united states general accounting office report to the ... · calculate pesticide use by county on...
TRANSCRIPT

United States General Accounting Office
Report to the Chairman, Subcommittee - on Oversight of Government Management, Committee on Governmental Affairs, U.S. Senate
j June 1993
I PESTICIDES
Issues Concerning Pesticides Used in the Great Lakes Watershed


GAO United States General Accounting Office Washington, D.C. 20548
Resources, Community, and Economic Development Division
B-252519
June 14,1993
The Honorable Carl Levin Chairman, Subcommittee on Oversight
of Government Management Committee on Governmental Affairs United States Senate
Dear Mr. Chairman:
The Great Lakes contain about 95 percent of the nation’s fresh water and provide 3 billion gallons daily for domestic use by about 24 million people. Despite their large size, the lakes are sensitive to the effects of pollution. Some pollutants that enter the lakes, whether by direct discharge along the shores, through tributaries, from land use, or from the atmosphere, are retained in the lakes and become more concentrated over time. Pesticides are one of the sources of chemical pollution of the Great Lakes.
Concerned that no analysis of the use of pesticides in the Great Lakes watershed had been performed, you asked us to obtain information on the amounts and types of pesticides used in the Great Lakes watershed and explain how pesticides may contribute to toxic chemicals in Great Lakes waters. In addition, you asked us to describe the typical storage and disposal practices in the Great Lakes region. We also determined whether pesticides used in the Great Lakes watershed were subject to the Environmental Protection Agency’s (EPA) pesticide reregistration program.’
Results in Brief The federal government and private organizations collect information on the amounts of pesticides used in the United States, but no data systems exist that track pesticide usage in the Great Lakes watershed. Using federal and private data sources, we estimate that at least 56 million pounds of pesticides are used annually in the United States and Canada in the Great Lakes watershed, including about 46 million pounds used on agricultural crops.2 The remaining 10 million pounds include 8 million pounds used annually on lawns and more than 2 million pounds used on golf courses in the U.S. portion of the watershed. While this estimate does not include pesticides used on some agricultural crops in the United States or the nonagricultural pesticides used in Canada, U.S. Department of
‘An ongoing program to reassess the cnvironmcntal and health risks of pesticides.
2All pesticide amounts in t.l~is report are expressed in pounds of active ingredients, except in the section on disposal, where amounts are exprcsscd in pounds of pesticide product.
Page 1 GAO/RCED-93-128 Pesticides
s

B-262619
Agriculture (USDA) and EPA officials believe that it includes the vast majority of the pesticides used in the watershed.
Herbicides, which account for about three-quarters of the 46 million pounds of agricultural pesticides used in the Great Lakes watershed, are generally applied once to field crops, such as corn and soybeans, during the spring by ground or aerial sprayers to control weeds. Fungicides and insecticides, which account for the remaining amount of agricultural pesticides, are applied to fruits and vegetables as many as eight times during the year to control diseases and pests. (The amounts of pesticides applied to major agricultural crops in each watershed county are shown in apps. VI and VII.)
Persistent pesticides that enter the Great Lakes are retained in the lakes and become more concentrated with time because less than 1 percent of Great Lakes water flows out of the lakes annually. The long retention time permits some pesticides to settle in lake-bottom sediments and to bioaccumulate in the food chain. Fish-tissue monitoring shows that persistent pesticides long since banned or restricted are still being detected at high concentrations. EPA is measuring the concentrations in the lakes of nine herbicides in current use, and prelimimuy results show that bhese pesticides may also be more persistent than previously thought. EPA needs to complete this water quality monitoring program and use the accurate and up-to-date data in its reregistration program, in which these pesticides are required by law to be reassessed for their health and environmental effects.
In addition to the pesticides already present in area waters, data indicat.e hat millions of pountis & um:;t&le pesticidtis being stored on farms present disposal problems m ;ke Great Ii akeh states. EPA has instituted a program In the regioia that has disposed cr? .;ome of these pesticides, but large quantities r5xnain &_,titimg banncr”r. 3~1c iiled, or no-longer-needed pesticides
‘:‘d,t- 2 GAOfRCED-93-128 Pesticides
B-252619
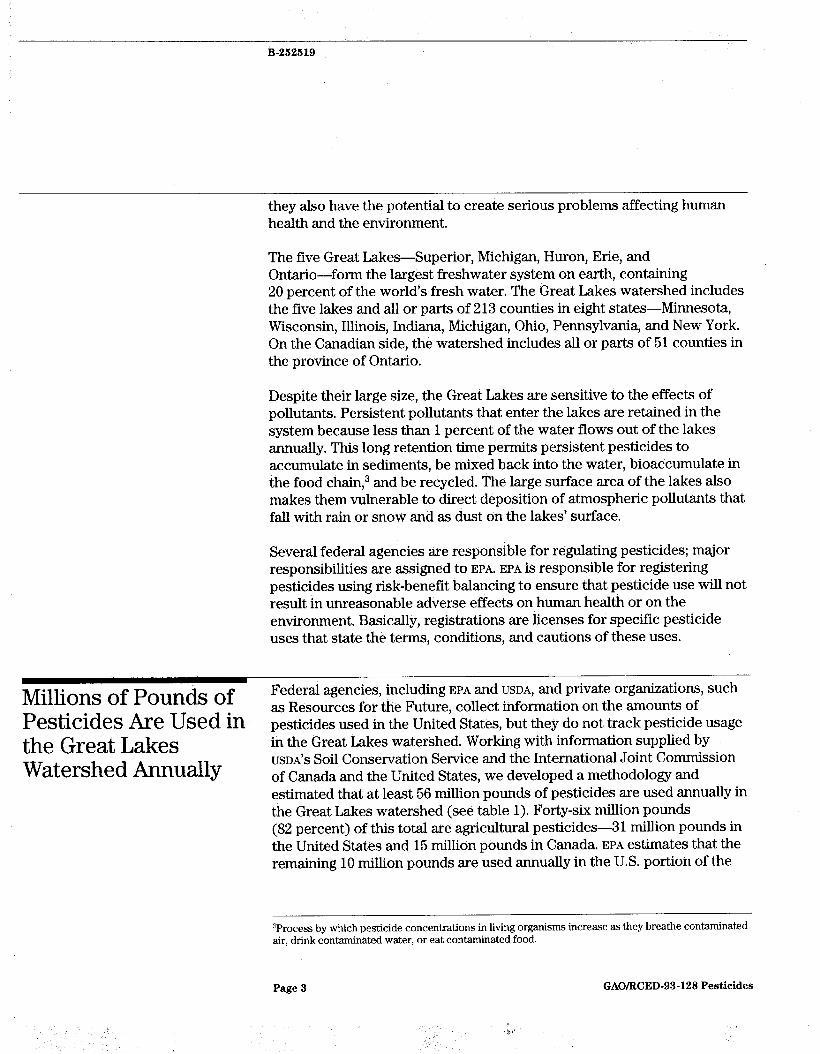
they also have the potential to create serious problems affecting human health and the environment.
The five Great Lakes-Superior, Michigan, Huron, Erie, and Ontario-form the largest freshwater system on earth, containing 20 percent of the world’s fresh water. The Great Lakes watershed includes the five lakes and all or parts of 213 counties in eight states-Minnesota, Wisconsin, Illinois, Indiana, Michigan, Ohio, Pennsylvania, and New York. On the Canadian side, the watershed includes all or parts of 51 counties in the province of Ontario.
Despite their large size, the Great Lakes are sensitive to the effects of pollutants. Persistent pollutants that enter the lakes are retained in the system because less than 1 percent of the water flows out of the lakes annually. This long retention time permits persistent pesticides to accumulate in sediments, be mixed back into the water, bioaccumulate in the food chain,3 and be recycled. The large surface area of the lakes also makes them vulnerable to direct deposition of atmospheric pollutants that fall with rain or snow and as dust on the lakes’ surface.
Several federal agencies are responsible for regulating pesticides; major responsibilities are assigned to EPA. EPA is responsible for registering pesticides using risk-benefit balancing to ensure that pesticide use will not result in unreasonable adverse effects on human health or on the environment. Basically, registrations are licenses for specific pesticide uses that state the terms, conditions, and cautions of these uses.
Millions of Pounds of Pesticides Are Used in
as Resources for the Future, collect information on the amounts of pesticides used in the United States, but they do not track pesticide usage
the Great Lakes in the Great Lakes watershed. Working with information supplied by
Watershed Annually USDA'S Soil Conservation Service and the International Joint Commission of Canada and the United States, we developed a methodology and estimated that at least 56 million pounds of pesticides are used annually in the Great Lakes watershed (see table 1). Forty-six million pounds (82 percent) of this total are agricultural pesticides-31 million pounds in the United States and 15 million pounds in Canada. EPA estimates that the remaining 10 million pounds are used annually in the U.S. portion of the
‘Process by which pesticide concentrations in living organisms increase as they breathe contaminated air, drink contaminated water, or eat contaminated food.
Page 3 GAO/RCED-93-128 Pesticides

B-262619
watershed-8 million pounds on lawns and more than 2 million pounds on golf courses.
Although information was not available on pesticides used on some U.S. field crops and on Canadian lawns and golf courses, USDA and EPA officials said that the 56-million-pound estimate includes the vast majority of pesticides that are used in the watershed annually. USDA officials believe this estimate includes 85 to 90 percent of the pesticides used in the, watershed. (For details on the methods used to estimate the amounts of pesticides used, see app. I.)
Table 1: Estimated Annual Pesticide Usage in the Great Lakes Watershed (in Pounds) Corn,soybean and field crop9
Fruits Vegetables Lawns
United States 24,547,600
$324,900 1,315,200 8,000,OOO
Canada Total 12,781,OOO 37,328,600
1,283,900 6,608,800 848,900 2.164,100
b 8,000,OOO Golf courses 2,400,OOO b 2,400,OOO Total 41,587,700 14,913,800 56,501,500 aThe U.S. pesticide usage estimate includes the amounts used on corn and soybeans only. The Canadian estimate includes the amounts used on all field crops, including corn and soybeans.
blnformation not available.
Apes of Pesticides Agricultural pesticides are applied by ground or aerial sprayers at various
Used in the Watershed times of the year depending on the crop and the pesticide’s intended use. H er 1c1 b’ ‘d es are applied for weed control usually once during the spring when crops are planted and emerge. Approximately 34 million pounds (74 percent) of the agricultural pesticides used in the watershed are herbicides used primarily on corn and soybeans. The herbicides atrazine, metolachlor, alachlor, and cyanazine make up 74 percent of the pesticides used on these crops in the United States. (See apps. II and III for the types and amounts of pesticides used on corn and soybeans.)
In contrast to herbicides, insecticides and fungicides are applied during the year as many as 8 times to fruits and 10 times to vegetables to control or kill pests and diseases. These pesticides account for 89 percent of pesticides used on fruits and vegetables in the United States. (See apps. IV and V for the pesticides used on fruits and vegetables.) No overall information was readily available on the types of pesticides used on lawns or golf courses.
Page 4 GAO/BCED-93-128 Pesticides

B-262619
Amounts of Pesticides Using available information, we were able to estimate the amounts of
Used, by County pesticides used on U.S. corn and soybean crops and all Canadian agricultural crops for each watershed county. The amounts of pesticides used in each county varied widely because of two factors-the number of agricultural acres within the watershed and the pesticide application rates.’ For example, the amounts of pesticides applied to corn and soybean crops ranged from 40 pounds to more than 525,000 pounds per county in the 213 U.S. counties, and from about 500 pounds to more than 1,750,OOO pounds on field crops per county in the 51 Ontario counties. To visualize the pesticide usage within the watershed’s counties, see figure 1. For the amounts of pesticides applied in each U.S. county, see appendix VI; for each Canadian county, see appendix VII. No information was available to calculate pesticide use by county on U.S. fruits, vegetables, lawns, or golf courses.
Page 6 GAO/RCED-93-128 Pesticides

B-262619
iaure 1: Estimated Annual Aaricultural Pesticide Usaae on Field Croix in Counties in the Great Lakes Watershed
Canada
Pounds per year per county
twk
1 U.S.
3
------. U.S.-Canadian Border
Note: The map represents pesticide usage in the latest years available. U.S. data include amounts used on corn and soybean crops in 1991. Canadian data include amounts used on aft field crops in 1988.
County borders are shown where they coincide with ranges of pesticide use. In some counties not all of the land area shown lies within the Great Lakes watershed.
Page 0 GAORCED-93-128 Pesticides

-~~ B-262619
Various Studies Have Although EPA'S herbicides study discussed in the following section is the
Shown Nationwide only Great Lakes-specific study of pesticide concentrations we are aware of, a number of national studies are available whose findings include some
Effects of Pesticides on Water Quality
of the states in the Great Lakes watershed. A nationwide EPA study analyzed fish for pesticide residues and found the presence of banned pesticides, such as the insecticide dieldrin: The test locations included sites in the watershed. The Food and Drug Administration’s fish samples from all 50 states have also shown low levels of pesticide residues in fish. Tests by the Water Quality Laboratory at Heidelberg College in Ohio, by EPA, and by the U.S. Geological Survey (USGS) have shown that runoff from agricultural pesticides has entered surface and groundwater, including drinking water, and that measurable amounts of pesticides are present in waters in states bordering the Great Lakes. Other studies by the Heidelberg Water Quality Laboratory and USGS have shown that pesticides are present in rainfall, indicating the possibility of widespread deposition of pesticides in the air over some Great Lakes states. In addition, a Wisconsin study found pesticides in soils across the state, and a Michigan study found that some wells had been contaminated beneath pesticide dealers’ sites. (Further details on these studies and their findings are in app. VIII.)
Effective Pesticide Under the 1972 amendments to the Federal Insecticide, Fungicide, and
Reregistration Rodenticide Act, EPA is required to reregister all pesticide products that were previously registered with less information on health and
Depends on Accurate environmental effects than is now required. EPA determines whether
and Up-To-Date pesticides are eligible for reregistration by evaluating data submitted by
Information the product’s registrant and determining whether the pesticide would cause unreasonable adverse effects when it is used in accordance with the product’s label directions and restrictions.
EPA'S Great Lakes National Program Office provided $89,000 for a project to measure the concentrations of nine high-use herbicides in Lakes Michigan, Erie, Huron, and Ontario. The pesticides include atrazine, aIachlor, metolachlor, and cyanazine, which we found are the four pesticides used in the largest amounts in the Great Lakes watershed. The project began in September 1991 and a final report is expected in early 1994. In addition, the program will attempt to measure the concentrations of the pesticides in the air and rain over the lakes.
Preliminary data from this ongoing project raise questions on the persistence of the high-use pesticides. The data indicate that the
Page 7 GAO/RCED-93-128 Pesticides
B-262619
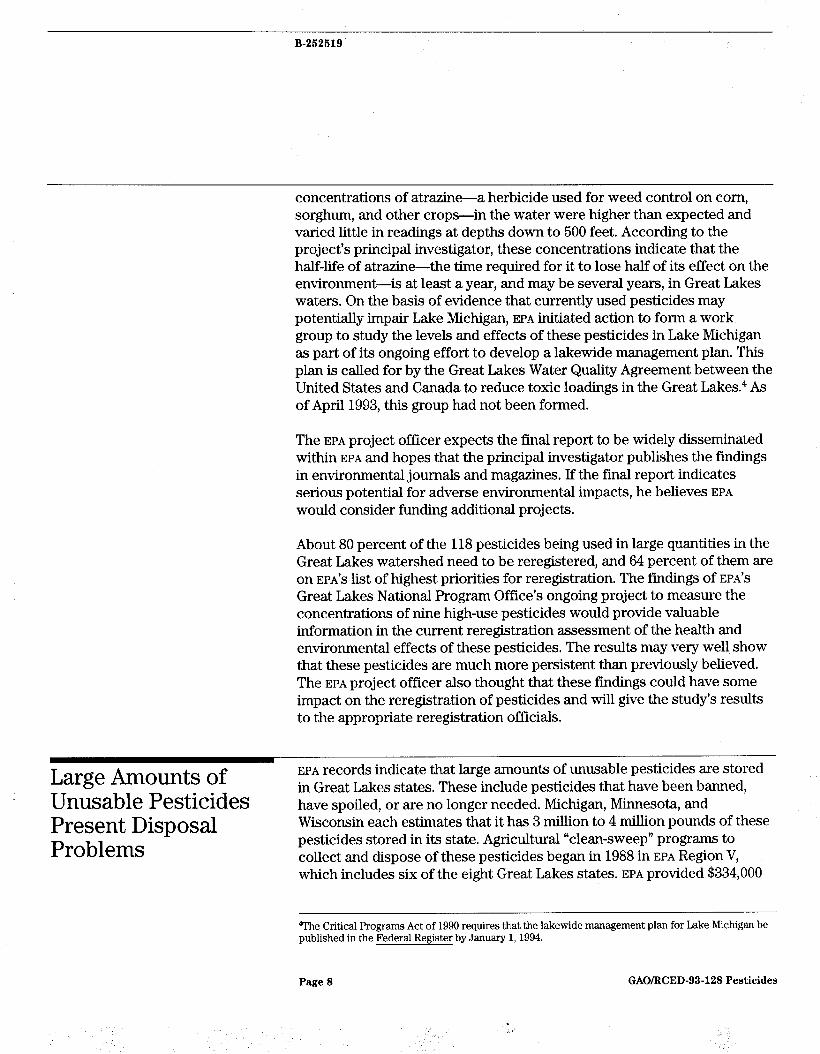
concentrations of atrazine-a herbicide used for weed control on corn, sorghum, and other crops-in the water were higher than expected and varied little in readings at depths down to 500 feet. According to the project’s principal investigator, these concentrations indicate that the half-life of atrazine-the time required for it to lose half of its effect on the environment-is at least a year, and may be several years, in Great Lakes waters. On the basis of evidence that currently used pesticides may potentially impair Lake Michigan, EPA initiated action to form a work. group to study the levels and effects of these pesticides in Lake Michigan as part of its ongoing effort to develop a lakewide management plan. This plan is called for by the Great Lakes Water Quality Agreement between the United States and Canada to reduce toxic loadings in the Great Lakes.4 As of April 1993, this group had not been formed.
The EPA project officer expects the final report to be widely disseminated within EPA and hopes that the principal investigator publishes the findings in environmental journals and magazines. If the final report indicates serious potential for adverse environmental impacts, he believes EPA would consider funding additional projects.
About 80 percent of the 118 pesticides being used in large quantities in the Great Lakes watershed need to be reregistered, and 64 percent of them are on EPA'S list of highest priorities for reregistration. The findings of EPA'S Great Lakes National Program Office’s ongoing project to measure the concentrations of nine high-use pesticides would provide valuable information in the current reregistration assessment of the health and environmental effects of these pesticides. The results may very well show that these pesticides are much more persistent than previously believed. The EPA project officer also thought that these findings could have some impact on the reregistration of pesticides and will give the study’s results to the appropriate reregistration officials.
Unusable Pesticides Present Disposal Problems
have spoiled, or are no longer needed. Michigan, Minnesota, and Wisconsin each estimates that it has 3 million to 4 million pounds of these pesticides stored in its state. Agricultural “clean-sweep” programs to collect and dispose of these pesticides began in 1988 in EPA Region V, which includes six of the eight Great Lakes states. EPA provided $334,000
4The Critical Programs Act of 1990 requires that the lakewide management plan for Lake Michigan be published in the Federal Register by January 1, 1994.
Page 8 GAO/RCED-93-128 Pesticides
Y

B-262619
to support clean-sweep programs in the states in Region V. As of January 1993,400,OOO pounds had been collected and disposed of, including 232,000 pounds in the Great Lakes watershed.
While these programs uncovered large quantities of unusable pesticides, only some have been disposed of to date. For example, Wisconsin’s 1990 clean-sweep program found that a large quantity of the pesticides stored on farms and in rural homes was not used because it had been damaged, predominantly because of improper storage. The program disposed of more than 39,000 pounds of unusable pesticides. An estimated additional 24,000 pounds of unusable pesticides were not disposed of because the program ran out of funds.
To address the problems of spoiled and damaged pesticides, EPA submitted draft regulations on pesticide storage containers to the Office of Management and Budget in March 1993. In addition, it has identified the problems of pesticide disposal as having the potential to create a material weakness in its December 1992 annual report on compliance with the Federal Managers Financial Integrity Act.
Conclusions No data bases exist to track pesticide use in the Great Lakes watershed. However, using available pesticide usage data for the eight Great Lakes states, we were able to estimate that at least 56 million pounds are used annually inside the watershed boundaries. While this estimate does not include all the pesticides used, it appears to represent the vast majority of the pesticides used in the watershed.
EPA has analyzed studies and documented that banned and restricted-use pesticides are among the toxic pollutants that present the most serious threats to the Great Lakes environment and hazards to human health. Studies of the pesticides currently being used in large quantities in the Great Lakes watershed indicate that, although these pesticides may be less toxic, they are pervasive in ground water, surface water, and the Great Lakes environment. Data from the ongoing EPA study to assess the persistence and the concentrations of these pesticides in the Great Lakes indicate that these newer pesticides may be more persistent than previously thought. However, this study will not be completed for another year. EPA should complete its analysis of the levels of these pesticides in Great Lakes waters and incorporate the results in its assessment of the safety of these pesticides in its pesticides reregistration program.
Page 9 GAO/RCED-93-128 Pesticides
?’ ,,

B-262619
Recommendation To more effectively reregister pesticides, we recommend that the Administrator, EPA, direct the Office of Pesticide Programs to incorporate the results of the Great Lakes National Program Office’s study of pesticides in the Great Lakes in EPA'S reregistration reassessment of these pesticides.
Agency Comments As requested, we did not provide a draft of this report to EPA officials for written comments. However, we discussed its contents with EPA'S Director, Policy and Special Projects Division, Office of Pesticide Programs, and her staff; with EPA'S Deputy Director, Great Lakes National Program Office, and his staff; with USDA'S Executive Secretary, Water Quality Working Group; and with the head of USDA'S Environmental Statistics Group. They generally agreed with the findings in the report. We incorporated their comments and suggestions where appropriate.
The two basic objectives of this review were to obtain information on the amounts and types of pesticides used in the Great Lakes watershed and explain how pesticides may contribute to toxic chemicals in Great Lakes waters. We analyzed federal and private pesticide data reports and estimated the amounts that were used inside the watershed boundaries. We interviewed various federal, state, and private officials and reviewed reports and studies on the potential effects that pesticides may have on the environment. (App. I contains details on our objectives, scope, and methodology.) We conducted our review between April I992 and April I993 in accordance with generally accepted government auditing standards.
As arranged with your office, unless you publicly announce its contents earlier, we plan no further distribution of this report until 30 days from the date of this letter. At that time, we will send copies to appropriate congressional committees; the Administrator of EPA; the Secretary of Agriculture; the Director of the Office of Management and Budget; and other interested parties. This work was performed under the direction of
Page 10 GAO/RCED-93-128 Pesticides

B-262619
Richard L. Hembra, Director, Environmental Protection Issues, who can be reached on (202) 512-6111 if you or your staff have any questions. Major contributors to this report are listed in appendix IX.
J. Dexter Peach Assistant Comptroller General
Page 11 GAO/RCED-93-128 Pesticides

Contents
Letter
Appendix I Objectives, Scope, and Methodology ,
Appendix II Estimated Annual Amounts of Agricultural Pesticides Used in the Great Lakes Watershed (in Pounds)
Appendix III Estimated Amounts of Pesticides Used on U.S. Corn and Soybean Crops in the Great Lakes Watershed in 1991
Appendix IV Estimated Amounts of Pesticides Used on U.S. Fruit Crops in the Great Lakes Watershed in 1991
23
Page 12 GAOIRCED-93-128 Pesticides
.
Content9
1 Appendix V Estimated Amounts of Pesticides Used on U.S. Vegetable Crops in the Great Lakes Watershed in 1990 1 Appendix VI Estimated Amounts of Pesticides Used on Soybeans and Corn in the Great Lakes Watershed by U.S. County in 1991
Appendix VII 34
Estimated Amounts of Pesticides Used on Field Crops in Ontario (Canada) Counties in the Great Lakes Watershed in 1988 1 Appendix VIII National and State Studies Show That U.S. Waters Contain Measurable Pesticide Residues
Page 13 GAO/RCED-93-128 Pesticides

Contents
Appendix IX Major Contributors to This Report
Table Table 1: Estimated Annual Pesticide Usage in the Great Lakes Watershed
Figure Figure 1: Estimated Annual Agricultural Pesticide Usage on Field 6 Crops in Counties in the Great Lakes Watershed
Abbreviations
DDT dichloro diphenyl trichloroethane EPA Environmental Protection Agency FDA Food and Drug Administration NASS National Agricultural Statistics Service PC& polychlorinated biphenyls USDA U.S. Department of Agriculture
Page 14 GAOfRCED-93-128 Pesticides

Page 16
Y _’
:
GAO/WED-93-128 Pesticides

Appendix I
Objectives, Scope, and Methodology
As requested by the Chairman, Subcommittee on Oversight of Government Management, Senate Committee on Governmental Affairs, the objectives of this review are to identify (1) the data systems tracking pesticide usage in the Great Lakes watershed; (2) the major users and the types and amounts of pesticides used, on a county-by-county basis, in the latest ye& for which data are available; (3) how they are applied and during what times of the year; (4) how they are typically stored and disposed of; (5) how they may contribute to toxic chemical pollution of the Great Lakes; and (6) the weaknesses in existing data and data base systems to track pesticide use in the Great Lakes watershed. We also determined whether the pesticides used in the Great Lakes watershed were subject to the Environmental Protection Agency’s (EPA) pesticide reregistration program.
To satisfy these objectives we interviewed officials and reviewed records at EPA headquarters Office of Pesticides Programs, EPA Region V’s Pesticides and Toxic Substances Branch, EPA'S Great Lakes National Program Office, and the Food and Drug Administration (FDA). We interviewed officials and reviewed records at the U.S. Department of Agriculture’s Soil Conservation Service, Agricultural Stabilization and Conservation Service, Water Quality Working Group, and National Agricultural Statistics Service (NASS). We interviewed officials at the Department of Interior’s U.S. Geological Survey and U.S. Fish and Wildlife Service. We also interviewed officials at the National Coalition Against the Misuse of Pesticides; World Wildlife Fund; National Agricultural Chemical Association; Natural Resources Defense Council; Water Quality Laboratory at Heidelberg College, Tiffin, Ohio; and Resources for the Future, an organization that analyzes data on pesticide usage in the United States.
We found no data systems tracking pesticide usage in the Great Lakes watershed area. To estimate the amounts of agricultural pesticides used in the watershed, we obtained NASS' latest surveys of pesticides used by states on field crops and fruits (1991) and vegetables (1990). NASS' field crop survey covered pesticides used on corn in seven of the eight Great Lakes states (all except New York) and soybeans in four states (Minnesota, Ohio, Illinois, and Indiana); its vegetable survey covered Michigan; and its fruit survey covered Michigan, New York, and Pennsylvania. In addition, NASS' records showed that 12 additional crops, such as oats, barley, and hay, are grown in one or more of the eight watershed states but that pesticide usage data was not collected on these crops. NASS officials said that these crops will generally receive less pesticides and that they lack the resources to collect data on all crops.
Page 16 GAO/RCED-93-128 Pesticides

Appendix I Objectives, Scope, and Methodology
To estimate how much of the pesticides used in each of the eight states was used inside the Great Lakes boundaries, we (1) obtained the number of corn and soybean acres planted in each county in 1991 from the Conservation Technology Information Center, (2) calculated the numbers of acres planted inside the boundaries of the Great Lakes watershed using’ information from the Federal Information Processing System, (3) calculated the amounts of pesticides used inside the watershed boundaries using NASS' survey of pesticide application rates, and (4) summed the amounts of the various pesticides applied. For pesticides used on fruits and vegetables, we were limited to reviewing those used in Michigan, which is completely inside the watershed boundaries. Lacking fruit acreage data, we were unable to estimate how much of the pesticides used in New York and Pennsylvania were used inside the Great Lakes watershed boundaries.
Since NASS did not survey all eight Great Lakes states, we had to use pesticide application rates of the surveyed states for some of the states not surveyed. For example, NASS reports show that the pesticide application rates for corn crops ranged from 2.7 pounds to 3.4 pounds per acre per year in the seven Great Lakes states surveyed. To estimate pesticides used on corn in New York, which was not surveyed, we used Pennsylvania’s rate of 2.7 pounds, the lowest surveyed rate. For soybeans, NASS reported that pesticide application rates ranged from 1 pound to 1.5 pounds per acre per year among the four surveyed states. We used Minnesota rates (1 pound per acre per year) to estimate Wisconsin and Michigan usage and Ohio rates (1.5 pounds per acre per year) to estimate amounts for Pennsylvania and New York.
Of the total estimate of nearly 24.5 million pounds of pesticides used in the United States on corn and soybeans in 1991,21.2 million pounds (86 percent) are based on surveyed pesticide application rates and 3.3 million pounds (14 percent) are estimates for states not surveyed. According to NASS officials, the amounts of pesticides used will generally vary by state and county on the basis of soil types, slope of land, and farming practices; however, using adjacent states’ rates is a reasonable way to estimate the amounts used inside the watershed boundaries. In addition, USDA officials also said that they believe that our estimate includes at least 75 percent, and more likely 85 to 90 percent, of all the pesticides used in the Great Lakes watershed.
NASS' pesticides usage reports are based on interviews of random samples of 5,759 farmers in the 17 states that accounted for 90 percent of U.S. corn
Page 17 GAOIRCED-93-128 Pesticides

Appendix I Objectives, Scope, and Methodology
acres, 4,443 farmers in 16 states accounting for 90 percent of soybean acres, an unspecified number of vegetable farmers in 4 states, and an unspecified number of fruit farmers in 12 states. The reports do not show the reliability of the data collected from farmers or the actual sample size for the various crops and the corresponding response rate. However, the reports state that the pesticide usage estimates are statistically representative of the pesticide usage on the crops in the surveyed states, because the samples were probability samples.’ In addition, the reports state that, at the 67-percent confidence level, the estimates of pesticides used will vary within a range depending on the size of state samples and the percentage of acres treated. In general, the larger the percentage of acres treated, the smaller the sampling variability of the estimate. For example, in the corn and soybean report, when the pesticide was applied to 75 percent or more of the acres, the sampling variability of the pesticide usage estimate ranged from 1 percent to 5 percent for large and small state samples, respectively; when the pesticide was applied to 10 percent to 24 percent of the acres, the sampling variability of the pesticide usage estimate ranged from 10 percent to 30 percent. According to the reports, the sampling variability of the estimates varied considerably by pesticide and crop.
To ascertain the amounts of agricultural pesticides used on the Canadian side of the Great Lakes watershed, we reviewed Ontario’s Survey of Pesticide Use in Ontario, 1988, the latest year for which data were available. The survey, conducted every 5 years, includes pesticides used on field crops, fruits, and vegetables in each county, including the amounts used inside the watershed boundaries. The 1988 pesticide usage data are based on questionnaire responses from stratified random samples of 10,000 field crop farmers and 3,200 fruit and vegetable growers. About 2,600 field crop questionnaires and 525 fruit/vegetable questionnaires were returned and used to estimate the pesticides used in each county and drainage basin area. In a study made in the early 1980s a telephone follow-up of the responding versus nonresponding field crop farmers in 1983 determined that nonresponding farmers were representative of responding farmers; therefore, the telephone follow-up was not repeated. The report shows how the estimated quantities of pesticides used were computed, but the sampling errors are not shown.
To ascertain the amount of nonagricultural pesticides used, we reviewed the Great Lakes National Program Office’s June 1991 Great Lakes Basin
‘NASS reports state that it received some reports that additional pesticides were used on corn, soybeans, fruits, and vegetables, but the reports were insufficient to estimate the amounts used in the states.
Page 18 GAO/RCED-93-128 Pesticides

Appendix I Objectives, Scope, and Methodology
Risk Characterization Study, which was prepared to assess the nature and extent of current health and environmental risks in the U.S. portion of the Great Lakes watershed. The study estimates, on the basis of the proportion of the population residing in the Great Lakes watershed, that 12 percent of the lawn care pesticides used in the nation-over 8 million pounds-is used inside the watershed. On a similar basis, the study estimates that more than 2 million pounds of pesticides are used on golf courses in the watershed annually.
Our work was performed in accordance with generally accepted government auditing standards from April 1992 to April 1993.
Page 19 GAOIRCED-93-128 Pesticides

Appendix II
Estimated Annual Amounts of Agricultural Pesticides Used in the Great Lakes Watershed (in Pounds)
Crop United States
Herbicides Insecticides Fungicides Other Total
Corn 17,884,900 1 ,534,800a 0 0 19,419,700
Soybeans 5,127,900 0 0 0 5,127,90b
Fruits 68,700 2,132,800 3,117,700 5,700 5,324,900
Vegetables 602,200 239,800 412,400 60,800 1,315.200
Total
Canada
23,683,700 3,907,400 3,530,100 66,500 31 ,187,700
Agricultural cropsb 10,332,100 756,300 1,347,ooo 2,478,400 14,913,800
Total 34,015,800 4,663,700 4,877,100 2,544,900 46,101,500 aAmount does not agree with the amount in appendix III because of rounding.
blncludes corn, soybeans, fruits, vegetables, and other field crops.
Page 20 GAO/WED-93-128 Pesticides

Appendix III
Estimated Amounts of Pesticides Used on U.S. Corn and Soybean Crops in the Great Lakes Watershed in 1991
Number of oound@ Herbicides Atrazine 6,040,600 Metolachlor 5,248,OOO Alachlor 4,535,100 Cyanazine 2,252,200 Pendimethalin 1,040,700 Trifluralin 601,400 EPTC 549.000 Glvphosate 430,600 Butylate 353,900 Dicamba 352,400 Metribuzin 320,900 Linuron Bentazon 2,4-D
254,800 249,000 229,500
Clomazone 74,600 Ethalfluralin 69,600 lmazethapvr 68,100 Simazine 61,800 Chloramben 55,700 Acifluorfen 43,000 lmazaauin 38,000 Bromoxynil 35,500 Paraquat 33,600 Flauzifou-P-butvl 25,600 Chlorimuron 23,300 Sethoxydim 22,200 Quizalofop 1,400 Nicosulfuron 1,300 Thifensulfuron Methyl Propachlor Total herbicides
Insecticides Chlorpvrifos
500 300
23,012,600
661,200 Terbufos 415,500 Fonofos 231,200 Carbofuran 130,300
(continued)
Page 21 GAO/RCED-93-128 Pesticides

Appendix III Estimated Amounts of Pesticides Used on U.S. Corn and Soybean Crops in the Great Lakes Watershed in 1991
Phorate Number of poundsa
93,000 Tefluthrin 3,500 Total insecticides 1,534,700
Total pesticides 24,547,300
aAmounts do not agree with amounts in appendix II because of rounding.
Page 22 GAO/RCED-93-128 Pesticides

Appendix IV
Estimated Amounts of Pesticides Used on U.S. Fruit Crops in the Great Lakes Watershed in 1991
Number of pounds’ Herbicides Simazine 23.600 Paraquat 13,160 Glyphosate 12,800 Diuron 10,300 2,4-D 5,500 Terbacil 3,100 Hexazinone 300 Total herbicides 68.700
Insecticides Petroleum distillate 1,409,700 Azinphos-methyl 150,300 Phosmet 134,900 Chlorpyrifos 92,800 Carbaryl 66,400 Propargite 62,200 Malathion 50,500 Endosulfan 39,200 Methomyl 36,300 Ethvl parathion 20,200 Dimethoate 15,100 Phosphamidon 12,100 Oxamvl 10,300 Formetanate hvdrochloride
Fenbutatin-oxide
2
Methyl parathion Permethrin
8,800
4,100
8,000 6,800
Oxythioquinox 2,700 Esfenvalerate 1,700 Diazinon 700 Total insecticides
Funaicides Sulfur Captan
2,132,800
1578,200 1,003,200
Chlorothalonil 151,400 Dodine 58,800
(continued)
Page 23 GAOIRCED-93-128 Pesticides

Appendix IV Estimated Amounts of Pesticides Used on U.S. Fruit Crops in the Great Lakes Watershed in 1991
Ferbam Number of pounds*
57 a-K-l
Copper oxychloride sulfate 47,600 Mancozeb 34,500 Metiram 31,000 Ziram 28,500 Thiram 22.900 Benomyl Copper hydroxide Copper sulfate
15,100 14,500 13.700
Triforine 12,800 lprodione 12,000 Streptomycin 10,500 Thiophanate-methyl 7,100 Fenarimol 6,500 Myclobutanil 5,900 Calcium polysulfide 4,100 Triadimefon 3,600 Dinocap 1,100 Oxytetracycline 1,000 Basic copper sulfate 700 Vinclozin 200 Total fungicides
Other pesticides Ethephon NAA (Alpha-Naphthylacetic Acid) Zinc phoside Gibberellic acid Total other
Total pesticides
%ciudes pesticides used on fruits grown in Michigan only.
3,117,700
4,300 700 500 200
5,700
5,324,900
Page 24 GAO/RCED-93-128 Pesticides

Appendix V
Estimated Amounts of Pesticides Used on U.S. Vegetable Crops in the Great Lakes Watershed in 1990
Herbicides Stoddard solvent EPTC Naptalam Metolachlor Linuron Simazine Pendimethalin Trifluralin Diuron Cyanazine Chloramben Ethalfluralin Atrazine Bensulide Pebulate 2,4-D Alachlor Napropamide Glyphosate Prometryn Metribuzin Paraquat DCPA Pronamide Flauzifop-P-butyl Oxyfluorfen Propachlor Butylate Norflurazon Bentazon Diphenamid Terbacil Bromoxynil Sethoxydim Total herbicides
Number of pounds’
282,100 41,100 27,400 24,100 22,800 20,900 20,200 17,700 16,900 13,600 12,600 10,300
9,900 9,400 9,300 8,700 8,100 8,000 6,600 5,900 5,100 3,800 3,000 2,700 2,300 1,900 1,700 1,600 1,200
900 800 700 500 400
602,200 (continued)
Page 26 GAO/RCED-93-128 Pesticides

Appendix V Estimated Amounts of Pesticides Used on U.S. Vegetable Crops in the Great Lakes Watershed in 1990
Number of pounds”
Insecticides Carbarvl 76.500
Disulfoton 23,100
Acephate 16 200 Chlorpyrifos 15.500 Ethyl parathion 13,000
Malathion 12,900 Methyl parathion 12,100
Diazinon 11,300
Endosulfan 10,500 Carbofuran 10,000
Azinphos-methyl 8,100
Methomvl 7,100
Permethrin 5,100 Oxamyl 3,900 Fonofos 3.100
Mevinphos 2,500
Terbufos 1,900 Thiodicarb 1,600
Naled 1.300
Esfenvalerate 1,100
Cvpermethrin am Dimethoate 700
Lindane 500
Oxvdemeton-methvl 4Orl
Fenbutatin-oxide 300
Methamidophos Total insecticides
Fungicides Chlorothalonil Mancozeb
200
239,000
166,800 68,600
Copper hydroxide 48,600
Sulfur 43,200
Basic copper sulfate 184013
Maneb 14,600 Captan 13,200 Anilazine 11,800
(continued)
Page 26 GAO/RCED-93-128 Pesticides

Appendix V Estimated Amounts of Pesticides Used on U.S. Vegetable Crops in the Great Lakes Watershed in 1990
Number of pound9 Copper oxychloride 4,900
lprodione 4,400 Metiram 3,600 Benomvl 3,400 Copper oxychloride sulfate 3,000 Metalaxyl 2,800 PCNR 2.100 ThioDhanate-methvl Vinclozolin Triphenyltin hydroxide Tridimefon
1,000 1,000
700 300
Total funaicides 412,400
Other pesticides DichloroDroDene 34,100 Metam-sodium 17,300 Ethephon 5,000 Methyl isothiocyanate 2,100 Chlorobcrin 1,700 Maleic hydrazide 600
Total other 60.800
Total pesticides
Blnctudes pesticides used on vegetables grown in Michigan only.
1,315,200
Page 27 GAO/RCED-93-128 Pesticides

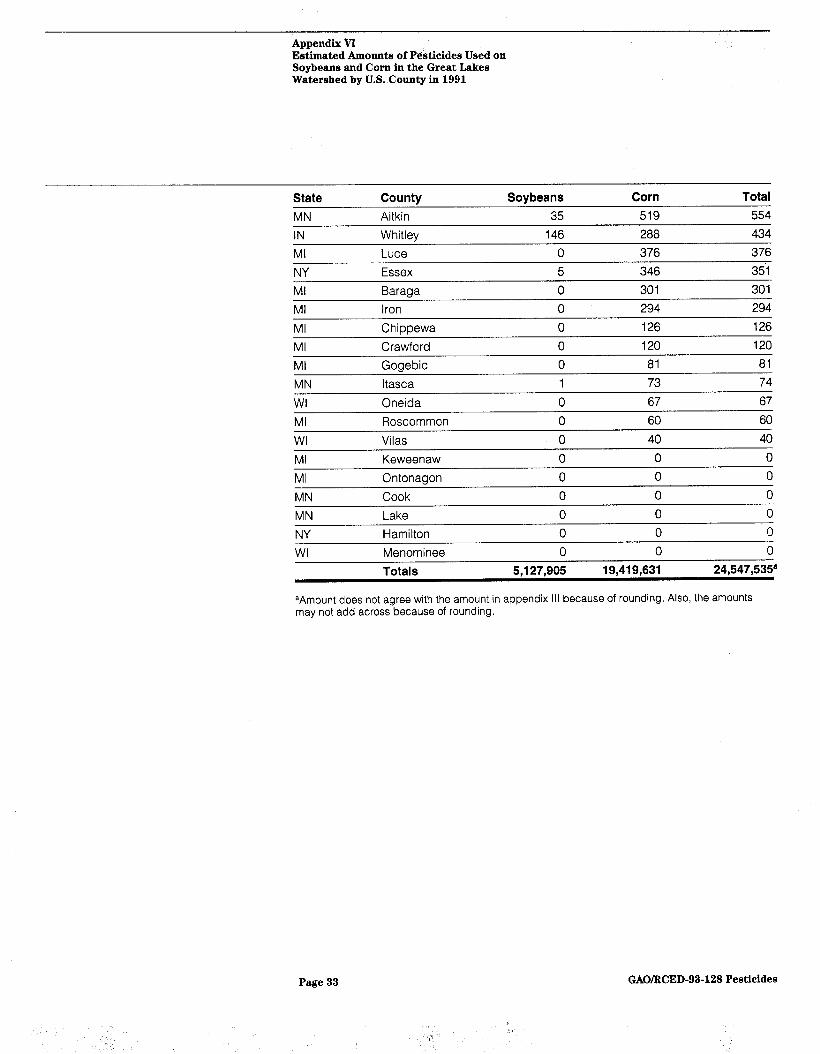
Appendix VI
Estimated Amounts of Pesticides Used on Soybeans and Corn in the Great Lakes Watershed by U.S. County in 1991
State County OH Wood OH Hancock
Soybeans Corn Total 196,475 328,859 525,334 205,193 291,651 496,843
OH Seneca 207,595 271,812 479,407 OH Fulton 133,685 334,614 468,299 Ml Lenawee 93,958 334,850 428,807 Ml Huron 5.786 421,638 417,424 OH Putnam 202,825 224,164 426,990 OH Van Wert 175,121 244,020 419,141 OH Henry 141,676 255,033 396,709 MI Sanilac 45,728 337,310 383,039 IN Allen 136,398 240,350 376,749 Ml Saginaw 149,463 221,622 371,085 OH Wyandot 155,077 214,765 369,842 Ml Hillsdale 43,322 316,229 359,550 Ml Gratiot 72,251 284,223 356,474 OH Paulding 162,795 190,050 352,845 OH Sandusky 130,229 220,919 351,148 Ml lnaham 38,171 310,130 348,301 OH Allen 141,656 206,037 347,693 Ml St. Joseph 35,139 301,170 336,309 OH Huron 131,560 200,993 332,553 WI Outagamie 3,369 320,472 323,841 Ml Branch 36,448 274,065 310,513 Ml Cass 36,583 271,053 307,636 Ml Jackson 6,450 301,170 307,620 Ml Monroe 91,457 213,831 305,287 Ml Washtenaw 23,586 278,582 302,168 IN Elkhart 65,070 233,674 298,744 OH Auglaize 119,352 178,188 297,540 OH Williams 124,898 161,409 286,307 Mt Tuscola 35,909 241,840 277,748 Ml Allegan 14,869 262,018 276,887 IN Noble 66,085 208,838 274,923 IN St. JosePh 72,300 196,954 269,254 bH Crawford 112,783 154,590 267,374 Ml lonia 34,657 225,878 260,535 OH Defiance 144,911 114,282 259,193 Ml Calhoun 26,474 231,299 257,773
Page 28
(continued)
GAO/RCED-93-128 Pesticides
Y ‘,
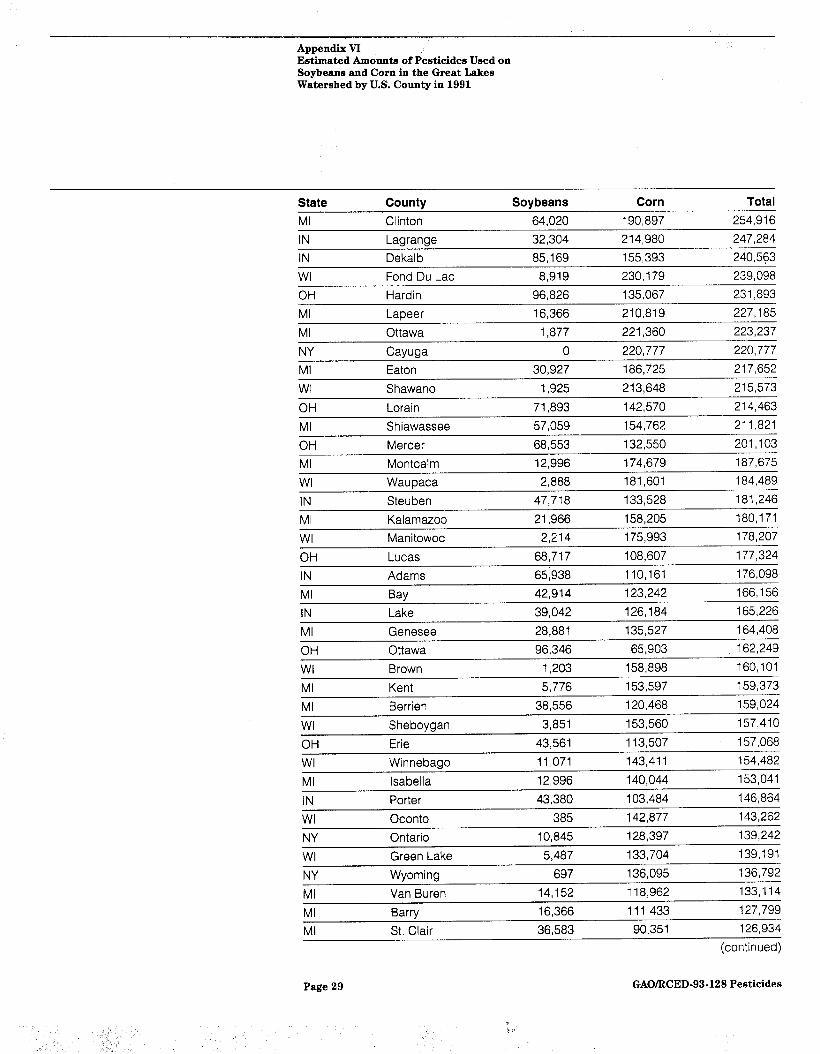
Appendix VI Estimated Amounts of Pesticides Used on Soybeans and Corn in the Great Lakes Watershed by U.S. County in 1991
State County Soybeans Corn MI Clinton 64,020 190,897 IN Lagrange 32,304 214,980 IN Dekalb 85,169 155,393 WI Fond Du Lac 8,919 230,179
Total 254.916 -- .,- - 247,284 240,563 239.098
OH Hardin 96,826 135,067 231,893 MI Lapeer 16,366 210,819 227,185 MI Ottawa 1,877 221,360 223.237 NY Cayuga 0 220,777 220,777 MI Eaton 30,927 186,725 217,652 WI Shawano 1,925 213,648 215.573 OH MI OH Ml
Lorain Shiawassee Mercer Montcalm
71,893 57,059 68,553 12,996
142,570 154,762 132,550 174,679
214,463 211,821 201,103 187.675 .~
WI Waupaca 2,888 181,601 184,489 IN Steuben 47,718 133,528 181,246 MI Kalamazoo 21,966 158,205 180.171 WI Manitowoc 2,214 175,993 178,207 OH Lucas 68,717 108,607 177,324 IN Adams 65,938 110,161 176,098 Ml Bav 42,914 123,242 166.156 IN Ml OH
39.042 28,881 96,346
Lake Genesee Ottawa
126,184 165,226 135,527 164,408
65,903 162.249 WI Brown 1.203 158,898 16o.tol -_, _. Ml Kent 5,776 153,597 159,373 Ml Berrien 38,556 120,468 159,024 WI Sheboygan 3,851 153,560 157,410 OH Erie 43,561 113,507 157,068 WI MI
Winnebago Isabella
11,071 12,996
143,411 140,044
154,482 153.041
IN Porter 43,380 103,484 146,864 WI Oconto 385 142,877 143,262 NY Ontario 10,845 128,397 139,242 WI Green Lake 5,487 133,704 139,191 NY Wyoming 697 136,095 136,792 Ml Van Buren 14,152 I 18,962 133,114 Ml Barry 16,366 111,433 127,799 Ml St. Clair 36,583 90,351 126,934
(continued)
Page 29 GAO/RCED-93-128 Pesticides

Appendix VI Estimated Amounts of Pesticides Used on Soybeans and Corn in the Great Lakes Watershed by U.S. County in 1991
State Countv Sovbeans Corn Total NY Onondaaa 2.789 115.062 117,851 Ml Newaygo 775 115,848 116,623 WI Calumet 4,814 109,495 114,308 NY Livingston 3,098 109,976 113,074 MI Livingston 7,557 103,904 111,461 NY Seneca 13,168 96,229 109,397 WI Waushara 5,459 103,352 108,811 NY Genesee 3,098 104,477 107,576 NY St. Lawrence 310 104,477 104,787 NY Niagara 7,746 93,914 101,660 NY Wayne 9,295 90,730 100,026 OH Ashtabula 13,275 84,832 98,107 WI Marquette 3,369 93,47i 96,840 NY Orleans 12,394 81,107 93,501 WI Kewaunee 1,444 90,800 92,244 Ml Macomb 21,179 66,257 87,437 NY Jefferson 1,859 82,482 84,341 WI Racine 15,403 68,234 83,637 WI Ozaukee 3,851 79,317 83,168 OH Marion 27,774 52,617 80,392 NY Erie 310 76,983 77,293 MI Midland 16,510 58,728 75,238 WI Washington 3,100 71,786 74,886 NY Monroe 2,014 67,360 69,374 IN Kosciusko 17,722 50,519 68,241 Ml Mecosta 96 67,763 67,860 Ml Muskegon 2,503 63,848 66,351 WI Marinette 193 65,430 65,622 OH Medina 18,245 43,648 61,893 NY Oneida 387 60,487 60,874 Ml Wayne 14,729 45,176 59,905 NY Yates 930 54,988 55,918 IN Laoorte 9.833 41,728 51,560 WI Door 433 51,008 51,442 Ml Arenac 5,181 46,079 51,260 NY Tompkins 976 49,489 NY Madison 0 49,269 Ml Menominee 24 48,790 OH Portage 5,872 42,931
50,465 49,269 48,814 48,803
(continued)
Page 30 GAOIRCED-93-128 Pesticides

Appendix VI Estimated Amounts of Pesticides Used on Soybeans and Corn in the Great Lakes Watershed by U.S. County in 1991
State
WI Countv Portage
Sovbeans 202
Corn . . 48,071
Total
48,273 Mt Gladwin 2,118 43,850 45,968 NY Lewis 0 43,990 43.990 ~.~ Ml Oceana 48 39,754 39,863 NY Oswego 77 38,492 38,569 OH Geauga 1,704 34,396 36.100 WI Columbia 1,473 31,940 ‘33,413 Ml Mason 549 32,508 33,057 Ml Missaukee 0 32,828 32,828 Ml Ogemaw 241 31,623 31,864 NY Herkimer 0 31,274 31,274 Ml Oakland 510 30,719 31,230 NY Franklin 0 30,623 30,623 Ml Osceola 0 30,117 30,117 PA Erie 2,905 26,807 29,711 Ml Grand Traverse 144 28,611 28,756 NY Ailegany 54 26,944 26,998 Ml Clare 193 26,352 26,545 Ml losco 235 24,696 24,931 Ml Alpena 193 19,245 19,437 OH Summit 1,155 17,323 18,479 NY Steuben 93 17,734 17,827 OH Ashland 3,780 12,609 16,389 WI Langlade 58 16,024 16,081 MI Wexford 29 15,059 15,087 WI Waukesha 1,273 13,219 14,493 WI Milwaukee 2,474 12,018 14,492 Ml Charlevoix 0 14,456 14,456 NY Cattaragus 31 14,297 14,328 Ml Presque Isle 0 13,553 13,553 WI Kenosha 1,925 10,816 12,741 NY Chautauaua 0 12,262 12.262 NY Schuyler 0 11,685 11,685 WI Marathon 96 11,550 11,647 MI Antrim 51 11,444 OH Shelby 4,175 7,164 MI Delta 0 10,929 Ml Leelanau 0 10,842 OH Richland 4,418 5,189
11,495 11,340 10,929 10,842
9,607 (continued)
Page 31 GAO/RCED-93-128 Pesticides

Appendix VI Estimated Amounts of Pesticides Used on Soybeans and Corn in the Great Lakes Watershed by U.S. County in 1991
State County Soybeans Corn Total Ml Emmet 0 9,186 9,186 PA Crawford 775 8,248 9,023 NY Clinton 0 8,890 8,890 WI Bavfield 0 8.546 8,546 , OH Trumbull 1,165 7,297 8,463 IL Lake 1,873 5,686 7,559 OH Cuyahoga 775 6,711 ‘7,486 IN Wells 2,715 4,632 7,347 Ml Montmorency 104 6,460 6,564 Ml Alcona 46 5,722 5,768 Ml Manistee 39 5,722 5,762 Ml Otseao 0 5,270 5,270 Ml Dickinson 0 4,819 4,819 MN Pine 598 4,209 4,807 OH Lake 542 4,027 4,569 NY Cortland 13 4,555 4,568 Ml Kalkaska 0 4,216 4,216 WI Ashland 0 4,006 4,006 Ml Benzie 0 3,915 3,915 IL Cook 910 2,747 3,657 WI Dodge 70 3,581 3,651 WI Adams 375 3,138 3,513 Ml Oscoda 0 3,313 WI Florence 0 3,205 Ml Cheboygan 0 2,861 MN Carlton 0 2,773 Ml Lake 19 2,71 I MN St. Louis 10 2,565 PA Potter 0 2,450 WI Forest 0 2,203 NY Chemung 0 2,069 Ml Houghton 0 1,355 Ml Mackinac 0 940 Ml Alger 0 919 OH Stark 94 817 WI Iron 0 801 MI Schoolcraft 0 708 Ml Marquette 0 669 WI Douglas 0 668
3,313 3,205 2,861 2,773 2,730 2,575 2,450 2,203 2,069 1,355
940 919 911 801 708 669 668
(continued)
Page 32 GAO/RCED-93-128 Pesticides
Appendix VI Estimated Amounts of Pesticides Used on Soybeans and Corn in the Great Lakes Watershed by U.S. County in 1991
State County MN Aitkin IN Whitley Ml Lute NY Essex Ml Baraga Ml Iron
Soybeans Corn Total 35 519 554
146 288 434 0 376 376 5 346 35’1 0 301 301 0 294 294
Ml Chippewa 0 126 126 Ml Crawford 0 120 120 Ml Gogebic 0 81 81 MN ltasca 1 73 74 WI Oneida 0 67 67 MI Roscommon 0 60 60 WI Vilas 0 40 40 Ml Keweenaw 0 0 0 Ml Ontonagon 0 0 0 MN Cook 0 0 0 MN Lake 0 0 0 NY Hamilton 0 0 0 WI Menominee 0 0 0
Totals $127,905 19,419,631 24,547,535*
aAmount does not agree with the amount in appendix Ill because of rounding. Also, the amounts may not add across because of rounding.
Page 33 GAO/RCED-93-128 Pesticides

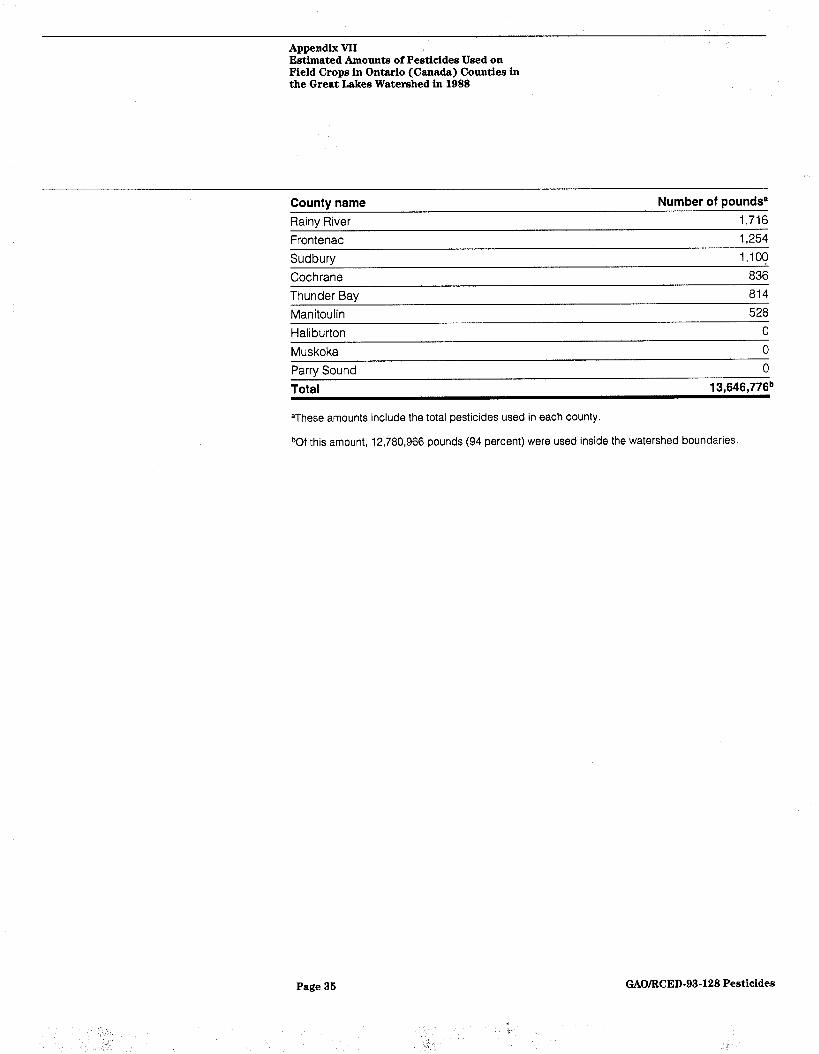
Appendix VII
Estimated Amounts of Pesticides Used on Field Crops in Ontario (Canada) Counties in the Great Lakes Watershed in 1988
County name Haldimand-Norfolk Elgin Middlesex Kent Oxford Huron Lambton Essex Perth Stormont, Dundas, & Glengarry Waterloo Brant Wellington Durham Bruce Simcoe Prescott & Russell Halton Niagara Dufferin Northumberland Lennox & Addinaton Peel
Number of pounds0 1,789,744 1,370,138 1,214,356 1,136,938
988,966 973,104 917,466 675,928 653,818 421,300 387,354 387,002 324,280 321,530 269,434 262,548 257,862 245,432 144,430 136,422 117,392 101.112 -.
91,872 Victoria 73,656 Hamilton-Wentworth 62,458 Prince Edward 58,806 York 51,128 Leeds & Grenville 38.984 Ottawa-Carleton 32,054 Hastings 23,936 Grev 23,650 Timiskaming 21,626 Nipissing 15,422 Kenora 13,772 Peterborough 11,154 Lanark 10,318 Renfrew 10,296 Algoma 4,840
(continued)
Page 34 GAOIRCED-93-128 Pesticides
Appendix VII Estimated Amounts of Pesticides Used on Field Crops in Ontario (Canada) Counties in the Great Lakes Watershed in 1988
County name Number of pounds’ Rainv River 1,716 Frontenac 1,254 Sudbury 1,100 Cochrane 836 Thunder Bay 814 Manitoulin 528 Haliburton 0 Muskoka 0 Parry Sound Total
0 13,646,776b
aThese amounts include the total pesticides used in each county.
bOf this amount, 12,780,966 pounds (94 percent) were used inside the watershed boundaries.
Page 36
.‘%.,
GAO/RCED-93-128 Pesticides

Appendix VIII
National and State Studies Show That U.S. Waters Contain Measurable Pesticide Residues
EPA'S September 1992 National Study of Chemical Residues in Fish indicates that the levels of pesticides and other pollutants in fish have been reduced but that they-continue to pose risks to the environment and human health. The study included data from samples of both bottom-feeding and game fish collected from 388 sites around the country between 1986 and 1989. Fish were analyzed for 60 bioaccumulative chemicals, including 21 pesticides. The study showed that some very persistent pollutants were found in fish at many sites. The study concluded that 46 sites were higher-risk sites, where the lifetime cancer risk was greater than 1 in 10,000’ for persons who ate two 4-ounce fillets of fish per month over their lifetime.
Of the 46 contaminated sites, which includes 28 sites in six Great Lakes watershed states-New York, Pennsylvania, Illinois, Michigan, Minnesota, and Wisconsin-42 are contaminated with Polychlorinated Biphenyls (PCBs), an industrial pollutant, and 6 with die&in, an insecticide. Both are essentially banned in the United States but are highly persistent in the environment. These chemicals have accumulated in the sediments of the nation’s waters and reenter the food chain from these sediments. Fish consumption advisories or bans were in effect at 41 of these sites. Persons at risk are avid recreational fishers and subsistence fishers who may consume more fish than the average person and more of whose fish could come from these contaminated sites. Pregnant women and nursing mothers may be especially sensitive to the pollutants found, according to the study. The study did not address commercial fishing and concluded that there is no evidence that persons who ate most of their fish from commercial markets had cause for concern.
The Food and Drug Administration’s (FDA) monitoring of fish and other foods over the 5 fiscal years (1987-91) led it to conclude that pesticide residues in the U. S. food supply are generally below established safety limits. FDA collects fish and other food samples from all 50 states and analyzes them for pesticide residues. In its 1991 program, it tested for 298 different pesticides and found 108 of them in its various samples. In analyzing 531 samples of fish and shellfish collected nationwide, it found that 41 percent contained pesticide residues, but less than 1 percent contained residues in violation of EPA tolerances. FDA'S data showed that 120 of the fish samples came from Great Lakes states, including one violative sample that contained arochlor, a pesticide banned in 1970, in excess of EPA tolerances. FDA'S data do not indicate whether any of the fish
'EPA's water quality criteria for human consumption of fish is based on a cancer risk of 1 in 1 million.
Page 36 GAO/RCED-93-128 Pesticides

Appendix VIII National and State Studies Show That U.S. Waters Contain Measurable Pesticide Residues
samples that came from the Great Lakes states came from within the watershed boundaries.
Compared to their predecessors, the pesticides currently being used in the Great Lakes watershed are generally more soluble in water and more likely to run off into surface and groundwater and end up in drinking water supplies. A 1988 study by the Water Quality Laboratory at Heidelberg College showed that although 1 percent or less of the pesticides applied to agricultural croplands runs off into surface waters, they are used in such large quantities that tons of pesticides end up in the Great Lakes tributaries. For example, the laboratory calculated that about 75,000 pounds of 11 pesticides applied ran off into eight Ohio and Michigan tributaries draining into Lake Erie in 1984 and 1985. The study concluded that these pesticides were likely to affect the algae and higher aquatic plants, which could affect fish, invertebrates, and possibly animals in the Great Lakes food chain.
EPA'S November 1991 report entitled Pesticides in Groundwater Database states that pesticides have been found in the groundwater of 40 states. Over 48,000 wells were tested from 1979 to 1990 for more than 230 pesticides. Ninety-eight pesticides were found in at least 1 well, 16 were found in 100 or more wells, and 4 were found in more than 1,000 wells. Eighteen of the pesticides found in groundwater are no longer registered for use in the United States.
About 90 percent of the samples were taken in 12 states. Ninety percent of the wells containing one or more pesticides were located in 11 states, including Minnesota, New York, Ohio, and Wisconsin. A study by Heidelberg College’s Water Quality Laboratory found that pesticide concentrations in Ohio’s surface waters used for drinking water frequently exceeded EPA'S drinking water standards during periods following pesticide applications. The study concluded that at times during the year, 0.05 percent of Ohio’s population was consuming atrazine in excess of EPA'S standards, and that 0.06 percent was consuming alachlor in excess of standards. However, annual average concentrations were in compliance with drinking water standards.
A December 1992 study by the U.S. Geological Survey concluded that there is a clear effect on water quality caused by surface runoff of pesticides after spring application in the lOstate Midwestern corn and soybean belt area, which included five Great Lakes states-Illinois, Indiana, Minnesota, Ohio, and Wisconsin. Although the study was not
Page 37 GAO/RCED-93-128 Pesticides

Appendix VIII National and State Studies Show That U.S. Waters Contain Measurable Pesticide Residues
specific to the Great Lakes watershed, it reported that more needs to be known about the duration of large herbicide concentrations during storm runoff and the possible implications of storing this water for long-term use. Furthermore, the study concluded that the frequency of samples exceeding EPA'S maximum contaminant levels for drinking water reinforced the need for environmental health studies to examine the combined synergistic effects2 of the major herbicides and their degradation products.
Similarly, an October 1991 Wisconsin study found pesticides in the soils at 25 of 27 randomly selected pesticide dealer sites across the state. Groundwater samples at 15 of the 27 sites contained pesticides, 9 at levels greater than state standards. The most heavily used herbicides-alachlor, atrazine, cyanazine, and metolachlor-were found most often in soils and groundwater. A 1989 Michigan study found that 9 of 50 sample wells (18 percent) from 300 high-risk pesticide dealers’ sites contained pesticides, particularly atrazine. In two of the nine wells, the atrazine levels exceeded EPA drinking water standards.
*Effects that could occur when a pesticide that is not toxic by itself becomes lethal in the presence of other pesticides.
Page 38 GAO/RCED-93-128 Pesticides
Appendix IX
Major Contributors to This Report
Resources, Peter F. Guerrero, Associate Director
Community, and J. Kevin Donohue, Assistant Director Molly MacLeod, Reports Analyst
Economic Derek Updegraff, Technical Advisor
Development Division, Washington, D.C.
Chicago Regional James B. Musial, Regional Management Representative
Office Frederick A. Wiener, Evaluator-in-Charge Rosemary Torres Lerma, Staff Evaluator John Zarem, Technical ,4dvisor Lakale Williams, Technical Advisor


Ordering Information
The first copy of each GAO report and testimony is free. Additional copies are $2 each. Orders should be sent to the following address, accompanied by a check or money order made out to the Superintendent of Documents, when necessary. Orders for 100 or more copies to be mailed to a single address are discounted 25 percent.
Orders by mail:
U.S. General Accounting Office P.O. Box 6015 Gaithersburg, MD 20884-6015
or visit:
Room 1000 700 4th St. NW (corner of 4th and G Sts. NW) U.S. General Accounting Office Washington, DC
Orders may also be placed by calling (202) 512-6000 or by using fax number (301) 258-4066.
PRINTED ON & RECYCLED PAPER

United States General Accounting Office Washington, D.C. 20548
Official Business Penalty for Private Use $300