united states floriculture crops department of...
TRANSCRIPT

United States Department of Agriculture National Agricultural Statistics Service
ISSN: 1949-0917
Floriculture Crops 2015 Summary April 2016

Floriculture Crops 2015 Summary (April 2016) 3 USDA, National Agricultural Statistics Service
Contents 2015 Floriculture Crops Highlights ........................................................................................................................................ 5
Expanded Wholesale Value, Operations with $10,000+ Sales Chart – 15 Program States .................................................... 5
Number of Producers and Operations with Hired Workers by Size – 15 Program States: 2014 and 2015 ............................ 6
Number of Producers by Gross Value of Sales and Expanded Wholesale Value – 15 Program States:
2014 and 2015 ......................................................................................................................................................................... 7
Number of Producers and Area Used for Production by Type of Cover – 15 Program States: 2014 and 2015 ..................... 8
Highlights from Operations with Sales of $100,000 or More ................................................................................................. 9
Wholesale Value of Sales by Plant Category, Operations with $100,000+ Sales Chart – 15 Program States: 2015 ........... 10
Number of Producers by Plant Category – 15 Program States: 2014 and 2015 ................................................................... 10
Number of Producers and Area Used for Production by Type of Cover – 15 Program States: 2014 and 2015 ................... 11
Wholesale Value of All Sales by Plant Category – 15 Program States: 2014 and 2015....................................................... 12
Annual Bedding/Garden Plants Sold in Flats by Type – 15 Program States: 2014 and 2015 .............................................. 14
Annual Bedding/Garden Plants Sold in Hanging Baskets by Type – 15 Program States: 2014 and 2015 ........................... 19
Annual Bedding/Garden Plants Sold in Pots, Begonias – 15 Program States: 2014 and 2015............................................. 24
Annual Bedding/Garden Plants Sold in Pots, Geraniums from Vegetative Cuttings – 15 Program States:
2014 and 2015 ....................................................................................................................................................................... 25
Annual Bedding/Garden Plants Sold in Pots, Geraniums from Seeds – 15 Program States: 2014 and 2015 ....................... 26
Annual Bedding/Garden Plants Sold in Pots, New Guinea Impatiens – 15 Program States: 2014 and 2015 ....................... 27
Annual Bedding/Garden Plants Sold in Pots, Other Impatiens – 15 Program States: 2014 and 2015 .................................. 28
Annual Bedding/Garden Plants Sold in Pots, Marigolds – 15 Program States: 2014 and 2015 ........................................... 29
Annual Bedding/Garden Plants Sold in Pots, Pansies/Violas – 15 Program States: 2014 and 2015 .................................... 30
Annual Bedding/Garden Plants Sold in Pots, Petunias – 15 Program States: 2014 and 2015 .............................................. 31
Annual Bedding/Garden Plants Sold in Pots, Other Potted Flowering and Foliar Plants – 15 Program States:
2014 and 2015 ....................................................................................................................................................................... 32
Annual Bedding/Garden Plants Sold in Pots, Vegetable Type Plants – 15 Program States: 2014 and 2015 ....................... 33
Herbaceous Perennial Plants Sold in Pots, Hardy/Garden Chrysanthemums – 15 Program States: 2014 and 2015 ............ 34

4 Floriculture Crops 2015 Summary (April 2016) USDA, National Agricultural Statistics Service
Herbaceous Perennial Plants Sold in Pots, Hostas – 15 Program States: 2014 and 2015 ..................................................... 35
Herbaceous Perennial Plants Sold in Pots, Other Herbaceous Perennials – 15 Program States: 2014 and 2015 ................. 36
Flowering Plants Sold for Indoor or Patio Use Sold in Pots, African Violets – 15 Program States: 2014 and 2015 ........... 37
Flowering Plants for Indoor or Patio Use Sold in Pots, Finished Florist Azaleas – 15 Program States:
2014 and 2015 ....................................................................................................................................................................... 38
Flowering Plants for Indoor or Patio Use Sold in Pots, Florist Chrysanthemums – 15 Program States:
2014 and 2015 ....................................................................................................................................................................... 39
Flowering Plants for Indoor or Patio Use Sold in Pots, Easter Lilies – 15 Program States: 2014 and 2015 ........................ 40
Flowering Plants for Indoor or Patio Use Sold in Pots, Orchids – 15 Program States: 2014 and 2015 ................................ 41
Flowering Plants for Indoor or Patio Use Sold in Pots, Poinsettias – 15 Program States: 2014 and 2015 ........................... 42
Flowering Plants for Indoor or Patio Use Sold in Pots, Florist Roses – 15 Program States: 2014 and 2015 ....................... 43
Flowering Plants for Indoor or Patio Use Sold in Pots, Spring Flowering Bulbs – 15 Program States:
2014 and 2015 ....................................................................................................................................................................... 44
Flowering Plants for Indoor or Patio Use Sold in Pots, Other Flowering Plants – 15 Program States:
2014 and 2015 ....................................................................................................................................................................... 45
Foliage Plants for Indoor or Patio Use Sold in Hanging Baskets – 15 Program States: 2014 and 2015............................... 46
Foliage Plants for Indoor or Patio Use Sold in Pots – 15 Program States: 2014 and 2015 ................................................... 46
Cut Flowers by Type – 15 Program States: 2014 and 2015 .................................................................................................. 47
Cut Cultivated Greens by Type – 15 Program States: 2014 and 2015 .................................................................................. 54
Propagative (Unfinished) Floriculture Materials Value of Sales by Category – 15 Program States: 2014 and 2015 ........... 55
Statistical Methodology ......................................................................................................................................................... 56
Survey Definitions................................................................................................................................................................. 57
Information Contacts ............................................................................................................................................................. 58

Floriculture Crops 2015 Summary (April 2016) 5 USDA, National Agricultural Statistics Service
2015 Floriculture Crop Highlights Value of All Production: The 2015 wholesale value of floriculture crops is up 4 percent from the revised 2014 valuation.
The total crop value at wholesale for the 15 State program for all growers with $10,000 or more in sales is estimated at
$4.37 billion for 2015, compared with $4.20 billion for 2014. California continues to be the leading State with crops
valued at $1.08 billion, up 1 percent from the 2014 value. Florida, the next largest producer, is up 12 percent from the
prior year to $1.03 in wholesale value. These two States account for 49 percent of the 15 State total value. For 2015, the
top 5 States are California, Florida, Michigan, North Carolina, and Ohio which account for $3.00 billion or 69 percent of
the 15 State program total value.
Number of Producers: The number of producers for 2015, at 5,913, is up 5 percent in the 15 States compared with the
2014 count of 5,606.
Area Used for Production: In the 15 State program, total covered area for floriculture crop production was
767 million square feet, down slightly from the revised 2014 figure. Greenhouse space for 2015, at
409 million square feet, is down 6 percent from 2014. This accounts for 53 percent of the total covered area. Shade and
temporary cover is up 8 percent, to 358 million square feet. Open ground totaled 40,042 acres, down 34 percent from the
revised 2014 total.
Peak Hired Workers: The average peak number of hired workers employed on operations in the 15 State program in
2015 is 18.3, down 12 percent from a revised average of 20.8 peak workers in 2014. A total of 4,407 operations hired
workers during 2015 compared with 4,202 a year earlier. Overall, 75 percent of operations used some hired labor during
2015, down slightly from 2014.
$4.03 $4.32
$4.11 $4.00 $4.15 $4.08
$4.36 $4.25 $4.20 $4.37
$0.00
$0.50
$1.00
$1.50
$2.00
$2.50
$3.00
$3.50
$4.00
$4.50
2006 2007 2008 2009 2010 2011 2012 2013 2014 2015
Expanded Wholesale Value, Operations with $10,000+ Sales - 15 Program States: 2015
Billion dollars

6 Floriculture Crops 2015 Summary (April 2016) USDA, National Agricultural Statistics Service
Number of Producers and Operations with Hired Workers by Size – 15 Program States: 2014 and 2015 [Operations with $10,000+ sales]
Gross value of
sales
All producers
Operations with
hired workers
Average peak number of workers
1
2014 2015 2014 2015 2014 2015
(number) (number) (number) (number) (number) (number)
$10,000 to $19,999 .................................... $20,000 to $39,999 .................................... $40,000 to $49,999 .................................... $50,000 to $99,999 .................................... $100,000 to $499,999 ................................ $500,000 or more ....................................... Total ..........................................................
740
907
315
958
1,601
1,085
5,606
673
939
376
1,330
1,517
1,078
5,913
297
451
188
712
1,484
1,070
4,202
272
473
227
971
1,412
1,052
4,407
4.6
4.3
5.7
5.7
10.2
59.7
20.8
3.4
4.0
4.8
5.0
9.3
55.9
18.3 1 Average of individual operation's reported largest number of workers on the payroll on any one day.

Floriculture Crops 2015 Summary (April 2016) 7 USDA, National Agricultural Statistics Service
Number of Producers by Gross Value of Sales and Expanded Wholesale Value – 15 Program States: 2014 and 2015 [Operations with $10,000+ sales]
State
$10,000 to
$19,999
$20,000 to
$39,999
$40,000 to
$49,999
$50,000 to
$99,999
2014 2015 2014 2015 2014 2015 2014 2015
(number) (number) (number) (number) (number) (number) (number) (number)
California ................... Florida ....................... Hawaii ....................... Illinois ........................ Maryland .................... Michigan .................... New Jersey ................ New York ................... North Carolina ........... Ohio ........................... Oregon ...................... Pennsylvania ............. South Carolina ........... Texas ........................ Washington ............... 15 State total .............
52 54 70 24 21 59 28 91 48 45
47
120 6
23 52
740
67 49 63 31 27 57 25 72 38 45
46 82 8
24 39
673
84 61 72 40 25 57 36
111 63 53
41
157 19 28 60
907
62 70 72 44 24 78 28
116 63 85
36
160 17 22 62
939
24 24 14 19 8
19 18 29 18 34
23 46 8
11 20
315
45 26 17 8
13 32 17 48 12 35
22 66 4 9
22
376
103 118 68 54 22 71 44
110 42 74
53
125 14 27 33
958
119 103 65 79 32 98 64
161 68
134
67 226 20 48 46
1,330
State
$100,000 to
$499,999
$500,000 or
more
All producers
Expanded wholesale
value 1
2014 2015 2014 2015 2014 2015 2014 2015
(number) (number) (number) (number) (number) (number) (1,000 dollars) (1,000 dollars)
California ................... Florida ....................... Hawaii ....................... Illinois ........................ Maryland .................... Michigan .................... New Jersey ................ New York ................... North Carolina ........... Ohio ........................... Oregon ...................... Pennsylvania ............. South Carolina ........... Texas ........................ Washington ............... 15 State total .............
181 233 65 77 46
170 94
171 65
127
58 156 14 99 45
1,601
177 233 60 77 34
155 86
159 72
111
63 146 12 83 49
1,517
223 231 23 41 24
134 52 56 43 64
43 43 11 67 30
1,085
215 229 24 34 23
136 53 59 41 62
49 47 11 65 30
1,078
667 721 312 255 146 510 272 568 279 397
265 647 72
255 240
5,606
685 710 301 273 153 556 273 615 294 472
283 727 72
251 248
5,913
1,075,548 931,959 44,064
108,977 100,181 413,939 191,693 166,484 230,826 204,357
130,831 169,379 63,303
227,025 144,766
4,203,332
1,083,706 1,039,411
44,981 99,292
115,003 409,078 203,421 177,582 241,578 223,842
136,764 193,812 65,179
221,154 118,836
4,373,639
1 Wholesale value of sales as reported by operations with $100,000 or more in sales of floriculture crops plus a calculated wholesale value of sales for operations with sales below $100,000. The value of sales for producers below $100,000 level was calculated by multiplying the number of producers in each size group by the mid-point of the sales range.

8 Floriculture Crops 2015 Summary (April 2016) USDA, National Agricultural Statistics Service
Number of Producers and Area Used for Production by Type of Cover – 15 Program States: 2014 and 2015 [Operations with $10,000+ sales]
State
Total number of producers
Glass greenhouses
Fiberglass and other rigid
greenhouses
Film plastic (single / multi) greenhouses
2014 2015 2014 2015 2014 2015 2014 2015
(number) (number) (1,000 sq. ft.) (1,000 sq. ft.) (1,000 sq. ft.) (1,000 sq. ft.) (1,000 sq. ft.) (1,000 sq. ft.)
California ............................. Florida .................................. Hawaii .................................. Illinois ................................... Maryland .............................. Michigan .............................. New Jersey .......................... New York ............................. North Carolina ...................... Ohio ..................................... Oregon ................................. Pennsylvania ....................... South Carolina ..................... Texas ................................... Washington .......................... Other States
1 ......................
15 State total ........................
667 721 312 255 146 510 272 568 279 397
265 647 72
255 240
-
5,606
685 710 301 273 153 556 273 615 294 472
283 727 72
251 248
-
5,913
12,355 4,061
(D) 3,301 1,338 3,722 5,458 4,103 6,780 7,667
2,544 2,497
(D) 1,204 2,221
280
57,531
10,748 3,054
(D) 2,966 1,644 3,458 4,675 3,816 6,652 8,860
2,835 2,585
(D) 1,361 2,317
27
54,998
38,399 9,918
(D) 1,899
984 3,614 1,057 1,551
451 1,881
2,677 3,923
(D) 3,822
859
1,770
72,805
30,042 8,159
(D) 2,249 1,375 3,773 1,031 1,223
529 1,767
2,691 3,808
(D) 3,696 1,099
1,704
63,146
70,359 39,376 3,191
10,425 5,616
40,495 19,328 15,547 15,650 17,267
12,715 13,796 2,945
32,030 7,986
-
306,726
63,989 40,460 2,873 9,389 6,255
39,047 17,530 15,721 14,459 16,005
13,335 14,566 2,821
28,052 6,702
-
291,204
State
Total greenhouse
cover
Shade and temporary
cover
Total covered
area
Open ground
2
2014 2015 2014 2015 2014 2015 2014 2015
(1,000 sq. ft.) (1,000 sq. ft.) (1,000 sq. ft.) (1,000 sq. ft.) (1,000 sq. ft.) (1,000 sq. ft.) (acres) (acres)
California ............................. Florida .................................. Hawaii .................................. Illinois ................................... Maryland .............................. Michigan .............................. New Jersey .......................... New York ............................. North Carolina ...................... Ohio ..................................... Oregon ................................. Pennsylvania ....................... South Carolina ..................... Texas ................................... Washington .......................... Other States
1 ......................
15 State total ........................
121,113 53,355
(D) 15,625 7,938
47,831 25,843 21,201 22,881 26,815
17,936 20,216
(D) 37,056 11,066
8,186
437,062
104,779 51,673
(D) 14,604 9,274
46,278 23,236 20,760 21,640 26,632
18,861 20,959
(D) 33,109 10,118
7,425
409,348
30,347 261,588
(D) 733 479 610 364 341
1,558 496
5,210
592 (D)
12,571 287
16,923
332,099
37,148 289,184
(D) 664 360 711 493 433
1,244 956
2,275
262 (D)
6,485 917
16,436
357,568
151,460 314,943 19,288 16,358 8,417
48,441 26,207 21,542 24,439 27,311
23,146 20,808 5,821
49,627 11,353
-
769,161
141,927 340,857 17,940 15,268 9,634
46,989 23,729 21,193 22,884 27,588
21,136 21,221 5,921
39,594 11,035
-
766,916
11,640 6,145
973 6,223 3,231 7,197 4,635 1,792 1,752 4,039
5,359 1,681
490 2,981 2,939
-
61,077
9,399 6,853
914 4,272
618 2,063 4,826
722 912 385
3,903
778 396
1,215 2,786
-
40,042
- Represents zero. (D) Withheld to avoid disclosing data for individual operations. 1
Includes data withheld above. 2
Totals may not add due to rounding.
Floriculture Crops 2015 Summary (April 2016) 9 USDA, National Agricultural Statistics Service
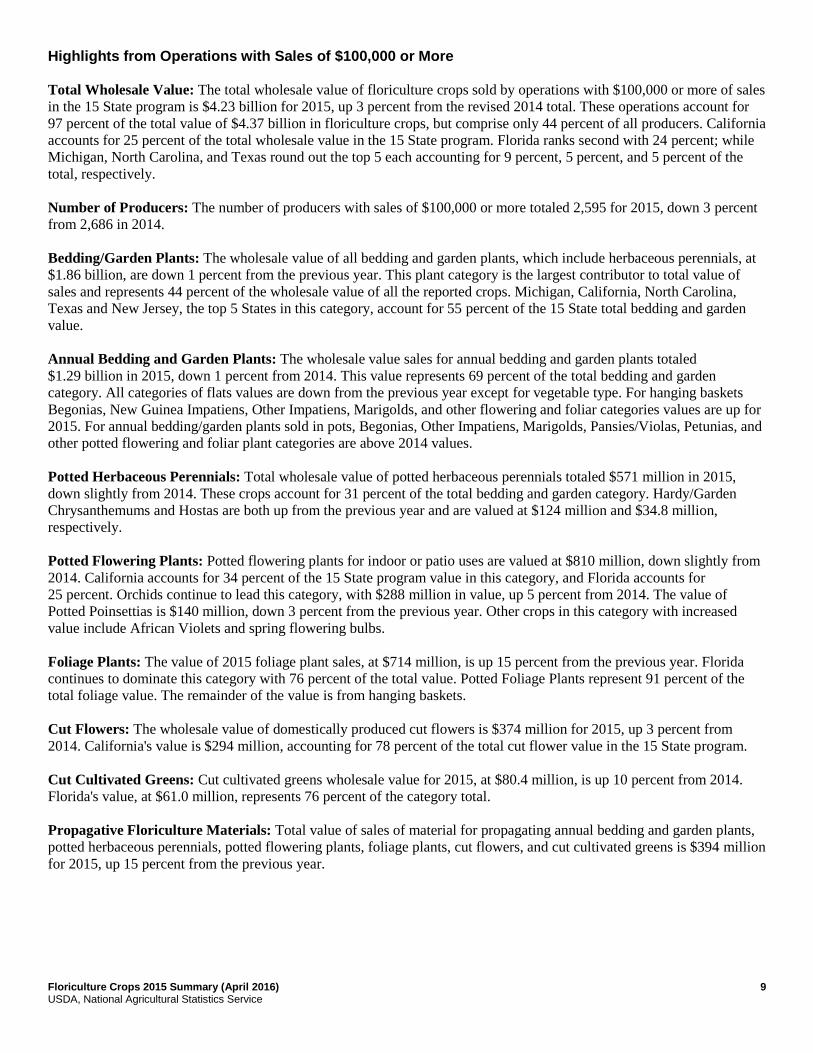
Highlights from Operations with Sales of $100,000 or More Total Wholesale Value: The total wholesale value of floriculture crops sold by operations with $100,000 or more of sales
in the 15 State program is $4.23 billion for 2015, up 3 percent from the revised 2014 total. These operations account for
97 percent of the total value of $4.37 billion in floriculture crops, but comprise only 44 percent of all producers. California
accounts for 25 percent of the total wholesale value in the 15 State program. Florida ranks second with 24 percent; while
Michigan, North Carolina, and Texas round out the top 5 each accounting for 9 percent, 5 percent, and 5 percent of the
total, respectively.
Number of Producers: The number of producers with sales of $100,000 or more totaled 2,595 for 2015, down 3 percent
from 2,686 in 2014.
Bedding/Garden Plants: The wholesale value of all bedding and garden plants, which include herbaceous perennials, at
$1.86 billion, are down 1 percent from the previous year. This plant category is the largest contributor to total value of
sales and represents 44 percent of the wholesale value of all the reported crops. Michigan, California, North Carolina,
Texas and New Jersey, the top 5 States in this category, account for 55 percent of the 15 State total bedding and garden
value.
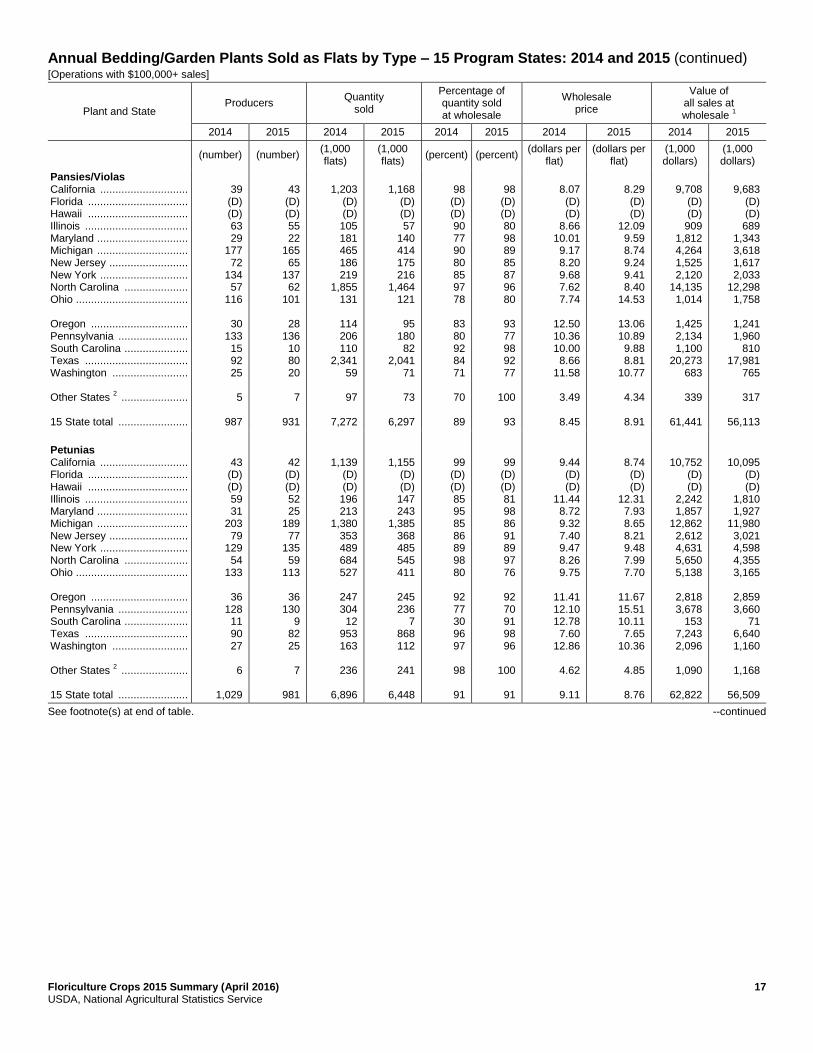
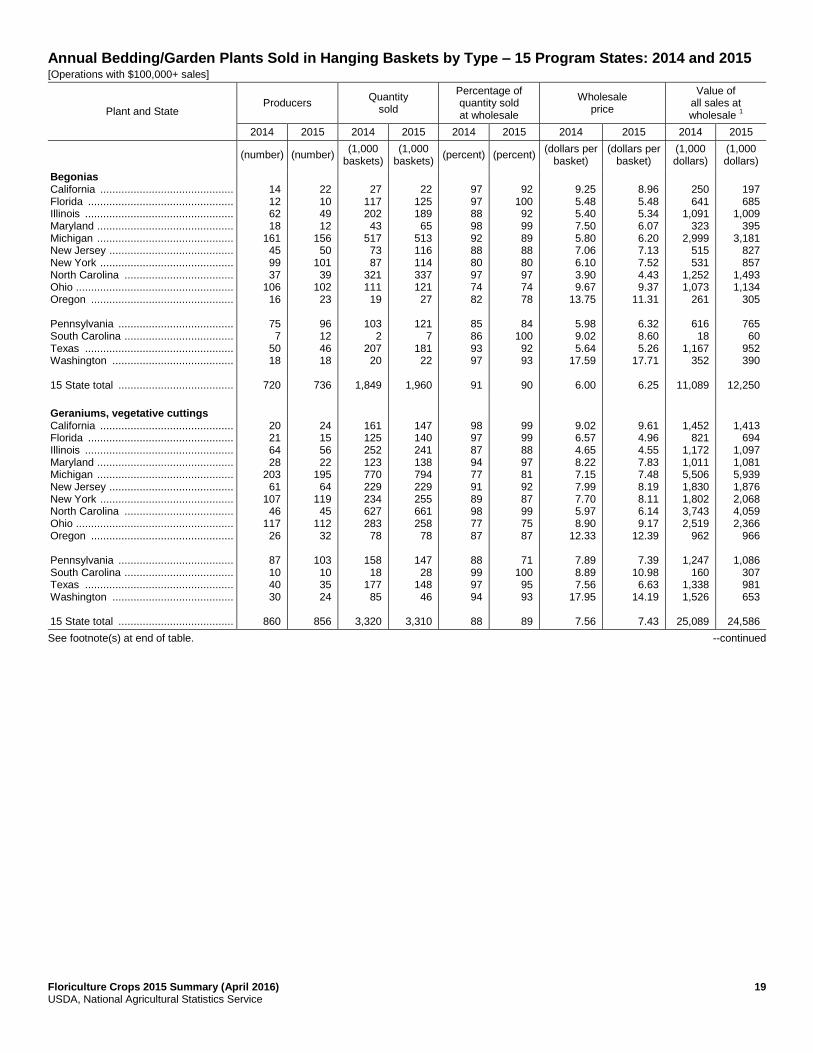
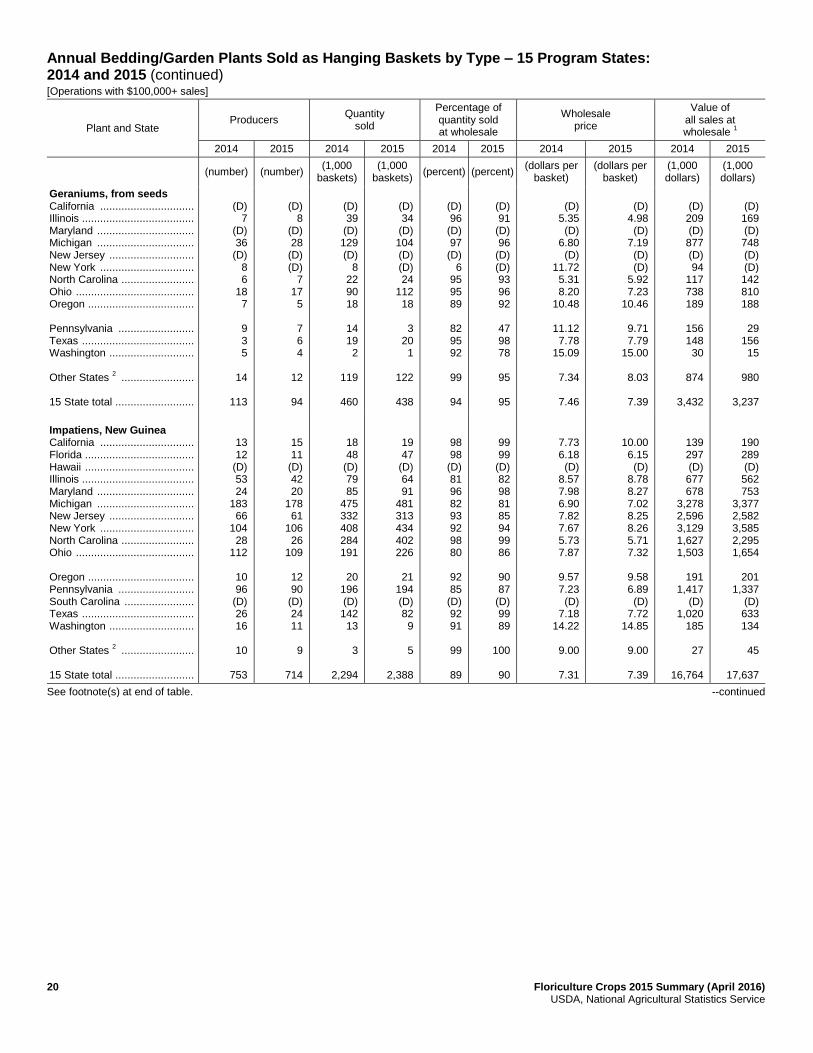
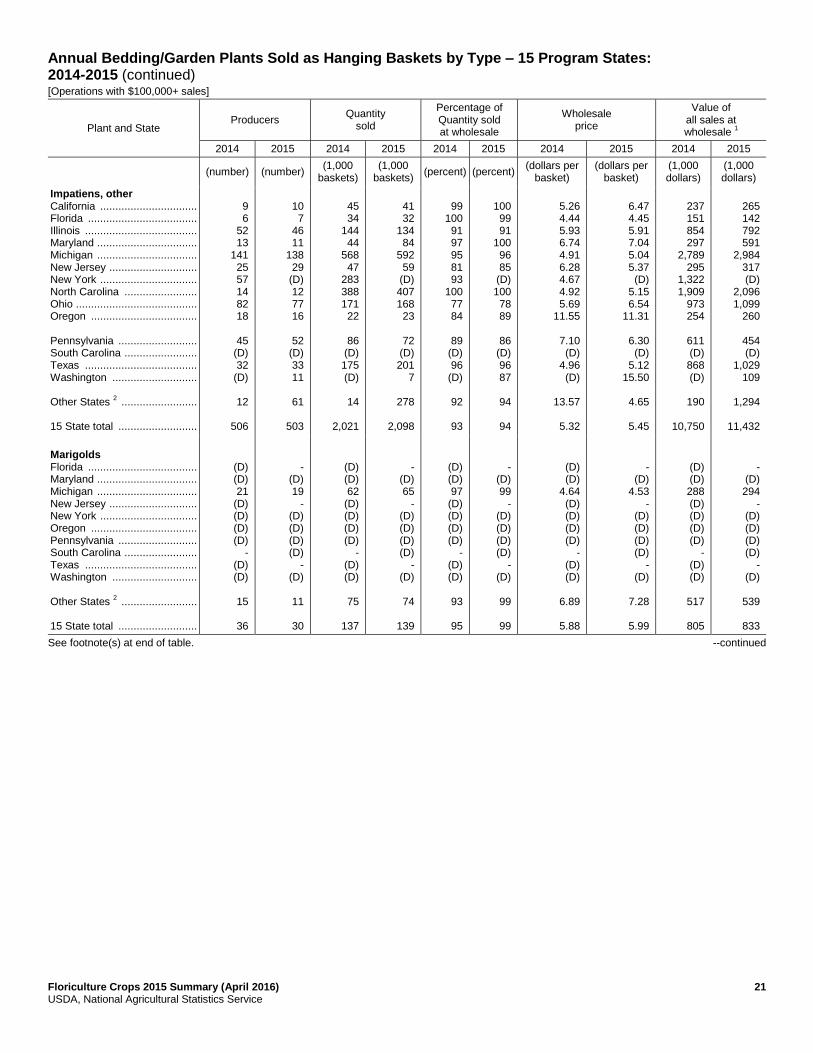
Annual Bedding and Garden Plants: The wholesale value sales for annual bedding and garden plants totaled
$1.29 billion in 2015, down 1 percent from 2014. This value represents 69 percent of the total bedding and garden
category. All categories of flats values are down from the previous year except for vegetable type. For hanging baskets
Begonias, New Guinea Impatiens, Other Impatiens, Marigolds, and other flowering and foliar categories values are up for
2015. For annual bedding/garden plants sold in pots, Begonias, Other Impatiens, Marigolds, Pansies/Violas, Petunias, and
other potted flowering and foliar plant categories are above 2014 values.
Potted Herbaceous Perennials: Total wholesale value of potted herbaceous perennials totaled $571 million in 2015,
down slightly from 2014. These crops account for 31 percent of the total bedding and garden category. Hardy/Garden
Chrysanthemums and Hostas are both up from the previous year and are valued at $124 million and $34.8 million,
respectively.
Potted Flowering Plants: Potted flowering plants for indoor or patio uses are valued at $810 million, down slightly from
2014. California accounts for 34 percent of the 15 State program value in this category, and Florida accounts for
25 percent. Orchids continue to lead this category, with $288 million in value, up 5 percent from 2014. The value of
Potted Poinsettias is $140 million, down 3 percent from the previous year. Other crops in this category with increased
value include African Violets and spring flowering bulbs.
Foliage Plants: The value of 2015 foliage plant sales, at $714 million, is up 15 percent from the previous year. Florida
continues to dominate this category with 76 percent of the total value. Potted Foliage Plants represent 91 percent of the
total foliage value. The remainder of the value is from hanging baskets.
Cut Flowers: The wholesale value of domestically produced cut flowers is $374 million for 2015, up 3 percent from
2014. California's value is $294 million, accounting for 78 percent of the total cut flower value in the 15 State program.
Cut Cultivated Greens: Cut cultivated greens wholesale value for 2015, at $80.4 million, is up 10 percent from 2014.
Florida's value, at $61.0 million, represents 76 percent of the category total.
Propagative Floriculture Materials: Total value of sales of material for propagating annual bedding and garden plants,
potted herbaceous perennials, potted flowering plants, foliage plants, cut flowers, and cut cultivated greens is $394 million
for 2015, up 15 percent from the previous year.
10 Floriculture Crops 2015 Summary (April 2016) USDA, National Agricultural Statistics Service
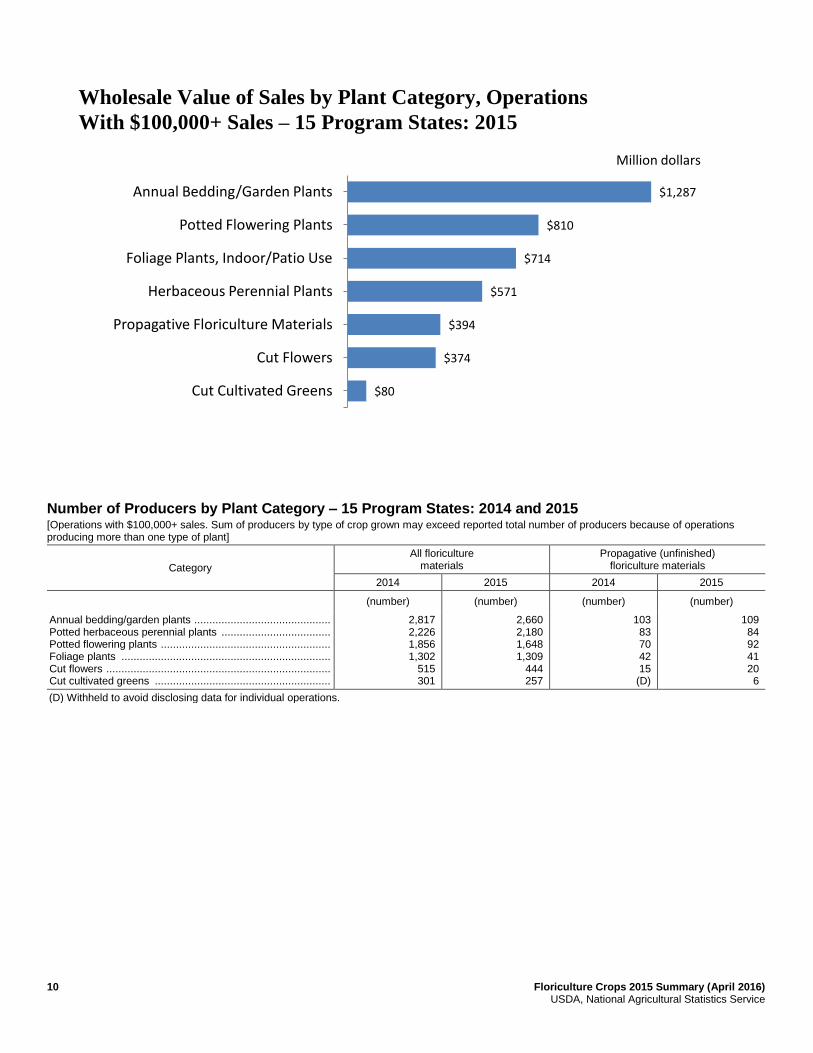
Number of Producers by Plant Category – 15 Program States: 2014 and 2015 [Operations with $100,000+ sales. Sum of producers by type of crop grown may exceed reported total number of producers because of operations producing more than one type of plant]
Category
All floriculture materials
Propagative (unfinished) floriculture materials
2014 2015 2014 2015
(number) (number) (number) (number)
Annual bedding/garden plants ............................................. Potted herbaceous perennial plants .................................... Potted flowering plants ........................................................ Foliage plants ..................................................................... Cut flowers .......................................................................... Cut cultivated greens ..........................................................
2,817 2,226 1,856 1,302
515 301
2,660 2,180 1,648 1,309
444 257
103 83 70 42 15
(D)
109 84 92 41 20 6
(D) Withheld to avoid disclosing data for individual operations.
$1,287
$810
$714
$571
$394
$374
$80
Annual Bedding/Garden Plants
Potted Flowering Plants
Foliage Plants, Indoor/Patio Use
Herbaceous Perennial Plants
Propagative Floriculture Materials
Cut Flowers
Cut Cultivated Greens
Million dollars
Wholesale Value of Sales by Plant Category, Operations
With $100,000+ Sales – 15 Program States: 2015

Floriculture Crops 2015 Summary (April 2016) 11 USDA, National Agricultural Statistics Service
Number of Producers and Area Used for Production by Type of Cover – 15 Program States: 2014 and 2015 [Operations with $100,000+ sales]
State
Total number of producers
Glass greenhouses
Fiberglass and other rigid
greenhouses
Film plastic (single / multi) greenhouses
2014 2015 2014 2015 2014 2015 2014 2015
(number) (number) (1,000 sq. ft.) (1,000 sq. ft.) (1,000 sq. ft.) (1,000 sq. ft.) (1,000 sq. ft.) (1,000 sq. ft.)
California ............................. Florida ................................. Hawaii ................................. Illinois .................................. Maryland .............................. Michigan .............................. New Jersey .......................... New York ............................. North Carolina ..................... Ohio ..................................... Oregon ................................ Pennsylvania ....................... South Carolina ..................... Texas .................................. Washington ......................... Other States
1 ......................
15 State total .......................
404 464 88
118 70
304 146 227 108 191
101 199 25
166 75
-
2,686
392 462 84
111 57
291 139 218 113 173
112 193 23
148 79
-
2,595
12,058 4,049
- 3,094
(D) 3,621 5,272 3,891 6,747 7,332
2,497 2,172
(D) 1,177 2,188
1,593
55,691
10,415 3,051
- 2,772 1,338 3,332 4,582 3,549 6,619 8,510
2,729 2,291
15 1,336 2,292
-
52,831
36,086 9,601
887 1,681
(D) 3,435
992 1,122
270 1,605
2,263 3,422
(D) 3,582
713
1,384
67,043
28,468 7,912
998 2,012 1,133 3,562
977 957 307
1,530
2,155 3,021
285 3,603
870
-
57,790
68,080 36,442 2,275 8,912 4,779
37,639 16,159 12,531 13,542 14,527
11,274 10,152 2,588
29,990 7,217
-
276,107
62,181 38,522 2,166 7,140 5,253
35,641 15,115 12,447 12,593 12,437
12,177 10,985 2,388
26,250 5,936
-
261,231
State
Total greenhouse
cover
Shade and temporary
cover
Total covered
area
Open ground
2
2014 2015 2014 2015 2014 2015 2014 2015
(1,000 sq. ft.) (1,000 sq. ft.) (1,000 sq. ft.) (1,000 sq. ft.) (1,000 sq. ft.) (1,000 sq. ft.) (acres) (acres)
California ............................. Florida ................................. Hawaii ................................. Illinois .................................. Maryland .............................. Michigan .............................. New Jersey .......................... New York ............................. North Carolina ..................... Ohio ..................................... Oregon ................................ Pennsylvania ....................... South Carolina ..................... Texas .................................. Washington ......................... Other States
1 ......................
15 State total .......................
116,224 50,092 3,162
13,687 (D)
44,695 22,423 17,544 20,559 23,464
16,034 15,746
(D) 34,749 10,118
10,344
398,841
101,064 49,485 3,164
11,924 (D)
42,535 20,674 16,953 19,519 22,477
17,061 16,297
(D) 31,189 9,098
10,412
371,852
28,768 241,991 10,074
622 (D) 568 301 265
1,226 407
5,013
423 (D)
12,411 127
2,471
304,667
34,304 271,798
9,216 588 (D) 566 275 267
1,190 840
2,100
192 (D)
6,096 891
3,085
331,408
144,992 292,083 13,236 14,309 7,403
45,263 22,724 17,809 21,785 23,871
21,047 16,169 5,412
47,160 10,245
-
703,508
135,368 321,283 12,380 12,512 8,046
43,101 20,949 17,220 20,709 23,317
19,161 16,489 5,451
37,285 9,989
-
703,260
10,158 5,238
434 3,952 2,278 6,345 4,189
658 1,396 3,657
4,102 1,218
378 2,336 2,089
-
48,428
8,187 5,791
426 2,956
546 1,856 4,560
473 742 247
2,995
376 347
1,122 2,035
-
32,658
- Represents zero. (D) Withheld to avoid disclosing data for individual operations. 1
Includes data withheld above. 2
Totals may not add due to rounding.

12 Floriculture Crops 2015 Summary (April 2016) USDA, National Agricultural Statistics Service
Wholesale Value of All Sales by Plant Category – 15 Program States: 2014 and 2015 [Operations with $100,000+ sales]
State
Annual bedding/garden
plants
Herbaceous perennial
plants
Total bedding/garden
plants 1
2014 2015 2014 2015 2014 2015
(1,000 dollars) (1,000 dollars) (1,000 dollars) (1,000 dollars) (1,000 dollars) (1,000 dollars)
California ............................. Florida .................................. Hawaii .................................. Illinois ................................... Maryland .............................. Michigan .............................. New Jersey .......................... New York ............................. North Carolina ...................... Ohio ..................................... Oregon ................................. Pennsylvania ....................... South Carolina ..................... Texas ................................... Washington .......................... Other States
2 ......................
15 State total ........................
200,642 104,133
2,469 46,655 59,937
208,640 70,884 77,277
135,076 76,725
49,722 72,949 6,620
134,703 55,552
-
1,301,984
193,209 96,402 2,199
38,595 64,704
208,727 77,016 86,189
140,596 81,126
52,586 67,574 8,036
136,112 33,511
-
1,286,582
79,225 41,042 1,605
37,558 23,407 64,958 45,215 27,438 36,047 46,232
29,401 17,648 45,833 38,232 38,836
-
572,677
72,361 37,023 1,587
25,619 37,527 61,939 56,641 24,608 42,873 51,844
30,667 22,593 46,786 32,118 27,226
-
571,412
279,867 145,175
4,074 84,213 83,344
273,598 116,099 104,715 171,123 122,957
79,123 90,597 52,453
172,935 94,388
-
1,874,661
265,570 133,425
3,786 64,214
102,231 270,666 133,657 110,797 183,469 132,970
83,253 90,167 54,822
168,230 60,737
-
1,857,994
State
Potted flowering
plants
Foliage plants for indoor
or patio use
Cut flowers
2014 2015 2014 2015 2014 2015
(1,000 dollars) (1,000 dollars) (1,000 dollars) (1,000 dollars) (1,000 dollars) (1,000 dollars)
California ............................. Florida .................................. Hawaii .................................. Illinois ................................... Maryland .............................. Michigan .............................. New Jersey .......................... New York ............................. North Carolina ...................... Ohio ..................................... Oregon ................................. Pennsylvania ....................... South Carolina ..................... Texas ................................... Washington .......................... Other States
2 ......................
15 State total ........................
290,194 199,831 15,031 13,015 4,240
37,397 36,074 28,326 32,093 59,642
16,092 29,910 8,766
29,322 10,012
-
809,945
273,537 201,212 15,079 23,875 7,060
31,147 29,368 29,537 27,545 68,163
14,809 44,954 8,221
27,165 7,988
-
809,660
116,949 444,710
8,694 1,373
(D) 6,411
(D) (D) (D)
7,465
(D) (D) (D)
12,232 849
24,199
622,882
114,599 543,447
9,612 1,121
(D) 6,305
(D) (D) (D)
4,207
1,170 (D) (D) (D) (D)
33,228
713,689
284,799 3,358 6,254 1,424
(D) 5,359
12,711 1,018 3,844
(D)
13,724 8,407
(D) (D)
20,897
1,659
363,454
293,737 2,289 7,014 1,103
470 5,312
14,675 885
4,981 (D)
13,350
(D) (D) (D)
20,457
10,045
374,318
See footnote(s) at end of table. --continued
Floriculture Crops 2015 Summary (April 2016) 13 USDA, National Agricultural Statistics Service
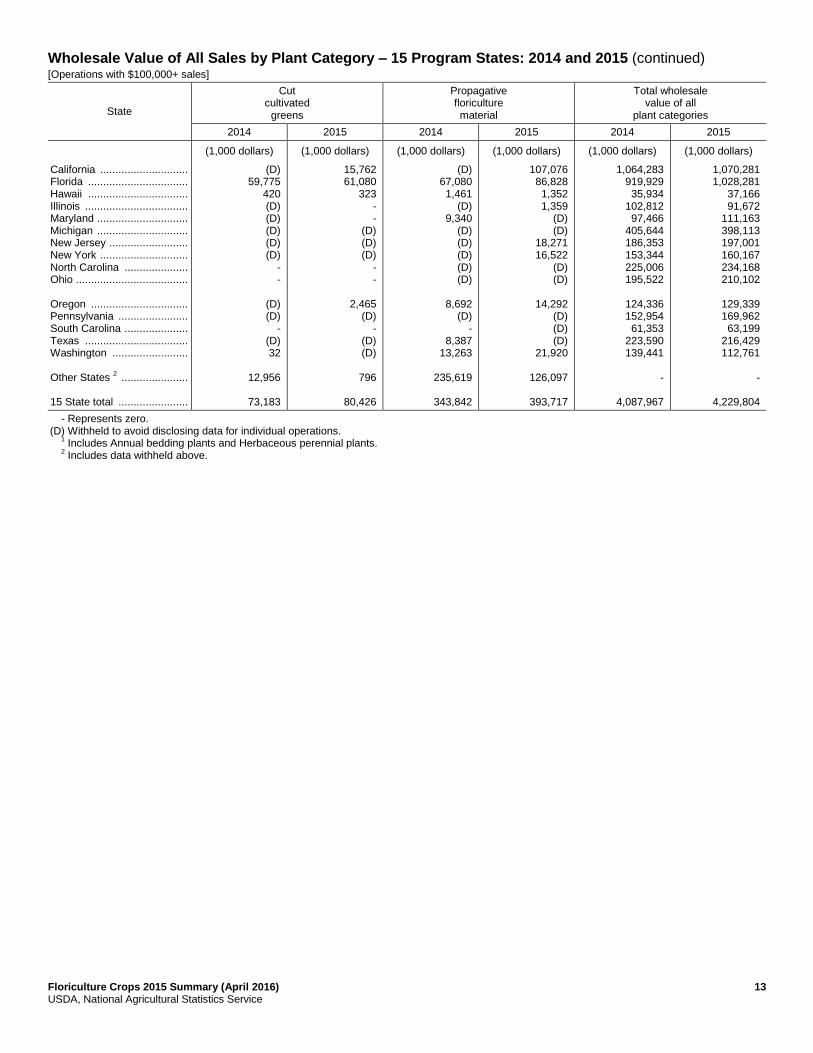
Wholesale Value of All Sales by Plant Category – 15 Program States: 2014 and 2015 (continued) [Operations with $100,000+ sales]
State
Cut cultivated
greens
Propagative floriculture material
Total wholesale value of all
plant categories
2014 2015 2014 2015 2014 2015
(1,000 dollars) (1,000 dollars) (1,000 dollars) (1,000 dollars) (1,000 dollars) (1,000 dollars)
California ............................. Florida ................................. Hawaii ................................. Illinois .................................. Maryland .............................. Michigan .............................. New Jersey .......................... New York ............................. North Carolina ..................... Ohio ..................................... Oregon ................................ Pennsylvania ....................... South Carolina ..................... Texas .................................. Washington ......................... Other States
2 ......................
15 State total .......................
(D) 59,775
420 (D) (D) (D) (D) (D)
- -
(D) (D)
- (D) 32
12,956
73,183
15,762 61,080
323 - -
(D) (D) (D)
- -
2,465 (D)
- (D) (D)
796
80,426
(D) 67,080 1,461
(D) 9,340
(D) (D) (D) (D) (D)
8,692
(D) -
8,387 13,263
235,619
343,842
107,076 86,828 1,352 1,359
(D) (D)
18,271 16,522
(D) (D)
14,292
(D) (D) (D)
21,920
126,097
393,717
1,064,283 919,929 35,934
102,812 97,466
405,644 186,353 153,344 225,006 195,522
124,336 152,954 61,353
223,590 139,441
-
4,087,967
1,070,281 1,028,281
37,166 91,672
111,163 398,113 197,001 160,167 234,168 210,102
129,339 169,962 63,199
216,429 112,761
-
4,229,804
- Represents zero. (D) Withheld to avoid disclosing data for individual operations. 1
Includes Annual bedding plants and Herbaceous perennial plants. 2
Includes data withheld above.

14 Floriculture Crops 2015 Summary (April 2016) USDA, National Agricultural Statistics Service
Annual Bedding/Garden Plants Sold in Flats by Type – 15 Program States: 2014 and 2015 [Operations with $100,000+ sales]
Plant and State Producers
Quantity sold
Percentage of quantity sold at wholesale
Wholesale price
Value of all sales at wholesale
1
2014 2015 2014 2015 2014 2015 2014 2015 2014 2015
(number) (number) (1,000 flats)
(1,000 flats)
(percent) (percent) (dollars per
flat) (dollars per
flat) (1,000 dollars)
(1,000 dollars)
Begonias California ............................. Florida .................................. Illinois ................................... Maryland .............................. Michigan .............................. New Jersey .......................... New York ............................. North Carolina ...................... Ohio ..................................... Oregon ................................. Pennsylvania ....................... South Carolina ..................... Texas ................................... Washington .......................... Other States
2 ......................
15 State total ........................
43
(D) 54 32
189 79
130 56
127 27
129 (D) 91 23
19
999
43
(D) 49 25
179 80
135 63
111 27
131 (D) 76 21
17
957
550 (D) 127 72
767 295 266 501 242 29
152 (D) 753 19
197
3,970
515 (D) 105 98
817 298 265 520 239 27
130 (D) 605 20
180
3,819
91
(D) 79 86 78 79 75 96 75 96
79
(D) 85 94
87
84
98
(D) 74 96 82 85 82 97 75 93
76
(D) 92 94
91
88
8.45 (D)
8.97 10.51 8.69 8.21 8.19 8.69 9.42
12.46
13.03 (D)
8.06 13.19
5.59
8.62
7.67 (D)
9.95 8.04 7.64 9.04 8.01 8.41 8.05
12.75
15.22 (D)
8.49 10.96
5.53
8.33
4,648
(D) 1,139
757 6,665 2,422 2,179 4,354 2,280
361
1,981 (D)
6,069 251
1,102
34,208
3,950
(D) 1,045
788 6,242 2,694 2,123 4,373 1,924
344
1,979 (D)
5,136 219
996
31,813
Geraniums, from vegetative cuttings California ............................. Florida .................................. Illinois ................................... Maryland .............................. Michigan .............................. New Jersey .......................... New York ............................. North Carolina ...................... Ohio ..................................... Oregon ................................. Pennsylvania ....................... South Carolina ..................... Texas ................................... Washington .......................... Other States
2 ......................
15 State total ........................
17 (D) (D)
5 8
(D) (D) (D) 11
7
(D) (D) 10 10
26
94
12 (D)
4 4 8
(D) (D)
5 13
11
(D) (D) 11 9
14
91
71 (D) (D)
7 23
(D) (D) (D) 10
6
(D) (D) 59 9
67
252
72 (D) 19 4
22 (D) (D) 13 15
12
(D) (D) 54 5
32
248
97 (D) (D) 49 87
(D) (D) (D) 77
84
(D) (D) 99 84
78
89
99 (D) 83 45 86
(D) (D) 80 57
91
(D) (D) 99 66
87
90
12.99 (D) (D)
11.01 21.92
(D) (D) (D)
15.46
21.43 (D) (D)
11.57 28.01
12.13
14.03
10.73 (D)
11.62 12.48 22.60
(D) (D)
6.44 14.85
22.81
(D) (D)
12.26 32.69
7.34
12.83
922 (D) (D) 77
504 (D) (D) (D) 155
129 (D) (D) 683 252
813
3,535
773 (D) 221 50
497 (D) (D) 84
223
274 (D) (D) 662 163
235
3,182
See footnote(s) at end of table. --continued

Floriculture Crops 2015 Summary (April 2016) 15 USDA, National Agricultural Statistics Service
Annual Bedding/Garden Plants Sold as Flats by Type – 15 Program States: 2014 and 2015 (continued) [Operations with $100,000+ sales]
Plant and State Producers
Quantity sold
Percentage of quantity sold at wholesale
Wholesale Price
Value of all sales at wholesale
1
2014 2015 2014 2015 2014 2015 2014 2015 2014 2015
(number) (number) (1,000 flats)
(1,000 flats)
(percent) (percent) (dollars per
flat) (dollars per
flat) (1,000 dollars)
(1,000 dollars)
Geraniums, from seeds California ................................. Florida ..................................... Illinois ...................................... Maryland .................................. Michigan .................................. New Jersey .............................. New York ................................. North Carolina ......................... Ohio ......................................... Oregon .................................... Pennsylvania ........................... South Carolina ......................... Texas ...................................... Washington ............................. Other States
2 ..........................
15 State total ...........................
(D)
- (D) (D) 31
(D) 20
(D) 63
(D)
18 (D) (D) (D)
50
182
(D) (D) (D)
4 31
(D) 22
(D) 54
(D)
14 (D)
7 (D)
32
164
(D)
- (D) (D) 66
(D) 27
(D) 47
(D)
5 (D) (D) (D)
227
372
(D) (D) (D)
3 141 (D) 66
(D) 42
(D)
6 (D) 22
(D)
145
425
(D)
- (D) (D) 87
(D) 93
(D) 63
(D)
64 (D) (D) (D)
94
89
(D) (D) (D) 43 92
(D) 97
(D) 62
(D)
61 (D) 97
(D)
93
90
(D)
- (D) (D)
7.70 (D)
7.94 (D)
11.40 (D)
22.22
(D) (D) (D)
9.15
9.26
(D) (D) (D)
10.91 7.21 (D)
8.29 (D)
10.22 (D)
20.97
(D) 7.99 (D)
7.61
8.07
(D)
- (D) (D) 508 (D) 214 (D) 536 (D)
111 (D) (D) (D)
2,076
3,445
(D) (D) (D) 33
1,017 (D) 547 (D) 429 (D)
126 (D) 176 (D)
1,103
3,431
Impatiens, New Guinea California ................................. Florida ..................................... Illinois ...................................... Maryland .................................. Michigan .................................. New Jersey .............................. New York ................................. North Carolina ......................... Ohio ......................................... Oregon .................................... Pennsylvania ........................... South Carolina ......................... Texas ...................................... Washington ............................. Other States
2 ..........................
15 State total ...........................
18 10 13 10 36 11 43 16 32
(D)
31 (D) 22 7
4
253
16 (D) 10 9
33 6
37 16 27
-
22 (D) 16 6
4
202
58 66 10 34
110 19 51 41 19
(D)
25 (D) 166 11
15
625
71 (D)
3 29 73 14 41 31 11
-
13 (D) 27 7
48
368
97 93 84 93 92 78 90 95 60
(D)
49 (D) 72
100
1
82
98 (D) 59 96 87 82 87 93 56
-
70 (D) 58 99
84
86
12.65 6.33 8.66
10.02 8.77
10.59 11.02 15.28 15.23
(D)
13.93 (D)
7.70 13.52
10.00
9.84
11.32 (D)
7.72 10.36 7.80
11.85 11.02 8.37
13.53 -
14.46 (D)
10.64 15.55
5.96
9.76
734 418 87
341 965 201 562 626 289 (D)
348 (D)
1,278 149
150
6,148
804 (D) 23
300 569 166 452 259 149
-
188 (D) 287 109
286
3,592
See footnote(s) at end of table. --continued

16 Floriculture Crops 2015 Summary (April 2016) USDA, National Agricultural Statistics Service
Annual Bedding/Garden Plants Sold as Flats by Type – 15 Program States: 2014 and 2015 (continued) [Operations with $100,000+ sales]
Plant and State Producers
Quantity sold
Percentage of quantity sold at wholesale
Wholesale price
Value of all sales at wholesale
1
2014 2015 2014 2015 2014 2015 2014 2015 2014 2015
(number) (number) (1,000 flats)
(1,000 flats)
(percent) (percent) (dollars per
flat) (dollars per
flat) (1,000 dollars)
(1,000 dollars)
Impatiens, other California ................................ Florida ..................................... Hawaii ..................................... Illinois ...................................... Maryland ................................. Michigan ................................. New Jersey ............................. New York ................................ North Carolina ......................... Ohio ........................................ Oregon .................................... Pennsylvania .......................... South Carolina ........................ Texas ...................................... Washington ............................. Other States
2 .........................
15 State total ...........................
38 6
(D) 54 23
176 64
100 46
119
30 116 (D) 70 23
7
872
40 5
(D) 48 23
168 59
101 53
110
28 115 (D) 73 22
6
851
888 87
(D) 137 41
1,329 327 533 417 427
78
165 (D) 284 59
3
4,775
669 42
(D) 111 129
1,106 263 655 415 308
76
146 (D) 441 39
4
4,404
98 93
(D) 80 82 90 79 92 97 71
79 59
(D) 94 95
91
89
98
100 (D) 73 98 88 85 93 97 63
85 53
(D) 93 94
87
89
8.43 4.08 (D)
9.69 11.73 7.45 7.17 9.40 9.08 7.45
12.68 12.13
(D) 8.18
13.81
11.00
8.38
8.32 5.98 (D)
10.93 6.22 8.06
10.84 9.11 8.68 8.11
13.41 12.50
(D) 8.36
10.67
9.00
8.78
7,486
355 (D)
1,328 481
9,901 2,345 5,010 3,786 3,181
989
2,001 (D)
2,323 815
33
40,034
5,566
251 (D)
1,213 802
8,914 2,851 5,967 3,602 2,498
1,019 1,825
(D) 3,687
416
36
38,647
Marigolds California ................................ Florida ..................................... Hawaii ..................................... Illinois ...................................... Maryland ................................. Michigan ................................. New Jersey ............................. New York ................................ North Carolina ......................... Ohio ........................................ Oregon .................................... Pennsylvania .......................... South Carolina ........................ Texas ...................................... Washington ............................. Other States
2 .........................
15 State total ...........................
42 (D) (D) 56 32
196 80
133 59
132
36 133
8 86 28
8
1,029
41 (D) (D) 49 28
182 77
135 66
113
37 134
6 81 25
9
983
779 (D) (D) 89 50
586 163 274 434 262
131 212
3 349 86
253
3,671
768 (D) (D) 60 73
588 166 274 434 235
115 185
3 377 54
255
3,587
98 (D) (D) 81 69 82 76 83 98 76
93 74 93 95 95
97
89
99 (D) (D) 75 97 83 82 81 97 76
96 75 78 96 95
98
90
8.66 (D) (D)
10.51 11.18 8.09 8.02 9.16 6.34 8.41
9.95
13.14 8.46 7.44
11.54
4.94
8.36
8.20 (D) (D)
11.44 9.66 7.34
10.29 9.23 6.48 7.78
10.25 15.16 9.68 7.13
10.17
5.07
8.20
6,746 (D) (D) 935 559
4,741 1,307 2,510 2,752 2,203
1,303 2,786
25 2,597
992
1,250
30,706
6,298 (D) (D) 686 705
4,316 1,708 2,529 2,812 1,828
1,179 2,805
29 2,688
549
1,293
29,425
See footnote(s) at end of table. --continued
Floriculture Crops 2015 Summary (April 2016) 17 USDA, National Agricultural Statistics Service
Annual Bedding/Garden Plants Sold as Flats by Type – 15 Program States: 2014 and 2015 (continued) [Operations with $100,000+ sales]
Plant and State Producers
Quantity sold
Percentage of quantity sold at wholesale
Wholesale price
Value of all sales at wholesale
1
2014 2015 2014 2015 2014 2015 2014 2015 2014 2015
(number) (number) (1,000 flats)
(1,000 flats)
(percent) (percent) (dollars per
flat) (dollars per
flat) (1,000 dollars)
(1,000 dollars)
Pansies/Violas California ............................. Florida ................................. Hawaii ................................. Illinois .................................. Maryland .............................. Michigan .............................. New Jersey .......................... New York ............................. North Carolina ..................... Ohio ..................................... Oregon ................................ Pennsylvania ....................... South Carolina ..................... Texas .................................. Washington ......................... Other States
2 ......................
15 State total .......................
39
(D) (D) 63 29
177 72
134 57
116
30 133 15 92 25
5
987
43
(D) (D) 55 22
165 65
137 62
101
28 136 10 80 20
7
931
1,203
(D) (D) 105 181 465 186 219
1,855 131
114 206 110
2,341 59
97
7,272
1,168
(D) (D) 57
140 414 175 216
1,464 121
95
180 82
2,041 71
73
6,297
98
(D) (D) 90 77 90 80 85 97 78
83 80 92 84 71
70
89
98
(D) (D) 80 98 89 85 87 96 80
93 77 98 92 77
100
93
8.07 (D) (D)
8.66 10.01 9.17 8.20 9.68 7.62 7.74
12.50 10.36 10.00 8.66
11.58
3.49
8.45
8.29 (D) (D)
12.09 9.59 8.74 9.24 9.41 8.40
14.53
13.06 10.89 9.88 8.81
10.77
4.34
8.91
9,708
(D) (D) 909
1,812 4,264 1,525 2,120
14,135 1,014
1,425 2,134 1,100
20,273 683
339
61,441
9,683
(D) (D) 689
1,343 3,618 1,617 2,033
12,298 1,758
1,241 1,960
810 17,981
765
317
56,113
Petunias California ............................. Florida ................................. Hawaii ................................. Illinois .................................. Maryland .............................. Michigan .............................. New Jersey .......................... New York ............................. North Carolina ..................... Ohio ..................................... Oregon ................................ Pennsylvania ....................... South Carolina ..................... Texas .................................. Washington ......................... Other States
2 ......................
15 State total .......................
43 (D) (D) 59 31
203 79
129 54
133
36 128 11 90 27
6
1,029
42 (D) (D) 52 25
189 77
135 59
113
36 130
9 82 25
7
981
1,139 (D) (D) 196 213
1,380 353 489 684 527
247 304 12
953 163
236
6,896
1,155 (D) (D) 147 243
1,385 368 485 545 411
245 236
7 868 112
241
6,448
99 (D) (D) 85 95 85 86 89 98 80
92 77 30 96 97
98
91
99 (D) (D) 81 98 86 91 89 97 76
92 70 91 98 96
100
91
9.44 (D) (D)
11.44 8.72 9.32 7.40 9.47 8.26 9.75
11.41 12.10 12.78 7.60
12.86
4.62
9.11
8.74 (D) (D)
12.31 7.93 8.65 8.21 9.48 7.99 7.70
11.67 15.51 10.11 7.65
10.36
4.85
8.76
10,752 (D) (D)
2,242 1,857
12,862 2,612 4,631 5,650 5,138
2,818 3,678
153 7,243 2,096
1,090
62,822
10,095 (D) (D)
1,810 1,927
11,980 3,021 4,598 4,355 3,165
2,859 3,660
71 6,640 1,160
1,168
56,509
See footnote(s) at end of table. --continued

18 Floriculture Crops 2015 Summary (April 2016) USDA, National Agricultural Statistics Service
Annual Bedding/Garden Plants Sold as Flats by Type – 15 Program States: 2014 and 2015 (continued) [Operations with $100,000+ sales]
Plant and State Producers
Quantity sold
Percentage of quantity sold at wholesale
Wholesale price
Value of all sales at wholesale
1
2014 2015 2014 2015 2014 2015 2014 2015 2014 2015
(number) (number) (1,000 flats)
(1,000 flats)
(percent) (percent) (dollars per
flat) (dollars per
flat) (1,000 dollars)
(1,000 dollars)
Other flowering and foliar California ............................. Florida .................................. Hawaii .................................. Illinois ................................... Maryland .............................. Michigan .............................. New Jersey .......................... New York ............................. North Carolina ...................... Ohio ..................................... Oregon ................................. Pennsylvania ....................... South Carolina ..................... Texas ................................... Washington .......................... Other States
2 ......................
15 State total ........................
51 12
(D) 49 32
181 63
127 55
111
30 129 (D) 82 28
9
959
45 6
(D) 46 23
170 63
127 55
103
34 127 (D) 71 25
9
904
3,719 546 (D) 271 385
3,112 707 663
1,085 806
333 485 (D)
2,082 418
176
14,788
3,607 554 (D) 236 233
2,186 724 705
1,578 888
466 486 (D)
2,807 272
69
14,811
97 96
(D) 82 83 88 92 78 94 79
87 71
(D) 92 90
100
90
99 98
(D) 77 95 85 87 74 96 75
86 69
(D) 96 84
100
91
10.11 5.37 (D)
8.57 8.27 6.84 8.26 8.66
14.10 9.17
12.44 10.96
(D) 10.58 11.00
5.70
9.38
7.99 5.56 (D)
11.27 10.53
8.74 9.05 8.95 8.68 8.35
13.13 11.97
(D) 9.09
10.98
11.97
8.87
37,599 2,932
(D) 2,322 3,184
21,286 5,840 5,742
15,299 7,391
4,143 5,316
(D) 22,028 4,598
1,003
138,683
28,820 3,080
(D) 2,660 2,453
19,106 6,552 6,310
13,697 7,415
6,119 5,817
(D) 25,516 2,987
826
131,358
Vegetable type California ............................. Florida .................................. Hawaii .................................. Illinois ................................... Maryland .............................. Michigan .............................. New Jersey .......................... New York ............................. North Carolina ...................... Ohio ..................................... Oregon ................................. Pennsylvania ....................... South Carolina ..................... Texas ................................... Washington .......................... Other States
2 ......................
15 State total ........................
26 10
(D) 39
(D) 132 47
103 37
108
23 106
6 54 21
14
726
37 7
(D) 35
(D) 129 56
118 48 98
23
114 4
48 16
17
750
1,034 95
(D) 153 (D) 590 133 467 406 383
134 258 20
720 103
365
4,861
1,364 58
(D) 96
(D) 743 302 474 491 383
159 240 10
661 103
369
5,453
100 74
(D) 75
(D) 73 67 80 84 65
92 62 94 96 98
99
86
97 80
(D) 72
(D) 80 81 77 88 67
89 66 80 97 98
99
87
10.39 10.32
(D) 9.34 (D)
8.77 10.37 7.48
15.42 10.28
12.79 9.10
11.34 10.45 13.65
16.44
10.82
9.04 11.44
(D) 8.15 (D)
11.00 9.51 7.45
12.86 10.06
12.54
9.26 8.54
13.16 11.11
13.94
10.60
10,743 980 (D)
1,429 (D)
5,174 1,379 3,493 6,261 3,937
1,714 2,348
227 7,524 1,406
6,001
52,616
12,331 664 (D) 782 (D)
8,173 2,872 3,531 6,314 3,853
1,994 2,222
85 8,699 1,144
5,144
57,808
- Represents zero. (D) Withheld to avoid disclosing data for individual operations. 1
Equivalent wholesale value of all sales. 2
Includes data withheld above.
Floriculture Crops 2015 Summary (April 2016) 19 USDA, National Agricultural Statistics Service
Annual Bedding/Garden Plants Sold in Hanging Baskets by Type – 15 Program States: 2014 and 2015 [Operations with $100,000+ sales]
Plant and State Producers
Quantity sold
Percentage of quantity sold at wholesale
Wholesale price
Value of all sales at wholesale
1
2014 2015 2014 2015 2014 2015 2014 2015 2014 2015
(number) (number) (1,000
baskets) (1,000
baskets) (percent) (percent)
(dollars per basket)
(dollars per basket)
(1,000 dollars)
(1,000 dollars)
Begonias California ............................................ Florida ................................................ Illinois ................................................. Maryland ............................................. Michigan ............................................. New Jersey ......................................... New York ............................................ North Carolina .................................... Ohio .................................................... Oregon ............................................... Pennsylvania ...................................... South Carolina .................................... Texas ................................................. Washington ........................................ 15 State total ......................................
14 12 62 18
161 45 99 37
106 16
75 7
50 18
720
22 10 49 12
156 50
101 39
102 23
96 12 46 18
736
27
117 202 43
517 73 87
321 111 19
103
2 207 20
1,849
22
125 189 65
513 116 114 337 121 27
121
7 181 22
1,960
97 97 88 98 92 88 80 97 74 82
85 86 93 97
91
92
100 92 99 89 88 80 97 74 78
84
100 92 93
90
9.25 5.48 5.40 7.50 5.80 7.06 6.10 3.90 9.67
13.75
5.98 9.02 5.64
17.59
6.00
8.96 5.48 5.34 6.07 6.20 7.13 7.52 4.43 9.37
11.31
6.32 8.60 5.26
17.71
6.25
250 641
1,091 323
2,999 515 531
1,252 1,073
261
616 18
1,167 352
11,089
197 685
1,009 395
3,181 827 857
1,493 1,134
305
765 60
952 390
12,250
Geraniums, vegetative cuttings California ............................................ Florida ................................................ Illinois ................................................. Maryland ............................................. Michigan ............................................. New Jersey ......................................... New York ............................................ North Carolina .................................... Ohio .................................................... Oregon ............................................... Pennsylvania ...................................... South Carolina .................................... Texas ................................................. Washington ........................................ 15 State total ......................................
20 21 64 28
203 61
107 46
117 26
87 10 40 30
860
24 15 56 22
195 64
119 45
112 32
103 10 35 24
856
161 125 252 123 770 229 234 627 283 78
158 18
177 85
3,320
147 140 241 138 794 229 255 661 258 78
147 28
148 46
3,310
98 97 87 94 77 91 89 98 77 87
88 99 97 94
88
99 99 88 97 81 92 87 99 75 87
71
100 95 93
89
9.02 6.57 4.65 8.22 7.15 7.99 7.70 5.97 8.90
12.33
7.89 8.89 7.56
17.95
7.56
9.61 4.96 4.55 7.83 7.48 8.19 8.11 6.14 9.17
12.39
7.39 10.98 6.63
14.19
7.43
1,452 821
1,172 1,011 5,506 1,830 1,802 3,743 2,519
962
1,247 160
1,338 1,526
25,089
1,413 694
1,097 1,081 5,939 1,876 2,068 4,059 2,366
966
1,086 307 981 653
24,586
See footnote(s) at end of table. --continued
20 Floriculture Crops 2015 Summary (April 2016) USDA, National Agricultural Statistics Service
Annual Bedding/Garden Plants Sold as Hanging Baskets by Type – 15 Program States: 2014 and 2015 (continued) [Operations with $100,000+ sales]
Plant and State Producers
Quantity sold
Percentage of quantity sold at wholesale
Wholesale price
Value of all sales at wholesale
1
2014 2015 2014 2015 2014 2015 2014 2015 2014 2015
(number) (number) (1,000
baskets) (1,000
baskets) (percent) (percent)
(dollars per basket)
(dollars per basket)
(1,000 dollars)
(1,000 dollars)
Geraniums, from seeds California ............................... Illinois ..................................... Maryland ................................ Michigan ................................ New Jersey ............................ New York ............................... North Carolina ........................ Ohio ....................................... Oregon ................................... Pennsylvania ......................... Texas ..................................... Washington ............................ Other States
2 ........................
15 State total ..........................
(D)
7 (D) 36
(D) 8 6
18 7
9 3 5
14
113
(D)
8 (D) 28
(D) (D)
7 17 5
7 6 4
12
94
(D) 39
(D) 129 (D)
8 22 90 18
14 19 2
119
460
(D) 34
(D) 104 (D) (D) 24
112 18
3
20 1
122
438
(D) 96
(D) 97
(D) 6
95 95 89
82 95 92
99
94
(D) 91
(D) 96
(D) (D) 93 96 92
47 98 78
95
95
(D)
5.35 (D)
6.80 (D)
11.72 5.31 8.20
10.48
11.12 7.78
15.09
7.34
7.46
(D)
4.98 (D)
7.19 (D) (D)
5.92 7.23
10.46
9.71 7.79
15.00
8.03
7.39
(D) 209 (D) 877 (D) 94
117 738 189
156 148 30
874
3,432
(D) 169 (D) 748 (D) (D) 142 810 188
29
156 15
980
3,237
Impatiens, New Guinea California ............................... Florida .................................... Hawaii .................................... Illinois ..................................... Maryland ................................ Michigan ................................ New Jersey ............................ New York ............................... North Carolina ........................ Ohio ....................................... Oregon ................................... Pennsylvania ......................... South Carolina ....................... Texas ..................................... Washington ............................ Other States
2 ........................
15 State total ..........................
13 12
(D) 53 24
183 66
104 28
112
10 96
(D) 26 16
10
753
15 11
(D) 42 20
178 61
106 26
109
12 90
(D) 24 11
9
714
18 48
(D) 79 85
475 332 408 284 191
20
196 (D) 142 13
3
2,294
19 47
(D) 64 91
481 313 434 402 226
21
194 (D) 82 9
5
2,388
98 98
(D) 81 96 82 93 92 98 80
92 85
(D) 92 91
99
89
99 99
(D) 82 98 81 85 94 99 86
90 87
(D) 99 89
100
90
7.73 6.18 (D)
8.57 7.98 6.90 7.82 7.67 5.73 7.87
9.57 7.23 (D)
7.18 14.22
9.00
7.31
10.00 6.15 (D)
8.78 8.27 7.02 8.25 8.26 5.71 7.32
9.58 6.89 (D)
7.72 14.85
9.00
7.39
139 297 (D) 677 678
3,278 2,596 3,129 1,627 1,503
191
1,417 (D)
1,020 185
27
16,764
190 289 (D) 562 753
3,377 2,582 3,585 2,295 1,654
201
1,337 (D) 633 134
45
17,637
See footnote(s) at end of table. --continued
Floriculture Crops 2015 Summary (April 2016) 21 USDA, National Agricultural Statistics Service
Annual Bedding/Garden Plants Sold as Hanging Baskets by Type – 15 Program States: 2014-2015 (continued) [Operations with $100,000+ sales]
Plant and State Producers
Quantity sold
Percentage of Quantity sold at wholesale
Wholesale price
Value of all sales at wholesale
1
2014 2015 2014 2015 2014 2015 2014 2015 2014 2015
(number) (number) (1,000
baskets) (1,000
baskets) (percent) (percent)
(dollars per basket)
(dollars per basket)
(1,000 dollars)
(1,000 dollars)
Impatiens, other California ................................ Florida .................................... Illinois ..................................... Maryland ................................. Michigan ................................. New Jersey ............................. New York ................................ North Carolina ........................ Ohio ........................................ Oregon ................................... Pennsylvania .......................... South Carolina ........................ Texas ..................................... Washington ............................ Other States
2 .........................
15 State total ..........................
9 6
52 13
141 25 57 14 82 18
45
(D) 32
(D)
12
506
10 7
46 11
138 29
(D) 12 77 16
52
(D) 33 11
61
503
45 34
144 44
568 47
283 388 171 22
86
(D) 175 (D)
14
2,021
41 32
134 84
592 59
(D) 407 168 23
72
(D) 201
7
278
2,098
99
100 91 97 95 81 93
100 77 84
89
(D) 96
(D)
92
93
100 99 91
100 96 85
(D) 100 78 89
86
(D) 96 87
94
94
5.26 4.44 5.93 6.74 4.91 6.28 4.67 4.92 5.69
11.55
7.10 (D)
4.96 (D)
13.57
5.32
6.47 4.45 5.91 7.04 5.04 5.37 (D)
5.15 6.54
11.31
6.30 (D)
5.12 15.50
4.65
5.45
237 151 854 297
2,789 295
1,322 1,909
973 254
611 (D) 868 (D)
190
10,750
265 142 792 591
2,984 317 (D)
2,096 1,099
260
454 (D)
1,029 109
1,294
11,432
Marigolds Florida .................................... Maryland ................................. Michigan ................................. New Jersey ............................. New York ................................ Oregon ................................... Pennsylvania .......................... South Carolina ........................ Texas ..................................... Washington ............................ Other States
2 .........................
15 State total ..........................
(D) (D) 21
(D) (D) (D) (D)
- (D) (D)
15
36
- (D) 19
- (D) (D) (D) (D)
- (D)
11
30
(D) (D) 62
(D) (D) (D) (D)
- (D) (D)
75
137
- (D) 65
- (D) (D) (D) (D)
- (D)
74
139
(D) (D) 97
(D) (D) (D) (D)
- (D) (D)
93
95
- (D) 99
- (D) (D) (D) (D)
- (D)
99
99
(D) (D)
4.64 (D) (D) (D) (D)
- (D) (D)
6.89
5.88
- (D)
4.53 -
(D) (D) (D) (D)
- (D)
7.28
5.99
(D) (D) 288 (D) (D) (D) (D)
- (D) (D)
517
805
- (D) 294
- (D) (D) (D) (D)
- (D)
539
833
See footnote(s) at end of table. --continued
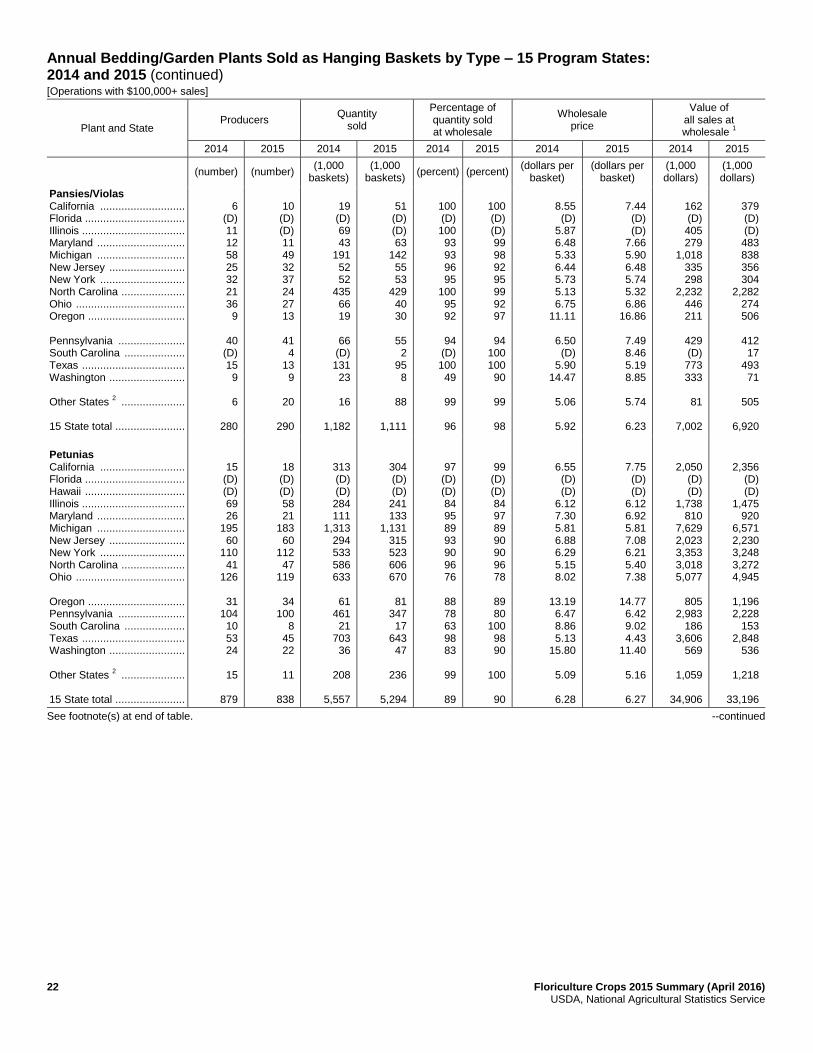
22 Floriculture Crops 2015 Summary (April 2016) USDA, National Agricultural Statistics Service
Annual Bedding/Garden Plants Sold as Hanging Baskets by Type – 15 Program States: 2014 and 2015 (continued) [Operations with $100,000+ sales]
Plant and State Producers
Quantity sold
Percentage of quantity sold at wholesale
Wholesale price
Value of all sales at wholesale
1
2014 2015 2014 2015 2014 2015 2014 2015 2014 2015
(number) (number) (1,000
baskets) (1,000
baskets) (percent) (percent)
(dollars per basket)
(dollars per basket)
(1,000 dollars)
(1,000 dollars)
Pansies/Violas California ............................ Florida ................................. Illinois .................................. Maryland ............................. Michigan ............................. New Jersey ......................... New York ............................ North Carolina ..................... Ohio .................................... Oregon ................................ Pennsylvania ...................... South Carolina .................... Texas .................................. Washington ......................... Other States
2 .....................
15 State total .......................
6
(D) 11 12 58 25 32 21 36 9
40 (D) 15 9
6
280
10
(D) (D) 11 49 32 37 24 27 13
41 4
13 9
20
290
19
(D) 69 43
191 52 52
435 66 19
66
(D) 131 23
16
1,182
51
(D) (D) 63
142 55 53
429 40 30
55 2
95 8
88
1,111
100 (D) 100 93 93 96 95
100 95 92
94
(D) 100 49
99
96
100 (D) (D) 99 98 92 95 99 92 97
94
100 100 90
99
98
8.55 (D)
5.87 6.48 5.33 6.44 5.73 5.13 6.75
11.11
6.50 (D)
5.90 14.47
5.06
5.92
7.44 (D) (D)
7.66 5.90 6.48 5.74 5.32 6.86
16.86
7.49 8.46 5.19 8.85
5.74
6.23
162 (D) 405 279
1,018 335 298
2,232 446 211
429 (D) 773 333
81
7,002
379 (D) (D) 483 838 356 304
2,282 274 506
412 17
493 71
505
6,920
Petunias California ............................ Florida ................................. Hawaii ................................. Illinois .................................. Maryland ............................. Michigan ............................. New Jersey ......................... New York ............................ North Carolina ..................... Ohio .................................... Oregon ................................ Pennsylvania ...................... South Carolina .................... Texas .................................. Washington ......................... Other States
2 .....................
15 State total .......................
15 (D) (D) 69 26
195 60
110 41
126
31 104 10 53 24
15
879
18 (D) (D) 58 21
183 60
112 47
119
34 100
8 45 22
11
838
313 (D) (D) 284 111
1,313 294 533 586 633
61
461 21
703 36
208
5,557
304 (D) (D) 241 133
1,131 315 523 606 670
81
347 17
643 47
236
5,294
97 (D) (D) 84 95 89 93 90 96 76
88 78 63 98 83
99
89
99 (D) (D) 84 97 89 90 90 96 78
89 80
100 98 90
100
90
6.55 (D) (D)
6.12 7.30 5.81 6.88 6.29 5.15 8.02
13.19 6.47 8.86 5.13
15.80
5.09
6.28
7.75 (D) (D)
6.12 6.92 5.81 7.08 6.21 5.40 7.38
14.77 6.42 9.02 4.43
11.40
5.16
6.27
2,050 (D) (D)
1,738 810
7,629 2,023 3,353 3,018 5,077
805
2,983 186
3,606 569
1,059
34,906
2,356 (D) (D)
1,475 920
6,571 2,230 3,248 3,272 4,945
1,196 2,228
153 2,848
536
1,218
33,196
See footnote(s) at end of table. --continued

Floriculture Crops 2015 Summary (April 2016) 23 USDA, National Agricultural Statistics Service
Annual Bedding/Garden Plants Sold as Hanging Baskets by Type – 15 Program States: 2014 and 2015 (continued) [Operations with $100,000+ sales]
Plant and State Producers
Quantity sold
Percentage of quantity sold at wholesale
Wholesale price
Value of all sales at wholesale
1
2014 2015 2014 2015 2014 2015 2014 2015 2014 2015
(number) (number) (1,000
baskets) (1,000
baskets) (percent) (percent)
(dollars per basket)
(dollars per basket)
(1,000 dollars)
(1,000 dollars)
Other flowering and foliar California ............................ Florida ................................ Hawaii ................................ Illinois ................................. Maryland ............................. Michigan ............................. New Jersey ......................... New York ............................ North Carolina .................... Ohio .................................... Oregon ............................... Pennsylvania ...................... South Carolina .................... Texas ................................. Washington ........................ Other States
2 .....................
15 State total ......................
14 (D) (D) 63 26
176 51
120 42
113
29 110
7 52 35
18
856
23 (D) (D) 53 22
174 54
120 51
109
35 112 11 43 30
15
852
784 (D) (D) 380 533
3,427 799 495
3,117 1,132
311 644 35
597 372
633
13,259
820 (D) (D) 778 386
3,500 881 652
3,017 1,621
350
1,301 52
1,046 330
535
15,269
99 (D) (D) 85 97 92 95 85 99 83
74 71 99 97 84
100
92
99 (D) (D) 91 97 93 95 82 98 86
79 89 99 99 85
100
93
9.93 (D) (D)
9.57 10.51 7.92 8.22 8.63 6.48 7.86
15.68 8.80 9.70 6.61
18.62
5.15
8.23
9.85 (D) (D)
5.53 7.93 7.21 9.17 9.60 6.51 7.48
15.35 7.52 9.11 5.46
17.10
6.17
7.67
7,785 (D) (D)
3,637 5,602
27,142 6,568 4,272
20,198 8,898
4,876 5,667
340 3,946 6,927
3,259
109,117
8,077 (D) (D)
4,302 3,061
25,235 8,079 6,259
19,641 12,125
5,373 9,784
474 5,711 5,643
3,301
117,065
- Represents zero. (D) Withheld to avoid disclosing data for individual operations. 1
Equivalent wholesale value of all sales. 2
Includes data withheld above.
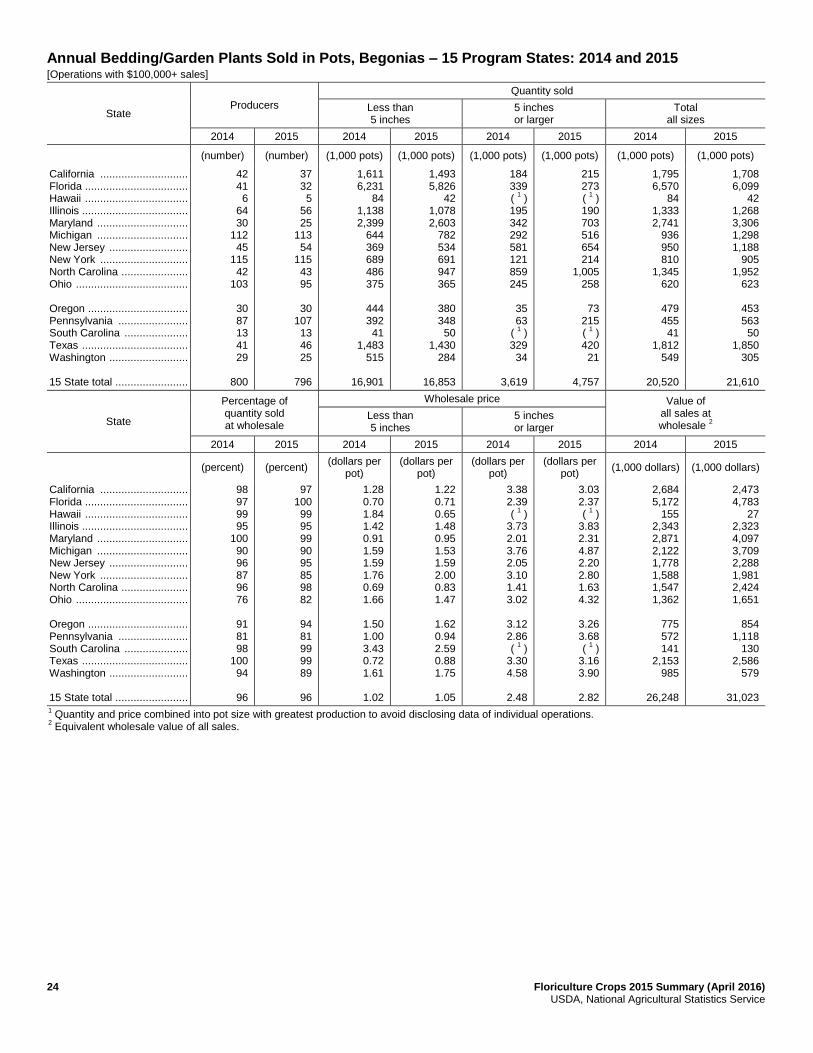
24 Floriculture Crops 2015 Summary (April 2016) USDA, National Agricultural Statistics Service
Annual Bedding/Garden Plants Sold in Pots, Begonias – 15 Program States: 2014 and 2015 [Operations with $100,000+ sales]
State Producers
Quantity sold
Less than 5 inches
5 inches or larger
Total all sizes
2014 2015 2014 2015 2014 2015 2014 2015
(number) (number) (1,000 pots) (1,000 pots) (1,000 pots) (1,000 pots) (1,000 pots) (1,000 pots)
California ............................. Florida .................................. Hawaii .................................. Illinois ................................... Maryland .............................. Michigan .............................. New Jersey .......................... New York ............................. North Carolina ...................... Ohio ..................................... Oregon ................................. Pennsylvania ....................... South Carolina ..................... Texas ................................... Washington .......................... 15 State total ........................
42 41 6
64 30
112 45
115 42
103
30 87 13 41 29
800
37 32 5
56 25
113 54
115 43 95
30
107 13 46 25
796
1,611 6,231
84 1,138 2,399
644 369 689 486 375
444 392 41
1,483 515
16,901
1,493 5,826
42 1,078 2,603
782 534 691 947 365
380 348 50
1,430 284
16,853
184 339 (
1 )
195 342 292 581 121 859 245
35 63
( 1 )
329 34
3,619
215 273 (
1 )
190 703 516 654 214
1,005 258
73
215 (
1 )
420 21
4,757
1,795 6,570
84 1,333 2,741
936 950 810
1,345 620
479 455 41
1,812 549
20,520
1,708 6,099
42 1,268 3,306 1,298 1,188
905 1,952
623
453 563 50
1,850 305
21,610
State
Percentage of quantity sold at wholesale
Wholesale price Value of all sales at wholesale
2
Less than 5 inches
5 inches or larger
2014 2015 2014 2015 2014 2015 2014 2015
(percent) (percent) (dollars per
pot) (dollars per
pot) (dollars per
pot) (dollars per
pot) (1,000 dollars) (1,000 dollars)
California ............................. Florida .................................. Hawaii .................................. Illinois ................................... Maryland .............................. Michigan .............................. New Jersey .......................... New York ............................. North Carolina ...................... Ohio ..................................... Oregon ................................. Pennsylvania ....................... South Carolina ..................... Texas ................................... Washington .......................... 15 State total ........................
98 97 99 95
100 90 96 87 96 76
91 81 98
100 94
96
97 100 99 95 99 90 95 85 98 82
94 81 99 99 89
96
1.28 0.70 1.84 1.42 0.91 1.59 1.59 1.76 0.69 1.66
1.50 1.00 3.43 0.72 1.61
1.02
1.22 0.71 0.65 1.48 0.95 1.53 1.59 2.00 0.83 1.47
1.62 0.94 2.59 0.88 1.75
1.05
3.38 2.39 (
1 )
3.73 2.01 3.76 2.05 3.10 1.41 3.02
3.12 2.86 (
1 )
3.30 4.58
2.48
3.03 2.37 (
1 )
3.83 2.31 4.87 2.20 2.80 1.63 4.32
3.26 3.68 (
1 )
3.16 3.90
2.82
2,684 5,172
155 2,343 2,871 2,122 1,778 1,588 1,547 1,362
775 572 141
2,153 985
26,248
2,473 4,783
27 2,323 4,097 3,709 2,288 1,981 2,424 1,651
854
1,118 130
2,586 579
31,023
1 Quantity and price combined into pot size with greatest production to avoid disclosing data of individual operations.
2 Equivalent wholesale value of all sales.

Floriculture Crops 2015 Summary (April 2016) 25 USDA, National Agricultural Statistics Service
Annual Bedding/Garden Plants Sold in Pots, Geraniums from Vegetative Cuttings – 15 Program States: 2014 and 2015 [Operations with $100,000+ sales]
State Producers
Quantity sold
Less than 5 inches
5 inches or larger
Total all sizes
2014 2015 2014 2015 2014 2015 2014 2015
(number) (number) (1,000 pots) (1,000 pots) (1,000 pots) (1,000 pots) (1,000 pots) (1,000 pots)
California ............................. Florida ................................. Hawaii ................................. Illinois .................................. Maryland .............................. Michigan .............................. New Jersey .......................... New York ............................. North Carolina ..................... Ohio ..................................... Oregon ................................ Pennsylvania ....................... South Carolina ..................... Texas .................................. Washington ......................... 15 State total .......................
41 41 5
76 31
202 84
150 57
151
34 142 15 69 43
1,141
46 31 4
67 25
181 79
156 63
132
34 150 12 60 37
1,077
2,869 2,008
( 1 )
633 424
2,215 1,295 2,384
255 1,430
2,300 2,436
19 881
1,944
21,093
2,120 1,939
( 1 )
656 1,007 2,128 1,349 2,609
409 1,275
2,192 2,358
17 691
1,071
19,821
1,396 1,997
16 556 74
1,177 409 476
2,144 489
226 384 29
1,375 371
11,119
1,230 2,378
13 500 239
1,450 456 444
2,223 441
209 347 30
1,486 278
11,724
4,265 4,005
16 1,189
498 3,392 1,704 2,860 2,399 1,919
2,526 2,820
48 2,256 2,315
32,212
3,350 4,317
13 1,156 1,246 3,578 1,805 3,053 2,632 1,716
2,401 2,705
47 2,177 1,349
31,545
State
Percentage of quantity sold at wholesale
Wholesale price Value of all sales at wholesale
2
Less than 5 inches
5 inches or larger
2014 2015 2014 2015 2014 2015 2014 2015
(percent) (percent) (dollars per
pot) (dollars per
pot) (dollars per
pot) (dollars per
pot) (1,000 dollars) (1,000 dollars)
California ............................. Florida ................................. Hawaii ................................. Illinois .................................. Maryland .............................. Michigan .............................. New Jersey .......................... New York ............................. North Carolina ..................... Ohio ..................................... Oregon ................................ Pennsylvania ....................... South Carolina ..................... Texas .................................. Washington ......................... 15 State total .......................
100 96
100 72 87 70 85 79 94 64
90 81 73 94 93
86
97 99
100 74 95 73 82 78 94 61
90 78 96 97 87
86
2.00 1.26 (
1 )
2.34 2.04 2.05 1.98 2.20 1.24 1.97
2.15 1.77 2.60 1.86 1.94
1.93
1.74 1.34 (
1 )
1.91 2.38 2.07 1.90 2.32 1.39 1.89
2.14 1.77 2.59 1.67 1.98
1.92
3.03 2.30 1.85 3.03 4.40 4.60 3.33 4.27 4.80 5.77
3.14 4.24 7.84 3.20 3.79
3.70
3.56 2.05 2.14 3.11 4.43 4.42 3.49 4.05 4.92 5.50
3.82 3.93 6.28 3.14 2.87
3.66
9,968 7,123
30 3,166 1,191 9,955 3,926 7,277
10,607 5,639
5,655 5,940
277 6,039 5,177
81,970
8,068 7,473
28 2,808 3,455
10,814 4,155 7,851
11,506 4,835
5,489 5,537
232 5,820 2,918
80,989
1 Quantity and price combined into pot size with greatest production to avoid disclosing data of individual operations.
2 Equivalent wholesale value of all sales.

26 Floriculture Crops 2015 Summary (April 2016) USDA, National Agricultural Statistics Service
Annual Bedding/Garden Plants Sold in Pots, Geraniums from Seeds – 15 Program States: 2014 and 2015 [Operations with $100,000+ sales]
State Producers
Quantity sold
Less than 5 inches
5 inches or larger
Total all sizes
2014 2015 2014 2015 2014 2015 2014 2015
(number) (number) (1,000 pots) (1,000 pots) (1,000 pots) (1,000 pots) (1,000 pots) (1,000 pots)
California ............................. Florida .................................. Hawaii .................................. Illinois ................................... Maryland .............................. Michigan .............................. New Jersey .......................... New York ............................. North Carolina ...................... Ohio ..................................... Oregon ................................. Pennsylvania ....................... South Carolina ..................... Texas ................................... Washington .......................... Other States
2 ......................
15 State total ........................
13 11
(D) 21 5
85 16 42 15 47
10 44
(D) 15 16
7
347
18 9
(D) 18 5
78 15 38 12 39
8
35 (D) 23 17
5
320
1,751 186 (D) 626 164
8,778 372 750 882
1,390
388 927 (D) 199 783
34
17,230
565 178 (D) 449 233
6,922 231 633 812
1,232
272 1,010
(D) 254 537
8
13,336
( 1 )
( 1 )
(D) 138 (
1 )
48 (
1 )
30 25
( 1 )
(
1 )
22 (D) 44
( 1 )
33
340
701 (
1 )
(D) 140 (
1 ) 6
( 1 )
20 27
( 1 )
(
1 )
( 1 )
(D) 208 (
1 )
17
1,119
1,751 186 (D) 764 164
8,826 372 780 907
1,390
388 949 (D) 243 783
67
17,570
1,266 178 (D) 589 233
6,928 231 653 839
1,232
272 1,010
(D) 462 537
25
14,455
State
Percentage of quantity sold at wholesale
Wholesale price Value of all sales at wholesale
3
Less than 5 inches
5 inches or larger
2014 2015 2014 2015 2014 2015 2014 2015
(percent) (percent) (dollars per
pot) (dollars per
pot) (dollars per
pot) (dollars per
pot) (1,000 dollars) (1,000 dollars)
California ............................. Florida .................................. Hawaii .................................. Illinois ................................... Maryland .............................. Michigan .............................. New Jersey .......................... New York ............................. North Carolina ...................... Ohio ..................................... Oregon ................................. Pennsylvania ....................... South Carolina ..................... Texas ................................... Washington .......................... Other States
2 ......................
15 State total ........................
99 76
(D) 90 98 97 91 80 97 88
97 87
(D) 94 97
98
95
99 97
(D) 83 99 98 88 79 98 88
97 91
(D) 93 96
96
95
2.28 1.47 (D)
1.35 0.77 0.82 1.85 1.24 0.86 1.04
1.11 1.01 (D)
1.26 1.50
3.74
1.11
1.55 1.63 (D)
1.36 0.88 0.77 1.23 1.30 0.82 1.12
1.32 1.30 (D)
1.36 1.49
1.99
1.00
( 1 )
( 1 )
(D) 3.97 (
1 )
4.34 (
1 )
4.38 2.45 (
1 )
(
1 )
4.18 (D)
3.64 (
1 )
5.46
4.06
3.88 (
1 )
(D) 3.96 (
1 )
2.63 (
1 )
2.96 4.10 (
1 )
(
1 )
( 1 )
(D) 2.27 (
1 )
4.05
3.58
3,985 273 (D)
1,393 126
7,406 688
1,061 820
1,448
431 1,028
(D) 411
1,175
307
20,552
3,596 290 (D)
1,165 205
5,346 283 882 777
1,379
359 1,313
(D) 818 799
85
17,297
(D) Withheld to avoid disclosing data for individual operations. 1
Quantity and price combined into pot size with greatest production to avoid disclosing data for individual operations. 2
Includes data withheld above, excluding those combined with other pot sizes. 3
Equivalent wholesale value of all sales.

Floriculture Crops 2015 Summary (April 2016) 27 USDA, National Agricultural Statistics Service
Annual Bedding/Garden Plants Sold in Pots, New Guinea Impatiens – 15 Program States: 2014 and 2015 [Operations with $100,000+ sales]
State Producers
Quantity sold
Less than 5 inches
5 inches or larger
Total all sizes
2014 2015 2014 2015 2014 2015 2014 2015
(number) (number) (1,000 pots) (1,000 pots) (1,000 pots) (1,000 pots) (1,000 pots) (1,000 pots)
California ....................... Florida ........................... Hawaii ........................... Illinois ............................ Maryland ........................ Michigan ........................ New Jersey .................... New York ....................... North Carolina ............... Ohio ............................... Oregon .......................... Pennsylvania ................. South Carolina ............... Texas ............................ Washington ................... 15 State total .................
30 47 6
69 32
171 80
134 53
133
27 140 15 31 26
994
36 35 5
59 26
153 75
134 43
123
24 139 11 30 25
918
425 4,383
( 1 )
378 714
2,186 1,014 1,923
52 419
210 754 30
289 194
12,971
322 4,186
( 1 )
367 627
1,753 1,095 2,352
162 501
213 712 21
381 172
12,864
257 1,205
38 144 198 218 430 173 838 232
29
178 10
210 (
1 )
4,160
251 1,044
38 97
258 261 306 269 827 205
16
221 15
216 (
1 )
4,024
682 5,588
38 522 912
2,404 1,444 2,096
890 651
239 932 40
499 194
17,131
573 5,230
38 464 885
2,014 1,401 2,621
989 706
229 933 36
597 172
16,888
State
Percentage of quantity sold at wholesale
Wholesale price Value of all sales at wholesale
2
Less than 5 inches
5 inches or larger
2014 2015 2014 2015 2014 2015 2014 2015
(percent) (percent) (dollars per
pot) (dollars per
pot) (dollars per
pot) (dollars per
pot) (1,000 dollars) (1,000 dollars)
California ....................... Florida ........................... Hawaii ........................... Illinois ............................ Maryland ........................ Michigan ........................ New Jersey .................... New York ....................... North Carolina ............... Ohio ............................... Oregon .......................... Pennsylvania ................. South Carolina ............... Texas ............................ Washington ................... 15 State total .................
98 98 94 85 98 90 83 90 95 73
92 80 93 96 88
92
98 100 94 84 97 90 86 92 97 73
87 77 99 95 86
93
1.90 1.20 (
1 )
1.67 2.13 1.45 1.61 1.88 1.78 2.26
1.89 1.94 3.82 2.07 2.15
1.59
1.66 1.04 (
1 )
1.62 1.69 1.43 1.52 1.89 1.82 2.23
1.96 1.94 2.33 2.02 2.13
1.52
3.38 1.91 2.63 2.59 3.43 5.85 2.76 4.19 4.53 3.88
3.00 3.52 4.67 5.39 (
1 )
3.39
3.57 1.94 2.65 3.19 4.10 5.09 2.88 4.73 4.71 3.77
3.53 3.37 5.79 5.44 (
1 )
3.63
1,676 7,561
100 1,004 2,200 4,445 2,819 4,340 3,889 1,847
484
2,089 161
1,730 417
34,762
1,431 6,379
101 904
2,117 3,835 2,546 5,718 4,190 1,890
474
2,126 136
1,945 366
34,158
1 Quantity and price combined into pot size with greatest production to avoid disclosing data for individual operations.
2 Equivalent wholesale value of all sales.
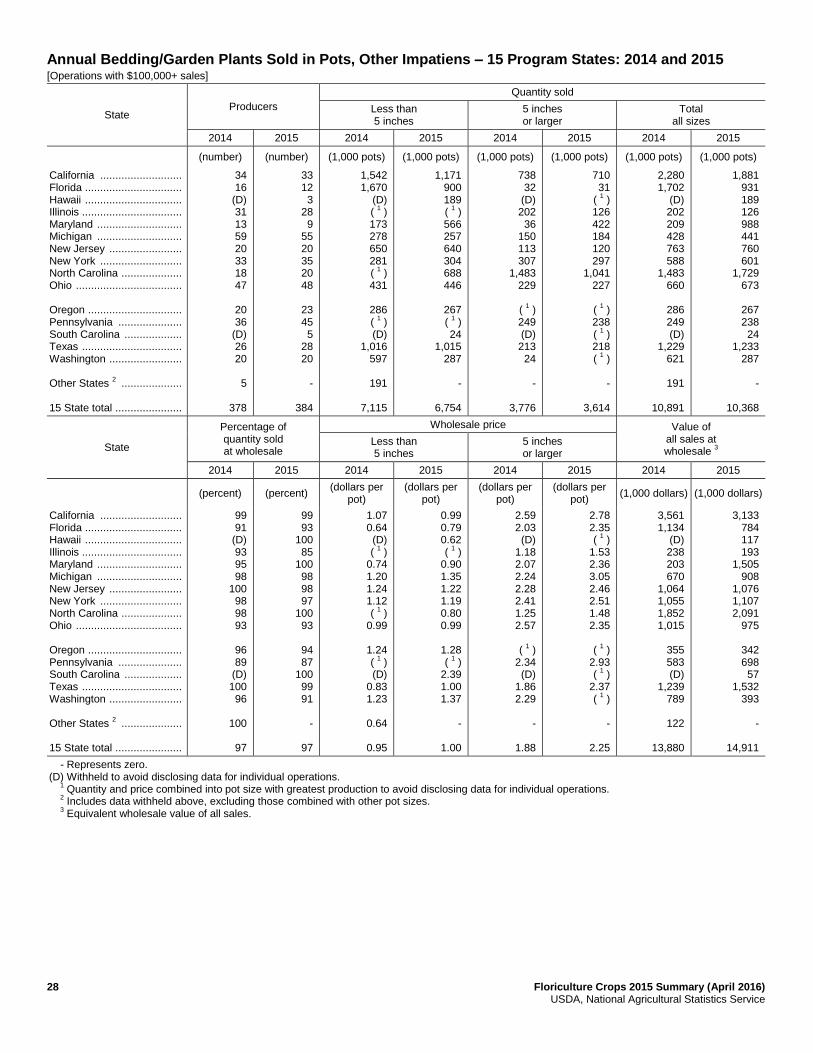
28 Floriculture Crops 2015 Summary (April 2016) USDA, National Agricultural Statistics Service
Annual Bedding/Garden Plants Sold in Pots, Other Impatiens – 15 Program States: 2014 and 2015 [Operations with $100,000+ sales]
State Producers
Quantity sold
Less than 5 inches
5 inches or larger
Total all sizes
2014 2015 2014 2015 2014 2015 2014 2015
(number) (number) (1,000 pots) (1,000 pots) (1,000 pots) (1,000 pots) (1,000 pots) (1,000 pots)
California ........................... Florida ................................ Hawaii ................................ Illinois ................................. Maryland ............................ Michigan ............................ New Jersey ........................ New York ........................... North Carolina .................... Ohio ................................... Oregon ............................... Pennsylvania ..................... South Carolina ................... Texas ................................. Washington ........................ Other States
2 ....................
15 State total ......................
34 16
(D) 31 13 59 20 33 18 47
20 36
(D) 26 20
5
378
33 12 3
28 9
55 20 35 20 48
23 45 5
28 20
-
384
1,542 1,670
(D) (
1 )
173 278 650 281 (
1 )
431
286 (
1 )
(D) 1,016
597
191
7,115
1,171 900 189 (
1 )
566 257 640 304 688 446
267 (
1 )
24 1,015
287
-
6,754
738 32
(D) 202 36
150 113 307
1,483 229
(
1 )
249 (D) 213 24
-
3,776
710 31
( 1 )
126 422 184 120 297
1,041 227
(
1 )
238 (
1 )
218 (
1 )
-
3,614
2,280 1,702
(D) 202 209 428 763 588
1,483 660
286 249 (D)
1,229 621
191
10,891
1,881 931 189 126 988 441 760 601
1,729 673
267 238 24
1,233 287
-
10,368
State
Percentage of quantity sold at wholesale
Wholesale price Value of all sales at wholesale
3
Less than 5 inches
5 inches or larger
2014 2015 2014 2015 2014 2015 2014 2015
(percent) (percent) (dollars per
pot) (dollars per
pot) (dollars per
pot) (dollars per
pot) (1,000 dollars) (1,000 dollars)
California ........................... Florida ................................ Hawaii ................................ Illinois ................................. Maryland ............................ Michigan ............................ New Jersey ........................ New York ........................... North Carolina .................... Ohio ................................... Oregon ............................... Pennsylvania ..................... South Carolina ................... Texas ................................. Washington ........................ Other States
2 ....................
15 State total ......................
99 91
(D) 93 95 98
100 98 98 93
96 89
(D) 100 96
100
97
99 93
100 85
100 98 98 97
100 93
94 87
100 99 91
-
97
1.07 0.64 (D) (
1 )
0.74 1.20 1.24 1.12 (
1 )
0.99
1.24 (
1 )
(D) 0.83 1.23
0.64
0.95
0.99 0.79 0.62 (
1 )
0.90 1.35 1.22 1.19 0.80 0.99
1.28 (
1 )
2.39 1.00 1.37
-
1.00
2.59 2.03 (D)
1.18 2.07 2.24 2.28 2.41 1.25 2.57
(
1 )
2.34 (D)
1.86 2.29
-
1.88
2.78 2.35 (
1 )
1.53 2.36 3.05 2.46 2.51 1.48 2.35
(
1 )
2.93 (
1 )
2.37 (
1 )
-
2.25
3,561 1,134
(D) 238 203 670
1,064 1,055 1,852 1,015
355 583 (D)
1,239 789
122
13,880
3,133 784 117 193
1,505 908
1,076 1,107 2,091
975
342 698 57
1,532 393
-
14,911
- Represents zero. (D) Withheld to avoid disclosing data for individual operations. 1
Quantity and price combined into pot size with greatest production to avoid disclosing data for individual operations. 2
Includes data withheld above, excluding those combined with other pot sizes. 3
Equivalent wholesale value of all sales.

Floriculture Crops 2015 Summary (April 2016) 29 USDA, National Agricultural Statistics Service
Annual Bedding/Garden Plants Sold in Pots, Marigolds – 15 Program States: 2014 and 2015 [Operations with $100,000+ sales]
State Producers
Quantity sold
Less than 5 inches
5 inches or larger
Total all sizes
2014 2015 2014 2015 2014 2015 2014 2015
(number) (number) (1,000 pots) (1,000 pots) (1,000 pots) (1,000 pots) (1,000 pots) (1,000 pots)
California ............................. Florida ................................. Hawaii ................................. Illinois .................................. Maryland .............................. Michigan .............................. New Jersey .......................... New York ............................. North Carolina ..................... Ohio ..................................... Oregon ................................ Pennsylvania ....................... South Carolina ..................... Texas .................................. Washington ......................... 15 State total .......................
31 28 6
17 20 30 19 43 14 25
14 42 4
18 20
331
32 18 6
14 14 32 21 43 17 21
22 40 6
19 20
325
988 3,257
52 246 332 160 762 203 852 368
340 279 (
1 )
924 501
9,264
1,019 3,117
53 197 737 107 767 252 927 378
269 292 (
1 )
827 158
9,100
381 309 (
1 )
49 44
118 (
1 )
69 (
1 )
( 1 )
36
105 14
104 44
1,273
399 210 (
1 )
( 1 )
81 102 (
1 )
( 1 )
620 (
1 )
40
127 16
119 31
1,745
1,369 3,566
52 295 376 278 762 272 852 368
376 384 14
1,028 545
10,537
1,418 3,327
53 197 818 209 767 252
1,547 378
309 419 16
946 189
10,845
State
Percentage of quantity sold at wholesale
Wholesale price Value of all sales at wholesale
3
Less than 5 inches
5 inches or larger
2014 2015 2014 2015 2014 2015 2014 2015
(percent) (percent) (dollars per
pot) (dollars per
pot) (dollars per
pot) (dollars per
pot) (1,000 dollars) (1,000 dollars)
California ............................. Florida ................................. Hawaii ................................. Illinois .................................. Maryland .............................. Michigan .............................. New Jersey .......................... New York ............................. North Carolina ..................... Ohio ..................................... Oregon ................................ Pennsylvania ....................... South Carolina ..................... Texas .................................. Washington ......................... 15 State total .......................
99 97 95 97 98 96 99 94 98 96
99 96
100 100 97
98
99 100 95 97
100 98 99 86
100 95
88 96
100 100 90
99
0.95 0.73 0.75 0.77 0.75 0.69 1.73 1.17 1.04 1.42
0.87 0.96 (
1 )
1.14 0.97
0.97
0.96 0.73 0.78 0.96 0.87 0.92 1.76 1.50 0.81 1.65
1.09 0.98 (
1 )
0.96 0.98
0.97
2.22 2.40 (
1 )
1.63 1.80 2.22 (
1 )
2.51 (
1 )
( 1 )
2.15 2.80 2.98 2.47 2.24
2.32
2.50 1.78 (
1 )
( 1 )
2.16 1.98 (
1 )
( 1 )
1.75 (
1 )
2.13 3.51 3.09 2.19 2.21
2.14
1,784 3,119
39 269 328 372
1,319 411 887 522
373 562 42
1,310 585
11,922
1,976 2,649
41 189 816 300
1,352 377
1,836 623
378 732 49
1,055 223
12,596
1 Quantity and price combined into pot size with greatest production to avoid disclosing data for individual operations.
2 Includes data withheld above, excluding those combined with other pot sizes.
3 Equivalent wholesale value of all sales.
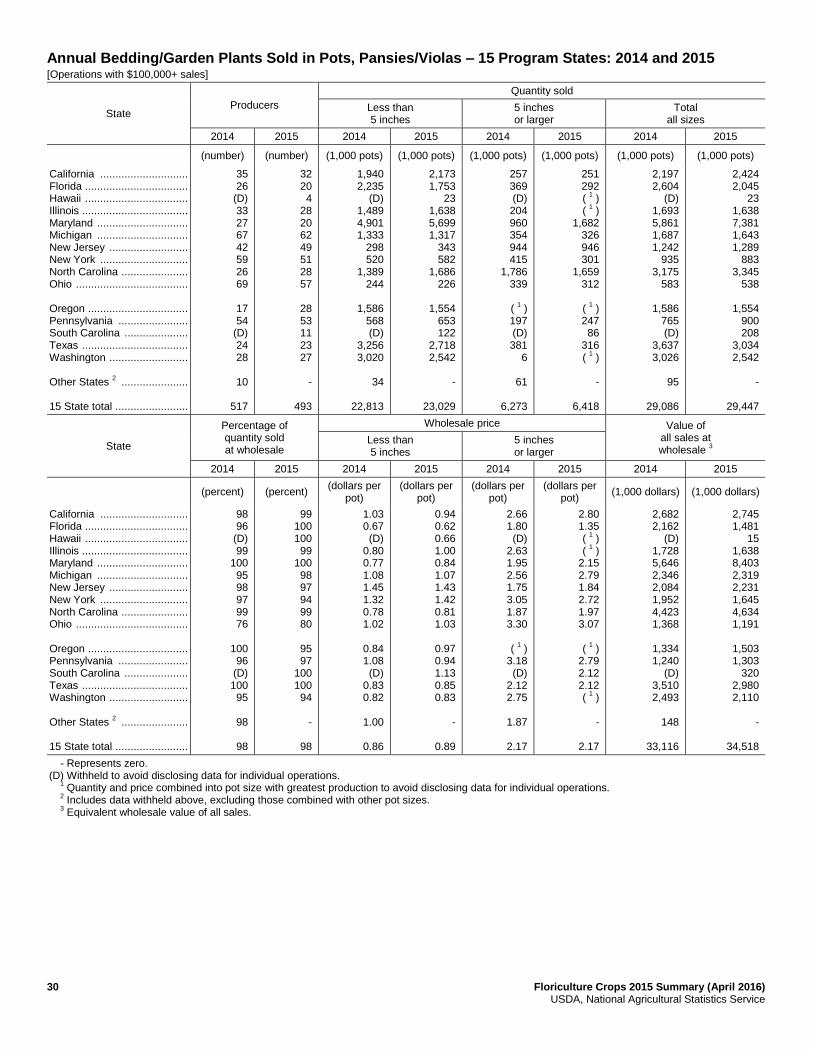
30 Floriculture Crops 2015 Summary (April 2016) USDA, National Agricultural Statistics Service
Annual Bedding/Garden Plants Sold in Pots, Pansies/Violas – 15 Program States: 2014 and 2015 [Operations with $100,000+ sales]
State Producers
Quantity sold
Less than 5 inches
5 inches or larger
Total all sizes
2014 2015 2014 2015 2014 2015 2014 2015
(number) (number) (1,000 pots) (1,000 pots) (1,000 pots) (1,000 pots) (1,000 pots) (1,000 pots)
California ............................. Florida .................................. Hawaii .................................. Illinois ................................... Maryland .............................. Michigan .............................. New Jersey .......................... New York ............................. North Carolina ...................... Ohio ..................................... Oregon ................................. Pennsylvania ....................... South Carolina ..................... Texas ................................... Washington .......................... Other States
2 ......................
15 State total ........................
35 26
(D) 33 27 67 42 59 26 69
17 54
(D) 24 28
10
517
32 20 4
28 20 62 49 51 28 57
28 53 11 23 27
-
493
1,940 2,235
(D) 1,489 4,901 1,333
298 520
1,389 244
1,586
568 (D)
3,256 3,020
34
22,813
2,173 1,753
23 1,638 5,699 1,317
343 582
1,686 226
1,554
653 122
2,718 2,542
-
23,029
257 369 (D) 204 960 354 944 415
1,786 339
(
1 )
197 (D) 381
6
61
6,273
251 292 (
1 )
( 1 )
1,682 326 946 301
1,659 312
(
1 )
247 86
316 (
1 )
-
6,418
2,197 2,604
(D) 1,693 5,861 1,687 1,242
935 3,175
583
1,586 765 (D)
3,637 3,026
95
29,086
2,424 2,045
23 1,638 7,381 1,643 1,289
883 3,345
538
1,554 900 208
3,034 2,542
-
29,447
State
Percentage of quantity sold at wholesale
Wholesale price Value of all sales at wholesale
3
Less than 5 inches
5 inches or larger
2014 2015 2014 2015 2014 2015 2014 2015
(percent) (percent) (dollars per
pot) (dollars per
pot) (dollars per
pot) (dollars per
pot) (1,000 dollars) (1,000 dollars)
California ............................. Florida .................................. Hawaii .................................. Illinois ................................... Maryland .............................. Michigan .............................. New Jersey .......................... New York ............................. North Carolina ...................... Ohio ..................................... Oregon ................................. Pennsylvania ....................... South Carolina ..................... Texas ................................... Washington .......................... Other States
2 ......................
15 State total ........................
98 96
(D) 99
100 95 98 97 99 76
100 96
(D) 100 95
98
98
99 100 100 99
100 98 97 94 99 80
95 97
100 100 94
-
98
1.03 0.67 (D)
0.80 0.77 1.08 1.45 1.32 0.78 1.02
0.84 1.08 (D)
0.83 0.82
1.00
0.86
0.94 0.62 0.66 1.00 0.84 1.07 1.43 1.42 0.81 1.03
0.97 0.94 1.13 0.85 0.83
-
0.89
2.66 1.80 (D)
2.63 1.95 2.56 1.75 3.05 1.87 3.30
(
1 )
3.18 (D)
2.12 2.75
1.87
2.17
2.80 1.35 (
1 )
( 1 )
2.15 2.79 1.84 2.72 1.97 3.07
(
1 )
2.79 2.12 2.12 (
1 )
-
2.17
2,682 2,162
(D) 1,728 5,646 2,346 2,084 1,952 4,423 1,368
1,334 1,240
(D) 3,510 2,493
148
33,116
2,745 1,481
15 1,638 8,403 2,319 2,231 1,645 4,634 1,191
1,503 1,303
320 2,980 2,110
-
34,518
- Represents zero. (D) Withheld to avoid disclosing data for individual operations. 1
Quantity and price combined into pot size with greatest production to avoid disclosing data for individual operations. 2
Includes data withheld above, excluding those combined with other pot sizes. 3
Equivalent wholesale value of all sales.

Floriculture Crops 2015 Summary (April 2016) 31 USDA, National Agricultural Statistics Service
Annual Bedding/Garden Plants Sold in Pots, Petunias – 15 Program States: 2014 and 2015 [Operations with $100,000+ sales]
State Producers
Quantity sold
Less than 5 inches
5 inches or larger
Total all sizes
2014 2015 2014 2015 2014 2015 2014 2015
(number) (number) (1,000 pots) (1,000 pots) (1,000 pots) (1,000 pots) (1,000 pots) (1,000 pots)
California ............................. Florida ................................. Hawaii ................................. Illinois .................................. Maryland .............................. Michigan .............................. New Jersey .......................... New York ............................. North Carolina ..................... Ohio ..................................... Oregon ................................ Pennsylvania ....................... South Carolina ..................... Texas .................................. Washington ......................... 15 State total .......................
31 34 6
63 28
120 52 95 43
106
23 98 10 33 35
777
34 29 6
56 24
110 50 95 42
103
34 96 11 34 33
757
2,166 2,779
69 678 916
3,072 668 642 735
1,102
888 531 23
1,997 1,361
17,627
2,514 2,278
69 646
1,692 2,664
650 610
1,447 1,028
824 593 19
1,886 744
17,664
866 333 (
1 )
213 179
1,191 568 397
1,870 499
135 183
3 978 348
7,763
943 474 (
1 )
197 (
1 )
1,408 609 406
1,996 498
127 294
3 781 79
7,815
3,032 3,112
69 891
1,095 4,263 1,236 1,039 2,605 1,601
1,023
714 26
2,975 1,709
25,390
3,457 2,752
69 843
1,692 4,072 1,259 1,016 3,443 1,526
951 887 22
2,667 823
25,479
State
Percentage of quantity sold at wholesale
Wholesale price Value of all sales at wholesale
2
Less than 5 inches
5 inches or larger
2014 2015 2014 2015 2014 2015 2014 2015
(percent) (percent) (dollars per
pot) (dollars per
pot) (dollars per
pot) (dollars per
pot) (1,000 dollars) (1,000 dollars)
California ............................. Florida ................................. Hawaii ................................. Illinois .................................. Maryland .............................. Michigan .............................. New Jersey .......................... New York ............................. North Carolina ..................... Ohio ..................................... Oregon ................................ Pennsylvania ....................... South Carolina ..................... Texas .................................. Washington ......................... 15 State total .......................
99 97 99 86 96 92 95 82 98 78
97 79 63
100 96
94
99 99 99 83 98 94 95 83 99 74
87 79 88
100 93
94
1.92 0.89 0.74 1.46 1.34 1.28 1.77 1.69 0.87 1.32
1.22 1.17 2.30 0.98 1.05
1.27
1.19 0.94 0.73 1.38 1.71 1.52 1.76 1.75 1.04 1.23
1.37 1.06 2.28 1.00 1.22
1.28
2.84 2.48 (
1 )
1.94 2.57 4.60 2.50 2.65 1.70 2.88
2.87 3.19 3.64 2.34 2.70
2.70
3.23 2.33 (
1 )
2.11 (
1 )
4.41 2.47 2.62 1.65 2.31
2.88 2.71 3.18 2.22 3.17
2.68
6,618 3,299
51 1,403 1,687 9,411 2,602 2,137 3,818 2,892
1,471 1,205
64 4,246 2,369
43,273
6,038 3,246
50 1,307 2,893
10,259 2,648 2,131 4,798 2,415
1,495 1,425
53 3,620 1,158
43,536
1 Quantity and price combined into pot size with greatest production to avoid disclosing data for individual operations.
2 Equivalent wholesale value of all sales.

32 Floriculture Crops 2015 Summary (April 2016) USDA, National Agricultural Statistics Service
Annual Bedding/Garden Plants Sold in Pots, Other Potted Flowering and Foliar Plants – 15 Program States: 2014 and 2015 [Operations with $100,000+ sales]
State Producers
Quantity sold
Less than 5 inches
5 inches or larger
Total all sizes
2014 2015 2014 2015 2014 2015 2014 2015
(number) (number) (1,000 pots) (1,000 pots) (1,000 pots) (1,000 pots) (1,000 pots) (1,000 pots)
California ....................... Florida ............................ Hawaii ............................ Illinois ............................. Maryland ........................ Michigan ........................ New Jersey .................... New York ....................... North Carolina ................ Ohio ............................... Oregon ........................... Pennsylvania ................. South Carolina ............... Texas ............................. Washington .................... 15 State total ..................
49 54 6
72 35
162 60
129 54
116
35 133 12 67 37
1,021
50 46 6
59 24
152 53
110 49
101
38 121 13 48 32
902
14,960 20,985
551 2,511 9,131
13,774 2,871 2,981 3,849 2,408
6,936 3,128
( 1 )
5,475 8,876
98,436
12,322 22,939
567 1,946 5,281
17,566 3,215 5,442 5,571 3,417
6,342 4,273 1,546
10,605 5,050
106,082
6,676 13,102
62 912
3,101 4,908 3,301 1,548 4,542
997
702 622 945
2,490 1,760
45,668
8,628 10,375
177 955
4,361 4,693 3,371 1,120 5,935 1,913
1,117
752 (
1 )
3,563 574
47,534
21,636 34,087
613 3,423
12,232 18,682 6,172 4,529 8,391 3,405
7,638 3,750
945 7,965
10,636
144,104
20,950 33,314
744 2,901 9,642
22,259 6,586 6,562
11,506 5,330
7,459 5,025 1,546
14,168 5,624
153,616
State
Percentage of quantity sold at wholesale
Wholesale price Value of all sales at wholesale
1
Less than 5 inches
5 inches or larger
2014 2015 2014 2015 2014 2015 2014 2015
(percent) (percent) (dollars per
pot) (dollars per
pot) (dollars per
pot) (dollars per
pot) (1,000 dollars) (1,000 dollars)
California ....................... Florida ............................ Hawaii ............................ Illinois ............................. Maryland ........................ Michigan ........................ New Jersey .................... New York ....................... North Carolina ................ Ohio ............................... Oregon ........................... Pennsylvania ................. South Carolina ............... Texas ............................. Washington .................... 15 State total ..................
99 99 99 84 99 90 98 88 97 66
93 83 98 99 96
95
98 100 99 83 99 93 97 90 98 74
95 78
100 100 96
96
1.67 0.89 0.61 1.69 1.11 1.64 1.55 1.97 1.35 2.02
1.42 1.83 (
1 )
0.99 1.14
1.35
1.64 0.92 0.62 1.31 1.32 1.61 1.59 2.03 1.24 1.95
1.46 1.53 2.50 1.07 1.26
1.38
4.02 2.43 2.52 5.36 2.72 4.50 3.21 3.52 3.03 5.10
3.76 5.20 2.63 3.25 3.56
3.33
4.14 2.40 2.90 4.77 2.82 5.06 3.20 3.97 2.92 4.10
3.41 4.71 (
1 )
2.71 3.62
3.39
51,821 50,515
492 9,132
18,570 44,675 15,046 11,322 18,958 9,949
12,489 8,959 2,488
13,513 16,384
284,313
55,928 46,004
865 7,105
19,269 52,028 15,899 15,494 24,238 14,506
13,068 10,080 3,871
21,003 8,441
307,799
1 Equivalent wholesale value of all sales.

Floriculture Crops 2015 Summary (April 2016) 33 USDA, National Agricultural Statistics Service
Annual Bedding/Garden Plants Sold in Pots, Vegetable Type Plants – 15 Program States: 2014 and 2015 [Operations with $100,000+ sales]
State Producers
Quantity sold
Less than 5 inches
5 inches or larger
Total all sizes
2014 2015 2014 2015 2014 2015 2014 2015
(number) (number) (1,000 pots) (1,000 pots) (1,000 pots) (1,000 pots) (1,000 pots) (1,000 pots)
California ....................... Florida ........................... Hawaii ........................... Illinois ............................ Maryland ........................ Michigan ........................ New Jersey .................... New York ....................... North Carolina ............... Ohio ............................... Oregon .......................... Pennsylvania ................. South Carolina ............... Texas ............................ Washington ................... Other States .................. 15 State total .................
25 17 6
44 18 99 41 92 21 76
23 88 6
30 29
-
615
32 13 5
43 11 99
(D) 98 19 77
28 94
(D) 38 23
44
624
6,896 2,886
228 1,207 1,762 3,752 3,795 2,179
251 1,871
3,181 6,600
14 7,415 2,454
-
44,491
7,852 2,504
225 788 851
3,337 (D)
1,372 234
2,468
2,723 3,652
(D) 5,401
842
4,153
36,402
3,157 1,237
51 210 272 654 482 384 39
251
927 138 (
1 )
2,329 400
-
10,531
3,345 1,426
45 202 49
410 (D) 143 129 206
459 89
(D) 1,176
216
279
8,174
10,053 4,123
279 1,417 2,034 4,406 4,277 2,563
290 2,122
4,108 6,738
14 9,744 2,854
-
55,022
11,197 3,930
270 990 900
3,747 (D)
1,515 363
2,674
3,182 3,741
(D) 6,577 1,058
4,432
44,576
State
Percentage of quantity sold at wholesale
Wholesale price Value of all sales at wholesale
2
Less than 5 inches
5 inches or larger
2014 2015 2014 2015 2014 2015 2014 2015
(percent) (percent) (dollars per
pot) (dollars per
pot) (dollars per
pot) (dollars per
pot) (1,000 dollars) (1,000 dollars)
California ....................... Florida ........................... Hawaii ........................... Illinois ............................ Maryland ........................ Michigan ........................ New Jersey .................... New York ....................... North Carolina ............... Ohio ............................... Oregon .......................... Pennsylvania ................. South Carolina ............... Texas ............................ Washington ................... Other States .................. 15 State total .................
95 100 100 73 98 81 97 84 85 69
93 93 99
100 96
-
93
99 100 100 79 96 85
(D) 80 88 72
94 85
(D) 100 92
98
93
1.34 1.86 1.07 2.46 1.15 1.22 1.35 1.75 1.46 1.29
1.08 2.32 1.02 1.09 1.05
-
1.47
1.24 2.04 1.08 1.24 1.12 1.18 (D)
1.69 1.50 1.33
1.18 1.61 (D)
1.13 1.11
1.30
1.33
1.41 3.18 1.97
12.43 3.42 6.52 4.00 2.02 4.90 3.66
2.31
10.12 (
1 )
3.92 2.55
-
3.21
1.80 2.87 2.01 4.62 2.72 4.08 (D)
4.69 4.60 3.54
2.33 5.94 (D)
3.72 2.07
3.35
2.73
13,692 9,302
344 5,580 2,957 8,842 7,051 4,589
558 3,332
5,577
16,709 14
17,212 3,597
-
99,356
15,757 9,201
333 1,910 1,086 5,610
(D) 2,989
944 4,012
4,283 6,408
(D) 10,478 1,382
6,328
70,721
- Represents zero. (D) Withheld to avoid disclosing data for individual operations. 1
Quantity and price combined into pot size with greatest production to avoid disclosing data for individual operations. 2
Equivalent wholesale value of all sales.

34 Floriculture Crops 2015 Summary (April 2016) USDA, National Agricultural Statistics Service
Herbaceous Perennial Plants Sold in Pots, Hardy/Garden Chrysanthemums – 15 Program States: 2014 and 2015 [Operations with $100,000+ sales]
State Producers
Quantity sold
Less than 5 inch
5 Inch or larger
Total all sizes
2014 2015 2014 2015 2014 2015 2014 2015
(number) (number) (1,000 pots) (1,000 pots) (1,000 pots) (1,000 pots) (1,000 pots) (1,000 pots)
California ............................. Florida .................................. Hawaii .................................. Illinois ................................... Maryland .............................. Michigan .............................. New Jersey .......................... New York ............................. North Carolina ...................... Ohio ..................................... Oregon ................................. Pennsylvania ....................... South Carolina ..................... Texas ................................... Washington .......................... Other States
2 ......................
15 State total ........................
27 14 3
66 25
119 69
127 56
121
26 112 10 44 18
-
837
28 12
(D) 56 21
111 71
122 65
115
32 117 (D) 41 20
10
821
9,247 (
1 )
( 1 )
531 33
1,357 471 315 (
1 )
66
279 749 (
1 )
864 815
-
14,727
3,431 (
1 )
(D) (
1 )
( 1 )
1,102 541 386
2,000 237
294 324 (D) 237 774
-
9,326
689 1,276
22 1,918 1,446 4,821 3,832 3,045 8,188 1,682
366
2,594 80
3,352 596
-
33,907
1,280 1,235
(D) 2,368 1,647 5,244 4,055 2,755 9,461 3,353
443
2,919 (D)
2,511 511
103
37,885
9,936 1,276
22 2,449 1,479 6,178 4,303 3,360 8,188 1,748
645
3,343 80
4,216 1,411
-
48,634
4,711 1,235
(D) 2,368 1,647 6,346 4,596 3,141
11,461 3,590
737
3,243 (D)
2,748 1,285
103
47,211
State
Percentage of Quantity sold at wholesale
Wholesale price Value of all sales at wholesale
3
Less than 5 inch
5 Inch or larger
2014 2015 2014 2015 2014 2015 2014 2015
(percent) (percent) (dollars per
pot) (dollars per
pot) (dollars per
pot) (dollars per
pot) (1,000 dollars) (1,000 dollars)
California ............................. Florida .................................. Hawaii .................................. Illinois ................................... Maryland .............................. Michigan .............................. New Jersey .......................... New York ............................. North Carolina ...................... Ohio ..................................... Oregon ................................. Pennsylvania ....................... South Carolina ..................... Texas ................................... Washington .......................... Other States
2 ......................
15 State total ........................
99 100 100 92 98 93 90 91 96 73
98 87 96 99
100
-
94
100 100 (D) 89 98 96 89 89 97 88
92 89
(D) 99
100
98
94
0.93 (
1 )
( 1 )
1.06 0.93 0.96 2.71 1.10 (
1 )
1.65
1.32 1.12 (
1 )
1.08 1.21
-
1.04
1.12 (
1 )
(D) (
1 )
( 1 )
1.06 2.35 1.14 0.79 1.55
1.28 1.00 (D)
1.04 1.07
-
1.12
4.12 2.73 1.12 2.79 3.87 3.01 2.75 3.20 2.68 3.09
2.87 2.63 4.05 4.59 2.96
-
3.08
4.27 2.61 (D)
2.51 2.93 2.80 2.89 3.09 2.92 2.88
2.77 2.58 (D)
4.33 3.17
3.29
2.99
11,438 3,483
25 5,914 5,627
15,814 11,814 10,091 21,903 5,306
1,419 7,661
324 16,319 2,750
-
119,888
9,308 3,218
(D) 5,937 4,826
15,851 12,990 8,953
29,206 10,024
1,603 7,855
(D) 11,119 2,448
339
123,677
- Represents zero. (D) Withheld to avoid disclosing data for individual operations. 1
Quantity and price combined into pot size with greatest production to avoid disclosing data for individual operations. 2
Includes data withheld above, excluding those combined with other pot sizes. 3
Equivalent wholesale value of all sales.
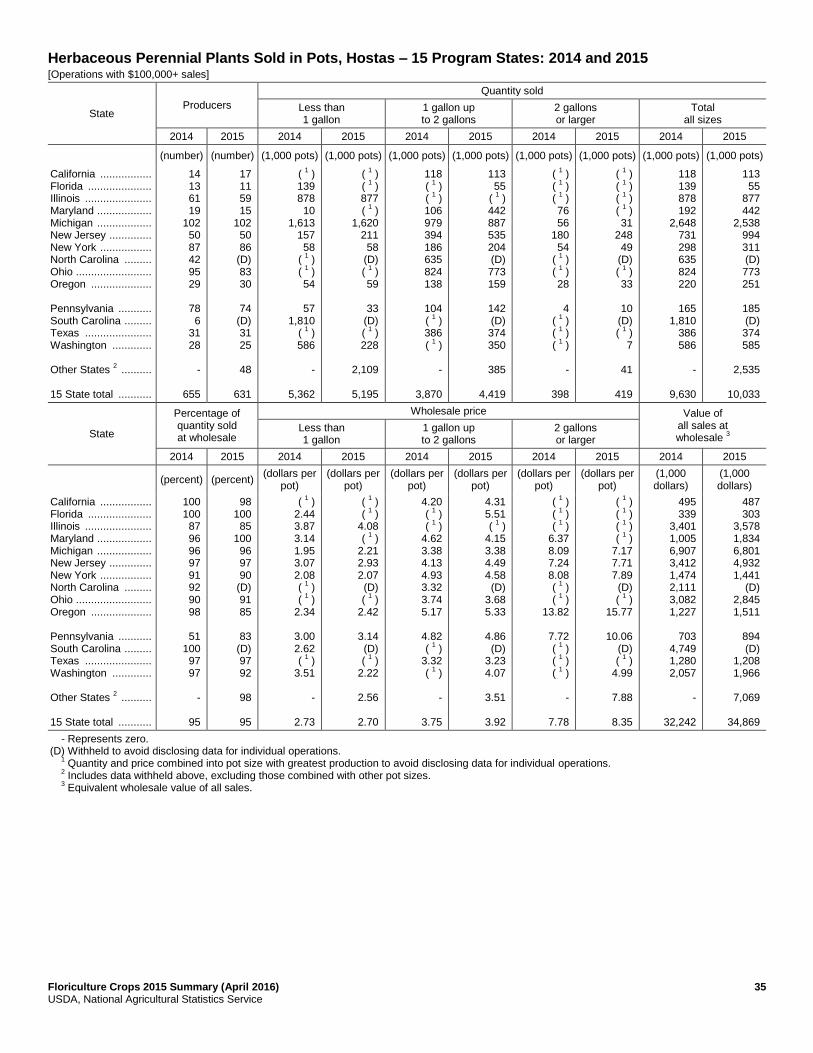
Floriculture Crops 2015 Summary (April 2016) 35 USDA, National Agricultural Statistics Service
Herbaceous Perennial Plants Sold in Pots, Hostas – 15 Program States: 2014 and 2015 [Operations with $100,000+ sales]
State Producers
Quantity sold
Less than 1 gallon
1 gallon up to 2 gallons
2 gallons or larger
Total all sizes
2014 2015 2014 2015 2014 2015 2014 2015 2014 2015
(number) (number) (1,000 pots) (1,000 pots) (1,000 pots) (1,000 pots) (1,000 pots) (1,000 pots) (1,000 pots) (1,000 pots)
California ................. Florida ..................... Illinois ...................... Maryland .................. Michigan .................. New Jersey .............. New York ................. North Carolina ......... Ohio ......................... Oregon .................... Pennsylvania ........... South Carolina ......... Texas ...................... Washington ............. Other States
2 ..........
15 State total ...........
14 13 61 19
102 50 87 42 95 29
78 6
31 28
-
655
17 11 59 15
102 50 86
(D) 83 30
74
(D) 31 25
48
631
( 1 )
139 878 10
1,613 157 58
( 1 )
( 1 )
54
57 1,810
( 1 )
586
-
5,362
( 1 )
( 1 )
877 (
1 )
1,620 211 58
(D) (
1 )
59
33 (D) (
1 )
228
2,109
5,195
118 (
1 )
( 1 )
106 979 394 186 635 824 138
104 (
1 )
386 (
1 )
-
3,870
113 55
( 1 )
442 887 535 204 (D) 773 159
142 (D) 374 350
385
4,419
( 1 )
( 1 )
( 1 )
76 56
180 54
( 1 )
( 1 )
28
4 (
1 )
( 1 )
( 1 )
-
398
( 1 )
( 1 )
( 1 )
( 1 )
31 248
49 (D) (
1 )
33
10 (D) (
1 ) 7
41
419
118 139 878 192
2,648 731 298 635 824 220
165
1,810 386 586
-
9,630
113 55
877 442
2,538 994 311 (D) 773 251
185 (D) 374 585
2,535
10,033
State
Percentage of quantity sold at wholesale
Wholesale price Value of all sales at wholesale
3
Less than 1 gallon
1 gallon up to 2 gallons
2 gallons or larger
2014 2015 2014 2015 2014 2015 2014 2015 2014 2015
(percent) (percent) (dollars per
pot) (dollars per
pot) (dollars per
pot) (dollars per
pot) (dollars per
pot) (dollars per
pot) (1,000 dollars)
(1,000 dollars)
California ................. Florida ..................... Illinois ...................... Maryland .................. Michigan .................. New Jersey .............. New York ................. North Carolina ......... Ohio ......................... Oregon .................... Pennsylvania ........... South Carolina ......... Texas ...................... Washington ............. Other States
2 ..........
15 State total ...........
100 100 87 96 96 97 91 92 90 98
51
100 97 97
-
95
98 100 85
100 96 97 90
(D) 91 85
83
(D) 97 92
98
95
( 1 )
2.44 3.87 3.14 1.95 3.07 2.08 (
1 )
( 1 )
2.34
3.00 2.62 (
1 )
3.51
-
2.73
( 1 )
( 1 )
4.08 (
1 )
2.21 2.93 2.07 (D) (
1 )
2.42
3.14 (D) (
1 )
2.22
2.56
2.70
4.20 (
1 )
( 1 )
4.62 3.38 4.13 4.93 3.32 3.74 5.17
4.82 (
1 )
3.32 (
1 )
-
3.75
4.31 5.51 (
1 )
4.15 3.38 4.49 4.58 (D)
3.68 5.33
4.86 (D)
3.23 4.07
3.51
3.92
( 1 )
( 1 )
( 1 )
6.37 8.09 7.24 8.08 (
1 )
( 1 )
13.82
7.72 (
1 )
( 1 )
( 1 )
-
7.78
( 1 )
( 1 )
( 1 )
( 1 )
7.17 7.71 7.89
(D) (
1 )
15.77
10.06 (D) (
1 )
4.99
7.88
8.35
495 339
3,401 1,005 6,907 3,412 1,474 2,111 3,082 1,227
703
4,749 1,280 2,057
-
32,242
487 303
3,578 1,834 6,801 4,932 1,441
(D) 2,845 1,511
894 (D)
1,208 1,966
7,069
34,869
- Represents zero. (D) Withheld to avoid disclosing data for individual operations. 1
Quantity and price combined into pot size with greatest production to avoid disclosing data for individual operations. 2
Includes data withheld above, excluding those combined with other pot sizes. 3
Equivalent wholesale value of all sales.

36 Floriculture Crops 2015 Summary (April 2016) USDA, National Agricultural Statistics Service
Herbaceous Perennial Plants Sold in Pots, Other Herbaceous Perennials – 15 Program States: 2014 and 2015 [Operations with $100,000+ sales]
State Producers
Quantity sold
Less than 1 gallon
1 gallon up to 2 gallons
2 gallons or larger
Total all sizes
2014 2015 2014 2015 2014 2015 2014 2015 2014 2015
(number) (number) (1,000 pots) (1,000 pots) (1,000 pots) (1,000 pots) (1,000 pots) (1,000 pots) (1,000 pots) (1,000 pots)
California ................... Florida ........................ Hawaii ........................ Illinois ......................... Maryland .................... Michigan .................... New Jersey ................ New York ................... North Carolina ............ Ohio ........................... Oregon ....................... Pennsylvania ............. South Carolina ........... Texas ......................... Washington ................ Other States ............... 15 State total ..............
85 42 8
69 26
127 54
123 61
108
48 108 12 81 41
-
993
83 26
(D) 66 21
124 57
121 (D) 103
49
103 15 66 38
67
939
6,880 7,828
344 4,692 1,766 6,094 1,395 1,223 2,332 3,662
3,591
979 13,386 2,111 6,225
-
62,508
6,946 8,651
(D) 2,915 3,032 5,889
( 1 )
1,463 (D)
3,811
3,581 1,053
14,519 2,095 3,371
340
57,666
10,039 7,266
( 1 )
3,995 2,870 7,491 3,912 2,202 2,408 7,393
3,145 1,831
( 1 )
3,533 4,026
-
60,111
8,662 5,495
(D) 2,217 5,417 5,994 7,939 1,609
(D) 7,275
3,683 2,046
( 1 )
3,894 3,752
4,466
62,449
1,421 426 (
1 )
113 191 429 819 312 194 723
569 80
( 1 )
481 65
-
5,823
1,166 638 (D) 74
180 252 (
1 )
235 (D) 724
343 176 (
1 )
411 72
-
4,271
18,340 15,520
344 8,800 4,827
14,014 6,126 3,737 4,934
11,778
7,305 2,890
13,386 6,125
10,316
-
128,442
16,774 14,784
(D) 5,206 8,629
12,135 7,939 3,307
(D) 11,810
7,607 3,275
14,519 6,400 7,195
4,806
124,386
State
Percentage of quantity sold at wholesale
Wholesale price Value of all sales at wholesale
2
Less than 1 gallon
1 gallon up to 2 gallons
2 gallons or larger
2014 2015 2014 2015 2014 2015 2014 2015 2014 2015
(percent) (percent) (dollars per
pot) (dollars per
pot) (dollars per
pot) (dollars per
pot) (dollars per
pot) (dollars per
pot) (1,000 dollars)
(1,000 dollars)
California ................... Florida ........................ Hawaii ........................ Illinois ......................... Maryland .................... Michigan .................... New Jersey ................ New York ................... North Carolina ............ Ohio ........................... Oregon ....................... Pennsylvania ............. South Carolina ........... Texas ......................... Washington ................ Other States ............... 15 State total ..............
95 98
100 91 97 95 98 81 89 92
92 84
100 97 99
-
95
92 100 (D) 85
100 93 98 80
(D) 93
95 83
100 98 97
89
95
2.26 1.54 4.59 1.73 2.19 1.76 3.60 2.03 1.35 1.47
2.02 2.08 3.05 1.81 2.39
-
2.19
2.22 1.60 (D)
1.75 2.30 1.86 (
1 )
3.02 (D)
1.55
1.84 2.31 2.87 1.90 1.88
4.58
2.17
3.91 3.06 (
1 )
4.73 4.13 3.82 4.41 4.79 3.12 3.67
4.31 3.66 (
1 )
3.54 4.59
-
3.90
4.09 2.93 (D)
4.68 4.22 4.32 4.88 4.88 (D)
3.80
4.39 4.61 (
1 )
3.24 4.21
2.57
4.01
8.79 6.88 (
1 )
10.88 5.52 6.75 9.42 9.11 7.07 7.37
10.45 6.83 (
1 )
8.95 10.34
-
8.47
10.05 5.58
(D) 8.47 5.74 9.68 (
1 )
8.27 (D)
7.49
13.98 11.25
( 1 )
7.77 9.42
-
8.75
67,292 37,220 1,580
28,243 16,775 42,237 29,989 15,873 12,033 37,844
26,755 9,284
40,760 20,633 34,029
-
420,547
62,566 33,502
(D) 16,104 30,867 39,287 38,719 14,214
(D) 38,975
27,553 13,844 41,597 19,791 22,812
13,035
412,866
- Represents zero. (D) Withheld to avoid disclosing data for individual operations. 1
Quantity and price combined into pot size with greatest production to avoid disclosing data for individual operations. 2
Equivalent wholesale value of all sales.

Floriculture Crops 2015 Summary (April 2016) 37 USDA, National Agricultural Statistics Service
Flowering Plants Sold for Indoor or Patio Use Sold in Pots, African Violets – 15 Program States: 2014 and 2015 [Operations with $100,000+ sales]
State Producers
Quantity sold
Less than 5 inch
5 Inch or larger
Total all sizes
2014 2015 2014 2015 2014 2015 2014 2015
(number) (number) (1,000 pots) (1,000 pots) (1,000 pots) (1,000 pots) (1,000 pots) (1,000 pots)
California ............................. Florida ................................. Hawaii ................................. Illinois .................................. Michigan .............................. New Jersey .......................... New York ............................. North Carolina ..................... Ohio ..................................... Oregon ................................ Pennsylvania ....................... South Carolina ..................... Texas .................................. Other States
2 ......................
15 State total .......................
(D) 9
(D) 7
(D) (D) 12
(D) 5
(D)
13 - 4
18
68
(D) 7
(D) (D) (D) (D)
9 4 3
(D)
10 (D)
5
21
59
(D) 824 (D) 21
(D) (D) 439 (D) 169 (D)
49
- 55
1,038
2,595
(D) 851 (D) (D) (D) (D) 406 112 22
(D)
8 (D) 57
1,185
2,641
(D) (
1 )
(D) -
(D) (D)
- (D) (
1 )
(D)
( 1 ) - -
9
9
(D) (
1 )
(D) (D) (D) (D)
- -
( 1 )
(D)
- (D) (
1 )
8
8
(D) 824 (D) 21
(D) (D) 439 (D) 169 (D)
49
- 55
1,047
2,604
(D) 851 (D) (D) (D) (D) 406 112 22
(D)
8 (D) 57
1,193
2,649
State
Percentage of quantity sold at wholesale
Wholesale price Value of all sales at wholesale
3
Less than 5 inches
5 inches or larger
2014 2015 2014 2015 2014 2015 2014 2015
(percent) (percent) (dollars per
pot) (dollars per
pot) (dollars per
pot) (dollars per
pot) (1,000 dollars) (1,000 dollars)
California ............................. Florida ................................. Hawaii ................................. Illinois .................................. Maryland .............................. Michigan .............................. New Jersey .......................... New York ............................. North Carolina ..................... Ohio ..................................... Oregon ................................ South Carolina ..................... Pennsylvania ....................... Texas .................................. Other States
2 ......................
15 State total .......................
(D) 100 (D) 81
- (D) (D) 87
(D) 100
(D)
- 95
100
100
98
(D) 100 (D) (D)
- (D) (D) 77
100 100
(D) (D) 76
100
100
96
(D) 1.57 (D)
2.07 -
(D) (D)
1.64 (D)
1.51
(D) -
1.69 2.25
1.46
1.55
(D) 1.60 (D) (D)
- (D) (D)
1.56 1.83 2.16
(D) (D)
2.11 2.25
1.46
1.56
(D) (
1 )
(D) - -
(D) (D)
- (D) (
1 )
(D)
- (
1 ) -
4.13
4.13
(D) (
1 )
(D) (D)
- (D) (D)
- -
( 1 )
(D) (D)
- (
1 )
3.85
3.85
(D) 1,297
(D) 43
- (D) (D) 720 (D) 255
(D)
- 83
124
1,547
4,069
(D) 1,365
(D) (D)
- (D) (D) 633 205 48
(D) (D) 17
128
1,765
4,161
- Represents zero. (D) Withheld to avoid disclosing data for individual operations. 1
Quantity and price combined into pot size with greatest production to avoid disclosing data for individual operations. 2
Includes data withheld above, excluding those combined with other pot sizes. 3
Equivalent wholesale value of all sales.

38 Floriculture Crops 2015 Summary (April 2016) USDA, National Agricultural Statistics Service
Flowering Plants for Indoor or Patio Use Sold in Pots, Finished Florist Azaleas – 15 Program States: 2014 and 2015 [Operations with $100,000+ sales]
State Producers
Quantity sold
Less than 5 inches
5 inches or larger
Total all sizes
2014 2015 2014 2015 2014 2015 2014 2015
(number) (number) (1,000 pots) (1,000 pots) (1,000 pots) (1,000 pots) (1,000 pots) (1,000 pots)
California ............................. Florida .................................. Hawaii .................................. Illinois ................................... Maryland .............................. Michigan .............................. New Jersey .......................... New York ............................. North Carolina ...................... Ohio ..................................... Oregon ................................. Pennsylvania ....................... South Carolina ..................... Texas ................................... Washington .......................... Other States
2 ......................
15 State total ........................
10 7 3 6 4
(D) (D) (D)
7 (D)
6
13 (D)
7 (D)
46
109
(D) 6 3 9
(D) 7 9
(D) 6
(D)
7 13
(D) 9
(D)
44
113
( 1 )
( 1 ) -
( 1 )
( 1 )
(D) (D) (D)
- (D)
(
1 )
( 1 )
(D) 9
(D)
13
22
(D) (
1 ) -
( 1 )
(D) (
1 )
( 1 )
(D) -
(D)
( 1 )
( 1 )
(D) 10
(D)
93
103
382 580
7 30 2
(D) (D) (D) 36
(D)
2,427 5
(D) 20
(D)
574
4,063
(D) 574
7 31
(D) 12 11
(D) 54
(D)
1,958 6
(D) 23
(D)
911
3,587
382 580
7 30 2
(D) (D) (D) 36
(D)
2,427 5
(D) 29
(D)
587
4,085
(D) 574
7 31
(D) 12 11
(D) 54
(D)
1,958 6
(D) 33
(D)
1,004
3,690
State
Percentage of quantity sold at wholesale
Wholesale price Value of all sales at wholesale
3
Less than 5 inches
5 inches or larger
2014 2015 2014 2015 2014 2015 2014 2015
(percent) (percent) (dollars per
pot) (dollars per
pot) (dollars per
pot) (dollars per
pot) (1,000 dollars) (1,000 dollars)
California ............................. Florida .................................. Hawaii .................................. Illinois ................................... Maryland .............................. Michigan .............................. New Jersey .......................... New York ............................. North Carolina ...................... Ohio ..................................... Oregon ................................. Pennsylvania ....................... South Carolina ..................... Texas ................................... Washington .......................... Other States
2 ......................
15 State total ........................
100 100 100 91 93
(D) (D) (D) 99
(D)
100 29
(D) 99
(D)
99
100
(D) 100 100 97
(D) 98 90
(D) 99
(D)
100 19
(D) 93
(D)
96
99
( 1 )
( 1 ) -
( 1 )
( 1 )
(D) (D) (D)
- (D)
(
1 )
( 1 )
(D) 5.77 (D)
3.19
4.25
(D) (
1 ) -
( 1 )
(D) (
1 )
( 1 )
(D) -
(D)
( 1 )
( 1 )
(D) 5.80 (D)
5.20
5.26
6.31 4.53 6.74 5.41 5.36 (D) (D) (D)
9.04 (D)
4.43
10.51 (D)
11.85 (D)
3.94
4.65
(D) 4.73 6.74 7.16 (D)
9.95 7.43 (D)
9.30 (D)
4.91 8.93 (D)
11.83 (D)
4.59
4.96
2,409 2,627
47 162 11
(D) (D) (D) 325 (D)
10,752
53 (D) 289 (D)
2,302
18,977
(D) 2,713
47 222 (D) 119 82
(D) 502 (D)
9,606
54 (D) 330 (D)
4,668
18,343
- Represents zero. (D) Withheld to avoid disclosing data for individual operations. 1
Quantity and price combined into pot size with greatest production to avoid disclosing data for individual operations. 2
Includes data withheld above, excluding those combined with other pot sizes. 3
Equivalent wholesale value of all sales.
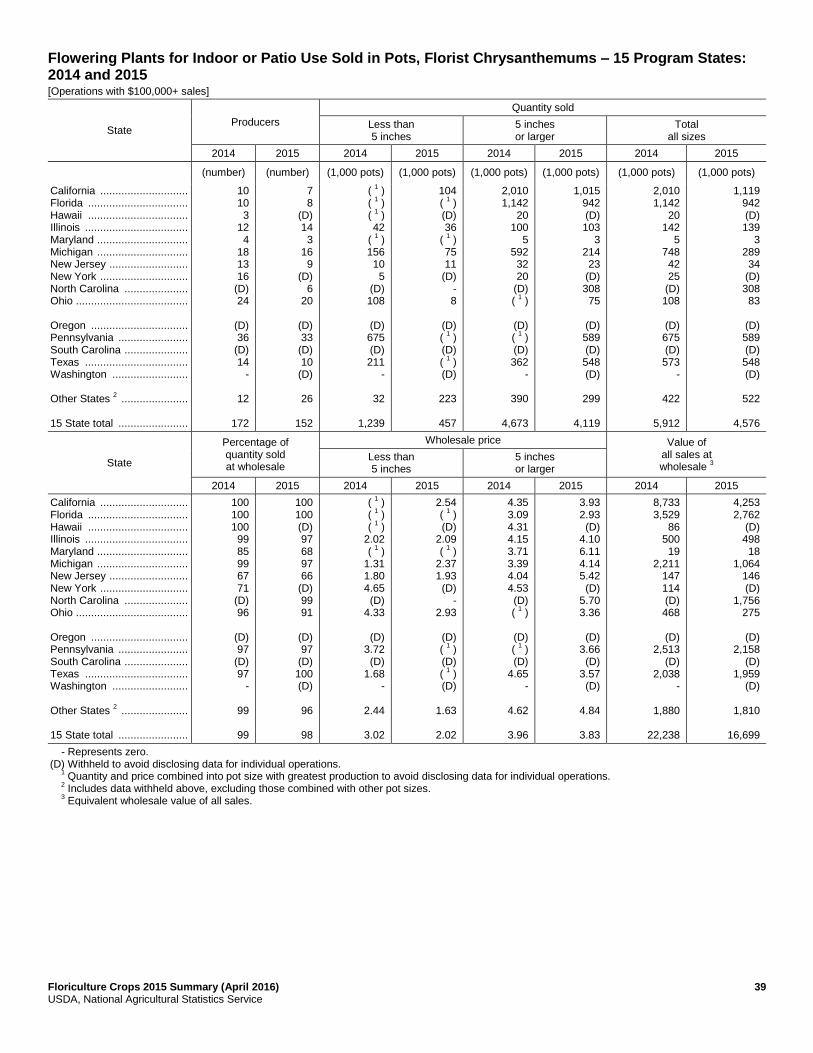
Floriculture Crops 2015 Summary (April 2016) 39 USDA, National Agricultural Statistics Service
Flowering Plants for Indoor or Patio Use Sold in Pots, Florist Chrysanthemums – 15 Program States: 2014 and 2015 [Operations with $100,000+ sales]
State Producers
Quantity sold
Less than 5 inches
5 inches or larger
Total all sizes
2014 2015 2014 2015 2014 2015 2014 2015
(number) (number) (1,000 pots) (1,000 pots) (1,000 pots) (1,000 pots) (1,000 pots) (1,000 pots)
California ............................. Florida ................................. Hawaii ................................. Illinois .................................. Maryland .............................. Michigan .............................. New Jersey .......................... New York ............................. North Carolina ..................... Ohio ..................................... Oregon ................................ Pennsylvania ....................... South Carolina ..................... Texas .................................. Washington ......................... Other States
2 ......................
15 State total .......................
10 10 3
12 4
18 13 16
(D) 24
(D) 36
(D) 14
-
12
172
7 8
(D) 14 3
16 9
(D) 6
20
(D) 33
(D) 10
(D)
26
152
( 1 )
( 1 )
( 1 )
42 (
1 )
156 10 5
(D) 108
(D) 675 (D) 211
-
32
1,239
104 (
1 )
(D) 36
( 1 )
75 11
(D) - 8
(D) (
1 )
(D) (
1 )
(D)
223
457
2,010 1,142
20 100
5 592 32 20
(D) (
1 )
(D) (
1 )
(D) 362
-
390
4,673
1,015 942 (D) 103
3 214 23
(D) 308 75
(D) 589 (D) 548 (D)
299
4,119
2,010 1,142
20 142
5 748 42 25
(D) 108
(D) 675 (D) 573
-
422
5,912
1,119 942 (D) 139
3 289 34
(D) 308 83
(D) 589 (D) 548 (D)
522
4,576
State
Percentage of quantity sold at wholesale
Wholesale price Value of all sales at wholesale
3
Less than 5 inches
5 inches or larger
2014 2015 2014 2015 2014 2015 2014 2015
California ............................. Florida ................................. Hawaii ................................. Illinois .................................. Maryland .............................. Michigan .............................. New Jersey .......................... New York ............................. North Carolina ..................... Ohio ..................................... Oregon ................................ Pennsylvania ....................... South Carolina ..................... Texas .................................. Washington ......................... Other States
2 ......................
15 State total .......................
100 100 100 99 85 99 67 71
(D) 96
(D) 97
(D) 97
-
99
99
100 100 (D) 97 68 97 66
(D) 99 91
(D) 97
(D) 100 (D)
96
98
( 1 )
( 1 )
( 1 )
2.02 (
1 )
1.31 1.80 4.65 (D)
4.33
(D) 3.72 (D)
1.68 -
2.44
3.02
2.54 (
1 )
(D) 2.09 (
1 )
2.37 1.93 (D)
- 2.93
(D) (
1 )
(D) (
1 )
(D)
1.63
2.02
4.35 3.09 4.31 4.15 3.71 3.39 4.04 4.53 (D) (
1 )
(D) (
1 )
(D) 4.65
-
4.62
3.96
3.93 2.93 (D)
4.10 6.11 4.14 5.42 (D)
5.70 3.36
(D)
3.66 (D)
3.57 (D)
4.84
3.83
8,733 3,529
86 500 19
2,211 147 114 (D) 468
(D)
2,513 (D)
2,038 -
1,880
22,238
4,253 2,762
(D) 498 18
1,064 146 (D)
1,756 275
(D)
2,158 (D)
1,959 (D)
1,810
16,699
- Represents zero. (D) Withheld to avoid disclosing data for individual operations. 1
Quantity and price combined into pot size with greatest production to avoid disclosing data for individual operations. 2
Includes data withheld above, excluding those combined with other pot sizes. 3
Equivalent wholesale value of all sales.

40 Floriculture Crops 2015 Summary (April 2016) USDA, National Agricultural Statistics Service
Flowering Plants for Indoor or Patio Use Sold in Pots, Easter Lilies – 15 Program States: 2014 and 2015 [Operations with $100,000+ sales]
State Producers
Quantity sold
Less than 5 inches
5 inches or larger
Total all sizes
2014 2015 2014 2015 2014 2015 2014 2015
(number) (number) (1,000 pots) (1,000 pots) (1,000 pots) (1,000 pots) (1,000 pots) (1,000 pots)
California ............................. Florida .................................. Hawaii .................................. Illinois ................................... Maryland .............................. Michigan .............................. New Jersey .......................... New York ............................. North Carolina ...................... Ohio ..................................... Oregon ................................. Pennsylvania ....................... South Carolina ..................... Texas ................................... Washington .......................... Other States
2 ......................
15 State total ........................
13 12
(D) 16 8
30 29 43 11 38
(D) 51 4
(D) (D)
26
281
13 11 5
16 7
26 28 37 13 38
(D) 46
(D) (D) (D)
25
265
106 (
1 )
(D) - -
103 (
1 )
( 1 ) -
542
(D) 31
- (D) (D)
3
785
( 1 )
( 1 )
( 1 )
( 1 ) -
124 (
1 )
( 1 ) -
11
(D) 17
(D) (D) (D)
3
155
714 571 (D) 257 28
1,427 273 458 271 (
1 )
(D) 740 20
(D) (D)
340
5,099
624 560 21
262 48
1,366 254 417 362 514
(D) 689 (D) (D) (D)
253
5,370
820 571 (D) 257 28
1,530 273 458 271 542
(D) 771 20
(D) (D)
343
5,884
624 560 21
262 48
1,490 254 417 362 525
(D) 706 (D) (D) (D)
256
5,525
State
Percentage of quantity sold at wholesale
Wholesale price Value of all sales at wholesale
3
Less than 5 inches
5 inches or larger
2014 2015 2014 2015 2014 2015 2014 2015
(percent) (percent) (dollars per
pot) (dollars per
pot) (dollars per
pot) (dollars per
pot) (1,000 dollars) (1,000 dollars)
California ............................. Florida .................................. Hawaii .................................. Illinois ................................... Maryland .............................. Michigan .............................. New Jersey .......................... New York ............................. North Carolina ...................... Ohio ..................................... Oregon ................................. Pennsylvania ....................... South Carolina ..................... Texas ................................... Washington .......................... Other States
2 ......................
15 State total ........................
100 99
(D) 99 85 97 95 96 99 97
(D) 96 54
(D) (D)
99
97
100 99
100 99 93 98 97 97 99 97
(D) 97
(D) (D) (D)
96
98
3.58 (
1 )
(D) - -
1.79 (
1 )
( 1 ) -
4.41
(D) 2.92
- (D) (D)
5.51
3.90
( 1 )
( 1 )
( 1 )
( 1 ) -
2.27 (
1 )
( 1 ) -
5.26
(D) 2.24 (D) (D) (D)
5.51
2.54
3.90 4.66 (D)
4.81 5.91 4.74 5.14 4.76 5.26 (
1 )
(D)
3.89 8.95 (D) (D)
5.07
4.59
4.25 4.57 6.07 4.90 5.93 4.17 5.31 4.49 4.88 4.37
(D)
3.99 (D) (D) (D)
5.28
4.45
3,164 2,663
(D) 1,236
165 6,948 1,402 2,181 1,425 2,388
(D)
2,969 179 (D) (D)
1,740
26,460
2,652 2,559
127 1,285
285 5,978 1,348 1,871 1,767 2,304
(D)
2,787 (D) (D) (D)
1,354
24,317
- Represents zero. (D) Withheld to avoid disclosing data for individual operations. 1
Quantity and price combined into pot size with greatest production to avoid disclosing data for individual operations. 2
Includes data withheld above, excluding those combined with other pot sizes. 3
Equivalent wholesale value of all sales.
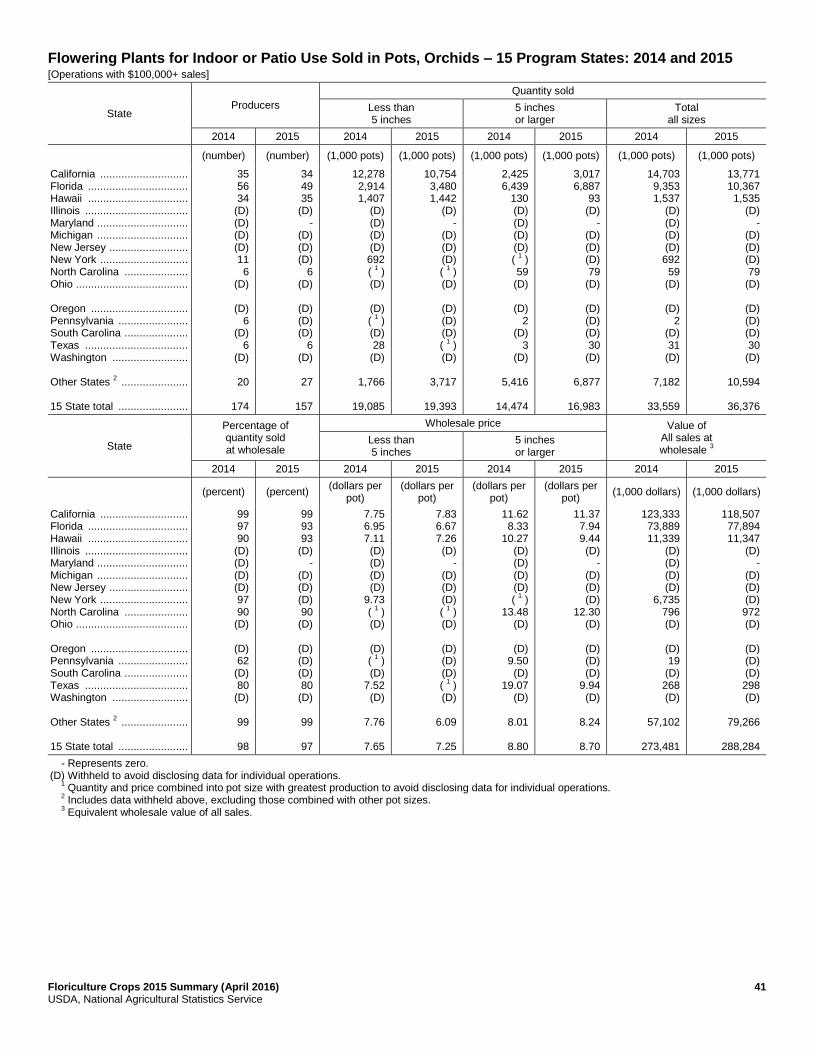
Floriculture Crops 2015 Summary (April 2016) 41 USDA, National Agricultural Statistics Service
Flowering Plants for Indoor or Patio Use Sold in Pots, Orchids – 15 Program States: 2014 and 2015 [Operations with $100,000+ sales]
State Producers
Quantity sold
Less than 5 inches
5 inches or larger
Total all sizes
2014 2015 2014 2015 2014 2015 2014 2015
(number) (number) (1,000 pots) (1,000 pots) (1,000 pots) (1,000 pots) (1,000 pots) (1,000 pots)
California ............................. Florida ................................. Hawaii ................................. Illinois .................................. Maryland .............................. Michigan .............................. New Jersey .......................... New York ............................. North Carolina ..................... Ohio ..................................... Oregon ................................ Pennsylvania ....................... South Carolina ..................... Texas .................................. Washington ......................... Other States
2 ......................
15 State total .......................
35 56 34
(D) (D) (D) (D) 11 6
(D)
(D) 6
(D) 6
(D)
20
174
34 49 35
(D) -
(D) (D) (D)
6 (D)
(D) (D) (D)
6 (D)
27
157
12,278 2,914 1,407
(D) (D) (D) (D) 692 (
1 )
(D)
(D) (
1 )
(D) 28
(D)
1,766
19,085
10,754 3,480 1,442
(D) -
(D) (D) (D) (
1 )
(D)
(D) (D) (D) (
1 )
(D)
3,717
19,393
2,425 6,439
130 (D) (D) (D) (D) (
1 )
59 (D)
(D)
2 (D)
3 (D)
5,416
14,474
3,017 6,887
93 (D)
- (D) (D) (D) 79
(D)
(D) (D) (D) 30
(D)
6,877
16,983
14,703 9,353 1,537
(D) (D) (D) (D) 692 59
(D)
(D) 2
(D) 31
(D)
7,182
33,559
13,771 10,367 1,535
(D) -
(D) (D) (D) 79
(D)
(D) (D) (D) 30
(D)
10,594
36,376
State
Percentage of quantity sold at wholesale
Wholesale price Value of All sales at wholesale
3
Less than 5 inches
5 inches or larger
2014 2015 2014 2015 2014 2015 2014 2015
(percent) (percent) (dollars per
pot) (dollars per
pot) (dollars per
pot) (dollars per
pot) (1,000 dollars) (1,000 dollars)
California ............................. Florida ................................. Hawaii ................................. Illinois .................................. Maryland .............................. Michigan .............................. New Jersey .......................... New York ............................. North Carolina ..................... Ohio ..................................... Oregon ................................ Pennsylvania ....................... South Carolina ..................... Texas .................................. Washington ......................... Other States
2 ......................
15 State total .......................
99 97 90
(D) (D) (D) (D) 97 90
(D)
(D) 62
(D) 80
(D)
99
98
99 93 93
(D) -
(D) (D) (D) 90
(D)
(D) (D) (D) 80
(D)
99
97
7.75 6.95 7.11 (D) (D) (D) (D)
9.73 (
1 )
(D)
(D) (
1 )
(D) 7.52 (D)
7.76
7.65
7.83 6.67 7.26 (D)
- (D) (D) (D) (
1 )
(D)
(D) (D) (D) (
1 )
(D)
6.09
7.25
11.62 8.33
10.27 (D) (D) (D) (D) (
1 )
13.48 (D)
(D)
9.50 (D)
19.07 (D)
8.01
8.80
11.37 7.94 9.44 (D)
- (D) (D) (D)
12.30 (D)
(D) (D) (D)
9.94 (D)
8.24
8.70
123,333 73,889 11,339
(D) (D) (D) (D)
6,735 796 (D)
(D) 19
(D) 268 (D)
57,102
273,481
118,507 77,894 11,347
(D) -
(D) (D) (D) 972 (D)
(D) (D) (D) 298 (D)
79,266
288,284
- Represents zero. (D) Withheld to avoid disclosing data for individual operations. 1
Quantity and price combined into pot size with greatest production to avoid disclosing data for individual operations. 2
Includes data withheld above, excluding those combined with other pot sizes. 3
Equivalent wholesale value of all sales.
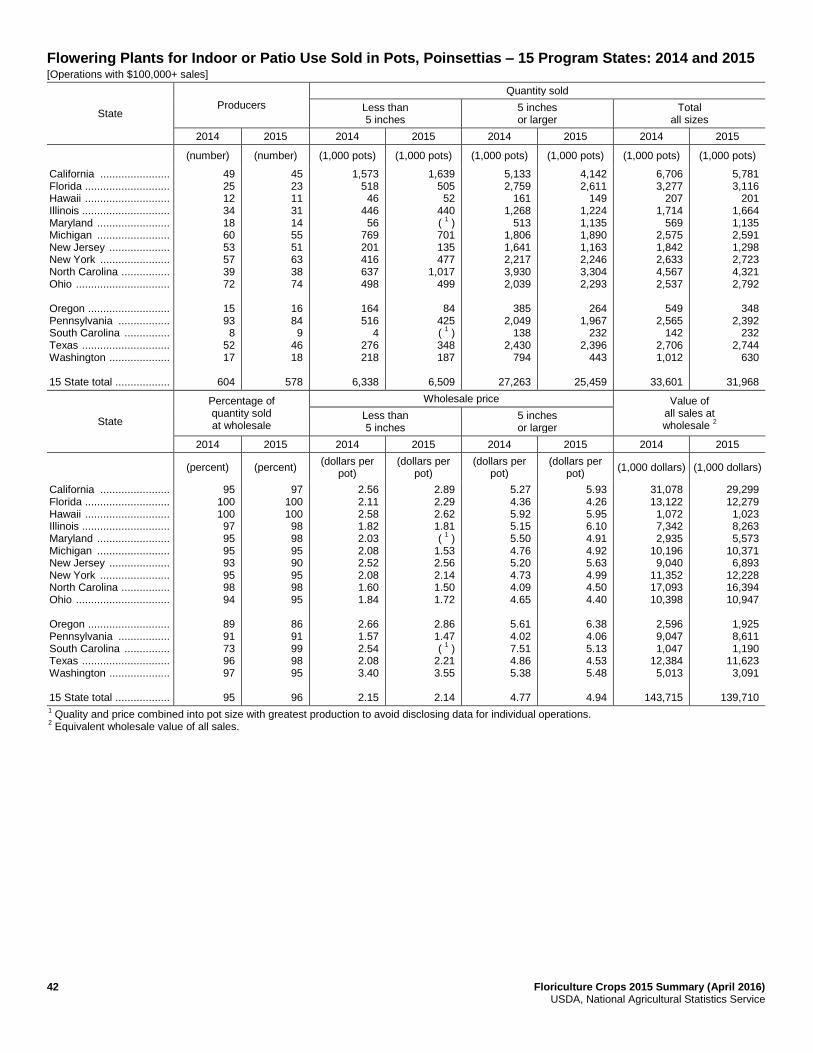
42 Floriculture Crops 2015 Summary (April 2016) USDA, National Agricultural Statistics Service
Flowering Plants for Indoor or Patio Use Sold in Pots, Poinsettias – 15 Program States: 2014 and 2015 [Operations with $100,000+ sales]
State Producers
Quantity sold
Less than 5 inches
5 inches or larger
Total all sizes
2014 2015 2014 2015 2014 2015 2014 2015
(number) (number) (1,000 pots) (1,000 pots) (1,000 pots) (1,000 pots) (1,000 pots) (1,000 pots)
California ....................... Florida ............................ Hawaii ............................ Illinois ............................. Maryland ........................ Michigan ........................ New Jersey .................... New York ....................... North Carolina ................ Ohio ............................... Oregon ........................... Pennsylvania ................. South Carolina ............... Texas ............................. Washington .................... 15 State total ..................
49 25 12 34 18 60 53 57 39 72
15 93 8
52 17
604
45 23 11 31 14 55 51 63 38 74
16 84 9
46 18
578
1,573 518 46
446 56
769 201 416 637 498
164 516
4 276 218
6,338
1,639 505 52
440 (
1 )
701 135 477
1,017 499
84
425 (
1 )
348 187
6,509
5,133 2,759
161 1,268
513 1,806 1,641 2,217 3,930 2,039
385
2,049 138
2,430 794
27,263
4,142 2,611
149 1,224 1,135 1,890 1,163 2,246 3,304 2,293
264
1,967 232
2,396 443
25,459
6,706 3,277
207 1,714
569 2,575 1,842 2,633 4,567 2,537
549
2,565 142
2,706 1,012
33,601
5,781 3,116
201 1,664 1,135 2,591 1,298 2,723 4,321 2,792
348
2,392 232
2,744 630
31,968
State
Percentage of quantity sold at wholesale
Wholesale price Value of all sales at wholesale
2
Less than 5 inches
5 inches or larger
2014 2015 2014 2015 2014 2015 2014 2015
(percent) (percent) (dollars per
pot) (dollars per
pot) (dollars per
pot) (dollars per
pot) (1,000 dollars) (1,000 dollars)
California ....................... Florida ............................ Hawaii ............................ Illinois ............................. Maryland ........................ Michigan ........................ New Jersey .................... New York ....................... North Carolina ................ Ohio ............................... Oregon ........................... Pennsylvania ................. South Carolina ............... Texas ............................. Washington .................... 15 State total ..................
95 100 100 97 95 95 93 95 98 94
89 91 73 96 97
95
97 100 100 98 98 95 90 95 98 95
86 91 99 98 95
96
2.56 2.11 2.58 1.82 2.03 2.08 2.52 2.08 1.60 1.84
2.66 1.57 2.54 2.08 3.40
2.15
2.89 2.29 2.62 1.81 (
1 )
1.53 2.56 2.14 1.50 1.72
2.86 1.47 (
1 )
2.21 3.55
2.14
5.27 4.36 5.92 5.15 5.50 4.76 5.20 4.73 4.09 4.65
5.61 4.02 7.51 4.86 5.38
4.77
5.93 4.26 5.95 6.10 4.91 4.92 5.63 4.99 4.50 4.40
6.38 4.06 5.13 4.53 5.48
4.94
31,078 13,122 1,072 7,342 2,935
10,196 9,040
11,352 17,093 10,398
2,596 9,047 1,047
12,384 5,013
143,715
29,299 12,279 1,023 8,263 5,573
10,371 6,893
12,228 16,394 10,947
1,925 8,611 1,190
11,623 3,091
139,710
1 Quality and price combined into pot size with greatest production to avoid disclosing data for individual operations.
2 Equivalent wholesale value of all sales.
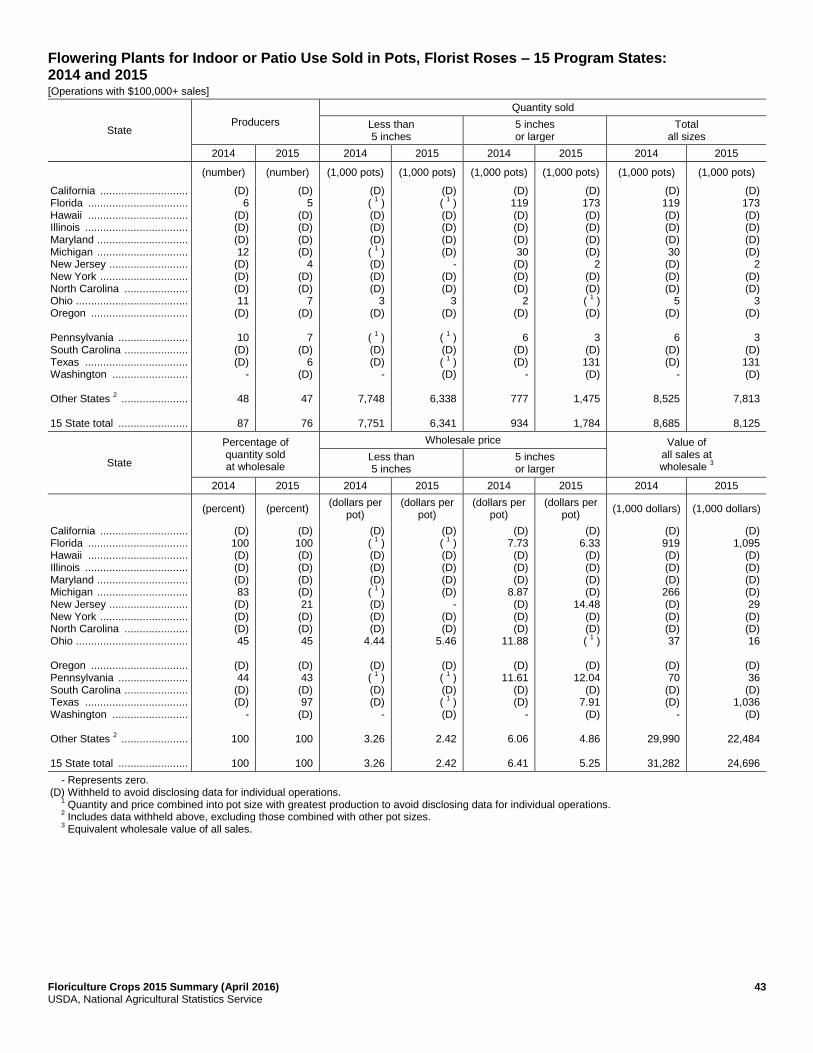
Floriculture Crops 2015 Summary (April 2016) 43 USDA, National Agricultural Statistics Service
Flowering Plants for Indoor or Patio Use Sold in Pots, Florist Roses – 15 Program States: 2014 and 2015 [Operations with $100,000+ sales]
State Producers
Quantity sold
Less than 5 inches
5 inches or larger
Total all sizes
2014 2015 2014 2015 2014 2015 2014 2015
(number) (number) (1,000 pots) (1,000 pots) (1,000 pots) (1,000 pots) (1,000 pots) (1,000 pots)
California ............................. Florida ................................. Hawaii ................................. Illinois .................................. Maryland .............................. Michigan .............................. New Jersey .......................... New York ............................. North Carolina ..................... Ohio ..................................... Oregon ................................ Pennsylvania ....................... South Carolina ..................... Texas .................................. Washington ......................... Other States
2 ......................
15 State total .......................
(D) 6
(D) (D) (D) 12
(D) (D) (D) 11
(D)
10 (D) (D)
-
48
87
(D) 5
(D) (D) (D) (D)
4 (D) (D)
7 (D)
7
(D) 6
(D)
47
76
(D) (
1 )
(D) (D) (D) (
1 )
(D) (D) (D)
3 (D)
(
1 )
(D) (D)
-
7,748
7,751
(D) (
1 )
(D) (D) (D) (D)
- (D) (D)
3 (D)
(
1 )
(D) (
1 )
(D)
6,338
6,341
(D) 119 (D) (D) (D) 30
(D) (D) (D)
2 (D)
6
(D) (D)
-
777
934
(D) 173 (D) (D) (D) (D)
2 (D) (D) (
1 )
(D)
3 (D) 131 (D)
1,475
1,784
(D) 119 (D) (D) (D) 30
(D) (D) (D)
5 (D)
6
(D) (D)
-
8,525
8,685
(D) 173 (D) (D) (D) (D)
2 (D) (D)
3 (D)
3
(D) 131 (D)
7,813
8,125
State
Percentage of quantity sold at wholesale
Wholesale price Value of all sales at wholesale
3
Less than 5 inches
5 inches or larger
2014 2015 2014 2015 2014 2015 2014 2015
(percent) (percent) (dollars per
pot) (dollars per
pot) (dollars per
pot) (dollars per
pot) (1,000 dollars) (1,000 dollars)
California ............................. Florida ................................. Hawaii ................................. Illinois .................................. Maryland .............................. Michigan .............................. New Jersey .......................... New York ............................. North Carolina ..................... Ohio ..................................... Oregon ................................ Pennsylvania ....................... South Carolina ..................... Texas .................................. Washington ......................... Other States
2 ......................
15 State total .......................
(D) 100 (D) (D) (D) 83
(D) (D) (D) 45
(D) 44
(D) (D)
-
100
100
(D) 100 (D) (D) (D) (D) 21
(D) (D) 45
(D) 43
(D) 97
(D)
100
100
(D) (
1 )
(D) (D) (D) (
1 )
(D) (D) (D)
4.44
(D) (
1 )
(D) (D)
-
3.26
3.26
(D) (
1 )
(D) (D) (D) (D)
- (D) (D)
5.46
(D) (
1 )
(D) (
1 )
(D)
2.42
2.42
(D) 7.73 (D) (D) (D)
8.87 (D) (D) (D)
11.88
(D) 11.61
(D) (D)
-
6.06
6.41
(D) 6.33 (D) (D) (D) (D)
14.48 (D) (D) (
1 )
(D)
12.04 (D)
7.91 (D)
4.86
5.25
(D) 919 (D) (D) (D) 266 (D) (D) (D) 37
(D) 70
(D) (D)
-
29,990
31,282
(D) 1,095
(D) (D) (D) (D) 29
(D) (D) 16
(D) 36
(D) 1,036
(D)
22,484
24,696
- Represents zero. (D) Withheld to avoid disclosing data for individual operations. 1
Quantity and price combined into pot size with greatest production to avoid disclosing data for individual operations. 2
Includes data withheld above, excluding those combined with other pot sizes. 3
Equivalent wholesale value of all sales.
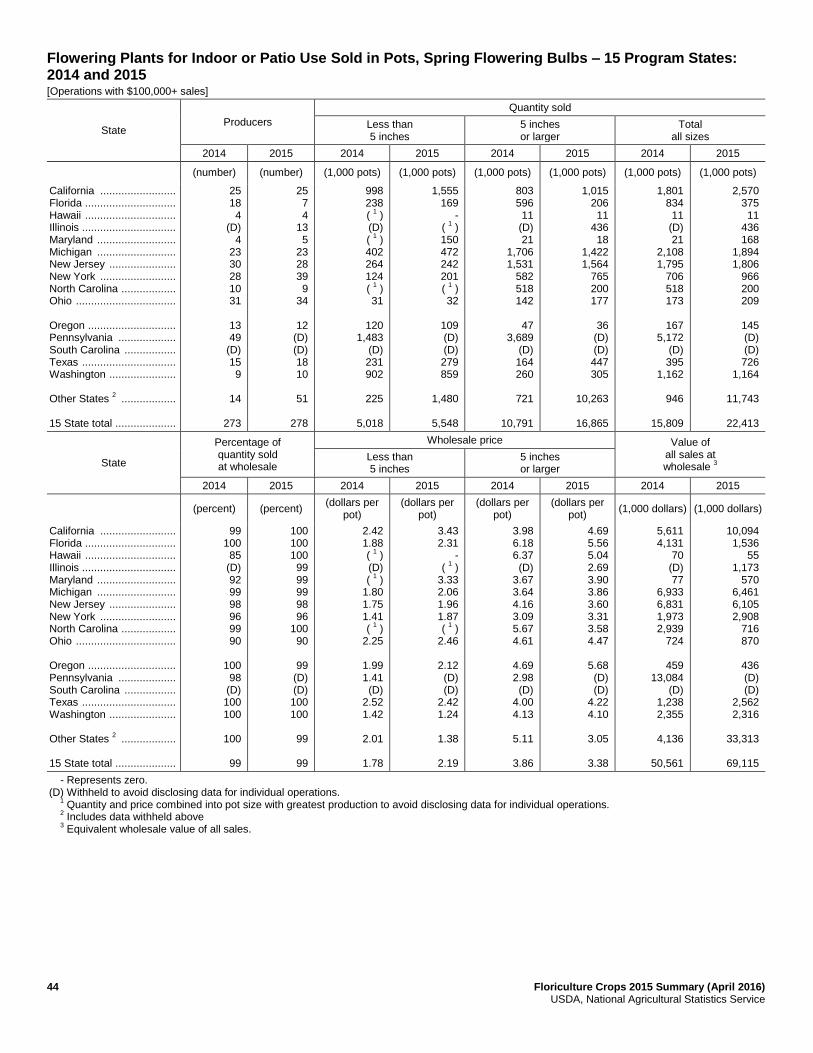
44 Floriculture Crops 2015 Summary (April 2016) USDA, National Agricultural Statistics Service
Flowering Plants for Indoor or Patio Use Sold in Pots, Spring Flowering Bulbs – 15 Program States: 2014 and 2015 [Operations with $100,000+ sales]
State Producers
Quantity sold
Less than 5 inches
5 inches or larger
Total all sizes
2014 2015 2014 2015 2014 2015 2014 2015
(number) (number) (1,000 pots) (1,000 pots) (1,000 pots) (1,000 pots) (1,000 pots) (1,000 pots)
California ......................... Florida .............................. Hawaii .............................. Illinois ............................... Maryland .......................... Michigan .......................... New Jersey ...................... New York ......................... North Carolina .................. Ohio ................................. Oregon ............................. Pennsylvania ................... South Carolina ................. Texas ............................... Washington ...................... Other States
2 ..................
15 State total ....................
25 18 4
(D) 4
23 30 28 10 31
13 49
(D) 15 9
14
273
25 7 4
13 5
23 28 39 9
34
12 (D) (D) 18 10
51
278
998 238 (
1 )
(D) (
1 )
402 264 124 (
1 )
31
120 1,483
(D) 231 902
225
5,018
1,555 169
- (
1 )
150 472 242 201 (
1 )
32
109 (D) (D) 279 859
1,480
5,548
803 596 11
(D) 21
1,706 1,531
582 518 142
47
3,689 (D) 164 260
721
10,791
1,015 206 11
436 18
1,422 1,564
765 200 177
36
(D) (D) 447 305
10,263
16,865
1,801 834 11
(D) 21
2,108 1,795
706 518 173
167
5,172 (D) 395
1,162
946
15,809
2,570 375 11
436 168
1,894 1,806
966 200 209
145 (D) (D) 726
1,164
11,743
22,413
State
Percentage of quantity sold at wholesale
Wholesale price Value of all sales at wholesale
3
Less than 5 inches
5 inches or larger
2014 2015 2014 2015 2014 2015 2014 2015
(percent) (percent) (dollars per
pot) (dollars per
pot) (dollars per
pot) (dollars per
pot) (1,000 dollars) (1,000 dollars)
California ......................... Florida .............................. Hawaii .............................. Illinois ............................... Maryland .......................... Michigan .......................... New Jersey ...................... New York ......................... North Carolina .................. Ohio ................................. Oregon ............................. Pennsylvania ................... South Carolina ................. Texas ............................... Washington ...................... Other States
2 ..................
15 State total ....................
99 100 85
(D) 92 99 98 96 99 90
100 98
(D) 100 100
100
99
100 100 100 99 99 99 98 96
100 90
99
(D) (D) 100 100
99
99
2.42 1.88 (
1 )
(D) (
1 )
1.80 1.75 1.41 (
1 )
2.25
1.99 1.41 (D)
2.52 1.42
2.01
1.78
3.43 2.31
- (
1 )
3.33 2.06 1.96 1.87 (
1 )
2.46
2.12 (D) (D)
2.42 1.24
1.38
2.19
3.98 6.18 6.37 (D)
3.67 3.64 4.16 3.09 5.67 4.61
4.69 2.98 (D)
4.00 4.13
5.11
3.86
4.69 5.56 5.04 2.69 3.90 3.86 3.60 3.31 3.58 4.47
5.68 (D) (D)
4.22 4.10
3.05
3.38
5,611 4,131
70 (D) 77
6,933 6,831 1,973 2,939
724
459 13,084
(D) 1,238 2,355
4,136
50,561
10,094 1,536
55 1,173
570 6,461 6,105 2,908
716 870
436 (D) (D)
2,562 2,316
33,313
69,115
- Represents zero. (D) Withheld to avoid disclosing data for individual operations. 1
Quantity and price combined into pot size with greatest production to avoid disclosing data for individual operations. 2
Includes data withheld above 3
Equivalent wholesale value of all sales.

Floriculture Crops 2015 Summary (April 2016) 45 USDA, National Agricultural Statistics Service
Flowering Plants for Indoor or Patio Use Sold in Pots, Other Flowering Plants – 15 Program States: 2014 and 2015 [Operations with $100,000+ sales]
State Producers
Quantity sold
Less than 5 inches
5 inches or larger
Total all sizes
2014 2015 2014 2015 2014 2015 2014 2015
(number) (number) (1,000 pots) (1,000 pots) (1,000 pots) (1,000 pots) (1,000 pots) (1,000 pots)
California ............................. Florida ................................. Hawaii ................................. Illinois .................................. Maryland .............................. Michigan .............................. New Jersey .......................... New York ............................. North Carolina ..................... Ohio ..................................... Oregon ................................ Pennsylvania ....................... South Carolina ..................... Texas .................................. Washington ......................... 15 State total .......................
71 72 14 26 15 72 48 72 38 61
22 77 12 42 11
653
59 63 14 22 7
47 28 44 29 39
19 53 4
35 11
474
13,221 5,801
217 189 27
1,491 208 610 941 242
528 300 41
1,461 292
25,569
10,947 7,995
237 139
8 595 222 654 129 108
737 545 (
1 )
930 329
23,575
12,674 12,408
90 496 122
1,505 746 483 924 334
158 503 277
1,266 204
32,190
8,770 16,066
77 909 88
602 497 487 663 171
134 83
188 937 217
29,889
25,895 18,209
307 685 149
2,996 954
1,093 1,865
576
686 803 318
2,727 496
57,759
19,717 24,061
314 1,048
96 1,197
719 1,141
792 279
871 628 188
1,867 546
53,464
State
Percentage of quantity sold at wholesale
Wholesale price Value of all sales at wholesale
2
Less Than 5 inches
5 inches or larger
2014 2015 2014 2015 2014 2015 2014 2015
(percent) (percent) (dollars per
pot) (dollars per
pot) (dollars per
pot) (dollars per
pot) (1,000 dollars) (1,000 dollars)
California ............................. Florida ................................. Hawaii ................................. Illinois .................................. Maryland .............................. Michigan .............................. New Jersey .......................... New York ............................. North Carolina ..................... Ohio ..................................... Oregon ................................ Pennsylvania ....................... South Carolina ..................... Texas .................................. Washington ......................... 15 State total .......................
97 99 98 97 99 90 94 92 96 83
94 81 99 99 98
97
100 99 98 95 94 92 93 89 91 76
96 78
100 96 96
98
2.69 3.38 5.75 2.24 2.01 1.88 2.36 1.81 2.15 2.18
1.23 1.76 1.41 2.39 1.18
2.70
2.48 0.99 6.11 2.40 2.50 2.57 3.53 1.78 1.69 2.54
1.36 1.50 (
1 )
2.60 1.14
1.93
4.28 6.29 6.40 3.29 7.13 4.43 7.94 4.36 4.62 6.77
7.23 3.07 4.85 6.00 9.92
5.29
6.83 5.67 6.55 2.97 6.32 6.26 7.23 4.59 5.72 7.62
4.65 4.96 5.75 6.05 7.65
5.99
89,809 97,654 1,824 2,055
924 9,470 6,414 3,210 6,292 2,789
1,792 2,072 1,401
11,088 2,368
239,162
87,048 99,009 1,952 3,033
576 5,298 4,377 3,399 4,010 1,577
1,625 1,229 1,080 8,087 2,035
224,335
1 Quantity and price combined into pot size with greatest production to avoid disclosing data for individual operations.
2 Equivalent wholesale value of all sales.

46 Floriculture Crops 2015 Summary (April 2016) USDA, National Agricultural Statistics Service
Foliage Plants for Indoor or Patio Use Sold in Hanging Baskets – 15 Program States: 2014 and 2015 [Operations with $100,000+ sales]
State Producers
Quantity sold
Percentage of quantity sold at wholesale
Wholesale price
Value of all sales at wholesale
1
2014 2015 2014 2015 2014 2015 2014 2015 2014 2015
(number) (number) (1,000
baskets) (1,000
baskets) (percent) (percent)
(dollars per basket)
(dollars per basket)
(1,000 dollars)
(1,000 dollars)
California ........................ Florida ............................. Hawaii ............................. Illinois .............................. Maryland ......................... Michigan ......................... New Jersey ..................... New York ........................ North Carolina ................. Ohio ................................ Oregon ............................ Pennsylvania .................. South Carolina ................ Texas .............................. Washington ..................... Other States .................... 15 State total ...................
20 76 7
17 (D) 43
(D) 27
(D) 49
(D) 47 7
37 4
52
386
32 97 7
22 (D) 49 16
(D) 35 61
11 58
(D) 49
(D)
51
488
959 6,077
13 55
(D) 160 (D) 32
(D) 213
(D) 118
9 238
7
2,318
10,199
1,687 6,582
11 56
(D) 258 107 (D)
2,164 249
42 74
(D) 220 (D)
106
11,556
100 100 100 95
(D) 86
(D) 78
(D) 92
(D) 83 70 91 78
99
99
100 100 100 79
(D) 90 96
(D) 99 37
93 55
(D) 90
(D)
83
97
5.84 5.80 6.76 8.24 (D)
9.47 (D)
9.59 (D)
5.87
(D) 6.39 8.50 6.47
14.00
6.98
6.19
4.78 5.35 7.43 9.80 (D)
10.91 6.01 (D)
6.41 7.91
14.21
9.06 (D)
7.19 (D)
14.20
5.85
5,601 35,247
88 453 (D)
1,515 (D) 307 (D)
1,250
(D) 754 77
1,540 98
16,173
63,103
8,064 35,214
82 549 (D)
2,815 643 (D)
13,871 1,970
597 670 (D)
1,582 (D)
1,505
67,562
(D) Withheld to avoid disclosing data for individual operations. 1
Equivalent wholesale value of all sales. 2
Includes data withheld above.
Foliage Plants for Indoor or Patio Use Sold in Pots – 15 Program States: 2014 and 2015 [Operations with $100,000+ sales]
State Producers
Percentage of value of all sales
at wholesale
Value of all sales at wholesale
1
2014 2015 2014 2015 2014 2015
(number) (number) (percent) (percent) (1,000 dollars) (1,000 dollars)
California ............................. Florida .................................. Hawaii .................................. Illinois ................................... Maryland .............................. Michigan .............................. New Jersey .......................... New York ............................. North Carolina ...................... Ohio ..................................... Oregon ................................. Pennsylvania ....................... South Carolina ..................... Texas ................................... Washington .......................... Other States
2 ......................
15 State total ........................
84 261
25 21
(D) 49
(D) 35
(D) 49
(D) 52
(D) 28 9
70
683
77 259 23 14
(D) 41
(D) 36
(D) 38
8
34 (D) 33
(D)
41
604
99 100 100 96
(D) 93
(D) 85
(D) 98
(D) 88
(D) 99 81
74
99
99 100 100 85
(D) 89
(D) 83
(D) 85
81 80
(D) 98
(D)
81
100
111,348 409,463
8,606 920 (D)
4,896 (D)
1,373 (D)
6,215
(D) 1,487
(D) 10,692
751
4,028
559,779
106,535 508,233
9,530 572 (D)
3,490 (D)
1,865 (D)
2,237
573 832 (D)
10,213 (D)
2,047
646,127
(D) Withheld to avoid disclosing data for individual operations. 1
Equivalent wholesale value of all sales. 2
Includes data withheld above.

Floriculture Crops 2015 Summary (April 2016) 47 USDA, National Agricultural Statistics Service
Cut Flowers by Type – 15 Program States: 2014 and 2015 [Operations with $100,000+ Sales]
Plant and State Producers
Quantity sold
Percentage of quantity sold at wholesale
Wholesale price
Value of all sales at wholesale
1
2014 2015 2014 2015 2014 2015 2014 2015 2014 2015
(number) (number) (1,000 stems)
(1,000 stems)
(percent) (percent) (cents per
stem) (cents per
stem) (1,000 dollars)
(1,000 dollars)
Alstroemeria California ...................................... Florida .......................................... Hawaii .......................................... Illinois ........................................... New York ...................................... Ohio .............................................. Pennsylvania ................................ Other States
2 ...............................
15 State total ................................
19
- (D)
- (D) (D) (D)
6
25
19
(D) -
(D) (D) (D) (D)
7
26
8,431
- (D)
- (D) (D) (D)
459
8,890
7,255
(D) -
(D) (D) (D) (D)
492
7,747
96
- (D)
- (D) (D) (D)
98
96
98
(D) -
(D) (D) (D) (D)
98
98
16.2
- (D)
- (D) (D) (D)
73.2
19.1
16.5 (D)
- (D) (D) (D) (D)
65.0
19.6
1,366
- (D)
- (D) (D) (D)
336
1,702
1,197
(D) -
(D) (D) (D) (D)
320
1,517
Carnations, standard California ...................................... Florida .......................................... Illinois ........................................... New York ...................................... Oregon ......................................... Pennsylvania ................................ Other States
2 ...............................
15 State total ................................
4 - -
(D) (D) (D)
3
7
4 (D) (D)
- (D) (D)
4
8
775 - -
(D) (D) (D)
22
797
775 (D) (D)
- (D) (D)
121
896
74 - -
(D) (D) (D)
15
72
74 (D) (D)
- (D) (D)
67
73
30.8 - -
(D) (D) (D)
22.7
30.6
30.8 (D) (D)
- (D) (D)
28.1
30.5
239 - -
(D) (D) (D)
5
244
239 (D) (D)
- (D) (D)
34
273
See footnote(s) at end of table. --continued
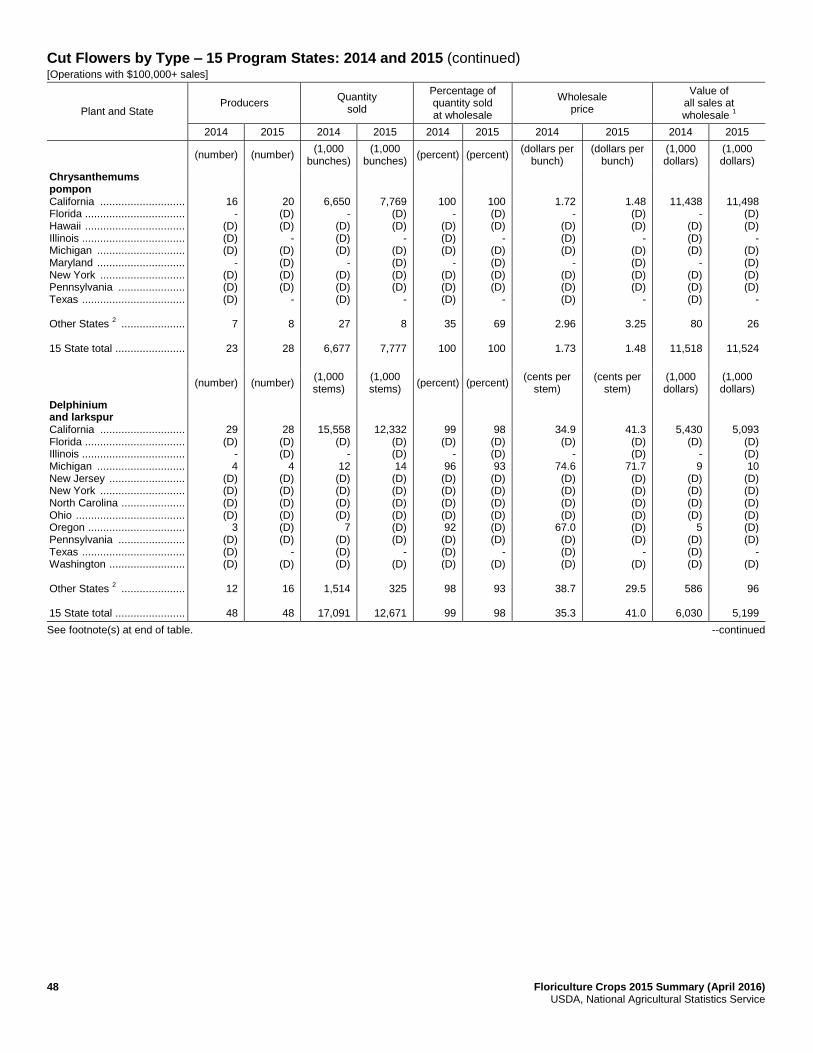
48 Floriculture Crops 2015 Summary (April 2016) USDA, National Agricultural Statistics Service
Cut Flowers by Type – 15 Program States: 2014 and 2015 (continued) [Operations with $100,000+ sales]
Plant and State Producers
Quantity sold
Percentage of quantity sold at wholesale
Wholesale price
Value of all sales at wholesale
1
2014 2015 2014 2015 2014 2015 2014 2015 2014 2015
(number) (number) (1,000
bunches) (1,000
bunches) (percent) (percent)
(dollars per bunch)
(dollars per bunch)
(1,000 dollars)
(1,000 dollars)
Chrysanthemums pompon California ............................ Florida ................................. Hawaii ................................. Illinois .................................. Michigan ............................. Maryland ............................. New York ............................ Pennsylvania ...................... Texas .................................. Other States
2 .....................
15 State total .......................
16 -
(D) (D) (D)
- (D) (D) (D)
7
23
20 (D) (D)
- (D) (D) (D) (D)
-
8
28
6,650 -
(D) (D) (D)
- (D) (D) (D)
27
6,677
7,769 (D) (D)
- (D) (D) (D) (D)
-
8
7,777
100 -
(D) (D) (D)
- (D) (D) (D)
35
100
100 (D) (D)
- (D) (D) (D) (D)
-
69
100
1.72 -
(D) (D) (D)
- (D) (D) (D)
2.96
1.73
1.48 (D) (D)
- (D) (D) (D) (D)
-
3.25
1.48
11,438 -
(D) (D) (D)
- (D) (D) (D)
80
11,518
11,498 (D) (D)
- (D) (D) (D) (D)
-
26
11,524
(number) (number) (1,000 stems)
(1,000 stems)
(percent) (percent) (cents per
stem) (cents per
stem) (1,000 dollars)
(1,000 dollars)
Delphinium and larkspur California ............................ Florida ................................. Illinois .................................. Michigan ............................. New Jersey ......................... New York ............................ North Carolina ..................... Ohio .................................... Oregon ................................ Pennsylvania ...................... Texas .................................. Washington ......................... Other States
2 .....................
15 State total .......................
29 (D)
- 4
(D) (D) (D) (D)
3 (D) (D) (D)
12
48
28 (D) (D)
4 (D) (D) (D) (D) (D) (D)
- (D)
16
48
15,558 (D)
- 12
(D) (D) (D) (D)
7 (D) (D) (D)
1,514
17,091
12,332 (D) (D) 14
(D) (D) (D) (D) (D) (D)
- (D)
325
12,671
99 (D)
- 96
(D) (D) (D) (D) 92
(D) (D) (D)
98
99
98 (D) (D) 93
(D) (D) (D) (D) (D) (D)
- (D)
93
98
34.9 (D)
- 74.6 (D) (D) (D) (D)
67.0 (D) (D) (D)
38.7
35.3
41.3 (D) (D)
71.7 (D) (D) (D) (D) (D) (D)
- (D)
29.5
41.0
5,430 (D)
- 9
(D) (D) (D) (D)
5 (D) (D) (D)
586
6,030
5,093 (D) (D) 10
(D) (D) (D) (D) (D) (D)
- (D)
96
5,199
See footnote(s) at end of table. --continued
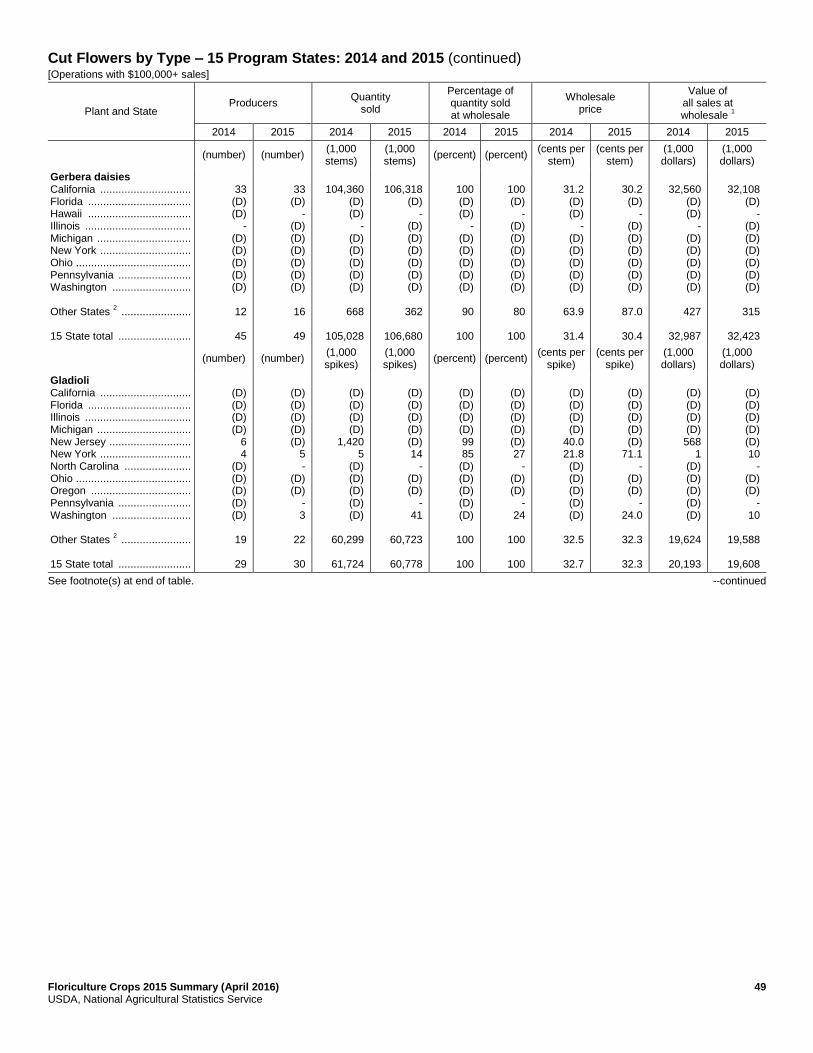
Floriculture Crops 2015 Summary (April 2016) 49 USDA, National Agricultural Statistics Service
Cut Flowers by Type – 15 Program States: 2014 and 2015 (continued) [Operations with $100,000+ sales]
Plant and State Producers
Quantity sold
Percentage of quantity sold at wholesale
Wholesale price
Value of all sales at wholesale
1
2014 2015 2014 2015 2014 2015 2014 2015 2014 2015
(number) (number) (1,000 stems)
(1,000 stems)
(percent) (percent) (cents per
stem) (cents per
stem) (1,000 dollars)
(1,000 dollars)
Gerbera daisies California .............................. Florida .................................. Hawaii .................................. Illinois ................................... Michigan ............................... New York .............................. Ohio ...................................... Pennsylvania ........................ Washington .......................... Other States
2 .......................
15 State total ........................
33
(D) (D)
- (D) (D) (D) (D) (D)
12
45
33
(D) -
(D) (D) (D) (D) (D) (D)
16
49
104,360
(D) (D)
- (D) (D) (D) (D) (D)
668
105,028
106,318
(D) -
(D) (D) (D) (D) (D) (D)
362
106,680
100 (D) (D)
- (D) (D) (D) (D) (D)
90
100
100 (D)
- (D) (D) (D) (D) (D) (D)
80
100
31.2 (D) (D)
- (D) (D) (D) (D) (D)
63.9
31.4
30.2 (D)
- (D) (D) (D) (D) (D) (D)
87.0
30.4
32,560
(D) (D)
- (D) (D) (D) (D) (D)
427
32,987
32,108
(D) -
(D) (D) (D) (D) (D) (D)
315
32,423
(number) (number) (1,000 spikes)
(1,000 spikes)
(percent) (percent) (cents per
spike) (cents per
spike) (1,000 dollars)
(1,000 dollars)
Gladioli California .............................. Florida .................................. Illinois ................................... Michigan ............................... New Jersey ........................... New York .............................. North Carolina ...................... Ohio ...................................... Oregon ................................. Pennsylvania ........................ Washington .......................... Other States
2 .......................
15 State total ........................
(D) (D) (D) (D)
6 4
(D) (D) (D) (D) (D)
19
29
(D) (D) (D) (D) (D)
5 -
(D) (D)
- 3
22
30
(D) (D) (D) (D)
1,420 5
(D) (D) (D) (D) (D)
60,299
61,724
(D) (D) (D) (D) (D) 14
- (D) (D)
- 41
60,723
60,778
(D) (D) (D) (D) 99 85
(D) (D) (D) (D) (D)
100
100
(D) (D) (D) (D) (D) 27
- (D) (D)
- 24
100
100
(D) (D) (D) (D)
40.0 21.8 (D) (D) (D) (D) (D)
32.5
32.7
(D) (D) (D) (D) (D)
71.1 -
(D) (D)
- 24.0
32.3
32.3
(D) (D) (D) (D) 568
1 (D) (D) (D) (D) (D)
19,624
20,193
(D) (D) (D) (D) (D) 10
- (D) (D)
- 10
19,588
19,608
See footnote(s) at end of table. --continued
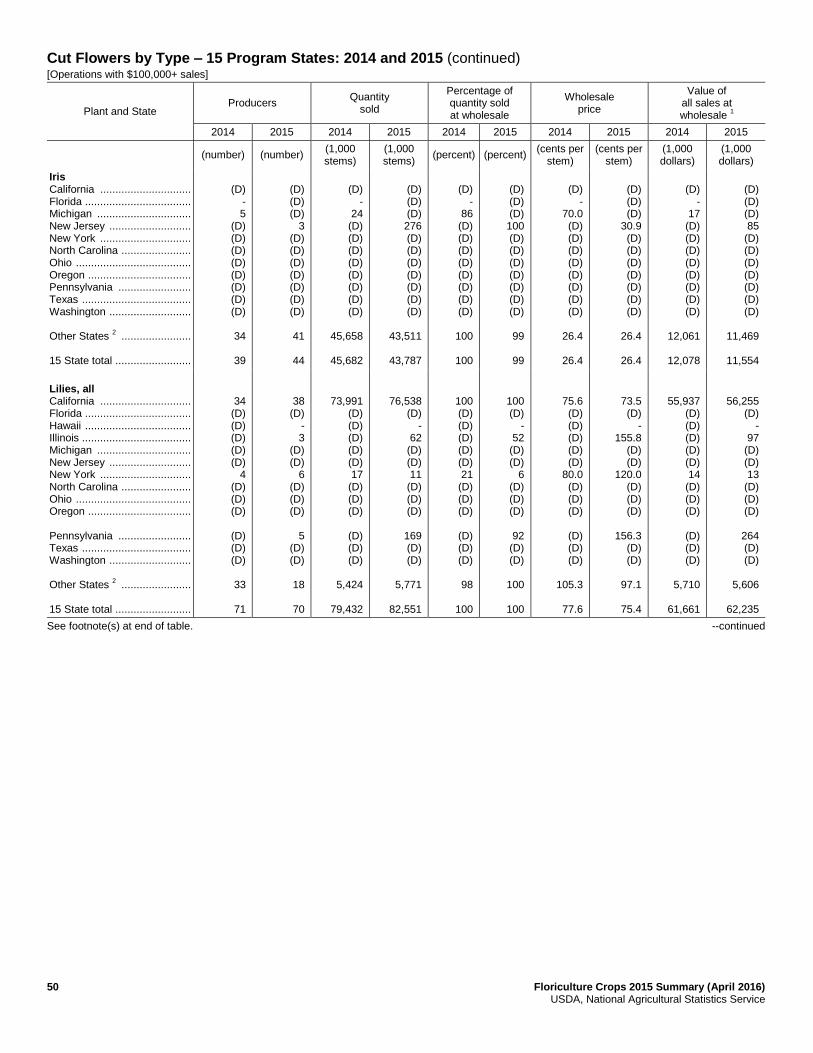
50 Floriculture Crops 2015 Summary (April 2016) USDA, National Agricultural Statistics Service
Cut Flowers by Type – 15 Program States: 2014 and 2015 (continued) [Operations with $100,000+ sales]
Plant and State Producers
Quantity sold
Percentage of quantity sold at wholesale
Wholesale price
Value of all sales at wholesale
1
2014 2015 2014 2015 2014 2015 2014 2015 2014 2015
(number) (number) (1,000 stems)
(1,000 stems)
(percent) (percent) (cents per
stem) (cents per
stem) (1,000 dollars)
(1,000 dollars)
Iris California .............................. Florida ................................... Michigan ............................... New Jersey ........................... New York .............................. North Carolina ....................... Ohio ...................................... Oregon .................................. Pennsylvania ........................ Texas .................................... Washington ........................... Other States
2 .......................
15 State total .........................
(D)
- 5
(D) (D) (D) (D) (D) (D) (D) (D)
34
39
(D) (D) (D)
3 (D) (D) (D) (D) (D) (D) (D)
41
44
(D)
- 24
(D) (D) (D) (D) (D) (D) (D) (D)
45,658
45,682
(D) (D) (D) 276 (D) (D) (D) (D) (D) (D) (D)
43,511
43,787
(D)
- 86
(D) (D) (D) (D) (D) (D) (D) (D)
100
100
(D) (D) (D) 100 (D) (D) (D) (D) (D) (D) (D)
99
99
(D)
- 70.0 (D) (D) (D) (D) (D) (D) (D) (D)
26.4
26.4
(D) (D) (D)
30.9 (D) (D) (D) (D) (D) (D) (D)
26.4
26.4
(D)
- 17
(D) (D) (D) (D) (D) (D) (D) (D)
12,061
12,078
(D) (D) (D) 85
(D) (D) (D) (D) (D) (D) (D)
11,469
11,554
Lilies, all California .............................. Florida ................................... Hawaii ................................... Illinois .................................... Michigan ............................... New Jersey ........................... New York .............................. North Carolina ....................... Ohio ...................................... Oregon .................................. Pennsylvania ........................ Texas .................................... Washington ........................... Other States
2 .......................
15 State total .........................
34 (D) (D) (D) (D) (D)
4 (D) (D) (D)
(D) (D) (D)
33
71
38 (D)
- 3
(D) (D)
6 (D) (D) (D)
5
(D) (D)
18
70
73,991 (D) (D) (D) (D) (D) 17
(D) (D) (D)
(D) (D) (D)
5,424
79,432
76,538 (D)
- 62
(D) (D) 11
(D) (D) (D)
169 (D) (D)
5,771
82,551
100 (D) (D) (D) (D) (D) 21
(D) (D) (D)
(D) (D) (D)
98
100
100 (D)
- 52
(D) (D)
6 (D) (D) (D)
92
(D) (D)
100
100
75.6 (D) (D) (D) (D) (D)
80.0 (D) (D) (D)
(D) (D) (D)
105.3
77.6
73.5 (D)
- 155.8
(D) (D)
120.0 (D) (D) (D)
156.3
(D) (D)
97.1
75.4
55,937 (D) (D) (D) (D) (D) 14
(D) (D) (D)
(D) (D) (D)
5,710
61,661
56,255 (D)
- 97
(D) (D) 13
(D) (D) (D)
264 (D) (D)
5,606
62,235
See footnote(s) at end of table. --continued
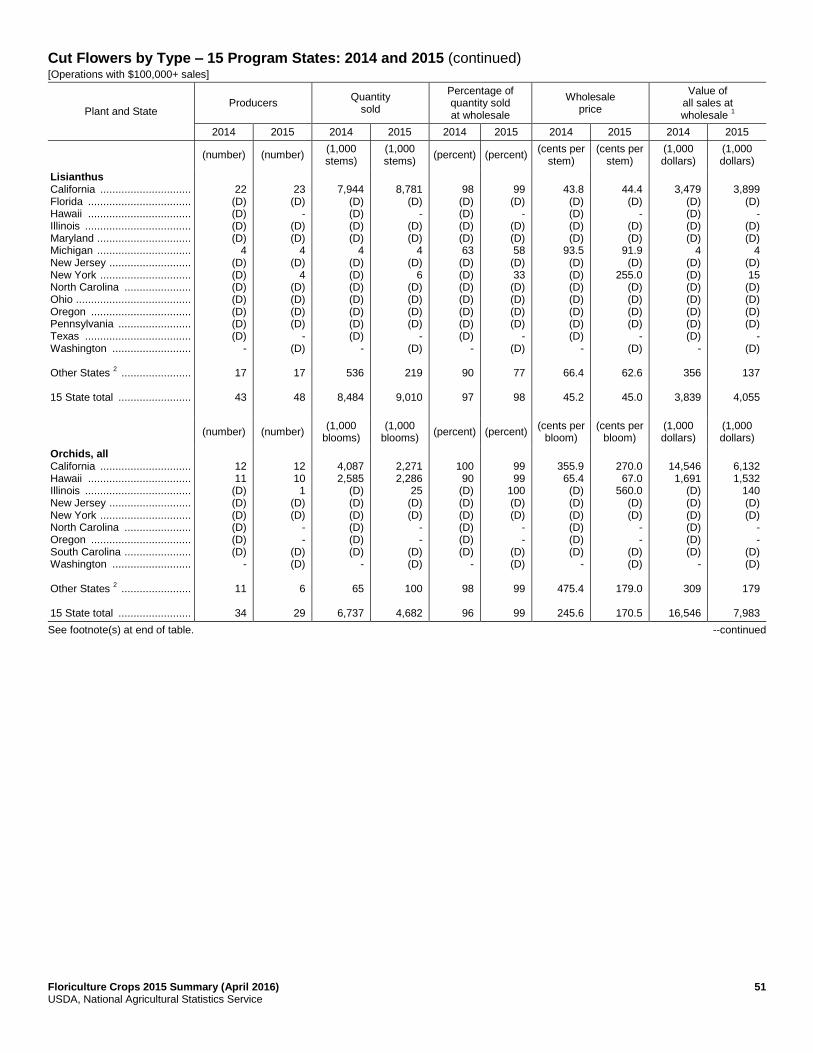
Floriculture Crops 2015 Summary (April 2016) 51 USDA, National Agricultural Statistics Service
Cut Flowers by Type – 15 Program States: 2014 and 2015 (continued) [Operations with $100,000+ sales]
Plant and State Producers
Quantity sold
Percentage of quantity sold at wholesale
Wholesale price
Value of all sales at wholesale
1
2014 2015 2014 2015 2014 2015 2014 2015 2014 2015
(number) (number) (1,000 stems)
(1,000 stems)
(percent) (percent) (cents per
stem) (cents per
stem) (1,000 dollars)
(1,000 dollars)
Lisianthus California .............................. Florida .................................. Hawaii .................................. Illinois ................................... Maryland ............................... Michigan ............................... New Jersey ........................... New York .............................. North Carolina ...................... Ohio ...................................... Oregon ................................. Pennsylvania ........................ Texas ................................... Washington .......................... Other States
2 .......................
15 State total ........................
22
(D) (D) (D) (D)
4 (D) (D) (D) (D) (D) (D) (D)
-
17
43
23
(D) -
(D) (D)
4 (D)
4 (D) (D) (D) (D)
- (D)
17
48
7,944
(D) (D) (D) (D)
4 (D) (D) (D) (D) (D) (D) (D)
-
536
8,484
8,781
(D) -
(D) (D)
4 (D)
6 (D) (D) (D) (D)
- (D)
219
9,010
98
(D) (D) (D) (D) 63
(D) (D) (D) (D) (D) (D) (D)
-
90
97
99
(D) -
(D) (D) 58
(D) 33
(D) (D) (D) (D)
- (D)
77
98
43.8 (D) (D) (D) (D)
93.5 (D) (D) (D) (D) (D) (D) (D)
-
66.4
45.2
44.4 (D)
- (D) (D)
91.9 (D)
255.0 (D) (D) (D) (D)
- (D)
62.6
45.0
3,479
(D) (D) (D) (D)
4 (D) (D) (D) (D) (D) (D) (D)
-
356
3,839
3,899
(D) -
(D) (D)
4 (D) 15
(D) (D) (D) (D)
- (D)
137
4,055
(number) (number) (1,000
blooms) (1,000
blooms) (percent) (percent)
(cents per bloom)
(cents per bloom)
(1,000 dollars)
(1,000 dollars)
Orchids, all California .............................. Hawaii .................................. Illinois ................................... New Jersey ........................... New York .............................. North Carolina ...................... Oregon ................................. South Carolina ...................... Washington .......................... Other States
2 .......................
15 State total ........................
12 11
(D) (D) (D) (D) (D) (D)
-
11
34
12 10 1
(D) (D)
- -
(D) (D)
6
29
4,087 2,585
(D) (D) (D) (D) (D) (D)
-
65
6,737
2,271 2,286
25 (D) (D)
- -
(D) (D)
100
4,682
100 90
(D) (D) (D) (D) (D) (D)
-
98
96
99 99
100 (D) (D)
- -
(D) (D)
99
99
355.9 65.4 (D) (D) (D) (D) (D) (D)
-
475.4
245.6
270.0
67.0 560.0
(D) (D)
- -
(D) (D)
179.0
170.5
14,546 1,691
(D) (D) (D) (D) (D) (D)
-
309
16,546
6,132 1,532
140 (D) (D)
- -
(D) (D)
179
7,983
See footnote(s) at end of table. --continued

52 Floriculture Crops 2015 Summary (April 2016) USDA, National Agricultural Statistics Service
Cut Flowers by Type – 15 Program States: 2014 and 2015 (continued) [Operations with $100,000+ sales]
Plant and State Producers
Quantity sold
Percentage of quantity sold at wholesale
Wholesale price
Value of all sales at wholesale
1
2014 2015 2014 2015 2014 2015 2014 2015 2014 2015
(number) (number) (1,000 stems)
(1,000 stems)
(percent) (percent) (cents per
stem) (cents per
stem) (1,000 dollars)
(1,000 dollars)
Roses, all California .............................. Florida ................................... Hawaii ................................... New Jersey ........................... New York .............................. Oregon .................................. Texas .................................... Washington ........................... Other States
2 .......................
15 State total .........................
19
- (D) (D) (D) (D)
3 (D)
5
27
21
(D) (D) (D) (D) (D)
- (D)
5
26
29,710
- (D) (D) (D) (D) 201 (D)
644
30,555
27,188
(D) (D) (D) (D) (D)
- (D)
624
27,812
93
- (D) (D) (D) (D)
- (D)
100
93
97
(D) (D) (D) (D) (D)
- (D)
100
97
55.5
- (D) (D) (D) (D)
55.9 (D)
89.6
56.2
60.6 (D) (D) (D) (D) (D)
- (D)
90.2
61.3
16,489
- (D) (D) (D) (D) 112 (D)
577
17,178
16,476
(D) (D) (D) (D) (D)
- (D)
563
17,039
(number) (number) (1,000 spikes)
(1,000 spikes)
(percent) (percent) (cents per
spike) (cents per
spike) (1,000 dollars)
(1,000 dollars)
Snapdragons California .............................. Florida ................................... Hawaii ................................... Illinois .................................... Maryland ............................... Michigan ............................... New Jersey ........................... New York .............................. North Carolina ....................... Ohio ...................................... Oregon .................................. Pennsylvania ........................ Other States
2 .......................
15 State total .........................
30
(D) (D) (D)
- (D)
5 9
(D) 5 3 5
10
67
36
(D) -
(D) (D) (D) (D) 13
(D) (D) (D)
5
18
72
40,183
(D) (D) (D)
- (D) 145 99
(D) 14 16
148
862
41,467
42,953
(D) -
(D) (D) (D) (D) 285 (D) (D) (D) 166
459
43,863
100 (D) (D) (D)
- (D) 74 25
(D) 36 95 57
96
99
99
(D) -
(D) (D) (D) (D) 10
(D) (D) (D) 58
84
98
24.0 (D) (D) (D)
- (D)
25.6 32.0 (D)
100.0 72.3 60.1
51.7
24.8
28.9 (D)
- (D) (D) (D) (D)
47.8 (D) (D) (D)
61.9
61.2
29.5
9,644
(D) (D) (D)
- (D) 37 32
(D) 14 12 89
446
10,274
12,413
(D) -
(D) (D) (D) (D) 136 (D) (D) (D) 103
281
12,933
See footnote(s) at end of table. --continued

Floriculture Crops 2015 Summary (April 2016) 53 USDA, National Agricultural Statistics Service
Cut Flowers by Type – 15 Program States: 2014 and 2015 (continued) [Operations with $100,000+ sales]
Plant and State Producers
Quantity sold
Percentage of quantity sold at wholesale
Wholesale price
Value of all sales at wholesale
1
2014 2015 2014 2015 2014 2015 2014 2015 2014 2015
(number) (number) (1,000 stems)
(1,000 stems)
(percent) (percent) (cents per
stem) (cents per
stem) (1,000 dollars)
(1,000 dollars)
Tulips California .......................... Florida .............................. Michigan ........................... New Jersey ....................... New York .......................... North Carolina .................. Ohio .................................. Oregon ............................. Pennsylvania .................... Texas ............................... Washington ...................... Other States
2 ...................
15 State total ....................
(D)
- 5
(D) (D) (D) (D)
5 (D) (D)
7
36
53
(D) (D)
5 (D) (D) (D) (D)
5 (D)
- 8
37
55
(D)
- 30
(D) (D) (D) (D)
5,000 (D) (D)
39,109
116,851
160,990
(D) (D) 29
(D) (D) (D) (D)
4,067 (D)
- 39,795
123,487
167,378
(D)
- 30
(D) (D) (D) (D) 100 (D) (D) 100
100
100
(D) (D) 29
(D) (D) (D) (D) 100 (D)
- 99
100
100
(D)
- 64.9 (D) (D) (D) (D)
29.8 (D) (D)
32.8
36.7
35.5
(D) (D)
64.0 (D) (D) (D) (D)
30.1 (D)
- 32.9
35.2
34.6
(D)
- 19
(D) (D) (D) (D)
1,490 (D) (D)
12,828
42,861
57,198
(D) (D) 19
(D) (D) (D) (D)
1,224 (D)
- 13,093
43,504
57,840
Other cut flowers California .......................... Florida .............................. Hawaii .............................. Illinois ............................... Maryland ........................... Michigan ........................... New Jersey ....................... New York .......................... North Carolina .................. Ohio .................................. Oregon ............................. Pennsylvania .................... Texas ............................... Washington ...................... Other States
2 ...................
15 State total ....................
110 4
25 6
(D) 8
17 18 7
(D)
21 10
(D) 10
9
245
103 5
26 5 4 7
16 16 7
(D)
20 7
(D) 8
6
230
(NA) (NA) (NA) (NA) (NA) (NA) (NA) (NA) (NA) (NA)
(NA) (NA) (NA) (NA)
(NA)
(NA)
(NA) (NA) (NA) (NA) (NA) (NA) (NA) (NA) (NA) (NA)
(NA) (NA) (NA) (NA)
(NA)
(NA)
99 100 89
100 (D) 95 98 46
100 (D)
97 91
(D) 99
90
98
95 100 91 91 64 93 97 42
100 (D)
97 89
(D) 99
75
95
(NA) (NA) (NA) (NA) (NA) (NA) (NA) (NA) (NA) (NA)
(NA) (NA) (NA) (NA)
(NA)
(NA)
(NA) (NA) (NA) (NA) (NA) (NA) (NA) (NA) (NA) (NA)
(NA) (NA) (NA) (NA)
(NA)
(NA)
76,663 1,888 4,481
974 (D) 913
7,009 830
1,865 (D)
10,045
796 (D)
5,965
577
112,006
92,799 1,873 5,432
518 430 871
8,219 580
2,976 (D)
9,176 1,045
(D) 5,286
930
130,135
- Represents zero. (D) Withheld to avoid disclosing data for individual operations. (NA) Not available. 1
Equivalent wholesale value of all sales. 2
Includes data withheld above.
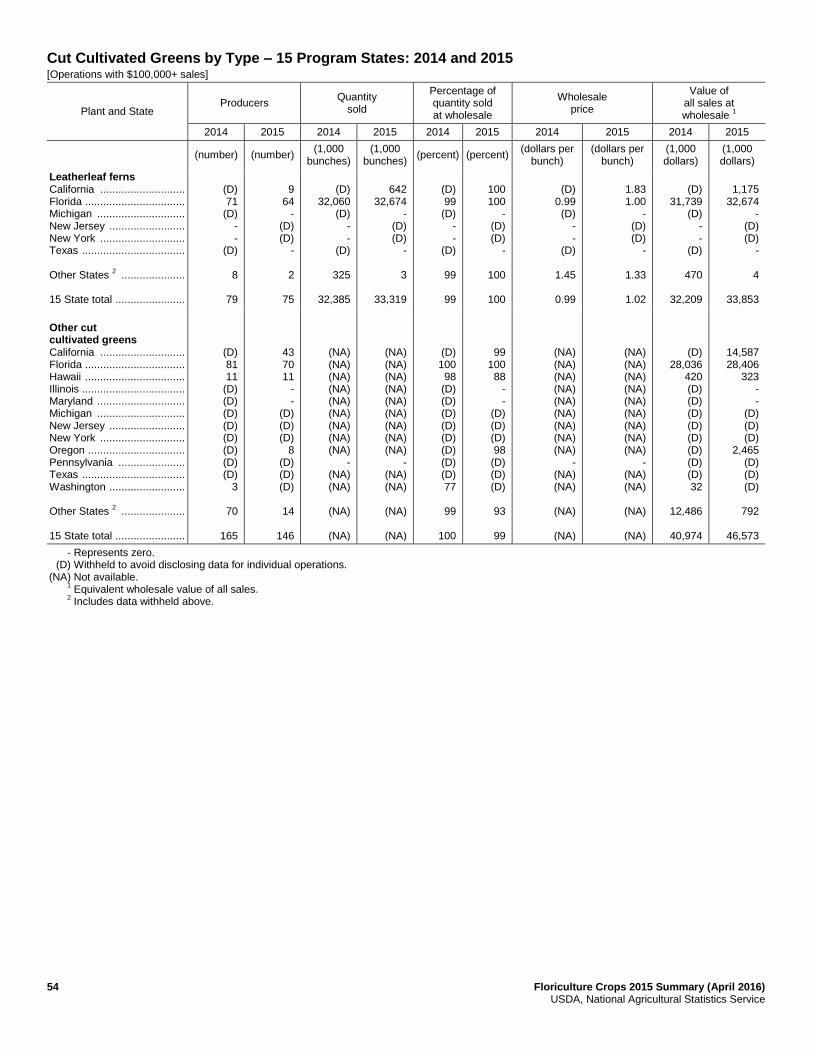
54 Floriculture Crops 2015 Summary (April 2016) USDA, National Agricultural Statistics Service
Cut Cultivated Greens by Type – 15 Program States: 2014 and 2015 [Operations with $100,000+ sales]
Plant and State Producers
Quantity sold
Percentage of quantity sold at wholesale
Wholesale price
Value of all sales at wholesale
1
2014 2015 2014 2015 2014 2015 2014 2015 2014 2015
(number) (number) (1,000
bunches) (1,000
bunches) (percent) (percent)
(dollars per bunch)
(dollars per bunch)
(1,000 dollars)
(1,000 dollars)
Leatherleaf ferns California ............................ Florida ................................. Michigan ............................. New Jersey ......................... New York ............................ Texas .................................. Other States
2 .....................
15 State total .......................
(D) 71
(D) - -
(D)
8
79
9
64 -
(D) (D)
-
2
75
(D)
32,060 (D)
- -
(D)
325
32,385
642
32,674 -
(D) (D)
-
3
33,319
(D) 99
(D) - -
(D)
99
99
100 100
- (D) (D)
-
100
100
(D)
0.99 (D)
- -
(D)
1.45
0.99
1.83 1.00
- (D) (D)
-
1.33
1.02
(D)
31,739 (D)
- -
(D)
470
32,209
1,175
32,674 -
(D) (D)
-
4
33,853
Other cut cultivated greens California ............................ Florida ................................. Hawaii ................................. Illinois .................................. Maryland ............................. Michigan ............................. New Jersey ......................... New York ............................ Oregon ................................ Pennsylvania ...................... Texas .................................. Washington ......................... Other States
2 .....................
15 State total .......................
(D) 81 11
(D) (D) (D) (D) (D) (D) (D) (D)
3
70
165
43 70 11
- -
(D) (D) (D)
8 (D) (D) (D)
14
146
(NA) (NA) (NA) (NA) (NA) (NA) (NA) (NA) (NA)
- (NA) (NA)
(NA)
(NA)
(NA) (NA) (NA) (NA) (NA) (NA) (NA) (NA) (NA)
- (NA) (NA)
(NA)
(NA)
(D) 100 98
(D) (D) (D) (D) (D) (D) (D) (D) 77
99
100
99 100 88
- -
(D) (D) (D) 98
(D) (D) (D)
93
99
(NA) (NA) (NA) (NA) (NA) (NA) (NA) (NA) (NA)
- (NA) (NA)
(NA)
(NA)
(NA) (NA) (NA) (NA) (NA) (NA) (NA) (NA) (NA)
- (NA) (NA)
(NA)
(NA)
(D) 28,036
420 (D) (D) (D) (D) (D) (D) (D) (D) 32
12,486
40,974
14,587 28,406
323 - -
(D) (D) (D)
2,465 (D) (D) (D)
792
46,573
- Represents zero. (D) Withheld to avoid disclosing data for individual operations. (NA) Not available. 1
Equivalent wholesale value of all sales. 2
Includes data withheld above.

Floriculture Crops 2015 Summary (April 2016) 55 USDA, National Agricultural Statistics Service
Propagative (Unfinished) Floriculture Materials Value of Sales by Category – 15 Program States: 2014 and 2015 [Operations with $100,000+ sales]
State
Annual bedding/garden
plants
Herbaceous perennial
plants
Potted flowering
plants
2014 2015 2014 2015 2014 2015
(1,000 dollars) (1,000 dollars) (1,000 dollars) (1,000 dollars) (1,000 dollars) (1,000 dollars)
California ............................. Florida ................................. Hawaii ................................. Illinois .................................. Maryland .............................. Michigan .............................. New Jersey .......................... New York ............................. North Carolina ..................... Ohio ..................................... Oregon ................................ Pennsylvania ....................... South Carolina ..................... Texas .................................. Washington ......................... Other States
1 ......................
15 State total .......................
51,282 (D)
- (D) (D)
46,614 10,444 13,546
(D) (D)
(D)
4,730 -
(D) 7,546
25,733
159,895
63,323 (D)
- (D) (D)
45,633 8,564
13,232 (D) (D)
42
5,282 -
244 5,823
18,913
161,056
13,801 25,013
- (D) 980
34,120 1,716 1,757
- (D)
7,043
16,903 -
5,482 (D)
7,213
114,028
11,083 23,203
- (D) (D)
32,850 (D)
1,367 (D) (D)
12,492 18,508
- 5,143
13,300
1,887
119,833
6,346 (D) 848 (D) (D)
1,710 (D)
2,274 (D) (D)
(D) 155
- 753 (D)
21,566
33,652
15,537 (D) 938 (D) (D)
4,728 (D)
1,923 (D) (D)
(D) 260 (D) 841 (D)
26,640
50,867
State
Foliage plants for indoor
or patio use
Cut flowers
Cut cultivated
greens
2014 2015 2014 2015 2014 2015
(1,000 dollars) (1,000 dollars) (1,000 dollars) (1,000 dollars) (1,000 dollars) (1,000 dollars)
California ............................. Florida ................................. Hawaii ................................. Illinois .................................. Michigan .............................. New Jersey .......................... New York ............................. North Carolina ..................... Ohio ..................................... Oregon ................................ Pennsylvania ....................... Texas .................................. Washington ......................... Other States
1 ......................
15 State total .......................
(D) 19,686
(D) -
(D) -
(D) (D)
- (D)
(D) (D)
-
6,302
25,988
(D) 35,619
(D) -
(D) - -
(D) -
(D)
(D) (D) (D)
11,854
47,473
8,988 -
(D) (D) (D)
- - - -
(D)
- -
(D)
(D)
(D)
8,823 -
(D) 1
(D) - - -
(D) (D)
(D)
- (D)
696
9,520
- - - - -
(D) - - - -
- - -
(D)
(D)
(D) - - -
(D) (D)
- - - -
- -
(D)
4,968
4,968
- Represents zero. (D) Withheld to avoid disclosing data for individual operations. 1
Includes data withheld above.
56 Floriculture Crops 2015 Summary (April 2016) USDA, National Agricultural Statistics Service
Statistical Methodology
Survey Procedures: The statistics contained in this report represent data from all known growers in the 15 Program
States with $10,000 or more in annual gross sales (both retail and wholesale) of fresh cut flowers, potted flowering plants,
foliage plants, annual bedding and garden plants, herbaceous perennials, cut cultivated florist greens, propagative
floriculture material, and/or unfinished plants.
The data for the 2014 crop year were collected in the 2014 Census of Horticulture Specialties, while the data for crop year
2015 were collected on the 2016 Commercial Floriculture Survey. For both surveys, producers received a pre-survey
letter explaining the survey along with a questionnaire to complete and return by mail. Producers who do not respond by
mail are contacted by phone or personal interview to attempt to gather the data.
The data in this report for annual bedding and garden plants, potted herbaceous perennials, potted flowering plants for
indoor and patio use, foliage plants for indoor or patio use, cut flowers, cut cultivated greens, and propagative floriculture
materials are summarized only from growers with $100,000 or more in annual sales. The data summarized in tables
showing grower numbers, hired workers, and growing area represent all growers having sales of $10,000 or more. The
area and labor statistics will not be comparable between the two published years as they will include nursery production
area and labor for 2014 due to combined data collection efforts with the 2014 Census of Horticulture Specialties. The
tables showing selected Hawaiian flower crops include data for all operations with sales at, or above, the $10,000 level.
Estimating Procedures: Since reports are not received from every known operation, estimates are made for missing
reports to make the survey complete. All survey data are thoroughly reviewed at the State and national levels for
reasonableness and consistency with historical levels. Final estimates also included a coverage adjustment to account for
list incompleteness. Data are summarized to aggregate totals, which are carefully reviewed to ensure that published totals
do not allow any individual data to be revealed.
Revision Policy: The estimates published in the 2014 Census of Horticulture Specialties were considered final and no
revisions were made to the 2014 floriculture crop estimates in this publication with the exception of a coverage
adjustment to account for list incompleteness. The 2015 estimates will be subject to revision based on availability of
additional data in 2017.
Reliability: The survey results are subject to non-sampling errors such as omission, duplication, imputation of missing
data, and mistakes in reporting, recording, and processing the data. These errors cannot be measured directly, but are
minimized through rigid quality controls in the data collection process and a careful review of all reported data for
consistency and reasonableness.
.

Floriculture Crops 2015 Summary (April 2016) 57 USDA, National Agricultural Statistics Service
Survey Definitions
Floriculture Crop: Any item considered in the categories of annual bedding and garden plants, potted herbaceous
perennials, potted flowering plants for indoor and patio use, foliage plants for indoor or patio use, cut flowers, cut
cultivated greens, and propagative floriculture materials.
Commercial Producer: Any operation which produces any commodity listed above and whose gross sales total $10,000
or more during the calendar year.
Area Used for Production: Greenhouse, other covered space, and outdoor area used for the production of floriculture
crops. Walkways and aisles are included. Multiple uses of the same area are counted only once, without counting crop
turns. Covered area includes glass, rigid plastic and film plastic greenhouses, and shade houses.
Quantity Sold: Represents both retail and wholesale sales in the calendar year shown. Flowers, plants, or materials
purchased from others for immediate re-sale are excluded.
Expanded Wholesale Value: Value of all crops grown, at wholesale, for growers with sales of floriculture crops of
$10,000 or more. This figure is the sum of two parts. The first is the wholesale value of sales as reported by operations
with $100,000 or more in sales. The second part is an estimated value for operations with sales between $10,000 and
$99,999. The value is derived by multiplying the number of producers in each range of sales by the mid-point of the
range.
Value of All Sales at Wholesale: Equivalent wholesale value of all sales. It is derived by multiplying the average
wholesale price by the total quantity sold (both retail and wholesale). Wholesale prices are on a gross basis before
deductions for sales commissions, transportation charges, or other similar deductions.
58 Floriculture Crops 2015 Summary (April 2016) USDA, National Agricultural Statistics Service
Information Contacts
Listed below are the commodity statisticians in the Crops Branch of the National Agricultural Statistics Service to contact
for additional information. E-mail inquiries may be sent to [email protected]
Lance Honig, Chief, Crops Branch ....................................................................................................... (202) 720-2127
Jorge Garcia-Pratts, Head, Fruits, Vegetables and Special Crops Section ............................................ (202) 720-2127
Vincent Davis – Fresh and Processing Vegetables, Onions, Strawberries,
Sugarbeets, Sugarcane, Cherries ................................................................................................ (202) 720-2157
Fleming Gibson – Citrus, Coffee, Tropical Fruits ............................................................................ (202) 720-5412
Greg Lemmons – Berries, Cranberries, Potatoes, Sweet Potatoes .................................................. (202) 720-4285
Dave Losh – Hops ............................................................................................................................ (360) 709-2400
Dan Norris – Austrian Winter Peas, Dry Edible Peas, Lentils, Mint,
Mushrooms, Peaches, Pears, Wrinkled Seed Peas, Dry Beans .................................................. (202) 720-3250
Daphne Schauber – Floriculture, Grapes, Maple Syrup, Nursery, Tree Nuts ................................. (202) 720-4215
Chris Singh – Apples, Apricots, Plums, Prunes, Tobacco .............................................................. (202) 720-4288

Access to NASS Reports For your convenience, you may access NASS reports and products the following ways:
All reports are available electronically, at no cost, on the NASS web site: http://www.nass.usda.gov
Both national and state specific reports are available via a free e-mail subscription. To set-up this free
subscription, visit http://www.nass.usda.gov and click on “National” or “State” in upper right corner above
“search” box to create an account and select the reports you would like to receive.
For more information on NASS surveys and reports, call the NASS Agricultural Statistics Hotline at (800) 727-9540,
7:30 a.m. to 4:00 p.m. ET, or e-mail: [email protected].
The U.S. Department of Agriculture (USDA) prohibits discrimination against its customers, employees, and applicants for
employment on the basis of race, color, national origin, age, disability, sex, gender identity, religion, reprisal, and where
applicable, political beliefs, marital status, familial or parental status, sexual orientation, or all or part of an individual's
income is derived from any public assistance program, or protected genetic information in employment or in any program
or activity conducted or funded by the Department. (Not all prohibited bases will apply to all programs and/or
employment activities.)
If you wish to file a Civil Rights program complaint of discrimination, complete the USDA Program Discrimination
Complaint Form (PDF), found online at http://www.ascr.usda.gov/complaint_filing_cust.html, or at any USDA office, or
call (866) 632-9992 to request the form. You may also write a letter containing all of the information requested in the
form. Send your completed complaint form or letter to us by mail at U.S. Department of Agriculture, Director, Office of
Adjudication, 1400 Independence Avenue, S.W., Washington, D.C. 20250-9410, by fax (202) 690-7442 or email at