united states: entry, startup activities, and the launch ... · business creation in the united...
TRANSCRIPT
Business Creation in the United States: Entry, Startup Activities, and the Launch of New Ventures 165
7�business creation in the united states: entry, startup activities, and the launch of new ventures
synopsisnew businesses are significant contributors to the growth and productivity of the u.s. economy. Their importance warrants ongoing research efforts to develop relevant data sources with which to explore the dynamics of the business creation process.1 while a number of datasets are representative of the u.s. business population, only one—the panel study of entrepreneurial dynamics (psed)—defines a nationally representative sample of entrepre-neurs who are in the process of starting a new business. This dataset permits detailed analysis of specific stages of the business creation process from the entrepreneur’s initial idea to the successful creation of a functioning new busi-ness. it permits measurement of the elusive concept of “entrepreneurship” in terms of new firm creation—an accepted feature of most working definitions of entrepreneurship.
significant research analyzing the business creation process has been based on the psed dataset. results of this research indicate that the extent of busi-ness creation in the united states is enormous. in 2005, more than 12 million individuals were involved in starting more than 7 million ventures. in addi-tion, the factors affecting entrepreneurial behavior have been found to be more complex than previously thought. socio-demographic factors including age, gender, and ethnic background appear to have a major impact on who is entre-preneurial and participates in the business creation process. individuals and
1 This chapter was prepared by paul d. reynolds, Florida international university, and richard t. curtin, university of Michigan, both co-principal investigators on the first and second panel studies of entrepreneurial dynamics (psed i and ii). The psed i project was sponsored by the 34 member units of the entrepreneurial research consortium, which included the u.s. small business adminis-tration (sba) office of advocacy, two national science Foundation grants (9809841 and 9905255), and the ewing Marion Kauffman Foundation; the primary sponsor of psed ii was the Kauffman Foundation with funding from the office of advocacy. analysis and interpretation are those of the authors and not of the sba office of advocacy.
166 The Small Business Economy
teams develop and implement new firms with diverse procedures. existing evi-dence indicates there is no one way to successfully start and grow a new firm.
research on factors associated with success of a new firm startup sug-gests that personal background and socio-demographic attributes of individual entrepreneurs or entrepreneurs who work in teams have much less to do with business success than what these entrepreneurs actually accomplish in the early phases of the business creation process. The creativity and hard work of the entrepreneurs in the early phases, rather than their personal backgrounds, are key to successfully creating a viable new firm. according to one estimate, the amount of uncompensated time entrepreneurs devote to starting new firms is enormous—7.7 billion hours in 1999 and 9.9 billion hours in 2005. These hours equaled 2.1 percent of total paid work in the united states in 1999 and 2.7 percent in 2005. This entrepreneurial activity is equal to almost one-half of the work hours for all u.s. self-employed workers for those years (20 billion hours in 1999 and 18 billion hours in 2005).
The time required for an entrepreneur to start a business varies widely. only one-third of entrepreneurs will actually have a working business within the first six years. over the same period, another one-third of these nascent entrepreneurs will disengage. yet another one-third of these entrepreneurs will not have gotten past the earliest stages of the firm creation process in six years.
prior analyses of new firm creation suggest that u.s. business creation activity has been stable over the past several decades. entrepreneurship has been an integral part of american economic life and a viable personal career option. while the united states retains its status as a premier location for entrepreneurship activity, new firm creation and innovation, there is evidence of growing global competition. For example, international comparisons indi-cate a significant increase in entrepreneurship and new firm creation in asia—particularly related to growth-oriented new ventures. if the united states is to retain its competitive position, various approaches will be needed to facilitate entrepreneurship and new firm creation. These include enhancing the skills of individuals and teams of entrepreneurs and helping these innovators move beyond the early stages of a business idea to the implementation of a profitable new business.
Business Creation in the United States: Entry, Startup Activities, and the Launch of New Ventures 167
introductionbusiness creation began to attract attention in the sixteenth century, when a cadre of observers began to write about social and economic phenomena. it was noticed that some individuals specialized in organizing the resources—money, people, suitable locations—for a new venture or initiative. This led to the creation of the concept of an ”entrepreneur,” or someone who engages in “entrepreneurial” activities. The amount of writing about entrepreneurship expanded considerably in the latter part of the twentieth century, reflecting widespread recognition of many contributions from entrepreneurial initiatives. despite the substantial increase in attention from scholars and policymakers, detailed research on the entrepreneurial process itself has been modest. This gap has reflected both the amorphous nature of entrepreneurship and the lack of procedures for producing representative samples of entrepreneurs to scien-tifically investigate the business creation process.
This chapter describes the first systematic studies of business creation that utilize samples representative of the u.s. population of nascent entrepreneurs. The panel study of entrepreneurial dynamics (psed) research program pro-vides—for the first time—a detailed description of how modern entrepreneurs create new businesses. while this unique national resource is relatively new, the research program has been widely imitated and has generated considerable analysis,2 which has substantial implications for practitioners and policymak-ers. This overview summarizes the justification for the research program,3 the methodological protocol, and a selection of the major findings.4
conceptions of entrepreneurship Few concepts are more ambiguous than “entrepreneurship.” The French word “entrepreneur” originally described an individual “who unites all means of production and who finds in the value of the products … the
2 an extensive and useful summary of the analysis based on psed-based studies is found in davidsson, 2006.
3 Major sources for this review include reynolds, 2000; Gartner, et al., 2004; reynolds, 2007; and reynolds and curtin, 2008. Full details and datasets related to the research program are available on the project website, http://www.psed.isr.umich.edu.
4 as of december 2007, nine dissertations and theses, seven books and monographs, 45 peer-reviewed journal articles, eight book chapters, and five dozen conference presentations had utilized the psed datasets; the current bibliography of psed-based scholarly works is available on the project website, http://www.psed.isr.umich.edu.
168 The Small Business Economy
reestablishment of the entire capital he employs, and the value of the wages, the interest, and rent which he pays, as well as profits belonging to himself.”5 in other words, the entrepreneur is the person or team that establishes a venture. early english translators did not know whether to use the term “undertaker” or “adventurer” to describe such individuals. The entrepreneurial concept reflects the idea of opportunity recognition and success as a coordinator and administrator but does not necessarily imply creating something new or innovative. it does imply that the entrepreneur bears some risk or uncertainty,6 including excessive optimism about the extent of a business opportunity.
The idea that entrepreneurship is a positive contribution to economic adap-tation and change was conveyed by the idea of “creative destruction.”7 it was suggested that the creation of new productive activities led to the beneficial replacement of existing firms, displacing them with firms that provided new goods and services or that used new productive mechanisms to provide estab-lished commodities more efficiently. some now consider “innovative entrepre-neurship” as the only form worthy of serious attention;8 others have suggested that only those few new firms receiving venture capital support, about 200 each year, make significant contributions.9 identifying the level of innovation or impact on markets that is to be considered “real” entrepreneurship has not been resolved conceptually or operationally.
another trend has been to focus on “opportunity recognition,” or how entrepreneurs identify markets for new goods and services.10 it has been sug-gested that opportunity recognition should be the central feature of entre-preneurial research.11 opportunities, however, are difficult to recognize until they have already been exploited. it is even harder to classify the quality of an opportunity. a new venture that grows quickly may be exploiting a “major opportunity,” and therefore may be labeled “entrepreneurial.” The concept of entrepreneurship can be applied to an active participant in any market, such
5 say, 1816.
6 cantillon, 1730; Knight, 1921.
7 schumpeter, 1934.
8 baumol, litan, and schramm, 2007.
9 shane, 2008, 162.
10 penrose, 1959; Kirzner, 1979.
11 shane and venkataranam, 2001.
Business Creation in the United States: Entry, Startup Activities, and the Launch of New Ventures 169
as managers in commercial firms, now referred to as “intrapreneurs,” or even administrators or officials in government organizations or not-for-profits, often referred to as “social entrepreneurs.”
perhaps the idea that entrepreneurs have unique dispositions or personali-ties has derived from observations that individuals who organize inputs to cre-ate a new good or service often seem very focused and driven.12 Many think that entrepreneurs have a need for achievement13 or a preference for risk.14 however, research efforts to define an “entrepreneurial personality” have found few stable empirical relationships (stylized facts or empirical generalizations).15
individuals generally experience major life events—marriage, occupational choice—within a social network or group. similarly, creating a new firm is gen-erally done in a network of social relationships.16 Therefore, entrepreneurship can be considered a social phenomenon as much as an individual career choice.
intrinsic to all conceptions of entrepreneurship is the idea that some type of new business venture is created, whether through part-time self-employ-ment or a substantial organization involving hundreds. a key question that follows relates to the types of individual behavior that lead to the creation of these new ventures.
why care about Firm creation? why is firm creation important? Most significant is that new ventures replen-ish and maintain the population of operating firms, which in turn power the u.s. economy. The annual increase in u.s. employer firms has averaged 1.0 per 100 existing firms from 1990 through 2006. This reflects an average birth rate of 10.8 births per 100 firms, less an annual firm death rate of 9.8 per 100 firms.17 by 2006 more than 600,000 new employer firms were being added to
12 Kets de vries, 1985.
13 Mcclelland, 1961.
14 Knight, 1921.
15 Gartner, 1988.
16 aldrich, 2005; reynolds, 1991; Thornton, 1999.
17 employer firm counts for 1989 through 2006 from u.s. small business administration, 2007, table a.1 and employer firm births and deaths from table a.2. birth and death rates used total employer firms in the previous year as the base.

170 The Small Business Economy
the economy each year—one for every 200 employed persons. new firm cre-ation is central to economic growth in the united states.
Firm creation has important economic implications. First, new firms have generated new sectors or markets—from automobiles to computers to consumer services. The emergence of new sectors reflects a flurry of new firm creation.18
second, initial assessments of the impacts of entrepreneurship and new firm creation focused on net job gains by size19 which led to substantial con-troversy over the impacts of small versus large firms.20 The most recent evi-dence indicates that new independent firms are the source of half of all net job creation; the other half is accounted for by new branches and subsidiaries, reflecting expansions of existing firms. in fact, the net job creation of all firms, branches, and establishments more than a year old is negative. after one year, losses from contractions and discontinued firms are greater than the job gains from expansions.21
Third, longitudinal datasets on u.s. firms have made it possible to estimate the labor productivity of new, existing, and discontinuing businesses. it turns out that new firms have the highest labor productivity and are responsible for a major share of increases in sector productivity. while this varies by sector—new firms are responsible for almost 100 percent of the productivity gains in retail and perhaps 30 percent in manufacturing—new firms are critical to the efficient production of goods 22 and displace less efficient existing firms.
Fourth, new and small firms are a major source of technical and market innovations. one effort to track the source of technical innovation by firm size found that small firms produced one-half of new innovations.23 small firms are also a major source of market changes.24
Fifth, researchers have investigated the relationship between measures of new firm creation and national and regional economic growth. There is consis-tent evidence of a modest positive association between the level of new entries
18 hannan and Freeman, 1989; carroll and hannan, 2000; Klepper, 2002.
19 armington and odle, 1982; birch, 1997, 1981; schreyer, 1966.
20 brown, Medoff, and hamilton, 1990; davis, haltiwanger, and schuh, 1996.
21 acs and armington, 2004.
22 Foster, haltiwanger, and Krizan, 2002; Foster, haltiwanger, and syverson, 2005.
23 audretsch, 1995.
24 baumol, 2005.
Business Creation in the United States: Entry, Startup Activities, and the Launch of New Ventures 171
or firm births in regions or countries, and economic growth in subsequent periods. while the causal mechanisms have yet to be clarified, the association is a robust finding.25
There is also evidence that entrepreneurs have higher job satisfaction than those working for others.26 The capacity to create a business is an important career goal for a substantial number of those in the work force. estimates from the psed samples suggest that in 2006 about 12.6 million u.s. nascent entre-preneurs were involved in about 7.4 million nascent enterprises27—more than the number of people who marry or become parents annually. by the time they reach retirement, almost half of all men in the work force will have a period of self-employment.28
Finally, new firm creation is a major mechanism for immigrants to inte-grate themselves into the economy.29 it is also a major route to enhanced eco-nomic status for many, including women and minorities who may find limited advancement opportunity in their jobs.30
resources for tracking business dynamicswhat data resources are currently available to analyze the firm creation pro-cess in the u.s. economy? a panel of experts convened to report on this issue for the national academy of sciences recently completed a study of busi-ness dynamics.31 a summary of their business dynamics conceptual framework is presented in appendix 7a as Figure 7a.1. The presentation is organized around two major business phenomena: the business entity’s life course and the work career of typical individuals.
This framework posits that two major processes lead to the conception of a new business. one process involves individuals shifting into the startup mode after a work career as employees holding jobs; the other involves individuals
25 acs and armington, 2006; audretsch, Keilbach, & lehmann, 2006; van stel and Thurik, 2004.
26 blanchflower and oswald, 1998.
27 reynolds and curtin, 2008, 172.
28 reynolds and white, 1995, 5.
29 aldrich and waldinger, 1990; light and bonacich, 1988; portes and rumbaut, 2006.
30 reynolds, carter, Gartner, and Greene, 2004.
31 haltiwanger, lynch, and Mackie, 2007.
172 The Small Business Economy
initiating new firms as part of current job requirements, representing a startup sponsored by an existing firm.
The major purpose of the conceptual framework is to identify existing datasets for research on business and career dynamics. a total of 26 different datasets were identified as relevant to some aspect of firm creation and busi-ness dynamics; they are listed at the bottom of Figure 7a.1. only one dataset, the panel study of entrepreneurial dynamics (psed), provides information based on a representative national sample that permits detailed analysis of the firm creation process. The psed provides data describing the startup phase of the business dynamic processes. a wide range of issues can be addressed about both entrepreneurial activity and business dynamics, for example:
Entrepreneurial Activity
• Who gets involved in creating a new business?
• How many nascent entrepreneurs/nascent enterprises exist?
• What do nascent entrepreneurs do to create a new firm?
• How long does it take to reach a resolution—a new firm or disengage-ment—after entry into the startup process?
• What is the social cost, in terms of sweat equity and personal invest-ments, associated with the firm creation process?
• how many individuals must implement how many firms to create one firm with substantial growth potential?
Business Dynamics
• To what extent are new firms based on advances in technology and science?
• What proportion of nascent enterprises complete the process to become a new firm?
• What is unique about nascent enterprises that become new businesses, compared with those that do not make the firm birth transition?
Business Creation in the United States: Entry, Startup Activities, and the Launch of New Ventures 173
• What is unique about the new firms expecting to have a substantial growth trajectory after launch?
• How do the startup procedures and strategies affect the trajectory of firms once they are launched?
all of these issues have great relevance for efforts to promote new firm creation and improve the efficiency of the process. without information on these issues, policies designed to increase the level of entrepreneurial activity could be ineffective or counterproductive.
identifying entrepreneurial activity serious analysis of the firm creation process has been complicated by the lack of representative samples of nascent entrepreneurs, individuals actively involved in business creation. a number of proxy measures have been employed, with mixed results. These have included measures of self-employment,32 new busi-ness registrations,33 and new participants in markets (or market entry).34 another strategy has been to utilize samples of convenience. none are fully satisfactory as indicators of the entrepreneurial or business creation process and data for these measures do not allow an adequate representation of busi-ness creation activity.
self-employment is widely available as a measure of labor force activity; it generally refers to a person working on their own account, full- or part-time, without any employees. in a sense, the self-employed represent the smallest pos-sible business venture. Most are established, some are new. in some u.s. datasets a person managing such a business that has formally incorporated is considered a manager, even though there may be no employees—hence the distinctions between the unincorporated and incorporated self-employed.35 self-employment is often considered a “labor force activity” option, like full-time work, or being disabled or retired. as a choice offered for selection as “the” primary labor force
32 see examples of research on self-employment in blanchflower, 2000; evans and leighton, 1989; le, 1999; and parker, 2004.
33 spletzer et al, 2004; u.s. small business administratin, 2004; or the dun and bradstreet dun’s Mar-ket ideitifier files.
34 orr, 1974; Geroski, 1995.
35 u.s. department of commerce, 2002, 4-5.
174 The Small Business Economy
activity, self-employment does not capture individuals pursuing new firm cre-ation while they have other established job or work responsibilities.
one assessment has been designed to capture those in the process of becoming self-employed.36 using the panel nature of the current population survey samples, those individuals that change status from no self-employed work to more than 15 hours a week in self-employment in two consecutive monthly interviews are considered “entrepreneurial”—but only for that month. while this captures some aspects of a transition into self-employment, the lack of information on the nature of the new business activity or any other form of business creation suggests it may capture only a narrow aspect of the busi-ness creation process. The procedure also excludes individuals pursuing firm creation while they are employed or considered self-employed—more than 80 percent of those involved in firm creation.
Much research has been based on capturing new additions to an existing registry of firms, such as state lists of new incorporation filings, new employee establishments in the bureau of labor statistics unemployment insurance data files,37 new employer firms filing federal social security payments for the first time,38 or new listings in the dun and bradstreet credit rating files.39 in these examples it is possible to track the presence and scope of new ventures after they are incorporated into the registry, but there is little information about the point in the business creation process when they were incorporated into the registry, what preceded the registry listing, or the nature of startup initiatives that were abandoned prior to incorporation into the registry.
perhaps equally significant, a new registry listing is triggered by events that can have a tangential relationship to the economic activity of the new business. not all new incorporated businesses are active producers of goods or services or active as buyers of goods, services, supplies, labor, equipment, and the like. Those filing state unemployment insurance or federal social security payments for the first time may have employees, but they may not be selling goods or ser-vices and may never become profitable businesses. a new listing in the dun and bradstreet files may reflect a new venture that is purchasing goods or services,
36 Fairlie, 2006.
37 business employment dynamics (bed); haltiwanger, lynch, and Mackie, 2007, 160.
38 see, for example, the business information tracking series (bits); haltiwanger, lynch, and Mack-ie, 2007, 174.
39 dun’s Market identifier files, haltiwanger, lynch, and Mackie, 2007, 160.

Business Creation in the United States: Entry, Startup Activities, and the Launch of New Ventures 175
but may not have any sales or revenue and would not be considered an operating business. a registry listing is not directly related to active participation in the economy as either a buyer or seller or functioning as a profitable firm.
in brief, reports of self-employment, entry into self-employment, or a new listing in a business registry, have an ambiguous relationship to the presence of a functioning business activity. one primary reason for the development of the psed research protocol was to provide a more complete description of the business creation process from conception to profitable operation, using a research design that would identify that point in the process when the new ventures would be incorporated in the major business registries.
two strategies are widely employed for developing samples of various populations of firms. one is to identify a population of firms—based on their economic sector or organizational type—and utilize procedures to attempt to identify them all using historical records to determine evidence of an initial startup.40 This may be done by examining historical records to locate the first evidence of the presence of a startup effort or some activity related to the start-up.41 while a complete census of new entities ensures that inferences to the population are appropriate, it is not clear how this unique population might represent new firms in all economic sectors.
another strategy for developing a sample simply uses available lists of firms that might be considered new, with no analysis of historical records and therefore little concern for how these entities enter into the listings. This includes the Inc. magazine list of 500 high-growth new businesses,42 the files of a university technology transfer office,43 applications for financing submitted to a venture capital firm,44 or even new entries in the phone book yellow page listings.45 in such cases the population represented by the sample is a complete mystery, and how to extrapolate the findings beyond the sample is unknown. retrospective accounts of extremely successful new ventures—such as Federal
40 This has been popular in studies of organizational population ecology (hannan and Freeman, 1977; caroll and hannan, 2000) or industry studies (Klepper, 2002).
41 This might be using lists of new incorporations (eeisenhardt and schoonhoven, 1990; schoonhoven and eisenhardt, 1990) or first use of critical technology (Zucker, darby, and brewer, 1998).
42 bhide, 2000.
43 roberts, 1991.
44 Kaplan, sensoy, and stromberg, 2005.
45 shapero and Giglierano, 1982.
176 The Small Business Economy
express, Microsoft, or wal-Mart—can be fascinating,46 but the absence of any information on a comparison group of unsuccessful firms limits inferences about the basis for their success.
neither strategy allows a reasonable extrapolation from the samples to the total u.s. population of nascent entrepreneurs or nascent enterprises.
From inception, the psed research protocol was designed to create rep-resentative samples of all new firm creation, to provide confidence that the samples would represent all sectors, and to facilitate extrapolation to the total population of u.s. nascent enterprises or businesses in creation.
psed conceptual Model The major objectives of this research program are to (1) provide a comprehen-sive, objective description of the business creation process, and (2) assemble data that can facilitate theory development and hypothesis testing regarding new firm creation. The research design is based on the assumption that the major elements affecting the emergence of a new firm are not the direct result of macroeconomic conditions, the availability of government programs, the entrepreneurial climate, the presence of friendly financial institutions, supportive family and friends, or speeches by politicians. The impact of all these contextual factors is assumed to be mediated by the direct actions taken by individuals.
people create new firms. The psed research program is a study of who they are, how they react to their personal and work career context, and what they do to implement a new business.
The research requires precise operational definitions of the major fea-tures of this process, including measures that capture the critical transition points from one phase to another. This framework reflects a general view of the firm creation process (Figure 7.1) and assumes that individuals pass through the first phase when they begin to take some action to create a new firm. These actions may have been taken on their own behalf or as part of their job at an existing firm. Thus, nascent entrepreneurs are drawn from the adult population as independent nascent entrepreneurs or from an existing business as “nascent intrapreneurs.” There are two potential second stages: “new firm creation” or “disengagement.”
46 trimble, 1993 (Federal express); ichbiah and Knepper, 1991 (Microsoft) ; and vance and scott, 1994 (wal-Mart).

Business Creation in the United States: Entry, Startup Activities, and the Launch of New Ventures 177
Figure7.1BusinessLifeCourse,ContextandTransitions
a new firm is defined as a profitable business venture that offers goods or services in the market. Following birth, these entities pass through phase two, where young firms become established firms, and eventually to a final phase as their economic usefulness declines and they terminate. The alternative for nascent entrepreneurs is disengagement from the startup process. a substantial proportion of entrepreneurs, however, seem to be involved in a third option: they remain in the startup process for a long period of time, never achieving a clear resolution. The firm creation process occurs in a social, political, eco-nomic, and historical context.
at conception, a new firm, in the psed paradigm, is one that has begun to show profits (operationally defined as positive monthly cash flow for three or more months). Much analysis in economics and elsewhere focuses on markets.47 From another perspective, this leads to defining a new business as an active participant in a market, whether or not it is profitable.48 a number of well-known, successful businesses were active for long periods of time before they actually became profitable, such as amazon.com, or usa today. nascent enterprises that are active participants in markets as buyers of goods
47 haltiwanger, lynch, and Mackie, 2007, 32.
48 Markets are exchanges between buyers and sellers; a new participant, either as a buyer or seller, is of considerable interest. a new participant may affect the quantity or price of transactions. whether or not the new participant (a person, household, or new business venture) is financially solvent is irrelevant.
Adult Population
Nascent Entrepreneurs
Nascent Intrapreneurs
BusinessPopulation
Conception
Disengage
Start-up Process New Firm
Firm Birth
EstablishedFirm Termination
Social, Political, Economic, Historical Context
178 The Small Business Economy
and services can be identified in the dataset, but the conceptual and opera-tional criteria for a “new firm birth” are related to profitability.
psed research protocol49
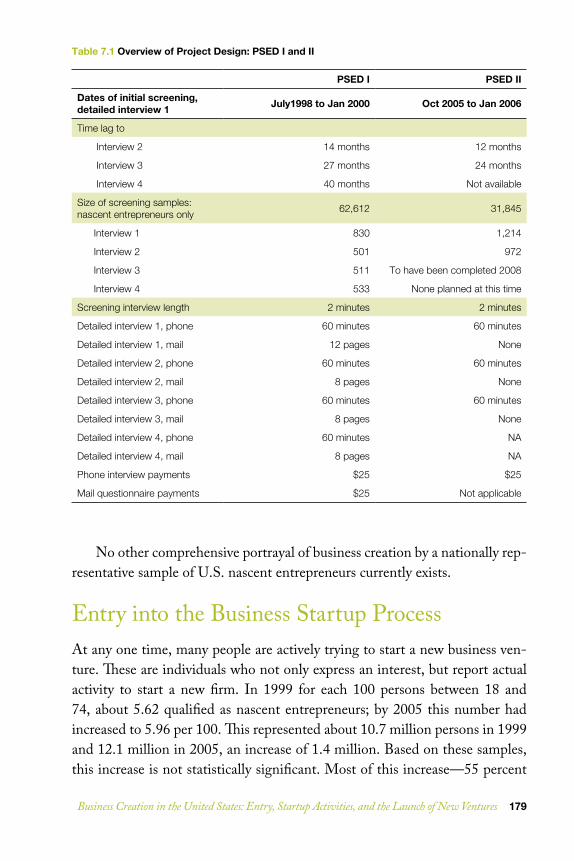
The u.s. panel study of entrepreneurial dynamics (psed) research program consists of two longitudinal projects. psed i was based on a representative sample of nascent entrepreneurs identified in 1998–2000 and contacted again three times over the following four years. psed ii is based on a representative sample of nascent entrepreneurs identified in late 2005 and early 2006 with follow-ups at 12 and 24 months.50 although there is a six-year lag between the screenings to select the nascent entrepreneur cohorts in these two projects, the research procedures were almost identical. The basic design is summarized in table 7.1.
The procedure, discussed in more detail in the appendix, has three stages. The first is screening a representative sample of adults to locate those that could be considered candidate nascent entrepreneurs. Those that met certain criteria—considered themselves to be creating new businesses, had been active in the past 12 months, expected to own part of the new firm, and the new ven-ture was not yet a profitable business—were eligible for the second stage. This involved a detailed phone interview that averaged 60 minutes in length. Those in the 1999 cohort were also asked to complete a 12-page self-administered questionnaire; three out of four in this cohort provided this additional infor-mation. The third stage was follow-up phone interviews, which also averaged 60 minutes in length. These follow-up interviews involved different sets of questions for those who reported that the new firm had been established, those still working on the startup, and those who had disengaged from the effort.
The results of this effort are comprehensive descriptions of a wide range of characteristics of the startup teams and activities pursued in the business cre-ation process. The 1999 dataset, which involved the screening, initial detailed interview, and three follow-up interviews, has 5,000 variables. The 2005 data-set is similar in scope and size.
49 There is a considerable amount of information on the research design in the public domain; a good introduction is provided in reynolds, 2000; Gartner, et al., 2004; and on the project website, www.psed.isr.umich.edu.
50 The 24-month follow-up data for the psed ii cohort was to be available in summer 2008.
Business Creation in the United States: Entry, Startup Activities, and the Launch of New Ventures 179
Table7.1OverviewofProjectDesign:PSEDIandII
PSEDI PSEDII
Datesofinitialscreening,detailedinterview1 July1998toJan2000 Oct2005toJan2006
Time lag to
Interview 2 14 months 12 months
Interview 3 27 months 24 months
Interview 4 40 months Not available
Size of screening samples: nascent entrepreneurs only 62,612 31,845
Interview 1 830 1,214
Interview 2 501 972
Interview 3 511 To have been completed 2008
Interview 4 533 None planned at this time
Screening interview length 2 minutes 2 minutes
Detailed interview 1, phone 60 minutes 60 minutes
Detailed interview 1, mail 12 pages None
Detailed interview 2, phone 60 minutes 60 minutes
Detailed interview 2, mail 8 pages None
Detailed interview 3, phone 60 minutes 60 minutes
Detailed interview 3, mail 8 pages None
Detailed interview 4, phone 60 minutes NA
Detailed interview 4, mail 8 pages NA
Phone interview payments $25 $25
Mail questionnaire payments $25 Not applicable
no other comprehensive portrayal of business creation by a nationally rep-resentative sample of u.s. nascent entrepreneurs currently exists.
entry into the business startup process at any one time, many people are actively trying to start a new business ven-ture. These are individuals who not only express an interest, but report actual activity to start a new firm. in 1999 for each 100 persons between 18 and 74, about 5.62 qualified as nascent entrepreneurs; by 2005 this number had increased to 5.96 per 100. This represented about 10.7 million persons in 1999 and 12.1 million in 2005, an increase of 1.4 million. based on these samples, this increase is not statistically significant. Most of this increase—55 percent
180 The Small Business Economy
of the total count—is attributable to an increase in the population of 25- to 44-year-olds most likely to pursue business creation. a smaller proportion, 42 percent, reflects an increase in the “tendency to pursue” a new venture; about 3 percent is an interaction effect between these two influences.51
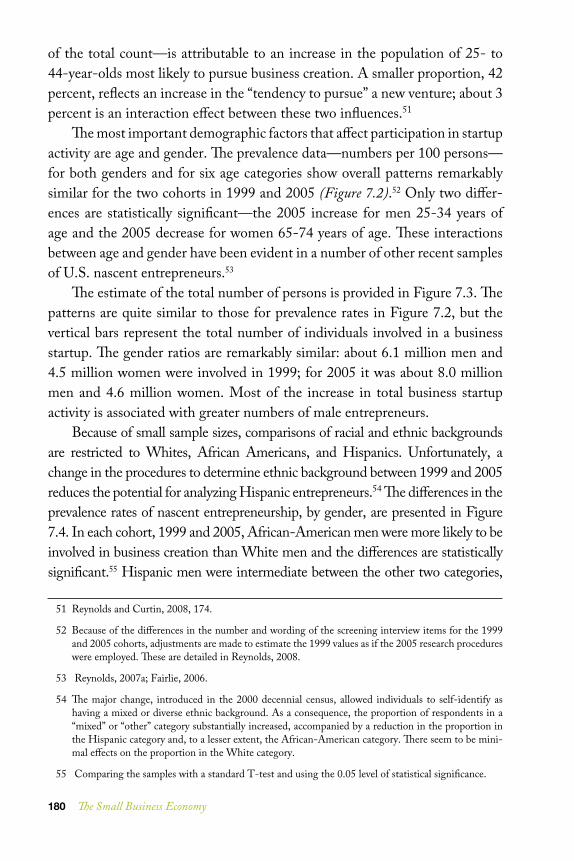
The most important demographic factors that affect participation in startup activity are age and gender. The prevalence data—numbers per 100 persons—for both genders and for six age categories show overall patterns remarkably similar for the two cohorts in 1999 and 2005 (Figure 7.2).52 only two differ-ences are statistically significant—the 2005 increase for men 25-34 years of age and the 2005 decrease for women 65-74 years of age. These interactions between age and gender have been evident in a number of other recent samples of u.s. nascent entrepreneurs.53
The estimate of the total number of persons is provided in Figure 7.3. The patterns are quite similar to those for prevalence rates in Figure 7.2, but the vertical bars represent the total number of individuals involved in a business startup. The gender ratios are remarkably similar: about 6.1 million men and 4.5 million women were involved in 1999; for 2005 it was about 8.0 million men and 4.6 million women. Most of the increase in total business startup activity is associated with greater numbers of male entrepreneurs.
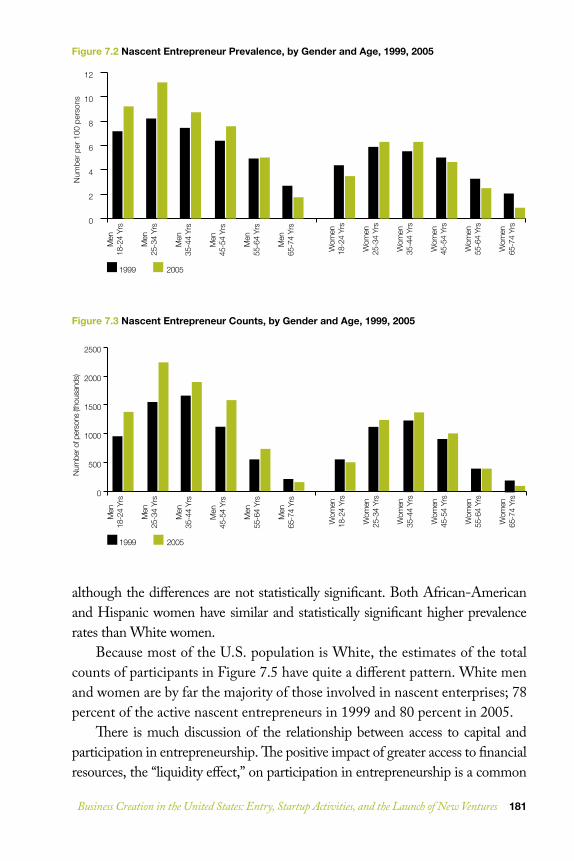
because of small sample sizes, comparisons of racial and ethnic backgrounds are restricted to whites, african americans, and hispanics. unfortunately, a change in the procedures to determine ethnic background between 1999 and 2005 reduces the potential for analyzing hispanic entrepreneurs.54 The differences in the prevalence rates of nascent entrepreneurship, by gender, are presented in Figure 7.4. in each cohort, 1999 and 2005, african-american men were more likely to be involved in business creation than white men and the differences are statistically significant.55 hispanic men were intermediate between the other two categories,
51 reynolds and curtin, 2008, 174.
52 because of the differences in the number and wording of the screening interview items for the 1999 and 2005 cohorts, adjustments are made to estimate the 1999 values as if the 2005 research procedures were employed. These are detailed in reynolds, 2008.
53 reynolds, 2007a; Fairlie, 2006.
54 The major change, introduced in the 2000 decennial census, allowed individuals to self-identify as having a mixed or diverse ethnic background. as a consequence, the proportion of respondents in a “mixed” or “other” category substantially increased, accompanied by a reduction in the proportion in the hispanic category and, to a lesser extent, the african-american category. There seem to be mini-mal effects on the proportion in the white category.
55 comparing the samples with a standard t-test and using the 0.05 level of statistical significance.
Business Creation in the United States: Entry, Startup Activities, and the Launch of New Ventures 181
although the differences are not statistically significant. both african-american and hispanic women have similar and statistically significant higher prevalence rates than white women.
because most of the u.s. population is white, the estimates of the total counts of participants in Figure 7.5 have quite a different pattern. white men and women are by far the majority of those involved in nascent enterprises; 78 percent of the active nascent entrepreneurs in 1999 and 80 percent in 2005.
There is much discussion of the relationship between access to capital and participation in entrepreneurship. The positive impact of greater access to financial resources, the “liquidity effect,” on participation in entrepreneurship is a common
0
2
4
6
8
10
12
Men
18-2
4 Yr
s
Men
25-3
4 Yr
s
Men
35-4
4 Yr
s
Men
45-5
4 Yr
s
Men
55-6
4 Yr
s
Men
65-7
4 Yr
s
Wom
en18
-24
Yrs
Wom
en25
-34
Yrs
Wom
en35
-44
Yrs
Wom
en45
-54
Yrs
Wom
en55
-64
Yrs
Wom
en65
-74
Yrs
1999 2005
Num
ber
per
100
pers
ons
Men
18-2
4 Yr
s
Men
25-3
4 Yr
s
Men
35-4
4 Yr
s
Men
45-5
4 Yr
s
Men
55-6
4 Yr
s
Men
65-7
4 Yr
s
Wom
en18
-24
Yrs
Wom
en25
-34
Yrs
Wom
en35
-44
Yrs
Wom
en45
-54
Yrs
Wom
en55
-64
Yrs
Wom
en65
-74
Yrs
Num
ber o
f per
sons
(tho
usan
ds)
1999 2005
0
500
1000
1500
2000
2500
Figure7.2NascentEntrepreneurPrevalence,byGenderandAge,1999,2005
Figure7.3NascentEntrepreneurCounts,byGenderandAge,1999,2005
182 The Small Business Economy
theme.56 one indicator of access to wealth is annual household income. The rela-tionship, for men and women, is provided in Figure 7.6. The 1999 values have been adjusted using the consumer price index to match 2005 values. This com-parison shows a modest impact, with men from the highest income households at a higher level of participation and women from the lowest income households
56 dunn and holtz-eakin, 2000; le, 1999.
Men
:W
hite
Men
:Af
rican
Am
eric
an
Men
:H
ispa
nic
Wom
en:
Whi
te
Wom
en:
Afric
an
Amer
ican
Wom
en:
His
pani
c
Num
ber p
er 1
00 p
erso
ns
1999 2005
0
3
6
9
12
15
Men
:W
hite
Men
:Af
rican
Am
eric
an
Men
:H
ispa
nic
Wom
en:
Whi
te
Wom
en:
Afric
an
Amer
ican
Wom
en:
His
pani
c
Num
ber o
f per
sons
(tho
usan
ds)
1999 2005
0
1000
2000
3000
4000
5000
6000
Figure7.4NascentEntrepreneurPrevalence,byGenderandEthnicity,1999,2005
Figure7.5NascentEntrepreneurCounts,byGenderandEthnicity,1999,2005

Business Creation in the United States: Entry, Startup Activities, and the Launch of New Ventures 183
with a slightly lower level of participation. when these different subsamples are compared, however, none of these differences are statistically significant.57
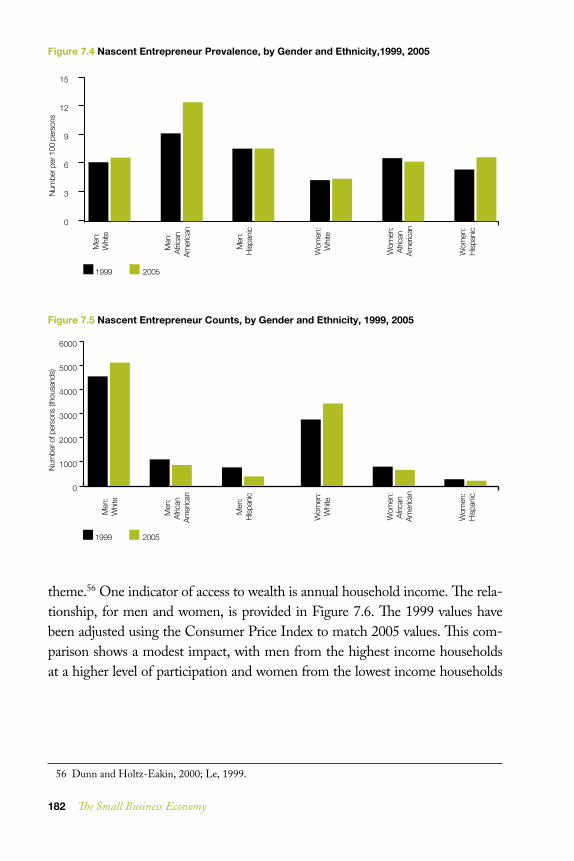
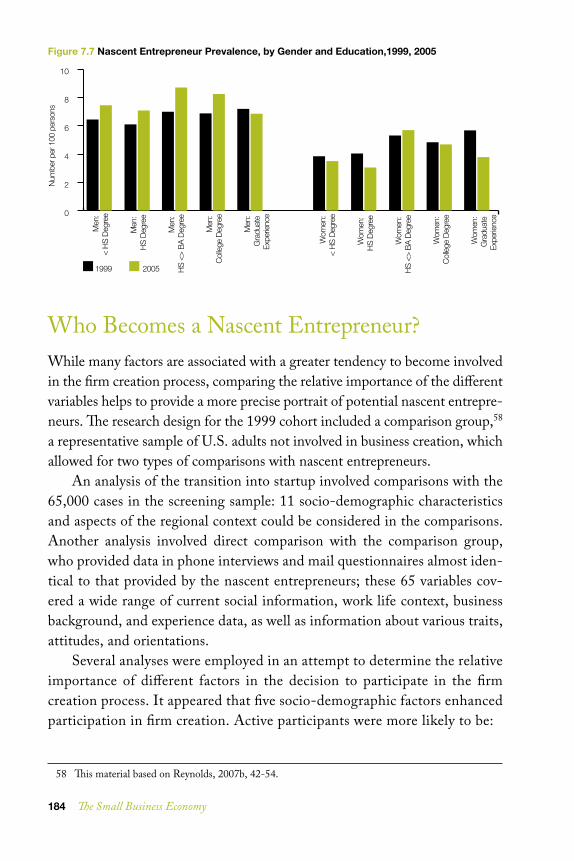
The relationship between educational attainment and participation in firm creation is presented by gender in Figure 7.7. There is little variation among the men and none of the differences are statistically significant. among the women, however, those who had not finished high school or had not gone beyond high school were much less likely to participate in the startup process; these differences are statistically significant.
The data show that when both household income and educational attain-ment are taken into account, women from low-income households with little education are half as likely (3 per 100) to be involved in new firm creation as other women (6 per 100). The difference is clearly statistically significant for both the 1999 and 2005 cohorts. women with both disadvantages are clearly not involved in the entrepreneurial process; no such interaction effect is present for men.
57 an extensive analysis of the 1999 cohort, comparing them to a comparison group identified at the same time, found that household net worth, once a variety of other factors were taken into account, had little impact on the propensity to participate in firm creation, crosa, aldrich, and Keister, 2002; Kim, aldrich, and Keister, 2003. There may be a liquidity effect, but it clearly is not a major factor affecting the decision to participate in business creation.
Num
ber p
er 1
00 p
erso
ns
1999 2005
0
2
4
6
8
10
Men
: $1
5/yr
Men
: $1
5-30
/yr
Men
: $3
0-50
/yr
Men
: $5
0-75
/yr
Men
: $7
5-10
0/yr
Men
: $>
100/
yr
Wom
en:
$15/
yr
Wom
en:
$15-
30/y
r
Wom
en:
$30-
50/y
r
Wom
en:
$50-
75/y
r
Wom
en:
$75-
100/
yr
Wom
en:
$>10
0/yr
Figure7.6NascentEntrepreneurPrevalence,byGenderandHouseholdIncome,1999,2005(incomefiguresinthousandsofdollars)
184 The Small Business Economy
who becomes a nascent entrepreneur?while many factors are associated with a greater tendency to become involved in the firm creation process, comparing the relative importance of the different variables helps to provide a more precise portrait of potential nascent entrepre-neurs. The research design for the 1999 cohort included a comparison group,58 a representative sample of u.s. adults not involved in business creation, which allowed for two types of comparisons with nascent entrepreneurs.
an analysis of the transition into startup involved comparisons with the 65,000 cases in the screening sample: 11 socio-demographic characteristics and aspects of the regional context could be considered in the comparisons. another analysis involved direct comparison with the comparison group, who provided data in phone interviews and mail questionnaires almost iden-tical to that provided by the nascent entrepreneurs; these 65 variables cov-ered a wide range of current social information, work life context, business background, and experience data, as well as information about various traits, attitudes, and orientations.
several analyses were employed in an attempt to determine the relative importance of different factors in the decision to participate in the firm creation process. it appeared that five socio-demographic factors enhanced participation in firm creation. active participants were more likely to be:
58 This material based on reynolds, 2007b, 42-54.
Figure7.7NascentEntrepreneurPrevalence,byGenderandEducation,1999,2005N
umbe
r per
100
per
sons
1999 2005
Men
: <
HS
Deg
ree
Men
: H
S D
egre
e
Men
: H
S <>
BA
Deg
ree
Men
: C
olle
ge D
egre
e
Men
: G
radu
ate
Expe
rienc
e0
2
4
6
8
10
Wom
en:
< H
S D
egre
e
Wom
en:
HS
Deg
ree
Wom
en:
HS
<> B
A D
egre
e
Wom
en:
Col
lege
Deg
ree
Wom
en:
Gra
duat
e Ex
perie
nce
Business Creation in the United States: Entry, Startup Activities, and the Launch of New Ventures 185
• 24-54 years old
• men
• full- or part-time workers or self-employed
• African Americans and Hispanics
• high school graduates
a number of other factors seemed to have limited influence, depending on the situation, context, or alternatives for the person:
• household income (not poor)
• household net worth (very low or very high)
• recent population growth in local community (increase in demand)
• greater management and administrative experience and training
• positive impressions and encouragement from family and friends
• strong expectations for and commitment to an entrepreneurial career
the assessments of a wide range of personal attributes, attitudes, and perceptions were inconclusive. none were related to a negative impact on the decision to enter the startup process, but most had no statistically significant impact.
The life course stage, the immediate economic context, and the back-ground of the individual affect the decision to pursue business creation. while some are more likely to become involved than others, there is no segment of society—no category of individuals—that is unrepresented among nascent entrepreneurs.
nascent entrepreneur profile a detailed profile of nascent entrepreneurs—individuals actively involved in trying to start a new business venture—is possible from the psed cohorts identified in 1999 and 2005.59 These descriptions represent the 10-12 million
59 based on reynolds and curtin, 2008, 181-202.
186 The Small Business Economy
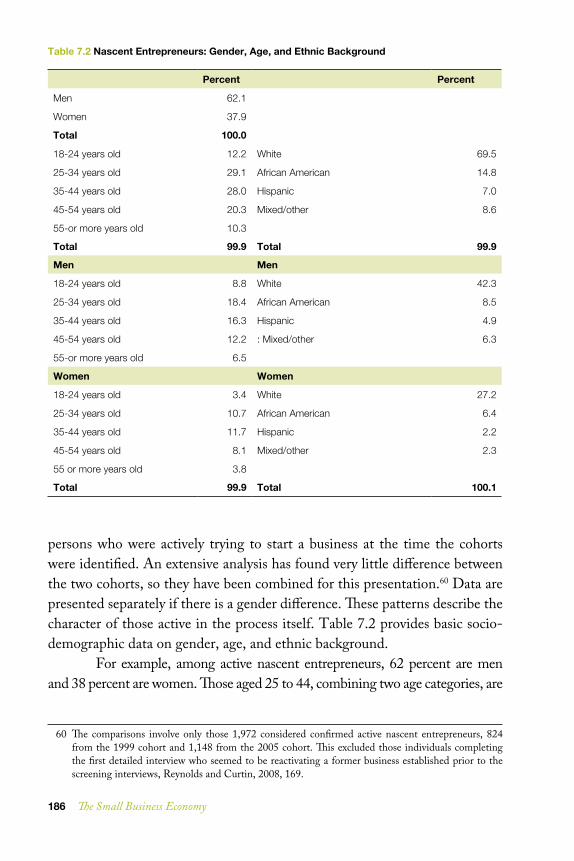
persons who were actively trying to start a business at the time the cohorts were identified. an extensive analysis has found very little difference between the two cohorts, so they have been combined for this presentation.60 data are presented separately if there is a gender difference. These patterns describe the character of those active in the process itself. table 7.2 provides basic socio-demographic data on gender, age, and ethnic background.
For example, among active nascent entrepreneurs, 62 percent are men and 38 percent are women. Those aged 25 to 44, combining two age categories, are
60 The comparisons involve only those 1,972 considered confirmed active nascent entrepreneurs, 824 from the 1999 cohort and 1,148 from the 2005 cohort. This excluded those individuals completing the first detailed interview who seemed to be reactivating a former business established prior to the screening interviews, reynolds and curtin, 2008, 169.
Table7.2NascentEntrepreneurs:Gender,Age,andEthnicBackground
Percent Percent
Men 62.1
Women 37.9
Total 100.0
18-24 years old 12.2 White 69.5
25-34 years old 29.1 African American 14.8
35-44 years old 28.0 Hispanic 7.0
45-54 years old 20.3 Mixed/other 8.6
55-or more years old 10.3
Total 99.9 Total 99.9
Men Men
18-24 years old 8.8 White 42.3
25-34 years old 18.4 African American 8.5
35-44 years old 16.3 Hispanic 4.9
45-54 years old 12.2 : Mixed/other 6.3
55-or more years old 6.5
Women Women
18-24 years old 3.4 White 27.2
25-34 years old 10.7 African American 6.4
35-44 years old 11.7 Hispanic 2.2
45-54 years old 8.1 Mixed/other 2.3
55 or more years old 3.8
Total 99.9 Total 100.1
Business Creation in the United States: Entry, Startup Activities, and the Launch of New Ventures 187
57 percent of the active nascent entrepreneurs. The age pattern is similar for both men and women, with slightly fewer women under 24 or over 54 years of age.
almost seven in ten are white and about one in six are african american, the remainder are about evenly divided between hispanics and those with mixed or other ethnic backgrounds.
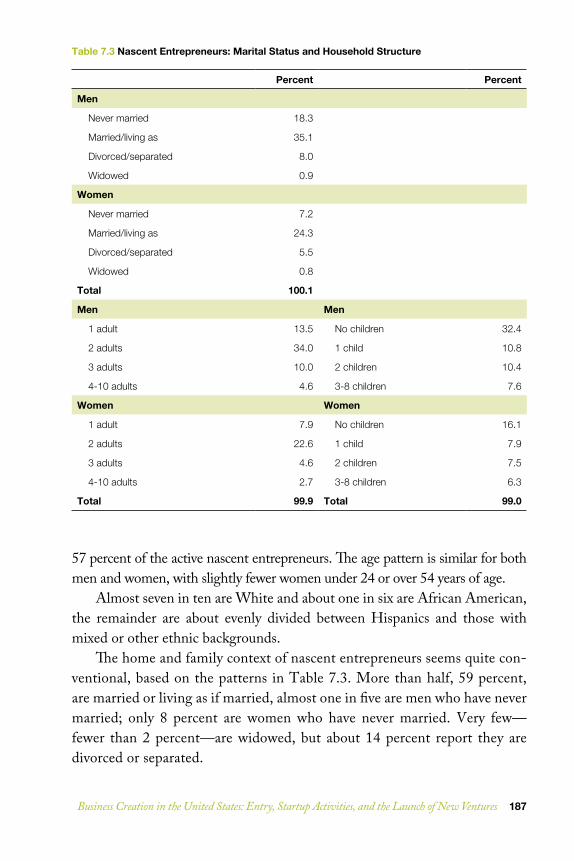
The home and family context of nascent entrepreneurs seems quite con-ventional, based on the patterns in table 7.3. More than half, 59 percent, are married or living as if married, almost one in five are men who have never married; only 8 percent are women who have never married. very few—fewer than 2 percent—are widowed, but about 14 percent report they are divorced or separated.
Table7.3NascentEntrepreneurs:MaritalStatusandHouseholdStructure
Percent Percent
Men
Never married 18.3
Married/living as 35.1
Divorced/separated 8.0
Widowed 0.9
Women
Never married 7.2
Married/living as 24.3
Divorced/separated 5.5
Widowed 0.8
Total 100.1
Men Men
1 adult 13.5 No children 32.4
2 adults 34.0 1 child 10.8
3 adults 10.0 2 children 10.4
4-10 adults 4.6 3-8 children 7.6
Women Women
1 adult 7.9 No children 16.1
2 adults 22.6 1 child 7.9
3 adults 4.6 2 children 7.5
4-10 adults 2.7 3-8 children 6.3
Total 99.9 Total 99.0
188 The Small Business Economy
about one in five are living alone, but 80 percent share a household with other adults. about three in five (34 percent are men and 23 percent are women) are in a two-adult household. half, mostly men, have no children in their household, but 30 percent who are men and 20 percent who are women report having a household with one or more persons under 18 years of age.
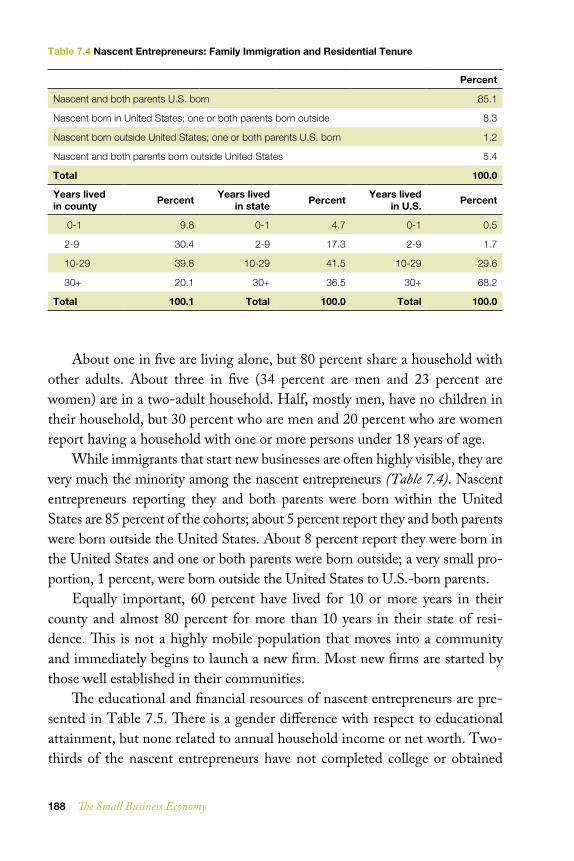
while immigrants that start new businesses are often highly visible, they are very much the minority among the nascent entrepreneurs (Table 7.4). nascent entrepreneurs reporting they and both parents were born within the united states are 85 percent of the cohorts; about 5 percent report they and both parents were born outside the united states. about 8 percent report they were born in the united states and one or both parents were born outside; a very small pro-portion, 1 percent, were born outside the united states to u.s.-born parents.
equally important, 60 percent have lived for 10 or more years in their county and almost 80 percent for more than 10 years in their state of resi-dence. This is not a highly mobile population that moves into a community and immediately begins to launch a new firm. Most new firms are started by those well established in their communities.
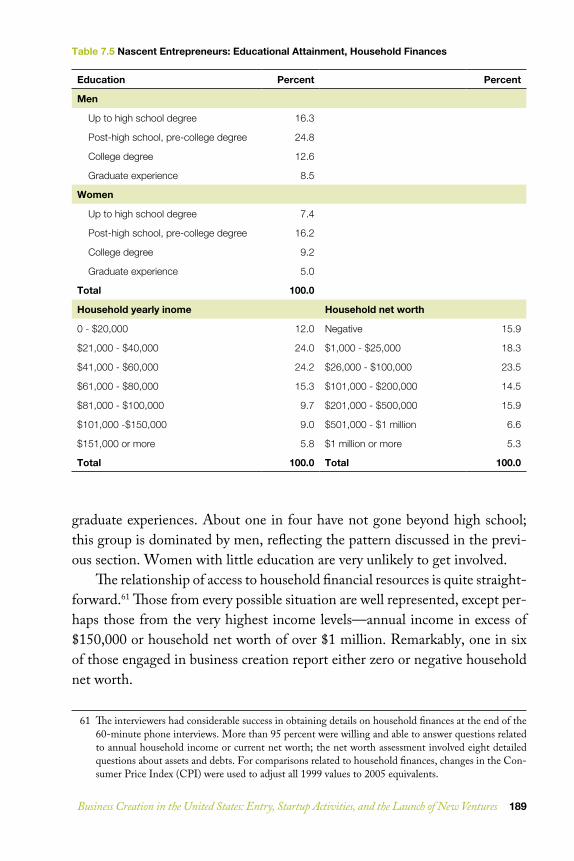
The educational and financial resources of nascent entrepreneurs are pre-sented in table 7.5. There is a gender difference with respect to educational attainment, but none related to annual household income or net worth. two-thirds of the nascent entrepreneurs have not completed college or obtained
Table7.4NascentEntrepreneurs:FamilyImmigrationandResidentialTenure
Percent
Nascent and both parents U.S. born 85.1
Nascent born in United States; one or both parents born outside 8.3
Nascent born outside United States; one or both parents U.S. born 1.2
Nascent and both parents born outside United States 5.4
Total 100.0
Yearslivedincounty Percent Yearslived
instate Percent YearslivedinU.S. Percent
0-1 9.8 0-1 4.7 0-1 0.5
2-9 30.4 2-9 17.3 2-9 1.7
10-29 39.8 10-29 41.5 10-29 29.6
30+ 20.1 30+ 36.5 30+ 68.2
Total 100.1 Total 100.0 Total 100.0
Business Creation in the United States: Entry, Startup Activities, and the Launch of New Ventures 189
graduate experiences. about one in four have not gone beyond high school; this group is dominated by men, reflecting the pattern discussed in the previ-ous section. women with little education are very unlikely to get involved.
The relationship of access to household financial resources is quite straight-forward.61 Those from every possible situation are well represented, except per-haps those from the very highest income levels—annual income in excess of $150,000 or household net worth of over $1 million. remarkably, one in six of those engaged in business creation report either zero or negative household net worth.
61 The interviewers had considerable success in obtaining details on household finances at the end of the 60-minute phone interviews. More than 95 percent were willing and able to answer questions related to annual household income or current net worth; the net worth assessment involved eight detailed questions about assets and debts. For comparisons related to household finances, changes in the con-sumer price index (cpi) were used to adjust all 1999 values to 2005 equivalents.
Table7.5NascentEntrepreneurs:EducationalAttainment,HouseholdFinances
Education Percent Percent
Men
Up to high school degree 16.3
Post-high school, pre-college degree 24.8
College degree 12.6
Graduate experience 8.5
Women
Up to high school degree 7.4
Post-high school, pre-college degree 16.2
College degree 9.2
Graduate experience 5.0
Total 100.0
Householdyearlyinome Householdnetworth
0 - $20,000 12.0 Negative 15.9
$21,000 - $40,000 24.0 $1,000 - $25,000 18.3
$41,000 - $60,000 24.2 $26,000 - $100,000 23.5
$61,000 - $80,000 15.3 $101,000 - $200,000 14.5
$81,000 - $100,000 9.7 $201,000 - $500,000 15.9
$101,000 -$150,000 9.0 $501,000 - $1 million 6.6
$151,000 or more 5.8 $1 million or more 5.3
Total 100.0 Total 100.0
190 The Small Business Economy
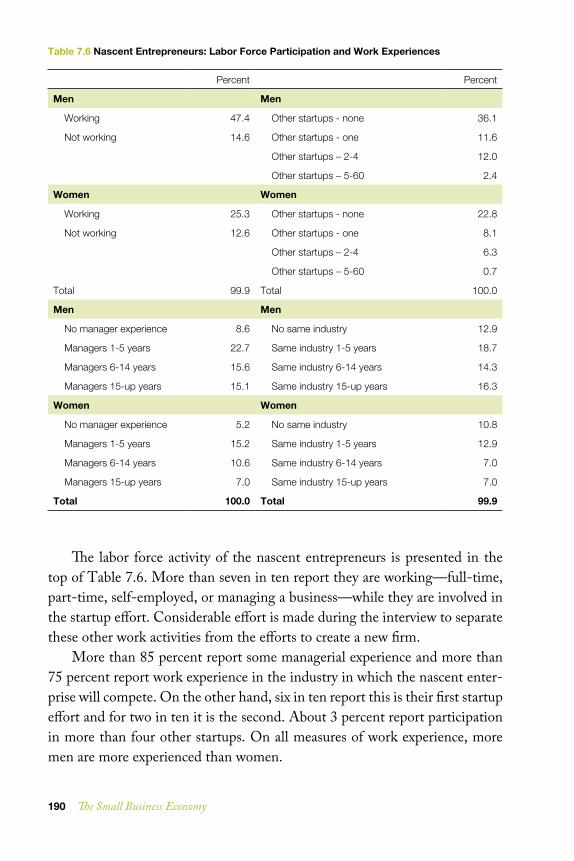
The labor force activity of the nascent entrepreneurs is presented in the top of table 7.6. More than seven in ten report they are working—full-time, part-time, self-employed, or managing a business—while they are involved in the startup effort. considerable effort is made during the interview to separate these other work activities from the efforts to create a new firm.
More than 85 percent report some managerial experience and more than 75 percent report work experience in the industry in which the nascent enter-prise will compete. on the other hand, six in ten report this is their first startup effort and for two in ten it is the second. about 3 percent report participation in more than four other startups. on all measures of work experience, more men are more experienced than women.
Table7.6NascentEntrepreneurs:LaborForceParticipationandWorkExperiences
Percent Percent
Men Men
Working 47.4 Other startups - none 36.1
Not working 14.6 Other startups - one 11.6
Other startups – 2-4 12.0
Other startups – 5-60 2.4
Women Women
Working 25.3 Other startups - none 22.8
Not working 12.6 Other startups - one 8.1
Other startups – 2-4 6.3
Other startups – 5-60 0.7
Total 99.9 Total 100.0
Men Men
No manager experience 8.6 No same industry 12.9
Managers 1-5 years 22.7 Same industry 1-5 years 18.7
Managers 6-14 years 15.6 Same industry 6-14 years 14.3
Managers 15-up years 15.1 Same industry 15-up years 16.3
Women Women
No manager experience 5.2 No same industry 10.8
Managers 1-5 years 15.2 Same industry 1-5 years 12.9
Managers 6-14 years 10.6 Same industry 6-14 years 7.0
Managers 15-up years 7.0 Same industry 15-up years 7.0
Total 100.0 Total 99.9
Business Creation in the United States: Entry, Startup Activities, and the Launch of New Ventures 191
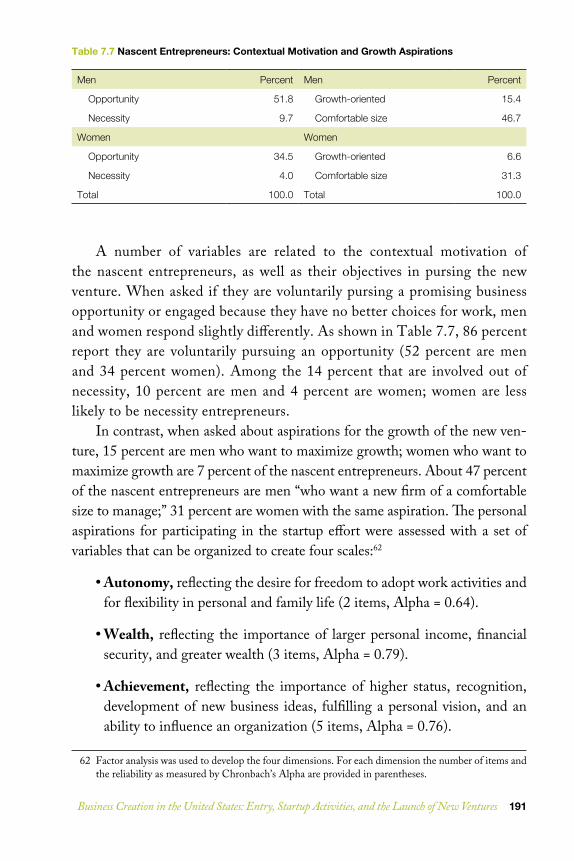
a number of variables are related to the contextual motivation of the nascent entrepreneurs, as well as their objectives in pursing the new venture. when asked if they are voluntarily pursing a promising business opportunity or engaged because they have no better choices for work, men and women respond slightly differently. as shown in table 7.7, 86 percent report they are voluntarily pursuing an opportunity (52 percent are men and 34 percent women). among the 14 percent that are involved out of necessity, 10 percent are men and 4 percent are women; women are less likely to be necessity entrepreneurs.
in contrast, when asked about aspirations for the growth of the new ven-ture, 15 percent are men who want to maximize growth; women who want to maximize growth are 7 percent of the nascent entrepreneurs. about 47 percent of the nascent entrepreneurs are men “who want a new firm of a comfortable size to manage;” 31 percent are women with the same aspiration. The personal aspirations for participating in the startup effort were assessed with a set of variables that can be organized to create four scales:62
• Autonomy, reflecting the desire for freedom to adopt work activities and for flexibility in personal and family life (2 items, alpha = 0.64).
• Wealth, reflecting the importance of larger personal income, financial security, and greater wealth (3 items, alpha = 0.79).
• Achievement, reflecting the importance of higher status, recognition, development of new business ideas, fulfilling a personal vision, and an ability to influence an organization (5 items, alpha = 0.76).
62 Factor analysis was used to develop the four dimensions. For each dimension the number of items and the reliability as measured by chronbach’s alpha are provided in parentheses.
Table7.7NascentEntrepreneurs:ContextualMotivationandGrowthAspirations
Men Percent Men Percent
Opportunity 51.8 Growth-oriented 15.4
Necessity 9.7 Comfortable size 46.7
Women Women
Opportunity 34.5 Growth-oriented 6.6
Necessity 4.0 Comfortable size 31.3
Total 100.0 Total 100.0

192 The Small Business Economy
• Respect, reflecting the importance of following the family tradition, fol-lowing the example of admired persons, respect from friends, and a busi-ness for one’s children (4 items, alpha = 0.69).
The relative importance of these four dimensions of intrinsic motivation for men and women nascent entrepreneurs is presented in Figure 7.8. as with any index, the actual numerical values are arbitrary, but the comparisons do make clear the relative importance assigned to each. The rank order is the same for both men and women, with small differences in emphasis. Generally, both men and women seem to become involved with firm creation to gain greater autonomy and wealth, with less emphasis on achievement and status or to gain the respect of family and friends. as with almost all work career choices, com-plex intrinsic motivations are involved in the final decisions.
in summary, the 12 million active nascent entrepreneurs in the united states in 2005 reflect a number of salient characteristics:
• Three in five are men; two in five are women.
• Three in five are between 25 and 44 years old; one in ten is 55 or older.
• Seven in ten are White; one in six African American, and one in fourteen hispanic.
• One in five are men who have never married; three in five are currently married or with a significant other.
Men: autonomy
Men: wealth
Men: achievement
Men: respect
Women: autonomy
Women: wealth
Women: achievement
Women: respect
0 0.5 1 1.5 2.52 3 3.5 4 4.5Index of emphasis
Figure7.8NascentEntrepreneurs:IntrinsicMotivationbyGender

Business Creation in the United States: Entry, Startup Activities, and the Launch of New Ventures 193
• Four in five are in households with one or more other adults.
• Half are in households with one or more children under 18 years of age.
• The large majority, 85 percent, were born in the United States of U.S.-born parents. one in twenty, 5 percent, was born outside the united states to parents also born outside the country.
• Nine in ten have lived in their county for more than a year, six in ten for more than 10 years.
• One in four has not gone beyond high school, one in seven has some graduate experience; two in five have gone beyond high school but not finished college.
• All levels of household income and household net worth are represented among active nascent entrepreneurs; one in six report zero or negative net worth.
• The majority, 73 percent, report a full-time or part-time job, self-employ-ment, or managing a business for another while they are involved in cre-ating another business venture.
• Almost nine in ten report one or more years of managerial experience; more than three-fourths have one or more years experience in the same industry as the new venture. For three in five this is the first startup ini-tiative; 3 percent report experience on five or more other startups.
• One in five seeks maximum growth for the new firm; the remainder want to manage a firm of comfortable size.
• Most, 85 percent, report they are responding to the opportunity to develop a promising business idea; the remainder are involved because of a lack of other career options.
• The primary intrinsic attraction of the new firm is the potential for work autonomy and greater wealth, followed by a potential for achievement and recognition as well as respect from family and friends.
• While in some ways with respect to involvement in nascent entrepreneur-ship, women are distinctive—for example, a small percentage have not
194 The Small Business Economy
gone beyond high school and there is less interest in the firm’s growth—for most comparisons women are very similar to men.
The 12 million nascent entrepreneurs, then, appear as a cross-section of those in the prime years of their work career. no major segments seem to be excluded; some segments—younger men—are more involved than others.
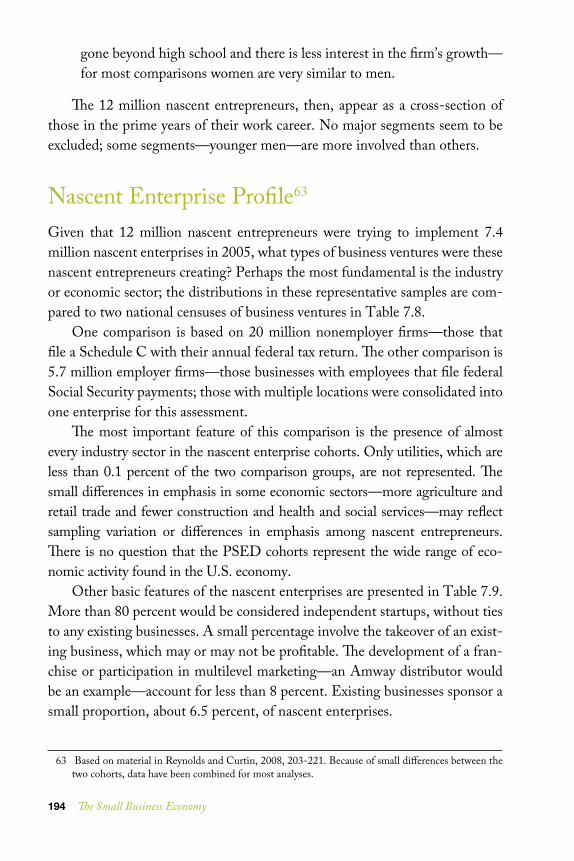
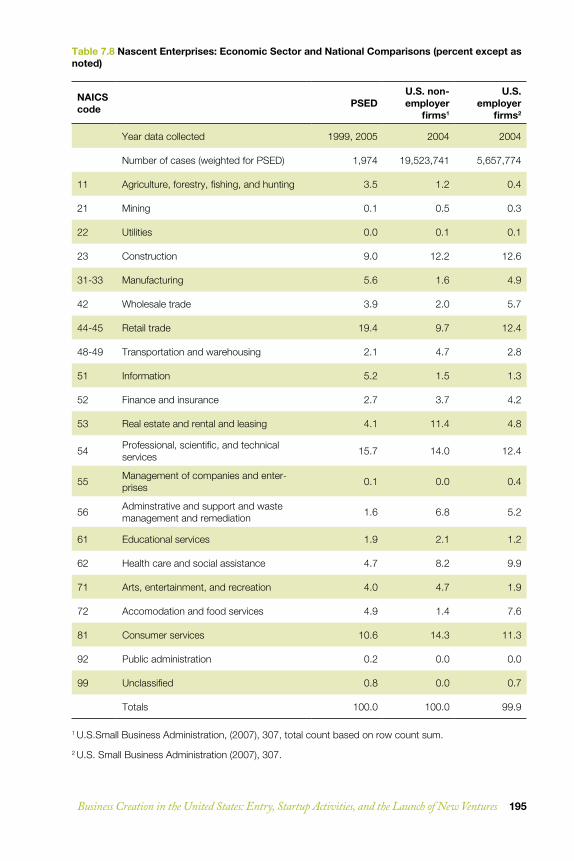
nascent enterprise profile63 Given that 12 million nascent entrepreneurs were trying to implement 7.4 million nascent enterprises in 2005, what types of business ventures were these nascent entrepreneurs creating? perhaps the most fundamental is the industry or economic sector; the distributions in these representative samples are com-pared to two national censuses of business ventures in table 7.8.
one comparison is based on 20 million nonemployer firms—those that file a schedule c with their annual federal tax return. The other comparison is 5.7 million employer firms—those businesses with employees that file federal social security payments; those with multiple locations were consolidated into one enterprise for this assessment.
The most important feature of this comparison is the presence of almost every industry sector in the nascent enterprise cohorts. only utilities, which are less than 0.1 percent of the two comparison groups, are not represented. The small differences in emphasis in some economic sectors—more agriculture and retail trade and fewer construction and health and social services—may reflect sampling variation or differences in emphasis among nascent entrepreneurs. There is no question that the psed cohorts represent the wide range of eco-nomic activity found in the u.s. economy.
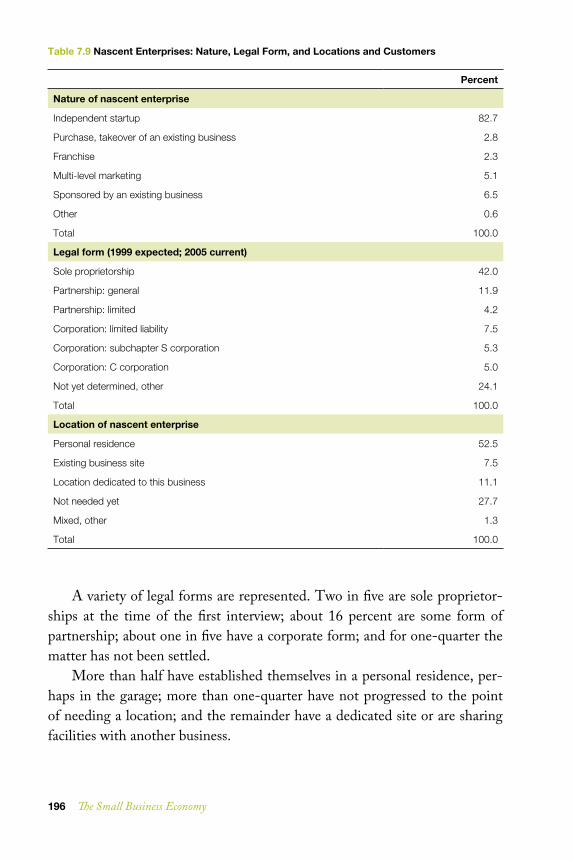
other basic features of the nascent enterprises are presented in table 7.9. More than 80 percent would be considered independent startups, without ties to any existing businesses. a small percentage involve the takeover of an exist-ing business, which may or may not be profitable. The development of a fran-chise or participation in multilevel marketing—an amway distributor would be an example—account for less than 8 percent. existing businesses sponsor a small proportion, about 6.5 percent, of nascent enterprises.
63 based on material in reynolds and curtin, 2008, 203-221. because of small differences between the two cohorts, data have been combined for most analyses.
Business Creation in the United States: Entry, Startup Activities, and the Launch of New Ventures 195
Table7.8NascentEnterprises:EconomicSectorandNationalComparisons(percentexceptasnoted)
NAICScode PSED
U.S.non-employer
firms1
U.S.employer
firms2
Year data collected 1999, 2005 2004 2004
Number of cases (weighted for PSED) 1,974 19,523,741 5,657,774
11 Agriculture, forestry, fishing, and hunting 3.5 1.2 0.4
21 Mining 0.1 0.5 0.3
22 Utilities 0.0 0.1 0.1
23 Construction 9.0 12.2 12.6
31-33 Manufacturing 5.6 1.6 4.9
42 Wholesale trade 3.9 2.0 5.7
44-45 Retail trade 19.4 9.7 12.4
48-49 Transportation and warehousing 2.1 4.7 2.8
51 Information 5.2 1.5 1.3
52 Finance and insurance 2.7 3.7 4.2
53 Real estate and rental and leasing 4.1 11.4 4.8
54 Professional, scientific, and technical services 15.7 14.0 12.4
55 Management of companies and enter-prises 0.1 0.0 0.4
56 Adminstrative and support and waste management and remediation 1.6 6.8 5.2
61 Educational services 1.9 2.1 1.2
62 Health care and social assistance 4.7 8.2 9.9
71 Arts, entertainment, and recreation 4.0 4.7 1.9
72 Accomodation and food services 4.9 1.4 7.6
81 Consumer services 10.6 14.3 11.3
92 Public administration 0.2 0.0 0.0
99 Unclassified 0.8 0.0 0.7
Totals 100.0 100.0 99.9
1 U.S.Small Business Administration, (2007), 307, total count based on row count sum.
2 U.S. Small Business Administration (2007), 307.
196 The Small Business Economy
a variety of legal forms are represented. two in five are sole proprietor-ships at the time of the first interview; about 16 percent are some form of partnership; about one in five have a corporate form; and for one-quarter the matter has not been settled.
More than half have established themselves in a personal residence, per-haps in the garage; more than one-quarter have not progressed to the point of needing a location; and the remainder have a dedicated site or are sharing facilities with another business.
Table7.9NascentEnterprises:Nature,LegalForm,andLocationsandCustomers
Percent
Natureofnascententerprise
Independent startup 82.7
Purchase, takeover of an existing business 2.8
Franchise 2.3
Multi-level marketing 5.1
Sponsored by an existing business 6.5
Other 0.6
Total 100.0
Legalform(1999expected;2005current)
Sole proprietorship 42.0
Partnership: general 11.9
Partnership: limited 4.2
Corporation: limited liability 7.5
Corporation: subchapter S corporation 5.3
Corporation: C corporation 5.0
Not yet determined, other 24.1
Total 100.0
Locationofnascententerprise
Personal residence 52.5
Existing business site 7.5
Location dedicated to this business 11.1
Not needed yet 27.7
Mixed, other 1.3
Total 100.0
Business Creation in the United States: Entry, Startup Activities, and the Launch of New Ventures 197
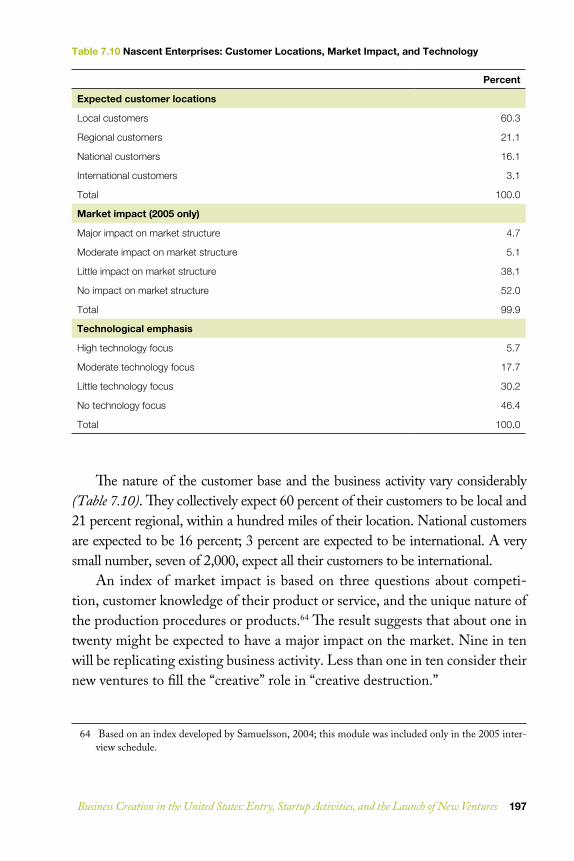
The nature of the customer base and the business activity vary considerably (Table 7.10). They collectively expect 60 percent of their customers to be local and 21 percent regional, within a hundred miles of their location. national customers are expected to be 16 percent; 3 percent are expected to be international. a very small number, seven of 2,000, expect all their customers to be international.
an index of market impact is based on three questions about competi-tion, customer knowledge of their product or service, and the unique nature of the production procedures or products.64 The result suggests that about one in twenty might be expected to have a major impact on the market. nine in ten will be replicating existing business activity. less than one in ten consider their new ventures to fill the “creative” role in “creative destruction.”
64 based on an index developed by samuelsson, 2004; this module was included only in the 2005 inter-view schedule.
Table7.10NascentEnterprises:CustomerLocations,MarketImpact,andTechnology
Percent
Expectedcustomerlocations
Local customers 60.3
Regional customers 21.1
National customers 16.1
International customers 3.1
Total 100.0
Marketimpact(2005only)
Major impact on market structure 4.7
Moderate impact on market structure 5.1
Little impact on market structure 38.1
No impact on market structure 52.0
Total 99.9
Technologicalemphasis
High technology focus 5.7
Moderate technology focus 17.7
Little technology focus 30.2
No technology focus 46.4
Total 100.0
198 The Small Business Economy
Three variables—related to current technology, spending on research and development, and the owner’s judgment about the technological focus—are used to create a technology focus index. about one in twenty might be considered high technology; almost half have no focus on new techniques or products.
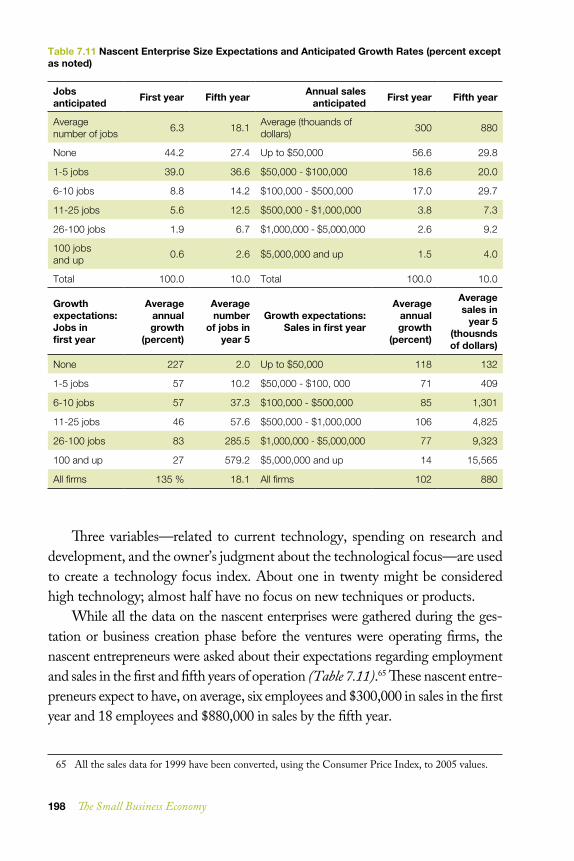
while all the data on the nascent enterprises were gathered during the ges-tation or business creation phase before the ventures were operating firms, the nascent entrepreneurs were asked about their expectations regarding employment and sales in the first and fifth years of operation (Table 7.11).65 These nascent entre-preneurs expect to have, on average, six employees and $300,000 in sales in the first year and 18 employees and $880,000 in sales by the fifth year.
65 all the sales data for 1999 have been converted, using the consumer price index, to 2005 values.
Table7.11NascentEnterpriseSizeExpectationsandAnticipatedGrowthRates(percentexceptasnoted)
Jobsanticipated Firstyear Fifthyear Annualsales
anticipated Firstyear Fifthyear
Average number of jobs 6.3 18.1 Average (thouands of
dollars) 300 880
None 44.2 27.4 Up to $50,000 56.6 29.8
1-5 jobs 39.0 36.6 $50,000 - $100,000 18.6 20.0
6-10 jobs 8.8 14.2 $100,000 - $500,000 17.0 29.7
11-25 jobs 5.6 12.5 $500,000 - $1,000,000 3.8 7.3
26-100 jobs 1.9 6.7 $1,000,000 - $5,000,000 2.6 9.2
100 jobs and up 0.6 2.6 $5,000,000 and up 1.5 4.0
Total 100.0 10.0 Total 100.0 10.0
Growthexpectations:Jobsinfirstyear
Averageannualgrowth
(percent)
Averagenumber
ofjobsinyear5
Growthexpectations:Salesinfirstyear
Averageannualgrowth
(percent)
Averagesalesin
year5(thousndsofdollars)
None 227 2.0 Up to $50,000 118 132
1-5 jobs 57 10.2 $50,000 - $100, 000 71 409
6-10 jobs 57 37.3 $100,000 - $500,000 85 1,301
11-25 jobs 46 57.6 $500,000 - $1,000,000 106 4,825
26-100 jobs 83 285.5 $1,000,000 - $5,000,000 77 9,323
100 and up 27 579.2 $5,000,000 and up 14 15,565
All firms 135 % 18.1 All firms 102 880
Business Creation in the United States: Entry, Startup Activities, and the Launch of New Ventures 199
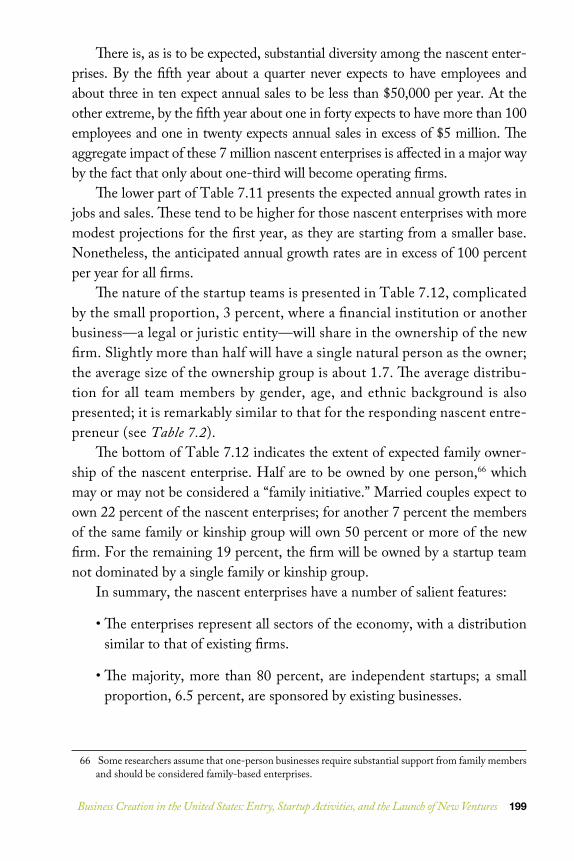
There is, as is to be expected, substantial diversity among the nascent enter-prises. by the fifth year about a quarter never expects to have employees and about three in ten expect annual sales to be less than $50,000 per year. at the other extreme, by the fifth year about one in forty expects to have more than 100 employees and one in twenty expects annual sales in excess of $5 million. The aggregate impact of these 7 million nascent enterprises is affected in a major way by the fact that only about one-third will become operating firms.
The lower part of table 7.11 presents the expected annual growth rates in jobs and sales. These tend to be higher for those nascent enterprises with more modest projections for the first year, as they are starting from a smaller base. nonetheless, the anticipated annual growth rates are in excess of 100 percent per year for all firms.
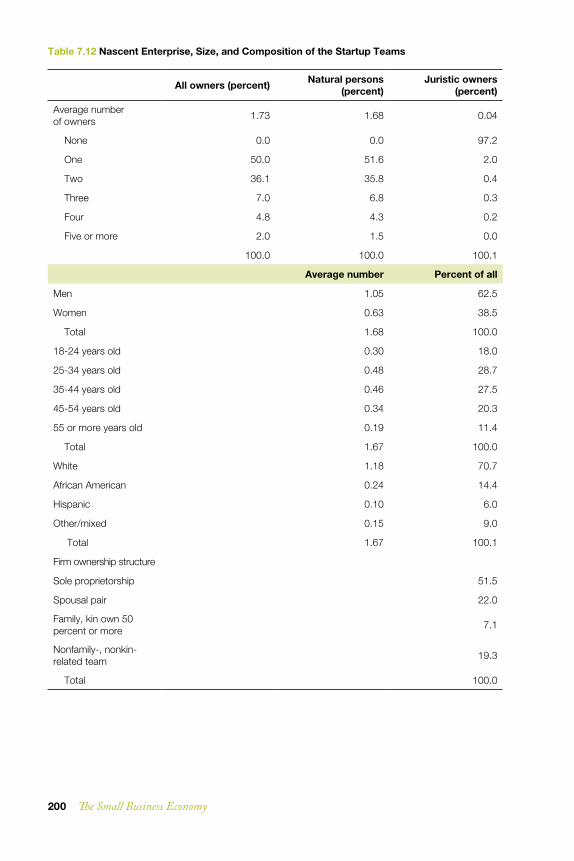
The nature of the startup teams is presented in table 7.12, complicated by the small proportion, 3 percent, where a financial institution or another business—a legal or juristic entity—will share in the ownership of the new firm. slightly more than half will have a single natural person as the owner; the average size of the ownership group is about 1.7. The average distribu-tion for all team members by gender, age, and ethnic background is also presented; it is remarkably similar to that for the responding nascent entre-preneur (see Table 7.2).
The bottom of table 7.12 indicates the extent of expected family owner-ship of the nascent enterprise. half are to be owned by one person,66 which may or may not be considered a “family initiative.” Married couples expect to own 22 percent of the nascent enterprises; for another 7 percent the members of the same family or kinship group will own 50 percent or more of the new firm. For the remaining 19 percent, the firm will be owned by a startup team not dominated by a single family or kinship group.
in summary, the nascent enterprises have a number of salient features:
• The enterprises represent all sectors of the economy, with a distribution similar to that of existing firms.
• The majority, more than 80 percent, are independent startups; a small proportion, 6.5 percent, are sponsored by existing businesses.
66 some researchers assume that one-person businesses require substantial support from family members and should be considered family-based enterprises.
200 The Small Business Economy
Table7.12NascentEnterprise,Size,andCompositionoftheStartupTeams
Allowners(percent) Naturalpersons(percent)
Juristicowners(percent)
Average number of owners 1.73 1.68 0.04
None 0.0 0.0 97.2
One 50.0 51.6 2.0
Two 36.1 35.8 0.4
Three 7.0 6.8 0.3
Four 4.8 4.3 0.2
Five or more 2.0 1.5 0.0
100.0 100.0 100.1
Averagenumber Percentofall
Men 1.05 62.5
Women 0.63 38.5
Total 1.68 100.0
18-24 years old 0.30 18.0
25-34 years old 0.48 28.7
35-44 years old 0.46 27.5
45-54 years old 0.34 20.3
55 or more years old 0.19 11.4
Total 1.67 100.0
White 1.18 70.7
African American 0.24 14.4
Hispanic 0.10 6.0
Other/mixed 0.15 9.0
Total 1.67 100.1
Firm ownership structure
Sole proprietorship 51.5
Spousal pair 22.0
Family, kin own 50 percent or more 7.1
Nonfamily-, nonkin-related team 19.3
Total 100.0
Business Creation in the United States: Entry, Startup Activities, and the Launch of New Ventures 201
• The largest proportions, 42 percent, are sole proprietorships; 18 percent are corporations, and 16 percent are partnerships; for 24 percent the legal form has not been determined.
• More than half are operating out of a personal residence, 19 percent at a business site, and no special location is required for 28 percent at the first interview.
• The majority of the customers, 60 percent, are expected to be local, with 21 percent regional, 16 percent national, and 3 percent international.
• Only one in ten expects to have a moderate or major impact on the nature of the markets.
• About one in twenty has a major focus on new technology.
• The average expected size is 18 employees five years after the birth of the new firm; about one-fourth never expect to have employees; 3 percent expect to have 100 or more employees five years after the birth of the firm.
• Average annual sales expected in the fifth year total $880,000; three in ten expect sales to remain under $50,000 per year and 4 percent expect sales to exceed $5 million a year.
• The actual average size of the startup team is 1.7 persons.
• About 62 percent of team members are men, 38 percent women; 56 per-cent are between 25 and 44 years old; 70 percent are white, 14 percent african american, and 6 percent hispanic.
• Half of the nascent enterprises have one owner. One in five is owned by a spousal team, 7 percent by a family-related team, and 19 percent by a team with no family relationships.
There is great variety among the nascent enterprises, as might be expected from a sample of startup efforts reflecting a common phenomenon in a diverse economy.
202 The Small Business Economy
The startup process individuals and teams working to implement a new firm do many things. of considerable interest are both the startup activities and the amount of time and money involved in creating new ventures. The psed project provides unique and detailed information on both.
The procedure used to capture information about these startup activities was similar for both the 1999 and 2005 cohorts. The nascent entrepreneur would be asked if a given activity—such as developing a legal form or seeking external financial support—had been implemented. if they said it had, they were asked the month and year the effort began. The 1999 cohort was asked about 26 different activities associated with starting a new firm; a slightly dif-ferent list of 34 activities was presented to the 2005 cohort. eighteen activities were included in both lists.
The average number of activities reported in the first interview was similar for the two cohorts, 7.2 in 1999 and 8.8 in 2005 (Table 7.13). The distribution is slightly different. despite the larger number of activities in the 2005 inter-view, somewhat fewer reported 9 or more activities, 32.0 percent versus 49.6 percent for the 1999 cohort.
The activities of the two cohorts given in the first detailed interview are rank-ordered by frequency of mention (Table 7.14). perhaps it is no surprise that “serious thought” about the startup is the most common activity, reported by every nascent entrepreneur in 1999 and all but a dozen (1 percent) in 2005. The emphasis on the other activities ranges from 81 percent reporting they had “invested their own money in the startup” to 3 percent reporting “positive monthly cash flow, but for less than three months.” other activities of note are work on a business plan, reported by 55 percent, and “devoting full time to the startup,” reported by 30 percent.67
in the follow-up interview, the nascent entrepreneur is asked to update this profile of activities; any activity not reported as initiated in a prior interview is once again presented for an assessment. This provides a comprehensive overview of both the startup activities initiated and the sequence in which they are pursued.
information from the first detailed interview on the inclusion of these nascent enterprises in established registries is shown for four registration activities for the 1999 cohort and six for 2005 (Table 7.15). some registrations
67 an extensive analysis of business plan preparation, based on the data from the 1999 cohort, was pro-vided in The Small Business Economy: A Report to the President 2007 (Gartner and liao, 2007).
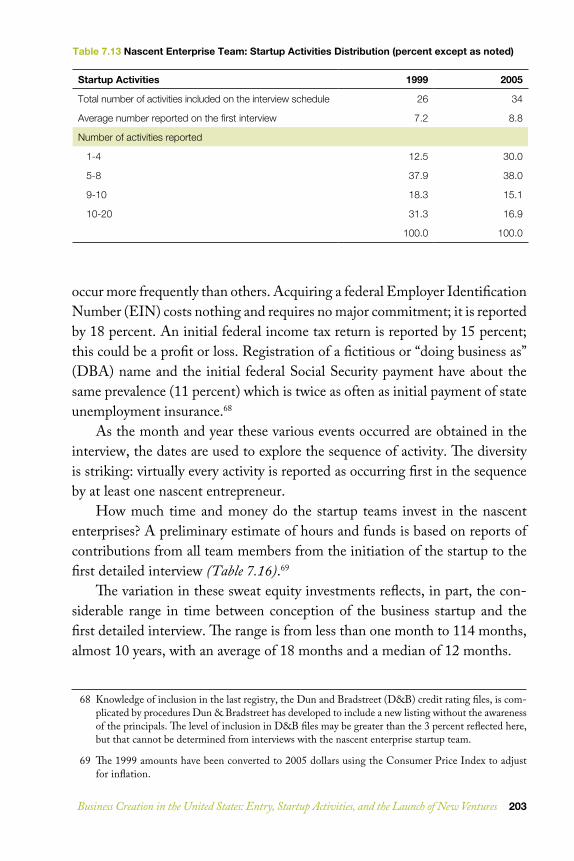
Business Creation in the United States: Entry, Startup Activities, and the Launch of New Ventures 203
occur more frequently than others. acquiring a federal employer identification number (ein) costs nothing and requires no major commitment; it is reported by 18 percent. an initial federal income tax return is reported by 15 percent; this could be a profit or loss. registration of a fictitious or “doing business as” (dba) name and the initial federal social security payment have about the same prevalence (11 percent) which is twice as often as initial payment of state unemployment insurance.68
as the month and year these various events occurred are obtained in the interview, the dates are used to explore the sequence of activity. The diversity is striking: virtually every activity is reported as occurring first in the sequence by at least one nascent entrepreneur.
how much time and money do the startup teams invest in the nascent enterprises? a preliminary estimate of hours and funds is based on reports of contributions from all team members from the initiation of the startup to the first detailed interview (Table 7.16).69
The variation in these sweat equity investments reflects, in part, the con-siderable range in time between conception of the business startup and the first detailed interview. The range is from less than one month to 114 months, almost 10 years, with an average of 18 months and a median of 12 months.
68 Knowledge of inclusion in the last registry, the dun and bradstreet (d&b) credit rating files, is com-plicated by procedures dun & bradstreet has developed to include a new listing without the awareness of the principals. The level of inclusion in d&b files may be greater than the 3 percent reflected here, but that cannot be determined from interviews with the nascent enterprise startup team.
69 The 1999 amounts have been converted to 2005 dollars using the consumer price index to adjust for inflation.
Table7.13NascentEnterpriseTeam:StartupActivitiesDistribution(percentexceptasnoted)
StartupActivities 1999 2005
Total number of activities included on the interview schedule 26 34
Average number reported on the first interview 7.2 8.8
Number of activities reported
1-4 12.5 30.0
5-8 37.9 38.0
9-10 18.3 15.1
10-20 31.3 16.9
100.0 100.0
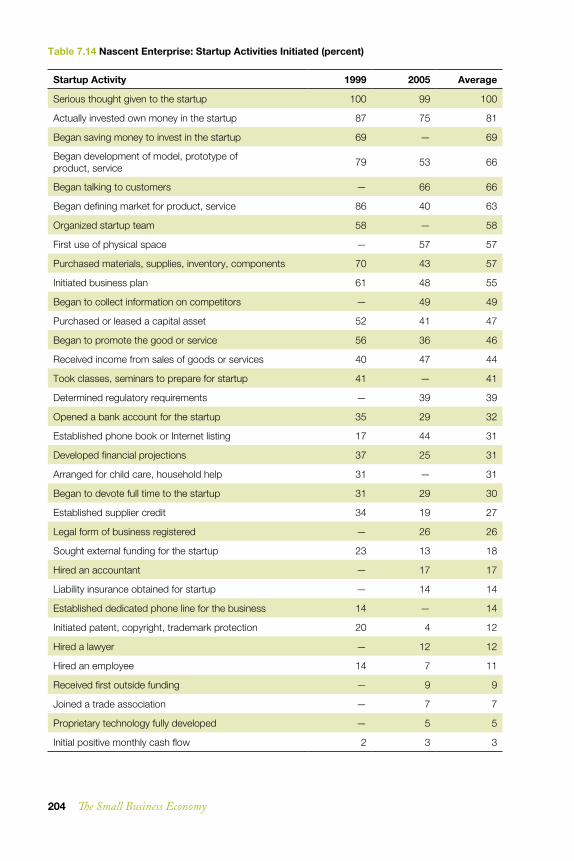
204 The Small Business Economy
Table7.14NascentEnterprise:StartupActivitiesInitiated(percent)
StartupActivity 1999 2005 Average
Serious thought given to the startup 100 99 100
Actually invested own money in the startup 87 75 81
Began saving money to invest in the startup 69 — 69
Began development of model, prototype of product, service 79 53 66
Began talking to customers — 66 66
Began defining market for product, service 86 40 63
Organized startup team 58 — 58
First use of physical space — 57 57
Purchased materials, supplies, inventory, components 70 43 57
Initiated business plan 61 48 55
Began to collect information on competitors — 49 49
Purchased or leased a capital asset 52 41 47
Began to promote the good or service 56 36 46
Received income from sales of goods or services 40 47 44
Took classes, seminars to prepare for startup 41 — 41
Determined regulatory requirements — 39 39
Opened a bank account for the startup 35 29 32
Established phone book or Internet listing 17 44 31
Developed financial projections 37 25 31
Arranged for child care, household help 31 — 31
Began to devote full time to the startup 31 29 30
Established supplier credit 34 19 27
Legal form of business registered — 26 26
Sought external funding for the startup 23 13 18
Hired an accountant — 17 17
Liability insurance obtained for startup — 14 14
Established dedicated phone line for the business 14 — 14
Initiated patent, copyright, trademark protection 20 4 12
Hired a lawyer — 12 12
Hired an employee 14 7 11
Received first outside funding — 9 9
Joined a trade association — 7 7
Proprietary technology fully developed — 5 5
Initial positive monthly cash flow 2 3 3
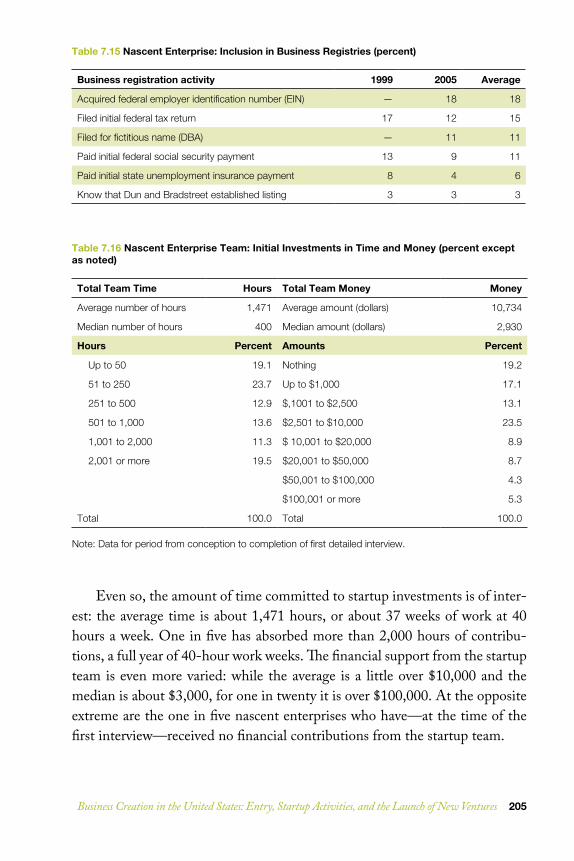
Business Creation in the United States: Entry, Startup Activities, and the Launch of New Ventures 205
Table7.15NascentEnterprise:InclusioninBusinessRegistries(percent)
Businessregistrationactivity 1999 2005 Average
Acquired federal employer identification number (EIN) — 18 18
Filed initial federal tax return 17 12 15
Filed for fictitious name (DBA) — 11 11
Paid initial federal social security payment 13 9 11
Paid initial state unemployment insurance payment 8 4 6
Know that Dun and Bradstreet established listing 3 3 3
even so, the amount of time committed to startup investments is of inter-est: the average time is about 1,471 hours, or about 37 weeks of work at 40 hours a week. one in five has absorbed more than 2,000 hours of contribu-tions, a full year of 40-hour work weeks. The financial support from the startup team is even more varied: while the average is a little over $10,000 and the median is about $3,000, for one in twenty it is over $100,000. at the opposite extreme are the one in five nascent enterprises who have—at the time of the first interview—received no financial contributions from the startup team.
Table7.16NascentEnterpriseTeam:InitialInvestmentsinTimeandMoney(percentexceptasnoted)
TotalTeamTime Hours TotalTeamMoney Money
Average number of hours 1,471 Average amount (dollars) 10,734
Median number of hours 400 Median amount (dollars) 2,930
Hours Percent Amounts Percent
Up to 50 19.1 Nothing 19.2
51 to 250 23.7 Up to $1,000 17.1
251 to 500 12.9 $,1001 to $2,500 13.1
501 to 1,000 13.6 $2,501 to $10,000 23.5
1,001 to 2,000 11.3 $ 10,001 to $20,000 8.9
2,001 or more 19.5 $20,001 to $50,000 8.7
$50,001 to $100,000 4.3
$100,001 or more 5.3
Total 100.0 Total 100.0
Note: Data for period from conception to completion of first detailed interview.
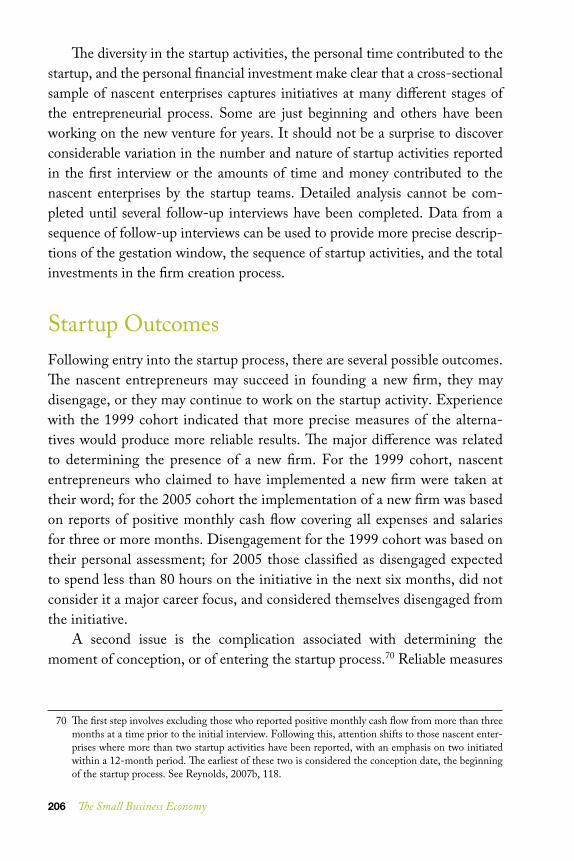
206 The Small Business Economy
The diversity in the startup activities, the personal time contributed to the startup, and the personal financial investment make clear that a cross-sectional sample of nascent enterprises captures initiatives at many different stages of the entrepreneurial process. some are just beginning and others have been working on the new venture for years. it should not be a surprise to discover considerable variation in the number and nature of startup activities reported in the first interview or the amounts of time and money contributed to the nascent enterprises by the startup teams. detailed analysis cannot be com-pleted until several follow-up interviews have been completed. data from a sequence of follow-up interviews can be used to provide more precise descrip-tions of the gestation window, the sequence of startup activities, and the total investments in the firm creation process.
startup outcomes Following entry into the startup process, there are several possible outcomes. The nascent entrepreneurs may succeed in founding a new firm, they may disengage, or they may continue to work on the startup activity. experience with the 1999 cohort indicated that more precise measures of the alterna-tives would produce more reliable results. The major difference was related to determining the presence of a new firm. For the 1999 cohort, nascent entrepreneurs who claimed to have implemented a new firm were taken at their word; for the 2005 cohort the implementation of a new firm was based on reports of positive monthly cash flow covering all expenses and salaries for three or more months. disengagement for the 1999 cohort was based on their personal assessment; for 2005 those classified as disengaged expected to spend less than 80 hours on the initiative in the next six months, did not consider it a major career focus, and considered themselves disengaged from the initiative.
a second issue is the complication associated with determining the moment of conception, or of entering the startup process.70 reliable measures
70 The first step involves excluding those who reported positive monthly cash flow from more than three months at a time prior to the initial interview. Following this, attention shifts to those nascent enter-prises where more than two startup activities have been reported, with an emphasis on two initiated within a 12-month period. The earliest of these two is considered the conception date, the beginning of the startup process. see reynolds, 2007b, 118.
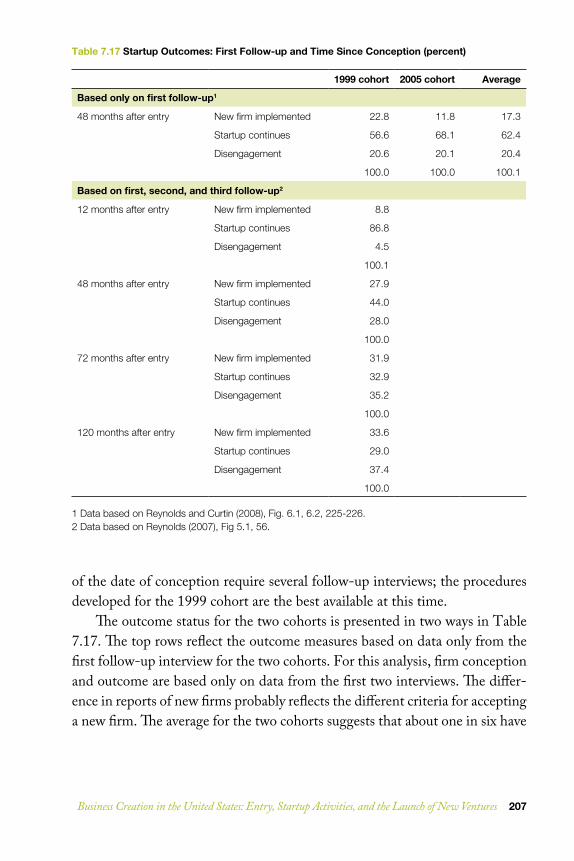
Business Creation in the United States: Entry, Startup Activities, and the Launch of New Ventures 207
of the date of conception require several follow-up interviews; the procedures developed for the 1999 cohort are the best available at this time.
The outcome status for the two cohorts is presented in two ways in table 7.17. The top rows reflect the outcome measures based on data only from the first follow-up interview for the two cohorts. For this analysis, firm conception and outcome are based only on data from the first two interviews. The differ-ence in reports of new firms probably reflects the different criteria for accepting a new firm. The average for the two cohorts suggests that about one in six have
Table7.17StartupOutcomes:FirstFollow-upandTimeSinceConception(percent)
1999cohort 2005cohort Average
Basedonlyonfirstfollow-up1
48 months after entry New firm implemented 22.8 11.8 17.3
Startup continues 56.6 68.1 62.4
Disengagement 20.6 20.1 20.4
100.0 100.0 100.1
Basedonfirst,second,andthirdfollow-up2
12 months after entry New firm implemented 8.8
Startup continues 86.8
Disengagement 4.5
100.1
48 months after entry New firm implemented 27.9
Startup continues 44.0
Disengagement 28.0
100.0
72 months after entry New firm implemented 31.9
Startup continues 32.9
Disengagement 35.2
100.0
120 months after entry New firm implemented 33.6
Startup continues 29.0
Disengagement 37.4
100.0
1 Data based on Reynolds and Curtin (2008), Fig. 6.1, 6.2, 225-226.2 Data based on Reynolds (2007), Fig 5.1, 56.
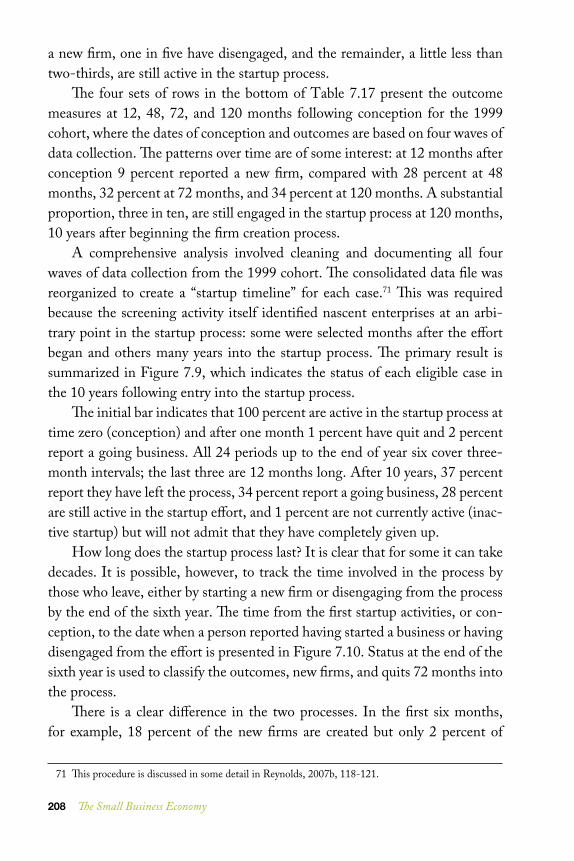
208 The Small Business Economy
a new firm, one in five have disengaged, and the remainder, a little less than two-thirds, are still active in the startup process.
The four sets of rows in the bottom of table 7.17 present the outcome measures at 12, 48, 72, and 120 months following conception for the 1999 cohort, where the dates of conception and outcomes are based on four waves of data collection. The patterns over time are of some interest: at 12 months after conception 9 percent reported a new firm, compared with 28 percent at 48 months, 32 percent at 72 months, and 34 percent at 120 months. a substantial proportion, three in ten, are still engaged in the startup process at 120 months, 10 years after beginning the firm creation process.
a comprehensive analysis involved cleaning and documenting all four waves of data collection from the 1999 cohort. The consolidated data file was reorganized to create a “startup timeline” for each case.71 This was required because the screening activity itself identified nascent enterprises at an arbi-trary point in the startup process: some were selected months after the effort began and others many years into the startup process. The primary result is summarized in Figure 7.9, which indicates the status of each eligible case in the 10 years following entry into the startup process.
The initial bar indicates that 100 percent are active in the startup process at time zero (conception) and after one month 1 percent have quit and 2 percent report a going business. all 24 periods up to the end of year six cover three-month intervals; the last three are 12 months long. after 10 years, 37 percent report they have left the process, 34 percent report a going business, 28 percent are still active in the startup effort, and 1 percent are not currently active (inac-tive startup) but will not admit that they have completely given up.
how long does the startup process last? it is clear that for some it can take decades. it is possible, however, to track the time involved in the process by those who leave, either by starting a new firm or disengaging from the process by the end of the sixth year. The time from the first startup activities, or con-ception, to the date when a person reported having started a business or having disengaged from the effort is presented in Figure 7.10. status at the end of the sixth year is used to classify the outcomes, new firms, and quits 72 months into the process.
There is a clear difference in the two processes. in the first six months, for example, 18 percent of the new firms are created but only 2 percent of
71 This procedure is discussed in some detail in reynolds, 2007b, 118-121.
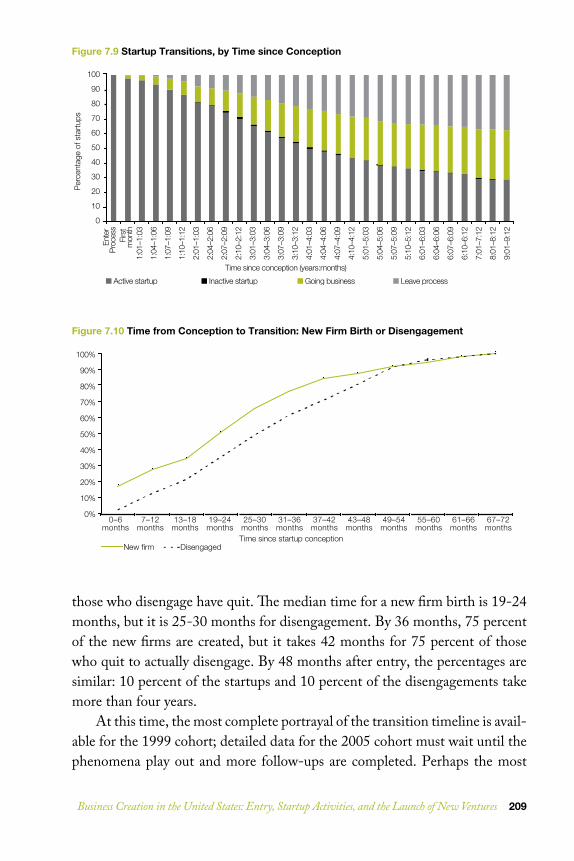
Business Creation in the United States: Entry, Startup Activities, and the Launch of New Ventures 209
those who disengage have quit. The median time for a new firm birth is 19-24 months, but it is 25-30 months for disengagement. by 36 months, 75 percent of the new firms are created, but it takes 42 months for 75 percent of those who quit to actually disengage. by 48 months after entry, the percentages are similar: 10 percent of the startups and 10 percent of the disengagements take more than four years.
at this time, the most complete portrayal of the transition timeline is avail-able for the 1999 cohort; detailed data for the 2005 cohort must wait until the phenomena play out and more follow-ups are completed. perhaps the most
Enter process2:04-2:06 5:10-5:12 7:01-7:128:01-8:12
Percentage of Start-ups
100
90
80
70
60
50
40
30
20
10
0
Time since conception (years:months)
Ente
r Pr
oces
sFi
rst
mon
th1:
01–1
:03
1:04
–1:0
6
1:07
–1:0
9
1:10
–1:1
2
2:01
–1:0
3
2:04
–2:0
6
2:07
–2:0
9
2:10
–2:1
2
3:01
–3:0
3
3:04
–3:0
6
3:07
–3:0
9
3:10
–3:1
2
4:01
–4:0
3
4:04
–4:0
6
4:07
–4:0
9
4:10
–4:1
2
5:01
–5:0
3
5:04
–5:0
6
5:07
–5:0
9
5:10
–5:1
2
6:01
–6:0
3
6:04
–6:0
6
6:07
–6:0
9
6:10
–6:1
2
7:01
–7:1
2
8:01
–8:1
2
9:01
–9:1
2
■ Active startup ■ Inactive startup ■ Going business ■ Leave process
Per
cent
age
of s
tart
ups
Figure7.9StartupTransitions,byTimesinceConception
100%
90%
80%
70%
60%
50%
40%
30%
20%
10%
0%
New firm DisengagedTime since startup conception
0–6months
7–12months
13–18months
19–24months
25–30months
31–36months
37–42months
43–48months
49–54months
55–60months
61–66months
67–72months
Figure7.10TimefromConceptiontoTransition:NewFirmBirthorDisengagement
210 The Small Business Economy
striking feature of this portrayal is the large proportion that take a long time to complete a transition; after seven years, one-third are still actively working on the startup; after 10 years, nearly one in three are still in the startup phase. while it appears that a substantial proportion can reach an early resolution—half that launch a new firm or disengage seem to do so within a couple of years—a large number require more years to reach closure. six years after entry into the startup process, about one-third have launched new firms, one-third have quit, and one-third are still working on the startup.
which nascent enterprises become new Firms? a detailed assessment of the nascent enterprises that appear to complete the transition to a new firm was completed with the 1999 cohort. This was made possible by follow-up data on 648 cases out of 830 considered recent active nascent entrepreneurs. The analysis focused on comparing 200 nascent enter-prises that were operating new firms within 72 months after entering the startup process with 468 nascent enterprises that had discontinued operation or involved entrepreneurs who continued to work on the startup.72
The comparative analysis included more than 130 independent variables. The majority were based on various items and multi-item scales developed by the consortium of scholars who implemented the psed i project, the 1999 cohort, through their participation in the entrepreneurial research consortium.73 These variables can be classified into seven major categories:
• socio-demographic background (13 measures)
• current social and work life context (13 measures)
• personal traits, orientation, and attitudes (35 measures)
• business background and experience (20 measures)
• business and economic context (10 measures)
• business activity and investments (30 measures)
• ambient (host) community (7 measures)
72 This analysis is presented in detail in reynolds, 2007b, 58-85 and 134-153.
73 They are summarized in detail in Gartner, et al. (2004), The handbook of entrepreneurial dynamics.
Business Creation in the United States: Entry, Startup Activities, and the Launch of New Ventures 211
an additional six indices were developed utilizing factor analysis to deter-mine sets of 23 activities that seemed to occur together:74
• business presence: focuses on formal registration, full-time work on the startup, hiring of employees (5 items, 0.72)
• production implementation: focuses on acquiring inputs, use of major assets, sales of the product or service (6 items, 0.72)
• organizational, financial structure: focuses on mobilizing individuals, planning, acquiring outside financing (4 items, 0.59)
• personal planning: thinking about the new business, defining business opportunities, investing own money (3 items; 0.54)
• personal preparation: preparing for participation by taking classes, sav-ing money, arranging for childcare or household help (3 items; 0.36)
• task or product emphasis: focuses on developing the product or service and acquiring intellectual property rights (2 items; alpha = 0.25)
These six measures of startup activity appeared to have a much stronger relationship to successful implementation of a new firm than any of the other factors.
several primary factors seemed to affect the transition from a nascent enterprise to a new firm:
• activity emphasizing production of good or service
• activity emphasizing a presence for the new venture
• nascent entrepreneur business experience, particularly in the same industry
• activity emphasizing development of organizational, financial structures
• startup team financial commitments
• intense rate of time and financial investments by the startup team, time and temporal compression of startup activities
74 chronbach’s alpha values computed at the second year, from reynolds, 2007b, 155.
212 The Small Business Economy
a number of secondary factors seemed to have some impact:
• located in less urbanized, more rural areas
• selected personal traits
• locus of control
• response to pressure by doing better, not differently
• economic sophistication
• social confidence
• ethnic background
• whites, hispanics more successful
it should be noted that neither the nascent entrepreneur’s gender nor age at entry into the process had a statistically significant relation to the outcome—the birth of a new firm. ethnic background had a very modest impact. The unexpected outcome is that major factors associated with entry into the startup process—age, gender, ethnic background—have almost no effect on a success-ful completion of the startup process resulting in a new firm.
The major factors associated with completion of the startup process with a new firm were related to the types of startup activities as well as the intensity of the investments made by the startup team. teams that were very active in the startup and invested substantial personal effort and capital were more success-ful in implementing a new firm. prior experience in the startup industry also seemed to have a positive impact. There was some evidence of more success by entrepreneurs outside urban areas, where there would be less competition. some personal traits had positive impacts. whites or hispanics were slightly more likely to report a new firm than african americans; african americans were more likely to report they were still working on the startup. The propor-tion of entrepreneurs that had quit was the same for all ethnic groups.
but the major message is the absence of any statistically significant associa-tion of the birth of a new firm with 120 variables representing the personal situations, orientations, or motivations of the entrepreneurs—to say nothing of the competitive strategy or planning of the business. The major result is quite straightforward. success at implementing a business reflects what was
Business Creation in the United States: Entry, Startup Activities, and the Launch of New Ventures 213
done in the startup process, not the attributes of the nascent entrepreneurs. It is what an entrepreneur does, not who the entrepreneur is, that counts.
This would suggest that the most effective way to increase the proportions of successful transitions may be to enhance the skills and training of the startup teams—to enhance their capacity to be entrepreneurs, not simply to enhance their desire to start businesses with motivational speeches.
informal investments in business creationwhat is the social cost of business creation activity—the startup sector? Millions of individuals are trying to create new firms, and each nascent enter-prise receives considerable informal investment in time and capital from the startup teams. it would be of some interest to have an estimate of the total amount of this investment and relate this cost to the outcomes of the pro-cess. in other words, how much of this “sweat equity”—volunteer time and capital—is associated with a successful firm launch and how much represents costs that may never be recovered?
a number of key adjustments and assumptions were required to use the psed data to estimate the cost.75 The result is a harmonized initial estimate of the average annual informal investment in nascent enterprises, by outcome.
selected features are presented in table 7.18. The first set of rows pres-ents the estimates of the outcome at 48 months, where there is a considerable difference between the two cohorts in terms of the transition to a new firm. For the 1999 cohort, where the criterion was the judgment of the respond-ing nascent entrepreneur, 23 percent report a new firm at 48 months after entry into the process. For the 2005 cohort, where a more precise criterion of three months of positive cash flow was utilized, 12 percent are considered new firms at 48 months. The second set of rows provides estimates of the time between entry into the process, conception, and the initial detailed interview.
75 The following adjustments were made: all analysis was completed separately for the 1999 and 2005 cohort, to retain any evidence of changes over these two time periods. procedures to develop harmo-nized timelines for the 1999 and 2005 cohorts, based only on the detailed first interview and initial follow-up interview were used to determine the date of conception—entry into the startup process—for all nascent entrepreneurs. The total hours and funds committed by all members of the startup teams from conception to the first detailed interview were computed for the 1999 and 2005 cohorts. to minimize the effects of the extreme cases, extremely high values were reset to three standard devia-tions above the mean. all 1999 dollars were converted to 2005 values using the consumer price index. These procedures and estimates are discussed in more detail in reynolds and curtin, 2008, chapter 7 and appendix c.
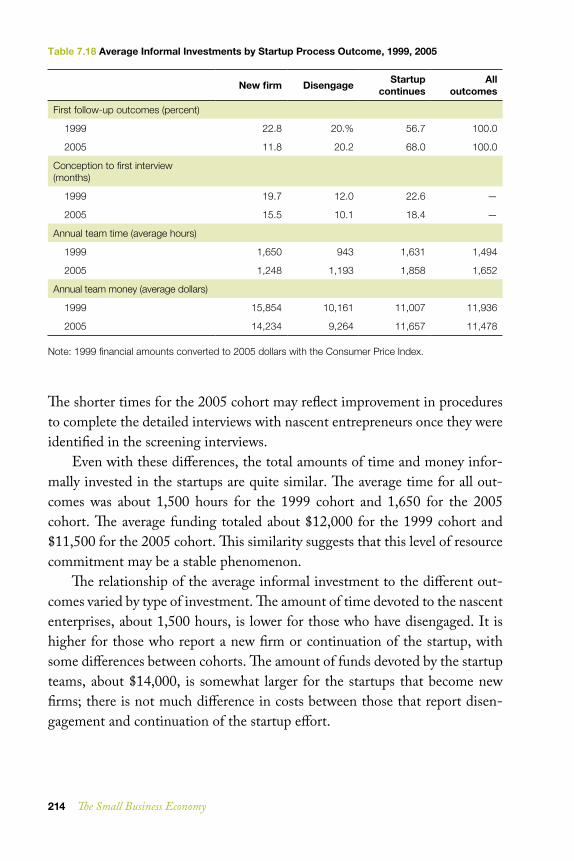
214 The Small Business Economy
The shorter times for the 2005 cohort may reflect improvement in procedures to complete the detailed interviews with nascent entrepreneurs once they were identified in the screening interviews.
even with these differences, the total amounts of time and money infor-mally invested in the startups are quite similar. The average time for all out-comes was about 1,500 hours for the 1999 cohort and 1,650 for the 2005 cohort. The average funding totaled about $12,000 for the 1999 cohort and $11,500 for the 2005 cohort. This similarity suggests that this level of resource commitment may be a stable phenomenon.
The relationship of the average informal investment to the different out-comes varied by type of investment. The amount of time devoted to the nascent enterprises, about 1,500 hours, is lower for those who have disengaged. it is higher for those who report a new firm or continuation of the startup, with some differences between cohorts. The amount of funds devoted by the startup teams, about $14,000, is somewhat larger for the startups that become new firms; there is not much difference in costs between those that report disen-gagement and continuation of the startup effort.
Table7.18AverageInformalInvestmentsbyStartupProcessOutcome,1999,2005
Newfirm Disengage Startupcontinues
Alloutcomes
First follow-up outcomes (percent)
1999 22.8 20.% 56.7 100.0
2005 11.8 20.2 68.0 100.0
Conception to first interview (months)
1999 19.7 12.0 22.6 —
2005 15.5 10.1 18.4 —
Annual team time (average hours)
1999 1,650 943 1,631 1,494
2005 1,248 1,193 1,858 1,652
Annual team money (average dollars)
1999 15,854 10,161 11,007 11,936
2005 14,234 9,264 11,657 11,478
Note: 1999 financial amounts converted to 2005 dollars with the Consumer Price Index.
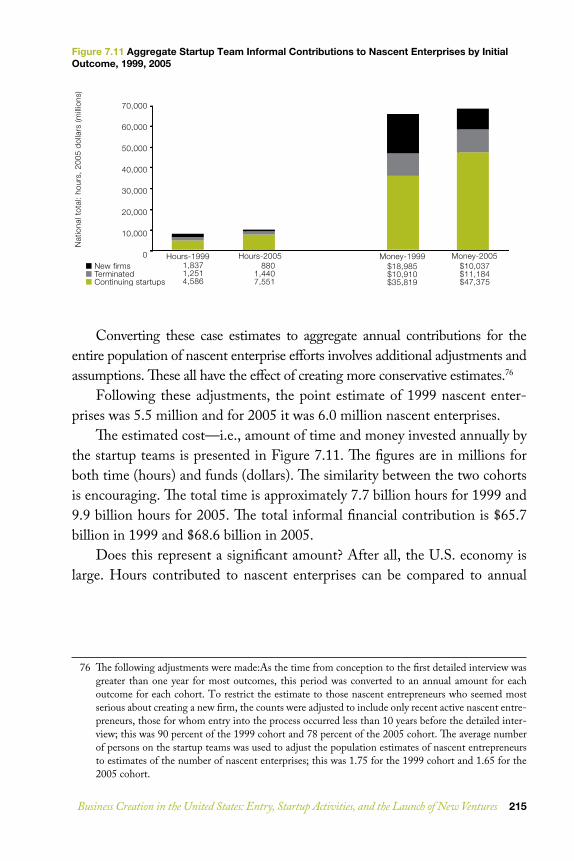
Business Creation in the United States: Entry, Startup Activities, and the Launch of New Ventures 215
converting these case estimates to aggregate annual contributions for the entire population of nascent enterprise efforts involves additional adjustments and assumptions. These all have the effect of creating more conservative estimates.76
Following these adjustments, the point estimate of 1999 nascent enter-prises was 5.5 million and for 2005 it was 6.0 million nascent enterprises.
The estimated cost—i.e., amount of time and money invested annually by the startup teams is presented in Figure 7.11. The figures are in millions for both time (hours) and funds (dollars). The similarity between the two cohorts is encouraging. The total time is approximately 7.7 billion hours for 1999 and 9.9 billion hours for 2005. The total informal financial contribution is $65.7 billion in 1999 and $68.6 billion in 2005.
does this represent a significant amount? after all, the u.s. economy is large. hours contributed to nascent enterprises can be compared to annual
76 The following adjustments were made:as the time from conception to the first detailed interview was greater than one year for most outcomes, this period was converted to an annual amount for each outcome for each cohort. to restrict the estimate to those nascent entrepreneurs who seemed most serious about creating a new firm, the counts were adjusted to include only recent active nascent entre-preneurs, those for whom entry into the process occurred less than 10 years before the detailed inter-view; this was 90 percent of the 1999 cohort and 78 percent of the 2005 cohort. The average number of persons on the startup teams was used to adjust the population estimates of nascent entrepreneurs to estimates of the number of nascent enterprises; this was 1.75 for the 1999 cohort and 1.65 for the 2005 cohort.
Nat
iona
l tot
al:
hour
s, 2
005
dolla
rs (m
illio
ns)
70,000
60,000
50,000
40,000
30,000
20,000
10,000
0 Hours-1999 Hours-2005 Money-1999 Money-20051,8371,2514,586
8801,4407,551
$18,985$10,910$35,819
$10,037$11,184$47,375
■ New firms■ Terminated■ Continuing startups
Figure7.11AggregateStartupTeamInformalContributionstoNascentEnterprisesbyInitialOutcome,1999,2005
216 The Small Business Economy
hours worked in the united states.77 based on the number of employed per-sons and the average hours worked for 50 weeks in a year, the totals for hours worked in the united states were 253 billion in 1999 and 267 billion in 2005. The amount of uncompensated time devoted to nascent enterprises is 2.1 per-cent of the paid work total for 1999 and 2.7 percent for 2005. This nascent enterprise total is close to one-half of the total work of self-employed work-ers—20 billion hours in 1999 and 18 billion hours in 2005.
comparisons of the informal funding of these enterprises to other bench-marks are less precise. The amount of venture capital funding to seed and startup firms was about $3.7 billion in 1999 at the peak of the dot-com boom, and $0.8 billion in 2005, a more normal period.78 The total number of firms receiving venture capital support was less than 3,000 in 1999 and less than 2,000 in 2005. hence, this informal financial support for nascent enterprises was 18 times ($65.7 billion/$3.7 billion) to 86 times ($68.6 billion/$0.8 billion) greater than venture capital support for startups over the same period. This would suggest that informal investment by startup teams in nascent enterprises is a significant unrecognized investment in the u.s. economy.
perhaps more dramatic are the clear differences between these informal investments and the outcomes. averaging across the two cohorts, 16 percent of the time is invested in nascent enterprises that appear to be new firms, 15 percent in those that have been discontinued, and 68 percent in those that continue in the startup mode. The ratios for informal financial investments are similar, with 22 percent invested in startups that become new firms, 17 percent that are dis-continued, and 62 percent in those continuing in the startup process.
More information would be very helpful. it takes more than five years for most nascent enterprises to complete the transition to a new firm: the comple-tion of more follow-ups with the 2005 cohort will make possible more precise information on the total social investment. but even taking this into consider-ation, it is striking that most time and funding invested in nascent enterprises is not associated with the creation of an operating new firm. Most costs are borne by startup teams—and their families—who do not receive the benefits of a viable new firm.
77 data on the number of persons active in employment, including the self-employed, and hours worked for 1999 are from tables 656 and 658 of The statistical abstract of the United States (2000). For 2005 they are from tables 587 and 588 from the u.s. bureau of labor statistics, Employment and earnings, January 2006: www.bls.gov/cps/home.htm.
78 National Venture Capital Association yearbook, 2007.
Business Creation in the United States: Entry, Startup Activities, and the Launch of New Ventures 217
There is little question that new firms are major contributors to the econ-omy and generate careers and employment for many. naturally, these benefits have costs in both the time and financial resources devoted to the nascent enterprises by the startup teams. The benefit-cost ratio would improve if the costs borne by the startup teams—and their friends and families—were reduced. This could be done by providing training and assistance that would improve the success rate—so more nascent enterprises actually became viable new firms. such training might also help entrepreneurs to more readily deter-mine when an enterprise is not viable, thereby reducing their investment of time and financial capital.
in contrast to the serious startups, there are startups that may be defined as “recreational” where some entrepreneurs view the startup process as a perma-nent hobby. These activities are unlikely to be a serious policy concern.
cross-national comparisons Given intense global competition and the desire to strengthen national eco-nomic growth, there is considerable interest in the relative entrepreneurial capacity of the united states.79 it is possible to compare the prevalence of new firm creation with other countries, facilitated by the widespread adoption of the screening procedures developed for the 1999 cohort, psed i.80 The Global entrepreneurship Monitor (GeM) research design was a modified version of the psed i procedure. as of 2008, it has been implemented in 50 countries, in some for as many as 10 annual surveys. while the actual procedures to locate individuals active in firm creation are very similar, there is less detail on the nascent enterprises and new ventures than in the psed. even so, it is possible to develop some preliminary comparisons.
The major measure of firm creation activity combines counts of those in the startup phase working with nascent ventures with counts of new firms up to 42 months old. This measure, the total entrepreneurial activity or tea index (also called the early-stage index) allows for comparisons across countries and regions. because of differences in the adult sample of these
79 council on competitiveness, 2007; schramm, 2006.
80 reynolds, bosma, autio and others, 2005.
218 The Small Business Economy
population surveys, the population base includes adults 18 to 64 years of age; all u.s. data have been adjusted to this base for this assessment.81
a comparison of six regions and countries is presented in Figures 7.12 and 7.13; they include large asian countries (india, china), the united states, latin american countries (Mexico, brazil, and argentina), western europe (belgium, denmark, Finland, Germany, ireland, italy, netherlands, norway, spain, sweden, switzerland, and the united Kingdom), canada, and Japan. Figure 7.12 indicates the prevalence rate (the line) and estimated total counts (the bars) of tea-active individuals in these regions. because of the signifi-cant differences in total counts, the bars are scaled logarithmically, as indicated on the left of the figure. while the prevalence rate for india and china, at about 15 per 100, is slightly higher than that of the united states, at about 11, the number of individuals involved, at 200 million, is 10 times the 20 million for the united states. The counts for the three latin american countries at 26 million are similar to the u.s. counts; western europe’s entrepreneurial count at 11 million is considerably lower. canada and Japan, each at about 2 million, are similar, even though Japan has four times as many people.
The respondents in these surveys, whether they are reporting on a nascent enterprise or a young business, are asked about their growth aspirations and their expectations of firm size in five years. This allows the identification of those who anticipate having more than 20 employees in five years. The preva-lence rates and estimated counts for these high-growth firms are displayed in Figure 7.13.82
The high growth tea prevalence rates for the united states, 1.5 per 100, are the highest in the chart, and translate into about 3 million individuals. india and china have slightly lower prevalence rates, about 1.0 per 100, but 15 million high-growth-oriented tea entrepreneurs, five times the number of the united states. The high-growth prevalence rates and counts for all other areas are somewhat lower than those of the united states. For latin america and western europe, the estimated counts are slightly more than 1 million, for canada about 300,000, and for Japan about 100,000.
This assessment would suggest that the united states is more than hold-ing its own with respect to the emergence of growth-oriented entrepreneurs. There is little current threat from Japan, western europe, or latin america.
81 reynolds, bygrave, autio, and others, 2004.
82 autio, 2007, table 3.
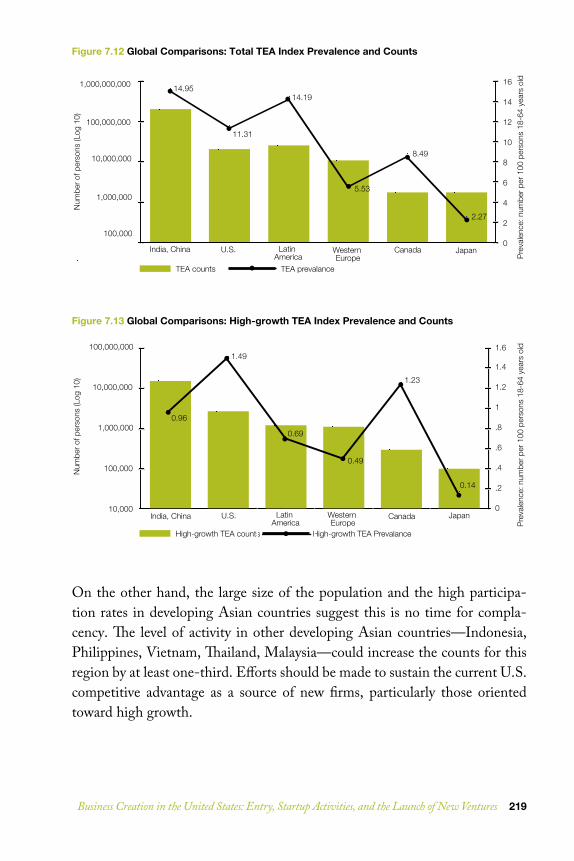
Business Creation in the United States: Entry, Startup Activities, and the Launch of New Ventures 219
on the other hand, the large size of the population and the high participa-tion rates in developing asian countries suggest this is no time for compla-cency. The level of activity in other developing asian countries—indonesia, philippines, vietnam, Thailand, Malaysia—could increase the counts for this region by at least one-third. efforts should be made to sustain the current u.s. competitive advantage as a source of new firms, particularly those oriented toward high growth.
Figure7.12GlobalComparisons:TotalTEAIndexPrevalenceandCounts
Figure7.13GlobalComparisons:High-growthTEAIndexPrevalenceandCounts
Number of persons (Log10)
Num
ber o
f per
sons
(Log
10)
Pre
vale
nce:
num
ber p
er 1
00 p
erso
ns 1
8-64
yea
rs o
ld
1,000,000,000
100,000,000
10,000,000
100,000
1,000,000
16
14
12
10
8
6
4
2
0India, China U.S. Latin
AmericaWestern Europe
Canada Japan
TEA counts TEA prevalance
14.95
11.31
14.19
5.53
8.49
2.27
Num
ber o
f per
sons
(Log
10)
Pre
vale
nce:
num
ber p
er 1
00 p
erso
ns 1
8-64
yea
rs o
ld1.6
1.4
1.2
1
.8
.6
.4
.2
0
High-growth TEA counts High-growth TEA Prevalance
Number of Persons (Log10)Prevalance: #/100 18064 years old
100,000,000
10,000,000
100,000
1,000,000
10,000India, China U.S. Latin
AmericaWestern Europe
Canada Japan
0.96
1.49
0.69
0.49
1.23
0.14
220 The Small Business Economy
overview and implications The psed research program has made major contributions to understanding the process of business creation. by focusing on the individuals who take the initiative to develop new ventures, and locating them with procedures that are independent of all other mechanisms for developing lists of business activity, the psed provides a completely independent source of information about the entrepreneurial process. The only biases in the procedure are those inherent in any survey designed to identify a representative sample of adults, and the methodology employed is “state of the art.” in addition, the psed datasets have a significant correspondence with other data developed to represent the process of business creation (see appendix 7c). The cohorts selected in 1999 and 2005 can be used to estimate the number of nascent entrepreneurs and nascent enterprises in the u.s. population.
a number of findings from this research program have major implications for the study of business creation:
• The scope of activity is considerable, with 12 million people trying to create more than 7 million new businesses in 2005.
• The major factors affecting participation in new firm creation seem to reflect the background and situation of the individual—age, gender, sup-portive context.
• All segments of the population are involved—regardless of age, gender, ethnic background, educational attainment, financial resources. Those with some attributes are more likely to be involved—men, early-career adults—but no groups are excluded.
• Half of the nascent enterprises reflect self-employment, 30 percent a spousal pair or a family initiative, and 20 percent a group organized solely to create a new venture. These latter teams organized around business objectives tend to be more growth-oriented.
• The nascent enterprises are a mirror image of existing businesses in their industry sectors; they are just as diverse as existing firms.
• There is considerable diversity in the startup patterns. While some entre-preneurs have new firms operating in a matter of months, it takes four
Business Creation in the United States: Entry, Startup Activities, and the Launch of New Ventures 221
years for the majority of nascent enterprises to achieve an operational resolution, and even then a full two-fifths are continuing in the startup mode. by six years, two-thirds have achieved an operational resolution.
• The major factors affecting success in completing the startup process with a new business are related to what is actually done to implement a new firm and the work experience of the individual, particularly experience relevant to the industry of the startup. personal attributes and charac-teristics have little influence. success reflects what nascent entrepreneurs do, not who they are.
This research program has implications for a variety of audiences, includ-ing researchers, practitioners, and policymakers.
Implications for Researchas a resource for scholars, the psed datasets provide a description of the firm creation process from the conception through the birth of a new firm. There is also a substantial amount of information on the stages of this and related processes. The data may be used to explore the applicability and relative impact of a wide range of theories, models, or hypotheses regarding the firm creation process. numerous indicators are available to measure various aspects of these nascent enterprises. This makes it possible to directly test different theories of firm creation. before the availability of the psed datasets, it was not possible to analyze the impact of a wide range of factors on the firm’s startup processes. in addition, as both the 1999 and 2005 cohorts are nationally representative samples, inferences to the u.s. population are possible.
analysis of the data uncovered two unexpected features of the firm creation phenomenon. First was the complexity and diversity of the process. Many fac-tors affect business creation. identifying the key causal mechanisms will take considerable effort by entrepreneurship scholars. second was the extensive time required for most nascent enterprises to reach a resolution. This means that unless follow-up interviews are completed for four to six years after the cohorts are screened and the initial interviews are completed, a great deal of information will be lost regarding the outcome for a substantial proportion of new firms. research on the impact of the startup process on the growth and survival of the new firms will require additional data collection, perhaps for up to 10 years or more.
222 The Small Business Economy
The techniques required to create common timelines for each new venture, compensating for the fact that the screening identifies nascent enterprises at different stages of development, are not routine, but these procedures are in the public domain and they dramatically change the character and descriptions of the startup process.
Implications for Practitioners—Nascent Entrepreneurstwo implications for practitioners seem significant. First, people from all seg-ments of society are active in business creation; anyone who gets involved will have a great deal of company. second, the most important factors associated with successful completion of the process with a new firm are related to know-ing the industry and aggressively pursuing the opportunity. individual back-ground and personal attributes are much less significant.
what entrepreneurs do is much more important than who they are. That does not mean that it is easy to start a business. it is reasonable to expect the startup process to require the equivalent of one year of full-time work and tens of thousands of dollars. Most of those who implement a new firm seem to work on the project with considerable intensity—doing many things and investing a great deal of time and money in a relatively short period of time. it would appear that those who discover that the business opportunity is not viable and quickly disengage from the process also make intense investments in the startup process—and get an early answer to the question of viability. They soon discover that the opportunity is not there and move on to other alternatives.
so what is the bottom line for aspiring entrepreneurs? Know what you are doing and do it.
Implications for PolicyMany of the policy implications are related to the image of the business cre-ation process in the united states:
• Participation in business creation, as a personal career choice, is a very stable phenomenon: policy initiatives are not likely to make major changes in the level of activity.
Business Creation in the United States: Entry, Startup Activities, and the Launch of New Ventures 223
• It takes many nascent enterprises to create new firms. In a given year, for example, 12 million nascent entrepreneurs are trying to start 7.4 million nascent enterprises that will eventually become 600,000 employer firms.
• Half of the nascent enterprises reflect team efforts; one in five nascent enterprises reflects the efforts of a team assembled solely for the purpose of creating a new venture.
• Nascent entrepreneurs, individually or as teams, contribute substantial resources, voluntarily and informally, to startups—as much as 2 to 3 per-cent of the total time invested in paid work and $60 billion per year in informal financial contributions. Most of the investments are made by individuals who will not implement new firms and will not personally benefit from this investment.
• Efforts to improve the process might focus on improved training and knowledge for the nascent entrepreneurs.83 There is no shortage of per-sons willing to devote substantial effort to creating a new firm; the most effective way to increase the probability of success may to provide training and managerial assistance to active nascent entrepreneurs. This should not, however, take the form of specialized training in entrepreneurship alone. entrepreneurship training should augment training for all types of crafts, occupations, vocations, and professions. Most firms are started by those who have not completed college. substantive training and edu-cation creates a fuller understanding of future customers, markets, and industry practices—information that can lead to the identification of opportunities. having the skills and information needed to implement a new firm will facilitate developing new ventures that reflect emerging business opportunities.
• The United States is a major source of the world’s new firms, both firms that produce traditional goods and services for local consumption and those designed for high growth. it is evident that there is a substantial competitive threat from asia. This is not a good time to be complacent
83 an extensive discussion of educational efforts associated with entrepreneurship is provided in weaver, dickson, and solomon (2006), chapter 5 of The small business economy: A report to the president for data year 2006.
224 The Small Business Economy
about the role of new firm creation in the united states and the potential of new firms to increase u.s. global competitiveness.
These implications reflect the systematic study of the firm creation process, focusing on the persons and teams that take action to organize and establish new ventures.
Future PSED Research Project Applicationsresources at the national, state, and local level devoted to facilitating entre-preneurship are enormous—in the tens of billions of dollars. however, these efforts could be more efficient and effective with improved understanding of the business creation process. The type of information assembled by the psed research program provides a unique resource for informing policy discussions. two initiatives, with modest costs compared to the current program invest-ments, are under way:
• The PSED II project, the source of data on the 2005 cohort, has just com-pleted the third wave of data collection with the 24-month follow-up. low-cost annual follow-up for five or more years would provide more precision on the ultimate resolution for a larger proportion of nascent enterprises and allow for tracking the growth and survival of the new firms identified in the early follow-up interviews. no scientific descrip-tions of these early stages of the business life course currently exist.
• The Current Population Survey completes 50,000 interviews each month to determine the labor force activity of the u.s. population. The psed screening procedures—which have been thoroughly field-tested in the united states and 50 other countries—take less than two minutes, on average, to locate active nascent entrepreneurs. if this screening were incorporated into the cps it would provide precise monthly data on business creation activity in the united states. This would facilitate, in a major way, tracking this critical feature of business dynamics in the u.s. economy.
as a research innovation, the psed research protocol has been successful beyond expectations. it is now developed to the point of providing systematic reliable information on the early stages of business dynamics, information of great value in tracking and guiding the development of the u.s. economy.
Business Creation in the United States: Entry, Startup Activities, and the Launch of New Ventures 225
referencesacs, Zoltan. J. and catherine armington (2004). employment growth and
entrepreneurial activity in cities. Regional Studies, 38(9):911-927.acs, Zoltan. J. and catherine armington (2006). Entrepreneurship, geogra-
phy, and American economic growth. cambridge, uK: cambridge university press.
aldrich, howard e. (2005). entrepreneurship. chapter 20 in n.J. smelser and r. swedberg (eds). Handbook of economic sociology. princeton: nJ: princeton university press, 451-477.
aldrich, howard e. and r. waldinger (1990). ethnicity and entrepreneur-ship. Annual Review of Sociology 16:111-135.
alsos, G. a. and l. Kolvereid (1998). The business gestation process of nov-ice, serial, and parallel business founders. Entrepreneurship Theory and Practice 22(4):101-114.
armington, catherine and Majorie odle (1982). small business: how many jobs? Brookings Review 20:14-17.
audretsch, david b. (1995). Innovation and industry evolution. cambridge, Ma: Mit press.
audretsch, david b., Max c. Keilbach, and erik e. lehmann (2006). Entrepreneurship and economic growth. new york: oxford university press.
autio, erkko (2007). Global entrepreneurship monitor: 2007 global report on high-growth entrepreneurship. babson park, Ma and london, uK: babson college and london business school.
baumol, william J. (2005). small firms: why market-driven innovation can’t get along without them. chapter 8 in u.s. small business administration (2004). The small business economy: A report to the president. washington, d.c.: u.s. Government printing office, 183-206.
baumol, william J., robert e. litan, and carl J. schramm (2007). Good capi-talism, bad capitalism, and the economics of growth and prosperity. new haven: yale university press.
bhide, amar v. (2000). The origin and evolution of new business. new york: oxford university press.
birch, david a. (1979). The job generation process. cambridge, Ma: Mit program on neighborhood and regional change. report prepared
226 The Small Business Economy
for the u.s. department of commerce, economic development administration.
birch, david (1981). who creates jobs? The Public Interest 6:3-14.blanchflower, david G. (2000). Self-employment in OECD countries.
cambridge, Ma: nber working paper 7486. brown, charles, Jay hamilton, and James Medoff (1990). Employers large and
small. cambridge, Ma: harvard university press. caroll, Glenn r. and Michael t. hannan (2000) The demography of corpora-
tions and industries. princeton, nJ: princeton university press. carter, n. M., w. b. Gartner, K. G. shaver, and e. J. Gatewood (2003).
The career reasons of nascent entrepreneurs. Journal of Business Venturing 18:13-29.
cantillon, richard (1730). Essai sur la nature du commerce en général (Essay on the nature of trade in general). henry higgs (translator and editor). london: Frank cass and company, ltd.
council on competitiveness (2007). Where America stands: Entrepreneurship com-petitiveness index. washington, d.c.: council on competitiveness.
crosa, b., aldrich, h. a., & Keister, l. a. (2002). is there a wealth effect? Financial and human capital determinants of business startups. in w. d. bygrave et al. (ed.), Frontiers of entrepreneurship research 2002. wellesley, Ma: babson college.
davidsson, per (2004). Researching entrepreneurship. new york: springer. davidsson, per (2006). nascent entrepreneurship: empirical studies and devel-
opments. Foundations and Trends in Entrepreneurship 2(1):1-76. davis, steven J., John haltiwanger, and scott schuh (1996). Job creation and
destruction. cambridge, Ma: Mit press. delmar, F., & davidsson, p. (2000). where do they come from? prevalence
and characteristics of nascent entrepreneurs. Entrepreneurship & Regional Development, 12, 1-23.
de rearte, a. G., e. lanari, and p.a.a. J. atucha (1998). El proceso de creac-tion de empresas: Abordaje methodologico y primeros resultados de unstu-dio regional. argentina: universidad nactional de Mar del plata.
diochon, Monica, teresa v. Menzies, and yvon Gasse (2007). From becoming to being: Measuring firm creation. Journal of Enterprising Culture 15(1):21-42.

Business Creation in the United States: Entry, Startup Activities, and the Launch of New Ventures 227
dunn, Thomas, and douglas holtz-eakin (2000). Financial capital, human capital, and the transition to self-employment: evidence from inter-generational links. Journal of Labor Economics 18(2):282-305.
eisenhardt, K. M and c. b. schoonhoven (1990). organizational growth: linking founding team, strategy, environment and growth among u.s. semiconductor ventures: 1978-1988. Administrative Science Quarterly 35:504-529.
evans, david s. and linda s. leighton (1989). some empirical aspects of entrepreneurship. American Economic Review 79(3):519-35.
Fairlie, robert w. (2006). Kauffman index of entrepreneurial activity: National report 1996-2005. Kansas city, Mo: ewing Marion Kauffman Foundation.
Foster, lucia, John haltiwanger, and c. J. Krizan (2002). The link between aggregate and micro productivity growth: Evidence from retail trade. nber working paper series #9120. cambridge, Ma: national bureau of economic research.
Foster, lucia, John haltiwanger, and chad syverson (2005). Reallocation, firm turnover, and efficiency: Selection on productivity or profitability? nber working paper series #11555. cambridge, Ma: national bureau of economic research.
Gartner, william b. (1988). “what is an entrepreneur” is the wrong question. American Small Business Journal (spring): 11-31.
Gartner, william b. and Jianwen liao (2007). pre-venture planning. chapter 7 in u.s. small business administration (2007). The small busi-ness economy: A report to the president. washington, d.c.: u.s. Government printing office, 213-264.
Gartner, w.b., K.G. shaver, n. M. carter, and p. d. reynolds (eds.) (2004). Handbook of entrepreneurial dynamics: The process of business creation. Thousand oaks, ca: sage publications.
Geroski, paul (1995). what do we know about entry? International Journal of Industrial Organization 13:421-440.
Glasser, edward l. (2007). Entrepreneurship and the city. discussion paper 2140. cambridge, Ma: harvard institute of economic research.
hamilton, barton h. (2000). does entrepreneurship pay? an empirical analy-sis of the returns to self-employment. Journal of Political Economy 108(3): 604-631.
228 The Small Business Economy
hannan, Michael t. and John Freeman (1989). Organizational ecology. cambridge: harvard university press.
hannan, Michael t. and John Freeman (1977). The population ecology of organizations. The American Journal of Sociology 82:929-964.
haltiwanger, John, lisa M. lynch, and christopher Mackie (eds.) (2007). Understanding business dynamics: An integrated data system for America’s future. washington, d.c.: national academies press.
ichbiah, daniel and susan l. Knepper (1991). The making of Microsoft. rocklin, ca: prima publishing.
Kaplan, s.n., b.a.sensoy, and p. stromberg (2005). What are firms? Evolution from birth to public companies. nber working paper series #11581. cambridge, Ma: national bureau of economic research.
Kets de vries, Manfred F. r. (1985). The dark side of entrepreneurship. Harvard Business Review. 64:6, 160-167.
Kim, p. h., h. a. aldrich, and l. a. Keister (2003). If I were rich? The impact of financial and human capital on becoming a nascent entrepreneur. paper presented at the annual Meeting of the american sociological association, atlanta.
Kirzner, israel M. (1979). Perception, opportunity, and profit: Studies in the the-ory of entrepreneurship. chicago: university of chicago press.
Klepper, steven (2002). The capabilities of new firms and the evolution of the u.s. automobile industry. Industrial and Corporate Change 11(6):645-666.
Knight, Frank h. (1921). Risk, uncertainty, and profit. new york: a. M. Kelly (1964 reprint).
le, anh t. (1999). empirical studies of self-employment. Journal of Economic Surveys 13 (4): 381-386.
light, ivan and edna bonacich (1988). Immigrant entrepreneurs: Koreans in Los Angeles, 1965-1982. berkeley, ca: university of california press.
Mathematica policy research (2007). building and sustaining innovative companies: The Kauffman firm survey. www.mathematica-mpr.com/surveys/kauffmanfirm.asp..
Mcclelland, david c. (1961). The achieving society. ny: van norstrand. Menzies, t. v., y. Gasse, M.dichon, and d. Garand (2002). Nascent entre-
preneurs in Canada: An empirical study. paper presented at the 47th meeting of the icsb world conference, san Juan, pr, June.
Business Creation in the United States: Entry, Startup Activities, and the Launch of New Ventures 229
national venture capital association (2007). National Venture Capital Association yearbook 2007. arlington, va: national venture capital association.
orr, d. (1974). The determinants of entry: a study of the canadian manufacturing industries. Review of Economics and Statistics 61:58-66.
parker, simon c. (2004). The economics of self-employment and entrepreneurship. cambridge, uK: cambridge university press.
penrose, edith t. (1959). The theory of the growth of the firm. oxford, uK: blackwell.
portes, llejandro and ruben G. rumbaut (2006). Immigrant America: A por-trait. berkeley, ca: university of california press.
reynolds, paul d. (1991). sociology and entrepreneurship: concept and con-tributions. Entrepreneurship Theory and Practice. 16(2):47-70.
reynolds, paul d. (2000). national panel study of u.s. business startups: background and methodology. in Jerome a. Katz (ed.), Advances in entrepreneurship, firm emergence and growth, vol. 4. stamford, ct: Jai press, 153-228.
reynolds, paul d. (2004). nature of business startups, chapter 23 in w. b. Gartner, K. G. shaver, n. M. carter, and p. d. reynolds (eds), Handbook of entrepreneurial dynamics: The process of business creation. Thousand oaks, ca: sage, 244-258.
reynolds, paul d. (2007a). Entrepreneurship in the U.S.: The future is now. new york: springer.
reynolds, paul d. (2007b). new firm creation in the u.s.: a psed i over-view. Foundations and Trends in Entrepreneurship 3(1):1-149.
reynolds, paul d. (2008) screening item effects in estimating the prevalence of nascent entrepreneurs. Small Business Economics (in press).
reynolds, paul, niels bosma, erkko autio, steve hunt, natalie de bono, isabel servais, paloma lopez-Garcia, and nancy chin (2005). Global entrepreneurship monitor: data collection design and imple-mentation: 1998-2003. Small Business Economics 24: 205-231.
reynolds, paul d., william d. bygrave, erkko autio, and others (2004). Global entrepreneurship monitor: 2003 summary report . babson park, Ma: babson college.
reynolds, paul d. and richard t. curtin (2008). business creation in the united states: panel study of entrepreneurial dynamics ii first wave results. in Foundations and trends in entrepreneurship (in press).

230 The Small Business Economy
reynolds, p.d., n. M. carter, w.b. Gartner, and p. G. Greene (2004). The prevalence of nascent entrepreneurs in the united states: evidence from the panel study of entrepreneurial dynamics. Small Business Economics, 23(4), 263-284.
reynolds, paul d. and sammis b. white (1997). The entrepreneurial process: Economic growth, women, and minorities. westport, ct: Greenwood publishing Group, inc.
roberts, edward b. (1991) Entrepreneurs in high technology: Lessons from MIT and beyond. new york: oxford university press.
samuelsson, M. (2004). Creating new ventures: A longitudinal investigation of the nascent venturing process. doctoral dissertation. Jönköping, sweden: Jönköping international business school.
say, Jean-baptist (1984). A treatise on political economy. new york: a. M. Kelley (1964 reprint).
schoonhoven, c. b. and K. M. eisenhart (1990). speeding products to market: waiting time to first product introduction in new firms. Administrative Science Quarterly 35:177-207.
schramm, c. J. (2006). The entrepreneurial imperative: How America’s eco-nomic miracle will reshape the world (and change your life). ny: harper collins.
schreyer, paul (1996). SMEs and employment creation: Overview of selected quantitative studies in OECD member countries. paris, France: organization for economic co-operation and development, sti working papers 1996/4.
schumpeter, J. a. (1934). The theory of economic development. cambridge, Ma: harvard university press.
shane, scott a. (2008). The illusions of entrepreneurship. new haven, ct: yale university press.
shane, s. and v.s. venkataraman (2001). The promise of entrepreneurship as a field of research. Academy of Management Review 25(1):217-226.
shapero, albert and Joseph Giglierano (1982). exits and entries: a study in yellow pages journalism. Frontiers of Entrepreneurial Research: 1982. wellesley, Ma: babson college.
speltzer, James r., r. Jason Faberman, akbar sadeghi, david M. talan, and richard l. clayton (2004). business enterprise dynamics: new data on gross job gains and losses. Monthly Labor Review (april): 29-42.
Business Creation in the United States: Entry, Startup Activities, and the Launch of New Ventures 231
Thornton, patricia h. (1999). The sociology of entrepreneurship. Annual Review of Sociology 25:19-46.
trimble, vance h. (1993). Overnight success: Federal Express and Frederick Smith, its renegade creator. new york, ny: crown.
u.s. department of commerce (2002, March). Current Population Survey: Design and methodology. technical paper 63rv. www.bls.census.gov/cps/tp/tp63/htm.
u.s. small business administration (2004). The small business economy: A report to the president. washington, d.c.: u.s. Government printing office.
u.s. small business administration (2007). The small business economy: A report to the president. washington, d.c.: u.s. Government printing office.
vance, sandra s. and roy v. scott (1994). Wal-Mart: A history of Sam Walton’s retail phenomenon. new york, ny: twayne.
van Gelderen, M. w. (2000). enterprising behavior or ordinary people. European Journal of Work and Organizational Psychology 9:81-88.
van stel, a. and r. Thurik (2004). The effect of entrepreneurship on national economic growth: An analysis using the GEM database. Jena, de: Max planck institute for research into economic systems working paper 3404.
weaver, Mark, pat dickson, and George solomon (2006). entrepreneurship and education: what is known and not known about the links between education and entrepreneurial activity. chapter 5 in u.s. small business administration. The small business economy: A report to the president: 2006. washington, d.c.: u.s. Government printing office, 113-156.
Zucker, lynn G., Michael r. darby, and Marilynn b. brewer (1998). intellectual human capital and the birth of u.s. biotechnology enterprises. American Economic Review 88(1):290-306.
232 The Small Business Economy
appendix 7a: national academy of sciences study of business dynamics a panel of experts convened to report for the national academy of sciences recently completed a study of business dynamics.84 a summary of their busi-ness dynamics conceptual framework is presented as Figure 7a.1. The pre-sentation is organized around two major business phenomena: the business entity’s life course and the work career of typical individuals.
This framework posits that two major processes lead to the conception of a new business. one process involves individuals shifting into the startup mode after a work career as employees holding jobs; the other involves individuals initiating new firms as part of current job requirements, representing a startup sponsored by an existing firm.
The major purpose of the conceptual framework is to identify existing data-sets for research on business and career dynamics. a total of 26 different datasets were identified as relevant to some aspect of firm creation and business dynam-ics; they are listed at the bottom of Figure 7a.1.85 Fifteen of the 26 provide for cross-sectional information about existing firms at a point in time, but without any capacity for tracking the firms over time (1-3, 5-10, 14, 16,18-20, 22, 24). seven provide for longitudinal analyses of existing firms, once they are included in an existing firm registry, such as the unemployment insurance files maintained by the bureau of labor statistics, the longitudinal business database main-tained by the u.s. bureau of the census, or a sample drawn from the dun and bradstreet data files (4, 11-13, 15, 17, 23). Three track the labor force activities of persons, either as individuals or as members of households, but the focus is on the nature of the jobs they may hold and shifts between jobs over the life course. other than reports of “self-employment,” there is little attention to creating new businesses, and the description of the self-employment activity is brief and basic (6, 25, 26). one, the Global entrepreneurship Monitor, provides annual comparisons of national measures of firm creation activities, but does not track nascent enterprises over time (22).
84 haltiwanger, lynch, and Mackie, 2007.
85 details on the nature, sources, and access to these datasets are provided in haltiwanger, lynch, and Mackie, 2007, 158-171.
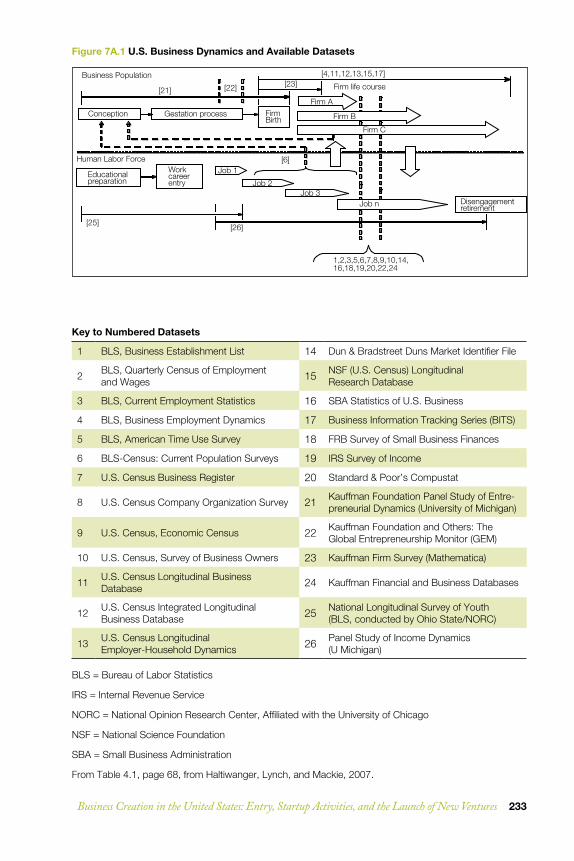
Business Creation in the United States: Entry, Startup Activities, and the Launch of New Ventures 233
Figure7A.1U.S.BusinessDynamicsandAvailableDatasets
KeytoNumberedDatasets
1 BLS, Business Establishment List 14 Dun & Bradstreet Duns Market Identifier File
2 BLS, Quarterly Census of Employment and Wages 15 NSF (U.S. Census) Longitudinal
Research Database
3 BLS, Current Employment Statistics 16 SBA Statistics of U.S. Business
4 BLS, Business Employment Dynamics 17 Business Information Tracking Series (BITS)
5 BLS, American Time Use Survey 18 FRB Survey of Small Business Finances
6 BLS-Census: Current Population Surveys 19 IRS Survey of Income
7 U.S. Census Business Register 20 Standard & Poor’s Compustat
8 U.S. Census Company Organization Survey 21 Kauffman Foundation Panel Study of Entre-preneurial Dynamics (University of Michigan)
9 U.S. Census, Economic Census 22 Kauffman Foundation and Others: The Global Entrepreneurship Monitor (GEM)
10 U.S. Census, Survey of Business Owners 23 Kauffman Firm Survey (Mathematica)
11 U.S. Census Longitudinal Business Database 24 Kauffman Financial and Business Databases
12 U.S. Census Integrated Longitudinal Business Database 25 National Longitudinal Survey of Youth
(BLS, conducted by Ohio State/NORC)
13 U.S. Census Longitudinal Employer-Household Dynamics 26 Panel Study of Income Dynamics
(U Michigan)
BLS = Bureau of Labor Statistics
IRS = Internal Revenue Service
NORC = National Opinion Research Center, Affiliated with the University of Chicago
NSF = National Science Foundation
SBA = Small Business Administration
From Table 4.1, page 68, from Haltiwanger, Lynch, and Mackie, 2007.
Educational preparation
Workcareer entry
Conception Gestation process Firm Birth
Firm life course
Job 1
Job 2Job 3
Job n Disengagementretirement
Firm C
Firm B
Firm A
Human Labor Force
Business Population
1,2,3,5,6,7,8,9,10,14,16,18,19,20,22,24
[4,11,12,13,15,17][23][22][21]
[25][26]
[6]
234 The Small Business Economy
appendix 7b: psed research procedureThe research procedure consists of three phases. The first was the identification of a representative sample of those actively involved in the new firm creation process, the nascent entrepreneurs. They were identified from phone inter-views completed with adults from a representative sample of households that met four criteria: 1) they considered themselves involved in the firm creation process, 2) they had engaged in some startup activity in the past 12 months, 3) they expected to own all or part of the new firm, and 4) the initiative had not progressed to the point that it could be considered an operating business. about 87 percent of those identified in the screening as active nascent entrepreneurs agreed to participate in the study.86 For both projects the initial screening was completed by a commercial survey firm (Market Facts for psed i; opinion research corporation for psed ii). The detailed data were collected by sur-vey operations located in academic institutions (The university of wisconsin survey research laboratory for the initial and first follow-ups for psed i; the university of Michigan institute for social research for the second and third follow-ups for psed i and all detailed interviews for psed ii).
These volunteers were then contacted for the second phase, a detailed inter-view. about 60 percent completed the initial 60-minute phone interview;87 it covered a wide range of topics related to the initiation of a new firm.
The third phase consisted of the annual follow-up interviews.The content of the interview schedules was similar for the two projects,
the modules for psed ii are presented in table 7b.1. psed i is similar but covered more topics by utilizing both phone and mail data collection.
86 it should be noted that the low yield of nascent entrepreneurs in psed i—-830 following screening of more than 60,000 individuals—reflected a procedure designed to increase the number of women and minorities in the nascent entrepreneur cohort. a large number of white male active nascent entrepre-neurs was identified in the screening but not included in the cohort in order to focus available resources on women and minorities. if resources had allowed the inclusion of all active nascent entrepreneurs identified in the psed i screening, this cohort would have been three times larger.
87 table a.3, 464, of Gartner, et al, 2004. Handbook of entrepreneurial dynamics. Thousand oaks, ca: sage.
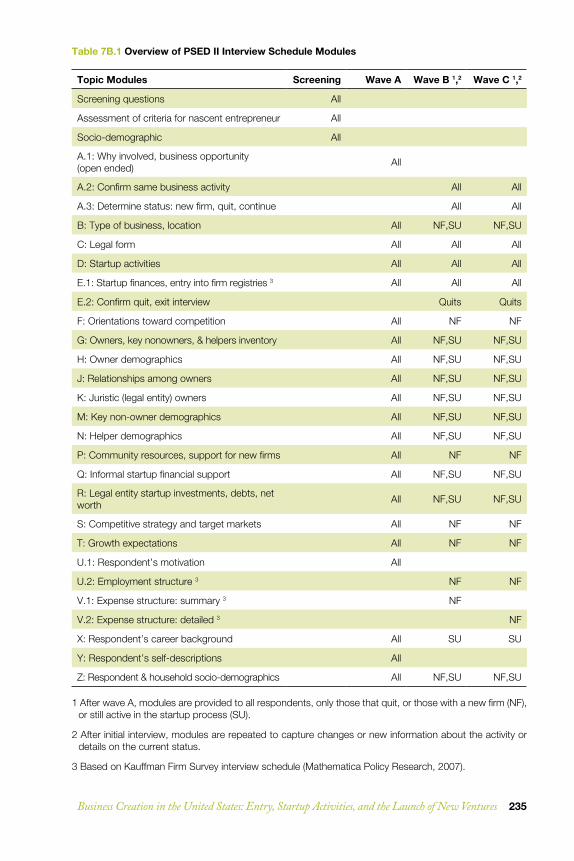
Business Creation in the United States: Entry, Startup Activities, and the Launch of New Ventures 235
Table7B.1OverviewofPSEDIIInterviewScheduleModules
TopicModules Screening WaveA WaveB1,2 WaveC1,2
Screening questions All
Assessment of criteria for nascent entrepreneur All
Socio-demographic All
A.1: Why involved, business opportunity (open ended) All
A.2: Confirm same business activity All All
A.3: Determine status: new firm, quit, continue All All
B: Type of business, location All NF,SU NF,SU
C: Legal form All All All
D: Startup activities All All All
E.1: Startup finances, entry into firm registries 3 All All All
E.2: Confirm quit, exit interview Quits Quits
F: Orientations toward competition All NF NF
G: Owners, key nonowners, & helpers inventory All NF,SU NF,SU
H: Owner demographics All NF,SU NF,SU
J: Relationships among owners All NF,SU NF,SU
K: Juristic (legal entity) owners All NF,SU NF,SU
M: Key non-owner demographics All NF,SU NF,SU
N: Helper demographics All NF,SU NF,SU
P: Community resources, support for new firms All NF NF
Q: Informal startup financial support All NF,SU NF,SU
R: Legal entity startup investments, debts, net worth All NF,SU NF,SU
S: Competitive strategy and target markets All NF NF
T: Growth expectations All NF NF
U.1: Respondent’s motivation All
U.2: Employment structure 3 NF NF
V.1: Expense structure: summary 3 NF
V.2: Expense structure: detailed 3 NF
X: Respondent’s career background All SU SU
Y: Respondent’s self-descriptions All
Z: Respondent & household socio-demographics All NF,SU NF,SU
1 After wave A, modules are provided to all respondents, only those that quit, or those with a new firm (NF), or still active in the startup process (SU).
2 After initial interview, modules are repeated to capture changes or new information about the activity or details on the current status.
3 Based on Kauffman Firm Survey interview schedule (Mathematica Policy Research, 2007).

236 The Small Business Economy
The screening phase, represented by the screening column, provides a small amount of socio-demographic data on all individuals involved in the screening; this is useful for assessing some factors affecting the decision to enter the startup process.
The first detailed interview, presented in the wave a column in table 7b.1, includes information on the nature of the business, startup activities implemented on behalf of the new firm, incorporation into business reg-istries, the nature of the startup team and helping networks, sources and amounts of financial support, evaluations of the immediate context, com-petitive strategy, and growth expectations, along with details of the motiva-tions, perspectives, self-descriptions, background, and family context of the responding nascent entrepreneur.
The third phase involved the follow-up phone interviews, also about 60 minutes long. in psed i the follow-ups were also supplemented by a mail questionnaire. The time lag between interviews for psed i was about 14 months; for psed ii careful scheduling has allowed the initial contact for the first follow-up to occur 52 weeks following completion of the initial detailed interview, the second follow-up at 104 weeks, and so forth. The topics of the interview are listed in the “wave b” column in table 7b.1 and vary depending on the status of the initiative at the time of the follow-up. nascent entrepre-neurs who report they have disengaged from the initiative (quit) receive a few questions about startup activity and a few about the reasons for their decision. all others receive most of the same interview schedule provided in the first interview, which provides them with a chance to update their case file with reports of new activity or changes in the startup team or financial structure. They do not receive most of the modules related to enduring features of the
Table7B.2NascentEntrepreneursbyBusinessCriteriaandRecentStartupActivity
PSEDI PSEDII
Screening period 1998–2000 2005–2006
Screened sample 62,612 31,845
Candidate nascent entrepreneurs (2-criteria) 3,592
Candidate nascent entrepreneurs (3-criteria) 1,571
Active nascent entrepreneurs 830 1,214
Confirmed active nascent entrepreneurs 824 1,148
Recent confirmed active nascent entrepreneurs 747 947
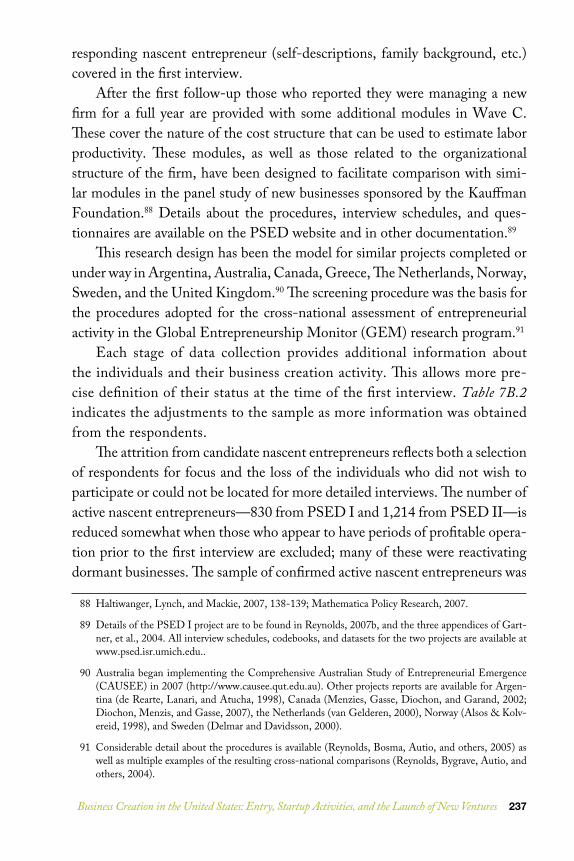
Business Creation in the United States: Entry, Startup Activities, and the Launch of New Ventures 237
responding nascent entrepreneur (self-descriptions, family background, etc.) covered in the first interview.
after the first follow-up those who reported they were managing a new firm for a full year are provided with some additional modules in wave c. These cover the nature of the cost structure that can be used to estimate labor productivity. These modules, as well as those related to the organizational structure of the firm, have been designed to facilitate comparison with simi-lar modules in the panel study of new businesses sponsored by the Kauffman Foundation.88 details about the procedures, interview schedules, and ques-tionnaires are available on the psed website and in other documentation.89
This research design has been the model for similar projects completed or under way in argentina, australia, canada, Greece, The netherlands, norway, sweden, and the united Kingdom.90 The screening procedure was the basis for the procedures adopted for the cross-national assessment of entrepreneurial activity in the Global entrepreneurship Monitor (GeM) research program.91
each stage of data collection provides additional information about the individuals and their business creation activity. This allows more pre-cise definition of their status at the time of the first interview. Table 7B.2 indicates the adjustments to the sample as more information was obtained from the respondents.
The attrition from candidate nascent entrepreneurs reflects both a selection of respondents for focus and the loss of the individuals who did not wish to participate or could not be located for more detailed interviews. The number of active nascent entrepreneurs—830 from psed i and 1,214 from psed ii—is reduced somewhat when those who appear to have periods of profitable opera-tion prior to the first interview are excluded; many of these were reactivating dormant businesses. The sample of confirmed active nascent entrepreneurs was
88 haltiwanger, lynch, and Mackie, 2007, 138-139; Mathematica policy research, 2007.
89 details of the psed i project are to be found in reynolds, 2007b, and the three appendices of Gart-ner, et al., 2004. all interview schedules, codebooks, and datasets for the two projects are available at www.psed.isr.umich.edu..
90 australia began implementing the comprehensive australian study of entrepreneurial emergence (causee) in 2007 (http://www.causee.qut.edu.au). other projects reports are available for argen-tina (de rearte, lanari, and atucha, 1998), canada (Menzies, Gasse, diochon, and Garand, 2002; diochon, Menzis, and Gasse, 2007), the netherlands (van Gelderen, 2000), norway (alsos & Kolv-ereid, 1998), and sweden (delmar and davidsson, 2000).
91 considerable detail about the procedures is available (reynolds, bosma, autio, and others, 2005) as well as multiple examples of the resulting cross-national comparisons (reynolds, bygrave, autio, and others, 2004).
238 The Small Business Economy
then reduced to 824 for psed i and 1,148 for psed ii. Further analyses of reported startup activities identify those who initiated startups more than 10 years before the initial detailed interview. The cohorts of nascent entrepreneurs are reduced to 747 for psed i and 947 for psed ii when only “recent” con-firmed active nascent entrepreneurs are included.
The procedure is designed to provide a representative sample of individu-als involved in business creation, identified as nascent entrepreneurs. with one caveat, it may be considered a representative sample of nascent enterprises or firms in gestation. any nascent enterprise implemented by more than one nascent entrepreneur is more likely to be included in the cohort. as a result, if the sample is considered to represent nascent enterprises, it should be rec-ognized as including an overrepresentation of team efforts. nascent entrepre-neurs with more than one person on the startup team have a higher probability of being represented in a sample based on identifying nascent entrepreneurs.92 it is assumed that the practical effect of this issue is negligible for the following analysis and no adjustment for a potential oversample of team initiatives has been implemented.
while the respondents devoted a substantial amount of time to complet-ing the interviews, very few, 1 percent in psed i and 2 percent in psed ii, report less interest in the startup by virtue of participation. Most, 61 percent in both cohorts, reported their interest in the startup increased upon completion of the initial interview; the remainder, 37-38 percent, indicated no change in their commitment to the startup initiative. This strong interest is one reason for the high cooperation reflected in item response rates and completion of the follow-up interviews.
92 davidsson, 2004.
Business Creation in the United States: Entry, Startup Activities, and the Launch of New Ventures 239
appendix 7c: The psed and other Measures of Firm creationMany of the patterns found in the psed datasets are, to say the least, unex-pected. is it possible that the populations represented by these samples are so unique and distinctive as to have no relationship to other measures of new firm creation? two types of comparisons would suggest that the psed research pro-tocol—locating nascent enterprises based on a representative sample of adults—is identifying entities that are captured at a later stage by other procedures.
one comparison involves estimating, with the psed-type datasets, those cases that are likely to be captured by other procedures. a detailed compari-son of the 1999 cohort of nascent enterprises with counts of new employer firms reported by the u.s. small business administration’s (sba) office of advocacy involved adjustments for the average size of the startup team, reports that the nascent enterprise has filed their first Fica payment, and adjustments for nascent enterprises missed because of limited callbacks to complete screen-ing interviews. once these adjustments were made, the 95 percent confidence interval of predicted new employer firm listings was from 475,000 to 669,000, with a point estimate of 565,000. This was very close to the three-year average of 581,000 new employer firms reported by the sba for the same period.93
The dataset assembled for the Global entrepreneurship Monitor pro-gram to locate nascent and new enterprises was adjusted to facilitate com-parisons with annual counts of new businesses based on administrative data for 13 countries.94 in seven countries, the 95 percent confidence intervals of the survey-based predictions encompassed the administrative counts; in two, the 90 percent confidence interval would encompass the administrative record counts; and in four, the administrative records were based on rather unusual procedures that precluded precise comparisons. in the united Kingdom, for example, new firms are identified on the basis of annual sales above the thresh-old for liability for a value-added tax; these tax data were not obtained in the GeM interviews. Given the small sample sizes in the GeM annual surveys—
93 detailed analysis presented in reynolds, 2004, 254-257; as the screening for the 1999 cohort was completed over the 1998-2000 period, the three-year average of new registration counts was used in the comparison.
94 reynolds, bosma, autio, and others, 2005, table iX.
240 The Small Business Economy
generally 2,000—this is rather strong evidence that the survey-identified new ventures represent the same populations as the administrative datasets.
various time series reflecting business creation in the united states offer a second category of sources for comparison. between the psed research pro-gram, the GeM research program, and some special studies, 134 independent samples of the adult population have been developed to estimate the preva-lence of nascent entrepreneurs. when adjustments are made to compensate for differences in item wording, the prevalence rate over the 1998-2006 period for the united states was from 5 to 6 per 100 adults, with no statistically signifi-cant differences between years.95
Three other measures of activity related to new firm creation—monthly increases in efforts to become self-employed, new establishments making state unemployment insurance payments for the first time, and new firms making federal social security payments for the first time—can be converted to preva-lence rates using the adult population as a base. time series based on all three of these large-scale surveys and censuses indicate no changes over the past decade or more (one series began in 1990).96 The temporal trend is identical for all four measures—the prevalence rate in terms of the adult population is flat.
if the household-based survey measures of firm creation can be used to predict annual counts in administrative records and if the temporal trends in the united states are identical for the psed and three other measures of new firm creation, the psed protocol is probably capturing the same business cre-ation phenomena as these other measures. it may never be possible to know what is really going on, but when four different measurement techniques have the same patterns, it increases confidence that all procedures are reflections of the same phenomena.
95 reynolds, 2008.
96 Fairlie, 2006; spletzer, et al, 2004; u.s. small business administration, 2007; summarized in reyn-olds (2008), Figure 8.