united states department of labor · of dentists, the largest employer ... followed by sales and...
TRANSCRIPT

Bureau of Labor Statistics Washington, D.C. 20212
Technical information: (202) 691-6569 USDL 09-0457 http://www.bls.gov/oes/ For release: 10:00 A.M. (EDT) Media contact: (202) 691-5902 Friday, May 1, 2009
(NOTE: This release was reissued on Friday, May 29, 2009, to correct wage data in table 1 for three occupations: (1) postal service clerks; (2) postal service mail carriers; and (3) postal service mail sorters, processors, and processing ma-chine operators. These corrections did not affect any other tables in the release or the analysis of occupational employment and wage data.)
OCCUPATIONAL EMPLOYMENT AND WAGES, 2008
In 2008, the U.S. median wage was $15.57 per hour or $32,390 per year, according to the Bureau of Labor Statistics (BLS) of the U.S. Department of Labor. These data are from the Occupational Employment Statistics (OES) program, which provides employment and wage estimates for wage and salary workers in 22 major occupational groups and 801 detailed occupations. OES produces data by occupation for the nation, states, metropolitan areas, metropolitan divisions, and nonmetropolitan areas, and by occupation and industry for the nation. National cross-industry employment and wage infor-mation for all occupations is shown in table 1. Complete data are available from the OES homepage at http://www.bls.gov/oes/.
The median wage represents the pay of the typical worker. Table 4 shows employment and wage information for occupations with median wages between 5 percent above and 5 percent below the U.S. median wage. Many of the occupations with wages within this range were office and administrative support, construction and extraction, or production occupations.
OES data can be used to compare employment and wages for different occupations, such as the
occupations with wages near the U.S. median shown in table 4. With employment of 1.9 and 1.3 mil-lion, respectively, bookkeeping, accounting, and auditing clerks; and general maintenance and repair
Changes to Occupational Employment Statistics Data
Effective with this news release, the Occupational Employment Statistics program
has switched the basis for their industry classification from the 2002 North American Industry Classification System (NAICS) to the 2007 NAICS. Historical data were not revised.
News
United States Department of Labor
2
workers were the largest occupations with wages near the U.S. median, and also were among the 20 largest occupations overall. The 2 largest occupations in the U.S., retail salespersons and cashiers, had employment of approximately 4.4 and 3.5 million, respectively.
Other large occupations with wages near the U.S. median included all other teachers and instructors, with employment of 574,540; billing and posting clerks and machine operators (512,120); inspectors, testers, sorters, samplers, and weighers (467,010); welders, cutters, solderers, and brazers (392,520); and dental assistants (293,090). Among the smallest occupations with wages near the U.S. median were forest fire inspectors and prevention specialists, farm labor contractors, wood model makers, and wood patternmakers, each of which had employment levels between 1,000 and 2,000.
While some of these occupations were concentrated in specific industries, others were more widely distributed across industries. For example, although 93 percent of dental assistants worked in offices of dentists, the largest employer of general maintenance and repair workers—lessors of real estate—em-ployed only about 10 percent of this occupation.
Median wages for occupations shown in table 4 ranged from $14.83 to $16.35 per hour. In con-
trast, the lowest paying occupations included gaming dealers; combined food preparation and serving workers; waiters and waitresses; dining room and cafeteria attendants and bartender helpers; and fast food cooks, with median wages ranging from $7.84 to $8.12 per hour. Among the highest paying occupations were several specialty physician and dentist occupations, which had median wages over $80.00 per hour or $166,400 annually.
Major Occupational Group Employment and Wages by Industry Sector
Most occupations with wages near the U.S. median were office and administrative support;
construction and extraction; installation, maintenance, and repair; or production occupations. Table 4 contains 26 occupations in the production group, making this group the one with the largest number of occupations earning near the median wage. Twelve office and administrative support occupations had wages near the U.S. median; however, total employment in these 12 occupations was approximately 3.8 million, as compared to total employment of 2.1 million for the production occupations shown in table 4.
Office and administrative support also was the largest occupational group overall, with total
employment of 23.2 million, followed by sales and related occupations, with total employment of 14.3 million, and food preparation and serving related occupations, with total employment of 11.4 million. (See table 2.) While some occupational groups were highly concentrated in specific industry sectors, others were distributed more evenly across sectors. For example, nearly 89 percent of employment in education, training, and library occupations was found in the educational services sector, and over 87 percent of employment in healthcare support occupations was found in the health care and social assistance sector. In contrast, although retail trade, finance and insurance, and health care and social assistance were among the largest employers of office and administrative support occupations, no single sector employed more than 12.4 percent of this group. (See table 2.)
The highest paying occupational groups included management occupations, with a median hourly
wage of $42.15, legal occupations ($34.49), and computer and mathematical science occupations ($34.26). Food preparation and serving related occupations ($8.59); farming, fishing, and forestry oc-cupations ($9.34); personal care and service occupations ($9.82); and building and grounds cleaning and maintenance occupations ($10.52) were among the lowest paying occupational groups. (See table 3.)

3
Wages for the occupational groups varied by industry. Utilities; transportation and warehousing; information; and finance and insurance were among the highest paying industry sectors for several occupational groups. Agriculture, forestry, fishing, and hunting; retail trade; and accommodation and food services were among the lowest paying sectors. For example, median hourly wages for business and financial operations occupations ranged from $33.75 in utilities to $20.94 in accommodation and food services, while median wages for office and administrative support occupations ranged from $19.57 in transportation and warehousing to $10.75 in retail trade.
Detailed Occupational Employment and Wages by Detailed Industry
In addition to the occupational group and industry sector data previously discussed, OES data also
are available for detailed occupations and industries. For example, table 5 shows employment and wages by industry for bookkeeping, accounting, and auditing clerks. Employment in this occupation was widely distributed across industries. The accounting, tax preparation, bookkeeping, and payroll services industry employed more bookkeeping clerks than any other industry, but only about 5.4 percent of bookkeeping clerks were employed in this industry. Other large employers of this occupation were building equipment contractors, depository credit intermediation, management of companies and enter-prises, and local government (OES designation); each representing less than 5 percent of occupational employment. The median hourly wage for bookkeeping clerks in these industries ranged from $14.43 in depository credit intermediation to $16.22 in building equipment contractors.
Although accounting, tax preparation, bookkeeping, and payroll services employed a relatively
small percentage of all bookkeeping clerks, this was the second largest occupation in the accounting services industry, representing about 11.4 percent of industry employment. (See table 6.) Accountants and auditors was by far the largest occupation in the industry, with 286,110 jobs making up about one-third of industry employment. Tax preparers was the third largest occupation in accounting services, with employment of 61,160. Most of the other large occupations in this industry were office and administrative support occupations. Occupational Employment and Wages by State and Area
OES data also allow comparison of occupational employment and wages across states and metro-politan areas. Tables 7 and 8 show the states and metropolitan areas with the highest employment and highest employment concentrations of selected detailed occupations. Areas with high total employment also tend to be among the largest employers of any individual occupation, while employment concen-trations reflect factors other than overall employment levels, such as the area's industry mix. For ex-ample, Texas employed more welders, cutters, solderers, and brazers than any other state, with 53,530 jobs in this occupation; and Wyoming, although it employed fewer total welders than Texas, had one of the highest employment concentrations in this occupation, with welders representing over 9 jobs out of every 1,000 in the state. Louisiana was the only state with both high employment levels and a high employment concentration of this occupation. (See table 7.)
Aside from Louisiana, the only state appearing on both sides of table 7 for the same occupation is
California, which was both one of the largest employers of dental assistants and one of the states with the highest concentrations of this occupation. Other states with high concentrations of dental assistants were Utah and Washington. Nevada and Hawaii had some of the highest concentrations of construction and maintenance painters, while Connecticut and Nebraska had some of the highest concentrations of insurance claims and policy processing clerks.

4
Although all of the selected occupations shown in table 7 had national median wages near the U.S. median, wages for each occupation varied across states. For example, among the states shown in the table, median wages for welders, cutters, solderers, and brazers varied from $13.83 in South Dakota to $21.29 in Wyoming, while median wages for construction and maintenance painters varied from $13.82 in Texas to $23.14 in Hawaii.
At the metropolitan area level, as at the state level, areas with high employment of the selected
occupations also tended to have high overall employment levels. (See table 8.) Chicago-Naperville-Joliet, Ill., and Los Angeles-Long Beach-Glendale, Calif., were among the largest employers for all of the selected occupations, while New York-White Plains-Wayne, N.Y.-N.J., and Houston-Sugar Land-Baytown, Texas, were among the largest employers for 3 out of the 4 occupations. These also were among the largest metropolitan areas or metropolitan divisions in the United States in terms of total employment.
While both Houston-Sugar Land-Baytown, Texas, and Dallas-Plano-Irving, Texas, were among the
metropolitan areas with the highest employment of welders, cutters, solderers, and brazers, two other metropolitan areas in Texas—Odessa and Beaumont-Port Arthur—reported some of the highest em-ployment concentrations of this occupation. Houma-Bayou Cane-Thibodaux, La., and Peoria, Ill., also had high concentrations of welders. Two metropolitan divisions in California—Los Angeles-Long Beach-Glendale and Santa Ana-Anaheim-Irvine—were among the largest employers of dental as-sistants, while four of the metropolitan areas with the highest concentrations of dental assistants also were in California. Naples-Marco Island, Fla., and Beaumont-Port Arthur, Texas, were among the areas with the highest concentrations of construction and maintenance painters, while Wausau, Wis., and Macon, Ga., were among the areas with the highest concentrations of insurance claims and policy processing clerks, although both areas employed relatively few workers in this occupation. Wages for the selected occupations varied by metropolitan area. For example, among the metropolitan areas shown, median wages for construction and maintenance painters ranged from $13.46 in Jacksonville, N.C., to $21.85 in Chicago-Naperville-Joliet, Ill., while wages for insurance claims and policy pro-cessing clerks ranged from $14.21 in Wausau, Wis., to $19.30 in Boston-Cambridge-Quincy, Mass.
Additional Information
The Occupational Employment Statistics program produces cross-industry occupational employ-
ment and wage estimates nationwide and for all states, 377 metropolitan areas, 34 metropolitan divi-sions, and 174 nonmetropolitan areas. OES also publishes national industry-specific occupational employment and wage estimates for NAICS sectors and 3-, 4-, and selected 5-digit industries. In ad-dition to mean hourly and annual wages, wage data include 10th, 25th, 50th (median), 75th, and 90th percentile wages, which can be used to show the distribution of wages within an occupation or industry. OES data are produced by a cooperative effort between BLS and State Workforce Agencies, and are based on a sample of 1.2 million business establishments, collected in 6 semiannual panels over a 3-year period. Complete May 2008 Occupational Employment Statistics data are available from the OES Web site at http://www.bls.gov/oes/.

Technical Note Scope of the survey
The Occupational Employment Statistics (OES) survey
is a semiannual mail survey measuring occupational employment and wage rates for wage and salary workers in nonfarm establishments in the United States. Guam, Puerto Rico, and the Virgin Islands also are surveyed, but their data are not included in this release. OES estimates are constructed from a sample of about 1.2 million establish-ments. Forms are mailed to approximately 200,000 estab-lishments in May and November of each year for a 3-year period. The nationwide response rate for the May 2008 estimates is 78.2 percent based on establishments and 74.3 percent based on employment. The survey included estab-lishments sampled in the May 2008, November 2007, May 2007, November 2006, May 2006, and November 2005 semiannual panels. The occupational coding system
The OES survey uses the Office of Management and
Budget's (OMB) occupational classification system, the Standard Occupational Classification (SOC) system. The SOC system is the first OMB-required occupational classification system for federal agencies. The OES survey categorizes workers into 801 detailed occupations. Together, these detailed occupations make up 22 of the 23 major occupational groups. Military specific occupations are not included in the OES survey. The major groups are as follows:
Management occupations Business and financial operations occupations Computer and mathematical science occupations Architecture and engineering occupations Life, physical, and social science occupations Community and social services occupations Legal occupations Education, training, and library occupations Arts, design, entertainment, sports, and media occupations Healthcare practitioner and technical occupations Healthcare support occupations Protective service occupations Food preparation and serving related occupations Building and grounds cleaning and maintenance occupations
Personal care and service occupations Sales and related occupations Office and administrative support occupations Farming, fishing, and forestry occupations Construction and extraction occupations Installation, maintenance, and repair occupations Production occupations Transportation and material moving occupations Military specific occupations (not surveyed in OES)
For more information about the SOC system, please see the Bureau of Labor Statistics (BLS) Web site at http://www.bls.gov/soc/. The industry coding system
The OES survey uses the North American Industry
Classification System (NAICS). The May 2008 estimates and survey data are based on the 2007 NAICS. Earlier panel data and estimates were based on the 2002 NAICS. For more information about NAICS, see the BLS Web site at http://www.bls.gov/bls/naics.htm.
The OES survey includes establishments in NAICS sectors 11 (logging and agricultural support activities only), 21, 22, 23, 31-33, 42, 44-45, 48-49, 51, 52, 53, 54, 55, 56, 61, 62, 71, 72, 81 (except private households), state government, and local government. The U.S. Postal Service and the executive branch of the federal government also are included. An establishment is defined as an economic unit that processes goods or provides services, such as a factory, mine, or store. The establishment is generally at a single physical location and is engaged primarily in one type of economic activity.
The OES survey covers all full- and part-time wage and salary workers in nonfarm industries. The survey does not include the self-employed, owners and partners in unincor-porated firms, household workers, or unpaid family workers. Survey sample
BLS funds the survey and provides the procedures and
technical support, while the State Workforce Agencies (SWAs) collect most of the data. BLS produces cross-industry and industry-specific estimates for the nation, states, metropolitan statistical areas (MSAs), metropolitan divisions, and nonmetropolitan areas. Industry-specific estimates are produced at the NAICS sector, 3-digit, 4-digit, and selected 5-digit industry levels. BLS releases all cross-industry and national estimates; many SWAs release industry-specific estimates at the state and MSA levels.
State unemployment insurance (UI) files provide the universe from which the OES survey draws its sample. Employment benchmarks are obtained from reports submitted by employers to the UI program. Supplemental sources are used for rail transportation (NAICS 4821) and Guam because they do not report to the UI program. The OES survey sample is stratified by metropolitan and nonmetropolitan areas and industry. The 2000 Metropolitan Statistical Area standards were used to define the metropolitan areas.
An annual census is taken of the executive branch of the federal government, the U.S. Postal Service, state government, and Hawaii's local government. In order to provide the most occupational coverage, larger employers are more likely to be selected than smaller employers. The
unweighted employment of sampled establishments makes up approximately 61 percent of total national employment. Concepts
Occupational employment is the estimate of total wage
and salary employment in an occupation across the industries surveyed. The OES survey defines employment as the number of workers who can be classified as full- or part-time employees, including workers on paid vacations or other types of paid leave; workers on unpaid short-term absences; salaried officers, executives, and staff members of incorporated firms; employees temporarily assigned to other units; and employees for whom the reporting unit is their permanent duty station regardless of whether that unit prepares their paycheck.
The OES survey forms sent to larger establishments, generally those with 20 or more workers, contain between 50 and 225 SOC occupations selected on the basis of the sampled establishment's industry classification. To reduce paperwork and respondent burden, no survey form contains every SOC occupation. Thus, data for specific occupations are collected primarily from establishments in industries that are the predominant employers of workers in those occupations. Each survey form is structured, however, to allow a respondent to provide detailed occupational information for each worker at the establishment; that is, unlisted occupations can be added to the survey form. Smaller establishments, generally those with fewer than 20 workers, are sent a form with no occupations listed, and are instructed to fill in the occupations for their workers.
Wages for the OES survey are straight-time, gross pay,
exclusive of premium pay. Base rate, cost-of-living allowances, guaranteed pay, hazardous-duty pay, incentive pay including commissions and production bonuses, tips, and on-call pay are included. Excluded are back pay, jury duty pay, overtime pay, severance pay, shift differentials, nonpro- May 2008 wage intervals
Hourly Annual
Range A Under $7.50 Under $15,600
Range B $7.50 to $9.49 $15,600 to $19,759
Range C $9.50 to $11.99 $19,760 to $24,959
Range D $12.00 to $15.24 $24,960 to $31,719
Range E $15.25 to $19.24 $31,720 to $40,039
Range F $19.25 to $24.49 $40,040 to $50,959
Range G $24.50 to $30.99 $50,960 to $64,479
Range H $31.00 to $39.24 $64,480 to $81,639
Range I $39.25 to $49.74 $81,640 to $103,479
Range J $49.75 to $63.24 $103,480 to $131,559
Range K $63.25 to $79.99 $131,560 to $166,399
Range L $80.00 and over $166,400 and over
Interval Wages
duction bonuses, employer cost for supplementary benefits, and tuition reimbursements.
The OES survey collects wage data in 12 intervals. Employers report the number of employees in an occupation for each wage range. The wage intervals used for the May 2008 survey are shown in the previous column.
Mean hourly wage. The mean hourly wage rate for an occupation is the total wages that all workers in the occupation earn in an hour divided by the total employment of the occupation. To calculate the mean hourly wage of each occupation, total weighted hourly wages are summed across all intervals and divided by the occupation's weighted survey employment. The mean wage for each interval is based on occupational wage data collected by the BLS Office of Compensation and Working Conditions for the National Compensation Survey (NCS). With the exception of the highest wage interval, mean wage rates for each panel are calculated using NCS data for the panel's reference year.
The lower boundary of the highest wage interval was $80.00. The mean hourly wage for this interval was calculated using the average of the 2005, 2006, and 2007 NCS data.
Percentile wage. The p-th percentile wage rate for an
occupation is the wage where p percent of all workers earn that amount or less and where (100-p) percent of all workers earn that amount or more. This statistic is calculated by uniformly distributing the workers inside each wage interval, ranking the workers from lowest paid to highest paid, and calculating the product of the total employment for the occupation and the desired percentile to determine the worker that earns the p-th percentile wage rate.
Annual wage. Many employees are paid at an hourly
rate by their employers and may work more than or less than 40 hours per week. Annual wage estimates for most occupations in this release are calculated by multiplying the mean hourly wage by a "year-round, full-time" figure of 2,080 hours (52 weeks by 40 hours). Thus, annual wage estimates may not represent the actual annual pay received by the employee if they work more or less than 2,080 hours per year. Some workers typically work less than 40 hours per week, year round. For these occupations, the OES survey collects and reports either the annual salary or the hourly wage rate, depending on how the occupation is typically paid, but not both. For example, teachers, flight attendants, and pilots may be paid an annual salary, but do not work the usual 2,080 hours per year. In this case, an annual salary is reported. Other workers, such as entertainment workers, are paid hourly rates, but generally do not work 40 hours per week, year round. For these workers, only an hourly wage is reported.
Hourly versus annual wage reporting. For each
occupation, respondents are asked to report the number of

employees paid within specific wage intervals. The intervals are defined both as hourly rates and the corresponding annual rates, where the annual rate for an occupation is calculated by multiplying the hourly wage rate by a typical work year of 2,080 hours. The responding establishment can reference either the hourly or the annual rate for full-time workers, but they are instructed to report the hourly rate for part-time workers. Estimation methodology
With the exception of the May 2008 panel, each OES
panel includes approximately 200,000 establishments. Due to budget constraints, the May 2008 sample was reduced to approximately 174,000 establishments. The OES survey is designed to produce estimates using six panels (3 years) of data. The full six-panel sample of nearly 1.2 million establishments allows the production of estimates at detailed levels of geography, industry, and occupation.
Wage updating. Significant reductions in sampling
errors are obtained by combining six panels of data, particularly for small geographic areas and occupations. Wages for the current panel need no adjustment. However, wages in the five previous panels need to be updated to the current panel's reference period.
The OES program uses the BLS Employment Cost Index (ECI) to adjust survey data from prior panels before combining them with the current panel's data. The wage updating procedure adjusts each detailed occupation's wage rate, as measured in the earlier panel, according to the average movement of its broader occupational division. The procedure assumes that there are no major differences by geography, industry, or detailed occupation within the occupational division. The wage rates for the highest wage interval are not updated.
Imputation. About 20 percent of establishments do not
respond for a given panel. A "nearest neighbor" hot deck imputation procedure is used to impute missing occupational employment totals. A variant of mean imputation is used to impute missing wage distributions. The variant of mean imputation for wage distributions also is applied to establishments that provide reports with occupational totals but partial or missing wage data.
Weighting and benchmarking. The sample establish-
ments in each panel are weighted to represent all estab-lishments that were part of the in-scope frame from which the panel was selected. Based on the sampled establishments, sampling weights are adjusted when six panels are combined. Sampling weights are further adjusted by the ratio of employ-ment totals (the average of November 2007 and May 2008 employment) from the BLS Quarterly Census of Employ-
ment and Wages to employment totals from the OES survey.
May 2008 OES survey estimates. The May 2008 OES survey estimates are based on all data collected from establishments in the May 2008, November 2007, May 2007, November 2006, May 2006, and November 2005 semiannual samples.
Reliability of the estimates. Estimates calculated from a
sample survey are subject to two types of error: sampling and nonsampling. Sampling error occurs when estimates are calculated from a subset (that is, a sample) of the population instead of the full population. When a sample of the population is surveyed, there is a chance that the sample estimate of the characteristic of interest may differ from the population value of that characteristic. Differences between the sample estimate and the population value will vary depending on the sample selected. This variability can be estimated by calculating the standard error (SE) of the sample estimate. If we were to repeat the sampling and estimation process countless times using the same survey design, approximately 90 percent of the intervals created by adding and subtracting 1.645 SEs from the sample estimate would include the population value. These intervals are called 90-percent confidence intervals. The OES survey, however, usually uses the relative standard error (RSE) of a sample estimate instead of its SE to measure sampling error. RSE is defined as the SE of a sample estimate divided by the sample estimate itself. This statistic provides the user with a measure of the relative precision of the sample estimate. RSEs are calculated for both occupational employment and mean wage rate estimates. Occupational employment RSEs are calculated using a subsample, random group replication technique called the jackknife. Mean wage rate RSEs are calculated using a variance components model that accounts for both the observed and unobserved components of the wage data. The variances of the unobserved components are estimated using wage data from the BLS National Com-pensation Survey. In general, estimates based on many estab-lishments have lower RSEs than estimates based on few establishments. If the distributional assumptions of the models are violated, the resulting confidence intervals may not reflect the prescribed level of confidence.
Nonsampling error occurs for a variety of reasons, none
of which are directly connected to sampling. Examples of nonsampling error include: nonresponse, data incorrectly reported by the respondent, errors in the administrative data used to create the sampling frame, mistakes made in entering collected data into the database, and mistakes made in editing and processing the collected data. Every attempt is made to minimize nonsampling error through survey methods such as data editing, imputation methods, and benchmarking of data to current employment totals.

Table 1. National employment and wage data from the Occupational Employment Statistics survey by occupation, May 2008
Hourly Annual ¹
Management occupations 6,152,650 $48.23 $100,310 $42.15Chief executives................................................................................................................. 301,930 77.13 160,440 76.23 General and operations managers.................................................................................... 1,697,690 51.91 107,970 44.02 Legislators.......................................................................................................................... 64,650 (²) 37,980 (²)Advertising and promotions managers.............................................................................. 36,100 45.54 94,720 38.57 Marketing managers.......................................................................................................... 166,790 56.81 118,160 52.20 Sales managers................................................................................................................. 333,910 53.07 110,390 46.76 Public relations managers.................................................................................................. 51,730 48.66 101,220 43.00
Administrative services managers..................................................................................... 246,930 38.22 79,500 35.35 Computer and information systems managers.................................................................. 276,820 57.07 118,710 53.95 Financial managers............................................................................................................ 500,590 53.19 110,640 47.76 Compensation and benefits managers.............................................................................. 38,810 44.91 93,410 41.59 Training and development managers................................................................................ 29,350 45.11 93,830 42.16 Human resources managers, all other............................................................................... 60,980 49.96 103,920 46.22 Industrial production managers.......................................................................................... 154,030 43.85 91,200 40.04 Purchasing managers........................................................................................................ 67,150 45.34 94,300 42.86 Transportation, storage, and distribution managers.......................................................... 96,300 40.64 84,520 37.98
Farm, ranch, and other agricultural managers................................................................... 3,410 30.00 62,400 27.03 Farmers and ranchers........................................................................................................ 490 23.62 49,140 16.13 Construction managers...................................................................................................... 220,550 43.16 89,770 38.39 Education administrators, preschool and child care center/program................................. 49,630 22.29 46,370 19.20 Education administrators, elementary and secondary school............................................ 219,100 (²) 86,060 (²)Education administrators, postsecondary.......................................................................... 97,410 44.67 92,920 38.79 Education administrators, all other..................................................................................... 28,090 37.13 77,220 34.44 Engineering managers....................................................................................................... 182,300 57.97 120,580 55.42 Food service managers..................................................................................................... 196,080 24.19 50,320 22.27 Funeral directors................................................................................................................ 25,680 28.27 58,810 25.10 Gaming managers............................................................................................................. 3,790 35.33 73,480 32.83 Lodging managers............................................................................................................. 32,460 25.26 52,550 22.02 Medical and health services managers.............................................................................. 258,130 42.67 88,750 38.58 Natural sciences managers............................................................................................... 43,060 59.20 123,140 54.23 Postmasters and mail superintendents.............................................................................. 26,410 28.44 59,150 28.52 Property, real estate, and community association managers............................................ 159,700 27.05 56,250 22.18 Social and community service managers.......................................................................... 117,150 29.12 60,570 26.92 Managers, all other............................................................................................................ 365,460 46.10 95,890 43.38
Business and financial operations occupations 6,135,520 31.12 64,720 27.89 Agents and business managers of artists, performers, and athletes................................. 12,110 39.21 81,550 30.26 Purchasing agents and buyers, farm products.................................................................. 13,010 28.25 58,760 23.88 Wholesale and retail buyers, except farm products........................................................... 132,420 26.70 55,540 23.42 Purchasing agents, except wholesale, retail, and farm products....................................... 286,990 27.70 57,630 25.93 Claims adjusters, examiners, and investigators................................................................. 277,230 27.67 57,550 26.81 Insurance appraisers, auto damage.................................................................................. 11,280 25.95 53,980 25.69 Compliance officers, except agriculture, construction, health and safety, and transportation................................................................................................................. 242,270 25.85 53,760 23.50 Cost estimators.................................................................................................................. 218,400 29.00 60,320 27.17 Emergency management specialists................................................................................. 12,260 25.70 53,460 24.26 Employment, recruitment, and placement specialists........................................................ 205,800 25.90 53,870 21.86 Compensation, benefits, and job analysis specialists........................................................ 116,250 27.43 57,060 25.89 Training and development specialists................................................................................ 206,890 26.36 54,830 24.73 Human resources, training, and labor relations specialists, all other................................. 217,440 28.00 58,230 26.79 Logisticians........................................................................................................................ 98,590 32.98 68,600 31.96 Management analysts........................................................................................................ 535,850 39.87 82,920 35.37 Meeting and convention planners...................................................................................... 47,960 22.84 47,500 21.28 Business operations specialists, all other.......................................................................... 1,030,320 31.25 64,990 28.81
Accountants and auditors.................................................................................................. 1,133,580 31.65 65,840 28.57 Appraisers and assessors of real estate............................................................................ 66,260 25.68 53,410 22.77 Budget analysts................................................................................................................. 62,630 32.76 68,140 31.41 Credit analysts................................................................................................................... 74,400 31.05 64,580 26.56 Financial analysts.............................................................................................................. 236,720 40.76 84,780 35.17 Personal financial advisors................................................................................................ 146,690 44.69 92,970 33.20 Insurance underwriters...................................................................................................... 98,690 30.09 62,600 27.31 Financial examiners........................................................................................................... 26,020 37.59 78,180 34.10 Loan counselors................................................................................................................. 29,430 20.18 41,970 18.02 Loan officers...................................................................................................................... 321,850 30.55 63,540 26.30 Tax examiners, collectors, and revenue agents................................................................ 66,030 25.53 53,090 23.12 Tax preparers..................................................................................................................... 63,030 17.08 35,520 14.14 Financial specialists, all other............................................................................................ 145,110 30.71 63,880 27.48
See footnotes at end of table.
Occupation EmploymentMean wages Median
hourly wages

Hourly Annual ¹
Computer and mathematical science occupations 3,308,260 $35.82 $74,500 $34.26Computer and information scientists, research.................................................................. 26,610 48.51 100,900 47.10 Computer programmers..................................................................................................... 394,230 35.32 73,470 33.47 Computer software engineers, applications....................................................................... 494,160 42.26 87,900 41.07 Computer software engineers, systems software.............................................................. 381,830 45.44 94,520 44.44 Computer support specialists............................................................................................. 545,520 22.29 46,370 20.89 Computer systems analysts............................................................................................... 489,890 37.90 78,830 36.30 Database administrators.................................................................................................... 115,770 35.05 72,900 33.53 Network and computer systems administrators................................................................. 327,850 33.45 69,570 31.88 Network systems and data communications analysts........................................................ 230,410 35.50 73,830 34.18 Computer specialists, all other........................................................................................... 191,780 36.54 76,000 36.13
Actuaries............................................................................................................................ 18,220 46.14 95,980 40.77 Mathematicians.................................................................................................................. 2,770 45.65 94,960 45.75 Operations research analysts............................................................................................ 60,860 35.68 74,220 33.17 Statisticians........................................................................................................................ 20,680 35.96 74,790 34.91 Mathematical technicians................................................................................................... 1,100 20.24 42,100 18.46 Mathematical scientists, all other....................................................................................... 6,600 31.55 65,630 26.44
Architecture and engineering occupations 2,521,630 34.34 71,430 32.09 Architects, except landscape and naval............................................................................. 110,990 36.90 76,750 33.81 Landscape architects......................................................................................................... 21,130 30.77 64,000 28.35 Cartographers and photogrammetrists.............................................................................. 11,690 27.87 57,980 24.60 Surveyors........................................................................................................................... 55,780 26.91 55,980 25.47
Aerospace engineers......................................................................................................... 67,800 45.18 93,980 44.48 Agricultural engineers........................................................................................................ 2,640 35.02 72,850 33.04 Biomedical engineers......................................................................................................... 15,220 39.00 81,120 37.21 Chemical engineers........................................................................................................... 30,970 42.67 88,760 40.71 Civil engineers................................................................................................................... 261,360 37.77 78,560 35.87 Computer hardware engineers.......................................................................................... 73,370 48.16 100,180 46.83 Electrical engineers............................................................................................................ 154,670 41.04 85,350 39.50 Electronics engineers, except computer............................................................................ 139,930 42.63 88,670 41.52 Environmental engineers................................................................................................... 52,590 37.49 77,970 35.59 Health and safety engineers, except mining safety engineers and inspectors.................. 25,190 35.50 73,830 34.85 Industrial engineers............................................................................................................ 214,580 36.41 75,740 35.49 Marine engineers and naval architects.............................................................................. 6,480 37.46 77,920 35.64 Materials engineers............................................................................................................ 24,160 40.48 84,200 39.34 Mechanical engineers........................................................................................................ 233,610 37.59 78,200 36.02 Mining and geological engineers, including mining safety engineers................................ 6,900 38.42 79,910 36.52 Nuclear engineers.............................................................................................................. 16,640 47.96 99,750 46.68 Petroleum engineers.......................................................................................................... 20,880 57.28 119,140 51.93 Engineers, all other............................................................................................................ 169,240 42.83 89,080 42.58
Architectural and civil drafters............................................................................................ 114,910 22.30 46,390 21.39 Electrical and electronics drafters...................................................................................... 32,710 25.85 53,770 24.67 Mechanical drafters............................................................................................................ 77,070 23.36 48,600 22.42 Drafters, all other............................................................................................................... 20,720 22.73 47,290 21.60 Aerospace engineering and operations technicians.......................................................... 8,540 27.06 56,280 26.46 Civil engineering technicians............................................................................................. 88,140 21.98 45,730 21.29 Electrical and electronic engineering technicians.............................................................. 162,330 25.96 53,990 25.60 Electro-mechanical technicians......................................................................................... 16,290 23.13 48,110 22.27 Environmental engineering technicians............................................................................. 20,740 21.36 44,440 19.76 Industrial engineering technicians...................................................................................... 72,820 24.07 50,070 22.69 Mechanical engineering technicians.................................................................................. 45,770 24.06 50,040 23.14 Engineering technicians, except drafters, all other............................................................ 73,870 27.19 56,560 27.33 Surveying and mapping technicians.................................................................................. 71,920 18.03 37,500 16.88
Life, physical, and social science occupations 1,296,840 30.90 64,280 27.51 Animal scientists................................................................................................................ 2,760 29.64 61,640 26.94 Food scientists and technologists...................................................................................... 10,510 31.06 64,610 28.61 Soil and plant scientists..................................................................................................... 10,790 30.82 64,110 28.07 Biochemists and biophysicists........................................................................................... 22,230 42.53 88,450 39.83 Microbiologists................................................................................................................... 15,750 33.73 70,150 30.94 Zoologists and wildlife biologists........................................................................................ 17,780 28.28 58,820 26.58 Biological scientists, all other............................................................................................. 28,290 32.71 68,030 31.29 Conservation scientists...................................................................................................... 15,830 28.93 60,170 28.23 Foresters............................................................................................................................ 10,160 26.46 55,040 25.84 Epidemiologists.................................................................................................................. 4,370 31.01 64,500 29.50 Medical scientists, except epidemiologists......................................................................... 99,750 39.36 81,870 34.90 Life scientists, all other....................................................................................................... 12,030 33.18 69,020 29.55
See footnotes at end of table.
Table 1. National employment and wage data from the Occupational Employment Statistics survey by occupation, May 2008—Continued
Occupation EmploymentMean wages Median
hourly wages

Hourly Annual ¹
Life, physical, and social science occupations—ContinuedAstronomers....................................................................................................................... 1,280 $47.95 $99,730 $48.70Physicists........................................................................................................................... 14,810 51.17 106,440 49.47 Atmospheric and space scientists...................................................................................... 8,860 39.46 82,080 39.08 Chemists............................................................................................................................ 83,080 34.17 71,070 31.84 Materials scientists............................................................................................................. 9,650 39.23 81,600 38.57 Environmental scientists and specialists, including health................................................. 80,120 31.39 65,280 28.72 Geoscientists, except hydrologists and geographers......................................................... 31,260 42.93 89,300 38.06 Hydrologists....................................................................................................................... 7,590 35.36 73,540 34.35 Physical scientists, all other............................................................................................... 22,900 44.16 91,850 43.99
Economists........................................................................................................................ 12,600 43.67 90,830 40.19 Market research analysts................................................................................................... 230,070 32.37 67,340 29.36 Survey researchers............................................................................................................ 21,100 20.22 42,060 17.42 Clinical, counseling, and school psychologists.................................................................. 97,880 33.74 70,190 30.84 Industrial-organizational psychologists.............................................................................. 1,460 41.57 86,460 37.03 Psychologists, all other...................................................................................................... 9,870 43.49 90,460 41.41
Sociologists........................................................................................................................ 4,390 36.28 75,460 32.96 Urban and regional planners.............................................................................................. 37,120 30.00 62,400 28.75 Anthropologists and archeologists..................................................................................... 5,230 27.55 57,300 25.92 Geographers...................................................................................................................... 1,120 32.13 66,830 32.02 Historians........................................................................................................................... 3,700 27.49 57,180 26.22 Political scientists............................................................................................................... 3,530 47.75 99,320 50.06 Social scientists and related workers, all other.................................................................. 28,680 34.49 71,730 33.04
Agricultural and food science technicians.......................................................................... 18,930 17.53 36,470 16.34 Biological technicians......................................................................................................... 72,200 19.67 40,900 18.46 Chemical technicians......................................................................................................... 65,830 21.02 43,710 20.25 Geological and petroleum technicians............................................................................... 14,570 27.44 57,080 25.65 Nuclear technicians............................................................................................................ 6,360 32.17 66,910 32.64 Social science research assistants.................................................................................... 18,120 18.23 37,920 17.14 Environmental science and protection technicians, including health................................. 33,370 20.76 43,180 19.34 Forensic science technicians............................................................................................. 11,990 25.46 52,960 23.97 Forest and conservation technicians................................................................................. 30,850 16.98 35,320 15.39 Life, physical, and social science technicians, all other..................................................... 58,070 20.63 42,910 19.25
Community and social services occupations 1,861,750 20.09 41,790 18.38 Substance abuse and behavioral disorder counselors...................................................... 79,180 19.07 39,670 17.80 Educational, vocational, and school counselors................................................................ 243,100 25.74 53,540 24.54 Marriage and family therapists........................................................................................... 24,520 22.56 46,930 21.44 Mental health counselors................................................................................................... 104,650 19.36 40,270 17.70 Rehabilitation counselors................................................................................................... 112,700 16.64 34,600 14.87 Counselors, all other.......................................................................................................... 29,980 20.31 42,240 19.20 Child, family, and school social workers............................................................................ 274,140 20.73 43,120 19.01 Medical and public health social workers........................................................................... 131,730 22.87 47,560 21.95 Mental health and substance abuse social workers........................................................... 131,010 19.05 39,630 17.89 Social workers, all other..................................................................................................... 68,230 23.16 48,180 22.22 Health educators................................................................................................................ 62,120 23.36 48,590 21.16 Probation officers and correctional treatment specialists................................................... 97,130 23.81 49,520 22.07 Social and human service assistants................................................................................. 332,880 14.03 29,170 13.12 Community and social service specialists, all other........................................................... 107,910 19.21 39,950 18.11 Clergy................................................................................................................................. 42,040 21.85 45,440 20.06 Directors, religious activities and education....................................................................... 14,790 19.36 40,260 17.35 Religious workers, all other................................................................................................ 5,640 15.56 32,360 13.30
Legal occupations 1,003,270 44.36 92,270 34.49 Lawyers.............................................................................................................................. 553,690 59.98 124,750 53.17 Administrative law judges, adjudicators, and hearing officers............................................ 13,370 38.88 80,870 36.99 Arbitrators, mediators, and conciliators.............................................................................. 9,570 28.68 59,650 24.36 Judges, magistrate judges, and magistrates..................................................................... 25,470 48.29 100,450 52.99 Paralegals and legal assistants......................................................................................... 253,040 23.46 48,790 22.18 Court reporters................................................................................................................... 17,930 24.98 51,960 23.90 Law clerks.......................................................................................................................... 31,500 19.51 40,580 17.85 Title examiners, abstractors, and searchers...................................................................... 59,390 20.24 42,090 18.41 Legal support workers, all other......................................................................................... 39,310 27.24 56,660 24.16
Education, training, and library occupations 8,451,250 23.30 48,460 21.26 Business teachers, postsecondary.................................................................................... 69,690 (²) 77,340 (²)Computer science teachers, postsecondary...................................................................... 32,520 (²) 74,050 (²)Mathematical science teachers, postsecondary................................................................ 45,710 (²) 68,130 (²)
See footnotes at end of table.
Table 1. National employment and wage data from the Occupational Employment Statistics survey by occupation, May 2008—Continued
Occupation EmploymentMean wages Median
hourly wages

Hourly Annual ¹
Education, training, and library occupations—ContinuedArchitecture teachers, postsecondary................................................................................ 6,430 (²) $75,450 (²)Engineering teachers, postsecondary................................................................................ 32,070 (²) 90,070 (²)Agricultural sciences teachers, postsecondary.................................................................. 10,000 (²) 77,770 (²)Biological science teachers, postsecondary...................................................................... 51,930 (²) 83,270 (²)Forestry and conservation science teachers, postsecondary............................................ 2,450 (²) 67,400 (²)Atmospheric, earth, marine, and space sciences teachers, postsecondary...................... 9,650 (²) 81,470 (²)Chemistry teachers, postsecondary................................................................................... 19,950 (²) 76,310 (²)Environmental science teachers, postsecondary............................................................... 4,870 (²) 74,610 (²)Physics teachers, postsecondary....................................................................................... 12,350 (²) 81,880 (²)
Anthropology and archeology teachers, postsecondary.................................................... 5,500 (²) 73,410 (²)Area, ethnic, and cultural studies teachers, postsecondary............................................... 7,570 (²) 70,560 (²)Economics teachers, postsecondary................................................................................. 12,540 (²) 88,330 (²)Geography teachers, postsecondary................................................................................. 4,030 (²) 67,480 (²)Political science teachers, postsecondary......................................................................... 14,340 (²) 75,960 (²)Psychology teachers, postsecondary................................................................................. 31,420 (²) 69,560 (²)Sociology teachers, postsecondary................................................................................... 16,440 (²) 68,900 (²)Social sciences teachers, postsecondary, all other........................................................... 5,720 (²) 74,720 (²)Health specialties teachers, postsecondary....................................................................... 125,100 (²) 102,000 (²)Nursing instructors and teachers, postsecondary.............................................................. 46,890 (²) 62,660 (²)Education teachers, postsecondary................................................................................... 55,880 (²) 60,080 (²)Library science teachers, postsecondary........................................................................... 3,960 (²) 61,630 (²)
Criminal justice and law enforcement teachers, postsecondary........................................ 11,630 (²) 59,830 (²)Law teachers, postsecondary............................................................................................ 12,490 (²) 101,170 (²)Social work teachers, postsecondary................................................................................. 7,930 (²) 64,680 (²)Art, drama, and music teachers, postsecondary................................................................ 76,810 (²) 65,030 (²)Communications teachers, postsecondary........................................................................ 24,360 (²) 63,330 (²)English language and literature teachers, postsecondary................................................. 62,230 (²) 63,610 (²)Foreign language and literature teachers, postsecondary................................................. 26,400 (²) 65,280 (²)History teachers, postsecondary........................................................................................ 21,020 (²) 68,360 (²)Philosophy and religion teachers, postsecondary.............................................................. 18,370 (²) 65,140 (²)Graduate teaching assistants............................................................................................ 124,380 (²) 31,710 (²)Home economics teachers, postsecondary....................................................................... 4,820 (²) 70,420 (²)Recreation and fitness studies teachers, postsecondary................................................... 17,410 (²) 60,700 (²)Vocational education teachers, postsecondary.................................................................. 112,940 24.46 50,870 22.76Postsecondary teachers, all other...................................................................................... 242,780 (²) 71,320 (²)
Preschool teachers, except special education................................................................... 392,170 12.80 26,610 11.48 Kindergarten teachers, except special education.............................................................. 174,530 (²) 49,770 (²)Elementary school teachers, except special education..................................................... 1,544,270 (²) 52,240 (²)Middle school teachers, except special and vocational education..................................... 661,820 (²) 52,570 (²)Vocational education teachers, middle school................................................................... 15,720 (²) 50,150 (²)Secondary school teachers, except special and vocational education.............................. 1,090,490 (²) 54,390 (²)Vocational education teachers, secondary school............................................................. 99,800 (²) 53,700 (²)Special education teachers, preschool, kindergarten, and elementary school.................. 226,250 (²) 52,970 (²)Special education teachers, middle school........................................................................ 100,650 (²) 53,540 (²)Special education teachers, secondary school.................................................................. 147,210 (²) 55,050 (²)Adult literacy, remedial education, and GED teachers and instructors.............................. 73,050 23.95 49,830 22.26 Self-enrichment education teachers.................................................................................. 163,190 19.68 40,920 17.17 Teachers and instructors, all other..................................................................................... 574,540 (²) 40,770 (²)
Archivists............................................................................................................................ 5,330 23.18 48,220 21.64 Curators............................................................................................................................. 10,820 24.78 51,540 22.70 Museum technicians and conservators.............................................................................. 10,200 19.59 40,750 17.63 Librarians........................................................................................................................... 151,170 26.30 54,700 25.26 Library technicians............................................................................................................. 113,510 14.49 30,130 13.86 Audio-visual collections specialists.................................................................................... 6,160 21.90 45,540 20.86 Farm and home management advisors............................................................................. 10,760 21.46 44,630 19.97 Instructional coordinators................................................................................................... 122,180 28.74 59,780 27.35 Teacher assistants............................................................................................................. 1,266,900 (²) 23,560 (²)Education, training, and library workers, all other.............................................................. 99,900 19.50 40,560 17.07
Arts, design, entertainment, sports, and media occupations 1,804,940 24.36 50,670 19.99 Art directors........................................................................................................................ 33,670 42.55 88,510 37.01 Craft artists......................................................................................................................... 5,440 15.66 32,570 13.98 Fine artists, including painters, sculptors, and illustrators.................................................. 9,380 23.22 48,300 20.51 Multi-media artists and animators...................................................................................... 31,500 29.99 62,380 27.08 Artists and related workers, all other.................................................................................. 8,470 26.51 55,140 24.81
See footnotes at end of table.
EmploymentMean wages Median
hourly wages
May 2008—Continued
Occupation
Table 1. National employment and wage data from the Occupational Employment Statistics survey by occupation,

Hourly Annual ¹
Arts, design, entertainment, sports, and media occupations—ContinuedCommercial and industrial designers................................................................................. 32,940 $29.60 $61,580 $27.57Fashion designers.............................................................................................................. 16,920 34.33 71,400 29.41 Floral designers................................................................................................................. 57,500 11.78 24,510 11.17 Graphic designers.............................................................................................................. 209,290 22.48 46,750 20.39 Interior designers............................................................................................................... 53,290 24.53 51,020 21.61 Merchandise displayers and window trimmers................................................................... 63,320 13.73 28,560 12.47 Set and exhibit designers................................................................................................... 7,940 23.40 48,660 21.47 Designers, all other............................................................................................................ 11,160 24.10 50,130 21.07
Actors................................................................................................................................. 44,360 29.05 (²) 16.59 Producers and directors..................................................................................................... 78,060 39.92 83,030 30.98 Athletes and sports competitors......................................................................................... 13,960 (²) 79,460 (²)Coaches and scouts.......................................................................................................... 175,720 (²) 35,580 (²)Umpires, referees, and other sports officials..................................................................... 12,970 (²) 28,330 (²)Dancers.............................................................................................................................. 11,370 15.06 (²) 12.22 Choreographers................................................................................................................. 13,860 20.13 41,870 18.52 Music directors and composers......................................................................................... 9,120 26.36 54,840 19.84 Musicians and singers....................................................................................................... 47,030 28.28 (²) 21.24 Entertainers and performers, sports and related workers, all other................................... 36,190 17.91 (²) 14.62
Radio and television announcers....................................................................................... 37,290 19.43 40,410 12.95 Public address system and other announcers................................................................... 8,280 18.04 37,530 13.18 Broadcast news analysts................................................................................................... 6,310 34.00 70,730 24.65 Reporters and correspondents.......................................................................................... 50,690 21.17 44,030 16.75 Public relations specialists................................................................................................. 240,610 28.34 58,960 24.65 Editors................................................................................................................................ 110,010 27.49 57,180 24.04 Technical writers................................................................................................................ 47,460 30.87 64,210 29.62 Writers and authors........................................................................................................... 44,170 31.04 64,560 25.51 Interpreters and translators................................................................................................ 36,610 20.74 43,130 18.68 Media and communication workers, all other..................................................................... 24,470 22.97 47,770 19.99
Audio and video equipment technicians............................................................................ 45,200 19.86 41,310 18.30 Broadcast technicians........................................................................................................ 33,550 18.30 38,070 15.82 Radio operators................................................................................................................. 820 18.52 38,520 17.85 Sound engineering technicians.......................................................................................... 16,600 25.53 53,110 22.83 Photographers................................................................................................................... 61,670 17.14 35,640 14.15 Camera operators, television, video, and motion picture................................................... 19,270 22.94 47,710 20.03 Film and video editors........................................................................................................ 18,720 30.05 62,500 24.31 Media and communication equipment workers, all other................................................... 19,770 26.98 56,120 25.45
Healthcare practitioner and technical occupations 7,076,800 32.64 67,890 27.20 Chiropractors..................................................................................................................... 27,050 39.11 81,340 31.97 Dentists, general................................................................................................................ 85,910 74.17 154,270 68.69 Oral and maxillofacial surgeons......................................................................................... 4,760 91.55 190,420 (³)Orthodontists...................................................................................................................... 5,500 93.72 194,930 (³)Prosthodontists.................................................................................................................. 370 81.64 169,810 (³)Dentists, all other specialists.............................................................................................. 4,770 68.30 142,070 66.33 Dietitians and nutritionists.................................................................................................. 53,630 24.75 51,470 24.32 Optometrists....................................................................................................................... 25,970 50.58 105,200 46.31 Pharmacists....................................................................................................................... 266,410 50.13 104,260 51.16
Anesthesiologists............................................................................................................... 34,230 94.99 197,570 (³)Family and general practitioners........................................................................................ 106,210 77.64 161,490 75.60 Internists, general.............................................................................................................. 46,980 84.97 176,740 (³)Obstetricians and gynecologists........................................................................................ 19,750 92.68 192,780 (³)Pediatricians, general........................................................................................................ 29,170 73.74 153,370 70.21 Psychiatrists....................................................................................................................... 22,140 74.06 154,050 74.13 Surgeons............................................................................................................................ 47,070 99.41 206,770 (³)Physicians and surgeons, all other.................................................................................... 262,850 79.33 165,000 (³)
Physician assistants........................................................................................................... 71,950 39.24 81,610 39.05 Podiatrists.......................................................................................................................... 9,670 60.46 125,760 54.60 Registered nurses.............................................................................................................. 2,542,760 31.31 65,130 30.03 Audiologists........................................................................................................................ 12,480 31.49 65,500 29.82 Occupational therapists..................................................................................................... 94,800 32.65 67,920 32.10
Physical therapists............................................................................................................. 167,300 35.77 74,410 35.00 Radiation therapists........................................................................................................... 14,850 36.28 75,450 35.05 Recreational therapists...................................................................................................... 22,510 19.20 39,930 18.45 Respiratory therapists........................................................................................................ 103,870 25.55 53,150 25.10
See footnotes at end of table.
Mean wages Median hourly wages
Table 1. National employment and wage data from the Occupational Employment Statistics survey by occupation, May 2008—Continued
Occupation Employment

Hourly Annual ¹
Healthcare practitioner and technical occupations —ContinuedSpeech-language pathologists........................................................................................... 107,340 $31.80 $66,130 $30.25Therapists, all other........................................................................................................... 12,960 26.32 54,750 24.37 Veterinarians...................................................................................................................... 53,110 43.00 89,450 38.01 Health diagnosing and treating practitioners, all other....................................................... 34,890 37.76 78,540 31.67
Medical and clinical laboratory technologists..................................................................... 166,510 25.99 54,050 25.72 Medical and clinical laboratory technicians........................................................................ 149,670 17.86 37,150 17.01 Dental hygienists................................................................................................................ 173,090 32.19 66,950 32.00 Cardiovascular technologists and technicians................................................................... 48,040 23.38 48,640 22.60 Diagnostic medical sonographers...................................................................................... 48,920 30.12 62,660 29.80 Nuclear medicine technologists......................................................................................... 21,200 32.44 67,480 32.05 Radiologic technologists and technicians.......................................................................... 208,570 25.59 53,230 25.10 Emergency medical technicians and paramedics.............................................................. 207,610 15.38 31,980 14.10
Dietetic technicians............................................................................................................ 24,620 13.26 27,580 12.54 Pharmacy technicians........................................................................................................ 324,110 13.70 28,500 13.32 Psychiatric technicians....................................................................................................... 54,800 15.48 32,190 14.06 Respiratory therapy technicians......................................................................................... 16,210 21.00 43,670 20.40 Surgical technologists........................................................................................................ 89,600 19.27 40,070 18.62 Veterinary technologists and technicians........................................................................... 78,920 14.35 29,850 13.89 Licensed practical and licensed vocational nurses............................................................ 730,500 19.28 40,110 18.77 Medical records and health information technicians.......................................................... 168,650 15.85 32,960 14.71 Opticians, dispensing......................................................................................................... 59,470 16.85 35,060 15.77 Orthotists and prosthetists................................................................................................. 5,490 31.76 66,060 30.09 Health technologists and technicians, all other.................................................................. 74,990 19.89 41,380 18.25 Occupational health and safety specialists........................................................................ 53,250 30.31 63,030 29.93 Occupational health and safety technicians....................................................................... 10,540 22.79 47,410 21.81 Athletic trainers.................................................................................................................. 15,070 (²) 41,620 (²)Healthcare practitioner and technical workers, all other.................................................... 55,750 24.28 50,510 20.98
Healthcare support occupations 3,779,280 12.66 26,340 11.80 Home health aides............................................................................................................. 892,410 10.31 21,440 9.84 Nursing aides, orderlies, and attendants........................................................................... 1,422,720 11.84 24,620 11.46 Psychiatric aides................................................................................................................ 59,050 13.10 27,260 12.77 Occupational therapist assistants...................................................................................... 25,610 23.29 48,440 23.19 Occupational therapist aides.............................................................................................. 7,410 14.22 29,580 12.96 Physical therapist assistants.............................................................................................. 61,820 22.26 46,300 22.18 Physical therapist aides..................................................................................................... 44,410 11.91 24,770 11.42 Massage therapists............................................................................................................ 51,250 19.16 39,850 16.78 Dental assistants................................................................................................................ 293,090 15.95 33,170 15.57 Medical assistants.............................................................................................................. 475,950 13.97 29,060 13.60 Medical equipment preparers............................................................................................ 44,340 14.08 29,290 13.66 Medical transcriptionists..................................................................................................... 86,200 15.84 32,960 15.41 Pharmacy aides................................................................................................................. 53,190 10.34 21,500 9.66 Veterinary assistants and laboratory animal caretakers.................................................... 71,950 10.96 22,790 10.20 Healthcare support workers, all other................................................................................ 189,890 14.74 30,650 14.11
Protective service occupations 3,128,960 19.33 40,200 16.65 First-line supervisors/managers of correctional officers..................................................... 40,840 28.07 58,380 27.58 First-line supervisors/managers of police and detectives.................................................. 92,840 36.93 76,820 36.29 First-line supervisors/managers of fire fighting and prevention workers............................ 53,300 34.07 70,860 32.42 First-line supervisors/managers, protective service workers, all other.............................. 49,310 22.93 47,700 20.95
Fire fighters........................................................................................................................ 298,900 21.97 45,700 21.28 Fire inspectors and investigators....................................................................................... 12,920 26.37 54,840 25.50 Forest fire inspectors and prevention specialists............................................................... 1,580 17.50 36,400 15.09
Bailiffs................................................................................................................................ 19,290 18.79 39,090 18.18 Correctional officers and jailers.......................................................................................... 428,040 19.88 41,340 18.45 Detectives and criminal investigators................................................................................. 104,480 30.69 63,840 29.29 Fish and game wardens..................................................................................................... 7,720 26.94 56,030 23.53 Parking enforcement workers............................................................................................ 9,530 16.36 34,020 15.57 Police and sheriff's patrol officers...................................................................................... 633,710 25.39 52,810 24.72 Transit and railroad police.................................................................................................. 3,830 23.34 48,540 22.44
Animal control workers....................................................................................................... 15,480 15.38 31,990 14.57 Private detectives and investigators.................................................................................. 35,820 22.35 46,480 20.08 Gaming surveillance officers and gaming investigators..................................................... 9,100 15.17 31,550 13.87 Security guards.................................................................................................................. 1,046,760 12.42 25,840 11.28
See footnotes at end of table.
Median hourly wages
Table 1. National employment and wage data from the Occupational Employment Statistics survey by occupation, May 2008—Continued
Occupation EmploymentMean wages

Hourly Annual ¹
Protective service occupations—ContinuedCrossing guards................................................................................................................. 68,530 $11.68 $24,290 $10.96Lifeguards, ski patrol, and other recreational protective service workers.......................... 111,560 9.58 19,930 8.87 Protective service workers, all other.................................................................................. 85,440 15.66 32,580 14.00
Food preparation and serving related occupations 11,438,550 9.72 20,220 8.59 Chefs and head cooks....................................................................................................... 98,040 20.39 42,410 18.64 First-line supervisors/managers of food preparation and serving workers........................ 805,360 14.81 30,810 13.93 Cooks, fast food................................................................................................................. 559,160 8.47 17,620 8.12 Cooks, institution and cafeteria.......................................................................................... 370,920 11.19 23,260 10.68 Cooks, private household.................................................................................................. 960 14.91 31,020 11.57 Cooks, restaurant............................................................................................................... 899,620 10.94 22,750 10.57 Cooks, short order............................................................................................................. 168,770 9.73 20,230 9.26 Cooks, all other.................................................................................................................. 17,340 11.91 24,770 11.09 Food preparation workers.................................................................................................. 880,480 9.54 19,850 8.96
Bartenders......................................................................................................................... 503,420 9.84 20,460 8.54 Combined food preparation and serving workers, including fast food............................... 2,708,840 8.36 17,400 7.90 Counter attendants, cafeteria, food concession, and coffee shop..................................... 527,530 8.90 18,520 8.42 Waiters and waitresses...................................................................................................... 2,371,750 9.41 19,580 8.01 Food servers, nonrestaurant.............................................................................................. 188,390 10.19 21,190 9.32 Dining room and cafeteria attendants and bartender helpers............................................ 416,410 8.72 18,140 8.05 Dishwashers....................................................................................................................... 521,150 8.54 17,750 8.19 Hosts and hostesses, restaurant, lounge, and coffee shop............................................... 349,990 8.93 18,570 8.42 Food preparation and serving related workers, all other.................................................... 50,420 10.32 21,460 9.39
Building and grounds cleaning and maintenance occupations 4,429,870 11.72 24,370 10.52 First-line supervisors/managers of housekeeping and janitorial workers........................... 183,560 17.46 36,310 16.34 First-line supervisors/managers of landscaping, lawn service, and groundskeeping workers............................................................................................. 108,940 20.67 42,990 19.19 Janitors and cleaners, except maids and housekeeping cleaners..................................... 2,145,320 11.30 23,500 10.31 Maids and housekeeping cleaners.................................................................................... 917,120 9.76 20,290 9.13 Building cleaning workers, all other.................................................................................... 13,580 13.78 28,660 13.09 Pest control workers........................................................................................................... 63,180 14.92 31,040 14.37 Landscaping and groundskeeping workers........................................................................ 921,900 11.95 24,860 11.13 Pesticide handlers, sprayers, and applicators, vegetation................................................. 25,060 15.01 31,210 14.31 Tree trimmers and pruners................................................................................................ 35,420 15.12 31,450 14.41 Grounds maintenance workers, all other........................................................................... 15,790 13.07 27,180 10.76
Personal care and service occupations 3,437,520 11.59 24,120 9.82 Gaming supervisors........................................................................................................... 26,110 22.40 46,600 21.87 Slot key persons................................................................................................................ 15,390 13.68 28,460 12.24 First-line supervisors/managers of personal service workers............................................ 129,070 18.38 38,230 16.78 Animal trainers................................................................................................................... 10,030 14.99 31,190 13.11 Nonfarm animal caretakers................................................................................................ 126,740 10.36 21,550 9.31
Gaming dealers.................................................................................................................. 91,130 9.56 19,890 7.84 Gaming and sports book writers and runners.................................................................... 16,140 10.96 22,800 9.46 Gaming service workers, all other...................................................................................... 13,910 12.16 25,290 11.58 Motion picture projectionists.............................................................................................. 10,200 10.91 22,700 9.46 Ushers, lobby attendants, and ticket takers....................................................................... 106,570 9.18 19,100 8.35 Amusement and recreation attendants.............................................................................. 258,820 9.10 18,930 8.40 Costume attendants........................................................................................................... 5,120 15.46 32,150 12.62 Locker room, coatroom, and dressing room attendants.................................................... 18,170 10.33 21,490 9.48 Entertainment attendants and related workers, all other.................................................... 43,930 10.06 20,920 9.39 Embalmers......................................................................................................................... 8,090 18.90 39,320 18.32 Funeral attendants............................................................................................................. 33,060 11.19 23,270 10.63 Barbers.............................................................................................................................. 10,330 12.79 26,610 11.56 Hairdressers, hairstylists, and cosmetologists................................................................... 355,990 12.82 26,660 11.13 Makeup artists, theatrical and performance....................................................................... 1,930 18.76 39,020 12.63 Manicurists and pedicurists................................................................................................ 51,590 10.60 22,040 9.46 Shampooers....................................................................................................................... 15,570 8.80 18,300 8.32 Skin care specialists.......................................................................................................... 26,300 15.40 32,040 13.81
Baggage porters and bellhops........................................................................................... 49,770 11.14 23,170 9.49 Concierges......................................................................................................................... 20,380 13.52 28,120 13.07 Tour guides and escorts.................................................................................................... 31,760 12.09 25,150 11.19 Travel guides..................................................................................................................... 4,510 16.18 33,660 14.60 Flight attendants................................................................................................................ 99,480 (²) 39,840 (²)Transportation attendants, except flight attendants and baggage porters......................... 21,870 10.76 22,370 9.98
See footnotes at end of table.
Table 1. National employment and wage data from the Occupational Employment Statistics survey by occupation, May 2008—Continued
Occupation EmploymentMean wages Median
hourly wages

Hourly Annual ¹
Personal care and service occupations—ContinuedChild care workers............................................................................................................. 581,670 $9.79 $20,350 $9.12Personal and home care aides.......................................................................................... 614,190 9.47 19,690 9.22 Fitness trainers and aerobics instructors........................................................................... 229,030 16.50 34,310 14.04 Recreation workers............................................................................................................ 282,680 11.81 24,570 10.56 Residential advisors........................................................................................................... 52,240 12.17 25,320 11.26 Personal care and service workers, all other..................................................................... 75,780 10.88 22,630 9.59
Sales and related occupations 14,336,430 17.35 36,080 11.69 First-line supervisors/managers of retail sales workers..................................................... 1,186,270 19.19 39,910 16.97 First-line supervisors/managers of non-retail sales workers.............................................. 275,390 38.40 79,870 32.74 Cashiers............................................................................................................................. 3,545,610 9.08 18,880 8.49 Gaming change persons and booth cashiers.................................................................... 22,280 11.00 22,890 10.57
Counter and rental clerks................................................................................................... 448,480 11.74 24,430 10.05 Parts salespersons............................................................................................................ 226,530 14.83 30,850 13.71 Retail salespersons............................................................................................................ 4,426,280 12.04 25,050 9.86
Advertising sales agents.................................................................................................... 161,550 25.56 53,170 20.90 Insurance sales agents...................................................................................................... 327,780 29.06 60,440 21.84 Securities, commodities, and financial services sales agents............................................ 271,900 44.26 92,050 33.02 Travel agents..................................................................................................................... 86,420 15.61 32,470 14.70 Sales representatives, services, all other.......................................................................... 569,130 28.38 59,030 23.77 Sales representatives, wholesale and manufacturing, technical and scientific products…… 415,120 38.11 79,260 33.75 Sales representatives, wholesale and manufacturing, except technical and scientific products......................................................................................................................... 1,493,760 29.55 61,470 24.68 Demonstrators and product promoters.............................................................................. 83,540 13.05 27,150 11.18 Models............................................................................................................................... 1,660 14.50 30,160 13.18 Real estate brokers............................................................................................................ 51,390 37.13 77,240 27.64 Real estate sales agents.................................................................................................... 164,080 26.16 54,410 19.30 Sales engineers................................................................................................................. 78,030 43.16 89,770 39.95 Telemarketers.................................................................................................................... 345,220 11.91 24,770 10.56 Door-to-door sales workers, news and street vendors, and related workers..................... 9,520 13.27 27,600 10.09 Sales and related workers, all other................................................................................... 146,480 20.10 41,810 16.99
Office and administrative support occupations 23,231,750 15.49 32,220 14.32 First-line supervisors/managers of office and administrative support workers.................. 1,404,330 23.42 48,700 22.02 Switchboard operators, including answering service......................................................... 153,860 12.14 25,250 11.65 Telephone operators.......................................................................................................... 22,820 16.25 33,800 15.23 Communications equipment operators, all other............................................................... 3,500 17.79 37,000 16.85
Bill and account collectors................................................................................................. 408,760 15.47 32,180 14.73 Billing and posting clerks and machine operators.............................................................. 512,120 15.44 32,120 14.88 Bookkeeping, accounting, and auditing clerks................................................................... 1,855,010 16.25 33,800 15.63 Gaming cage workers........................................................................................................ 17,060 12.48 25,970 11.97 Payroll and timekeeping clerks.......................................................................................... 203,210 17.07 35,500 16.74 Procurement clerks............................................................................................................ 79,610 16.96 35,280 16.72 Tellers................................................................................................................................ 600,380 11.66 24,250 11.35
Brokerage clerks................................................................................................................ 68,430 19.89 41,370 18.61 Correspondence clerks...................................................................................................... 13,450 15.04 31,280 14.73 Court, municipal, and license clerks.................................................................................. 115,070 16.88 35,120 15.96 Credit authorizers, checkers, and clerks............................................................................ 65,020 15.37 31,980 14.61 Customer service representatives..................................................................................... 2,233,270 15.28 31,790 14.36 Eligibility interviewers, government programs.................................................................... 112,510 19.16 39,850 18.90 File clerks........................................................................................................................... 204,760 12.16 25,290 11.44 Hotel, motel, and resort desk clerks................................................................................... 230,230 9.92 20,630 9.37
Interviewers, except eligibility and loan.............................................................................. 224,690 13.96 29,040 13.53 Library assistants, clerical.................................................................................................. 114,740 11.68 24,290 10.88 Loan interviewers and clerks............................................................................................. 212,340 16.29 33,890 15.61 New accounts clerks.......................................................................................................... 87,300 14.90 30,990 14.53 Order clerks....................................................................................................................... 248,030 14.08 29,300 13.46 Human resources assistants, except payroll and timekeeping.......................................... 164,340 17.70 36,810 17.19 Receptionists and information clerks................................................................................. 1,097,610 12.21 25,400 11.80 Reservation and transportation ticket agents and travel clerks......................................... 163,880 15.41 32,060 14.94 All other information and record clerks.............................................................................. 215,780 16.78 34,910 16.15
Cargo and freight agents................................................................................................... 85,950 18.67 38,830 17.92 Couriers and messengers.................................................................................................. 96,110 12.07 25,100 11.22 Police, fire, and ambulance dispatchers............................................................................ 96,360 16.99 35,340 16.19 Dispatchers, except police, fire, and ambulance................................................................ 193,210 17.58 36,560 16.28
See footnotes at end of table.
Occupation EmploymentMean wages Median
hourly wages
Table 1. National employment and wage data from the Occupational Employment Statistics survey by occupation, May 2008—Continued

Hourly Annual ¹
Office and administrative support occupations—ContinuedMeter readers, utilities........................................................................................................ 44,730 $16.77 $34,890 $15.84Postal service clerks.......................................................................................................... 78,250 c 24.11 c 50,150 c 24.54Postal service mail carriers................................................................................................ 354,570 c 22.58 c 46,970 c 23.94Postal service mail sorters, processors, and processing machine operators.................... 185,770 c 21.87 c 45,490 c 24.05Production, planning, and expediting clerks....................................................................... 281,660 20.26 42,150 19.46 Shipping, receiving, and traffic clerks................................................................................ 760,950 14.03 29,180 13.30 Stock clerks and order fillers.............................................................................................. 1,873,390 11.13 23,140 10.00 Weighers, measurers, checkers, and samplers, recordkeeping........................................ 72,720 13.70 28,500 12.95
Executive secretaries and administrative assistants.......................................................... 1,491,520 20.35 42,340 19.24 Legal secretaries................................................................................................................ 257,810 20.02 41,640 19.16 Medical secretaries............................................................................................................ 454,500 14.81 30,800 14.27 Secretaries, except legal, medical, and executive............................................................. 1,872,070 14.42 29,990 13.96
Computer operators........................................................................................................... 107,450 17.82 37,070 17.11 Data entry keyers............................................................................................................... 272,810 13.04 27,110 12.56 Word processors and typists............................................................................................. 128,010 15.73 32,710 15.09 Desktop publishers............................................................................................................ 26,210 18.62 38,740 17.59 Insurance claims and policy processing clerks.................................................................. 237,800 16.75 34,830 15.91 Mail clerks and mail machine operators, except postal service......................................... 137,350 12.70 26,420 12.07 Office clerks, general......................................................................................................... 2,906,600 12.90 26,830 12.17 Office machine operators, except computer...................................................................... 79,470 13.13 27,310 12.40 Proofreaders and copy markers......................................................................................... 15,300 15.50 32,240 14.66 Statistical assistants........................................................................................................... 16,900 17.32 36,020 16.76 Office and administrative support workers, all other.......................................................... 272,190 15.15 31,510 14.10
Farming, fishing, and forestry occupations 438,490 11.32 23,560 9.34 First-line supervisors/managers of farming, fishing, and forestry workers......................... 20,800 20.55 42,740 19.11 Farm labor contractors....................................................................................................... 1,110 17.62 36,640 16.10 Agricultural inspectors........................................................................................................ 14,340 19.87 41,330 19.80 Animal breeders................................................................................................................. 2,080 15.90 33,070 13.02 Graders and sorters, agricultural products......................................................................... 37,500 9.85 20,490 9.06 Agricultural equipment operators....................................................................................... 22,110 11.77 24,490 10.92 Farmworkers and laborers, crop, nursery, and greenhouse.............................................. 242,390 9.27 19,280 8.64 Farmworkers, farm and ranch animals.............................................................................. 38,110 11.02 22,920 10.13 Agricultural workers, all other............................................................................................. 7,680 13.13 27,310 12.00 Fishers and related fishing workers................................................................................... 1,110 13.68 28,460 13.44 Forest and conservation workers....................................................................................... 8,280 12.55 26,110 10.98 Fallers................................................................................................................................ 7,120 16.43 34,180 14.66 Logging equipment operators............................................................................................ 27,010 15.76 32,780 15.18 Log graders and scalers.................................................................................................... 3,610 16.51 34,330 15.64 Logging workers, all other.................................................................................................. 5,180 15.82 32,900 15.96
Construction and extraction occupations 6,548,760 20.36 42,350 18.24 First-line supervisors/managers of construction trades and extraction workers................ 577,390 29.46 61,280 27.95 Boilermakers...................................................................................................................... 20,400 25.53 53,100 25.13 Brickmasons and blockmasons......................................................................................... 106,270 22.95 47,740 21.94 Stonemasons..................................................................................................................... 18,910 19.68 40,930 18.17 Carpenters......................................................................................................................... 899,920 20.64 42,940 18.72 Carpet installers................................................................................................................. 34,390 19.87 41,330 17.80 Floor layers, except carpet, wood, and hard tiles............................................................... 14,250 19.03 39,580 17.50 Floor sanders and finishers................................................................................................ 8,220 16.93 35,220 15.41 Tile and marble setters...................................................................................................... 51,210 20.13 41,870 18.85 Cement masons and concrete finishers............................................................................. 201,730 18.75 39,000 16.87 Terrazzo workers and finishers.......................................................................................... 5,550 18.90 39,300 17.25 Construction laborers......................................................................................................... 1,020,290 15.51 32,250 13.71 Paving, surfacing, and tamping equipment operators........................................................ 61,230 17.54 36,490 16.00 Pile-driver operators........................................................................................................... 4,790 24.83 51,640 23.01 Operating engineers and other construction equipment operators.................................... 398,910 20.97 43,630 18.88 Drywall and ceiling tile installers........................................................................................ 128,740 19.68 40,940 18.12 Tapers................................................................................................................................ 31,850 22.07 45,900 21.03
Electricians......................................................................................................................... 633,010 23.98 49,890 22.32 Glaziers.............................................................................................................................. 51,730 18.74 38,990 17.11 Insulation workers, floor, ceiling, and wall.......................................................................... 28,390 16.79 34,920 15.34 Insulation workers, mechanical.......................................................................................... 30,150 19.99 41,570 17.95 Painters, construction and maintenance............................................................................ 250,310 17.56 36,510 15.85
See footnotes at end of table.
Table 1. National employment and wage data from the Occupational Employment Statistics survey by occupation, May 2008—Continued
Occupation EmploymentMean wages Median
hourly wages

Hourly Annual ¹
Construction and extraction occupations —ContinuedPaperhangers.................................................................................................................... 4,610 $19.00 $39,520 $16.76Pipelayers.......................................................................................................................... 54,440 17.45 36,300 15.72 Plumbers, pipefitters, and steamfitters............................................................................... 437,540 23.65 49,200 21.94 Plasterers and stucco masons........................................................................................... 43,290 19.27 40,070 18.01 Reinforcing iron and rebar workers.................................................................................... 28,620 21.34 44,380 19.18 Roofers.............................................................................................................................. 120,200 18.00 37,430 16.17 Sheet metal workers.......................................................................................................... 163,480 21.30 44,310 19.37 Structural iron and steel workers........................................................................................ 68,670 22.68 47,170 20.68
Helpers--brickmasons, blockmasons, stonemasons, and tile and marble setters............. 53,300 14.24 29,610 13.19 Helpers--carpenters........................................................................................................... 81,260 12.69 26,390 12.21 Helpers--electricians.......................................................................................................... 104,050 13.20 27,450 12.69 Helpers--painters, paperhangers, plasterers, and stucco masons.................................... 19,900 11.70 24,330 11.23 Helpers--pipelayers, plumbers, pipefitters, and steamfitters.............................................. 79,870 13.10 27,260 12.73 Helpers--roofers................................................................................................................. 18,730 11.85 24,660 11.47 Helpers, construction trades, all other............................................................................... 27,210 13.04 27,130 12.01
Construction and building inspectors................................................................................. 96,000 25.08 52,160 24.12 Elevator installers and repairers........................................................................................ 25,070 32.57 67,750 33.35 Fence erectors................................................................................................................... 25,710 14.49 30,130 13.49 Hazardous materials removal workers............................................................................... 42,500 19.37 40,290 17.94 Highway maintenance workers.......................................................................................... 136,420 16.84 35,040 16.35 Rail-track laying and maintenance equipment operators................................................... 15,020 21.57 44,870 21.26 Septic tank servicers and sewer pipe cleaners.................................................................. 24,730 17.09 35,550 16.19 Segmental pavers.............................................................................................................. 1,170 13.68 28,450 13.17 Construction and related workers, all other........................................................................ 55,820 16.91 35,170 15.65
Derrick operators, oil and gas............................................................................................ 23,590 20.18 41,980 20.15 Rotary drill operators, oil and gas...................................................................................... 27,020 26.14 54,370 23.94 Service unit operators, oil, gas, and mining....................................................................... 36,850 19.86 41,320 18.07 Earth drillers, except oil and gas........................................................................................ 20,220 19.88 41,360 18.39 Explosives workers, ordnance handling experts, and blasters.......................................... 6,060 21.39 44,490 20.18 Continuous mining machine operators.............................................................................. 10,920 21.91 45,570 22.09 Mine cutting and channeling machine operators............................................................... 9,190 19.96 41,510 19.94 Mining machine operators, all other................................................................................... 4,650 20.79 43,240 20.62 Rock splitters, quarry......................................................................................................... 4,210 14.50 30,160 13.41 Roof bolters, mining........................................................................................................... 4,950 21.97 45,690 21.74 Roustabouts, oil and gas................................................................................................... 62,540 15.70 32,660 14.72 Helpers--extraction workers............................................................................................... 25,550 16.36 34,030 15.74 Extraction workers, all other............................................................................................... 7,800 19.89 41,370 18.49
Installation, maintenance, and repair occupations 5,374,850 19.82 41,230 18.60 First-line supervisors/managers of mechanics, installers, and repairers........................... 443,840 28.44 59,160 27.55 Computer, automated teller, and office machine repairers................................................ 122,400 18.95 39,420 18.18 Radio mechanics............................................................................................................... 5,440 20.45 42,530 19.36 Telecommunications equipment installers and repairers, except line installers................. 195,170 25.31 52,650 26.73 Avionics technicians........................................................................................................... 18,360 23.73 49,360 23.71 Electric motor, power tool, and related repairers............................................................... 23,400 17.84 37,110 16.96 Electrical and electronics installers and repairers, transportation equipment.................... 15,860 21.60 44,940 21.37 Electrical and electronics repairers, commercial and industrial equipment........................ 77,270 23.68 49,260 23.29 Electrical and electronics repairers, powerhouse, substation, and relay........................... 23,180 29.18 60,700 29.34 Electronic equipment installers and repairers, motor vehicles........................................... 19,980 14.31 29,770 13.29 Electronic home entertainment equipment installers and repairers................................... 38,680 16.26 33,830 15.42 Security and fire alarm systems installers.......................................................................... 62,720 18.57 38,630 17.63
Aircraft mechanics and service technicians....................................................................... 116,310 24.83 51,650 24.71 Automotive body and related repairers.............................................................................. 147,200 19.21 39,950 17.81 Automotive glass installers and repairers.......................................................................... 18,330 15.95 33,180 15.44 Automotive service technicians and mechanics................................................................ 649,460 18.05 37,540 16.88 Bus and truck mechanics and diesel engine specialists.................................................... 248,620 19.57 40,710 18.94 Farm equipment mechanics............................................................................................... 30,240 15.79 32,850 15.32 Mobile heavy equipment mechanics, except engines........................................................ 125,930 21.30 44,300 20.59 Rail car repairers................................................................................................................ 20,780 21.59 44,920 21.48 Motorboat mechanics......................................................................................................... 19,640 17.35 36,080 16.60 Motorcycle mechanics....................................................................................................... 16,850 16.10 33,490 15.08 Outdoor power equipment and other small engine mechanics.......................................... 26,440 14.41 29,970 13.91 Bicycle repairers................................................................................................................ 9,690 11.61 24,140 11.15 Recreational vehicle service technicians........................................................................... 13,400 16.05 33,380 15.14 Tire repairers and changers............................................................................................... 98,520 11.46 23,830 10.80
See footnotes at end of table.
Median hourly wages
Table 1. National employment and wage data from the Occupational Employment Statistics survey by occupation, May 2008—Continued
Occupation EmploymentMean wages
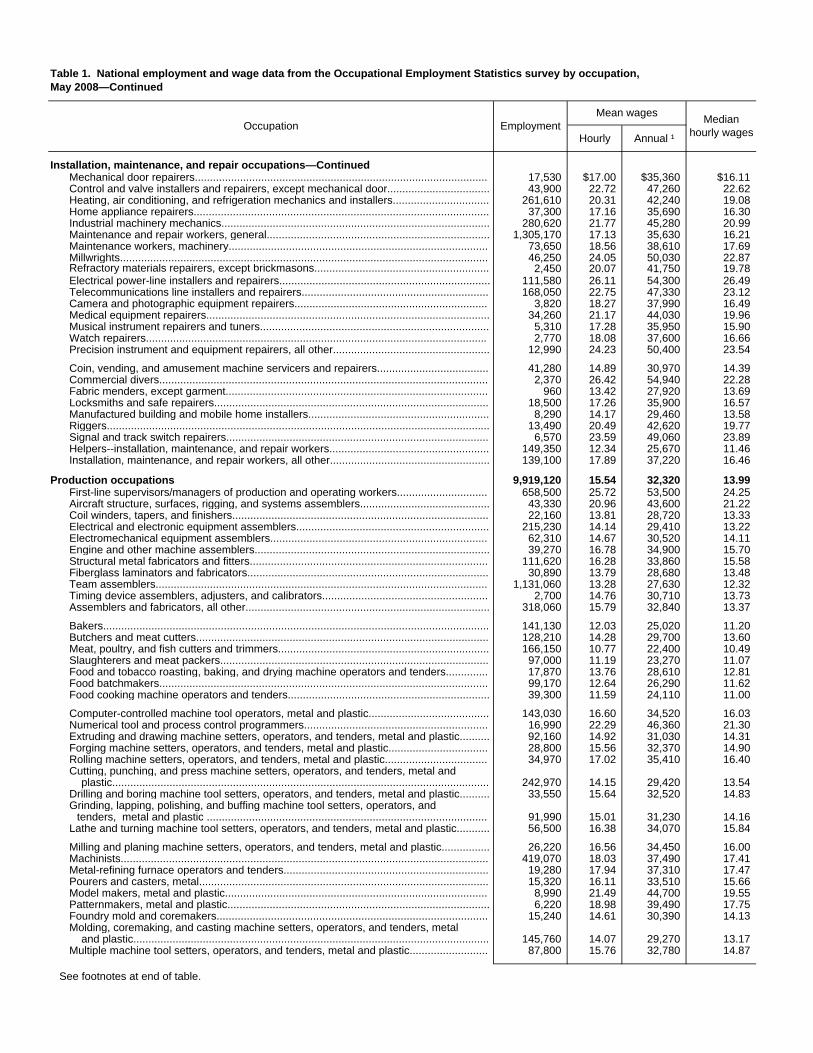
Hourly Annual ¹
Installation, maintenance, and repair occupations—ContinuedMechanical door repairers................................................................................................. 17,530 $17.00 $35,360 $16.11Control and valve installers and repairers, except mechanical door.................................. 43,900 22.72 47,260 22.62 Heating, air conditioning, and refrigeration mechanics and installers................................ 261,610 20.31 42,240 19.08 Home appliance repairers.................................................................................................. 37,300 17.16 35,690 16.30 Industrial machinery mechanics......................................................................................... 280,620 21.77 45,280 20.99 Maintenance and repair workers, general.......................................................................... 1,305,170 17.13 35,630 16.21 Maintenance workers, machinery...................................................................................... 73,650 18.56 38,610 17.69 Millwrights.......................................................................................................................... 46,250 24.05 50,030 22.87 Refractory materials repairers, except brickmasons.......................................................... 2,450 20.07 41,750 19.78 Electrical power-line installers and repairers...................................................................... 111,580 26.11 54,300 26.49 Telecommunications line installers and repairers.............................................................. 168,050 22.75 47,330 23.12 Camera and photographic equipment repairers................................................................ 3,820 18.27 37,990 16.49 Medical equipment repairers.............................................................................................. 34,260 21.17 44,030 19.96 Musical instrument repairers and tuners............................................................................ 5,310 17.28 35,950 15.90 Watch repairers................................................................................................................. 2,770 18.08 37,600 16.66 Precision instrument and equipment repairers, all other.................................................... 12,990 24.23 50,400 23.54
Coin, vending, and amusement machine servicers and repairers..................................... 41,280 14.89 30,970 14.39 Commercial divers............................................................................................................. 2,370 26.42 54,940 22.28 Fabric menders, except garment....................................................................................... 960 13.42 27,920 13.69 Locksmiths and safe repairers........................................................................................... 18,500 17.26 35,900 16.57 Manufactured building and mobile home installers............................................................ 8,290 14.17 29,460 13.58 Riggers............................................................................................................................... 13,490 20.49 42,620 19.77 Signal and track switch repairers....................................................................................... 6,570 23.59 49,060 23.89 Helpers--installation, maintenance, and repair workers..................................................... 149,350 12.34 25,670 11.46 Installation, maintenance, and repair workers, all other..................................................... 139,100 17.89 37,220 16.46
Production occupations 9,919,120 15.54 32,320 13.99 First-line supervisors/managers of production and operating workers.............................. 658,500 25.72 53,500 24.25 Aircraft structure, surfaces, rigging, and systems assemblers........................................... 43,330 20.96 43,600 21.22 Coil winders, tapers, and finishers..................................................................................... 22,160 13.81 28,720 13.33 Electrical and electronic equipment assemblers................................................................ 215,230 14.14 29,410 13.22 Electromechanical equipment assemblers........................................................................ 62,310 14.67 30,520 14.11 Engine and other machine assemblers.............................................................................. 39,270 16.78 34,900 15.70 Structural metal fabricators and fitters............................................................................... 111,620 16.28 33,860 15.58 Fiberglass laminators and fabricators................................................................................ 30,890 13.79 28,680 13.48 Team assemblers.............................................................................................................. 1,131,060 13.28 27,630 12.32 Timing device assemblers, adjusters, and calibrators....................................................... 2,700 14.76 30,710 13.73 Assemblers and fabricators, all other................................................................................. 318,060 15.79 32,840 13.37
Bakers................................................................................................................................ 141,130 12.03 25,020 11.20 Butchers and meat cutters................................................................................................. 128,210 14.28 29,700 13.60 Meat, poultry, and fish cutters and trimmers...................................................................... 166,150 10.77 22,400 10.49 Slaughterers and meat packers......................................................................................... 97,000 11.19 23,270 11.07 Food and tobacco roasting, baking, and drying machine operators and tenders.............. 17,870 13.76 28,610 12.81 Food batchmakers............................................................................................................. 99,170 12.64 26,290 11.62 Food cooking machine operators and tenders................................................................... 39,300 11.59 24,110 11.00
Computer-controlled machine tool operators, metal and plastic........................................ 143,030 16.60 34,520 16.03 Numerical tool and process control programmers............................................................. 16,990 22.29 46,360 21.30 Extruding and drawing machine setters, operators, and tenders, metal and plastic.......... 92,160 14.92 31,030 14.31 Forging machine setters, operators, and tenders, metal and plastic................................. 28,800 15.56 32,370 14.90 Rolling machine setters, operators, and tenders, metal and plastic.................................. 34,970 17.02 35,410 16.40 Cutting, punching, and press machine setters, operators, and tenders, metal and plastic............................................................................................................................. 242,970 14.15 29,420 13.54 Drilling and boring machine tool setters, operators, and tenders, metal and plastic.......... 33,550 15.64 32,520 14.83 Grinding, lapping, polishing, and buffing machine tool setters, operators, and
tenders, metal and plastic ............................................................................................. 91,990 15.01 31,230 14.16 Lathe and turning machine tool setters, operators, and tenders, metal and plastic........... 56,500 16.38 34,070 15.84
Milling and planing machine setters, operators, and tenders, metal and plastic................ 26,220 16.56 34,450 16.00 Machinists.......................................................................................................................... 419,070 18.03 37,490 17.41 Metal-refining furnace operators and tenders.................................................................... 19,280 17.94 37,310 17.47 Pourers and casters, metal................................................................................................ 15,320 16.11 33,510 15.66 Model makers, metal and plastic....................................................................................... 8,990 21.49 44,700 19.55 Patternmakers, metal and plastic....................................................................................... 6,220 18.98 39,490 17.75 Foundry mold and coremakers.......................................................................................... 15,240 14.61 30,390 14.13 Molding, coremaking, and casting machine setters, operators, and tenders, metal and plastic...................................................................................................................... 145,760 14.07 29,270 13.17 Multiple machine tool setters, operators, and tenders, metal and plastic.......................... 87,800 15.76 32,780 14.87
See footnotes at end of table.
Mean wages Median hourly wages
Table 1. National employment and wage data from the Occupational Employment Statistics survey by occupation, May 2008—Continued
Occupation Employment

Hourly Annual ¹
Production occupations—ContinuedTool and die makers.......................................................................................................... 85,610 $23.17 $48,180 $22.32Welders, cutters, solderers, and brazers........................................................................... 392,520 17.01 35,370 16.13 Welding, soldering, and brazing machine setters, operators, and tenders........................ 51,840 16.20 33,700 15.20 Heat treating equipment setters, operators, and tenders, metal and plastic...................... 23,630 15.93 33,140 15.40 Lay-out workers, metal and plastic..................................................................................... 8,340 17.87 37,170 16.79 Plating and coating machine setters, operators, and tenders, metal and plastic............... 40,300 14.46 30,090 13.65 Tool grinders, filers, and sharpeners................................................................................. 16,410 16.29 33,880 15.37 Metal workers and plastic workers, all other...................................................................... 43,690 17.10 35,570 15.61
Bindery workers................................................................................................................. 60,560 13.99 29,100 13.17 Bookbinders....................................................................................................................... 6,150 16.33 33,970 14.92 Job printers........................................................................................................................ 42,640 16.98 35,330 16.21 Prepress technicians and workers..................................................................................... 61,170 17.52 36,440 16.84 Printing machine operators................................................................................................ 193,510 16.42 34,150 15.46
Laundry and dry-cleaning workers..................................................................................... 221,230 9.72 20,230 9.14 Pressers, textile, garment, and related materials............................................................... 67,500 9.55 19,860 9.15 Sewing machine operators................................................................................................. 190,440 10.43 21,690 9.55 Shoe and leather workers and repairers............................................................................ 8,170 11.60 24,130 11.00 Shoe machine operators and tenders................................................................................ 4,910 12.22 25,420 12.06 Sewers, hand..................................................................................................................... 7,050 11.14 23,170 10.58 Tailors, dressmakers, and custom sewers......................................................................... 31,700 12.94 26,920 12.01 Textile bleaching and dyeing machine operators and tenders........................................... 16,180 11.77 24,480 11.38 Textile cutting machine setters, operators, and tenders.................................................... 20,170 11.45 23,810 10.88 Textile knitting and weaving machine setters, operators, and tenders.............................. 30,250 12.33 25,650 12.21 Textile winding, twisting, and drawing out machine setters, operators, and tenders......... 36,540 11.83 24,600 11.53
Extruding and forming machine setters, operators, and tenders, synthetic and glass fibers…………………………………………………………………………….. 14,440 15.29 31,800 14.98
Fabric and apparel patternmakers..................................................................................... 7,500 20.28 42,190 18.15 Upholsterers....................................................................................................................... 39,090 14.69 30,560 13.94 Textile, apparel, and furnishings workers, all other............................................................ 17,430 13.20 27,450 11.85
Cabinetmakers and bench carpenters............................................................................... 120,960 14.72 30,620 13.93 Furniture finishers.............................................................................................................. 21,630 13.66 28,410 12.93 Model makers, wood.......................................................................................................... 1,740 17.16 35,690 15.06 Patternmakers, wood......................................................................................................... 1,930 18.61 38,720 16.35 Sawing machine setters, operators, and tenders, wood.................................................... 51,830 13.01 27,070 12.41 Woodworking machine setters, operators, and tenders, except sawing............................ 88,510 12.44 25,880 11.89 Woodworkers, all other...................................................................................................... 11,260 12.78 26,570 11.57
Nuclear power reactor operators....................................................................................... 4,970 35.34 73,510 35.25 Power distributors and dispatchers.................................................................................... 9,820 31.76 66,070 31.68 Power plant operators........................................................................................................ 34,700 28.05 58,340 28.11 Stationary engineers and boiler operators......................................................................... 39,000 24.36 50,660 23.94 Water and liquid waste treatment plant and system operators.......................................... 110,300 19.21 39,950 18.48 Chemical plant and system operators................................................................................ 44,600 25.07 52,150 25.23 Gas plant operators........................................................................................................... 14,500 26.61 55,350 26.81 Petroleum pump system operators, refinery operators, and gaugers................................ 45,710 26.42 54,950 26.45 Plant and system operators, all other................................................................................ 12,370 23.36 48,590 23.37
Chemical equipment operators and tenders...................................................................... 52,890 21.92 45,580 21.76 Separating, filtering, clarifying, precipitating, and still machine setters,
operators, and tenders…................................................................................................ 41,200 18.27 38,010 17.64 Crushing, grinding, and polishing machine setters, operators, and tenders...................... 41,270 15.08 31,360 14.38 Grinding and polishing workers, hand................................................................................ 40,290 13.03 27,100 12.36 Mixing and blending machine setters, operators, and tenders.......................................... 140,120 15.70 32,650 15.04 Cutters and trimmers, hand............................................................................................... 24,700 12.28 25,540 11.38 Cutting and slicing machine setters, operators, and tenders............................................. 76,500 14.44 30,020 13.85 Extruding, forming, pressing, and compacting machine setters,
operators, and tenders.................................................................................................... 85,130 14.63 30,430 13.92 Furnace, kiln, oven, drier, and kettle operators and tenders.............................................. 22,950 15.84 32,950 15.31 Inspectors, testers, sorters, samplers, and weighers......................................................... 467,010 16.29 33,890 15.02 Jewelers and precious stone and metal workers............................................................... 24,780 17.00 35,360 15.84 Dental laboratory technicians............................................................................................. 42,640 17.78 36,990 16.43 Medical appliance technicians........................................................................................... 12,930 18.58 38,640 16.57 Ophthalmic laboratory technicians..................................................................................... 32,930 14.01 29,130 13.08
Packaging and filling machine operators and tenders....................................................... 357,480 12.76 26,550 11.73 Coating, painting, and spraying machine setters, operators, and tenders......................... 103,310 14.27 29,680 13.66
See footnotes at end of table.
Mean wages Median hourly wages
May 2008—Continued
Occupation Employment
Table 1. National employment and wage data from the Occupational Employment Statistics survey by occupation,

Hourly Annual ¹
Production occupations—ContinuedPainters, transportation equipment.................................................................................... 50,310 $19.37 $40,300 $17.86Painting, coating, and decorating workers......................................................................... 31,200 12.54 26,090 11.57 Photographic process workers........................................................................................... 21,040 14.14 29,410 12.51 Photographic processing machine operators..................................................................... 49,550 10.93 22,740 9.79 Semiconductor processors................................................................................................ 32,230 16.43 34,170 15.49
Cementing and gluing machine operators and tenders..................................................... 19,640 13.96 29,030 13.23 Cleaning, washing, and metal pickling equipment operators and tenders......................... 18,870 12.57 26,140 11.53 Cooling and freezing equipment operators and tenders.................................................... 9,940 13.11 27,260 12.05 Etchers and engravers....................................................................................................... 10,760 14.14 29,400 13.22 Molders, shapers, and casters, except metal and plastic.................................................. 41,900 13.98 29,090 13.40 Paper goods machine setters, operators, and tenders...................................................... 104,170 16.35 34,010 15.91 Tire builders....................................................................................................................... 21,740 18.31 38,080 19.35 Helpers--production workers.............................................................................................. 499,870 11.21 23,320 10.48 Production workers, all other.............................................................................................. 280,160 14.57 30,310 12.86
Transportation and material moving occupations 9,508,750 15.12 31,450 13.14 Aircraft cargo handling supervisors.................................................................................... 4,950 22.43 46,660 19.23 First-line supervisors/managers of helpers, laborers, and material movers, hand............ 186,230 21.33 44,380 20.18 First-line supervisors/managers of transportation and material-moving machine and vehicle operators............................................................................................................ 218,480 25.94 53,960 24.67 Airline pilots, copilots, and flight engineers........................................................................ 77,090 (²) 119,750 (²)Commercial pilots.............................................................................................................. 31,250 (²) 75,500 (²)Air traffic controllers........................................................................................................... 24,260 51.97 108,090 53.78 Airfield operations specialists............................................................................................. 8,050 20.46 42,550 19.88
Ambulance drivers and attendants, except emergency medical technicians..................... 21,790 11.25 23,400 10.77 Bus drivers, transit and intercity......................................................................................... 184,160 17.16 35,700 16.32 Bus drivers, school............................................................................................................. 460,100 13.01 27,060 12.79 Driver/sales workers.......................................................................................................... 372,720 12.52 26,050 10.70 Truck drivers, heavy and tractor-trailer.............................................................................. 1,672,580 18.62 38,720 17.92 Truck drivers, light or delivery services.............................................................................. 908,960 14.55 30,260 13.27 Taxi drivers and chauffeurs................................................................................................ 170,520 11.32 23,540 10.36 Motor vehicle operators, all other....................................................................................... 78,610 14.26 29,650 11.97
Locomotive engineers........................................................................................................ 42,760 25.71 53,470 23.29 Locomotive firers................................................................................................................ 970 25.46 52,950 23.17 Rail yard engineers, dinkey operators, and hostlers.......................................................... 5,480 16.76 34,850 15.68 Railroad brake, signal, and switch operators..................................................................... 24,610 23.75 49,400 22.94 Railroad conductors and yardmasters............................................................................... 39,580 26.02 54,120 25.40 Subway and streetcar operators........................................................................................ 7,430 23.72 49,330 25.59 Rail transportation workers, all other.................................................................................. 4,660 21.25 44,200 21.12
Sailors and marine oilers................................................................................................... 32,420 17.25 35,880 16.53 Captains, mates, and pilots of water vessels..................................................................... 30,600 32.56 67,730 29.79 Motorboat operators........................................................................................................... 3,380 17.54 36,480 15.34 Ship engineers................................................................................................................... 11,190 31.80 66,140 29.18
Bridge and lock tenders..................................................................................................... 4,490 19.20 39,930 19.54 Parking lot attendants........................................................................................................ 136,470 9.67 20,120 9.04 Service station attendants.................................................................................................. 84,480 9.78 20,340 9.11 Traffic technicians.............................................................................................................. 7,030 20.10 41,810 19.00 Transportation inspectors.................................................................................................. 24,940 28.46 59,200 26.56 Transportation workers, all other....................................................................................... 43,330 17.11 35,590 15.87
Conveyor operators and tenders....................................................................................... 41,920 14.46 30,090 13.95 Crane and tower operators................................................................................................ 44,490 21.84 45,430 20.13 Dredge operators............................................................................................................... 1,910 18.77 39,040 16.70 Excavating and loading machine and dragline operators.................................................. 65,160 18.36 38,180 16.93 Loading machine operators, underground mining............................................................. 3,670 21.26 44,230 20.54 Hoist and winch operators.................................................................................................. 2,810 19.87 41,340 17.50 Industrial truck and tractor operators................................................................................. 620,450 14.78 30,750 13.98 Cleaners of vehicles and equipment.................................................................................. 330,850 10.43 21,700 9.35 Laborers and freight, stock, and material movers, hand.................................................... 2,335,510 11.87 24,690 10.89 Machine feeders and offbearers........................................................................................ 144,820 12.92 26,880 12.29 Packers and packagers, hand........................................................................................... 777,630 10.15 21,100 9.16
See footnotes at end of table.
May 2008—Continued
Occupation EmploymentMean wages Median
hourly wages
Table 1. National employment and wage data from the Occupational Employment Statistics survey by occupation,

Hourly Annual ¹
Production occupations—ContinuedGas compressor and gas pumping station operators........................................................ 4,050 21.35 44,410 21.45 Pump operators, except wellhead pumpers....................................................................... 9,280 19.72 41,020 18.81 Wellhead pumpers............................................................................................................. 17,050 18.96 39,430 18.20 Refuse and recyclable material collectors.......................................................................... 129,080 15.76 32,790 14.93 Shuttle car operators.......................................................................................................... 3,050 20.53 42,700 20.29 Tank car, truck, and ship loaders....................................................................................... 12,330 19.00 39,510 18.14 Material moving workers, all other..................................................................................... 41,140 16.68 34,700 15.68
1 Annual wages have been calculated by multiplying the hourly mean wage by a "year-round, full-time" hours figure of 2,080 hours; for those occupations where there is not an hourly mean wage published, the annual wage has been directly calculated from the reported survey data. 2 Wages for some occupations that do not generally work year round, full time, are reported either as hourly wages or annual salaries depending on how they are typically paid. 3 Represents a wage above $80.00 per hour. c = corrected.
Table 1. National employment and wage data from the Occupational Employment Statistics survey by occupation, May 2008—Continued
Occupation EmploymentMean wages Median
hourly wages
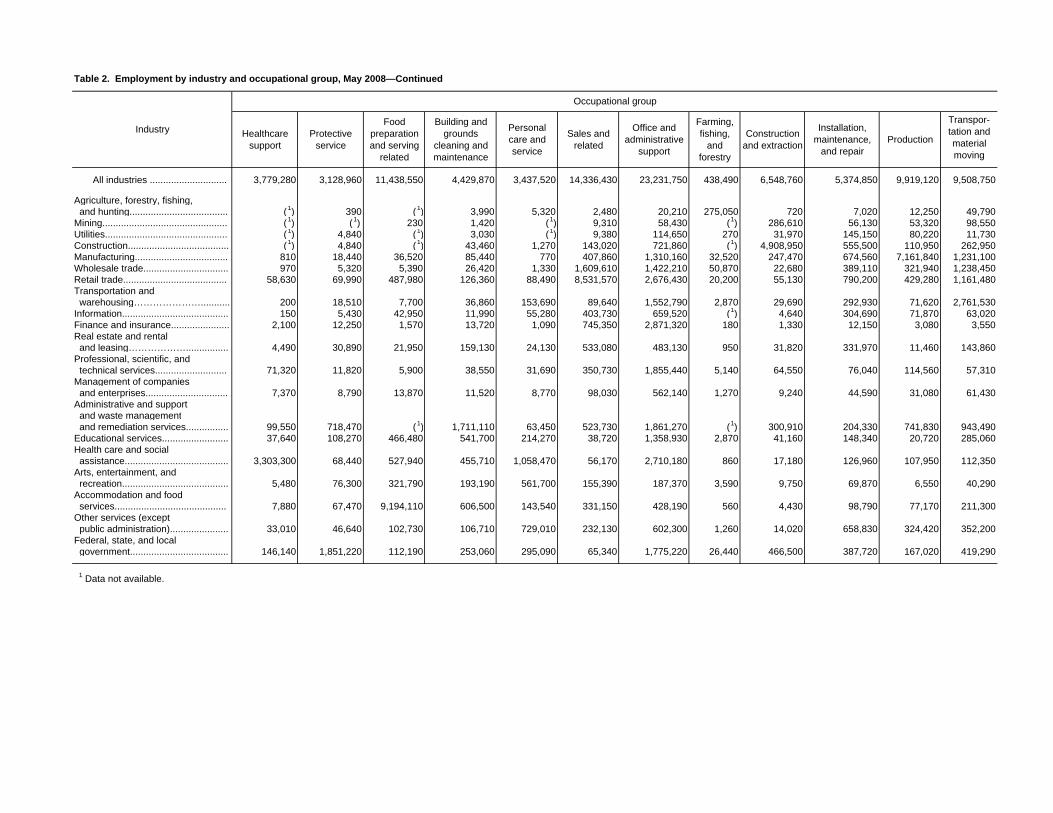
Table 2. Employment by industry and occupational group, May 2008—Continued
All industries ............................. 3,779,280 3,128,960 11,438,550 4,429,870 3,437,520 14,336,430 23,231,750 438,490 6,548,760 5,374,850 9,919,120 9,508,750
Agriculture, forestry, fishing, and hunting..................................... (1) 390 (1) 3,990 5,320 2,480 20,210 275,050 720 7,020 12,250 49,790Mining............................................... (1) (1) 230 1,420 (1) 9,310 58,430 (1) 286,610 56,130 53,320 98,550Utilities.............................................. (1) 4,840 (1) 3,030 (1) 9,380 114,650 270 31,970 145,150 80,220 11,730Construction...................................... (1) 4,840 (1) 43,460 1,270 143,020 721,860 (1) 4,908,950 555,500 110,950 262,950Manufacturing................................... 810 18,440 36,520 85,440 770 407,860 1,310,160 32,520 247,470 674,560 7,161,840 1,231,100Wholesale trade................................ 970 5,320 5,390 26,420 1,330 1,609,610 1,422,210 50,870 22,680 389,110 321,940 1,238,450Retail trade....................................... 58,630 69,990 487,980 126,360 88,490 8,531,570 2,676,430 20,200 55,130 790,200 429,280 1,161,480Transportation and warehousing…………………........... 200 18,510 7,700 36,860 153,690 89,640 1,552,790 2,870 29,690 292,930 71,620 2,761,530Information........................................ 150 5,430 42,950 11,990 55,280 403,730 659,520 (1) 4,640 304,690 71,870 63,020Finance and insurance...................... 2,100 12,250 1,570 13,720 1,090 745,350 2,871,320 180 1,330 12,150 3,080 3,550Real estate and rental and leasing………………................ 4,490 30,890 21,950 159,130 24,130 533,080 483,130 950 31,820 331,970 11,460 143,860Professional, scientific, and technical services........................... 71,320 11,820 5,900 38,550 31,690 350,730 1,855,440 5,140 64,550 76,040 114,560 57,310Management of companies and enterprises............................... 7,370 8,790 13,870 11,520 8,770 98,030 562,140 1,270 9,240 44,590 31,080 61,430Administrative and support and waste management and remediation services................ 99,550 718,470 (1) 1,711,110 63,450 523,730 1,861,270 (1) 300,910 204,330 741,830 943,490Educational services......................... 37,640 108,270 466,480 541,700 214,270 38,720 1,358,930 2,870 41,160 148,340 20,720 285,060Health care and social assistance....................................... 3,303,300 68,440 527,940 455,710 1,058,470 56,170 2,710,180 860 17,180 126,960 107,950 112,350Arts, entertainment, and recreation........................................ 5,480 76,300 321,790 193,190 561,700 155,390 187,370 3,590 9,750 69,870 6,550 40,290Accommodation and food services.......................................... 7,880 67,470 9,194,110 606,500 143,540 331,150 428,190 560 4,430 98,790 77,170 211,300Other services (except public administration)...................... 33,010 46,640 102,730 106,710 729,010 232,130 602,300 1,260 14,020 658,830 324,420 352,200Federal, state, and local government..................................... 146,140 1,851,220 112,190 253,060 295,090 65,340 1,775,220 26,440 466,500 387,720 167,020 419,290
1 Data not available.
Personal care and service
Sales and related
Office and administrative
support
Farming, fishing,
and forestry
Healthcare support
Protective service
Food preparation and serving
related
Building and grounds
cleaning and maintenance
Transpor-tation and material moving
Construction and extraction
Installation, maintenance,
and repair Production
Industry
Occupational group
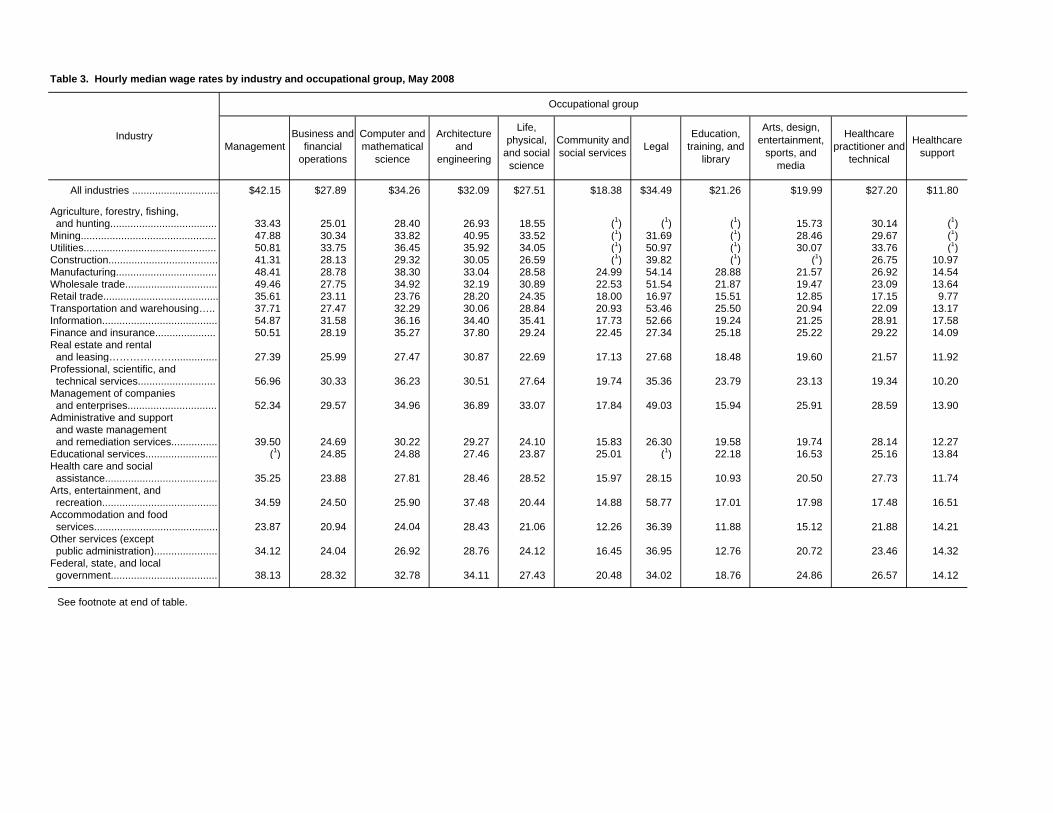
Table 3. Hourly median wage rates by industry and occupational group, May 2008
All industries .............................. $42.15 $27.89 $34.26 $32.09 $27.51 $18.38 $34.49 $21.26 $19.99 $27.20 $11.80
Agriculture, forestry, fishing, and hunting..................................... 33.43 25.01 28.40 26.93 18.55 (1) (1) (1) 15.73 30.14 (1)Mining............................................... 47.88 30.34 33.82 40.95 33.52 (1) 31.69 (1) 28.46 29.67 (1)Utilities.............................................. 50.81 33.75 36.45 35.92 34.05 (1) 50.97 (1) 30.07 33.76 (1)Construction...................................... 41.31 28.13 29.32 30.05 26.59 (1) 39.82 (1) (1) 26.75 10.97Manufacturing................................... 48.41 28.78 38.30 33.04 28.58 24.99 54.14 28.88 21.57 26.92 14.54Wholesale trade................................ 49.46 27.75 34.92 32.19 30.89 22.53 51.54 21.87 19.47 23.09 13.64Retail trade........................................ 35.61 23.11 23.76 28.20 24.35 18.00 16.97 15.51 12.85 17.15 9.77Transportation and warehousing….. 37.71 27.47 32.29 30.06 28.84 20.93 53.46 25.50 20.94 22.09 13.17Information........................................ 54.87 31.58 36.16 34.40 35.41 17.73 52.66 19.24 21.25 28.91 17.58Finance and insurance..................... 50.51 28.19 35.27 37.80 29.24 22.45 27.34 25.18 25.22 29.22 14.09Real estate and rental and leasing………………................ 27.39 25.99 27.47 30.87 22.69 17.13 27.68 18.48 19.60 21.57 11.92Professional, scientific, and technical services........................... 56.96 30.33 36.23 30.51 27.64 19.74 35.36 23.79 23.13 19.34 10.20Management of companies and enterprises............................... 52.34 29.57 34.96 36.89 33.07 17.84 49.03 15.94 25.91 28.59 13.90Administrative and support and waste management and remediation services................ 39.50 24.69 30.22 29.27 24.10 15.83 26.30 19.58 19.74 28.14 12.27Educational services......................... (1) 24.85 24.88 27.46 23.87 25.01 (1) 22.18 16.53 25.16 13.84Health care and social assistance....................................... 35.25 23.88 27.81 28.46 28.52 15.97 28.15 10.93 20.50 27.73 11.74Arts, entertainment, and recreation........................................ 34.59 24.50 25.90 37.48 20.44 14.88 58.77 17.01 17.98 17.48 16.51Accommodation and food services........................................... 23.87 20.94 24.04 28.43 21.06 12.26 36.39 11.88 15.12 21.88 14.21Other services (except public administration)...................... 34.12 24.04 26.92 28.76 24.12 16.45 36.95 12.76 20.72 23.46 14.32Federal, state, and local government..................................... 38.13 28.32 32.78 34.11 27.43 20.48 34.02 18.76 24.86 26.57 14.12
See footnote at end of table.
Arts, design, entertainment,
sports, and media
Healthcare practitioner and
technical
Healthcare supportLegal
Industry
Occupational group
ManagementBusiness and
financial operations
Computer and mathematical
science
Architecture and
engineering
Education, training, and
library
Life, physical,
and social science
Community and social services

Table 3. Hourly median wage rates by industry and occupational group, May 2008—Continued
All industries .............................. 16.65 8.59 10.52 9.82 11.69 14.32 9.34 18.24 18.60 13.99 13.14Agriculture, forestry, fishing, and hunting..................................... 10.49 (1) 10.95 11.37 23.97 12.24 8.95 14.35 14.27 9.65 9.89Mining............................................... (1) 8.76 10.00 (1) 27.65 15.00 (1) 19.08 20.71 19.89 17.39Utilities.............................................. 22.04 (1) 15.16 (1) 22.84 18.29 11.11 25.82 28.06 27.98 21.02Construction...................................... (1) (1) 11.60 10.72 23.93 14.71 (1) 18.16 18.45 16.35 15.56Manufacturing................................... 14.51 9.15 11.37 11.12 25.79 15.58 11.37 18.83 20.61 14.46 13.22Wholesale trade................................ 11.74 8.46 10.95 10.18 24.38 14.44 9.52 17.44 18.60 13.40 13.35Retail trade........................................ 11.61 9.21 9.74 9.02 9.62 10.75 9.67 15.94 15.76 11.97 9.87Transportation and warehousing….. 14.93 10.64 19.26 14.65 24.85 19.57 11.95 21.75 21.97 17.54 16.52Information........................................ 13.75 7.94 11.03 8.15 20.10 15.67 (1) 23.10 26.85 15.69 11.70Finance and insurance..................... 17.95 10.46 10.47 11.75 23.49 14.57 11.39 21.77 17.59 16.06 12.30Real estate and rental and leasing………………................ 12.45 9.19 10.91 11.45 12.91 13.76 11.48 18.14 14.96 13.63 11.13Professional, scientific, and technical services........................... 17.93 8.84 11.15 9.08 24.62 15.49 10.03 21.61 21.26 15.09 12.80Management of companies and enterprises............................... 15.74 10.15 11.29 10.95 24.13 16.17 12.18 21.46 20.63 16.16 13.70Administrative and support and waste management and remediation services................ 10.96 9.25 10.28 9.88 12.69 12.80 9.91 14.67 16.93 10.09 10.23Educational services......................... 13.99 9.98 12.71 10.83 14.03 14.66 (1) 21.15 17.86 18.91 12.56Health care and social assistance....................................... 13.50 9.78 10.15 9.31 14.52 14.12 8.90 22.04 16.66 10.22 10.63Arts, entertainment, and recreation........................................ 10.06 9.07 10.21 9.54 9.41 12.55 11.17 20.88 14.89 14.25 11.05Accommodation and food services........................................... 11.38 8.37 9.09 9.25 8.14 10.81 10.08 20.93 13.33 9.82 7.93Other services (except public administration)...................... 9.62 8.66 10.12 10.52 10.42 12.82 11.66 19.16 16.42 10.54 9.34Federal, state, and local government..................................... 22.31 10.93 13.31 10.49 12.74 16.32 16.34 19.05 21.29 20.76 17.66
1 Data not available.
Production
Transpor-tation and material moving
Office and administrative
support
Industry
Occupational group
Protective service
Food preparation and serving
related
Building and grounds
cleaning and maintenance
Personal care and service
Sales and related
Construction and extraction
Installation, maintenance,
and repair
Farming, fishing,
and forestry

Table 4. National employment and wage data for occupations with wages near the all-occupations median, May 2008
Hourly Annual 2
Total, all occupations …….…........…................….….…...………….…………… 135,185,230 $15.57 $32,390 $20.32
Office and administrative support occupationsBookkeeping, accounting, and auditing clerks.............................................................. 1,855,010 15.63 32,510 16.25Billing and posting clerks and machine operators......................................................... 512,120 14.88 30,950 15.44Insurance claims and policy processing clerks.............................................................. 237,800 15.91 33,100 16.75All other information and record clerks......................................................................... 215,780 16.15 33,600 16.78Loan interviewers and clerks......................................................................................... 212,340 15.61 32,470 16.29Dispatchers, except police, fire, and ambulance........................................................... 193,210 16.28 33,850 17.58Reservation and transportation ticket agents and travel clerks..................................... 163,880 14.94 31,070 15.41Word processors and typists......................................................................................... 128,010 15.09 31,390 15.73Court, municipal, and license clerks............................................................................. 115,070 15.96 33,200 16.88Police, fire, and ambulance dispatchers........................................................................ 96,360 16.19 33,670 16.99Meter readers, utilities................................................................................................... 44,730 15.84 32,950 16.77Telephone operators..................................................................................................... 22,820 15.23 31,670 16.25
Production occupationsInspectors, testers, sorters, samplers, and weighers.................................................... 467,010 15.02 31,240 16.29Welders, cutters, solderers, and brazers....................................................................... 392,520 16.13 33,560 17.01Printing machine operators........................................................................................... 193,510 15.46 32,170 16.42Computer-controlled machine tool operators, metal and plastic................................... 143,030 16.03 33,330 16.60Mixing and blending machine setters, operators, and tenders...................................... 140,120 15.04 31,280 15.70Structural metal fabricators and fitters.......................................................................... 111,620 15.58 32,400 16.28Paper goods machine setters, operators, and tenders................................................. 104,170 15.91 33,080 16.35Multiple machine tool setters, operators, and tenders, metal and plastic..................... 87,800 14.87 30,920 15.76Lathe and turning machine tool setters, operators, and tenders, metal and plastic...... 56,500 15.84 32,940 16.38Welding, soldering, and brazing machine setters, operators, and tenders................... 51,840 15.20 31,610 16.20Metal workers and plastic workers, all other................................................................. 43,690 15.61 32,460 17.10Job printers................................................................................................................... 42,640 16.21 33,710 16.98Engine and other machine assemblers......................................................................... 39,270 15.70 32,660 16.78Drilling and boring machine tool setters, operators, and tenders, metal and plastic..... 33,550 14.83 30,850 15.64Semiconductor processors............................................................................................ 32,230 15.49 32,230 16.43Forging machine setters, operators, and tenders, metal and plastic............................ 28,800 14.90 31,000 15.56Milling and planing machine setters, operators, and tenders, metal and plastic........... 26,220 16.00 33,270 16.56Jewelers and precious stone and metal workers........................................................... 24,780 15.84 32,940 17.00Heat treating equipment setters, operators, and tenders, metal and plastic................. 23,630 15.40 32,030 15.93Furnace, kiln, oven, drier, and kettle operators and tenders......................................... 22,950 15.31 31,840 15.84Tool grinders, filers, and sharpeners............................................................................ 16,410 15.37 31,970 16.29Pourers and casters, metal........................................................................................... 15,320 15.66 32,570 16.11Extruding and forming machine setters, operators, and tenders, synthetic and
glass fibers…………………………………..….…………………………………………… 14,440 14.98 31,160 15.29Bookbinders................................................................................................................... 6,150 14.92 31,040 16.33Patternmakers, wood..................................................................................................... 1,930 16.35 34,010 18.61Model makers, wood..................................................................................................... 1,740 15.06 31,320 17.16
Installation, maintenance, and repair occupationsMaintenance and repair workers, general..................................................................... 1,305,170 16.21 33,710 17.13Electronic home entertainment equipment installers and repairers.............................. 38,680 15.42 32,080 16.26Home appliance repairers............................................................................................. 37,300 16.30 33,910 17.16Farm equipment mechanics.......................................................................................... 30,240 15.32 31,860 15.79Automotive glass installers and repairers...................................................................... 18,330 15.44 32,110 15.95Mechanical door repairers............................................................................................. 17,530 16.11 33,500 17.00Motorcycle mechanics................................................................................................... 16,850 15.08 31,360 16.10Recreational vehicle service technicians....................................................................... 13,400 15.14 31,480 16.05Musical instrument repairers and tuners....................................................................... 5,310 15.90 33,080 17.28
Construction and extraction occupationsPainters, construction and maintenance....................................................................... 250,310 15.85 32,960 17.56Highway maintenance workers..................................................................................... 136,420 16.35 34,000 16.84Roofers......................................................................................................................... 120,200 16.17 33,630 18.00Paving, surfacing, and tamping equipment operators................................................... 61,230 16.00 33,270 17.54Construction and related workers, all other.................................................................. 55,820 15.65 32,550 16.91Pipelayers..................................................................................................................... 54,440 15.72 32,710 17.45Insulation workers, floor, ceiling, and wall.................................................................... 28,390 15.34 31,900 16.79Helpers--extraction workers.......................................................................................... 25,550 15.74 32,730 16.36Septic tank servicers and sewer pipe cleaners............................................................. 24,730 16.19 33,680 17.09Floor sanders and finishers........................................................................................... 8,220 15.41 32,050 16.93
Education, training, and library occupationsTeachers and instructors, all other................................................................................ 574,540 (³) 31,100 (³)
See footnotes at end of table.
Occupation 1 EmploymentMedian wages Mean hourly
wages

Hourly Annual 2
Transportation and material moving occupationsBus drivers, transit and intercity.................................................................................... 184,160 16.32 33,940 17.16Refuse and recyclable material collectors..................................................................... 129,080 14.93 31,050 15.76Transportation workers, all other................................................................................... 43,330 15.87 33,000 17.11Material moving workers, all other................................................................................ 41,140 15.68 32,620 16.68Rail yard engineers, dinkey operators, and hostlers..................................................... 5,480 15.68 32,610 16.76Motorboat operators...................................................................................................... 3,380 15.34 31,910 17.54
Healthcare support occupationsDental assistants........................................................................................................... 293,090 15.57 32,380 15.95Medical transcriptionists................................................................................................ 86,200 15.41 32,060 15.84
Building and grounds cleaning and maintenance occupationsFirst-line supervisors/managers of housekeeping and janitorial workers...................... 183,560 16.34 33,980 17.46
Community and social services occupationsRehabilitation counselors.............................................................................................. 112,700 14.87 30,930 16.64
Healthcare practitioner and technical occupationsOpticians, dispensing.................................................................................................... 59,470 15.77 32,810 16.85
Life, physical, and social science occupationsForest and conservation technicians............................................................................ 30,850 15.39 32,000 16.98Agricultural and food science technicians..................................................................... 18,930 16.34 33,990 17.53
Farming, fishing, and forestry occupationsLogging equipment operators....................................................................................... 27,010 15.18 31,580 15.76Logging workers, all other............................................................................................. 5,180 15.96 33,190 15.82Log graders and scalers................................................................................................ 3,610 15.64 32,520 16.51Farm labor contractors.................................................................................................. 1,110 16.10 33,500 17.62
Arts, design, entertainment, sports, and media occupationsBroadcast technicians................................................................................................... 33,550 15.82 32,900 18.30
Protective service occupationsParking enforcement workers....................................................................................... 9,530 15.57 32,390 16.36Forest fire inspectors and prevention specialists.......................................................... 1,580 15.09 31,380 17.50
1 Occupations shown have wages within plus or minus 5 percent of the all-occupation median. Occupations with employment less than 1,000 are not shown. Major groups are ranked from highest to lowest total employment in occupations paying near the median wage. Within each group, occupations are shown in order of highest to lowest employment. 2 Annual wages have been calculated by multiplying the hourly mean wage by a "year-round, full-time" hours figure of 2,080 hours; for those occupations where there is not an hourly mean wage published, the annual wage has been directly calculated from the reported survey data. 3 Wages for some occupations that do not generally work year round, full time, are reported either as hourly wages or annual salaries depending on how they are typically paid.
Table 4. National employment and wage data for occupations with wages near the all-occupations median, May 2008—Continued
Occupation 1 EmploymentMedian wages Mean hourly
wages
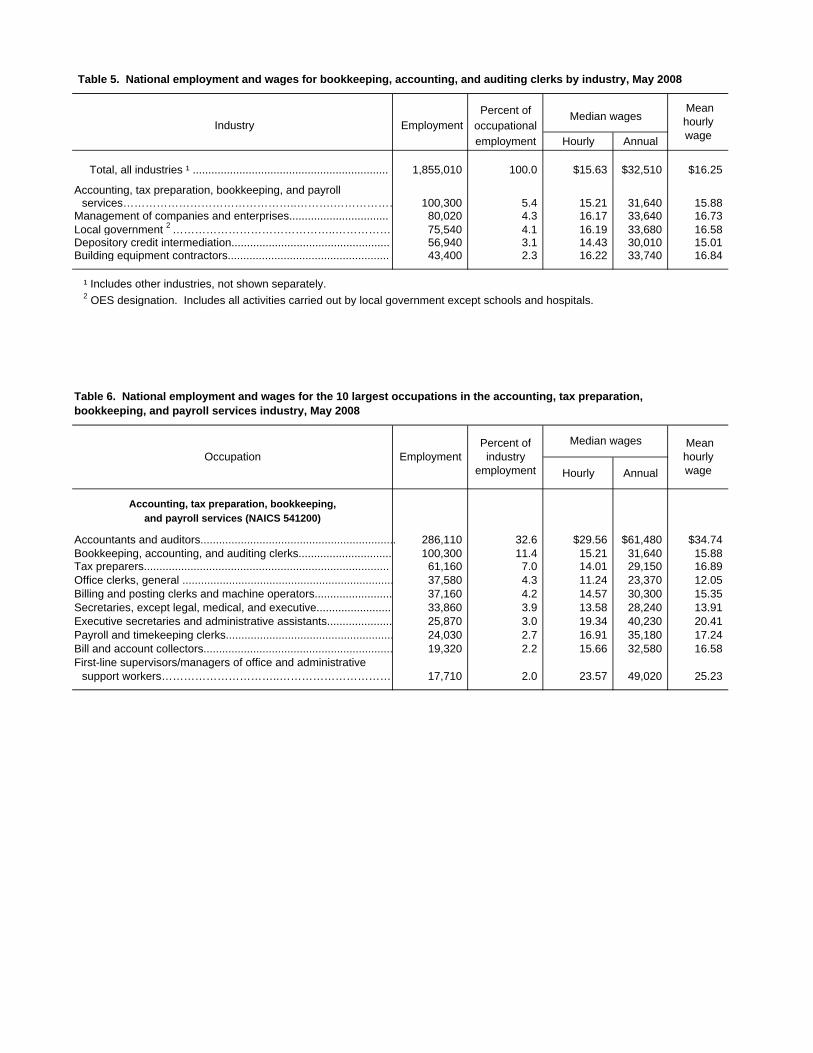
Table 5. National employment and wages for bookkeeping, accounting, and auditing clerks by industry, May 2008
Percent ofoccupationalemployment Hourly Annual
Total, all industries ¹ ................................................................ 1,855,010 100.0 $15.63 $32,510 $16.25
Accounting, tax preparation, bookkeeping, and payrollservices………………………………………..……….……………… 100,300 5.4 15.21 31,640 15.88
Management of companies and enterprises................................ 80,020 4.3 16.17 33,640 16.73Local government 2 ……………………………………..…………… 75,540 4.1 16.19 33,680 16.58Depository credit intermediation................................................... 56,940 3.1 14.43 30,010 15.01Building equipment contractors.................................................... 43,400 2.3 16.22 33,740 16.84
¹ Includes other industries, not shown separately. 2 OES designation. Includes all activities carried out by local government except schools and hospitals.
bookkeeping, and payroll services industry, May 2008
Hourly Annual
Accounting, tax preparation, bookkeeping,and payroll services (NAICS 541200)
Accountants and auditors............................................................... 286,110 32.6 $29.56 $61,480 $34.74Bookkeeping, accounting, and auditing clerks.............................. 100,300 11.4 15.21 31,640 15.88 Tax preparers............................................................................... 61,160 7.0 14.01 29,150 16.89 Office clerks, general .................................................................... 37,580 4.3 11.24 23,370 12.05 Billing and posting clerks and machine operators......................... 37,160 4.2 14.57 30,300 15.35 Secretaries, except legal, medical, and executive........................ 33,860 3.9 13.58 28,240 13.91 Executive secretaries and administrative assistants..................... 25,870 3.0 19.34 40,230 20.41 Payroll and timekeeping clerks...................................................... 24,030 2.7 16.91 35,180 17.24 Bill and account collectors............................................................. 19,320 2.2 15.66 32,580 16.58 First-line supervisors/managers of office and administrative
support workers…………………………..…………………………. 17,710 2.0 23.57 49,020 25.23
Table 6. National employment and wages for the 10 largest occupations in the accounting, tax preparation,
Mean hourly wage
Industry Employment
Occupation Employment
Median wages
Percent of industry
employment
Median wages
Mean hourly wage

Table 7. States with highest employment and highest employment concentration in selected occupations, May 2008
Texas ………………………….………...... 53,530 5.2 $15.82 Wyoming ……………………..…… 2,630 9.3 $21.29California ………………………..………… 28,340 1.9 16.01 Louisiana …………………………… 15,540 8.2 18.38Pennsylvania …………………………….. 16,860 3.0 16.42 Oklahoma …………………..……… 11,560 7.4 14.69Illinois ………...…………………….…….. 16,810 2.8 16.12 North Dakota ……………...……… 2,470 7.0 16.88Louisiana ……………………………….… 15,540 8.2 18.38 South Dakota …………………..… 2,480 6.3 13.83
California ……………………...…………… 33,630 2.2 $17.33 Connecticut ……………………..… 7,030 4.1 $18.75Texas ………..……………………….…… 14,300 1.4 15.34 Nebraska …………………...……… 3,730 4.0 14.66Ohio …………………………….………… 12,540 2.4 15.80 South Dakota …………………..… 1,290 3.3 12.08New York ………………………...………… 12,140 1.4 17.04 Maine………………..……..…….… 1,760 2.9 15.07Pennsylvania …………………………….. 11,860 2.1 15.72 Wisconsin…………………..…….… 7,120 2.6 15.11
California ……………………...…………… 37,000 2.4 $18.76 Nevada ……………………..……… 4,000 3.1 $19.09Florida ………..…………………..………… 20,600 2.6 14.48 Hawaii……………………….……… 1,910 3.1 23.14Texas ……………….………………….…… 18,440 1.8 13.82 Washington……………...………… 8,890 3.1 15.85New York ………………………...………… 14,370 1.7 19.83 Louisiana …………………………… 5,860 3.1 14.87Illinois ……………..………………..….…… 9,890 1.7 20.90 Oregon……………….…………….. 4,800 2.8 14.62
California ……………………...…………… 46,690 3.1 $15.51 Utah..………….…………..………… 4,380 3.6 $12.80Texas ……………………..…………….… 18,960 1.8 14.90 Washington……………...………… 9,310 3.3 17.61New York ………………...………………. 16,210 1.9 15.58 California ……………………...…… 46,690 3.1 15.51Florida …………………………....………… 15,000 1.9 16.00 Idaho…………………...…………… 1,860 2.9 13.96Illinois ………...…………………….…….. 12,370 2.1 15.11 Alaska…………………...…………. 830 2.7 19.97
Hourly median wage
Welders, cutters, solderers, and brazers
1 Represents state employment in selected occupation per 1,000 jobs in state.
Insurance claims and policy processing clerks
Painters, construction and maintenance
Dental assistants
Highest employment Highest employment concentration
State EmploymentHourly median wage
Employment per 1,000
jobs1
Employment per 1,000
jobs1State Employment

Table 8. Metropolitan areas or divisions with highest employment and highest employment concentration in selected occupations, May 2008
Houma-Bayou Cane-Thibodaux,Houston-Sugar Land-Baytown, TX ......... 19,040 7.4 $17.09 LA .................................................. 2,670 28.3 $18.09Los Angeles-Long Beach-Glendale,
CA metropolitan division ...................... 7,740 1.9 14.36 Peoria, IL ......................................... 3,080 16.9 15.44Chicago-Naperville-Joliet, IL
metropolitan division ............................ 7,360 1.9 16.16 Odessa, TX ...................................... 1,010 16.9 16.97Dallas-Plano-Irving, TX
metropolitan division ............................ 5,740 2.7 14.66 Casper, WY ..................................... 640 15.8 18.52Atlanta-Sandy Springs-Marietta, GA ...... 5,150 2.1 15.39 Beaumont-Port Arthur, TX ................ 2,370 14.8 18.63
Los Angeles-Long Beach-Glendale, CA metropolitan division ...................... 9,410 2.3 $15.30 Wausau, WI ...................................... 750 10.8 $14.21
Chicago-Naperville-Joliet, IL metropolitan division ............................ 5,390 1.4 17.85 Macon, GA ....................................... 790 8.0 14.39
New York-White Plains-Wayne, Lewiston-Auburn, ME NY-NJ metropolitan division ................ 5,220 1.0 18.56 metropolitan NECTA ...................... 370 7.6 15.70
Dallas-Plano-Irving, TX Hartford-West Hartford-Eastmetropolitan division ............................ 4,620 2.2 15.97 Hartford, CT metropolitan NECTA 4,250 7.4 18.99
Boston-Cambridge-Quincy, MANECTA division ................................... 4,580 2.7 19.30 Chattanooga, TN-GA ....................... 1,700 7.3 15.00
New York-White Plains-Wayne, NY-NJ metropolitan division ................ 8,400 1.6 $20.31 Naples-Marco Island, FL .................. 1,010 8.1 $14.78
Los Angeles-Long Beach-Glendale, CA metropolitan division ...................... 7,290 1.8 17.45 Beaumont-Port Arthur, TX ................ 1,200 7.5 14.49
Chicago-Naperville-Joliet, IL metropolitan division ............................ 6,330 1.7 21.85 Bremerton-Silverdale, WA ............... 600 7.3 21.77
Houston-Sugar Land-Baytown, TX ......... 5,700 2.2 14.41 Jacksonville, NC ............................... 270 6.4 13.46Phoenix-Mesa-Scottsdale, AZ ................ 5,250 2.8 14.41 Bend, OR .......................................... 410 6.0 14.13
Los Angeles-Long Beach-Glendale, CA metropolitan division ...................... 11,340 2.7 $13.96 Hanford-Corcoran, CA ..................... 180 4.6 $14.23
New York-White Plains-Wayne, NY-NJ metropolitan division ................ 9,510 1.8 15.68 Chico, CA ......................................... 330 4.6 13.10
Chicago-Naperville-Joliet, IL metropolitan division ............................ 8,230 2.2 15.39 Vallejo-Fairfield, CA.......................... 540 4.3 17.00
Santa Ana-Anaheim-Irvine, CA metropolitan division ............................ 5,480 3.6 14.99 Yuba City, CA .................................. 170 4.3 15.10
Houston-Sugar Land-Baytown, TX ......... 4,840 1.9 15.80 Provo-Orem, UT................................ 760 4.2 12.17
1 Represents metropolitan area employment in selected occupation per 1,000 area jobs.
Employment per 1,000
jobs1Employment
Painters, construction and maintenance
Dental assistants
Metropolitan area or division Metropolitan area or division
Highest employment Highest employment concentration
Welders, cutters, solderers, and brazers
Insurance claims and policy processing clerks
Hourly median wage
Employment per 1,000
jobs1Employment
Hourly median wage