united states department of agriculture tree nuts...2013/11/18 · united states department of...
TRANSCRIPT
United States Department of Agriculture Foreign Agricultural Service Circular Series November 2013
U.S. Almond Exports to Rebound
-
100
200
300
400
500
600
700
2011/12 2012/13 2013/14F
1,00
0 M
etric
Ton
s
ForecastOtherChina/Hong KongEuropean Union
China’s Imports Resume Growth Trend
-
20
40
60
80
100
120
140
2008/09 2009/10 2010/11 2011/12 2012/13 2013/14F
1,00
0 M
etric
Ton
s
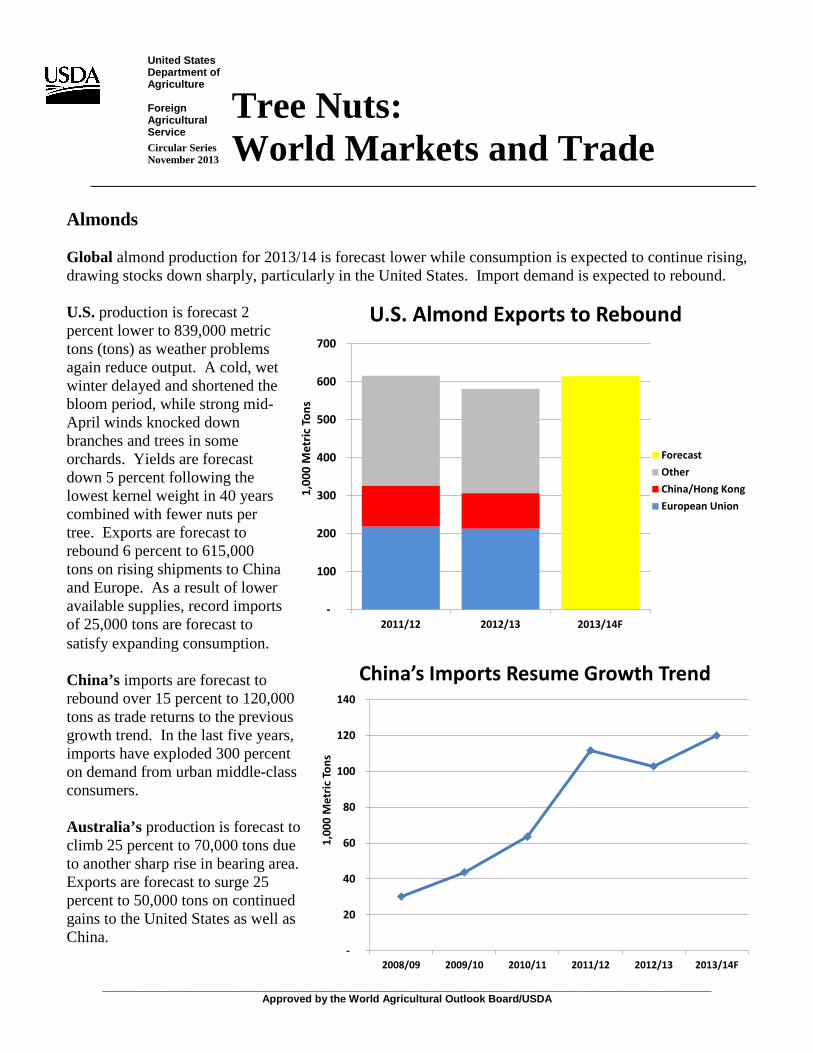
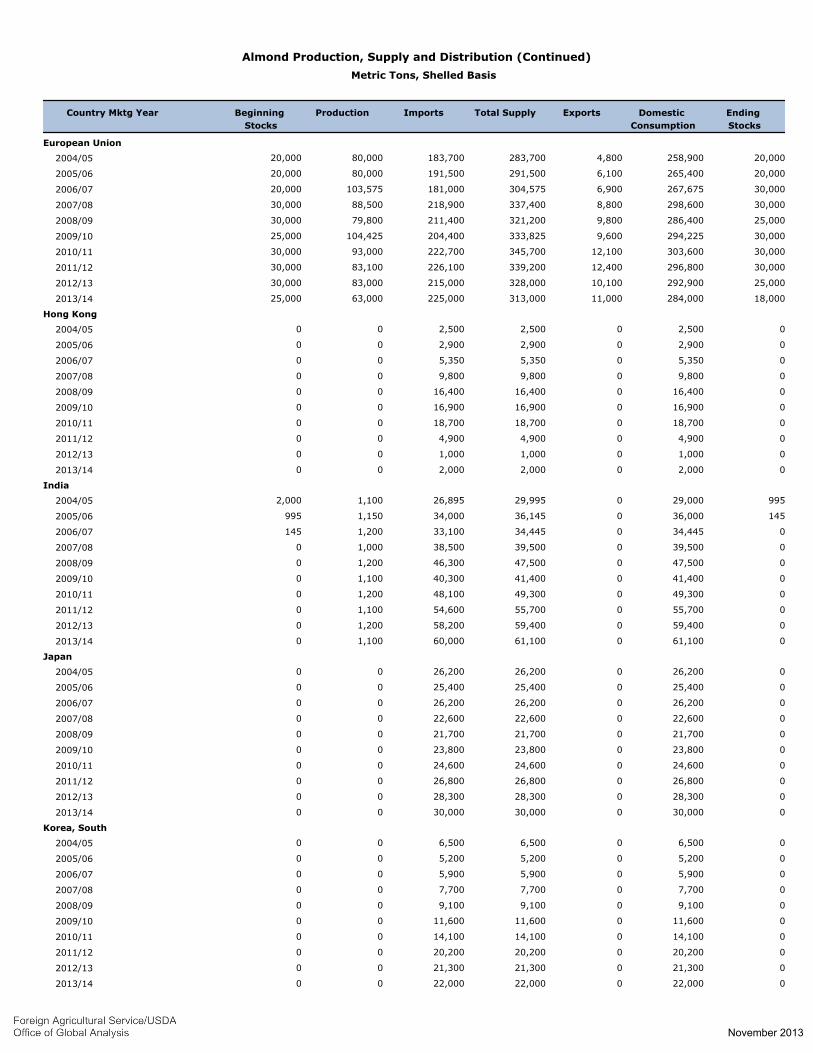
Almonds Global almond production for 2013/14 is forecast lower while consumption is expected to continue rising, drawing stocks down sharply, particularly in the United States. Import demand is expected to rebound. U.S. production is forecast 2 percent lower to 839,000 metric tons (tons) as weather problems again reduce output. A cold, wet winter delayed and shortened the bloom period, while strong mid-April winds knocked down branches and trees in some orchards. Yields are forecast down 5 percent following the lowest kernel weight in 40 years combined with fewer nuts per tree. Exports are forecast to rebound 6 percent to 615,000 tons on rising shipments to China and Europe. As a result of lower available supplies, record imports of 25,000 tons are forecast to satisfy expanding consumption. China’s imports are forecast to rebound over 15 percent to 120,000 tons as trade returns to the previous growth trend. In the last five years, imports have exploded 300 percent on demand from urban middle-class consumers. Australia’s production is forecast to climb 25 percent to 70,000 tons due to another sharp rise in bearing area. Exports are forecast to surge 25 percent to 50,000 tons on continued gains to the United States as well as China.
Tree Nuts: World Markets and Trade
_______________________________________________________________________________________________________ Approved by the World Agricultural Outlook Board/USDA

European Union production is forecast to drop 25 percent to 63,000 tons primarily due to Spain, where frost and heavy rains occurred during the delicate flowering period, though pests and fungus are also expected to lower output. Imports are forecast 5 percent higher to 225,000 tons to partially offset declining production. However, consumption is expected to slip 3 percent to 284,000 tons on reduced demand from the food ingredient, snack food, and confectionary industries. Revised 2012/13 World production is revised down from the previous estimate by 116,000 tons to 1.0 million.
• United States is revised 95,000 tons lower to 857,000 due to decreased yield. World exports are slashed 107,000 tons to 647,000.
• United States is reduced 109,000 tons to 581,000 following lower available exportable supplies. World imports are revised 106,000 tons lower to 585,000.
• China is cut 47,000 tons to 103,000 as importers adjusted to previous year’s record supplies. • United Arab Emirates is reduced 21,000 tons to 39,000. • Turkey is lowered 17,000 tons to 18,000. • United States is raised 13,000 tons to a record 18,000 in response to production shortfall.
November 2013

New Markets Drive U.S. Walnut Exports
-
50
100
150
200
250
300
350
2011/12 2012/13 2013/14F
1,00
0 M
etric
Ton
s
ForecastOther*Select New MarketsEuropean Union
*China, Hong Kong, Korea and Turkey
Walnuts Record global walnut production and trade is forecast. Production continues to expand and is forecast at 1.6 million tons in-shell basis, with China and the United States accounting for 80 percent of total output. World exports, dominated by the United States and Ukraine, are forecast to rise 3 percent to 510,000 tons. China’s production is forecast up 6 percent to 760,000 tons as additional bearing area outweighs lower yields resulting from cool temperatures during the critical flowering period. With exports forecast at just 15,000 tons, the remainder of this massive crop is consumed domestically. After nearly doubling last year, imports are forecast to rise only 6 percent to 150,000 tons as demand from the food ingredient and snack food industries continues to expand. U.S. production is forecast down marginally to 449,000 tons. Although bearing area increased 5 percent and benefited from a longer bloom period, it was offset by a record-low average nut set of 1,239 per tree, down 10 percent from last year. The nut set has trended lower for more than two decades due to changes in pruning practices, production moving to the top of the trees, smaller tree spacing and a shift in tree species. Exports are forecast 5 percent higher to 325,000 tons on continued gains to China and other new markets, with shipments to Europe unchanged. Ukraine’s production is forecast to rebound over 20 percent to 110,000 tons due primarily to higher yields from the alternate bearing crop cycle. With most of production destined for overseas markets, exports are forecast to rise in similar fashion, particularly to the Middle East. European Union production and imports are forecast nearly unchanged at 103,000 tons and 115,000 tons, respectively. Retail demand is driven by its inclusion in snack foods as well as cooking ingredients, while industrial uses center on the pastry and bakery industry. Revised 2012/13 World production is revised up from the previous estimate by 40,000 tons to 1.5 million.
• European Union is revised 44,000 tons higher to 104,000 on newly available data. • United States is raised 24,000 tons to 451,000 due to increased yield. • Ukraine is reduced 35,000 tons to 90,000 on lower bearing area.
November 2013

World exports are revised 7,000 tons lower to 493,000. • United States is raised 25,000 tons to 310,000 on stronger shipments to China. • Ukraine is reduced 32,000 tons to 78,000 following lower available exportable supplies.
World imports are revised 17,000 tons lower to 453,000.
• European Union is reduced 17,000 tons to 114,000 as demand slowed a second consecutive year. • Russia is lowered 13,000 tons to 12,000 as consumption dropped more than 50 percent. • Turkey is reduced 11,000 tons to 39,000 as imports broke from several years of growth. • China is raised 52,000 tons to 142,000 on higher-than-anticipated demand.
For further information, please contact Tony Halstead at 202-720-4620, or email [email protected] For additional production, supply, and demand information, you may visit our website at http://www.fas.usda.gov/psdonline/psdHome.aspx.
November 2013

Almond Summary
Metric Tons, Shelled Basis
2008/09 2009/10 2010/11 2011/12 2012/13
Oct
2013/14
Production none
739,356 United States 639,565 743,891 920,793 857,290 839,146
36,400 Australia 39,100 37,600 49,600 57,000 70,000
79,800 European Union 104,425 93,000 83,100 83,000 63,000
16,000 Turkey 16,000 14,000 16,000 17,000 18,000
8,000 Chile 6,000 9,000 9,100 8,300 9,300
1,600 Other 2,100 3,700 5,100 6,200 7,100
881,156 Total 807,190 901,191 1,083,693 1,028,790 1,006,546
Domestic Consumption none
214,138 United States 216,513 239,216 275,428 302,258 313,137
286,400 European Union 294,225 303,600 296,800 292,900 284,000
30,600 China 44,800 66,000 115,700 107,900 126,000
47,500 India 41,400 49,300 55,700 59,400 61,100
30,200 United Arab Emirates 29,700 39,300 47,300 39,400 42,000
21,700 Japan 23,800 24,600 26,800 28,300 30,000
25,200 Turkey 27,500 26,900 35,900 26,600 30,000
20,100 Canada 19,900 23,900 24,600 25,500 26,000
14,400 Australia 20,100 15,600 20,000 22,000 23,000
9,100 Korea, South 11,600 14,100 20,200 21,300 22,000
51,100 Other 55,200 65,000 55,900 56,300 59,400
750,438 Total 784,738 867,516 974,328 981,858 1,016,637
Ending Stocks none
187,667 United States 145,719 115,194 152,059 143,891 79,900
25,000 European Union 30,000 30,000 30,000 25,000 18,000
500 Australia 1,000 1,000 3,700 1,600 1,100
1,400 Chile 800 400 800 500 500
2,000 Turkey 2,300 300 300 500 500
0 Other 0 0 0 0 0
216,567 Total 179,819 146,894 186,859 171,491 100,000
Exports none
444,300 United States 467,500 538,900 615,700 581,100 615,000
23,000 Australia 19,900 23,300 29,000 40,000 50,000
9,800 European Union 9,600 12,100 12,400 10,100 11,000
8,100 Chile 6,500 9,100 8,300 7,900 8,500
3,800 Turkey 3,700 5,400 7,400 7,800 8,000
0 Other 0 0 0 0 0
489,000 Total 507,200 588,800 672,800 646,900 692,500
Imports none
211,400 European Union 204,400 222,700 226,100 215,000 225,000
30,200 China 43,800 63,500 111,700 102,900 120,000
46,300 India 40,300 48,100 54,600 58,200 60,000
30,200 United Arab Emirates 29,700 39,300 47,300 39,400 42,000
21,700 Japan 23,800 24,600 26,800 28,300 30,000
20,100 Canada 19,900 23,900 24,600 25,500 26,000
1,900 United States 2,500 3,700 7,200 17,900 25,000
9,100 Korea, South 11,600 14,100 20,200 21,300 22,000
9,000 Russia 11,000 15,400 17,700 20,200 20,000
13,200 Turkey 15,500 16,300 27,300 17,600 20,000
41,500 Other 45,500 50,600 39,900 38,300 41,100
434,600 Total 448,000 522,200 603,400 584,600 631,100
Marketing year begins in August of the first year of the split year for the United States and other Northern Hemisphere countries.
Southern hemisphere countries are on a calendar year basis indicated as the second year of the split year.
November 2013

Walnut Summary
Metric Tons, In-shell Basis
2008/09 2009/10 2010/11 2011/12 2012/13
Oct
2013/14
Production none
490,000 China 560,000 580,000 700,000 720,000 760,000
395,533 United States 396,440 457,221 418,212 450,871 449,057
80,000 Ukraine 100,000 80,000 115,000 90,000 110,000
90,000 European Union 87,000 80,000 112,750 104,000 103,000
85,000 Turkey 88,000 85,000 80,000 85,000 75,000
28,000 Chile 36,000 42,000 40,000 53,000 45,000
33,000 India 36,000 30,000 40,000 36,000 40,000
2,300 Other 2,300 2,400 2,500 2,700 3,000
1,203,833 Total 1,305,740 1,356,621 1,508,462 1,541,571 1,585,057
Domestic Consumption none
515,500 China 592,900 634,500 757,900 845,500 895,000
178,100 European Union 170,900 215,700 218,150 211,300 203,000
146,233 United States 174,240 145,321 139,512 153,871 145,657
120,446 Turkey 132,600 127,300 117,500 114,200 107,500
15,300 India 19,000 21,600 19,750 25,500 28,000
22,700 Japan 29,900 30,000 29,500 27,600 28,000
19,900 Korea, South 21,100 22,100 27,800 27,700 28,000
14,600 Canada 17,200 19,800 19,300 20,800 22,000
17,600 Ukraine 18,000 13,500 14,100 12,000 20,000
21,400 Russia 36,900 25,900 26,000 12,100 15,000
79,800 Other 66,300 78,300 74,900 65,000 71,500
1,151,579 Total 1,279,040 1,334,021 1,444,412 1,515,571 1,563,657
Ending Stocks none
52,400 United States 38,300 37,100 44,500 41,600 30,000
30,000 European Union 40,000 35,000 35,000 25,000 20,000
13,600 Turkey 5,000 3,000 5,000 5,000 5,000
3,850 India 1,850 350 5,900 4,400 3,400
1,500 Chile 1,800 1,400 1,100 1,200 800
0 Other 0 0 0 0 0
101,350 Total 86,950 76,850 91,500 77,200 59,200
Exports none
219,600 United States 240,700 313,700 277,500 310,300 325,000
62,400 Ukraine 82,000 66,500 100,900 78,000 90,000
27,400 Chile 32,700 38,900 38,800 50,000 43,000
20,300 European Union 22,600 12,800 18,900 16,200 20,000
8,800 China 11,500 16,000 17,300 16,100 15,000
18,500 Other 26,700 18,900 26,900 22,200 21,500
357,000 Total 416,200 466,800 480,300 492,800 514,500
Imports none
34,300 China 44,400 70,500 75,200 141,600 150,000
108,400 European Union 116,500 143,500 124,300 113,500 115,000
32,200 Turkey 43,200 48,300 51,100 38,800 40,000
22,700 Japan 29,900 30,000 29,500 27,600 28,000
19,900 Korea, South 21,100 22,100 27,800 27,700 28,000
14,600 Canada 17,200 19,800 19,300 20,800 22,000
21,400 Russia 36,900 25,900 26,000 12,100 15,000
10,000 Australia 9,400 9,500 14,900 10,400 11,000
13,400 Israel 7,500 8,500 7,800 9,600 10,000
17,500 Mexico 3,500 10,600 11,900 7,400 10,000
37,000 Other 45,500 45,400 43,100 43,000 46,100
331,400 Total 375,100 434,100 430,900 452,500 475,100
Marketing year begins in September of the first year of the split year for the United States and other Northern Hemisphere countries.
Southern hemisphere countries are on a calendar year basis indicated as the second year of the split year.
November 2013

Almond Production, Supply and Distribution
Metric Tons, Shelled Basis
Country Mktg Year Beginning
Stocks
Production Imports Total Supply Exports Domestic
Consumption
Ending
Stocks
Algeria
800 0800080000 2004/05
1,600 01,60001,60000 2005/06
2,000 02,00002,00000 2006/07
2,300 02,30002,30000 2007/08
7,100 07,10007,10000 2008/09
3,600 03,60003,60000 2009/10
6,500 06,50006,50000 2010/11
7,400 07,40007,40000 2011/12
6,600 06,60006,60000 2012/13
7,000 07,00007,00000 2013/14
Australia
1,900 013,0005,30018,30016,4000 2004/05
2,200 012,0006,20018,20016,0000 2005/06
2,000 50017,10011,30028,90026,9000 2006/07
1,200 50013,10014,10027,70026,000500 2007/08
1,000 50014,40023,00037,90036,400500 2008/09
1,400 1,00020,10019,90041,00039,100500 2009/10
1,300 1,00015,60023,30039,90037,6001,000 2010/11
2,100 3,70020,00029,00052,70049,6001,000 2011/12
2,900 1,60022,00040,00063,60057,0003,700 2012/13
2,500 1,10023,00050,00074,10070,0001,600 2013/14
Canada
20,600 020,600020,60000 2004/05
15,500 015,500015,50000 2005/06
18,300 018,300018,30000 2006/07
21,200 021,200021,20000 2007/08
20,100 020,100020,10000 2008/09
19,900 019,900019,90000 2009/10
23,900 023,900023,90000 2010/11
24,600 024,600024,60000 2011/12
25,500 025,500025,50000 2012/13
26,000 026,000026,00000 2013/14
Chile
1,000 5332,2556,0008,7887,500288 2004/05
1,300 02,1333,9006,0334,200533 2005/06
1,900 1,2002,5005,1008,8006,9000 2006/07
1,700 3,1002,6006,00011,7008,8001,200 2007/08
1,400 1,4003,0008,10012,5008,0003,100 2008/09
2,900 8003,0006,50010,3006,0001,400 2009/10
2,700 4003,0009,10012,5009,000800 2010/11
2,700 8003,1008,30012,2009,100400 2011/12
3,200 5003,9007,90012,3008,300800 2012/13
3,500 5004,3008,50013,3009,300500 2013/14
China
8,000 08,10008,1001000 2004/05
6,000 07,00007,0001,0000 2005/06
17,800 018,000018,0002000 2006/07
14,600 015,900015,9001,3000 2007/08
30,200 030,600030,6004000 2008/09
43,800 044,800044,8001,0000 2009/10
63,500 066,000066,0002,5000 2010/11
111,700 0115,7000115,7004,0000 2011/12
102,900 0107,9000107,9005,0000 2012/13
120,000 0126,0000126,0006,0000 2013/14
November 2013
Almond Production, Supply and Distribution (Continued)
Metric Tons, Shelled Basis
Country Mktg Year Beginning
Stocks
Production Imports Total Supply Exports Domestic
Consumption
Ending
Stocks
European Union
183,700 20,000258,9004,800283,70080,00020,000 2004/05
191,500 20,000265,4006,100291,50080,00020,000 2005/06
181,000 30,000267,6756,900304,575103,57520,000 2006/07
218,900 30,000298,6008,800337,40088,50030,000 2007/08
211,400 25,000286,4009,800321,20079,80030,000 2008/09
204,400 30,000294,2259,600333,825104,42525,000 2009/10
222,700 30,000303,60012,100345,70093,00030,000 2010/11
226,100 30,000296,80012,400339,20083,10030,000 2011/12
215,000 25,000292,90010,100328,00083,00030,000 2012/13
225,000 18,000284,00011,000313,00063,00025,000 2013/14
Hong Kong
2,500 02,50002,50000 2004/05
2,900 02,90002,90000 2005/06
5,350 05,35005,35000 2006/07
9,800 09,80009,80000 2007/08
16,400 016,400016,40000 2008/09
16,900 016,900016,90000 2009/10
18,700 018,700018,70000 2010/11
4,900 04,90004,90000 2011/12
1,000 01,00001,00000 2012/13
2,000 02,00002,00000 2013/14
India
26,895 99529,000029,9951,1002,000 2004/05
34,000 14536,000036,1451,150995 2005/06
33,100 034,445034,4451,200145 2006/07
38,500 039,500039,5001,0000 2007/08
46,300 047,500047,5001,2000 2008/09
40,300 041,400041,4001,1000 2009/10
48,100 049,300049,3001,2000 2010/11
54,600 055,700055,7001,1000 2011/12
58,200 059,400059,4001,2000 2012/13
60,000 061,100061,1001,1000 2013/14
Japan
26,200 026,200026,20000 2004/05
25,400 025,400025,40000 2005/06
26,200 026,200026,20000 2006/07
22,600 022,600022,60000 2007/08
21,700 021,700021,70000 2008/09
23,800 023,800023,80000 2009/10
24,600 024,600024,60000 2010/11
26,800 026,800026,80000 2011/12
28,300 028,300028,30000 2012/13
30,000 030,000030,00000 2013/14
Korea, South
6,500 06,50006,50000 2004/05
5,200 05,20005,20000 2005/06
5,900 05,90005,90000 2006/07
7,700 07,70007,70000 2007/08
9,100 09,10009,10000 2008/09
11,600 011,600011,60000 2009/10
14,100 014,100014,10000 2010/11
20,200 020,200020,20000 2011/12
21,300 021,300021,30000 2012/13
22,000 022,000022,00000 2013/14
November 2013

Almond Production, Supply and Distribution (Continued)
Metric Tons, Shelled Basis
Country Mktg Year Beginning
Stocks
Production Imports Total Supply Exports Domestic
Consumption
Ending
Stocks
Malaysia
1,500 01,50001,50000 2004/05
1,500 01,50001,50000 2005/06
1,500 01,50001,50000 2006/07
1,500 01,50001,50000 2007/08
1,300 01,30001,30000 2008/09
2,100 02,10002,10000 2009/10
2,400 02,40002,40000 2010/11
2,700 02,70002,70000 2011/12
2,400 02,40002,40000 2012/13
2,800 02,80002,80000 2013/14
Mexico
5,600 05,60005,60000 2004/05
4,600 04,60004,60000 2005/06
5,600 05,60005,60000 2006/07
4,600 04,60004,60000 2007/08
5,800 05,80005,80000 2008/09
7,600 07,60007,60000 2009/10
7,500 07,50007,50000 2010/11
7,000 07,00007,00000 2011/12
9,400 09,40009,40000 2012/13
10,000 010,000010,00000 2013/14
Russia
6,400 06,40006,40000 2004/05
6,200 06,20006,20000 2005/06
7,800 07,80007,80000 2006/07
8,000 08,00008,00000 2007/08
9,000 09,00009,00000 2008/09
11,000 011,000011,00000 2009/10
15,400 015,400015,40000 2010/11
17,700 017,700017,70000 2011/12
20,200 020,200020,20000 2012/13
20,000 020,000020,00000 2013/14
Switzerland
3,200 03,20003,20000 2004/05
3,100 03,10003,10000 2005/06
2,800 02,80002,80000 2006/07
2,800 02,80002,80000 2007/08
3,100 03,10003,10000 2008/09
4,300 04,30004,30000 2009/10
4,300 04,30004,30000 2010/11
5,000 05,00005,00000 2011/12
4,800 04,80004,80000 2012/13
5,000 05,00005,00000 2013/14
Taiwan
1,800 01,80001,80000 2004/05
1,600 01,60001,60000 2005/06
2,300 02,30002,30000 2006/07
2,400 02,40002,40000 2007/08
3,100 03,10003,10000 2008/09
3,800 03,80003,80000 2009/10
4,900 04,90004,90000 2010/11
5,200 05,20005,20000 2011/12
5,100 05,10005,10000 2012/13
5,300 05,30005,30000 2013/14
November 2013

Almond Production, Supply and Distribution (Continued)
Metric Tons, Shelled Basis
Country Mktg Year Beginning
Stocks
Production Imports Total Supply Exports Domestic
Consumption
Ending
Stocks
Turkey
800 40012,20080013,40012,300300 2004/05
800 30013,80080014,90013,700400 2005/06
1,000 1,80013,00090015,70014,400300 2006/07
7,400 1,80020,8002,10024,70015,5001,800 2007/08
13,200 2,00025,2003,80031,00016,0001,800 2008/09
15,500 2,30027,5003,70033,50016,0002,000 2009/10
16,300 30026,9005,40032,60014,0002,300 2010/11
27,300 30035,9007,40043,60016,000300 2011/12
17,600 50026,6007,80034,90017,000300 2012/13
20,000 50030,0008,00038,50018,000500 2013/14
United Arab Emirates
14,000 014,000014,00000 2004/05
9,600 09,60009,60000 2005/06
14,900 014,900014,90000 2006/07
19,400 019,400019,40000 2007/08
30,200 030,200030,20000 2008/09
29,700 029,700029,70000 2009/10
39,300 039,300039,30000 2010/11
47,300 047,300047,30000 2011/12
39,400 039,400039,40000 2012/13
42,000 042,000042,00000 2013/14
United States
2,600 62,452140,266323,300526,018455,86067,558 2004/05
4,200 50,903100,386330,400481,689415,03762,452 2005/06
3,700 60,759153,567348,300562,626508,02350,903 2006/07
3,200 104,849185,203404,400694,452630,49360,759 2007/08
1,900 187,667214,138444,300846,105739,356104,849 2008/09
2,500 145,719216,513467,500829,732639,565187,667 2009/10
3,700 115,194239,216538,900893,310743,891145,719 2010/11
7,200 152,059275,428615,7001,043,187920,793115,194 2011/12
17,900 143,891302,258581,1001,027,249857,290152,059 2012/13
25,000 79,900313,137615,0001,008,037839,146143,891 2013/14
World
World
316,095 84,380554,921340,200979,501573,26090,146 2004/05
319,500 71,348516,219347,400934,967531,08784,380 2005/06
335,250 94,259601,037372,5001,067,796661,19871,348 2006/07
390,100 140,249680,303435,4001,255,952771,59394,259 2007/08
434,600 216,567750,438489,0001,456,005881,156140,249 2008/09
448,000 179,819784,738507,2001,471,757807,190216,567 2009/10
522,200 146,894867,516588,8001,603,210901,191179,819 2010/11
603,400 186,859974,328672,8001,833,9871,083,693146,894 2011/12
584,600 171,491981,858646,9001,800,2491,028,790186,859 2012/13
631,100 100,0001,016,637692,5001,809,1371,006,546171,491 2013/14
Marketing year begins in August of the first year of the split year for the United States and other
Northern Hemisphere countries.
Southern hemisphere countries are on a calendar year basis indicated as the second year of the
split year.
November 2013

Walnut Production, Supply and Distribution
Metric Tons, In-shell Basis
Country Mktg Year Beginning
Stocks
Production Imports Total Supply Exports Domestic
Consumption
Ending
Stocks
Australia
8,900 08,90008,90000 2004/05
8,500 08,50008,50000 2005/06
9,266 09,26609,26600 2006/07
7,800 07,80007,80000 2007/08
10,000 010,000010,00000 2008/09
9,400 09,40009,40000 2009/10
9,500 09,50009,50000 2010/11
14,900 014,900014,90000 2011/12
10,400 010,400010,40000 2012/13
11,000 011,000011,00000 2013/14
Brazil
4,100 06,8001,5008,3004,2000 2004/05
5,400 09,9001,40011,3005,9000 2005/06
5,500 010,3001,00011,3005,8000 2006/07
7,900 09,45070010,1502,2500 2007/08
5,500 07,6002007,8002,3000 2008/09
7,800 09,60050010,1002,3000 2009/10
8,500 09,9001,00010,9002,4000 2010/11
8,700 010,60060011,2002,5000 2011/12
8,000 010,10060010,7002,7000 2012/13
9,000 011,0001,00012,0003,0000 2013/14
Canada
16,800 016,800016,80000 2004/05
18,900 018,900018,90000 2005/06
16,300 016,300016,30000 2006/07
16,900 016,900016,90000 2007/08
14,600 014,600014,60000 2008/09
17,200 017,200017,20000 2009/10
19,800 019,800019,80000 2010/11
19,300 019,300019,30000 2011/12
20,800 020,800020,80000 2012/13
22,000 022,000022,00000 2013/14
Chile
600 8211,69113,50016,01215,000412 2004/05
600 2,8002,02114,30019,12117,700821 2005/06
400 3,1002,30020,00025,40022,2002,800 2006/07
0 3,4001,90023,80029,10026,0003,100 2007/08
0 1,5002,50027,40031,40028,0003,400 2008/09
600 1,8003,60032,70038,10036,0001,500 2009/10
100 1,4003,60038,90043,90042,0001,800 2010/11
800 1,1002,30038,80042,20040,0001,400 2011/12
100 1,2003,00050,00054,20053,0001,100 2012/13
100 8002,50043,00046,30045,0001,200 2013/14
China
5,900 0341,90029,000370,900365,0000 2004/05
14,100 0370,10032,000402,100388,0000 2005/06
14,600 0412,90026,700439,600425,0000 2006/07
8,500 0437,30031,200468,500460,0000 2007/08
34,300 0515,5008,800524,300490,0000 2008/09
44,400 0592,90011,500604,400560,0000 2009/10
70,500 0634,50016,000650,500580,0000 2010/11
75,200 0757,90017,300775,200700,0000 2011/12
141,600 0845,50016,100861,600720,0000 2012/13
150,000 0895,00015,000910,000760,0000 2013/14
November 2013

Walnut Production, Supply and Distribution (Continued)
Metric Tons, In-shell Basis
Country Mktg Year Beginning
Stocks
Production Imports Total Supply Exports Domestic
Consumption
Ending
Stocks
European Union
112,500 20,000118,00034,500172,50040,00020,000 2004/05
148,800 30,000165,60018,200213,80045,00020,000 2005/06
111,900 30,000155,10026,800211,90070,00030,000 2006/07
105,400 30,000151,60014,400196,00060,60030,000 2007/08
108,400 30,000178,10020,300228,40090,00030,000 2008/09
116,500 40,000170,90022,600233,50087,00030,000 2009/10
143,500 35,000215,70012,800263,50080,00040,000 2010/11
124,300 35,000218,15018,900272,050112,75035,000 2011/12
113,500 25,000211,30016,200252,500104,00035,000 2012/13
115,000 20,000203,00020,000243,000103,00025,000 2013/14
Hong Kong
600 0600060000 2004/05
700 0700070000 2005/06
400 0400040000 2006/07
400 0400040000 2007/08
500 0500050000 2008/09
5,400 05,40005,40000 2009/10
11,100 011,100011,10000 2010/11
2,700 02,70002,70000 2011/12
4,200 04,20004,20000 2012/13
5,000 05,00005,00000 2013/14
India
0 1,05018,00014,00033,05031,0002,050 2004/05
0 2,45015,00010,60028,05027,0001,050 2005/06
0 2,55015,50012,40030,45028,0002,450 2006/07
0 1,55016,30015,70033,55031,0002,550 2007/08
0 3,85015,30015,40034,55033,0001,550 2008/09
0 1,85019,00019,00039,85036,0003,850 2009/10
0 35021,6009,90031,85030,0001,850 2010/11
0 5,90019,75014,70040,35040,000350 2011/12
0 4,40025,50012,00041,90036,0005,900 2012/13
0 3,40028,00013,00044,40040,0004,400 2013/14
Israel
8,200 08,20008,20000 2004/05
7,700 07,70007,70000 2005/06
8,600 08,60008,60000 2006/07
8,300 08,30008,30000 2007/08
13,400 013,400013,40000 2008/09
7,500 07,50007,50000 2009/10
8,500 08,50008,50000 2010/11
7,800 07,80007,80000 2011/12
9,600 09,60009,60000 2012/13
10,000 010,000010,00000 2013/14
Japan
23,200 023,200023,20000 2004/05
43,000 043,000043,00000 2005/06
27,100 027,100027,10000 2006/07
24,600 024,600024,60000 2007/08
22,700 022,700022,70000 2008/09
29,900 029,900029,90000 2009/10
30,000 030,000030,00000 2010/11
29,500 029,500029,50000 2011/12
27,600 027,600027,60000 2012/13
28,000 028,000028,00000 2013/14
November 2013

Walnut Production, Supply and Distribution (Continued)
Metric Tons, In-shell Basis
Country Mktg Year Beginning
Stocks
Production Imports Total Supply Exports Domestic
Consumption
Ending
Stocks
Korea, South
8,100 08,10008,10000 2004/05
17,300 017,300017,30000 2005/06
13,200 013,200013,20000 2006/07
12,600 012,600012,60000 2007/08
19,900 019,900019,90000 2008/09
21,100 021,100021,10000 2009/10
22,100 022,100022,10000 2010/11
27,800 027,800027,80000 2011/12
27,700 027,700027,70000 2012/13
28,000 028,000028,00000 2013/14
Mexico
4,600 04,60004,60000 2004/05
1,800 01,80001,80000 2005/06
1,900 01,90001,90000 2006/07
4,500 04,50004,50000 2007/08
17,500 017,500017,50000 2008/09
3,500 03,50003,50000 2009/10
10,600 010,600010,60000 2010/11
11,900 011,900011,90000 2011/12
7,400 07,40007,40000 2012/13
10,000 010,000010,00000 2013/14
Moldova
4,400 04,40004,40000 2004/05
6,300 06,30006,30000 2005/06
5,600 05,60005,60000 2006/07
4,700 04,70004,70000 2007/08
3,000 03,00003,00000 2008/09
4,600 04,60004,60000 2009/10
3,200 03,20003,20000 2010/11
3,300 03,30003,30000 2011/12
3,400 03,40003,40000 2012/13
3,500 03,50003,50000 2013/14
Norway
3,600 03,60003,60000 2004/05
4,300 04,30004,30000 2005/06
2,300 02,30002,30000 2006/07
1,600 01,60001,60000 2007/08
1,800 01,80001,80000 2008/09
2,100 02,10002,10000 2009/10
2,400 02,40002,40000 2010/11
2,300 02,30002,30000 2011/12
3,000 03,00003,00000 2012/13
3,500 03,50003,50000 2013/14
Russia
500 0500050000 2004/05
1,000 01,00001,00000 2005/06
3,800 03,80003,80000 2006/07
10,700 010,700010,70000 2007/08
21,400 021,400021,40000 2008/09
36,900 036,900036,90000 2009/10
25,900 025,900025,90000 2010/11
26,000 026,000026,00000 2011/12
12,100 012,100012,10000 2012/13
15,000 015,000015,00000 2013/14
November 2013

Walnut Production, Supply and Distribution (Continued)
Metric Tons, In-shell Basis
Country Mktg Year Beginning
Stocks
Production Imports Total Supply Exports Domestic
Consumption
Ending
Stocks
Switzerland
4,600 04,60004,60000 2004/05
6,000 06,00006,00000 2005/06
4,900 04,90004,90000 2006/07
4,500 04,50004,50000 2007/08
4,100 04,10004,10000 2008/09
4,300 04,30004,30000 2009/10
5,000 05,00005,00000 2010/11
5,300 05,30005,30000 2011/12
5,200 05,20005,20000 2012/13
5,000 05,00005,00000 2013/14
Syria
5,000 05,00005,00000 2004/05
5,800 05,80005,80000 2005/06
5,600 05,60005,60000 2006/07
8,060 08,06008,06000 2007/08
15,700 015,700015,70000 2008/09
11,600 011,600011,60000 2009/10
8,000 08,00008,00000 2010/11
7,800 07,80007,80000 2011/12
1,500 01,50001,50000 2012/13
2,000 02,00002,00000 2013/14
Taiwan
3,000 03,00003,00000 2004/05
3,600 03,60003,60000 2005/06
3,300 03,30003,30000 2006/07
2,300 02,30002,30000 2007/08
3,700 03,70003,70000 2008/09
4,700 04,70004,70000 2009/10
6,500 06,50006,50000 2010/11
6,000 06,00006,00000 2011/12
7,200 07,20007,20000 2012/13
8,000 08,00008,00000 2013/14
Turkey
23,000 5,00075,80070081,50050,0008,500 2004/05
19,900 5,00092,30060097,90073,0005,000 2005/06
14,700 18,00075,80090094,70075,0005,000 2006/07
23,800 19,746108,7543,300131,80090,00018,000 2007/08
32,200 13,600120,4462,900136,94685,00019,746 2008/09
43,200 5,000132,6007,200144,80088,00013,600 2009/10
48,300 3,000127,3008,000138,30085,0005,000 2010/11
51,100 5,000117,50011,600134,10080,0003,000 2011/12
38,800 5,000114,2009,600128,80085,0005,000 2012/13
40,000 5,000107,5007,500120,00075,0005,000 2013/14
Ukraine
0 019,30030,70050,00050,0000 2004/05
0 016,00044,00060,00060,0000 2005/06
0 013,30016,70030,00030,0000 2006/07
0 015,70054,30070,00070,0000 2007/08
0 017,60062,40080,00080,0000 2008/09
0 018,00082,000100,000100,0000 2009/10
0 013,50066,50080,00080,0000 2010/11
0 014,100100,900115,000115,0000 2011/12
0 012,00078,00090,00090,0000 2012/13
0 020,00090,000110,000110,0000 2013/14
November 2013

Walnut Production, Supply and Distribution (Continued)
Metric Tons, In-shell Basis
Country Mktg Year Beginning
Stocks
Production Imports Total Supply Exports Domestic
Consumption
Ending
Stocks
United States
800 55,600162,500144,000362,100294,80066,500 2004/05
1,400 40,300129,500209,300379,100322,10055,600 2005/06
2,900 19,900171,900165,300357,100313,90040,300 2006/07
11,300 20,000155,300153,500328,800297,60019,900 2007/08
2,700 52,400146,233219,600418,233395,53320,000 2008/09
4,400 38,300174,240240,700453,240396,44052,400 2009/10
600 37,100145,321313,700496,121457,22138,300 2010/11
6,200 44,500139,512277,500461,512418,21237,100 2011/12
10,400 41,600153,871310,300505,771450,87144,500 2012/13
10,000 30,000145,657325,000500,657449,05741,600 2013/14
World
World
238,400 82,471835,491267,9001,185,862850,00097,462 2004/05
315,100 80,550925,321330,4001,336,271938,70082,471 2005/06
252,266 73,550959,366269,8001,302,716969,90080,550 2006/07
263,860 74,6961,003,264296,9001,374,8601,037,45073,550 2007/08
331,400 101,3501,151,579357,0001,609,9291,203,83374,696 2008/09
375,100 86,9501,279,040416,2001,782,1901,305,740101,350 2009/10
434,100 76,8501,334,021466,8001,877,6711,356,62186,950 2010/11
430,900 91,5001,444,412480,3002,016,2121,508,46276,850 2011/12
452,500 77,2001,515,571492,8002,085,5711,541,57191,500 2012/13
475,100 59,2001,563,657514,5002,137,3571,585,05777,200 2013/14
Marketing year begins in September of the first year of the split year for the United States and
other Northern Hemisphere countries.
Southern hemisphere countries are on a calendar year basis indicated as the second year of the
split year.
November 2013