united nations scientific committee 1977 to the … report to the general assembly, with annexes ....
TRANSCRIPT
-d
United Nations Scientific Committee on the Effects of Atomic Radiation
1977 report to the General Assembly, with annexes
NOTE
The report of the Committee without its annexes appears as Official Records of the General Assembly, Thirty-second Session, Supplement No. 40 (A/32/40).
In the text of each annex, Arabic numbers in parentheses are references listed at the end.
The designations employed and the presentation of material in this publication do not imply the expression of any opinion whatsoever on the part of the Secretariat of the United Nations concerning the legal status of any country, territory, city or area, or of its authorities, or concerning the delimitation of its frontiers or boundaries.
UNITED NATIONS PUBLICATION Sales No. E.77.IX.1 Price: $U.S. 28.00
(or equivalent in other currencies)
Produced by UNIDO, Vienna

ANNEXC
Radioactive contamination due to nuclear explosions
CONTENTS
INTRODUCTION .................. .
I. TRANSPORT OF RADIOACTIVE DEBRIS WITHIN THE ATMOSPHERE •.......
II. INTERNAL IRRADIATION ........ .
A. Tritium ..........•.•..... 1. Tritium inventory •........ 2. Dose commitment from tritium
B. Carbon-14 ................ . C. Manganese-54 .............. . D. lron·SS .................. . E. Krypton.SS ............... . F. Strontium-90 ........•......
1. Inventory and deposition ..... 2. Strontium-90 in the environment 3. Levels in food . . . . . . . . . . . . 4. Transfer of • 0 Sr from fallout to
diet ............•... , . 5. Strontium-90 levels in bone ... . 6. Transfer from diet to bone ... . 7. Transfer factor relating bone acti·
vity level and dose ........ . 8. Dose commitment from stron·
tium-90 .............. . G. Strontium-89 .............. . H. Ruthenium-106 ............. .
illtroduction
Paragraphs
1·3
4-14
15-142
15-27 16-17 18-27 28-36 37-38 3940 41-42 43-87 43-47 48-51 52-54
55-69 70
71-77
78-79
80-83 84-87 88-91
1. During the period reviewed in this report (January 1972 to December 1976) a number of nuclear tests have been reported, including 20 atmospheric tests. 6 of which were in the northern hemisphere and 14 in the southern hemisphere. In this Annex, therefore. the total inventory of radionuclides from nuclear tests has been
I. Iodine-131 ............... . J. Caesium-137 •...•..........
1. Caesium-137 in the environment 2. Levels in diet ........... . 3. Caesium-137 in the human body 4. Dose commitment from
caesium-137 ............ . K. Caesium-136 .............. . L Barium-140 ............... . :0.1. Cerium-144 ..........•..... N. Plutonium ...•.............
1. Plutonium in the environment •. 2. Levels in the environment ..... 3. Pathways to man and dose com
mitments
III. EXTERNAL IRRADIATION ........ . A. Short-lived radionuclides ..•..•.. B. Caesium-137 .............. . C. Total dose commitment from external
irradiation . . . . . . . . . . . . . . . . .
IV. SUMMARY OF DOSE COMMITMENTS FROM NUCLEAR EXPLOSIONS ..... .
References ••.•.••••••••••••••.••.
Paragraphs
92-96 97-116 98-101
I 02-106 107-110
111-116 117 118
119-122 123-142 123·126 127-130
131-142
143-158 147-156
157
158
159-165
Page
155
reassessed and the consequential changes in the dose commitments have been evaluated.
2. This Annex also discusses improvements in the knowledge of the parameters involved in the assessment of dose commitments, particularly those factors related to the transfer of radioactivity between compartments
115

of the environment linking the input of tadionuclides to the subsequent dose in man. The compartment model
used by the Committee in its assessments can be represented schematically as follows:
Inhalation
Input (0)
-+ Atmosphere -+ Earth's surface -+ Diet -+ Tissue - Dose (1) (2) (3) (4) (5)
I
This model does not include all possible pathways of human exposure, but only those relevant to the assessments presented in this Annex. Procedures for the use of the model are described in Annex A.
3. Where sufficient information is available. assessments of collective dose commitments per unit activity release are presented. It should be noted that the bulk of the radionuclides from atmospheric nuclear explosions was injected into the atmosphere at high altitude. For this reason many of these commitments per unit activity do not apply to other situations of environmental releases of radioactive materials.
I. TRANSPORT OF RADIOACTIVE DEBRIS WITHIN THE ATMOSPHERE
4. During a nuclear explosion, the fission products, residual fissile material and structural materials associated with the device are raised to sufficiently high temperatures to be present in gaseous form. For explosions detonated in the atmosphere near the surface of the earth. a considerable amount of volatilized soil or rock material may also be entrained in the fireball.
5. After the explosion in the atmosphere, the fireball expands rapidly and rises due to buoyancy. As it rises, cooling causes the volatilized debris to condense, forming an aerosol with a wide distribution in particle size (245).
6. The height to which the aerosol cloud rises increases with explosion yield. Since the height of the tropopause is lower in polar regions than near the equator, the extent to which the cloud enters the stratosphere wHI depend on both latitude and yield (201).
7. During the initial expansion of the fireball, some tens of seconds after detonation, particles composed of iron and aluminium oxides and of other refractory materials are formed, with diameters in the range 0.4-4.0 µm (81, 223). The radionuclides having the more refractory oxides (i.e., oxides with high boiling points), tend to be incorporated into these particles. while those that have low boiling point oxides tend to be excluded. When the refractory material has condensed out, the gaseous remainder. enriched in the more volatile radionuclides and in radionuclides with volatile precursors, condenses into small particles (diameter< 0.4 µm).
116
External irradiation j
This separation of the radionuclides between aerosol particles in the two size ranges is usually known as fractionation. Because the larger aerosol particles are subjected to significant gravitational settling, they are more likely to be deposited upon the earth near the explosion site, whereas the smaller aerosol particles remain at greater altitudes for a longer time and are distributed over a wider area (95).
8. When nuclear explosions are detonated on or near the ground, large amounts of soil .)r' rock materials are drawn into the fireball. On cooling, these tend to form large aerosol particles; so for surface detonations much of the radioactive material is present in relatively large aerosol particles.
9. Radioactivity present in large aerosol particles will fall out within a few hundred kilometres, constituting the "local fallout"; smaller aerosol particles injected into the lower troposphere can be transported around the earth in the same hemisphere. and will be deposited from hundreds to many thousands of kilometres from the detonation site. constituting the "tropospheric fallout". Aerosol particles carried up into the stratosphere give rise to fallout with a world-wide distribution. the major part of which is in the hemisphere of injection. This fallout is known as global or '·stratospheric" fallout.
10. Most of the world-wide contamination of longlived fission products has been from the stratospheric fallout resulting from large thermonuclear tests. On the other hand. tropospheric fallout accounts for much of the contamination from short-lived radionuclides, during the first few months after a test.
11. Our knowledge of mixing processes and air movements in the stratosphere is still incomplete, although many of the gross features are now known from studies of radionuclide concentrations. Detailed descriptions of the atmospheric movement of radionuclides were given in the Committee ·s 1964 and 1972 reports (242. 245). Mixing processes in the stratosphere are generally slower than in the troposphere. most of the movement being due to horizontal diffusion with considerable downward motion at higher latitudes in the winter hemisphere (153).
12. Several mechanisms account for the transfer of particulate radioactivity from the stratosphere to the troposphere. Prominent among these is the horizontal transfer through the subtropical tropopause gap. This
---transfer process reaches a maximum in late winter and gives rise to the well known spring maximum in the fallout rate (141).
13. The mean residence time of a radionuclide in the stratosphere, defined as the average time spent by atoms of that radionuclide in the stratosphere before transfer to the troposphere, depends on the latitude and altitude of injection and also on the time of the year at which the injection is made. Between 15 and 25 km altitude, the mean residence time can vary from 0.3 to 2 y, depending upon altitude and latitude (212). For 9 0 Sr, the mean residence time in the stratosphere is typically of the order of 1 y (242). The long effective mean residence time in the stratosphere observed for some radionuclides such as 14 C is due to the fact that these radionuclides are not removed rapidly from the troposphere and are recycled back into the stratosphere (211).
14. After the radioactive debris has entered the troposphere, it is rapidly dispersed throughout the hemisphere. For particulate radioactivity, the troposphere is rapidly depleted by essentially three processes: (a) rain-out caused by droplet formation within clouds, (b) wash-out by falling raindrops picking up radioactivity, and (c) dry deposition on land surfaces or plant cover, this last process being of more importance in dry regions (85, 140). The resulting residence time for particulate radioactivity in the troposphere is about 30 d (98, 154, 176). Because of this rapid removal, very little particulate activity moves from the troposphere of one hemisphere to the troposphere of the other. On the other hand, gaseous radionuclides in the troposphere, such as 85 Kr, mix between hemispheres with a mean exchange time of 1.5 y (242).
II. INTERNAL IRRADIATION
A. TRITIUM
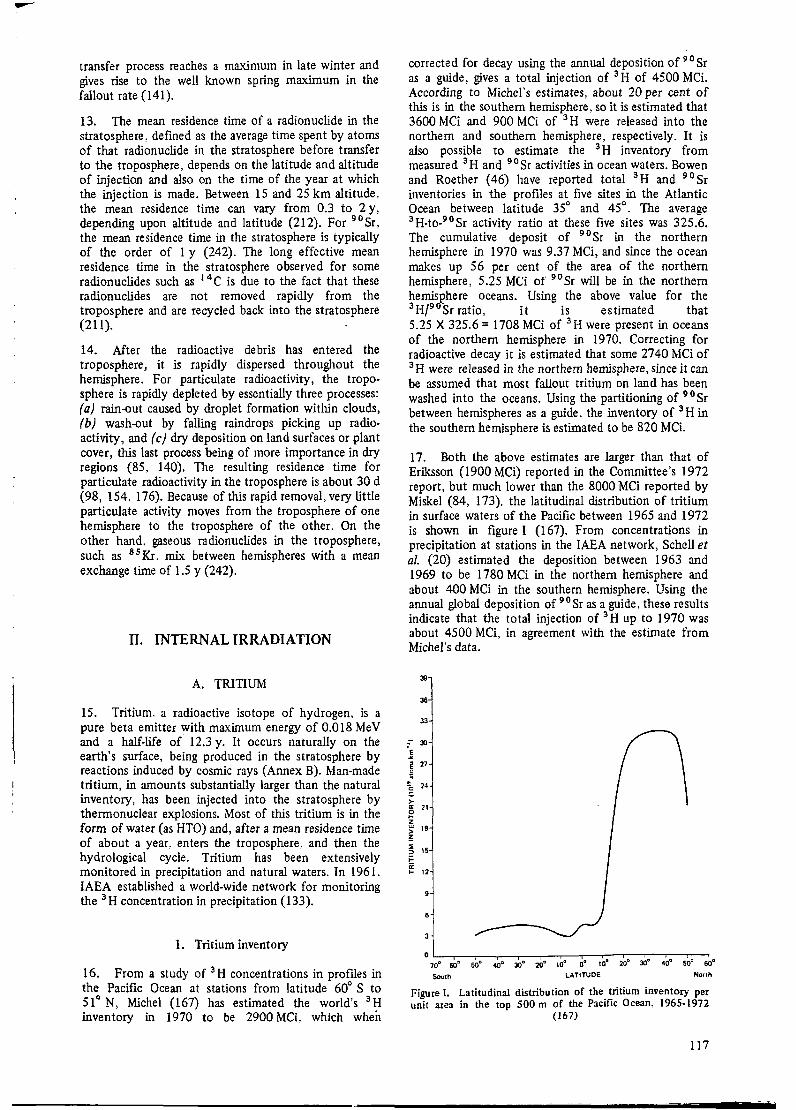
15. Tritium. a radioactive isotope of hydrogen, is a pure beta emitter with maximum energy of 0.018 MeV and a half.life of 12.3 y. It occurs naturally on the earth's surface, being produced in the stratosphere by reactions induced by cosmic rays (Annex B). Man-made tritium, in amounts substantially larger than the natural inventory, has been injected into the stratosphere by thermonuclear explosions. Most of this tritium is in the form of water (as HTO) and, after a mean residence time of about a year. enters the troposphere, and then the hydrological cycle. Tritium has been extensively monitored in precipitation and natural waters. In 1961, IAEA established a world-wide network for monitoring the 3 H concentration in precipitation ( 133).
1. Tritium inventory
16. From a study of 3 H concentrations in profiles in the Pacific Ocean at stations from latitude 60° S to 51° N, Michel (167) has estimated the world's 3 H inventory in 1970 to be 2900 MCL which when
corrected for decay using the annual deposition of 9 0 Sr as a guide, gives a total injection of 3 H of 4500 MCi. According to Michel's estimates, about 20 per cent of this is in the southern hemisphere, so it is estimated that 3600 MCi and 900 MCi of 3 H were released into the northern and southern hemisphere, respectively. It is also possible to estimate the 3 H inventory from measured 3 H and 90 Sr activities in ocean waters. Bowen and Roether ( 46) have reported total 3 H and 9 0 Sr inventories in the profiles at five sites in the Atlantic Ocean between latitude 35° and 45°. The average 3 H-to-9 0 Sr activity ratio at these five sites was 325.6. The cumulative deposit of 90 Sr in the northern hemisphere in 1970 was 9.37 MCi, and since the ocean makes up 56 per cent of the area of the northern hemisphere, 5.25 MCi of 90 Sr will be in the northern hemisJ:?here oceans. Using the above value for the 3 H/9°Sr ratio, it is estimated that 5.25 X 325.6 = 1708 MCi of 3 H were present in oceans of the northern hemisphere in 1970. Correcting for radioactive decay it is estimated that some 2740 MCi of 3 H were released in the northern hemisphere, since it can be assumed that most fallout tritium on land has been washed into the oceans. Using the partitioning of 9 0 Sr between hemispheres as a guide, the inventory of 3 H in the southern hemisphere is estimated to be 820 MCL
17. Both the above estimates are larger than that of Eriksson (1900 MCi) reported in the Committee's 1972 report, but much lower than the 8000 MCi reported by Miske! (84, 173). the latitudinal distribution of tritium in surface waters of the Pacific between 1965 and 1972 is shown in figure I (167). From concentrations in precipitation at stations in the IAEA network, Schell et al. (20) estimated the deposition between 1963 and 1969 to be 1780 MCi in the northern hemisphere and about 400 MCi in the southern hemisphere. Using the annual global deposition of 90 Sr as a guide, these results indicate that the total injection of 3 H up to 1970 was about 4500 MCi, in agreement with the estimate from Michel's data.
33
> ~ 21
~ > 18 :!: ~ 15 ;: ii: .. 12
9
O ' ' 30' 0 10° eo:, 50° 40° 30° 20~ 10° 0° to:. 20°
South LATITUDE
40° 501:1 f!IJ0
North
Figure I. Latitudinal distribution of the tritium inventory per unit area in the top 500 m of the Pacific Ocean, 1965-1972
{167)
117

2. Dose commitment from tritium
18. In the 1972 report, the dose commitments from fallout tritium were estimated in an indirect way on i:he basis of a comparison with the production rate of natural tritium and the measured concentrations in waters prior to the commencement of thermonuclear tests. More recent papers dealing with fallout tritium make it possible to estimate the dose commitments directly from fallout measurements. It should be realized that, due to insufficient information relating to some of the quantities involved in the calculations, estimates by both methods are uncertain.
19. Bennett (25, 37) used a three-compartment model suggested by Sanders and Reinig (219) to determine the
10000
' : J
1000
-u ,e z 0 j:: <
r..l'\l\ _;·-· ! \i rJ\}J . a:
I-z w u z 0 u
100
1---········~
i f
I j
tissue dose rate at equilibrium for a continuous intake of tritium in water. This model considers the dose rate in tissue due to tritium in tissue water as well as that which is organically bound in tissue. For a chronic intake of water with a concentration of l µCi 1-1 , the tissue dose rate at equilibrium is 95 mrad y-1 • Of this, 84 per cent is due to tritium in water and 16 per cent to tritium combined in tissue.
20. The tritium activity concentration of surface waters in the United States of America is shown in figure II. From the tritium concentrations in 18 United States rivers and in the Ottawa river, Bennett (25. 37) estimated the whole body dose commitments to the populations of the United States and the Ottawa Valiey to be 1.5 and 2.8 mrad, respectively.
10 '----,--..----,--,--,---,---r--.------,---r--,.-----r--r----r--,---r-----r--,--..------,---r--,.------r--r---i 1951 52 53 54 55 56 57 58 59 60 61 62 63 64 65 66 67 68 69 70 71 72 73 74 75
Figure 11. Variation of tritium activity concentration of surface waters in the United States of America over the period 1951-1975 (25, 27)
21. Schell et al. (220) have evaluated the 1961 to 1967 data provided by the IAEA and WMO world survey of tritium concentration in precipitation. They observed that the latitudinal distribution of the tritium concentration in precipitation at marine stations increased exponentially from the equator to the polar regions. In the northern hemisphere, the concentration doubled about every 13° of latitude, and in the southern hemisphere. about every 16° of latitude. The concentrations observed at the continental stations were on the average higher than at the marine stations by a factor of 3.6, this effect being due partly to re-evaporation and evapotranspiration over the land mass and partly to greater injection.
22. Assuming that the dose commitment to a population living in a given latitude band is proportional to the concentration in the corresponding precipitation and that the average concentration doubles every 13° of latitude from the equator to the North Pole, a dose
I 18
commitment of 2.8 mrad to the Ottawa Valley population corresponds to a dose commitment to the population of the northern hemisphere of 2.0 mrad.
23. From the extensive measurements of the tritium concentration in rainwater in both hemispheres between 1964 and 1967 carried out by IAEA (220), it appears that on the average the concentrations in the southern hemisphere were about one tenth of those in the northern hemisphere. Assuming that this ratio applies over the whole period of atmospheric tests, the dose commitment to the population of the southern hemisphere is estimated to be 0.2 mrad.
24. The dose commitment from fallout tritium can also be assessed, as in the 1972 report, using the relation nc = 'Yo W/B, where nc is the dose commitment. 'Yo is the tissue dose rate from natural tritium. W is the activity of tritium released by nuclear explosions. and B is the activity of natural tritium produced annually.

25. The annual dose from natural tritium is estimated to be 1.0 µrad (Annex B). Assuming a total release in the northern hemisphere of 3600 MCi of tritium from nuclear explosions, as discussed in previous paragraphs, and an annual natural production per hemisphere of about 1.9 MCi (Annex B). the dose commitment in the northern hemisphere from fallout tritium is estimated to be 1.9 mrad. In the southern hemisphere the dose commitment estimated by the same procedure is 0.47 mrad.
26. These values are in reasonable agreement with those given in paragraphs 22 and 23, namely 2 mrad and 0.2 mrad, which are taken in this report as the dose commitments from tritium in the northern and southern hemisphere, respectively. These estimates are lower than those presented in the 1972 report ( 4 mrad for the northern hemisphere and I mrad for the southern hemisphere).
27. The collective dose commitment from tritium is dominated by the contribution from the northern hemisphere, because of the higher individual doses in that hemisphere and also because of population distribution. Using the procedures outlined in Annex A and assuming a population growth of 2 per cent per year, the collective dose commitment due to tritium from nuclear explosions is estimated to be about 8 106 man rad, corresponding to about 3 10-3 man rad
per cent above normal
70
60
50
f 40
~ w 0
~ 30
20
10
1955
•
1960 1965
per curie of released activity. It should be noted that this estimate applies to the injection of tritium by nuclear explosions carried out in the northern hemisphere.
B. CARBON-14
28. Carbon-14 is a pure beta emitter with a maximum energy of 0.156 MeV and a half.life of 5730 y. It is formed in atmospheric nuclear explosions from the capture of excess neutrons by nitrogen. After large atmospheric nuclear explosions, most of the 14 C is transported into the stratosphere, from where it equilibrates with the troposphere with a half-time of 1-2 y.
29. Present in the troposphere as carbon dioxide, the activity of 1 4 C reached a peak in 1965 as a result of the nuclear explosions in the late 1950s and early 1960s. Although there have been additions to the troposphere of 14 C from explosions since that time, these inputs have been smaller than uptake by the oceans and the biosphere, and thus the levels in the troposphere have continued to decrease.
30. Measured values of excess specific activity of 1 4 C in the troposphere and in the surface ocean are shown in figure III. In order to estimate the inventory of 1 4 C from nuclear explosions and to predict future atmospheric levels, some model to represent the exchange of 14 C between the atmosphere, biosphere and ocean is needed.
0
1970
Troposphere
o Gulliksen ( 103) D Zimen 1255) x Munnlch (184)
Surface ocean
O Fairhall (~7)
o Gulliksen (1031
+ Raher (209)
x Bien (41) D Bien (411
Surface ocean
1975 1980
Figure Ill. Variation of excess 1 4 C in the troposphere and surface ocean. (The continuous line , has been obtained by regression, assuming no injections after 1972)
31. Figure IV is a schematic representation of the model used in this report to predict the circulation of 1 4 C and of the excess stable carbon injected by the use of fossil fuels {196). This model is similar to previous models used. by the Committee except that the thermocline region of the ocean is represented as a diffusive layer (194, 208. 242). The values of the
relevant parameters are also shown in this figure. The parameters Ka, k and W1 were adjusted to fit the excess 1 4 C in the atmosphere and surface ocean. Since the transfer time between the atmosphere and the short-term biosphere (i.e., annual plants, leaves, and short-term detritus) is short, being about 2.5 y, for the purposes of these calculations the short-term biosphere
119

wb = 2.5 Terrestrial biosphere
w. = 1.12 Atmosphere and short-term biosphere
W,= 1.2 Surface ocean
w, = 11 Thermocline layer in ocean
wd = 50 Deep ocean
K0 = 0.04 v·1
• I I •
K0 = 0.11 y·1
• I
I •
( Diffusion ) k = 2000 m1 y-1
+-I- Excess 14C input
Figure IV. Model representing tl1e exchange of excess 1 4 C between the atmosphere, the biosphere and tl1e ocean. The factors W are the capacity of each reservoir in units of the atmospheric capacity. The parameters Kb and K8 are transfer
rates and k is a diffusion coefficient.
is combined with the atmosphftiC compartment (13). The mean residence time of I ne excess 1 4 C in the atmospheric and short-term biospheric compartments, before movement to the long-term biospheric compartment or to the oceans, is Waf(Ka +Kb)= 7.5 y.
32. The pre dieted values of the excess 1 4 C in the atmosphere and surface ocean are included in figure ill. The parameters of the model, obtained by regression from the actual data on excess of 1 4 C, indicate that the input of man-made 1 4 C into the atmosphere up to 1972 was 5.8 MCi, and that the time-integrals of the man-made 14 Ccontent in the atmosphere up to 2000, 2020 and 2050 are equivalent to the natural content multiplied by 14.4, 17 .1 and 20.5 y, respectively. Fairhall et al (87), using .a quite different approach, estimated the excess 14 C inventory up to 1971 to be 6.2 MCi.
33. Carbon-14 is taken up by plants during photosynthesis and is subsequently incorporated into the human body. Several investigators have measured excess 14 C levels in human tissue (81, 150). Nydal et al. (194), from the measurement of 1 4 C/1 2 C ratios in human hair and blood between 1962 and 1969, concluded that the specific activity in human tissue comes into equilibrium with that in atmospheric C02 with a delay time of about l.4y.
34. The dose commitment from man-made 14 C can be assessed, as shown for the case of tritium, by a comparison with natural 14 C. Taking the natural production rate to be 28 kCi y-1 , as derived from the natural 14 C inventory, and the tissue dose rates from natural 14 C (Annex B), the dose commitments shown in table 1 have been calculated.
TABLE 1. DOSE COMMID!ENTS FROM THE 1 4 C PRODUCED IN NUCLEAR EXPLOSIONS
(mrad)
B9ne Red Whole· lining bone body
Gonads Lung cells marrow average
Dose commitment 103 124 414 455 269
Part accurnu-lated up to: 2 OOO 7.2 8.6 29 32 19 2 020 8.6 10.3 34 38 22 2 050 10.2 12.2 41 45 27
120
35. The parts of the dose commitment to the world population from 14 C delivered up to 2000, 2020 and 2050 were estimated from the corresponding integrated atmospheric levels given in paragraph 32. They are also shown in table 1.
36. Assuming an upper limit of 101 0 for the world population, the collective dose commitment per unit activity of 1 4 C released in the stratosphere is estimated to be about 200 man rad Ci-1 for soft tissues and abou: 700 man rad Ci-1 for bone lining cells and for red bone marrow.
C. MANGANESE-54
37. Manganese-54 was a significant component of fallout activity for several years after the test series in 1961-1962. It is not a fission product and was presumably produced by neutron capture reactions in the structural material used in the nuclear devices. It has a half-life of 310 d, decaying by electron capture with the emission of gamma and x rays. Little activity has been measured in air since 1966. The time-integrated activity concentration in air measured at Sterling, Virginia (United States), between 1963 and 1966 was 1.13 pCi y m - 3 (I 17, 249), and is typical of the integrated values measured in temperate latitudes of the northern hemisphere. In the southern hemisphere, the values were 100 times lower. Measurements of the deposition density (the activity deposited per unit area) made at Westwood, New Jersey (United States), indicate indirectly that the integrated air concentrations in 1962 were about 10 per cent of those in 1963 (110). Using this information; the integrated activity concentration in air at Sterling, Virginia, for 1962-1974 is estimated to be 1.2 pCi y m-3 •
38. Voilleque and Pelletier (248) have considered the different pathways of 5 4 Mn to man and have estimated transfer factors for the pathway air-+ deposition on the ground ~ cow's milk -+ man. In man, the organ receiving the highest dose from ingestion is the lower large intestine. For adults, the transfer factor P1 2345
pertaining to the atmosphere-to-dose pathway via ingestion (see paragraph 2), is estimated to be 7 10-3 mrad per pCi y m-3
• For children less than one year old, the population group receiving the highest dose, these authors estimated P 1234 5 to be 0.11 mrad per pCi y m -3
• The main dose is in the lung due to direct inhalation. Using the ICRP lung model (134, 135, 136) with the set of pa~ameters for compounds class W, and a value of 20 per cent retention in the pulmonary region, the value of P145 for adults is 0.91 mrad per pCi y m -3
• The dose commitments from 5 4 Mn, assessed from the factors mentioned above, are 8 10-3 mrad to the lower large intestine (LLI) of adults, 0.16 mrad to the LLI of infants, and 1.0 mrad to the adult lung.
D. IRON-55
39. Iron-55 has a half-life of 2.7 y and decays by electron capture with the emission of x rays and bremsstrahlung with 0.23 MeV maximum energy.

r
Iron-SS was produced as an activation product in the nuclear tests carried out in 1961-1962 and it is estimated that a total of about SO MCi was produced ( 126). The concentration of 5 5 Fe in air fell rapidly after 1962-1963 and has been essentially zero since 1970. Time-integrated concentrations in the atmosphere of the southern hemisphere were considerably below those of the northern hemisphere.
40. The uptake of 5 5 Fe by man was discussed in the 1972 report of the Committee (245), and it appears that both the terrestrial food chain and the marine food chain leading to man are important in contributing to the activity in man (137, 197). Body activities measured in a large number of people in different parts of the world in 1966 were in the range 20-30 nCi, and they dropped to 1-10 nCi in 1969 (148, 197). In Japan and in Alaska (United States) in 1966, body activities greater than 1 OOU nCi were observed in persons consuming large quantities of fish (197). The dose commitments in the northern hemisphere from testing in the period 1954-1962 was estimated by Persson (199), assuming a maximum body activity of 30 nCi in the temperate latitudes. The estimates are 1 mrad to the gonads and bone lining cells and 0.6 mrad to the bone marrow. A reduction by a factor of four is assumed for the southern hemisphere. The collective dose commitment per unit activity released in the northern stratosphere is estimated to be about 6 10-2 man rad Ci-1 for the gonads and bone lining cells and 4 10-2 man rad Ci-1 for the bone marrow.
E. KRYPTON-85
41. The production of 85 Kr by nuclear explosions can be estimated from 90 Sr production values, using a 85 K.r/90 Sr fission-yield ratio of0.07 (164. 190). By this procedure the production of 8 5 Kr by nuclear explosions
kCi
111"
\ \,
' \ ' \
\
-- Total rtl'iltosphere
- - - - Northern hemisphere
- · - · - Southern hemisphere
f I.Mge atmosphecic tests in northefn hemisphere
f ~rge 1tmospheric tests 1n southern henusphere
1ol /-\ '""" .i '-..... ' ..... \
'· ' ' ' ·.-·,. ', '. '
\ ' \.-·,'
'\. I \_I ·-,
\ ...... -....J
is estimated to be about 3 MCi. Krypton-85 is an inert gas and most of it remains in the atmosphere, its concentration becoming fairly uniform throughout the earth's atmosphere within a few years (88). Most of the 85 Kr present in the earth's atmosphere originates in releases from nuclear-fuel reprocessing plants and not from nuclear explosions (Annex D).
42. Krypton-85 has a I 0.7-y half-life, is a beta emitter with a maximum energy of 670 keV, and emits a 514-keV photon in 0.4 per cent of the disintegrations_ The dose to the skin, lung and gonads from a time-integrated concentration in air of I pCi y m -3 have been estimated (185) to be 1.8 µrad, 3.1 10-2 µrad and 1.6 10-2 µrad, respectively. Assuming that 3 MCi are uniformly mixed in the earth's troposphere (5 102 1 g air), the resulting dose commitments are estimated to be 21 µrad,035 µrad and 02µrad for the skin,lung and gonads. respectively. Assuming an annual increase in the world population of 2 per cent, the collective dose commit· ments. per curie of 8 5 Kr released in the stratosphere. are estimated to be about 4 10-3 man rad for skin, 7 10-4 man rad for Jung and 4 JO""" man rad for gonads.
F. STRONTIUM-90
1. Inventory and deposition
43. Strontium-90, a pure beta emitti:r with a maximum energy of 0.54 MeV, decays with a half-life of 28 y to 90 Y, which has a half-life of 65 hand is a beta-emitter with a maximum energy of2.27 MeV.
44. The total stratospheric inventory of 9 0 Sr is shown in figure V, together with that for each hemisphere for the period 1963-1975 ( 149). The period between 1963 and 1966 was marked by an exponential decrease of the
10 ..._---.----.---~-~-....._-.-_..,.rr_.,,._--'..~....L.L.-'-,-......... -,---~ ......... -.---.---1963 1964 1965 1966 1967 1968 1969 1970 1971 1972 1973 1974 1975
Figure V. Variation of the stratospheric inv!,lntory of 90 Srover the period 1963-1975 (149)
121

stratospheric inventory from the peak value resulting from the atmospheric tests conducted in the early 1960s. Between 1966 and mid-1971, the inventory in each hemisphere remained fairly constant at about 20 per cent of the 1963 peak values. During this period, the norther.n and southern hemisphere stratospheres were replenished with 9 0 Sr from a series of tests carried out in central Asia and in the south Pacific. During 1972 and early 1973, the stratospheric inventory in each hemisphere again decreased. After mid-1973 the inventory rose after an atmospheric test in the northern hemisphere.
45. The annual deposition of 9 0 Sr in the northern and southern hemispheres is shown in table 2 for -the period 1958-1975. in addition to the cumulative deposit in each hemisphere (89). (Deposition is the activity deposited on a specified area. The cumulative deposit is the activity present in a specified area at a given time; it is the result of past depositions and radioactive decay.) Between 1970 and 1973, deposition in both hemispheres fell off sharply, and the 1973 values were the ~mallest recorded since these measurements began. In 1974. however, there was an increase in the annual deposition in the northern hemisphere.
TABLE 2. ANNUAL DEPOSITION AND CUMULATIVE DEPOSIT OF 90 Sr
{AfCi)
Deposition Cumulative deposit
Northern Southern Northern Southern Year hemisphere hemisphere Global hemisphere hemisphere Global
Pre-1958 1.soa 0.65a 2.45a 1.70 0.60 2.30 1958 0.63 0.25 0.88 2.28 0.84 3.12 1959 1.05 0.18 1.23 3.26 1.00 4.26 1960 0.26 0.17 0.43 3.44 1.14 4.58 1961 0.35 0.17 0.52 3.70 1.29 4.99 1962 1.44 0.26 1.70 5.04 1.51 6.55 1963 2.62 0.31 2.93 7.51 1.78 9.29 1964 1.66 0.42 2.08 8.96 2.16 11.12 1965 0.77 0.36 1.13 9.50 2.46 11.96 1966 0.33 0.21 0.54 9.59 2.60 12.19 1961 0.17 0.11 0.28 9.52 2.65 12.17 1968 0.20 0.10 0.30 9.48 2.68 12.16 1969 0.15 0.14 0.29 9.40 2.76 12.16 1970 0.21 0.13 0.34 9.37 2.82 12.19 1971 0.19 0.15 0.34 9.33 2.90 12.23 1972 0.09 0.10 0.19 9.18 2.92 12.10 1973 0.03 0.03 0.06 8.98 2.88 11.86 1974 0.12 0.04 0.16 8.89 2.11: 11.74 1975 0.06 0.03 0.09 8.73 2.81 11.54
Integrated deposition 12.13 3.81 15.94
Stratospheric o.o3b inventory 0.03 0.06
Total injection to January 1976 12.16 3.84 16.00
Sources: References 89, 149.
aEstimated from the cumulative deposit, assuming a two-year decay. b Assumed to be the same as for the northern hemisphere.
46. The deposition density of 90 Sr is measured monthly at a considerable number of monitoring stations in both hemispheres. (Deposition density is the activity deposited per unit area.) Estimates of the average integrated deposition density (the addition of all previous deposition densities in a location. without taking account of radioactive decay) of 9 0 Sr in each latitude band are shown in table 3 (89), together with the zonal populations and areas. This latitudinal distribution is useful for determining the dose commitment to the world population and in addition serves indirectly as a guide to the geographical distribution of other radionuclides released by atmospheric tests. It can be seen from table 3 that the integrated deposition . density is maximum in the mid-latitude regions of each hemisphere.
47. The population-weighted deposition density is determined as follows: If Ni is the population of latitude band i and Fi is the average integrated deposition density of 9 0 Sr in that band. then the population-weighted
122
TABLE 3. LATITUDINAL DISTRIBUTION OF 90 Sr
Latitude band
70°-80°N 60°-70°N S0°-60°N 40° -50°N 30°-40°N 20'-30°N 10' -20°N
0° -10° N 0°-lO'S
10° -20° s 20° -30' s 30' -40° s 40° -50° s 50' -60° s
INTEGRATED DEPOSITION DENSITY
Relative population
Area of band of band (10 6 km 2
) (%)
11.6 0.0 18.9 0.4 25.6 12.2 31.5 13.8 36.4 18.2 40.2 29.2 42.8 9.8 44.1 5.6 44.1 5.8 42.8 1.8 40.2 1.6 36.4 1.4 31.5 0.1 25.6 0.05
Integrated deposition . density of ' 0Sr (mCi km"2
)
19.1 45.7 79.2 85.1 62.4 45.7 30.0 20.7 18.9 10.1 18.0 20.7 24.5 14.7
Sources: References 89, I SS.

-------1
TABLE 4. STRONTIUM-90 AND CAESIUM-137 IN MILK
'0 Sr/Ca q1,otie11t (pCI (gCar') 137 Cs co11ce11tra tion (pCi r 1
)
Countr)' or area /966 1967 1968 1969 1970 1971 1972 1973 1974 1975 1966 1967 1968 1969 1970 1971 1972 1973 1974 1975 Reference
Northern hemisphere
Austria 23 14 13 12 70 3 28 27 57, 58, 59 Belgium 13 9 8 9 6 6 5 36 I';' 20 15 10 13 JO 72, 73 Canada 13 10 8 9 9 8 7 51 33 25 20 21 22 16 78, 79,162,205, 237, 253 Colombia 2 2 I 1 1 I 206, 207 Czechoslovakia 12 183 Denmark 9 8 7 6 8 7 5 4 4 4 22 14 12 13 10 11 7 4 4 4 2 Egypt 13 6 157, 158 Faroe Islands 73 51 45 37 37 34 25 23 20 19 800 586 507 463 357 352 268 251 254 198 3 Finland 13 10 9 8 7 7 6 5 5 134 92 70 54 49 44 36 30 28 25 64,218 France (I) 19 14 12 9 8 9 8 6 6 6 21 20 19 21 22 15 8 6 8 96,198,222 France (2) 18 15 12 12 12 II JO 7 6 6 62 34 24 24 26 28 20 13 JO 12 76 French Guiana 13 17 8 7 II 6 61 12 72 67 68 206,207 Germany, Fed. Rep. of 16 II 9 9 8 8 7 6 6 5 61 35 27 25 31 29 25 18 20 15 52, 56 Guadeloupe 2 2 2 3 4 4 3 14 14 17 12 7 222, 253 India (Bombay) 5 3 3 2 3 2 11 6 5 5 4 4 146,147,170,171 Israel 2 2 90 Italy 13 10 8 8 7 34 25 74, 75 Jamaica 9 7 4 4 4 4 3 200 184 109 95 81 80 45 253 Japan II I! 7 5 5 6 4 4 4 3 52 30 28 18 16 15 19 12 10 9 7, 253 Martinique 7 8 5 5 4 7 4 41 41 61 59 98 65 222. 253 Netherlands 15 9 8 7 6 5 5 43 37 28 23 17 16 10 72, 161, 168, 169 Norway 30 18 13 11 II 9 8 9 7 244 181 146 128 117 84 80 72 59 49 131 Panama 4 21 22 11 11 247 Poland 13 14 10 9 6 8 6 6 6 5 58 42 37 31 31 32 26 I 8 22 22 138 Puerto Rico 6 4 4 4 21 14 247 Republic of Korea 22 11 15 143 Senegal 13 9 6 3 6 4 206 Sweden 15 JO 8 7 7 7 6 5 5 63 38 30 20 23 26 18 II II JO 106-108, 109, 228-230 Switzerland 15 9 7 7 8 9 7 5 5 29 16 15 14 15 16 12 7 11 129,130 USSR 12 10 9 8 7 7 6 5 56 38 30 20 23 27 21 18 144,257,258,261,263,264 United Kingdom 12 9 8 7 6 6 5 4 3 3 46 20 16 14 17 18 13 8 9 7 5,50,51, 178 United States 12 9 29 16 247
Alaska 12 6 6 5 34 20 13 247 Chicago 9 8 8 6 14 16 14 14 7 5 47,125,247 Hawaii 4 3 4 2 25 9 247 New York City 12 10 9 9 9 9 6 5 5 5 36, 112 Tampa II II 7 5 5 4 4 139 102 66 55 51 43 35 27 247, 253
Venezuela 4 14 9 247
Southern hemisphere
Argentina 5 5 4 4 3 4 4 3 2 2 24 21 19 20 20 19 17 13 12 5 21, 70, 71 Australia 7 5 4 5 6 7 5 4 4 4 28 20 15 18 19 21 18 II 7 6 9-11, 44, 91, 92, 99 Uolivia I 1 1 I I 76,206 Chile 2 2 1 2 2 I 3 2 8 9 76, 69, 206, 207 Ecuador 5 2 I I 1 I I 76,206,207 Madagascar 2 2 I 2 I I 76,206,207 New Caledonia 3 2 .3 3 3 3 2 2 8 7 5 12 6 3 2 76,206,207 New Zealand 8 6 5 7 7 7 6 4 55 43 32 40 35 32 27 18 14 187-188 Peru 2 I 2 206 Reunion 4 3 3 5 5 5 3 3 17 15 18 16 '14 14 10 207,222
N Sociely !$lands (Tahiti) 6 4 2 4 6 5 4 4 18 96 35 134 144 138 114 106 76,206,207 \J,,)

deposition density F is given by F = "E1F tN;/''f,tP/1- The gopulation-weighted integrated deposition densities of
0 Sr from all tests for the northern hemisphere, for the southern hemisphere and for the whole world are 56.5, 17.6 and 52.3 mCi km-2 , respectively.
2. Strontium-90 in the environment
48. The deposition of 9 0 Sr occurs over land and water, but that over land is the more important pathway for human exposure. The quantitative aspects of the transfer of 9 0 Sr along terrestrial pathways are treated in detail in the following sections of this Annex.
49. Previous reports of the Committee have discussed the behaviour of 9 0 Sr in soils (244, 245). Recent measurements of the soil profile (114) have shown that 9 0 Sr is still present mostly in the upper layers, with 50 per cent in the first 4 cm and ~ractically all in the top 30 cm. Only small amounts of O Sr are leached out of the soil and conveyed into fresh-water rivers and lakes. Concentrations in drinking waters are normally at least an order of magnitude lower than those found in other foodstuffs. Plants take up 9 0 Sr from soil through their root system. This root uptake and the time constants describing how 9 0 Sr becomes unavailable for plants are discussed in paragraphs 55 to 66.
50. Most of the 9 0 Sr fallout into the oceans is still present in the well mixed layer above the thermocline. Noshkin and Bowen (193), from measurements in the north and south Atlantic oceans, estimated that o·niy about I per cent of the 9 0 Sr has reached the bottom
sediments. In the open ocean, activity concentrations are about 0.2 pCi 1-1 in the surface layer and smaller by a factor of at least 30 below the thermocline. In coastal areas and estuaries concentrations may be a factor of 5 higher.
51. Strontium-90 is taken up by marine biota, and becomes incorporated into the marine food chain. A number of determinations of the concentration factors have been performed in recent years for various marine ::.,iota by measurements of stable and radioactive strontium under laboratory and field conditions (63, 93. 191, 214, 240). Typical values are 100 for algae, 2-10 for crabs and lobster and about 1 for the muscle meat of fish. The amount in fish does not contribute greatly to the intake of 90 Sr by man. It is estimated that only about 3 per cent of the 9 0 Sr intake by man in Japan between 1966 and 1971 came from fish (240).
3. Levels in food
52. The annual average 90 Sr/Ca quotients in milk and in the whole diet from 1966 onwards are shown in tables 4 and 6. Values for earlier years are given in earlier reports of the Committee. Typically, levels in milk fell by about 30 per cent between 1970 and 1974. Data so far available indicate that levels in 1975 are about the same as those reported in 1974. Table 5 gives the annual average 9 0 Sr/Ca quotients in milk of some countries of the north temperate zone for the period 1955-1975. The numbers in the right-hand column of table 5 are the averages of the available data for each year. It can be seen that this a-.:erage in 1975 is about 20 per cent of that prevailing during the peak years of 1963 and 1964.
TABLE 5. ANNUAL AVERAGE ' 0 Sr/Ca QUOTIENT IN MILK BY COUNTRY OR AREA
North temperate zone, 1955-1975
124
Year
1955 1956 1957 1958 1959 1960 1961 1962 1963 1964 1965 1966 1967 1968 1969 1970 1971 1972 1973 1974 1975
E ·== ,!:!> ., 'l:i
13 9 8 9 6 6 5
,§ t: ~ " i:: i::
a ., Cl
9 5 4
10 26 24 28 25 19 17 13 9 10 8 8 7 9 6 9 8 8 7 7 5
4 4 4
'2 t .§ E ~ Lt;
7 6
13 22 23 18 24 13 19 10 14 9 12 8 9 7 8 7 9 6 8 5 6 5 6
3 4 8 6 8 6 6
10 27 28 21 16 11 9 9 8 8 7 6 6 5
(pCi (gCa) -I)
9 25 22 17 15 9 8 7 6 5 5
27 27 23 15 9 7 7 8 9 7 5 5
8 6 4
13 23 18 14 15
8 5 5 7 7 6 5
4 6 6 7
10 6 6
12 26 28 19 12 9 8 7 6 6 5 4 3 3
7 11 19 19 14 II 9
United States
.:.: ., ... C ~
.:.: ~ " ...;i
.:: ~;,., ~o 6 ~a t;Jtj
5 4 7 8 4 7 11 6 8 8 6 6 7 4 9 12 8
17 26 19 16 23 23 12 19 17 9 12 10 8 10 5 8 9 6 9
8 8 6 5 5 5
Mean
3.5 5.0 5.3 6.2 8.6 6.6 5.6
10.8 23.3 23.3 18.2 13.0 9.2 8.5 7.8 7.2 7.2 6.2 5.2 5.0 4.3

. ··---·-,
TABLE 6. STRONTIUM-90 AND CAESIUM-137 IN TOTAL DIET
00Sr/Ca quotient (pCi (gCar'J 131Cs daily intake (pCi)
Country or area 1966 1967 1968 1969 1970 1971 1972 1973 1974 1975 1966 1967 1968 1969 1970 1971 1972 1973 1974 1975 Reference
Northern hemisphere
Austria 25 15 15 14 135 53 60 51 59 Denmark 14 JO 8 8 7 8 8 6 7 6 79 44 39 38 32 38 31 15 18 18 2 Egypt 45 13 157,158 Faroe Islands 33 22 23 17 20 15 13 12 10 10 496 480 502 403 384 202 191 316 239 281 3 Finland 21 260 132 France (I) 22 19 17 15 15 14 13 10 11 9 76 France (2) 21 20 18 18 16 13 12 12 38 34 37 37 31 15 16 14 96,198,222 Germany, Fed. Rep. of 26 18 15 14 11 13 11 9 II 8 123 77 40 36 28 53 27 . 18 17 16 52,54 Greenland 15 9 7 8 6 8 9 6 5 6 89 297 346 61 137 51 55 71 54 29 4 India 12 28 10 6 3 20 145,172 Japan (urban) 24 18 19 21 15 12 12 9 9 20 14 13 14 9 8 7 10 7 8,174 Netherlands 20 14 12 11 9 8 8 90 so 32 28 24 22 14 168, 169 Norway 38 420 132 Sweden 22 132 88 71 65 58 50 132,156,233 USSR (urban) 41 30 27 21 23 23 21 19 145 93 56 38 38 47 34 29 45,257,261,262,263 United States
Country average 16 12 55 30 34 28 25 24 17 11 47, 104, 125, 247 Alaska 29 26 247 Hawaii 10 6 65 35 247 New York City 17 16 14 12 12 13 11 10 9 8 30,36 San Francisco 6 6 4 4 4 4 4 3 3 3 30,36
Southern hemisphere
Argentina 7 7 5 6 5 5 5 4 3 3 24 19 18 17 17 15 13 11 4 21, 70, 71 Australia 7 6 5 5 6 7 6 5 4 4 9, 11, 91, 92, 99,l~O
-N V,

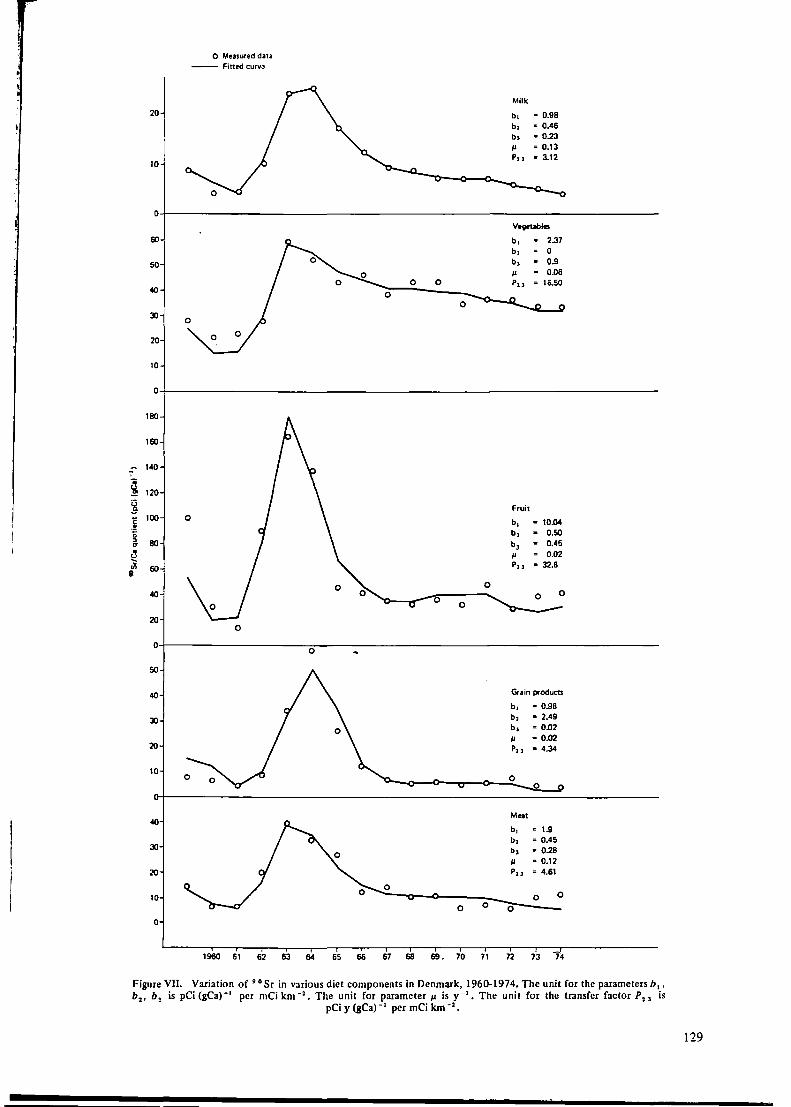
53. The annual values of the ratio of the 90 Sr/Ca quotient m the total diet to that in milk are shown m table 7. Bennett (30, 36) has investigated the relative contributions that different foods make to the 90 Sr intake in New York and San Francisco. The results for New York are shown in figure VL which presents the 90 Sr/Ca quotient in various components of the diet. Aarkrog and Lippert (2) have report~d similar results for the Danish diet, some of which are plotted in figure VII. When expressed as 9 0 Sr/Ca quotients, the peak values
recorded for fruit, vegetables and grain products are about 50 pCi (gCa)- 1
, for milk products they are about 50 per cent of that, for meat. fish and eggs. only about 20 per cent. It is also notable that the 9 0 Sr/Ca quotient in milk products and meat reaches a peak during periods of high fallout rate and then decreases rapidly over the next 5-8 y, while for fruit and vegetables it remains higher for longer periods of time. It is expected, therefore, that the long-term variation of the 9 0 Sr intake with _time would depend on the composition of the diet.
TABLE 7. RATIO OF THE 9 0 Sr/Ca QUOTIENT IN THE TOT AL DIET TO THAT IN MILK
Country Mean for
1963 1964 1965 1966 1967 1968 1969 1970 1971 1972 1973 1974 1975 1963-1975
Argentina Australia Denmark Finland France Germany, Federal Republic of India (Bombay)" Japan Norway Sweden USSR United Kingdom United States
Hawaii New York City
1.8 1.5 1.3 1.4 1.4 1.1 1.0 0.9 1.0 1.2 1.3 2.0 1.6 1.5 1.3
1.8 1.6 1.2 1.3
1.8 1.6 1.6 1.7 1.6 1.7 2.9 2.1 6.9
2.1 2.2 2.3 2.2 2.3 1.3 1.4 1.4 1.5
2.3 3.1 3.7 3.4 3.0 0.9 0.9 1.0
1.6 2.2 3.5 2.5 2.0 1.1 1.3 1.2 1.4 1.6
1.3 1.5 1.3 1.3 1.0 1.0 1.2 1.4 0.9
1.4 1.3 1.3 1.6 1.5 1.5 2.7 2.7 4.2 3.0
3.0 2.6 3.3
1.6 1.3 1.5
u 1.1 1.2
1.3 1.8
3.1
1.6
1.3 1.3 1.1 1.1 1.6 1.7
1.3 1.6 1.7 1.6
3.2
1.8 1.9
1.5 1.3 1.4 1.1 1.1 1.1 1.8 1.5
1.7 1.8 LS 1.4 1.8 1.7 1.7
3.3 2.6 3.0 2.7
1.3 1.4 3.1 0.9
2.4 1.9 1.6 1.5
0 Since most of the wheat and rice is imported, the diet data do not reflect the local fallout levels.
54. Aarkrog and Lippert (2) have reported that the 9 0 Sr/Ca quotients in potatoes, cabbage and carrots grown in Denmark have not diminished greatly since 1963, whereas in milk it has fallen by a factor of five. On the other hand, M.ukhin (182) has reported results on the 90 Sr concentrations of potatoes and cabbage grown in the Union of Soviet Socialist Republics, which have fallen by a factor of about five between 1963 and 1969. Borisov ei al (45) have reported that cereals have consistently been the major contributor of 9 0 Sr in the USSR diet; this would account for the fact that the 90 Sr/Ca quotient in total diet and also the ratio of total diet 9 0 Sr/Ca to that of milk is higher in the USSR than in other countries having high-milk diets.
4. Transfer of 9 0 Sr from fallout to diet
55. Transfers between two successive steps in the sequence linking input into the environment to the resulting dose commitment can be described by transfer factors, defmed as the quotient of the infinite time-integrals of the quantities considered for each step (see Annex A). In the transfer model used by the Committee in the 1969 and 1972 reports (244, 245), which is outlined in paragraph 2 of this· Annex, the transfer factor from fallout to diet is given by
f ~"' C (t) de P, 3 = (I)
~ . f ~<X)f (t) dt
where qt) is the 90 Sr/Ca quotient in the diet at time t, and ff t) is the deposition density rate of 90 Sr at time t.
126
56. If the values of qt) and f(t) are assessed as averages for discrete intervals of time h, equation I becomes
<Xl <Xl
I hC (i) I C (i)
P23 = i= -cci i= - 00 (2) = <Xl <Xl
I hf (i) I J (i) i= - co i= -Cl)
Equation 2 can be reformulated to take account of the determinations of the 90 Sr/Ca quotient in individual components of the diet. If the fractional contribution of component j of the diet to the total dietary calcium is Wj, and the 90 Sr/Ca quotient in that component is C,{i), then
cc
L CJ (i) P '\' w i=-CX) "' 23 = £.. j _00 ___ = £.. (3)
j I J OJ j
i= - a,
where Pf 3 is the transfer factor from fallout to diet component j.
57. In the 1969 and 1972 reports of the Committee (244, 245), the 9 0 Sr/Ca quotient in a diet component was related to the past and present deposition density rate /(r ), by the expression
cj (t) = I""KJ (t-r) f (r) dr (4)
where K; is a transfer function defined by this equation. If both C;(t) and f(r) are given as averages over discrete

intervals of time of duration h. the time becomes t = nh. and equation 4 is equivalent to
n
cj (nh) = L hK1 (nh-mh) f (mh) = m=-oc
co
=I hKj(lh)f(11h-/11) l=O
(5)
The transfer factor P/3 can be obtained from the transfer function K; by the relation
co
P{3 = L hKj (lit) (6) l=O
where, in practice. the time interval II is 1 y, because most of the determinations .of ~0 Sr in food have been reported on a calendar-year basis.
58. Several transfer functions between fallout and diet components have been tried in regression analyse~ of reported data. In the 1972 report of the Committee (245) the following function was used:
00
C1 (i)=hf.r(i)+h{/"{i-l)+h1 L e-=J(i-m) (7) m=l
In this equation, f(i) is the annual deposition density in the year considered, /(i-1) is the annual deposition density in the previous year. and the summation is
carried out over the deposition of all preceding years, each weighted by an exponential term describing the combined physical decay of 9 0 Sr and any decrease i.n tJ?e availability to plants of 9 0 Sr in soil. The factors bt b~ and bt and the effective mean life of available 90 Sr, µ- 1 , can be derived from reported data by regression analysis.
59. In the past, this transfer function was found to be adequate for predicting 9 0 Sr/Ca quotients in milk. By allowing each of the parameters b 1 , b2 , b 3 andµ to vary in a regression analysis, Bennett (30, 36) has fitted equation 7 to five New York City diet compone.nts (milk products: cereals; meat, fish and eggs; fruit; and vegetables) and also to the same five components of the Danish diet (22). The results are shown in the continuous curves in· figures VI and VII for New York and Denmark respectively. The factors obtained from this regression analysis are shown in tables 8 and 9 (22). The estimated transfer coefficients for each individual diet component P/3 in the two S!!ts of Danish data are in reasonably good agreement with each other, especially taking into account that the definitions of the components are not the same in the two cases. Also shown in these two tables are values of P2 3 for the total diet, estimated from a regression analysis with the total composite diet data. The 95% confidence limits on P2 3
are 4.3 and 6.4 pCi y (gCa)-1 per mCi km -2•
TABLES. PARAMETERS OF THE TRANSFER FUNCTION BETWEEN 90 Sr FALLOUT AND DIET
Obtained by regression analysis from New York City data
Meat, Total Milk Grain fish, Vege- composite
Parametell products products eggs tables Fruit diet
b, 0.69 0.86 0.004 0.96 1.36 0.90 b2 0.21 1.91 0.17 0.37 0.00 0.54 b, 0.20 0.30 0.31 1.03 0.90 0.36 µ 0.14 0.13 0.28 0.07 0.03 0.10 P/, 2.23 4.92 1.13 15.45 30.46 4.87 WJ 0.582 0.179 0.111 0.089 0.039 1.0 W;P/, 1.30 0.88 0.13 1.38 1.19 4.87
Total diet P23 4.88 4.87
aThe unit for parameters b., b 2 , b,. is pCi (gear• per mCi km • 2• The unit for parameterµ is
y·•. The unit for the transfer factor P/3 is pCi y (gCa)"1 per mCikm" 2• W; is the fractional
contribution of component/ to the total Ca diet.
TABLE 9. PARAMETERS OF THE TRA.!'ISFER FUNCTION BETWEEN 90 Sr FALLOUT AND DIET
Obtained by regression analysis from Danish data
Meat, Total Milk Grain fish, Vege- composite
Parametell products products eggs tables Fruit diet
b, 0.98 0.98 l.90 2.37 10.04 1.07 b2 0.46 2.49 0.45 0.00 0.50 1.22 b, 0.23 0.02 0.28 0.90 0.45 0.19
µI 0.13 0.02 0.12 0.06 0.02 0.10 P23 3.12 4.34 4.61 16.50 32.59 4.01 W; 0.44 0.48 0.02 0.05 0.01 1.00 W;P/3 1.37 2.08 0.09 0.83 0.33 4.01
Total diet P23 4.70 4.01
aThe unit for parameters b., b2
, b,.is pCi (gear• per mCi km •2• The unit for parameterµ is
y ·•. The unit for the transfer factor P/3 is pCi y (gear' per mCi km · 2• W; is the fractional
contribution of component/ to the total Ca diet.
127

.. O Mt1$ureddau
-- Fitted curve
30 Milk products
b, ~ 0.69 20 b2 = 021
b, • 0.20
10 /J • 0.14 P23 • 223
0
70
60 0
50
40 Vegetables
30 b1 0.96
b2 = 0.27
20 b3 = 1.03
/J = 0.07
P23 =15.5 10
0
0 70
60 0 Fruit
~ 0 b1 1.36 0 0 b, 0.00 50
i 0 0 b3 0.90
0 /J 0.03 ii 40
P23 =30.5 ·~ 0 :,
a 30
~ 0 (/)
Iii 20
10
0
60
50 0
40 Grain produeu
30 b1 0.86
bi 1.90
20 b3 0.30
/J 0.13
P21 4.92 10
0
15 Melt, fish.eggs
b, = 0.004
0 b, = 0.17 10
b3 = 0.31
/J = 0.28 5 P23 = 1.13
0 0
1959 60 61 62 63 64 65 66 67 68 69 70 71 72 73 74 75
Figure VI. Variation of 90Sr in various diet components in New York City, 1959-1975. The unit for the parameters b1
, b2
,
b 3 is pCi (gCa) • 1 per mCi km-•. The unit for parameter µ is y • 1 • The unit for the transfer factor P13
is pCi y (gCa) ·• per km • 2 •
128
20
10
0
60
50
40
31
20
10
0
180
160
140 i
~ 120
g c 100 .!! g C' 80 t'l ~ 60 i
40
20
0
50
40
31
20
10
40
31
20
10
0
FigureVTI.
0 Measured data -- Fitted curv.,
0
1960 61 62 63
0
0
0
64 65 66 67
0 0
0
0
0 0
0 0
68 69. 70 71
Milk
b, a 0.98 b, • 0.46 b, • 0.23 µ = 0.13 Pu • 3.12
Vegetabla
b, . 2.37 b, 0 b, . 0.9 µ . 0.06 Pu = 16.50
Fruit
b, = 10.Q4 b, . 0.50
b3 = 0.45 µ = 0.02 P,, • 32.6
Grain products
b, • 0.98 b, • 2.49 b, = 0.02 µ - om Pu • 4.34
0 0
Meat
b, • 1.9 b, = 0.45 b, • 0.28 µ = 0.12 P,, = 4.61
0 0
0
n 73 74
Variation of 9 0 Sr in various diet components in Denmark, 1960-1974. The unit for the parameters b 1 ,
b,, b3 is pCi (gCa) ·• per mCi km·•. The unit for parameterµ is y-•. The unit for the transfer factor P,, is pCi y (gCa) -• per mCi km·•.
129
60 .. The total diet transfer coefficient P2 3 is given in terms of the transfer factor for each component in equation 3. The contribution from component i is Wf'/3 , where w1 is the fractional contribution of component f to the total dietary calcium intake. To compare the relative contribution of different diet components to the 90 Sr intake, it is necessary to compare the products Wf'/3 , which are also given in tables 8 and 9. The values of the total diet transfer factor P2 3 estimated from the different dietary components using equation 3 agree with those estimated from the composite total diet. both for New York and for Denmark. Mille products appear to contribute about 30 per cent P2 3 in both places. Meat, fish and eggs contribute only to a small extent. In Denmark grain products contribute about 45 per cent of the intake, in New York, only about 17 per cent. Fruit and vegetables contribute about 54 per cent of 90 Sr intake in New York, but only 24 per cent in Denmark.
61. These differences reflect not only different annual intakes for each foodstuff, but also different agricultural practices and soil conditions. In general, it may be said that 9 0 Sr in the diet comes mainly from millc products, grain products, fruit and vegetables. Most of the 9 0 Sr from grain products is received during the years of heavier fallout; in the case of milk about 40 per cent is received during the years of fallout and the rest over some 8 y afterwards. For fruit and vegetables, most of the contribution seems to be delivered over a period of 12-14 y after deposition. This pattern is consistent with observations in the Federal Republic of Germany, where lettuce, cabbage, citrus fruits and potatoes showed little change in activity concentration between 1963 and 1967 (53).
62. A similar analysis of the reported 9 0 Sr data for the individual components of the Ar!len;ine and Australian diets has been carried out (22). Since the deposition density rate of 9 0 Sr did not peak so sharply in the southern hemisphere, the estimates of parameters
obtained by fitting the dietary 9 0 Sr data are probably less precise. However, differences are evident when these values are compared with the comparable ones derived from the New York and Danish data. For Argentina, the values obtained for P2 3 were (unit: pCi y (gCa)-1 per mCi km -2
): 6.49 for the composite diet, 6.00 from analysis of separate dietary components. The greatest contribution came from cereals and milk products. For Australia, a value of 7.47 was obtained from the composite diet and 10.7 from an analysis of individual dietary components. The greatest contribution also came from cereals and milk products.
63. From the above analysis of diets in two countries in the southern hemisphere it appears that the transfer factors between fallout and diet are about twice as great as those for countries in the northern hemisphere with similar diets. That is consistent with the observation that concentrations of 90 Sr in human bone from these southern latitudes are not substantially lower than those at similar latitudes in the northern hemisphere, even though the integrated deposition density of 9 0 Sr has been only about one fourth of that in the northern hemisphere.
64. There are as yet insufficient data to predict what contribution fruit and vegetables will make to the transfer factors for diets with little or no milk products. There is also the possibility, as suggested by Borisov et al (45), that the strontium and calcium present in different components of the diet are not equally available.
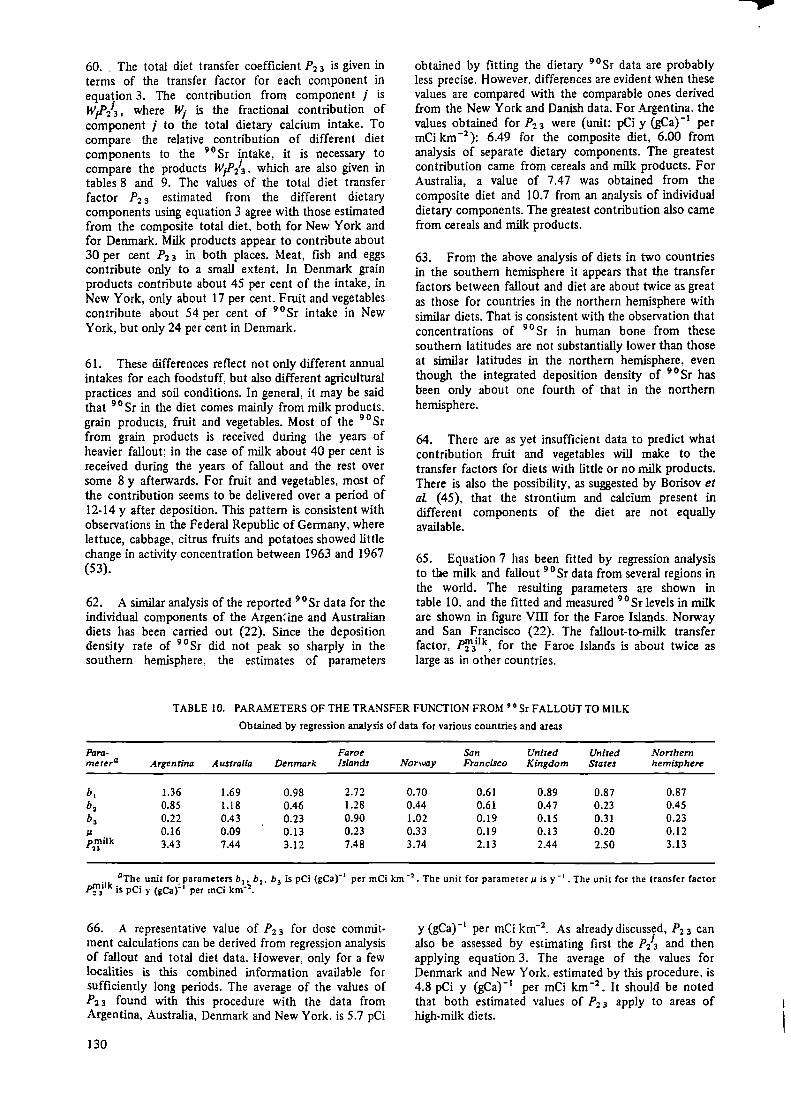
65. Equation 7 has been fitted by regression analysis to the milk and fallout 9 0 Sr data from several regions in the world. The resulting parameters are shown in table 10. and the fitted and measured 9 0 Sr levels in milk are shown in figure vm for the Faroe Islands. Norway and San Francisco (22). The fallout-to-milk transfer factor, PJ1Pk, for the Faroe Islands is about twice as large as in other countries.
TABLE 10. PARAMETERS OF THE TRANSFER FUNCTION FROM 9 0 Sr FALLOUT TO MILK
Obtained by regression analysis of data for various countries and areas
Para- Faroe San United United Nonhem metera Argentina Australia Denmark Islands Norway Francisco Kingdom States hemisphere
b, 1.36 1.69 0.98 2.72 0.70 0.61 0.89 0.87 0.87 b2 0.85 1.18 0.46 1.28 0.44 0.61 0.47 0.23 0.45 b, 0.22 0.43 0.23 0.90 1.02 0.19 0.15 0.31 0.23 /J 0.16 0.09 0.13 0.23 0.33 0.19 0.13 0.20 0.12 pmilk
2] 3.43 7.44 3.12 7.48 3.74 2.13 2.44 2.50 3.13
ilk aThe unit foi: parameters b 1 , b2 , b3 is pei (gear' per mei km · 2• The unit for parameter /J is y ·•. The unit for the transfer factor
~' is pei y (gear' per mei km·'l.
66. A representative value of P2 3 for dose commitment calculations can be derived from regression analysis of fallout and total diet data. However, only for a few localities is this combined information available for sufficiently long periods. The average of the values of P2 3 found with this procedure with the data from Argentina, Australia, Denmark and New York. is 5.7 pCi
130
y (gCa)-1 per mCi km-2• As alreadydiscuss~d. P23 can
also be assessed by estimating first the P/3 and then applying equation 3. The average of the values for Denmark and New York, estimated by this procedure. is 4.8 pCi y (gCa)-1 per mCi km-2
• It should be noted that both estimated values of P2 3 apply to areas of high-milk diets.
,..

160
140
120
7100
~ g E 80 .!! 0 :, O'
~ in
j 60
40
20
0
O Measured data
-- Fitted curve
0
1954 55 56 57 58 59 60 61 62 63 64 65 66 67 68 69 70 71 72 73 74
Figure VIII. Variation of•• Sr in milk in the Faroe Islands, Norway and San Francisco, 1954-1974 (22)
67. A less direct P!"Ocedure for estimating the value of P2 3 is to assess .P'f/k by regression analysis and then multiply this value by the ratio of the 9 0 Sr/Ca quotient in total diet to that in milk. This procedure is more uncertain because it requires the assumption that the diet-to-milk ratio would remain unchanged at the value observed in the past. On the other hand, the procedure makes it possible to estimate P2 3 for more regions, because of the availability of long serie~ of milk measurements. The range of the values of .PT;1k given in table 10, in pCi y (gCa)-1 per mCikm-2 , is 2.1-7.4. with an average of 3.3. This value, multiplied by an estimated average diet-to-milk ratio of 1.4, gives a value of 4.6 for the P2 3 factor in areas of high-milk diet.
68. Estimates of P2 3 are strongly dependent on the value of µ, the inverse of the effective mean life of available 9 0 Sr. The effect of this parameter is exemplified by calculations of P2 3 using the average values of b 1 , b2 and b3 of table 10 and a diet-to-milk ratio of 1.4, and withµ v.uying over the range defined by the highest value of table I O (0.33 y-1 ) and the value used in the 1966 and 1969 reports of the Committee (243, 244), which most probably is an underestimate (0.05 y-1
). These calculations give values of P23 in the range of 3-10 pCi y (gCa)-1 per mCi km -2 • As noted in paragraph 59, the 95% confidence limits on the estimated value of P23 for the New York diet are 4.3 and 6.4 pCi y (gCa)-1 per mCi km -2 •
69. For the purpose of assessing dose commitments from 90 Sr for the world population a value for P2 3 of 5 pCi y (gCa)-1 per mCi km -2 is used in this report. Th.is value gives adequate representation of areas of high-milk diet in the northern hemisphere; but it underestimates P2 3 for at least some areas of high-milk diet in the southern hemisphere. It could also underestimate P2 3 for other diets, including those for which there are no direct assessments. From the diet-to-milk ratios of table 7, weighted by the sizes of the populations with high-milk diets and low-milk diets, it can be shown that the above value for P2 3 could lead to underestimates of the dose commitment by a factor not exceeding two for populations with low-milk diets.
S. Strontium-90 levels in bone
70. New data on the 9 0 Sr/Ca quotient in bone are shown in table 11. Only a few data are available for 1974 and 1975, but in general they are slightly less than those observed in 1971-1972. Table 12 gives the 9 0 Sr/Ca quotients in adult vertebrae for some countries in the northern hemisphere from 1962 to 1974. For the most part the differences in the results are small, the values for adult vertebrae lying between I and 2 pCi (gCa)·1
• The values for Nepal and Norway seem to be significantly higher than the others.
131

TABLE 11. STRONTIUM-90/Ca QUOTIENT IN HUMAN BONE BY COUNTRY AND AGE
(The number in parentheses is the number of samples)
fpc; rrear• J
Age (y)
New- Adult born or bone Ref·
Country Year stillborn <I I 2 3 4 5-19 > 19 rypea erence
Northern hemisphere
Canada 1968 3.2 4.1 4.8 4.3 4.4 5.8 3.8 2.7 V (8) (86) (17) (16) (12) (4) (59) (38)
1969 2.5 4.0 5.0 5.1 4.4 4.2 3.3 2.2 V (6) (47) (5) (5) (4) (8) (48) (37)
Czechoslovakia 1966 2.2 3.3 3.5 3.3 3.8 3.0 2.9 1.8 V 245 (30) (63) (9) (8) (11) (5) (59) (103)
1967 1.6 2.8 4.1 3.8 2.9 2.9 2.8 1.9 V (31) (91) (20) (12) (12) (9) (63) (122)
1968 1.7 V (54)
1969 3.2 2.3 2.8 3.0 2.4 1.8 V (23) (9) (10) (10) (59) (62)
1970 1.2 2.2 2.7 3.8 3.1 2.8 2.6 1.8 V } (12) (14) (11) (9) (4) (5) (32) (106) 48 1971 1.0 1.9 2.2 1.7 1.3 2.0 1.5 V
(22) (16) (7) (6) (22) (53) (86) 1972 1.6 V } {54) 49 1973 1.4 V
(43)
Denmark 1969 1.2 1.7 2.4 2.1 1.8 1.9 1.3 V } (19) (33) (3) (1) (3) (36) (27) 245 1970 0.9 1.9 1.9 1.9 1.7 0.8 1.5 1.3 V
(18) (26) (4) (4) (4) (1) (31) (49) 1971 1.1 2.7 4.5 3.3 3.3 2.0 2.2 1.7 V
(5) (14) (1) (2) (1) (6) (40) (36) 1972 l.'9 2.4 2.2 3.1 1 .. 4 1.8 1.6 V
(16) (16) (1) (3) (1) (30) (14) 1973 1.9 2.0 0.8 1.4 3.2 1.6 1.5 V 2
(5) (3) (5) (5) (6) (38) (71) 1974 1.3 1.8 1.4 1.4 V
(3) (38) (39) (104) 1975 1.3 2.0 1.5 1.5 V
(1) (13) (32) (85)
Egypt 1968 0.4 V } (7) 245 1969 0.1 0.2 V
• (8) (14)
Fiji 1974 1.0 V 121 (12)
France (I) 1967 1.9 3.7 5.3 5.0 4.0 3.5 2.2 V
l (5) (53) (10) (5) (1) (41) (SS) 1968 1.6 3.2 4.4 3.7 3.9 3.8 2.8 2.3 V 245
(60) (102) (13) (9) (4) (6) (38) (88) 1969 1.6 3.2 3.7 3.1 3.6 3.0 l.8 2.0 V
(25) (87) (15) (12) (5) (6) (54) (105) 1970 1.6 2.7 2.9 2.6 3.2 2.3 2.1 1.9 V 139
(37) (73) (15) (11) (6) (15) (42) (132) 1971 1.6 2.4 2.9 2.1 2.6 3.8 2.3 1.8 V } (54) (67) (16) (9) (3) (3) (32) (153) 76 1972 1.2 2.1 2.1 2.0 1.6 V
(19) (33) (11) (31) (93) 1973 1.08 1.7 1.8 1.6 1.5 V
(23) (36) (18) (10) (109)
France (2) 1967 1.7 R
1968 (SS) 1.0 R 245
1969 (45) 1.3 R
1970 (61) 1.2 R (18)
132

Age (y)
New- Adult born or bone Ref·
Country Year stillborn <1 I 2 3 4 5-19 > 19 typea erence
Federal Republic 1968 1.2 2.4 2.8 2.5 1.8 } 245 of Germany (159) (25) (17) (34) (64)
1969 1.1 1.9 2.3 2.0 1.7 (98) (14) (10) (21) (40) R,S, V
1970 1.0 1.6 2.0 1.8 1.7 (94) (112) (12) (21) (36) J 55 1971 1.0 1.3 2.1 1.9 1.6 (30) (4) (4) (6) (12)
India 1973 0.9 0.9 V 122 (1) (10)
1975 2.3 120 (12)
Jamaica 1970 0.9 V (21)
Japan 1967 3.9 3.8 3.3 2.5 2.1 2.5 0.4 C (2) (2) (2) (1) (1) (21) (1)
245 1968 1.1 2.0 3.2 2.3 2.3 1.8 2.1 0.6 C (12) (31) (10) (4) (3) (3) (47) (13)
1969 0.7 1.5 2.1 2.6 1.5 0.6 1.4 0.7 C (30) (15) (5) (7) (7) (1) (26) (12)
1970 0.7 2.5 2.0 1.7 1.2 C (23) (1) (3) (14) (6)
1971 0.8 1.8 1.2 1.3 C 234 (37) (4) (20) (2)
1972 0.8 2.1 2.9 2.0 1.1 1.3 1.2 V 235 (30) (9) (2) (1) (1) (14) (10)
1973 0.7 1.3 1.5 1.3 1.2 V
} 236
(19) (4) (1) (10) (10) 1974 1.5 1.1 V
(10) (24) 1975 0.6 1.4 1.0 V
(29) (5) (22)
Nepal 1974 3.0 V
}121 (12)
1975 1.9 2.8 4.0 3.5 V (2) (1) (8) (30)
New Guinea 1974 0.5 V (12)
Norway 1969 2.6 3.5 4.5 4.7 3.4 V
)" (38) (13) (6) (9) (90)
1970 2.7 3.8 4.1 4.2 3.7 V (48) (15) (7) (19) (84)
1971 2.9 3.4 3.7 3.6 3.3 V (43) (26) (7) (20) (46)
1972 2.8 3.1 4.0 3.5 3.5 V (44) (15) (7) (20) (77)
1973 1.6 2.9 3.7 2.5 2.7 V
}67 (55) (17) (14) (20) (33)
1974 1.7 2.8 3.2 2.9 2.4 V (44) (9) (11) (22) (54)
1975 1.5 2.6 2.1 2.4 2.8 V 100 (31) (21) (10) (22) (100)
Senegal 1969 1.0 V (12)
1970 1.3 V (24) 245
Switzerland 1970 2.5 V (47)
1971 2.2 V (26)
1972 2.4 V 129 (45)
Thailand 1970 0.9 0.7 V
}245 (1) (6) 1971 0.7 0.5 V
(1) (5) 1973 0.7 0.5 V 122
(1) (10)
133

... TABLE 11 {continued}
Age (y)
New- Adult born or bone Ref-
Country Year stillborn <l 1 2 3 4 5-19 > 19 typea erence
Uganda 1970 1.1 V 245 (23)
USSRb 1968 1.7 2.4 3.0 2.2 1.2 N 259 (81) (19) (13) (224) (694)
1969 1.5 2.1 3.1 2.0 1.2 N
l (103) (30) (12) (288) (1142) 1970 1.4 2.4 2.9 3.1 1.4 N 260
(81) (32) (35) (329) (1 249) 1971 1.0 2.3 2.5 2.7 1.3 N
(55) (7) (8) (162) (867)
United Kingdom 1968 1.3 2.9 3.2 2.7 3.4 2.7 1.9 1.6 V 245 (101) (27) (9) (7) (4) (5) (73) (34)
1969 1.2 2.6 2.2 2.0 2.3 2.5 1.8 1.5 C
} (16) (46) (4) (6) (10) (3) (45) (32) 163 1970 1.2 2.1 2.4 2.4 2.2 1.9 1.6 1.3 V
(21) (56) (6) (9) (4) (10) (38) (18) United States
New York 1969 2.6 2.7 3.2 3.6 2.8 2.5 1.7 V } (23) (1) (2) (1) (2) (29) (25) 245 1970 2.5 2.8 2.4 2.1 1.6 V
(12) (1) (1) (20) (52) 1971 2.2 3.3 1.7 2.7 2.0 2.1 1.4 V 24
(8) (1) (2) (2) (3) (36) (56) 1972 1.6 3.4 2.9 2.7 2.6 1.8 1.4 V 26
(8) (2) (1) (1) (3) (33) (107) 1973 1.6 3.3 1.4 1.9 1.5 1.3 V 31
(15) (1) (1) (1) (23) (54) 1974 1.7 1.6 1.6 1.2 1.7 1.2 V 33
(7) (2) (1) (1) (11) (72) 1975 1.4 1.6 1.7 1.4 1.1 V 37
(7) (1) (2) (15) (42) ~
San Francisco 1969 1.4 1.6 1.2 1.5 1.0 1.3 0.9 V } (80) (5) (5) (4) (2) (21) (80) 245 1970 0.9 1.7 0.9 1.1 0.9 I.I 0.9 V
(74) (5) (1) (3) (1) (14) (46) 1971 0.7 1.8 1.2 1.5 1.4 1.1 0.8 V 24
(70) (3) (1) (3) (3) (11) (132) 1972 0.7 0.8 0.5 0.8 0.9 1.0 0.8 V 26
(83) (1) (1) (2) (1) (9) (119) 1973 0.7 0.8 1.3 0.8 0.8 V 31
(50) (1) (1) (1) (69) 1974 0.6 1.1 0.8 0.7 0.7 0.7 V 33
(40) (1) (1) (1) (8) (55) 1975 0.5 0.6 1.2 0.7 0.8 V 37
(36) (2) (1) (6) (50)
Venezuela 1969 0.8 V } (22) 245 1970 0.8 V
(23)
Southern hemisphere
Argentina 1969 1.3 1.4 1.2 l.3 --1.3-- --1.3-- v· } (19) (29) (9) (6) (9) (75) 245 1970 1.4 1.4 1.3 1.5 --1.4-- --1.3-- V
(9) (21) (12) (10) (11) (69) 1971 1.4 1.3 1.3 1.6 --1.3-- --1.2-- V
) (10) (20) (15) (17) (12) (75)
1972 1.4 1.3 1.3 1.5 --1.3-- --1.2-- V 21 (8) (21) (12) (15) (13) (71)
1973 0.97 V 1974 0.95 V
} 1975 0.9 1.0 0.9 1.0 1.0 1.0 1.0 1.0 V (8) (12) (7) (4) (6) (7) (12) (18) 71
1976 1.0 0.8 1.0 1.0 0.9 1.0 0.9 1.0 V Australia 1968 0.8 1.5 2.0 2.0 1.9 2.2 1.4 0.9 V } (79) (98) (26) (14) (8) (14) (75) (75) 245
1969 0.9 1.4 1.6 1.5 1.6 1.4 1.2 0.9 V (108) (98) (27) (11) (7) (13) (136) (112)
1970 0.7 1.4 1.6 1.5 1.2 1.2 1.1 0.9 V 10 (448) (182) (42) (34) (20) (13) (180) (246)
134

Age (y)
New- Adulr born or bone Ref-
Country Year stillborn <J 1 2 3 4 5-19 > 19 rypea erence
Australia 1971 0.8 1.6 1.8 1.6 1.3 1.2 1.1 0.8 V } 11 {continued) (413) {192) (32) (27) (21) (11) (162) (231)
1972 0.8 1.6 1.7 1.8 1.9 1.8 1.2 1.0 V (398) (143) (45) (19) (18) (13) (128) (143)
1973 0.7 1.1 1.5 1.7 1.4 1.3 1.0 0.8 V
} (264) (172) (27) (18) (21) (16) (129) (150)
1974 0.6 1.0 1.3 1.5 1.0 1.2 1.0 1.0 V 13 (348) (178) (25) (16) (19) (4) (83) (107)
1975 0.6 1.0 1.3 1.2 2.2 1.4 1.0 1.0 V (98) (55) (16) (9) (5) (2) (25) (21)
Brazil 1969 1.6 1.2 1.9 1.3 V } (1) (1) (5) (39) 245
Chile 1969 1.7 V (20)
Indonesia 1970 1.5 0.7 V } (2) (4) 119 1971 0.3 0.4 V
(1) (3) 1973 0.4 0.4 V
122 (1) (6)
South Africa 1966 to 1.1 1.3 2.0 0.5 R 245 1969
ay = vertebra, R = rib, S = sternum, C = composite, N = normalized to whole skeleton. bThe data up to age of 4 years refer to Moscow only, cMainly V.
TABLE 12. STRONTIUM-90/Ca QUOTIENT IN ADULT VERTEBRAE BY COUNTRY
Northern hemisphere, 1962-1975 (pCi (gCa) • 1
)
Year
1962 1963 1964 1965 1966 1967 1968 1969 1970 1971 1972 1973 1974 1975
Czecho-Canada slovak/a Denmark
1.2 0.8 1.7 1.2 3.1 1.8 2.4 3.1 2.2 2.7 2.6 1.8 2.6 2.5 1.9 2.1 2.7 I. 7 1.9 2.2 1.8 1.3
1.8 1.9 1.5 1.7
1.6 1.5 1.4
6. Transfer from diet to bone
France
2.2 2.1 2.2 2.3 2.0
1.8 1.6 1.5
71. The transfer factor linking diet and human bone P34 is defined by
f :a: Q (l) dt p 34 = ~--'----
f ~"' C (t) dt
(8)
where Q(t) is the 90 Sr/Ca quotient in bone at time t, averaged over the population, and C(t) is the corresponding quotient in the diet at time t, also averaged over the population.
Poland
1.4 1.6 2.5 2.5 2.9
USSR (Moscow)
1.7 2.4 3.1 2.7 2.3 1.7 1.7 1.4 1.2
Un/red Kingdom
1.9 2.2 1.6 1.6 1.5 1.3
United States (New York)
1.0 1.6 2.0 2.1 2.1 1.9 1.9 1.7 1.6 1.4 1.4 1.3 1.2 1.1
Mean
1.10 1.56 2.37 2.47 2.37 2.07 1.97 1.74 1.53 1.52 1.55 1.43 1.30
72. In the 1969 report of the Committee (244) it was shown that if the values of Q(t) and C(t) are evaluated for discrete intervals of time of duration h, they are interrelated by the equation
a)
Q (i) = I hC (ih-mh) K (mh) (9) m=O
where K(mh) is the transfer function discussed in the following paragraph. It is usual for Q( t) and C( t) to be determined for each calendar year, so in practice h has the value of 1 y. Equation 8 can be reformulated as
00 ""
L h I hC (ih-mh) K (mh) a,
p3~=i=-oo m=0
00 I hK(mh)
I hC (ih) m=O (lQ) i= - cc,
135

73. In the 1972 report (245) several types of transfer function were tried in regression analyses of bone and diet data. The best fits were obtained with a function consisting of a rate term plus an exponential function tenn, first proposed by Coulon and Madelmont (77), with h = I y:
K(m)=cc5m+gexp(-µm) (11)
where the first term is the rate term, accounting for that strontium in bone which is in rapid exchange with the plasma, the second term is the exponential term postulated to represent the values in bone after m years following a single intake, and Om is a function such that Om = 1 whenm =O, and Om = 0 whenm :I: 0.
74. The bone 90 Sr/Ca quotients were fitted to the corresponding diet quotients for data taken from Australia, Denmark, New York, San Francisco and also
to the average northern hemisphere data, using equation 9 and the transfer function of equation 11 (22). The 9 0 Sr/Ca quotient in the diet for the northern hemisphere was estimated by multiplying the corresponding values for milk (table 7) by 1.4.
75. The values of the parameters obtained by regression analysis are given in table 13, together with estimates of P34 obtained by the use of equation 10. Only the parameters for the Danish data have changed substantially since the 1972 report. and they are now more in line with those for other countries. Some comparisons of measured and predicted 9 0 Sr/Ca quotients in bone are shown in figure IX. The estimates of the transfer factor P34 vary little from one locality to another. The range of values shown in table 13 is 0.10-0.16, the average being 0.14.
TABLE 13. PARAMETERS OF THE TRANSFER FUNCTION OF 90 Sr BETWEEN DIET AND BONE
Obtained by regression analysis from data for various countries and areas
Parameter Australia Denmark
C (y·') 0.001 0.037 g (y "') 0.026 0.018 µ (y"') 0.22 0.20 P,,. 0.13 0.14
eo MMwreddo~ -- Fined curve
2
~ g E .!! 0 :, C,
~ ,i; g
1955 1960
United New York Kingdom City
0.017 0.035 0.021 0.28 0.28 0.15 0.10
0
1965
San Francisco
0.021 0.024 0.20 0.15
1970 1975
0.023 0.031 0.25 0.16
Figure IX. Variation of 9 0 Sr in bone in Australia and New York, 1955-1975
76. To account for the bone 9 0 Sr/Ca quotients in persons of all age groups, Bennett (36) has used an age-dependent transfer function. The 9 0 Sr/Ca quotient in bone at age i and yearn, Q(n. i}, is postulated to be
0 (n. i) = (ci+g.) C (n, i)+ - . (12)
+ [Q ( 11 - 1.i - 1 ) - c i _ 1 C ( 11 - 1, i - 1 )] e - .. ,
where C(n, i) is the 9 0 Sr/Ca quotient in the diet of persons of age i in year n, and c, and g; are age-dependent model parameters. Bennet (36) has fitted equation 12 to the New York and San Francisco bone data for all age groups. For children under nine years of age the parameter c; was found to be zero, consistent with a single exponential transfer model as originally proposed by Rivera (215). The best fit was obtained
136
with a turnover rate of 9 0 Sr varying from about I 00 per cent per year down to about 40 per cent per year in the pre-teenage years and then falling with age to about 20 per cent per year for adults. Beninson (18) had reported a similar variation in turnover rate with age from studies in Argentina. The fractional retention of strontium, i.e.. the fraction of dietary intake incorporated into the skeleton, was also found by Bennett (37) to vary with age, being five to seven times higher for infants than for adults.
77. As shown in Annex A, the transfer factor of a sequence of steps in series in the compartment model is the product of the transfer factors of each step. The transfer factor of 9 0 Sr between fallout and bone P2 3 4 can therefore be calculated as P2 3 4 = P23 P34 • Using the

average values estimated for both factors, the P234 is calculated to be 0.7 pCi y (gCa)-1 per mCi km-2
• This value is about 30 per cent higher than the one used in the 1972 report of the Committee, but due to the uncertainties involved in the calculations, this difference is not regarded as significant.
7. Transfer factor relating bone activity level and dose
78. In the compartment model described in paragraph 2, the transfer factor linking tissue radioactivity to tissue dose is P4 5 • The value of this factor for 9 0 Sr can be deduced from the following dosimetric considerations: The dose rate per unit beta activity in a small tissue-filled cavity in bone, Do, has been formulated by Spiers (225) as:
Do= Nm E (Sr/SB)m (KB/Kr)
where Nm= 1.17 106 M- 1 y·1 per pCi (gCa)·1 is the number of beta particles emitted per year and unit mass of bone for each unit of the 9 0 Sr/Ca quotient. M being the mass of bone per unit mass of calcium (M""' 5) ( 160, 252); E is the effective energy of the beta rays emitted {for 90 Sr+ 90 Y, E= 1.13 MeV); (ST/Ss)m is the ratio of mass stopping powers in tissue and in bone = 1.07 ( 41 ), and K sand KT are the ratios of the effective range to total track length of beta particles in bone and soft tissue. respectively. They are assumed in this case to be unity (83). The dose-rate factor is therefore Do = 4.5 mrad y·1 per pCi (gCa)·1
•
79. In order to obtain corresponding values for Dm and D5 , the dose rate factors for bone marrow and for bone lining cells, which are the desired P4 s transfer factors, use can be made of the Dm/D0 and DJb0 ratios estimated for cortical and trabecular bone by Spiers (226). These values are:
Dm/D0 i>Jb0
Cortical contribution 0.055 0.082 Trabecular contribution 0.260 0.352
Total 0.32 0.43
The transfer factors P45 are therefore estimated to be:
P4s (marrow) = (Dm/D0 ')D0 = 1.4 mrad per pCi y (gCa)·1
P45 (bone lining cells) =
(DJboWo = 1.9 mrad per pCi y (gcar1•
8. Dose commitment from strontium-90
80. The dose commitment from 90 Sr released by nuclear explosions can be assessed using the environmental compartment model described in paragraph 2. The dominant exposure pathway is dietary intake, inhalation being completely negligible in comparison. The dose commitment De is related to the integrated deposition density F of 9 0 Sr by the following expression:
where P2 34 is the transfer factor linking integrated deposition density and the time-integral of the 9 0 Sr/Ca quotient in bone (para. 77) and P 4 5 is the transfer factor linking the 9 0 Sr/Ca quotient in bone to the dose rate in the bone marrow or in the bone lining cells (para. 79).
81. The integrated deposition density in each hemisphere from all nuclear explosions to the end of 1975 can be calculated by applying the population weighting procedure described in paragraph 47 to · the data presented in table 3. The results are (mCi km-2
):
Entire hemisphere Temperate zone
Northern hemisphere
56.5 85.1
Southern hemisphere
17.6 24.5
82. Table 14 presents the dose commitment from 90 Sr to the populations of .each hemisphere and to the populations of the temperate latitudes of each hemisphere.
TABLE 14. DOSE COMMITMENTS TO BONE TISSUES FROM 9 0 Sr PRODUCED L~ ALL NUCLEAR EXPLOSIONS UP TO THE END OF 1975
(mrad)
Northern hemisphere Southern hemisphere
Tissue
Bone marrow Endosteal cells
Temperate zone
85 116
83. The dose commitments to the world population, calculated from the global mean integrated deposition density given in paragraph 47, are 52 mrad for bone marrow and 71 mrad for bone lining cells. As the total activity of 90 Sr released to the environment by nuclear tests is approximately 16 MCi ( table 2), the collective dose commitments per unit activity of 9 0 Sr released, assessed by the procedures outlined in Annex A. are
Populationweighted average
56 77
Temperate zone
24 33
Populationweighted average
17 24
approximately 13 man rad Ci-1 for bone marrow and 18 man rad Ci-1 for bone lining cells, for the geographic pattern of past nuclear tests.
G. STRONTI~-89
84. Strontium-89 has a half-life of 50.5 d and decays with the emission of a beta particle with maximum
137

energy of 1.46 MeV. It is one of the main components of fallout activity in the first few months after a nuclear test. It has been extensively measured in fallout since 1961 (111); the latitudinal distribution of the integrated deposition density is shown in table 15.
TABLE 15. LATITUDINAL DISTRIBUTION OF ' 9 Sr INTEGRATED DEPOSITION DENSITY, 1961-1963
Relative Area population Integrated
Latitude of band of band deposition density band (10 6 km 2
) (%) of 19Sr (mCi km" 2)
70°-80°N 11.6 -o 34 60°-70°N 18.9 0.4 210 50°·60°N 25.6 12.2 250 40°-50°N 31.5 13.8 326 30°-40"N 36.4 18.2 288 20° -30"N 40.2 29.2 218 HI" -20"N 42.8 9.8 121 0°-lO"N 44.1 5.6 I 04 0°-10" S 44.1 5.8 88
10° -20° s 42.8 1.8 9 20° -30" s 40.2 1.6 19 30°-40° S 36.4 1.4 II 40"-50" S 31.5 0.1 II 50"-60" S 25.6 0.05
Source: Reference 111.
85. Strontium-89 was measured in milk at some 63 cities in the United States between 1962 and 1966 (204). The time-integral of the concentration for this period was 95.5 pCi y 1-1 • O'Brien (195) has estimated the transfer factor P34 linking the time-integrals of the 8 9 Sr/Ca quotient in milk and in human bone. Using the infinite time-integrals of the retention functions, for cancellous bone for 8 9 Sr and 9 0 Sr presented in the ICRP alkaline earth metabolic model ( 160), it was estimated that the transfer factor Prl'k for 89 Sr is 0.022 of the total diet P23 for 90 Sr. O'Brien (195) estimated the factor P45 for 89 Sr to be 0.71 mrad per pCi y (gCa)- 1
, which, using a value of0.14Jor~eP34
of 9 0 Sr. leads to a combined factor Pr41~k of
0.0022 mrad per pCi y (gCa)- 1• With the above
time-integral of the 8 9 Sr/Ca quotient in milk, the per caput bone-marrow dose in the United States between I 961 and 1966 is estimated t.o be 0.21 mrad.
86. Relating this value to the relevant integrated deposition density of 8 9 Sr. it is estimated that the bone marrow dose commitment to the population in the temperate zone of the northern hemisphere from all tests up to 1970 is approximately 0.4 mrad.
87. As the ratio of activities 8 9 Sr/9 0 Sr at the time of fission is aprroximately J 85 (62). the total atmospheric input of 9 Sr is estimated to have been about 2.8 109 Ci. The collective dose commitment to the bone marrow per unit activity release of 8 9 Sr, calculated by the procedures outlined in Annex A is approximately 4 10-4 man rad Ci-1 for the past pattern of nuclear explosions.
H. RUTHENIUM-106
88. Ruthenium-106 has a half-life of 365 days and decays to 1 0 6 Rh by pure beta decay with a maximum energy of 0.039 MeV. The 30-s half-life 106 Rh decays with a maximum beta energy of 3.45 MeV and also emits several gamma rays.
138
89. The time-integral of the concentration of 106 Ru in air can be estimated from that for 14 4 Ce given in table 20. Cerium-144 has a half-life of 285 d, so that the 106 Ru/144 Ce activity ratio will only change with a half-time of about 3.5 y. The ratio of the integrated deposition densities of 106 Ru and 1 44 Ce was 0.51 for Chilton, United Kingdom, 1967-1970 (61) and 0.53 for Pittsburgh, United States, 1961-1963 (110), and at Bombay, India, 1966-1969 (102), the ratio of the time-integrals of the activity concentrations in air was 0.38. Assuming a value of 0.50 for the ratio of the time-integrals of the activity concentrations in air of 106 Ru and 144Ce, and using the estimates for the latter. time-integral for 106 Ru is estimated to be 1.5 pCi y m - 3
in the northern hemisphere and 0.35 pCi y m -3 in the southern.
90. Assuming that the activity is present as an aerosol of about 0.5-µm particle size and using the lCRP lung model ( 135, 136) with class Y parameters, the transfer factor between activity in air and Jung dose P, 4 5 is estimated to be 27 .2 mrad per pCi y m -3 for the dose to the pulmonary region of the lung. The resulting dose commitments to the pulmonary region from all tests to the end of 1975 are respectively 41 and 10 mrad in the northern and southern hemispheres.
91. The total injection of 106 Ru. assessed from that of 9 0 Sr using the corresponding activity ratio at the time of fission, has been about 3.3 108 Ci. Using the procedures described in Annex A, the collective dose commitment to the lung per unit activity of 10 6 Ru released is estimated to be about 0.4 man rad Ci-1 for the past pattern of nuclear explosions.
I. IODINE-131
92. lodine-131 is a beta emitter with a half-life of 8 d, and a maximum beta energy of 0.81 MeV. with the emission of gamma rays of 0.72 and 0.36 MeV and other energies. Due to its short half-life, 1 31 I is present in the long-range tropospheric fallout only shortly after atmospheric detonations. It is unlikely that the clouds of radioactive debris become well mixed during periods comparable to the mean residence time of an aerosol in the troposphere. The concentration of 1 3 1 l in surface air at a particular location, therefore, will depend strongly on meteorological conditions and will not necessarily be representative of a latitude band or even of a large region.
93. Fresh milk dominates as a source of 13 1 I intake in areas where it is a major diet component, because of the large areas scavenged by the grazing animal and also because of the short storage period of milk. The transfer of 1 3 1 I from deposition on grass to milk has been estimated from laboratory experiments (97) and from fallout field measurements (17), and varies widely, depending mainly on the density of the herbage and on cattle-feeding practices. Table 16 gives the reported time-integrated concentrations in milk over the period 1966-1974 in a number of countries, mainly in the southern hemisphere, and some 1976 data from France and Japan. The values reported for the southern hemisphere in 1974 were higher than those in 1972 and 1973 and approached the levels observed in the years 1967-1971.

-~~
TABLE 16. CONCENTRATION OF' 31 I IN MILK AND THYROID DOSE TO INFANTS AT VARIOUS LOCATIONS, 1966-J 974a
Integrated milk concentration (nCI d 1- 1) Calculated thyroid dose to i11fa11ts (mrad)
Location 1966 1967 1968 1969 1970 1971 1972 1973 1974 1966 1967 1968 1969 1970 1971 1972 1973 1974
Northem hemisphere
Japanb, c Chiba 0.42 2.75 0.37 0.9 5 32 4 10 Miyagi 1.2 14
United Kingdomb, c 0.60 7 United States
Sebastian Cityc 9.3 107 Houstonc 3.7 43 Nashvilleb, c 0.90 JO
Southern hemisphere
Argentina Barilochc 7.6 1.4 4.9 88 16 56 Buenos Aires 27 4.3 2.5 4.6 4.17 7.0 1.7 8.5 310 50 28 52 48 81 20 97 Salta 15 1.8 6.9 174 21 79
Australiac Malanda
(highest)d II 10.4 4.5 5.8 5.4 0.17 0.05 2.47 127 120 52 67 62 2 0.6 28 Hobart-
Launcestone 1.5 0.38 0.79 0.86 0.35 0.04 0.04 0.34 17 4 9 10 4 0.4 0.4 3.9 Country average 0.02 0.07 0.78 43 10 16 15 13 1.3 0.8 9.0
Bolivia La Paz 11 2.4 5 3.0 120 30 44 60 35
Brazil Guanabara 3.6 42
Chile Santiago 4.0 3.0 5.2 1.9 0.3 2.1 50 9 10 30 60 22 3 24
Colombia Bogota 0.4 0.4 0.4 0.9 0.7 1.5 0.1 5 5 10 10 8 18
Ecuador Quito 2.5 0.3 1.3 30 10 15
Piji 18! Suvac 2.9 4.4 3.7 2.9 0.4 0.4 2.4 210 33 51 43 33 5 5 28
Madagascar Diego-Suarez 13 1.8 6.5 6.4 160 22 80 75
New Caledonia Noumea 0.4 3.5 2.6 16 5 40 30 184
w New Zcalandc 1.5 0.4 0.7 0.7 0.4 0.4 0.4 0.4 17 5 8 8 5 5 5 5 \0

-,ll> 0
TABLE 16 (continued)
Integrated milk concentration (nCi d r') Calcula tcd thyroid dose to in/ants (mrad)
Location 1966 1967 1968 1969 1970 1971 1972 1973 1974 1966 1967 1968 1969 1970 1971 1972 1973 1974
Southcm hemisphere (continued)
l'cru Arequipa 6 7.5 2.9 16 70 90 35 Lima 6 4 2.1 70 23 50 10 13 Tacna 10 1.2 120
Samoa Apia 15! 8.4 3.3 6.2 7.3 0.4 l.1 4.4 170 97 38 71 84 5 13 51
Society Islands Tahiti 4.7 4.9 11 18 1.0 11 59 55 60 130 210 12 130 680
South Africa Cape Town 1.5 17 Pretoria 8.0 11.1 92 127
a There are 1976 data: France (0.91, JO); Japan: Fukushuma (0.95, 11 ), Chiba (0.36, 4), Fukoku (0.33, 4 ). The first figure in the parentheses is the integrated milk co11ce11tration and the second is the thyroid dose, in the same units as in the table.
bThe integrat"d concentration Iias been taken to be numerically equal to 10 times I.he highest observed concentration in nCi 1-•. cThe dose Is assumed to be the time-integrated concentration multiplied by 11.5 mrad pCi-1 d- 1 1. din 1973, the highest integrated milk concentration was measured at Perth (0.27 nCi d 1-• ). eLowcst. !value based <>nan extrapolation.
~

94. As 131 I concentrates in bovine thyroid. this organ is a suitable biological indicator of the presence of 131 I in the local environment. Beninson {19) measured the concentration of 131 I in bovine milk and thyroid in Argentina during the period 1966-1970. The ratio between the time-integral of the 131 I concentration in thyroid and that in milk was fairly constant for the different years and had a value of about 500. Monitoring of 1 31 I in bovine thyroid carried out in Czechoslovakia ( 66) confirms the very high sensitivity of this method of surveillance for 1 3 1 I in the environment.
95. Infants receive higher doses in their thyroids than do adults for a given intake of 131 I, the main reason being the smaller thyroid mass. A mass of 2 g was used for estimating doses to infant thyroids. Estimates of the dose in infant thyroids per unit activity of 13 1 I reaching the organ range from 15.5 to 18.5 mrad nCi-1 (179, 189), and a value of 16.5 was used in the 1972 report of the Committee. Assuming that infants consum~ 0.7 I of fresh milk per day and that all the 1 3 1 I ingested is taken up by the thyroid. the P345 transfer factor (relating thyroid dose in infants to the time-integrated iodine-131 concentration in milk) can be estimated to be about 11.5 mrad per nCi d 1-1
•
96. Table 16 presents estimates of the dose in infant thyroids, as calculated with the assumptions mentioned above. They should be regarded as the highest individual doses in the areas for which the assumed consumption is realistic, and as clear overestimates in areas such as the Society Islands where fresh cow's milk is only a small fraction of the total milk consumed by infants. The dose to adults should be at least an order of magnitude lower, because the mass of their thyroids is about ten times larger, and their milk consumption is smaller.
J. CAESIUM-137
97. Caesium-137 is a beta emitter with a maximum beta energy of 1.17 MeV, which decays with the emission of gamma rays of0.66 MeV. It has a half-life of 30 y, very close to that of 90 Sr, and since the measured activity ratio of 1 37 Cs/9 ° Sr in deposition at many sites and over a long time has been fairly constant at about 1.6 (245), it is useful to use the more complete data on 9 0 Sr to estimate the deposition of 1 3 7 Cs. In this way also the latitudinal distribution of 137 Cs integrated deposition density can be estimated from the 9 0 Sr data of table 3.
1. Caesium-137 in the environment
98. Since the half-life of 1 3 7 Cs is relatively long, the assessment of dose commitments requires the understanding of the behaviour of this radionuclide in the environment. A recent review of the literature on this subject has been publi,<;hed by Moiseev et al (262). The deposition of 1 3 7 Cs occurs over land and over the oceans. As in the case of 9 0 Sr, it has been found that fallout over land is the more important pathway as far as dose commitments to man are concerned.
99. After deposition over land, caesium-137 enters the dietary pathway, being taken up by plants either through the root system or by direct uptake by the
leaves. Caesium-137 seems to become more strongly fixed in the soil than 90 Sr does (14, 114, 159,267), but its availability to plants depends markedly on the soil type and has been found to decrease in time (256). In a sandy soil in Massachussetts (United States), Hardy {114) found that 84 per cent of the fallout 1 37 Cs was in the top 4 cm of soil. and 97 per cent was in the top 31 cm. Marei et al ( 159) have identified regions in the USSR where the soil is wet, peaty and podzolic, from which the transfer of 1 37 Cs into the food chain is 10 times higher than for other regions. Other regions of the world where there are soils giving rise to high 1 3 7 Cs transfer into diet have also been identified, for example. in the Faroe Islands (3), New Zealand (188) and Sweden ( 151 ). The mechanism of such enhanced transfer has also been studied (94). Much smaller amounts of 137 Cs than of 90 Sr are leached out of the soil to enter rivers and lakes.
100. Regarding deposition of 13 7 Cs on the oceans, measurements made on sediments of the Atlantic Ocean indicate that only about 3 per cent of the fallout 137 Cs has reached the bottom ( 193). Activity concentrations in surface waters of the open ocean are about 0.2 pCi 1-1 (46). and in the deep ocean they are lower by a factor of about 30. Hodge et al (127), from measurements of 1 3 7 Cs concentrations in Pacific tuna, estimated the half residence-time of 1 3 7 Cs in surface waters to be about 17 y.
101. Marine food chains seem to be of secondary importance in relation to human intakes. The reported concentration factors between sea water and mose biota are about 50 (93, 191, 214, 240). It has been estimated that in Japan, between 1966 and 1971. only about 8 per cent of the dietary intake of 137 Cs came from the consumption of fish products (240).
2. Levels in diet
102. Since 137 Cs is an alkali metal like potassium. and since the concentration of potassium in lean body mass is constant (225), it is convenient to express the 1 37 Cs activity in food and in the human body as the 1 3 7 Cs/K quotient, usually in picocuries per gram. Data on the 1 3 7 Cs concentration in milk and on its daily intake from the total diet are shown in tables 4 and 6. Data available for 1973 and 1974 indicate that, generally speaking, levels are still falling. The transfer of 1 3 7 Cs from deposition to diet is normally high during the first year after deposition and relatively small subsequently. Concentrations in milk are strongly dependent on deposition in the same year. That explains why in the northern hemisphere the milk concentrations on the average decreased from 1966 to 1969, were relatively stable from 1969 to 1971, and decreased again from 1971 to 1973.
103. The transfer of 1 37 Cs from deposition to diet can be studied quantitatively using an approach similar to that for 9 0 Sr (paras. 55-69). The measured 1 37 Cs/K quotients in the various components of the Danish diet are plotted against time in figure X (2). Evans and
141

T ;;: 2 u .e ~ c :,
" "' ~ !:!
142
O Measured data --- Fitted curve
7
60
50 Milk
b, • 2.17 40
b1 • 1.48 b1 • 0.05 30 µ = 0.07 Pu • 4.30
20 W; = 020
0 0 10
o
Vegetables 20 0 b, • 0.63
b, =O b1 = 0.006 µ • 0.02 Pn = 0.92
10 Wi = 0.37
ol
30J Fruit
b, • 0.81
20 I b, • 0.55 b, • 0.08
J µ = 0.3 P,, = 1.59 WJ = 0.09 I 0
ol 0
j I
~ 4001
J I
300
Grain products
b, = 2.36
200 b1 • 17.02 b, 0 µ 0 P,, 19.4
Wi 0.09 100
160
140
120
100 Meat
b, 4.45 80 b1 0
b, = 17.3 60 µ 1.6
P:1 8.8
40 w, 0.17
20 0 0
I 1955 56 57 58 59 60 61 62 63 64 65 66 67 68 69 70 71
Figure X. Variation of 1 '
1 Cs in various diet components in Denmark, 1955-1974. The unit for parameters b,, b1
, b3
is pCi (gK) •1 per mCi km -2
• The unit for parameter µ is y · 1• The unit for the transfer factor P
1 3 is pCi y (gK)"' per
mCikm· 2•
•

TABLE 17. PARAMETERS OF THE TRANSFER FUNCTION BETWEEN '31Cs FALLOUT AND DIET
Obtained by regression analysis from Danish data
Meat, Total ,Wilk Grain rish, Vege- composite
Paramete,a products products eggs tables Fruit diet
b, 2.17 2.36 4.45 0.63 0.81 1.56 b, 1.48 17.02 0.0 0.0 0.55 2.21 b, 0.05 0.02 17.24 0.006 0.08 0.04 µ 0.07 0.0 1.60 0.02 0.30 0.12 P/, 4.32 19.38 8.80 0.92 1.59 4.08 J~ . 0.20 0.09 0.17 0.37 0.09 1.00 WjPf, 0.86 1.74 I.SO 0.34 0.14 4.08
Total diet P23 4.58 4.08
a The unit for parameters b,, b1, b
3 i~ pCi (gK) -• per mCi km -l. The unit for parameterµ is
y-•. The unit for the transfer factor P/3 is pCi y (gKr' per mCi km - 2• W; is the fractional
contribution of component j to the total K diet.
Bennett (86) have carried out a regression analysis using these data and the annual deposition data, with a transfer function of the same form as that shown in paragraph 58 for 90 Sr. The figure also shows the curves fitted to the data with the parameters given in table 17. In Denmark the main contribution to the intake of 137 Cs has been from meat and grain products, with a sizeable contnlmtion from milk. Fruit and vegetables contribute much smaller amounts. The same is true of Chicago (United States). In Japan. however, the main contribution has been from cereals (240). For ail foods the transfer seems to be rapid, being essentially completed within the first two years after deposition.
I 04. The same transfer function was also fitted to the 1 3 7 Cs/K quotients in fresh milk in several countries. and the resulting par~eters are shown in table 18. The transfer factors />T;l1k linking deposition density and the time-integrated 137 Cs/K quotient in rru1k for Argentina. Australia, Faroe Islands, New Zealand, Norway and USSR are significantly greater than those for Denmark and the United States. The value reported for Finland, 15.8 pCi y (gK)-1 per mCi km-2 (65), is also in this higher range. It should be noted that parameters relating to Denmark in table 18 are for fresh milk. while those in the first column table 17 refer to milk products.
105. The results of the regression analysis for the estimation of P2 3 , or its components such as J>Tlk. are consistent with the assessments carried out by the Committee for its 1969 and 1972 reports (244,245). A value of 4.1 pCi y (gK)-1 per mCi km-2 was estimated in these reports for the factor P2 3 • identical with that shown in table 17, which was derived by regression analysis. The. same value, rounded to 4 pCi (gK)-1 per mCi km -2
, will be used in this report for the purpose of assessing dose commitments from 137 Cs for the world population. This value of the transfer factor adequately represents some areas in the northern hemisphere, but on the available evidence discussed above, it would appear to underestimate P2 3 for other areas. especially in the southern hemisphere.
106. The latitudinal distribution of 1 37 Cs deposition density in 1972 ( assessed from the 9 0 Sr data assuming a constant 137 Cs/90 Sr activity ratio) is shown as the curve in figure XI. Also shown in figure XI are the 1 37 Cs concentrations in milk in 1972 at various localities. The 1 3 7 Cs milk concentrations for a number of them depart markedly from a general correlation with the deposition data. Since data on 1 3 7 Cs concentration in foods are not available for many areas of the world, particularly in the tropical regions, it is not possible to assess what the importance of this effect might be on the global scale.
TABLE 18. PARAMETERS OF THE TRANSFER FUNCTION FROM' "Cs FALLOUT TO MILK
Obtained by regression analysis of data for various countries and areas
Faroe New United United Paramete,a Argentina Australia Denmark Islands Zealand Norway USSR Kingdom States
b, 2.21 7.24 2.37 6.80 6.79 3.52 4.43 1.75 2.28 b, 0.00 4.78 0.69 5.44 0.68 2.26 0.22 1.61 1.34 b, 1.80 0.30 0.06 2.83 3.62 2.63 0.31 0.03 0.00 µ 0.27 0.18 0.30 0.17 0.51 0.24 0.18 0.023 0.05 pmilk
23 8.02 13.59 3.23 27.51 12.91 15.48 6.22 4.75 3.63
·tk aThe unit for parameters b 1 , b 2 , b 3 , is pCi (gK)- 1 per mCi km-,. The unit for parameterµ is y-•. The unit for the transfer factor ~~ is pCi y (gK)- 1 per mCi km -l.
143

• Fa roe Islands
• Society Islands
' r:; -= "' ..J
i !': u :l 0 z 0 ;:: < "' ... z w c., z 0 u
100
90
80
70
60
50
40
JO
20
10
9
Australia
• Argentina
e Maninlque
• French Guiana
• Jamaica
• Florida (USA)
Japan
Federal Republic of Germany
1.0
0.1
I' E ,. u .§. >-... .;; z w 0 z 0 ;:: .;; 0 ~ w 0
u ;
ro•s 60"S 50'5 -S JO<S 20'S IO'S Equ,to< 10''1 20"'1 30"'1 40''1 50'N IIO"N 'IO'N
LATITclDE
Figure XI. Latitudinal distribution of 1 3 7 Cs deposition density (curve) and the concentration of' "Cs in milk at nrious locations (dots and segments), 1972
3. Caesium-137 in the human body
I07. Caesium-137 ingested by man is distributed in the body, with about 80 per cent being deposited in muscle and 8 per cent in bone (225). About 10 per cent of the activity taken in is eliminated rapidly, with a biological half-life of about 1 d. while the remaining 90 per cent is excreted at a lower rate (225). The biological half-life of this main fraction varies between less than 50 d to more than 200 d in adults ( 43, 124, 245) and is shorter in children than in adults ( 124). Owing to this relatively short biological half-life, the activity of 1 3 7 Cs in the body tends to follow the fluctuations of the concentration of 1 3 7 Cs in the diet.
108. Table 19 summarizes the information on 137 Cs/K quotients in the human body in the period 1964-1974. For all localities. the values have continued to decrease
144
since the 1972 report of the Committee. The 1 3 7 Cs/K quotients in subarctic populations are between two and three orders of magnitude higher than those in the middle latitudes, as shown by data from Finland, Norway and Sweden and from the northern USSR and United States (Alaska) (123. 200. 210, 238, 250). These high values are due to the lichen-reindeer (or caribou) food chain (245).
109. The short biological half-life of caesium in the body makes it possible to assess the transfer factor between diet and body P3 4 from the 1 37 Cs/k quotients integrated over a few years. Using this procedure, an average value of 3 is derived from the data of tables 6 and 19 converted into 137 Cs/K quotients. which is practically identical to the value used in the 1969 and 1972 reports, namely 2.9.

·-~ --_____ ...,.._ __ _
TABLE 19. CAESIUM-137/POTASSIUM QUOTIENT JN THE HUMAN DODY (pCi (gKJ • 1
)
Apg,roximate /at tilde Ref-
Locat/011 (degrees Nor S) Sex 1964 1965 1966 1967 1968 1969 1970 1971 1972 1973 1974 1975 ere11ce
Northern hemisphere
Belgium 50 M,F 158 135 87 50 29 244 Canada (Ottawa) 45 M,F 170 175 Denmark 55-60 M,F 185 168 106 65 46 40 23 13 16 11 10 11 2 Egypt 30 M,F 23 14 12 181 Finland 60 M,F 182 150 107 72 53 44 34 38 37 28 29 231,232 France 50 M,F 227 194 93 64 36 32 26 28 28 21 lR 17 198 Germany, Fed. Rep. of
Karlsruhe 49 M,F 151 111 81 49 27 16 15 15 17 11 9 12 Diisseldorf 51 M 243 186 128 76 41 32 31 22 30 23 19 15 52
Israel 35 M 48 Japan 30-45 M 93 77 54 33 20 14 13 16 12 10 9 8 186, 239 Norway 60 M,F 430 290 132 Poland 50-55 M,F 164 185 71 152 Sweden (Stockholm) 60 M, r 205 187 139 107 74 54 47 46 38 31 22 233 Switzerland (Geneva) 45 M 206 179 103 54 30 24 21 23 19
F 139 121 66 41 26 19 18 22 19 129 USSR
Moscow 55 M 258 50 34 29 38 266 F 42 27 22 36 265
Leningrad 60 M,F 174 142 92 68 70 United Kin~dom
London area so M 148 89 45 101 F 149 109 60 33
West Cumberland 55 M 257 190 110 52 30 United States
Country average 25-50 M,F 141 109 60 35 17 104 Florida 25-30 M,F 149 132 120 216
West Berlin 52 M,fo 68 49 47 36 29 25 19 JO 11 52
Canada S11barctic region
Eastern (Eskimos) 60-70 M 5 800 42 Central (Eskimos) 60-70 M 11 OOO
Finland 123 lnari (reindeer
herders) 70 M 7 800 9 OOO 7 800 S 500 5 200 3 400 3 100 4 100 F 8 800 11 200 7900 3 800 4 200 3 600 2 800 3 300
USSR Murmansk 65-70 M 14 OOO 18 OOO 25 SOO 17 500 16 500 15 500 12 500 11 SOO 9 OOO 238
United States Alaska 65-70 M 9 100 6 600 4 900 4 300 2400 210
So11thcrn hemisphere
Argentina 35-40 31 20 16 13 15 14 12 10 9 4 21, 71 - Australia 30-40 65 42 37 18 16 30 25 17 11 "'" v,

110. An alternative approach for the derivation of P34
is the assessment by regression analysis o( the parameters of a postulated transfer function relating diet to body. Applying this procedure to the data from Denmark and the United States. and assuming a single exponential transfer function. the estimated values of P34 are 2.6 for Denmark and 3.0 for the United States (86), in good agreement with the value of 3 mentioned in paragraph 109.
4. Dose commitment from caesium-137
111. The combined transfer factor P234 . linking deposition to the 1 37 Cs/K quotient in the body, is the product of P2 3 and P34 • From the estimated average values for these two factors (paras. I 05 and 109), a value of 12 pCi y (gKf 1 per mCi km -2 is calculated for the combined factor P2 34 •
112. An alternative procedure for the assessment of P234 is the direct use of the time-integrated 137Cs/K quotient in the body fQdt and the integrated deposition density F, both over the same period of several years, the factor being P234 = (fQdt)/F This procedure. applied to data from Argentina in the period 1966-1974 (16, 21), estimates the factor P234 to be 11 pCi (gK)- 1
r;r mCi km-2• For Stockholm the time-integrated
37 Cs/K quotient in the body in the period 1962-1972, is 1053 pCi y (gK)- 1 (244, 245), while for the same period the integrated deposition density of 1 3 7 Cs in the region (at Tumba. near Stockholm) is 58 mCi km -l.
This gives a value of P234 of 18pCiy(gK)-1 per mCi km -2
, about 50 per cent higher than the average estimate given above. Aarkrog estimated P2 3 4 in Denmark by regression analysis from the body 1 3 7 Cs/K quotients and the annual deposition densities, obtaining a value of about 11 pCi y (gK)-1 per mCi km -2 (2).
113. The transfer factor P2 3 4 could vary mainly as a result of variations of P2 3 with the local conditions, particularly soil characteristics (para. 99) and the nature of the diet. In the 1972 report (245), the Committee assessed the possible range of P2 3 values. based on USSR data and the conservative assumption that available 1 37 Cs decreased only by radioactive decay. This range, multiplied by the value of P34 given in paragraph 109, implies that P2 34 would be smaller than 22 pCi y (gK)- 1 per mCi km -2
• The use of a value of 12 pCi (gI()- 1 per mCi km -2 for P2 34 (para. 112), for the purpose of assessing dos~ commitments, could therefore not underestimate these commitments by a factor of more than two.
114. As was shown in the 1969 report of the Committee (244 ), the transfer factor P 4 5 , linking tissue activity and tissue dose, is approximately independent of a~e if expressed as dose per unit of the time-integrated 1 7 Cs/K quotient. The value of P4 5 = 1.8 10-2 mrad per pCi y (gK)- 1
, combined with the estimate of P2 34 = 12 pCi y (gK)-1 per mCi km-2
, gives a value for the overall transfer factor P2 3 4 5 of about 0.2 mrad per mCi km-2
•
115. The integrated deposition density of 1 3 7 Cs can be assessed from that of 90 Sr (paras. 47 and 81), using an activity ~atio of 1.6 (para. 97). The values are
146
(mCi km -:i ): temperate latitudes of the northern hemisphere. 136; temperate latitudes of the southern hemisphere. 39: global value weighted by the population distribution. 84. The resulting dose commitments are respectively 27 and 8 mrad for the populations in the temperate latitudes of the northern and southern hemisphere and 17 mrad for the world population.
I 16. It is to be noted that the above dose commitments are based upon information obtained in areas where 1 3 7 Cs in the soil becomes unavailable to plants fairly rapidly. For populations consuming food from other types of soil, the dose commitments could be higher (para. 113), and for people in the subarctic regions eating reindeer and caribou meat. the dose commitments . are indeed much larger. Assuming, however, that the contribution of such different situations to the total collective dose is not large, it can be estimated that the collective dose commitment from internal exposure, per unit activity of 1 3 7 Cs released, is of the order of 3 man rad Ci- 1 for the past pattern of nuclear explosions.
K. CAESIUM-136
117. Caesium-136 is a beta emitter with a half-life of 13.5 d. The maximum beta energy is 0.66 MeV, and several gamma rays with energies up to 1.25 Mev are emitted. Since it must be produced directly by fission and not by beta decay, because 136 Xe is stable, the activity produced in nuclear tests is fairly small. By using the 1 3 6 Cs/14 0 Ba fission yield ratio and the depositionto-milk transfer factors of 137 Cs and 140 Ba, O'Brien (195) has estimated the integrated deposition density of 136Cs and the time-integrated concentration in milk in the United States between 1961 and 1965. These calculated values agree roughly with the few measurements which have been made of 136 Cs (177). The time-integrated concentration in milk in the United States between 1961 and 1965 was estimated to be 4.2 pCi y 1-1
• Using data on trasfer factors for 1 37 Cs and 140 Ba as a guide, O'Brien estimated P345
(milk-to-dose) for 136 Cs to be 13 10-3 mrad per pCi y 1-1
• The estimated dose commitment for the population of the temperate regions of the northern hemisphere from all tests to 1970 is 0.01 mrad.
L. BARIUM-140
118. Barium-140 is a beta emitter with a half-life of 12.8 d and a maximum beta energy of 1.02 MeV. It emits several gamma rays. Its daughter product, the 40.2-h half-life 140 La, decays with a 2.18-MeV maximum-energy beta emission and several gamma rays, with energies up to 1.6 MeV. Barium-140 is measurable in fallout only for a few weeks after a nuclear explosion. This radionuclide was measured in the pasteurized milk supply networks of the United States by the Public Health Service between 1961 and 1966 (204). The time-integrated concentration in milk was 16.2 pCi y 1-1
for this period. O'Brien (195) estimated the factor P45
for 140 Ba to be about 3.0mrad per pCiy(gCa)- 1 in bone. In addition, using the P3 4 value for 9 0 Sr together with the ICRP model for alkaline-earth metabolism (160). the factor }11/k for 140 Ba was estimated to be

5.5 10-5• With these values, in the United States the
mean dose to bone marrow for the period 1961-1965 is estimated to be 2.6 10-3 mrad. The dose commitment in the temperate zone of the northern hemisphere is estimated to be 6 10-3 mrad, assuming an average consumption of 0.6 I of milk per day.
M. CERIUM-144
119. Cerium-144 has been widely measured in air and in fallout (61, 249). It has a half-life of285 d and together with its daughter decay product, the 1.7-min 14 4 Pr, emits beta particles of 2.99-MeV maximum energy and
several gamma rays. Table 20 shows. for a number of sites in each hemisphere, the ratio of the integrated deposition density of 144 Ce to that of 9 0 Sr, together with similar ratios of the time-integrated activity concentrations in air {obtained by the sum of the average monthly activity concentrations over the specified period of time). These ratios are indicated in the table as :E144 Ce/:E90 Sr. Using a value of 15 as representative for the ratio for all tests up to 1974, the mean integrated deposition density of 144 Ce is estimated to be (mCi km -l ): northern temperate zone, 1257: southern temperate zone, 360: world (population-weighted), 765, based on data of table 2 and paragraph 47.
TABLE 20. RATIO OF THE INTEGRATED DEPOSITION DENSITIES OR OF THE Tl~IEINTEGRATED AIR CONCENTRATIONS OF ' 44 Ce and 90 Sr AT VARIOUS LOCATIONS
Location Period
Buenos Aires, Argentina 1966-1974 Moosonee, Canada 1963-1974 Antofagasta, Chile 1963-1974 Santiago, Chile 1963-1974 Puerto Mont, Chile 1963-1974 Lower Hutt, New Zealand 1968-1972 Chilton, United Kingdom 1961-1965 Chilton, United Kingdom 1967-1970 Sterling, United States 1963-1974 Miami, United States 1963-1974
120. The inhalation of 144 Ce gives rise to lung irradiation. At Moosonee (Canada) and Sterling and Miami (United States), the time-integrated concentrations of 14 4 Ce in air from 1963 to 1974 were 1.33. 1.78 and 1.66 pCi y m -3
, respectively, giving a mean of 1.6 pCi y m - 3 (I 17). The time-integrated activity concentrations in air at Antofagasta and Santiago (Chile) for the same period were 0.36 and 0.39 pCi y m - 3
,
respectively, giving a mean of 0.38 pCi y m -3 • Assuming that these two means are representative of the northern and southern hemisphere, and using the 9 0 Sr integrated deposition data of table 2 to extrapolate the integrated air concentrations to cover the period 1954-1974, the resulting estimates for that period are respectively 3.0 and 0. 7 pCi y m -J for the northern and southern hemispheres.
121. Using the ICRP lung model (135. 136) with parameters of class Y. and assuming a mean particle size of 0.5 µm, which results in a 20-per-cent deposition in the pulmonary region of the lung, the transfer factor P15 (time-integrated air concentration-to-dose) is estimated to be 22 mrad per pCi y m - 3 •
122. Applying this value of P 1 5 to the time-integrated air concentrations given in paragraph 120 results in dose commitments to the lung of 65 and 15 mrad for the populations of the northern and southern temperate regions, respectively. The Jung dose commitment to the world population is estimated to be about 38 mrad. Assuming a 144 Ce/9°Sr activity ratio of 48 at the time of fission, it can be estimated that the collective dose commitment to the lung per unit activity released is of the order of 0.3 man rad Ci- 1
, for the past pattern of nuclear testing.
Type of ratio I: '"'Cef'~ 90 Sr
Deposition density 18.9 Air concentration 13.5 Air concentration 12.8 Air concentration 15.0 Air concentration 12.3 Deposition density 16.0 Deposition density 20.2 Deposition density 14.7 Air concentration 13.5 Air concentration 14.2
N. PLUTONIUM
I. Plutonium in the environment
123. Several isotopes of plutonium have been released into the environment by nuclear tests carried out in the atmosphere between 1945 and 1976. The most important, with half-lives shown in rarentheses, are 239 Pu (24 OOO y), 240 Pu (6600 y). 2 8 Pu (87 y) and 241 Pu (14 y). The last radionuclide is mainly a beta emitter and decays to the alpha emitter 24 1 Am (430 y). Since 2 3 9 Pu and 2 4 0 Pu are not usually distinguished in environmental activity measurements. reported 2 3 9 Pu activities should be assumed to apply to a mixture of 239 Pu and 240 Pu (I 16). Measurements have indicated that this mixture contains approximately 60 per cent of 239 Pu on an activity basis.
124. Plutonium released to the atmosphere during atmospheric tests is subsequently deposited on land and on the oceans as insoluble aerosol particles of the oxide. Profile measurements in sandy soil have shown that about 70 per cent is in the first 4-cm layer and virtually all in the top 30 cm ( 114). The profile depends on local climate and the physico-chemical properties of the soil. Other measurements (38) indicate that about 40 per cent of the plutonium is in the top 5 cm of soil.
125. The uptake of plutonium from soil by plants can be expressed as a concentration factor, usually defined as the ratio of the activity concentration in fresh plants to that in dry soil. Reported values for the plutonium concentration factor vary widely over the range 4 10-s to 3 10-2
• but representative values are on the average
147

of the order of 10-4 (38). From measurements of the 2 3 9 Pu intake and of the activity in the bone. muscle and liver 6f cows that had grazed on a contaminated range of the Nevada test site, a gastro-intestinal uptake factor of 3.4 10-s was obtained (224). In similar study on the uptake of plutonium by reindeer that had fed on lichen, the uptake factor was found to be about 2.4 10-5 (128).
126. In the ocean, plutonium has moved to greater depths than has 90 Sr and 137Cs. Noshkin et al (193) found that 2-36 per cent of oceanic plutonium in the Atlantic Ocean was in the sediments. In the water, they found that about 50 per cent of the activity was below the thermocline. In 1964 the activity concentration of plutonium in the Pacific Ocean was about 10-4 pCi 1-1
(202). Plutonium is taken up by marine biota, and the concentration factors for algae. plankton, crustacea are 1000-3000; for fish (muscle), 1-10 (192).
2. Levels in the environment
127. Most of the plutonium now dispersed around the world came from tests carried out prior to 1963; subsequent tests have contributed an additional 10 per cent to the global inventory (118). The deposition density rate and the integrated deposition density of 2 3 9 Pu-2 4 0 Pu can be inferred from the corresponding values for 9 0 Sr, as it has been observed that the Pu/9 0 Sr activity ratio in stratospheric- and surface-air samples has remained fairly constant in time with a value of about 0.017 (28, 116). A comparison of the cumulative deposit of Pu in fOil with that of 9 0 Sr can also be used to estimate the global deposition of plutonium. From such measurements the global deposition of 239 Pu-240 Pu up to the end of 1973 is estimated to be 320 kCi, of which 250 kCi were in the northern hemisphere and 70 kCi in the southern hemisphere (116). This global deposition amounts to about 3 t of the 239 Pu isotope. In 1975 the stratospheric inventory in the northern hemisphere was less than l kCi (149).
128. Nuclear tests have contributed 9 kCi of 2 38 Pu to global fallout (116), while the re-entry of a satelite into the earth's atmosphere in 1964 contributed some 17 kCi, 70 per cent of which has deposited in the southern hemisphere, as discussed in the 1972 report of the Committee (245).
129. Although 239 Pu-240 Pu concentrations in groundlevel air have been measured on a wide scale only since 1965, previous 2 3 9 Pu-2 4 0 Pu activity concentrations in
air can be estimated from ~ 0 Sr concentrations in air. assuming that the 239 Pu-2 40 Pu/9°Sr ratio has remained constant and that both nuclides have the same deposition velocity (149). Using this approach, Bennett found that the air activity concentration in New York reached a peak of about 1.7 fCi m - 3 in 1963 and by I 972 had decreased to 0.031 fCi m - 3 (22). The average deposition density rate of 239 Pu-240 Pu in New York for 1972-74 was 0.017 mCi km-2 y-1
, while the cumulative deposit density in 1974 was 2.68 mCi km -l (38).
130. Bennett (32, 35) has reported results from a complete-diet sampling programme conducted in New York during 1972 and 1974, which showed an average annual dietary intake of 1.6 pCi of 2 3 9 Pu-2 4 0 Pu. Of the food groups analysed, grain products, and fruit and vegetables had the highest activity concentrations, both being about 5 103 pCi kg-1 • It was also apparent from this study that external contamination of food is an important contributor to intake.
3. Pathways to man and dose commitments
131. Plutonium uptake and deposition in human tissues can follow the inhalation of airborne plutonium or the ingestion of contaminated food. The available data indicate that for plutonium released by atmospheric tests. the most important pathway to man is the inhalation of contaminated air. Dose commitments have been estimated for each pathway.
132. Bennett (28) has estimated that the cumulative intake by inhalation in New York from 1954 through 1975 was 43 pCi. As a single intake, this would have given rise to a body activity of 8.5 pCi, assuming a 20-per-cent retention factor as is indicated in the ICRP lung model (135, 136). But since the intake occurred over several years, allowing for loss of activity from the lung, the activity in the body was about 4 pCi at maximum in 1964, and for 1974 it was estimated to be 2.4 pCi (38).
133. The 239 Pu contents of various human organs measured at several areas of the United States in 1972 and 1973 in occupationally unexposed persons have recently been reported (12, 213). In this study, particular care was exercised in separating the lymph-node tissue. so that as little as possible of non-lymphatic tissue was included. These results are shown in table 21, together with the estimated values of
TABLE 21. CONCENTRATION OF PLUTONIUM IN BODY TISSUES OF NON-
148
OCCUPATIONALLY EXPOSED PERSONS IN THE UNITED STATES, 1972-1973 (The number in parentheses is the number of samples)
(pCi kg- 1)
Lung Liver Lymph node Kidney Vertebrae
Los Alamos 0.36 (8) 0.72 (5) 16.0 (4) 0.09 (5) 0.72 (5) Non-residents of
Los Alamos 0.18(17) 0.31 (10) 9.0 (15) 0.54 (10) 0.19 (16) Colorado 0.31 (29) 0.81 (25) 6.8 (22) 1.4 (25) 0.50 (25) Savannah River 0.18 (20) 0.54 (14) 18.0 (6) 1.0 (11) 0.31 (12)
Mean 0.27 (74) 0.68 (54) 11.0 (47) 0.68 (51) 0.31 (58)
Computed from fallout plutonium (1972)a 0.19 0.52 32.0 O.Q7 0.19
0 .>\ssuming organ weights for the lung, liver, lymph node ·and bone of 1.0, 1.7, 0.015 and 5.0 kg, respectively.

•: ;I
10.0 !\ ANNUAL INTAKE BY INHALATION
~ IJJ :, tl i= !: .... z w .... z 8 > ... > ~ C: 0 w
"' ~ !: ..J < :, z ~
/'I I \
/ \ / l
•• ••••••• i ••• l .. ..
1955 1960
I \ ! \ / New York data
i \ I \ I \ COMPUTED ACTIVITY CONTENT
I Total body
/ Bone
1965 1970 1975 1980 1985
Figure XII. Annual 2 39 Pu inhalation intake (dotted curve) and computed activity con~ent in human body fo;sues (solid curves)
Bennett based upon the New York data (28). The agreement is quite reasonable, considering the difficulties involved. It should be noted that, to get these results, Bennett used the ICRP lung model with class Y parameters (appropriate for insoluble aerosol particles). while the results with other classes of parameters were at variance with the measured values (28).
134. Inhalation of radioactivity resuspended from the soil surface by winds could add to the long-term intake due to airborne plutonium. Bennett (32). on the basis of natural 2 3 8 U concentrations in air and soil, considered that 10 -9 m -i would be a realistic estimate for the resuspension factor, applicable to activity in the top 1 cm of soil. This is in agreement with that estimated from normal dust loading of the atmosphere (6). This estimate · is also in agreement with values determined using an artificial tracer in a lightly vegetated area (221). Using such a factor, resuspension would only contribute 0.5 per cent to the total integral activity crf 239 Pu-240 Pu in air between 1954 and 2000 (29, 34). Since plutonium penetrates into the soil and thus becomes unavailable for resuspension, this effect is not expected therefore to contribute significantly to the dose commitment from plutonium.
135. By using estimates for the 2 3 9 Pu concentration in New York air between 1954 and 1972, assessed from 90 Sr deposition density data together with 90 Sr and
2 3 9 Pu concentration in air measured between 1965 and 1972, and utilizing the ICRP lung model (135, 136), Bennett has estimated the dose to man from inhalation of fallout 2 3 9 Pu through 2000 (28). The estimated 2 3 9 Pu annual intake and activity content in body tissues are shown in figure XII. The cumulative doses to 2000 are (mrad): lungs, 1.6; liver, 1.7: bone lining cells, 1.5. As the atmospheric inventory of 2 3 9 Pu decreases rapidly, the contribution from inhalation after 2000 is very small, and these cumulative doses are therefore good approximations of the dose commitments. The present estimate for the dose commitment to bone differs significantly from that given by the Committee in its 19_72 report. which was based upon concentrations in surface air at Ispra, Italy, and on earlier values of parameters for the ICRP lung model (135, 136). It is also to be noted that the lung doses have been calculated on the basis of a uniform distribution of 2 3 9 Pu over the whole organ (28. 245). As plutonium particles are assumed to be insoluble. the actual distribution of doses in the lung is probably non-homogeneous, but the calculated value can be taken to represent the mean dose to the lung.
136. Assuming that the 239 Pu concentrations in New York air are representative of the whole 40° -50° latitude band, that the global distribution of 2 3 9 Pu deposition is the same as that for 9 0 Sr, and that the latitudinal distribution of the population remains unchanged. the
149

population-weighted dose through 2000 to the bone lining cells would be 1.0 mrad in the northern hemisphere and 0.3 mrad in the southern hemisphere.
137. For the purpose of estimating dose commitments from the ingestion of the plutonium mixture, two extreme cases will be considered, assuming in the first that the amount of plutonium transferred to food depends on the deposition density rate and in the second, that it depenqs on the cumulative deposit density.
138. Under the first assumption, P2 3 is estimated from the quotient 1.6 pCi y- 1 /0.017 mCi km-2 y-• to be 94 pCi per mCi 1an-2
• The total individual intake from plutonium deposited from all tests up to 1974 would be 94 pCi per mCi km- 2 X 2.68 mCi 1un-2 = 252 pCi. Under ·the second assumption. on the other hand, the lifetime intake is estimated to be 1.6 pCi y- 1 X 70 y = 112 pCi.
139. Of the ingested plutonium it is assumed that a fraction 3 10-5 is absorbed through the GI tract and that 45 per cent of this goes to the bone ( 136). For the two assumed cases of intake of 252 pCi and 112 pCi, the activity deposited in bone is 3.4 10-3 and 1.5 10-3 pCi. respectively.
140. The dose rate in bone per unit activity of plutonium is 0.098 mrad y-• pCi- (28). Under the first assumed case, the activity in bone is 3.4 10-3 pCi, and the average exposure period in the population is 35 )l.
The dose commitment is therefore assessed to be 1.2 10-2 mrad.
141. Under the second assumed case the bone activity increases linearly with age with an average in the population of 1.5 10-3 pCi X 0.5 = 0.75 10-3 pCi. The factor of 0.5 takes account of the fact that the per caput bone activity is approximately 0.5 times that at death. The annual dose, averaged over all ages, is therefore 7.5 X 10⁻⁵ mrad. If it is assumed that the 2 3 9 Pu in the soil becomes unavailable only by decay, the dose commitment is estimated to be 2.6 mrad.
142. Taking into account population distribution and using the procedures outlined in Annex A. the collective dose commitments to the lung and to bone lining cells, per unit activity released by past nuclear explosions, are of the order of 10 man rad Ci-1
•
III .. EXTERNAL IRRADIATION
143. Many radionuclides present in fallout emit gamma rays and contribute to the dose from external irradiation. The most important from this point of view are a number of short-lived radionuclides, the most significant of which are 9 5 Zr and its daughter 95Nb, and the long-lived 1 3 7 Cs.
144. In principle, it is possible to calculate the external doses from the integrated deposition density of each radionuclide. Table 22 shows the conversion factors for estimating absorbed dose in air, 1 m above ground. that were used in the 1972 report and which are based largely on the work of Beck et al. ( 15). For short-lived radionuclides, a plane source on the surface of the ground is postulated, but for 1 37 Cs an exponential profile is assumed with a mean depth of 3 cm.
TABLE 22. CONVERSION FACTORS FOR THE ASSESSMENT OF ABSORBED DOSES IN AIR 1 m ABOVE GROUND
9Szr 1o•Ru '06
Ru 137Cs 140Ba •••ce 144 Ce
Dose-rate conversion factor (mrad y·• per mCi km·2) 0.341 a 0.072 0.042a 0.033 0.316a 0.011 0.004°
Mean life (y) 0.257 0.157 1.44 43.7 0.051 0.129 1.13
Dose conversion factor (mrad per mCi km·2) 0.087 0.011 0.060 1.44 0.016 0.0014 0.0045
Note: A plane source on the ground surface is assumed except for 1 3' Cs, for which the source
is assumed to be exponentially distributed with a mean depth of 3 cm. alncluding contributions from the daughter radionuclides, assumed in transient equilibrium.
145. The assessment of organ doses from absorbed doses in air is discussed in Annex A. A combined factor of 0.8 is used in this report to account for the change of material (air to tissue) and for back-scatter and shielding afforded by other tissues of the body. The estimation of the organ doses from external radiation due to fallout require the use of a further factor representing the shielding effect of buildings. This shielding is taken to reduce the absorbed dose rate in air in the building, on average, to 20 per cent of its outdoor value. Assuming that on the average 80 per cent of the time is spent indoors, the effective shielding factor of the building is 0.4 (241, 245).
146. The overall factor used in this report to convert air absorbed doses to organ doses is therefore 0.8 X 0.4 = 0.32. Transfer factors P2 5 relating integrated
150
depositions of selected gamma-emitting nuclides to the resulting doses in the tissues of interest to the Committee can be calculated by multiplying the conversion factors shown in table 22 by 0.32.
A. SHORT-LIVED RADIONUCLIDES
147. Although the deposition of short-lived radionuclides has not been measured over the whole period during which nuclear tests were conducted, there are sufficient data available to ·estimate approximately the mean integrated deposition density. This estimation is based on the use of ratios of the time-integrated air concentrations and of integrated deposition densities of the relevant nuclides, assessed from measurements at a
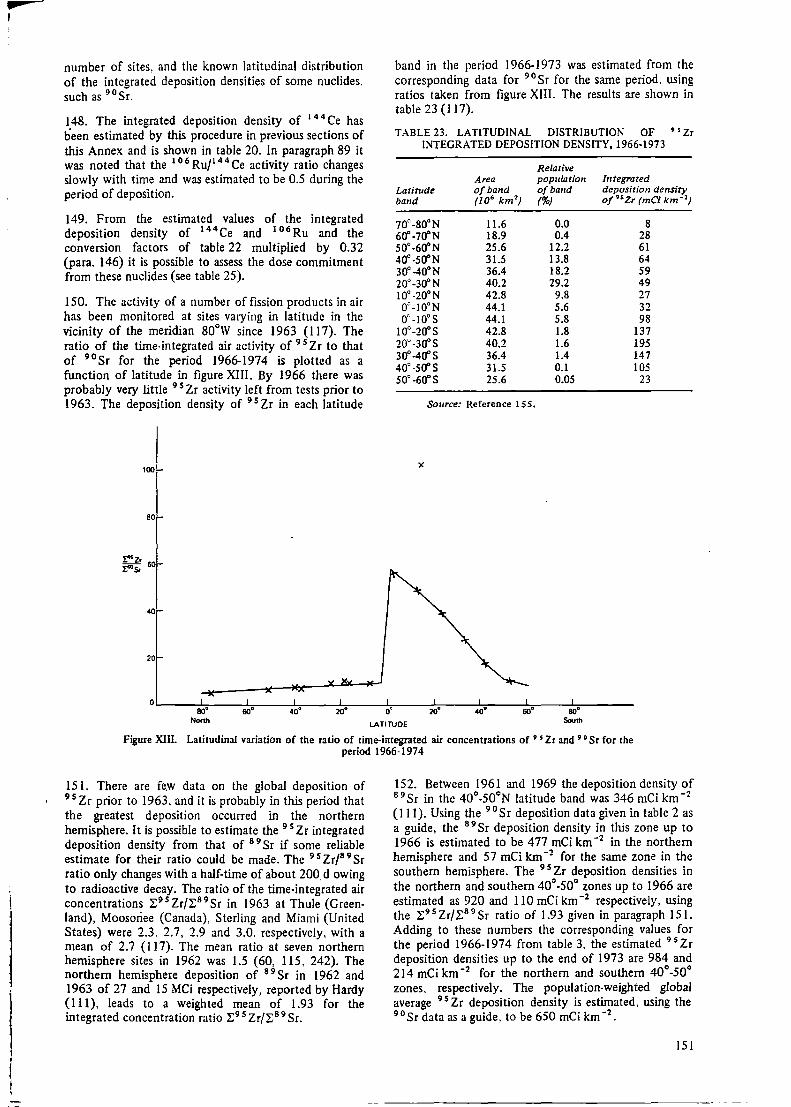
~ I
number of sites, and the known latitudinal distribution of the integrated deposition densities of some nuclides. such as 9 0 Sr.
148. The integrated deposition density of 144 Ce has been estimated by this procedure in previous sections of this Annex and is shown in table 20. In paragraph 89 it was noted that the 106 Ru/144 Ce activity ratio changes slowly with time and was estimated to be 0.5 during the period of deposition.
149. From the estimated values of the integrated deposition density of 144 Ce and 106 Ru and the conversion factors of table 22 multiplied by 0.32 (para. 146) it is possible to assess the dose commitment from these nuclides (see table 25).
150. The activity of a number of fission products in air has been monitored at sites varying in latitude in the vicinity of the meridian 80°W since 1963 {l 17). The ratio of the time-integrated air activity of 9 5 Zr to that of 9 0 Sr for the period 1966-1974 is plotted as a function of latitude in figure XIII. By 1966 there was probably very little 9 5 Zr activity left from tests prior to 1963. The deposition density of 95 Zr in each latitude
100
so
40
20
band in the period 1966-1973 was estimated from the corresponding data for 9 0 Sr for the same period. using ratios taken from figure XIII. The results are shown in table 23 ( 117).
TABLE 23. LATITUDINAL DISTRIBUTION OF • 'Zr INTEGRATED DEPOSITION DENSITY, 1966-1973
Latitude band
Area of band (10 6 km 2
)
70° -80°N 11.6 60" -70° N 18.9 50° -60"N 25.6 40"-5Cl°N 31.5 30"-4a°N 36.4 20° -3Cl° N 40.2 10° -20°N 42.8 0°-I0°N 44.1 0°-I0°S 44.1
10° -2Cl°S 42.8 20°-3Cl°S 40.2 3()° -4()° S 36.4 40° -Sa° S 31.5 50°-6Cl°S 25.6
Source: Reference I SS.
X
Relative population of band (%)
0.0 0.4
12.2 13.8 18.2 29.2
9.8 5.6 5.8 1.8 1.6 1.4 0.1 0.05
Integrated deposition density of 95Zr (mCi km- 2
)
8 28 61 64 59 49 27 32 98
137 195 147 105
23
0<-----::':;;---~----.l.,:--...J...,.-----1.,..----L:----J..,..--~--...L----~ ~ ~ ~ t ~ ~ ~ ~
North LA TllUOE Soulh
Figure XIIL Latitudinal variation of the ratio of time-integrated au concentrations of • 5 Zr and• 0 Sr for the period 1966-1974
15 I. There are fe.w data on the global deposition of 9 5 Zr prior to 1963, and it is probably in this period that the greatest deposition occurred in the northern hemisphere. It is possible to estimate the 9 5 Zr integrated deposition density from that of 8 9 Sr if some reliable estimate for their ratio could be made. The 9 5 Zr/8 9 Sr ratio only changes with a half-time of about 200. d owing to radioactive decay. The ratio of the time-integrated air concentrations "f. 95 Zr/"f.89 Sr in 1963 at Thule (Greenland), Moosoriee (Canada). Sterling and Miami (United States) were 2.3. 2.7, 2.9 and 3.0, respectively, with a mean of 2. 7 ( 117). The mean ratio at seven northern hemisphere sites in 1962 was 1.5 ( 60. 115, 242 ). The northern hemisphere deposition of 89 Sr in 1962 and 1963 of 27 and 15 MCi respectively, reported by Hardy {111), leads to a weighted mean of 1.93 for the integrated concentration ratio "f,9 5 Zr/"f,8 9 Sr.
152. Between 1961 and 1969 the deposition density of 8 9 Sr in the 40° -50°N latitude band was 346 mCi km - 2
(111). Using the 9 0 Sr deposition data given in table 2 as a guide, the 8 9 Sr deposition density in this zone up to 1966 is estimated to be 477 mCi km-2 in the northern hemisphere and 57 mCi km -2 for the same zone in the southern hemisphere. The 9 5 Zr deposition densities in the northern and southern 40°-50° zones up to 1966 are estimated as 920 and 110 mCi km-2 respectively, using the "f,95 Zr/"f.89 Sr ratio of 1.93 given in paragraph 151. Adding to these numbers the corresponding values for the period 1966-1974 from table 3. the estimated 95 Zr deposition densities up to the end of 1973 are 984 and 214 mCi km -2 for the northern and southern 40°-50° zones, respectively. The population-weighted global average 9 5 Zr deposition density is estimated, using the 9 0 Sr data as a guide, to be 650 mCi km -2
•
151
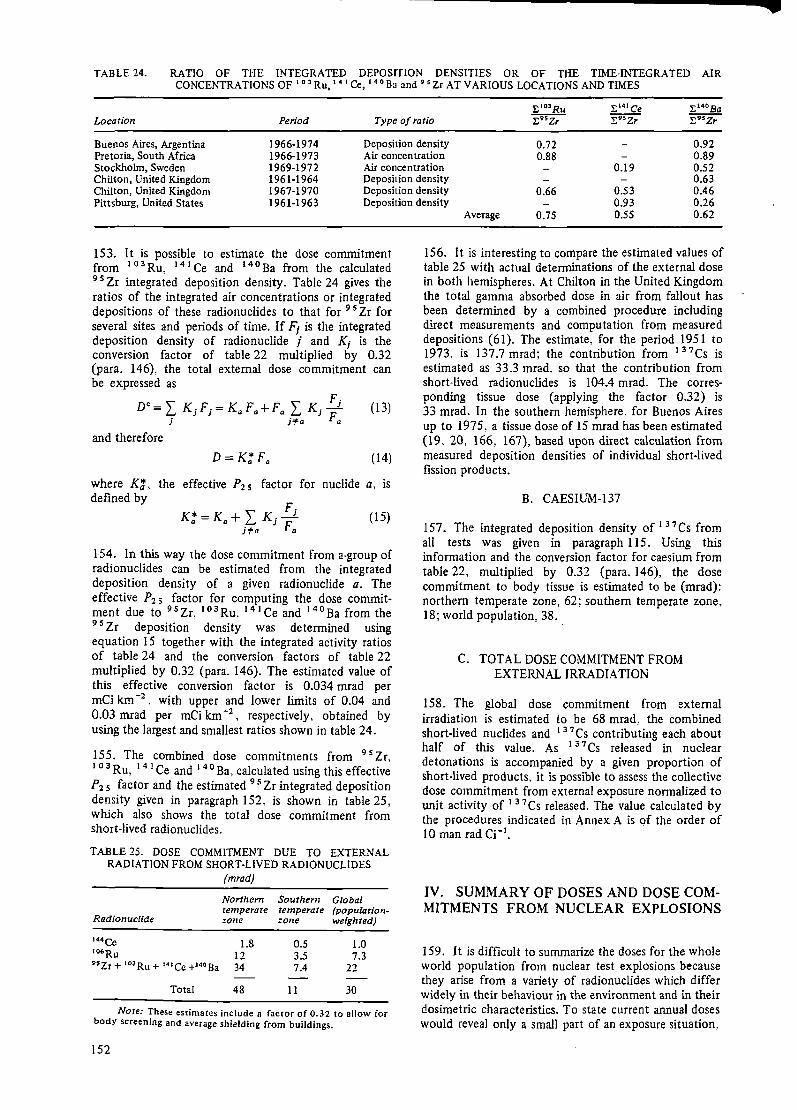
TABLE 24. RATIO OF THE INTEGRATED DEPOSITION DENSITIES OR OF THE TIME-INTEGRATED AIR CONCENTRATIONS OF 1 03 Ru, 141 Ce, 140 Ba and 95 Zr AT VARIOUS LOCATIONS AND TIMES
~103Ru E141Ce :i:;•4oBa
Location Period Type of ratio l: 95Zr I:95Zr I: 95Zr
Buenos Aires, Argentina 1966-1974 Deposition density 0.72 0.92 Pretoria, South Africa 1966-1973 Air concentration 0.88 0.89 Stockholm, Sweden 1969-1972 Air concentration 0.19 0.52 Chilton, United Kingdom 1961-1964 Deposition density 0.63 Chilton, United Kingdom 1967-1970 Deposition density 0.66 0.53 0.46 Pittsburg, United States 1961-1963 Deposition density 0.93 0.26
153. It is possible to estimate the dose commitment from 103 Ru. 14 1 Ce and 14 0 Ba from the calculated 9 5 Zr integrated deposition density. Table 24 gives the ratios of the integrated air concentrations or integrated depositions of these radionuclides to that for 9 5 Zr for several sites and periods of time. If F; is the integrated deposition density of radionuclide j and Ki is the conversion factor of table 22 multiplied by 0.32 (para. 146). the total external dose commitment can be expressed as
Dc=L KjFj=K 0 F0 +F0 L K1 ;j (13) j )'fa a
and therefore
(14)
where K!, the effective P2 5 factor for nuclide a, is defined by
f. K*=K + L K--1
a a j,pa J Fa (15)
154. In this way the dose commitment from a-group of radionuclides can be estimated from the integrated deposition density of a given radionuclide a. The effective P2 5 factor for computing the dose commitment due to 95 Zr. 103 Ru. 141 Ce and 140 Ba from the 9 5 Zr deposition · density was determined using equation 15 together with the integrated activity ratios of table 24 and the conversion factors of table 22 multiplied by 0.32 (para. 146). The estimated value of this effective conversion factor is 0.034 mrad per mCi km -2
• with upper and lower limits of 0.04 and 0.03 mrad per mCi km-2
, respectively, obtained by using the largest and smallest ratios shown in table 24.
155. The combined dose commitments from 9 5 Zr, 103 Ru, 14 1 Ce and 140 Ba, calculated using this effective P.2 5 factor and the estimated 9 5 Zr integrated deposition density given in paragraph 152. is shown in table 25, which also shows the total dose commitment from short-lived radionuclides.
TABLE 25. DOSE COMMITMENT DUE TO EXTERNAL RADLI\TION FROM SHORT-LIVED RADIONUCLIDES
(mrad)
Radionuclide
Nortllem Southern Global temperate temperate (populatio11-zone zo11e weighted)
144Ce 1.8 106 Ru 12 95 Zr+ ' 03 Ru+ 141 Ce+140Ba 34
Total 48
0.5 3.5 7.4
11
1.0 7.3
22
30
Nore: These estimates include a factor of 0.32 to allow for body screening and average shielding from buildings.
152
Average 0.75 0.55 0.62
156. It is interesting to compare the estimated values of table 25 with actual determinations of the external dose in both hemispheres. At Chilton in the United Kingdom the total gamma absorbed dose in air from fallout has been determined by a combined procedure including direct measurements and computation from measured depositions (61). The estimate, for the period 1951 to 1973. is 137.7 mrad: the contribution from 137Cs is estimated as 33.3 mrad. so that the contribution from short-lived radionuclides is 104.4 mrad. The corresponding tissue dose (applying the factor 032) is 33 mrad. In the southern hemisphere, for Buenos Aires up to 1975, a tissue dose of 15 mrad has been estimated (19. 20, 166, 167), based upon direct calculation from measured deposition densities of individual short-lived fission products.
B. CAESIUM-137
157. The integrated deposition density of 137 Cs from all tests was given in paragraph 115. Using this information and the conversion factor for caesium from table 22, multiplied by 0.32 (para. 146), the dose commitment to body tissue is estimated to be (mrad): northern temperate zone, 62; southern temperate zone, 18; world population. 38.
C. TOTAL DOSE COMMITMENT FROM EXTERNAL IRRADIATION
158. The global dose commitment from external irradiation is estimated to be 68 mrad, the combined short-lived nuclides and 1 3 7 Cs contributing each about half of this value. As 1 3 7 Cs released in nuclear detonations is accompanied by a given proportion of short-lived products, it is possible to assess the collective dose commitment from external exposure normalized to unit activity of 1 3 7 Cs released. The value calculated by the procedures indicated in Annex A is of the order of 10 man rad Ci-1
•
IV. SUMMARY OF DOSES AND DOSE COMMITMENTS FROM NUCLEAR EXPLOSIONS
159. It is difficult to summarize the doses for the whole world population from nuclear test explosions because they arise from a variety of radionuclides which differ widely in their behaviour in the environment and in their dosimetric characteristics. To state current annual doses would reveal only a small part of an exposure situation.

p
which is known to vary not only with time, but also with geographical location, living conditions and age. For a given group of individuals. for whom these factors are known, the annual doses from external and internal exposures may be presented as a function of age for some selected organs and tissues of interest; that would give a full picture of the annual doses for the particular groups. For some long-lived radionuclides that are globally distributed, such as 137 Cs, this information may be derived for the whole world populatipn as per caput annual doses which would be representative of individuals irrespective of age and location. For other radionuclides, however, the individual annual doses will vary substantially with location and age. That is the case with short-lived radionuclides, such as 131 I, 131 I, as regards location, and with bone-seeking radionuclides, such as 90 Sr, as regards age. Even for these radionuclides. however, once the population group of interest has been identified. it is possible to describe the current and
expected exposure situations for the individuals involved. drawing on the information given in the various sections of this Annex.
160. If the variation of individual organ dose rates with time were known for all locations, living conditions and ages. a world population per caput dose rate could be calculated. Its integral over infinite time would be the global dose commitment from the nuclear explosions to date. Using the methods described in this Annex, however, this integral can be evaluated even though the per caput dose rate as a function of time is not known or is difficult to derive. Because the global dose commitment, as described in Annex A, can be used as a relative measure of the detriment, the Committee, as in previous reports, has found this quantity to be a useful single measure of the irradiation consequences for the whole world population. It is therefore summarized in table 26.
TABLE 26. SUMMARY OF DOSE COMMITMENT FROM RADIO~UCLIDES PRODUCED IN ALL NUCLEAR TESTS CARRIED OUT BEFORE 1976
(mrad)
Northern temperate zone Southern temperate zone World population
Bone Bone Bone Source of Bone lining Bone lining Bone lining radiation Gonads marrow cells Lung Gonads mc"ow cells Lung Gonads marrow cells Lung
External Short-lived
nuclides 48 48 48 48 11 11 11 11 30 30 30 30 '
37Cs 62 62 62 62 18 18 18 18 38 38 38 38 Internal
'H 2 2 2 2 0.2 0,2 0.2 0.2 2 2 2 2 uca 7 32 29 9 7 32 29 9 7 32 29 9 54 Mn 1 1 S5Fe 0.6 1 1 0.3 0.2 0.3 0.3 0.7 0.4 0.7 0.7 P05r 84 120 24 33 52 71 89Sr 0.4 0.3 t06Ru 41 10 24 131Cs 27 27 27 27 8 8 8 8 17 17 17 17 t44Ce 65 15 38 23PpUb 1 0.3 0.3 0.9 0.9
Totalc 150 260 290 260 45 93 100 72 94 170 190 160
Notes: 1. The dose commitments for 15Kr, 136Cs and 140Ba, although discussed in the text, are not shown in this table because they are negligible compared with the values included.
2. For internal irradiation, where body activities have been measured, uncertainties are probably within a factor of 2. For external irradiation and for lung-dose estimates, where the models used were not checked by direct measurement. the uncertainties are probably within a factor of 5.
aDo'se accumulated up to the year 2000. The total dose commitment to gonads and lung is about 120 mrad, to bone lining cells 414 mrad and to bone marrow 455 mrad, delivered over some 8300 y. .
bThese dose commitments appear to be the same in different organs because of rounding. Only inhalation contributions are shown; for discussion on the ingestion pathway see chapter II, section N.
cRounded to two significant figures.
161. The values shown in table 26, taken from the relevant paragraphs in the preceding sections, have been rounded off. For this reason, when the differences between the estimated organ dose commitments are small. the table gives the appearance of a uniform dose over several organs. In the case of doses from external gamma radiation, or from internal emitters that are homogeneously distributed in the body, such as 3 H and 137 Cs, the dose commitment is essentially the same for all the relevant organs of the body.
162. The methods for calculating the values of the dose commitments given in table 26 have been
reassessed since the 1972 report of the Committee. In some cases, particularly for short-lived nuclides and 9 o-sr, this reassessment has produced dose commitment estimates that differ significantly from those given in the 1972 report.
163. For the radionuclides listed in table 26. the irradiation to which the world population was committed by nuclear tests up to 1975 is already iargely completed for all ex~ept 1 37 Cs ( external and internal), 3 H, 14 C, 9 0 Sr and 2 3 9 Pu. Therefore, in terms of current annual doses, only these five nuclides need to be considered. Caesium-137 makes major contributions for
153

all body tissues which are essentially independent of age; whereas the further substantial contribution from 9 0 Sr in bone marrow and bone lining cells is strongly dependent on ~e. In comparison. the contributions of 3 H. 14 C and 2 9 Pu to current annual doses are very small.
164. Although 1 3 7 Cs and 9 0 Sr are the only substantial contributors to current annual doses to the body organs and tissues included in table 26, it is not possible to summarize this annual dose situation in a simple description for the whole world population. It may be helpful, however, to indicate the magnitude of the annual doses in 1975 using 1 37 Cs as an illustrative example. Whole-body contents of 137Cs in 1975 (table 19) ranged from 8 to 29 pCi (gl()-1
, which would have caused annual doses to body tissues in the range 0.1-0.5 rnrad. The external exposure from 137 Cs
154
deposition in soil would have added less than 0.2 mrad to these doses. Because of the long half-life of 1 3 7 Cs, the world population is committed to continued exposure from this radionuclide for many years. This accounts for the substantial contribution of 1 3 7 Cs to the dose commitment.
165. For nuclear tests carried out in the atmosphere in the northern and southern hemispheres since the Committee's 1972 report, 1 31 I in milk supplies has led to irradiation of the thyroid glands of exposed populations in the periods immediately following the tests. Doses due to 1 31 1 in infant thyroids-the most highly exposed organ-ranged up to 15 rnrad in the northern hemisphere in 1974 and 1976, whereas. in the southern hemisphere, doses to infant thyroid ranged up to about 100 mrad in 1973 and up to some hundreds of mrad in 1974.

REFERENCES
1. Aarkrog, A. Personal communication.
2. Aarkrog, A. and J. Lippert. Environmental radioactivity in Denmark in 1971, 1972, 1973, 1974, and 1975. Danish Atomic Energy Commission. Riso reports 265 (1972), 291 (1973), 305 (1974), 323 (1975) and 345 (1976).
3. Aarkrog, A. and J. Lippert. Environmental radioactivity in the Faroes in 1973, 1974 and 1975. Danish Atomic Energy Commission. Ris0 reports 306 (1974), 324 (1975), and 347 (1976).
4. Aarkrog, A. and J. Lippert. Environmental radioactivity in Greenland. Danish Atomic Energy Commission. Ris0 reports 156 (1967), 182 (1968), 203 (1969), 222 (1970). 247 (1971), 267 (1972). 307 (1974}, and 325 (1975).
5. Agricultural Research Council, Letcombe Laboratory. United Kingdom. Annual reports for 1970, 1971 and 1972.
6. Anspaugh, L. R., J. H. Shinn. P. L. Phelps et al. Resuspension and redistribution of ,Plutonium in soils. Health Phys. 29: 571-582 (1975).
7. Asari. T .. M. Chiba and M. Kuroda. Strontium-90 and cesium-137 in milk in Radioactivity Survey Data in Japan. National Institute of Radiological Sciences (Chiba, Japan), reports NIRS-RSD-9 and 10 (1965-1966), 15 (1967), 17 (1967), 20 (1968). 24 (1969), 26 (1970), 30 (1971), and 36 (1972).
8. Asari, T., M. Chiba and M. Kuroda. Strontium-90 and cesium-137 in total diet, in Radioactivity Survey Data in Japan. National Institute of Radiological Sciences (Chiba. Japan), reports NIRS-RSD-13 (1966). 15, 17 (1967), 20 (1968), 24 (1969). 26 (1970), 30 (1971), and 35 (1972).
9. Atomic Weapons Tests Safety Committee (Commonwealth of Australia). Strontium-90 and caesium-137 in the Australian environment during 1969 and some results for 1970. A WTSC report no. 2. 1971.
10. Atomic Weapons Tests Safety Committee (Commonwealth of Australia). Strontium-90 and caesium-137 in the Australian environment during 1970 and some results for 1971. AWTSC report no. 4, 1972.
11. Australia. Data on levels of radioactivity in Australia, 1971-1973. Information submitted 1974.
12. Bair, W. J., C.R. Richmond and B. W. Wachholz. A radiobiological assessment of the spatial distribution of radiation dose from inhaled plutonium. U.S. Atomic Energy Commission report WASH-1320 (1974).
13. Bacastow. R. and C. D. Keeling. Atmospheric carbon dioxide and radiocarbon in the natural carbon cycle. I. Changes from A.D. 1700 to 2070 as deduced from a geochemical model, p. 86-135 in Carbon in the Biosphere. U.S. Atomic Energy Commission report CONF-720510. Oak Ridge, 1973.
14. Barkhudarov, R. M., A. N. Marei and N. Ya. Novikova. Factors determining the increased migration of caesium-137 from the environment into the human body, p. 365-372 in Environmental Behaviour of Radionuclides Released in the Nuclear Power Industry. IAEA publication STI/PUB/345, Vienna, 1973.
15. Beck. H. L. and G. de Planque. The radiation field in air due to distributed gamma-ray sources in the ground. U.S. Atomic Energy Commission report HASL-195. New York, 1968.
16. Beninson, D. Personal communication.
17. Beninson, D.. A. Migliori de Beninson and C. Menossi. Fallout radiactivo debido a !as explosiones en el Pacifico sur en el periodo 1966-1970. Comisi6n Nacional de Energia At6-mica. Informe RS 28/49, 1971.
18. Beninson, D., A. Migliori de Beninson. C. Menossi et al Radioestroncio en el hombre en funci6n de la edad. Trabajo presentado en el Quinto Congreso Internacional de la ··societe fran9aise de radioprotection", Grenoble, 1971.
19. Beninson, D., A. Migliori de Beninson and C. Menossi. Fallout radiactivo debido a las explosiones en el Pacifico Sur en el periodo 1966-1970. Comisi6n Nacional de Energia At6-mica. report CNEA-321. Buenos Aires. 1972.
20. Beninson, D., A. Migliori de Beninson and C. Menossi. Fallout radiactivo debido a !as explosiones en el Pacifico Sur en el perfodo 1971-1972. · Comisi6n Nacional de Energia At6-mica, report RS 43/102. Buenos Aires. 1973.
21. Beninson, D. Monitoraje de strontium-90 y cesium-137 debidos al fallout en la Republica Argentina. Comisi6n Nacional de Energia At6mica, report RS 48/119, 1973.
155

22. Bennett. B. G. Personal communication.
23. Bennett. B. G. Estimation of gonadal absorbed dose due to environmental gamma radiation. Health Phys. 19: 757-767 (1970).
24. Bennett, B. G. Strontium-90 in human bone. 1971 results for New York City and San Francisco, p. I-51-I-70 in Health and Safety Laboratory fallout program quarterly summary report HASL-257. New York, 1972.
25. Bennett, B. G. Fallout tritium in the environment and the dose commitments, p. 1-50-1-70 in Health and Safety Laboratory fallout program quarterly summary report HASL-268. New York, 1973.
26. Bennett, B. G. Strontium-90 in human bone. 1972 results for New York City and San Francisco. p. 1-13-1-29 in Health and Safety Laboratory fallout program quarterly summary report HASL-274. New York. 1973.
27. Bennett, B. G. Environmental tritium and the dose to man. Proceedings of the Third International Congress of the International Radiation Protection Association (IRPA). Washington, D.C., September 1973.
28. Bennett, B. G. Fallout 2 39 Pu dose to man, p. I-42-1-63 in Health and Safety Laboratory fallout program quarterly summary report HASL-278. New York, 1974.
29. Bennett, B. G. Environmental impact of · the LMFBR. Section 46.2, U.S. Atomic Energy Commission report WASH-1359 (1974).
30. Bennett, B. G. Strontium in diet-results through 1973, p. l-34-1-48 in Health and Safety Laboratory fallout program quarterly summary report HASL-284. New York, 1974.
31. Bennett, B. G. Strontium-90 in human bone. 1973 results for New York City and San Francisco, p. 1-53-1-70 in Health and Safety Laboratory fallout program quarterly summary report HASL-286. New York, 1974.
3l. Bennett, B. G. Environmental pathways of transuranic elements, p. 131-154 in Plutonium and other transuranium elements. U.S. Atomic Energy Commission report WASH-1359 (1974).
33. Bennett, B. G. Strontium-90 in human bone, p. I-21-1-33 in Health and Safety Laboratory environmental quarterly report HASL-297. New York, 1975.
34. Bennett, B. G. Environmental pathways of transuranic elements. p. 417 -451 in Proceedings of Public Hearings: Plutonium and Other Transuranic Elements. U.S. Environmental Protection Agency report ORP/CSD-75-l.
156
35. Bennett. B. G. Fallout 239 •240 Pu in diet. 1974
results. Health and Safety Laboratory environmental quarterly report HASL-306. New York, 1976.
36. Bennett, B. G. Strontium-90 in human diet. Results through 1975, p. I-95-1-144 in Health and Safety Laboratory environmental quarterly report HASL-306. New York, 1976.
37. Bennett. B. G. Strontium-90 in human bone. 1975 results of New York and San Francisco. Health and Safety Laboratory environmental quarterly report HASL-308. New York, 1976.
38. Bennett, B. G. Transuranic element pathways to man, p. 367-381 in Transuranium Nuclides in the Environment. IAEA publication STI/PUB/410. Vienna, 1976.
39. Berger, M. J. and S. M. Seiter. Additional stopping power and range tables for protons, mesons and electrons. National Aeronautics and Space Administration report NASA-SP-3036. Washington. D.C., 1966.
40. Bhat, S. G., S. Krishnaswamy, D. Lal et al 2 3 4 Th/2 3 8 U ratios in the ocean. Earth Planet. Sci. Lett. 5: 483-491 ( 1969).
41. Bien, G. and H. Suess. Transfer and exchange of carbon-14 between the atmosphere and the surface water of the Pacific Ocean, p. 105-115 in Radioactive Dating and Methods of Low Level Counting. IAEA publication STI/PUB/ 152, Vienna, 1967.
42. Bird, P. M. Studies of fallout 137 Cs in the Canadian North. Arch. Environ. Health 17: 631-638 {1968).
43. Boni, A. L. Variations in the retention and excretion of 137Cs with age and sex. Nature 222: 1188 (1969).
44. Bonnyman, J., J.C. Duggleby. J. Molina-Ramos et al Concentrations of caesium-137 in rainwater and milk in Australia during 1969. Search l: 160-163 (1970).
45. Borisov. V., V. Knizhnikov and E. Petukhova. Basic pattern of 90 Sr uptake with food and features of 9 0 Sr extraction from the diet in the USSR during the period 1964-1971. p. 127-137 in Environmental Behaviour of Radionuclides Released in the Nuclear Industry. IAEA publication STI/PUB/345. Vienna, 1973.
46. Bowen. V. T. and W. Raether. Vertical distributions of strontium-90, caesium-137 and tritium near 45° north in the Atlantic. J. Geophys. Res. 78: 6277-6285 {1973).
47. Brar, S.S. and D. M. Nelson. Caesium-137 in various Chicago foods, in Health and Safety Laboratory fallout program quarterly summary reports for the years 1968-1972.

;
I I 1 i
48. Brezik. Z. and D. Brezfkova. Unpublished.
49. Brezik, Z. and D. Brezfkova. The values of strontium-90 in vertebrae and fermoral diaphysis of adults in Czechoslovakia in 1972 and 1973. Institute of Hygiene and Epidemiology. Centre of Radiation Hygiene. Prague, Czechoslovakia.
50. Bruce, R. S., W. Downs and W. Harris. Contamination of diet with radioactive fallout from nuclear explosions, p. 76-80 in Annual Report, 1973. Agricultural Research Council, Letcombe Laboratory, United Kingdom.
51. Bruce, R. S., W. Downs and W. Harris. Radioactivity in human diet, 1974. Agricultural Research· Council Letcombe Laboratory, United Kingdom, 1975.
52. Bundesminister des Innern. Federal Republic of Germany. Umweltradioaktivitat und Strahlenbelastung. Jahresberichte 1972, 1973, 1974 and 1975.Bonn, 1974, 1975. 1976.
53. Bundesrninister fiir Bildung und Wissenschaft. Federal Republic of Germany. Umweltradioaktivitat und Strahlungsbelastung. Umweltiiberwachung 1956-1968. Schriftenreihe Kemforschung 2. Miinchen, 1970.
54. Bundesminister fiir Bildung und Wissenschaft. Federal Republic of Germany. Umweltradio· aktivitat und Strahlenbelastung. Jahresbericht 1970, Schriftenreihe Kernforschung 4. Miinchen, 1971.
55. Bundesminister fiir Bildung und Wissenschaft. Federal Republic of Germany. Umweltradioaktivitilt und Strahlenbelastung. Jahresbericht 1971. Schriftenreihe Kernforschung 7, 1972.
56. Bundesrninister fiir wissenschaftliche F orschung. Federal Republic of Germany. Umweltradioaktivitat und Strahlenbelastung. Berichte ill and IV, 1966. Miinchen, 1966-1967, Berichte I, II, III and IV, 1967. Miinchen, 1967-1968. Jahresbericht 1968. Miinchen, 1969.
57. Bundesministerium fur soziale Verwaltung. Austria. Radioaktivitatsmessungen in Osterreich. 8. Jahresbericht, 1967. Wien, 1968.
58. Bundesministerium fiir soziale Verwaltung. Austria. Radioaktivitatsmessungen in Osterreich. 9. Jahresbericht, 1968. Wien, 1969.
59. Bundesministerium fiir soziale Verwaltung. Austria. Radioaktivitiitsmessungen in Osterreich. 10. Jahresbericht, 1969. Wien, 1970.
60. Cambray, R. S., E. M. R. Fisher, G. S. Spicer et al Radioactive fallout in air and rain. Results to the middle of 1963. U.K. Atomic Energy Authority report AERE-R-4392. Harwell, 1963.
61. Cambray, R. S., E. M. R. Fisher. W. L. Brooks et el Radioactive fallout in air and rain. Results to the middle of 1971. U.K. Atomic Energy Authority report AERE-R-6923. Harwell, 1971.
62. Cambray. R. S., J. D. Eakins, E. M. R. Fisher et al Radioactive fallout in air and rain. Results to the middle of 1974. U.K. Atomic Energy Authority report AERE-R-7832. Harwell, 1974.
63. Cancio, D., J. A. Llaur6, N. R. Ciallella et al lncorporaci6n de radioestroncio por organismos marinos, p. 347-356 in Radioactive Contamination of the Marine Environment. Proceedings of a Symposium, Seattle, 1972. IAEA publication STI/PUB/313. Vienna. 1973.
64. Castren, 0. and 0. Paakkola. Radioactivity of Finnish milk, in Studies on Environmental Radioactivity in Finland. Sateilyfysiikan laitos. Helsinki. reports SFL-A8 (1967), SFL-Al2 (1968) and SFL-A 17 {1971).
65. Castren, 0. Models for the caesium-137 and strontium-90 contamination of milk in Finland. Saertryk of Proceedings, Nordisk Selskab for Stralebeskyttelse, 3. Mordiske Mode. Copenhagen, August 1971.
66. Cechova, J. and M. Zavadsky. Personal communication.
67. Christianson, G. C. Assay of strontium-90 in human bone in Norway 1974-1975. University of Oslo. Nuclear chemistry division report (1976).
68. Christianson, G. C. and A. C. Pappas. Unpublished.
69. Comisi6n Chilena de Energia Nuclear. Ridioactividad ambiental en Chile 1970-1974. Santiago, Chile, 1975.
70. Comisi6n Nacional de Energia At6mica. Monitoraje de Sr-90 y Cs-137 debidos al fallout en la Republica Argentina. lnforme RS 48/119 (1973).
71. Comisi6n Nacional de Energia At6mica. Argentina. Information submitted.
72. Commission des Communautes europeennes. Radioactivite ambiante dans Jes pays de Ja Communaute. Reports for the years 1967 to 1970.
73. Commission des Communautes europeennes. Radioactivite ambiante dans les pays de la Communaute. Reports for the years 1970 to 1972.
74. Comitato Nazionale Energia Nucleare. Italy. Data on environmental radioactivity collected in Italy. Reports for years 1966 to I 968.
75. Comitato Nazionale Energia Nucleare. Italy. Data on environmental radioactivity collected in Italy. Reports for the years 1966 to 1970.
76. Coulon, R. Unpublished.
157

77. Coulon, R. and C. Madelmont. Etude comparee chez l'homme du rapport 9 0 Sr/Ca dans I' alimentation et le tissu osseux. Commissariat a l'energie atomique, rapport CEA-R-3848. Fontenay-auxRoses, 1969.
78. Das Gupta, A. K. Radiation Surveillance in Canada. Department of National Health and Welfare, Canada. Quarterly reports RPD 80, 83, 85 (1970), and 96 (1971).
79. Das Gupta, A. K. Radiation Protection Division Report on Monitoring Programs for Period January-June 1972. Department of National Health and Welfare, Canada, 1972.
80. Dunster, H.J. and B. F. Warner. The disposal of noble gas fission products from the reprocessing of the nuclear fuel. U.K. Atomic Energy Authority report AHSB(RP) R 101. Harwell, Berkshire, 1970.
81. Drobinski, J.C. Jr., D. P. LaGotta. A. S. Goldin et aL · Analysis of environmental samples for carbon-14 and tritium. Health Phys. 11: 385-395 (1965).
82. Edvarson, K., K. Low and J. Sisefsky. Fractionation phenomena in nuclear weapon debris. Nature 184: 1771-1774 (1959).
83. Engstrom, A., R. Bjoernerstedt, C. J. Clemendson et aL Bone and Radiostrontium. Almquist and Wiksell. Stockholm, 1957.
84. Eriksson. E. An account of the major pulses of tritium and their effects in the atmosphere. Tellus 17: 118-130 (1965).
85. Eriksson, E. Vertical transport and depositions of atmospheric constituents, p. 117-122 in Technical note No. 68, Meteorological aspects of atmo· spheric radioactivity (W. Bleeker, ed.). World Meteorological Organization publication No. 619. TP. 83. Geneva, 1965.
86. Evans, C. and B. G. Bennett. The transfer of caesium-137 through the food chain to man. Health and Safety Laboratory report HASL-310. New York. 1976.
87. Fairhall, A. W., R. W. Buddemeir, I. C. Yang et aL Radiocarbon in the sea, p. 1-35-1-78 in Health and Safety Laboratory fallout program quarterly summary report HASL,242. New York, 1971.
88. Farges, L., F. Patti. R. Gross et al. Activite du krypton 85 dans !'air, hemispheres Nord et Sud, J. Radioanal. Chem. 22: 147,155 (1974).
89. Feely, H. W. Worldwide deposition of strontium-90 through 1975, p. 1-191-I-137 in Health and Safety Laboratory environmental quarterly report HASL-308. New York, 1976.
158
90. Feige, Y. Israel Atomic Energy Commission, Soreq Nuclear Research Centre. Personal communication.
91. Fiechter. W., W. J. Gibbs, J. R. Moroney et al Strontium-90 in the Australian environment during 1966. Aust. J. Sci. 30: 307-313 (1968).
92. Fiechter, W., W. J. Gibbs, J. R. Moroney et al Strontium-90 in the Australian environment during 1967. Aust. J. Sci. 31: 174-179 (1968).
93. Foyn, L. Some marine radioecological problems at the nuclear power station establishment at Oslofjorden. Fisheries Directorate Sea Research Institute report series B, No. 10. Bergen, Norway, 1973.
94. Fredriksson, L., A. Eriksson. Plant absorption of strontium-90 and caesium-137 from soil as influenced by soil organic matter. Forsvarets Forskningsanstalt Stockholm report FA0-4 A4485-4623, 1966.
95. Freiling, E. C. Radionuclide fractionation in bomb debris. Science 133: 1991-1998 (1961).
96. Gahinet, M. E., M. L. Remy, J.P. Moroni et al Etude de la radioactivite du regime alimentaire total au niveau des etablissements scolaires, p. 357-372 in Environmental Contamination by Radioactive Materials. IAEA publication STI/PUB/226. Vienna, 1969.
97. Garner. R. J. and R. S. Russell. Isotopes of iodine, p. 297-315 in Radioactivity and Human Diet (R. S. Russell, ed.). Pergamon Press, 1966.
98. Gavini, M. B., J. N. Beck and P. K. Kuroda. Mean residence times of the long-lived radon daughters in the atmosphere. J. Geophys. Res. 79: 4447-4452 (1974).
99. Gibbs, W. J ., W. K. Matthews. J. R. Moroney et al. Strontium-90 in the Australian environment during 1968. Aust. J. Sci. 32: 238-244 (1969).
100. Gjelsnes, S. 0., J. Hellesnes, L. Louby et al Assay of strontium-90 in human bone in Norway. Department of Chemistry, University of Oslo, Blindern, Norway, 1974.
101. Godfrey, B. E. and J. Vennart. Measurements of caesium-137 in human beings in 1958-1967. Nature 218: 741-746 (1968).
102. Gopalakrishnan, S., D. Rangarajan, L. U. Joshi et al. Measurements on airborne and surface fallout radioactivity in India. Bhabba Atomic Research Centre report BARC-679 (1973).
103. Gulliksen. S., R. Nydal and K. Lovseth. Further calculations of the C-14 exchange between the atmosphere and the oceans, p. A85-A9 l in Proceedings of the Eighth International Conference on Radiocarbon Dating. The Royal Society of New Zealand, October 1972.

• t
104. Gustafson, P. F. 137Cs in the U.S. diet 1961-1968 and the influence of climatic and agricultural factors, p. 135-143 in Environmental Contamination by Radioactive Materials. IAEA publication STI/PUB/226. Vienna, 1969.
105. Gustafson, P. F. and S.S. Brar. Gamma-ray doses from short-lived fission products from nuclear weapon tests. Health Phys. 9: 629-634 (1963).
106. Hagberg, N. Halten av caesium-137 i mejerimjolk 1970. Intern. basrapport SSI: 1971-005 in Arsrapport 1970, speciallaboratoriema. Statens strMskyddsinstitut rapport SSI: 1971-013 (1971).
107. Hagberg. N. Halten av caesium-137 i mejerimjolk 1973. Statens stnllskyddsinstitut report SSI: 1974-001 (1974).
108. Hagberg. N. Caesium-137 in dairy milk in Sweden 1974. Statens strruskyddsinstitut report SSI: 1975-001 (1975).
109. Hagberg, N. and H. Mohre. Halten av caesium-137 i mejerimjolk 1976. Statens str.Uskyddsinstitut report SSI: 1977-001 (1977).
110. Hardy, E. P. Jr. Fission product and activation product radionuclides at selected U.S. sites, p. 170-203 in Health and Safety Laboratory fallout program quarterly s~ummary report HASL-164. New York, 1965.
111. Hardy, E. P. Jr. 9 0 Sr fallout from atmospheric nuclear testing, p. 1-81-1-93 in Health and Safety Laboratory fallout program quarterly summary report HASL-227. New York, 1970.
112. Hardy, E. P. Jr. Radiostrontium in milk and tap water. Appendix D, in Health and Safety Laboratory fallout program quarterly summary report HASL-249. New York. 1972.
113. Hardy,E.P.Jr. On 137 Cs and 90 Sr in bone, p. 1-64-1-69 in Health and Safety Laboratory fallout program quarterly report HASL-278. New York, 1974.
114. Hardy, E. P. Jr. Depth distribution of global fallout Sr-90. Cs-137 and Pu-239, 240 in sandy loam soil. p. 1-2-1-10 in Health and Safety Laboratory fallout program quarterly summary report HASL-286. New York, 1974.
115. Hardy, E. P. Jr., J. Rivera and W.R. Collins, Jr. Health and Safety Laboratory fallout program quarterly summary report HASL-146. New York, 1964.
116. Hardy, E. P. Jr. Worldwide distribution of plutonium, in Plutonium and Other Transuranium Elements. U.S. Atomic Energy Commission report WASH-1359 (1974).
117. Harley, J. H. Unpublished.
118. Harley, J. H. Worldwide plutonium fallout from weapons tests, p. 13-19 in Proceedings of Environmental Plutonium Symposium. Los Alamos Scientific Laboratory r~port LA-4756 (1971).
119. Harley, J. H. UNSCEAR/WHO bone program, p. 11-4-II-7 in Health and Safety Laboratory fallout program quarterly summary report HASL-245. New York, 1971.
120. Harley, J. H. UNSCEAR/WHO bone program, p. II-7-II-9 in Health and Safety Laboratory environmental quarterly report HASL-297. New York, 1975.
121. Harley, J. H. UNSCEAR/WHO bone program, p. 11-7-II-8 in Health and Safety Laboratory fallout program quarterly summary report HASL-281. New York, 1974.
122. Harley. J. H. UNSCEAR/WHO bone program, p. 11-7-11-8 in Health and Safety Laboratory environmental quarterly report HASL-306. New York, 1976.
123. Hasanan, E. The occurrence of 1 3 7 Cs in the biosphere evaluated with environmental and metabolic studies. Department of Radiochemistry, University of Helsinki report series on radiochemistry 2 (1972).
124. Hasanan, E. and T. Rahola. The biological half-life of 137Cs and 24 Na in man. Ann. Clin. Res. 3: 236-240 ( 1971 ).
125. Health and Safety Laboratory. Cesium-137 in various Chicago foods, in Health and Safety Laboratory fallout program quarterly summary reports HASL-257, 259,274 and 278.
126. Hoang Chi Trach. Study of the fallout of artificial ferrum-55. Application to the evaluation of the fallout of natural iron of stratospheric origin. Commissariat a l'energie atomique, rapport CEA-R-3918. Saclay. 1970.
127. Hodge, V. F., T. R. Folsom and D.R. Young. Retention of fallout constituents in upper layers of the Pacific Ocean as estimated from studies of a tuna population, p. 263-276 in Radioactive Contamination of the Marine Environment. IAEA publication STI/PUB/313. Vienna. 1973.
128. Holm. E. and R. B. R. Persson. Transfer of fallout plutonium in the food chain lichen-reindeer-man, p. 435-445 in Transuranium Nuclides in the Environment. IAEA publication STI/PUB/410. Vienna, 1976.
129. Huber, 0., J. Halter and P. Winiger. Switzerland. Rapports de la Commission federale de la radioactivite a l'intention du Conseil federal pour les annees 1966 a 1972.
130. Huber, 0. I8e Rapport de la Commission federale pour l'annee 1974, a !'intention du Conseil federal. Switzerland, 1975.
159

131. Hvinden, T. Strontium-90 in Norwegian milk 1960.1976. Norwegian Defence Research Establishment report F-641 ( 1977).
132. Hvinden. T.. A. Aarkrog, 0. Castren et al The fallout in Denmark, Finland, Norway and Sweden in 1965-1~66. Report from a meeting of Scandinavian experts on radiation protection. Helsinki, May 11-12, 1967. National Institute of Radiation Protection, Stockholm, report SSI: 1967-035 (1967).
133. International Atomic Energy Agency. Environment Isotope Data nos. I, 2 and 3, Technical report series 96. 117 and 129. IAEA, Vienna, 1969, 1970 and 1971.
134. International Atomic Energy Agency. Inhalation Risks from Radioactive Contaminants. Technical report series 142. IAEA, Vienna, 1973.
135. International Commission on Radiological Protection. Task Group on Lung Dynamics. Deposition and retention models for internal dosimetry of the human respiratory tract. Health Phys. 12: 173-226 (1966).
136. International Commission on Radiological Protection. Task Group of Committee II. The metabolism of compounds of plutonium and other actinides. ICRP publication 19, Pergamon Press, 1972.
137. Jaakola, T. Analysis of 5 5 Fe produced by nuclear tests and its enrichment in Finnish Lapps. Paper No. 20 in Radioactive Foodchains in the Subarctic Environment. Annual Report for the period August 1968 to August 1969. Department of Radiochemistry. University of Helsinki, Finland.
138. Jaworowski. Z. Personal communication.
139. Jeanmaire, L., F. Patti and R. Gros. Teneur en strontium 90 d' os humains preleves en 1971. Commissariat a J'energie atomique, rapport CEA-N-1568 {1972).
140. Junge, C. E. Air Chemistry and Radioactivity. Academic Press, New York, 1963.
141. Karol, I. L. Numerical model of the global transport of radioactive tracers from the instantaneous sources in the lower stratosphere. J. Geophys. Res. 75: 3589-3608 ( 1970).
142. Krey, P. W., E. P. Hardy; E. Pachuki et al. Mass isotopic composition of global fallout plutonium in soil. p. 671-677 in Transuranium Nuclides in the Environment. IAEA publication STI/PUB/410. Vienna, 1976.
143. Korea. Republic of. Data for the effects of atomic radiation. Office of Atomic Energy. Communication.
160
144. Kuzhnikov, V. A. and E. V. Petuchova. Contents of strontium-90 and caesium-137 of global origin in food of the USSR population in 1970-1973. Moscow, 1976.
145. Lalit, B. Y. and T.V. Ramachandran. Unpublished.
146. Lalit, B. Y., S. Rajan and T.V. Ramachandran. Unpublished.
147. Lalit, B. Y., M. Subba Rao and S. B. Hingorani. Strontium-90 contamination of milk and food samples in India. Health Phys. 23: 47-54 (1972).
148. Langford, J.C. and C. E. Jenkins. The latitudinal variations of 5 5 Fe in man and cattle. Health Phys. 21: 71-77 (1971).
149. Leifer, R., M. Schoenberg and L. Tooke!. Updating stratospheric inventories to July 1975, p. 1-127-1-142 in Health and Safety Laboratory environmental quarterly report HASL-306. New York. 1976.
150. Libby, W. F., R. Berger, J. F. Mead et al. Replacement rates for human tissue from atmospheric radiocarbon. Science 146: 1170-1172 (1964).
151. Lindell, B. and A. Magi. The occurrence of caesium-137 in Swedish food, especially dairy milk, and in the human body after the nuclear test explosions in 1961 and 1962. Ark. Fys. 29: 69-96 (1965).
152. Liniecki, J. Instytut Medycyny Pracy, Poland. Communication.
153. List, R. J. and K. Telegadas. Using radioactive tracers to develop a model of the circulation of the stratosphere. J. Atnosph. Sci. 26: 1128-1136 (1969).
154. Machta, L., R. J. List, M. E. Smith, Jr. et al Use of natural radioactivity to estimate large-scale precipi· tation scavenging, p. 465-474 in Precipitation Scavenging. Proceedings of a symposium held at Richland, Washington, June 1970. U.S. Atomic Energy Commission Symposium Series 22. Oak Ridge, 1970.
155. Machta, L., G. J. Ferber and J. L. Heffter. Regional and global scale dispersion of 8 5 Kr for population-dose calculations, p. 411-426 in Physical Behaviour of Radioactive Contaminants in the Atmosphere. IAEA publication STI/PUB/354. Vienna, 1974.
156. Magi, A., J. 0. Snihs and G. A. Swedjemark. Some measurements on radioactivity in Sweden caused by nuclear test explosions. Radio!. Health Data and Reports 11: 487-510 (1970).
157. Mahmoud, K. A., M. K. Moloukhia, S. A. AbdelLatif et al Fallout and radioactive content of food chain in United Arab Republic during the year 1966. Environmental Laboratories, Radiation

Protection and Civil Defence Department. United Arab Republic Atomic Energy Establishment report. United Arab Republic Scientific Com· mittee on the Effects of Atomic Radiation, Vol. 9-1 (1967).
158. Mahmoud, K. A.. M. K. Moloukhia, S. A. AbdelLatif et al. Strontium-90 levels of fallout and of food diet in United Arab Republic Atomic Energy Establishment report. United Arab Republic Scientific Committee on the Effects of Atomic Radiation. Vol. 10-1 (1969).
159. Marei, A. N., R. M. Barkhudarov and N. Ya. Novikova. Radiation safety aspects of the geochemical areas with increased transfer of caesium•l37. Manuscript No. 0020-R-4.
160. Marshall, J. H., E. L. Lloyd and J. Rundo. Alkaline earth metabolism in adult man. Health Phys. 24: 129-221 (1973).
161. Mattern, F. C. M., R. Drost and L. Strackee. 90 Sr and 137Cs in the human diet in the Netherlands during 1967. Rijks Instituut voor de Volksgezondheit report RA-34. Utrecht, 1968.
162. McGregor, R. G .. E. R. Samuels and H. Taniguchi. Environmental radioactivity surveillance in Canada. 1969. Department of National Health and Welfare, Canada. Radiation Protection Division report RPD-78 (1970).
163. Medical Research Council. Assay of strontium-90 in human bone in the United Kingdom. Results for 1970. Monitoring report No. 19 ( 1973).
164. Meek, M. E. and B. F. Rider. Compilation of fission product yields. General Electric Co. Vallecitos Nuclear Center, Pleasanton, California report No. NED0-12154 (1972).
J65. Menossi, C. Fallout radiactivo debido a !as explosiones en el Pacifico Sur en el periodo enero-octubre de 1973. Comisi6n Nacional de Energia At6mica, report RS 47/ l 18. Buenos Aires. 1973.
166. Menossi, C.,. T. L. Escribano, H. A. Bruno et al Contaminaci6n radiactiva en la Argentina, debida a las explosiones en el Pacifico Sur durante 1974. Comisi6n Nacional de Energia At6mica, publicaci6n RS 56/163. Buenos Aires. 1975.
167. Michel, M. L. Tritium inventories of the world oceans and their implications. Nature 263: 103-106 ( 1976).
168. Ministerie van Sociale Zaken en Volksgezondheid, Netherlands. General radioactive contamination of the biosphere. Measurements in the Netherlands for 1968 and 1969.
169. Ministerie van Sociale Zaken en Volksgezondheid. Netherlands. General radioactive contamination of the biosphere. Measurements in the Netherlands for 1970. 1971 and 1972.
170. Mishra, U. C., A. S. Deshpande, R. Kerale Varma et al Caesium-137 and potassium in milk. Bhabba Atomic Research Centre report BARC-278 (1967).
171. Mishra, U. C., R. Kerale Varma and P. G. Karnath. Caesium-137 and potassium in Indian whole milk. Journal of Scientific and Industrial Research (India) 28: 354-358 (1969).
172. Mishra, U. C.. R. K. Verma and P. G. Karnath. Journal of Scientific and Industrial Research (India) 28: 354-358 (1969).
173. Miske!, J. A. Production of tritium by nuclear weapons, p. 79-84 in Tritium (A. A. Moghissi and M. W. Carter. eds.). Messenger Graphics, Phoenix, 1973.
174. Misono, K. Personal communication.
175. Mohindra, V. K. and J. H. Gordon. Caesium-137 levels in the Canadian North, January to June 1965, p. 3-12 in Data from Radiation Protection Programs 3: 10 (1965).
176. Moore, H. E., S. E. Poet and E. A. Martell. Tropospheric aerosol residence times indicated by radon and radon-daughter concentrations, p. 775-786 in The Natural Radiation Environment. U.S. Energy Research and Development Administration report CONF-820805-P2 ( 1972).
177. Morgan, A., J. Rundo, H. D. Wandervell et al Caesium-136 in rain and in milk. Nature 193: 1150-1151 (1962).
178. Morley, F. Personal communication.
179. Morley, F. and P. M. Bryant. Basic and derived radiological protection standards for the evaluation of environmental contamination, p. 255-272 in Environmental Contamination by Radioactive Materials. IAEA publication STI/PUB/226. Vienna. 1969.
180. Moroney, J. R. Personal communication.
181. Morsy, S. M. and M. Y. Abu-Bakr. Levels of potassium and caesium-137 in man in United Arab Republic during year 1968. United Arab Republic Atomic Energy Establishment, Radiation Protection Department report 1 Q.2 ( 1969).
182. Mukhin, I. Ye. Radioactivity of the external environment. food products, and the human organism in the Ukraine during 1962-1969.
183. Muller, J. Institute of Radiation Hygiene, Prague. Communication.
184. Munnich, K. 0. Circulation of radiocarbon in nature: Naturwissenschaften 50: 211-218 (1963).
185. National Council on Radiation Protection and Measurements. Krypton-85 in the atmosphereaccumulation, biological significance and control technology. NCRP report No. 44, July 1975.
161
186. National Institute of Radiological Sciences, Chiba, Japan. Caesium-137 body burden in Japanese male adults in Radioactivity Survey Data in Japan. Reports NIRS-RSD-7 (1965), NIRS-RSD-14 (1967), NIRS~RSD-26 (1970), NIRS-RSD-30 (1971).
187. National Radiation Laboratory, New Zealand. Environmental Radioactivity in New Zealand. Reports Nos. NRL-R33 (1969), 34 (1969), 35 (1970), 36 (1970), 37 (1970) and 43 (1971). Christchurch, New Zealand.
188. National Radiation Laboratory. Environmental Radioactivity in New Zealand. Annual reports 1972, 1973. I 974. Reports NRL-F /50 (1973), NRL-F/42 (1974) and NRL-F/54 (1975).
189. Neill, R.H. and P.R. Robinson. Radiation doses to children's thyroids from iodine-131 in milk. Radio!. Health Data and Reports 10: 1-9 (1969).
190. Netheiway. D.R. and G. W. Barton. A compilation of fission product yields in use at Lawrence Livermore Laboratory. Lawrence Livermore Laboratory report URCL-51458 (1973).
191. Norwegian Institute for Water Research. Release of radioactive materials from nuclear power stations. Report No. 2. Dispersal mechanisms, pathways and concentration factors for radionuclides in the cooling waters. Report 0-177 /70 (1974).
192. Noshkin. V. E. Ecological aspects of plutonium dissemination in aquatic environments. Health Phys. 22: 537-549 (1972).
193. Noshkin. V. E. and V. T. Bowen. Concentrations and distribution of long-lived fallout radionuclides in open ocean sediments, p. 671 in Radioactive Contamination of the Marine Environment. IAEA publication STI/PUB/313. Vienna. I 973.
194. Nydal, R., K. Lovseth and 0. Syrstad. Bomb 14 C in the human population. Nature 232: 418-421 (1971).
195. O'Brien, B. J. Internal radiation dose commitments in the northern temperate zone from 8 9 Sr, 140 Ba, 131 I and 1 3 6 Cs produced in nuclear tests. Health and Safety Laboratory environmental quarterly report HASL-318. New York, 1977.
196. O'Brien, B. J. Personal communication.
197. Palmer, H. E. and T. M. Beasley. Iron-55 in man and the biosphere. Health Phys. 13: 889-895 (1967).
198. Pellerin, P. Unpublished.
199. Persson, R. B. R. Iron-55 in Northern Sweden: relationships and annual variation from 1956 until 1967 in lichen and reindeer as well as uptake and metabolism in man. Health Phys. 16: 69-78 (1969).
162
200. Persson, R. B. R. Radiological health aspects of the environmental contamination from radioactive materials in Northern Sweden. Thesis, University ofLund, 1970.
20 I. Peterson, K. R. An empirical model for estimating worldwide deposition from atmospheric nuclear detonations. Health Phys. 18: 357-378 (1970).
202. Pillai, K. C., R. C. Smith and T. R. Folsom. Plutonium in the marine environment. Nature 203: 568-571 (1964).
203. Pohl, E. and J. Pohl-Ruling. Die Strahlenbelastung der Bevolkerung Badgastein, Osterreich. Ber. Nat. Med. Ver. Innsbruck 57: 95-110 (1969).
204. Public Health Service. Public Health Service Pasteurized Milk Service. 1962-1966. Radial. Health Data, Vol. 3-6.
205. Radiation Protection Division, Department of National Health and Welfare, Ottawa, Canada. Data from Radiation Protection Programs. Vols. 4-6 (1966-1968).
206. Republique fran~se. Retombees radioactives a la suite des tirs nucleaires en Polynesie. Reports for the years 1966 to 1968, and 1970 to 1971.
207. Republique franyaise. Retombees radioactives a la suite des tirs nucleaires en Polynesie. Juin-octobre 1971.
208. Rafter. J. A. and B. J. O'Brien. Exchange rates between the atmosphere and the ocean as shown from recent 14 C measurements in the South Pacific. Paper presented at the Twelfth Nobel Symposium on Radio-carbon Variations and Absolute Chronology. Uppsala. August 1969.
209. Rafter. T. A. and B. J. O'Brien. 1 4 C measurements in the atmosphere-a recalculation of the exchange rates between the atmosphere and the oceans. Proceedings of the 8th International Conference on Radio-carbon Dating. The Royal Society of New Zealand, October 1972.
210. Rechen, H.J. L.. R. L. Mikkelsen. 0. C. Birscoe et al Caesium-137 concentrations in Alaskans during the spring of 1967. Radio!. Health Data and Reports 9: 705-717 (1968).
211. Reiter. E. R. Age estimate of atmospheric air. U.S. Atomic Energy Commission report C00-1340-35 (1973).
212. Reiter. E. R. The role of the general circulation of the atmosphere in radioactive debris transport. U.S. Atomic Energy Commission report C00-1340-38 (1974).
213. Richmond. C.R. and E. M. Sullivan. Annual report of the biomedical and environmental research program of the HASL Health Division. Los Alamos Scientific Laboratory report LA-5633-PR (1974).

,, i
214. Ringhals Nuclear Power Station. Report on release limits for liquid effluents for the 3 + 4 reactor at Ringhals Nuclear Power Station. Sweden, June 1975.
215. Rivera, J. and J. H. Harley. The HASL bone program 1961-1964. U.S. Atomic Energy Commission report HASL-163. New York, 1965.
216. Roessler, G. C., B. G. Dunavant and C. E. Roessler. Caesium-137 body burdens in Florida residents. Health Phys. 16: 673-679 (1969).
217. Romney,E.M. and J.J.Davis. Ecological aspects of plutonium dissemination in terrestrial environments. Health Phys. 22: 551-557 (1972).
218. Salo, A. Personal communication.
219. Sanders, S. M. and W. C. Reinig. Diagnosis and treatment of deposited radionuclides. in Excerpta Medica Foundation (1968).
220. Schell, W.R., S. Sanzay and B. R. Payne. World distribution of environmental tritium, p. 375-395 in Physical Behaviour of Radioactive Contaminants in the Atmosphere. IAEA publication STI/PUB/354. Vienna, 1974.
221. SehmeL G. A. and F. D. Lloyd. Particle resuspension rates, in Atmosphere-Surface Exchange of Particulates and Gaseous Pollutants. U.S. Energy Research and Development Administration report CONF-740921. Oak Ridge, 1976.
222. Service central de protection contre Jes rayonnements ionisants. Rapports mensuels d'activite couvrant Jes annees 1967 a 1973. Le Vesinet. France.
223. Sisefsky, J. and G. Persson. Fractionation properties of nuclear debris from the Chinese test. Health Phys. 18(4): 347-357 (1970).
224. Smith, D. D., J. Barth and R. G. Patzer. Grazing studies on a plutonium contaminated range of the Nevada test site, p. 325-335 in Transuranium Nuclides in the Environment. IAEA publication STI/PUB/410. Vienna, 1976.
225. Spiers, F. W. Radioisotopes in the Human Body: Physical and Biological Aspects. Academic Press, New York and London. 1968.
226. Spiers, F. W., G. D. Zanelli, P. J. Darley et al Beta-particle dose rates in human and animal bone, p. 130-148 in Biomedical Implications of Radiostrontium Exposure. U.S. Atomic Energy Commission Symposium Series 25 (1972).
227. Stieve. F. E. Personal communication.
228. Suomela, J. Halten av strontium-90 i mejerimjolk 1970. Intern. basrapport SSI: 1971-006 in Arsrapport 1970, speciallaboratorierna. Statens Strhlskyddsinstitut report SSI: 1971-013 (1971 ).
229. Suomela, J. Halten av strontium-90 i mejerimjolk 1973. Statens Strfilskyddsinstitut report SSI: 1974-002 (1974).
230. Suomela, J. Strontium-90 in dairy milk in Sweden 1974. Statens StrMskyddsinstitut report SSI: 1975-002 (1975).
231. Suomela, M. 1 3' Cs-level in the control group of
the Institute of Radiation Physics in 1968-1970. p. 57-63 in Studies of Environmental Radioactivity in Finland 1968-1970. Institute of Radiation Physics report SFL-A 17. Helsinki, 1971.
232. Suomela, M. Caesium-137 level in the control group of the Institute of Radiation Protection in 1971-1975. Institute of Radiation Physics, report SFL-A2 l. Helsinki, 1976.
233. Swedjemark G. A. Unpublished.
234. Tanaka, G., H. Kawamura and S. Iguchi. Strontium-90 in human bone in 1971. Radioactivity Survey Data in Japan. National Institute of Radiological Sciences report NIRS-RSL-36 (1972).
235. Tanaka, G., H. Kawamura and Y. Matsumoto. Strontium-90 in human bone in Radioactivity Report Survey Data in Japan. National Institute of Radiological Sciences report NIRS-RSD-40 (1975).
236. Tanaka, G., H. Kawamura and E. Momura. Strontium-90 in human bone in Japan during 1973-1975. Unpublished.
237. Taniguchi, H., R. G. McGregor, M. P. Measures et al Environmental radioactivity surveillance for July-December 1972. Department of National Health and Welfare. Canada, 1972.
238. Troitskaya, M. N., M. S. lbatullin, B. Y. Litver et al Analysis of 1 3 'Cs clearance rate variations of the chain lichen-reindeer-man. Research Institute of Public Health report 32-R-4, Leningrad.
239. Uchiyama, M. and G. Tanaka. Caesium-137 body burden in Japanese male adults during the period February 1973 to May 1976. Unpublished.
240. Ueda, T., Y. Suzuki and R. Nakamura. Transfer of 1 3 'Cs and 9 0 Sr from the environment to the Japanese population via the marine environment. Population Dose Evaluation and Standards for Man and his Environment. IAEA publication STI/PUB/375. Vienna, 1974.
241. United Nations. Report of the United Nations Scientific Committee on the Effects of Atomic Radiation. Official Records of the General Assembly. Seventeenth Session. Supplement No. 16 (A/5216). New York, 1962.
163

242. United Nations. Report of the United Nations Scientific Committee on the Effects of Atomic Radiation. Official Records of the General Assembly, Nineteenth Session, Supplement No. 14 (A/5814). New York, 1964.
243. United Nations. Report of the United Nations Scientific Committee on the Effects of Atomic Radiation. Official Records of the General Assembly, Twenty-first Session , Supplement No. 14 (A/6314). New York, 1966.
244. United Nations. Report of the United Nations Scientific Committee on the Effects of Atomic Radiation. Official Records of the General Assembly, Twenty-fourth Session , Supplement No. 13 (A/7613). New York, 1969.
245. United Nations. Ionizing Radiation: Levels and Effects. A report of the United Nations Scientific Committee on the Effects of Atomic Radiation to the General Assembly, with annexes. United Nations publication, Sales No. E.72.IX. l 7 and 18. New York, 1972.
246. United States Department of Health, Education and Welfare. National Food Consumption Survey: Fresh whole milk consumption in the U.S.A. July 1962. Radio!. Health Data 4: 15-17 (1963).
247. United States Department of Health, Education and Welfare, Public Health Service. Radio!. Health Data and Reports from 1966 to 1974.
248. Voilleque, P. G. and C. A. Pelletier. Comparison of external irradiation and consumption of cows milk as critical pathways for 137Cs, 54 Mn and 144 Ce-14
4 Pr released into the atmosphere. Health Phys. 27: 189-199 (1974).
249. Volchock, H. L., L. Toonkel and M. Schonberg. Radionuclides and lead in surface air, p. B-1-B-130 in Health and Safety Laboratory environmental quarterly report HASL-291. New York. 1975.
250. Westerlund, E. A. 137-Cs body burden in Norwegian Lapps 1965-197 5. State Institute of Radiation Hygiene report 1976. Osteras, Norway.
251 . Whitton. J. Dose arising from inhalation of noble gases. Berkeley Nuclear Laboratories report RD/B/Nl274 (1968).
252. Woodard, H. W. The elementary composition of human cortical bone. Health Phys. 8: 513-517 (1962).
253. World Health Organization. Environmental radioactivity. Data on milk contamination level in the world. Prepared by the International Reference Center for Radioactivity. Reports for the years 1970 to 1976.
164
254. Wrenn, M. E. Environmental levels of plutonium and the transplutonium elements, p. 89-114 in Plutonium and Other Transuranium Elements. U.S. Atomic Energy Commission report WASH-1359 (1974).
255. Ziman, K. E. The future C02 burden of the atmosphere and 14-C in ethanol from wines, p. A85-A9 I in Proceedings of the 8th International Conference on Radiocarbon Dating. The Royal Society of New Zealand. October 1972.
256. ArleKcaxHH., P. M., 11. T. Mo0ceeB, <I>. A. T11xoMHJJOB. ArpoXHMHSI ueJHSl-137 H ero HaKOilJJeHHe CCJJhCKOX03SlliCTBeHHbIMH pacre!iIDIMM. Arl>OXHMIBL, Ng 2: 129-142 (1977).
257. !CmoKHHKOB, B. A.. 3. B. neT)'XOBa, IO. c. CTenaHOB H JIP. TiocT}'IlJieHJUI CTpOHUIDl-90 c rnnueBbrM pau110HOM HaceneIDUO CCCP B 1959-1967 IT. B pe3yJib Tine crparnc<t>epHbIX BbmanemnL ATOMHJDaT, MocKB3, 1969.
258. KHH)l(HHKOB, B. ;\. , 3. B. TieT)'XOBa, P. M. 6apxy,napoB. TiocT)'rurettue Sr90 11 Cs137 ttace:rettmo CoseTcKoro Coic3a c rnnueBhrM paUHOHOM B 1967-1969 IT. f11metta 11 camrrapID!: 8: 54 (1971).
259. Mapeii, A. H., 6. K. EopHCOB. 0 co.nep;Kamrn CTpomri,rn-90 B KOtTHm°i ncaHH ttace.nett1rn: CoseTcKoro Co10Ja B 1969 ro.zzy. Heony6JrnKOBaHo.
260. MapeCt, A. H. , E. K. 6op11cos . .lbrna~Ka Sr90 B KOCTHOH n:aHH ttaceJieHHSI CoseTc1wro Co103a Ja 1969-1971 rr. rHrnetta H camrrapllii: 7: 56 (1972).
261. Mape11,·A. H. , P. M. Eapxy.napos, H. 51. HoBHKOBa. UeJHll-137 rno6aJibHblX Bbma.neHHif KaK HCTOtfHHX o6mn-1eHHS1 ttaceneHHR nonecbsi. B ne'-!aTH.
262. Mo11cees. · A. A. . n. B. PaMJaes. UeJm"'i-137 B 6HOCQ)epe. MocKBa, A TOMHJDaT, 1975.
263. TieT)'xoaa, 3. B .. B. A. KHIDKHHKOB. Co.nep;KaHHe CTpOHUMSl-90 Ii UCJHSl-137 B rnuueB0!-1 pauHOHe HaceneHJffi CoseTcKoro Co103a B 1967-1969 rr. Heony6JIBKoBaHo.
264. Tieryxoaa, 3. B., B. A. KHH)l(HHKOB. TioCT}'IIJieHHe CTJ)OHUl1Sl-90 Joi ue3ltll-I37 C ruuueBbL\1 parniOHOM ttace.neRmo CoBeTCKoro Co103a B 1966-1967 rr. a pe3y Jlb Ta Te CTpaTOcq>eplfbtx Bbma.!leHHH, A TOM HJ· .naT. MocKaa, 1968.
265. TipoKOq>beB, 0. H., M. A. Hesc-rpyeaa, A. A. fleposa 11 .np. UeJHC!-137 rno6a.m,Hb1x Bbmanemm a npo.zzyr...,ax nHTaHHsi a opraHHJMe qenoBeKa, ATOMMJ.!laT. MocKBa. 1969.
266. Cus1rnueB, IO. B.. B. A. KaHapef1KHH, 0 . M. ApyTHHOB. J13MeHeHHe KOHUCHTpatnrn Cs137 B opraHMJMe tJenoseKa. Pa.IJJ106110.nonur 6: 822-825 (1966).
267. T10p10i-:att0Ba, 3. E. 0. MHTJ)allHH CTJ)OHUHSl-90 11 ueJI-rn-137 B nolfBaX. rocy.napCTBCHHblH KOMITTeT no 11cnoJlhJOBaHJoo aTOMHOH 3Hepnm CCCP. MocKsa, 1972.