united nations conference on trade and development...
TRANSCRIPT
ORIGINAL: English Preliminary draft for discussions only Please DO NOT Quote November 2007
UNITED NATIONS CONFERENCE ON TRADE AND DEVELOPMENT
Domestic Financial Resource Mobilization in Africa Namibia Case Study *
…………………………….. * This paper, requested by UNCTAD, was prepared by, Ms. Eline van der Linden for the Workshop on Domestic Financial Resource Mobilization in Africa, University of Mauritius, Mauritius, (28-30 November 2007). This project is funded by the UN Development Account (5th Tranche). The terminology used in the paper and the views expressed are those of the author and do not necessarily reflect the views of the UNCTAD Secretariat.
Case Study: NAMIBIA
(Final Draft July 2007)
“Expanded access to financial products and services is not in itself an ultimate goal but rather an important objective en route to the broader goal of reducing poverty. On the one hand, financial products and services such as insurance or secure savings play an important role in alleviating the effect of shocks to income caused by death, illness or weather conditions thereby reducing vulnerability to poverty. On the other hand, a sustainable route out of poverty usually includes the ability to take advantage of income generating opportunities and to build capital, whether human or otherwise, through investment of money over time. For all of this to happen, all Namibians need access to affordable financial products and services.” (Draft Namibian Financial Sector Charter, May 2007)
Prepared by drs. Eline van der Linden of TRENDLINE Economic & Management Services,
Windhoek, Namibia
Abbreviations AIDS Acquired Immune Deficiency Syndrome BEE Black Economic Empowerment BoN Bank of Namibia CBS Central Bureau of Statistics CMA Common Monetary Area DBN Development Bank of Namibia EE Employment Equity EPZ Export Processing Zone ETSIP Education and Training Sector Improvement Programme FDI Foreign Direct Investment FIAS Foreign Investment Advisory Service GDP Gross Domestic Product GDS Gross Domestic Savings GNS Gross National Savings GFCF Gross Fixed Capital Formation GIPF Government Institutions Pension Fund HIV Human Immunodeficiency Virus IRS Internal Registered Stock JSX Johannesburg Stock Exchange LDC Least Developed Country LMIC Low Middle Income Country MCA Millennium Challenge Account MCC Millennium Challenge Corporation MDGs Millennium Development Goals MoF Ministry of Finance MTEF Medium-Term Expenditure Framework NAD Namibian Dollar NAMFISA Namibian Financial Institutions Supervisory Agency NFSC Namibia Financial Sector Charter NHE National Housing Enterprise NHIES Namibia Household Income and Expenditure Survey NSX Namibia Stock Exchange ODA Official Development Assistance SAR Southern African Region PPP Public Private Partnership SME Small and Medium Enterprise SOE State Owned Enterprise SSA Sub-Sahara Africa TBs Treasury Bills UNCTAD United Nations Conference on Trade and Development UNDP United National Development Programme US$ US Dollar
Generous contributions were made by the Ministry of Finance, the Bank of Namibia (BoN), the Central Bureau of Statistics (National Planning Commission), the Namibia Financial Institutions Supervisory Agency, the Namibia Stock Exchange, Standard Bank, First National Bank and the Development Bank of Namibia.
1 Features of Namibia relevant to the Study
1.1 Salient Features and Drivers of the Economy
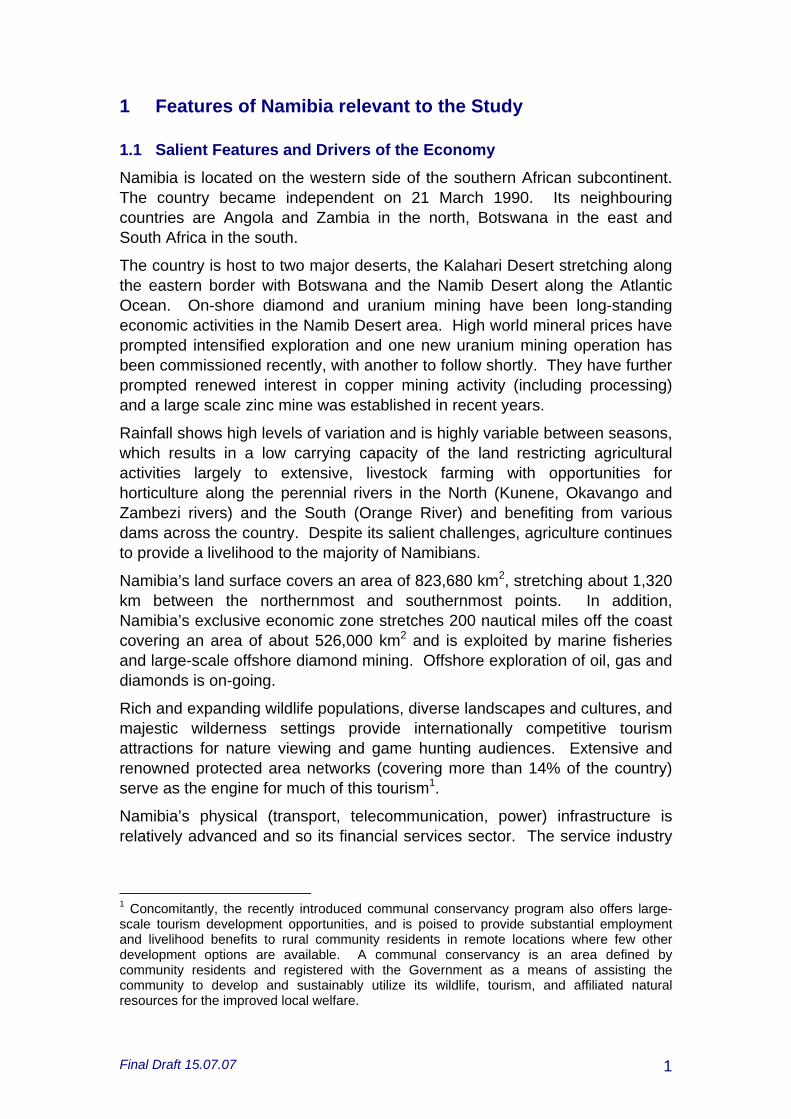
Namibia is located on the western side of the southern African subcontinent. The country became independent on 21 March 1990. Its neighbouring countries are Angola and Zambia in the north, Botswana in the east and South Africa in the south.
The country is host to two major deserts, the Kalahari Desert stretching along the eastern border with Botswana and the Namib Desert along the Atlantic Ocean. On-shore diamond and uranium mining have been long-standing economic activities in the Namib Desert area. High world mineral prices have prompted intensified exploration and one new uranium mining operation has been commissioned recently, with another to follow shortly. They have further prompted renewed interest in copper mining activity (including processing) and a large scale zinc mine was established in recent years.
Rainfall shows high levels of variation and is highly variable between seasons, which results in a low carrying capacity of the land restricting agricultural activities largely to extensive, livestock farming with opportunities for horticulture along the perennial rivers in the North (Kunene, Okavango and Zambezi rivers) and the South (Orange River) and benefiting from various dams across the country. Despite its salient challenges, agriculture continues to provide a livelihood to the majority of Namibians.
Namibia’s land surface covers an area of 823,680 km2, stretching about 1,320 km between the northernmost and southernmost points. In addition, Namibia’s exclusive economic zone stretches 200 nautical miles off the coast covering an area of about 526,000 km2 and is exploited by marine fisheries and large-scale offshore diamond mining. Offshore exploration of oil, gas and diamonds is on-going.
Rich and expanding wildlife populations, diverse landscapes and cultures, and majestic wilderness settings provide internationally competitive tourism attractions for nature viewing and game hunting audiences. Extensive and renowned protected area networks (covering more than 14% of the country) serve as the engine for much of this tourism1.
Namibia’s physical (transport, telecommunication, power) infrastructure is relatively advanced and so its financial services sector. The service industry
1 Concomitantly, the recently introduced communal conservancy program also offers large-scale tourism development opportunities, and is poised to provide substantial employment and livelihood benefits to rural community residents in remote locations where few other development options are available. A communal conservancy is an area defined by community residents and registered with the Government as a means of assisting the community to develop and sustainably utilize its wildlife, tourism, and affiliated natural resources for the improved local welfare.
Final Draft 15.07.07 1
(Government services, financial services, telecommunications, tourism and transport) is another main driver of economic growth in Namibia.
Since Independence, the economy has seen a transformation from a purely natural-resource based economy to a more diversified economy with some processing of natural materials (for example diamonds and marble) and other value added activities (for example textiles), a stronger contribution of the services sector, notably the transport, tourism and financial service sectors, and emerging diversification into on-land marine and freshwater fish farming, exploitation of indigenous natural plants and fruits, and high value irrigation production (for example grapes and dates).
Despite these new developments, the mining sector, including exploration activities, remains a key driver of the economy and is largely financed through FDI. Recent major capital injections in the telecommunications sector were also FDI resourced.
1.2 Population and Physical and Services Infrastructure Coverage
The population of Namibia increased from 1.41 million in 1991 to 1.83 million in 2001. The rate of population growth decreased from 3.1% in 1991 to 2.6% in 2001, mainly due to the high HIV/AIDS infection rates. Close to 40% of the population is aged below 15 years. Namibia is the second least densely populated country (2.2 persons per km2) after Mongolia, with 67% of its population residing in the rural areas, while 28% of all households obtain their main household income from farming activities (though with significant regional differences). The population is more concentrated in the northern areas along the perennial rivers, in the central area around the capital Windhoek and at the coastal towns in the west.
The sheer size of the country combined with low population densities constrains the physical and services infrastructure coverage, with large parts of the rural areas un- or under-serviced by the modern-technology services available in urban and peri-urban centres.
1.3 Poverty Profile and MDGs
During the 1990s Namibia was treated as if it was a “lower income country” (LIC), as per the World Bank Atlas method classification. However, today it is classified as “lower middle income country” (LMIC) with GDP per capita of about US$2,8432, an average that hides considerable disparities. According to the Namibia Household Income and Expenditure Survey (NHIES) of 2003/04, the richest 10% of the households accounts for nearly half of the total income of private households.
The income gap between rural and urban areas and the image of a good urban life fuel migration from rural areas to major cities, which has in turn tended to increase urban poverty. Poverty is higher among the “historically 2 UNDP, Human Development Report 2006
Final Draft 15.07.07 2

disadvantaged groups”3. Namibia represents a typical dualistic economy where abject poverty exists alongside extremes of wealth.
Wide disparities in infrastructural development between the impoverished northern parts of the country where most of the population lives, and the central and southern regions, unequal access to quality education and health services represent other dimensions of poverty in Namibia. The economic and geographical dualism, partly a legacy of the country’s colonial past, poses one of the biggest challenges to the fight against poverty in Namibia. HIV/AIDS is yet another challenge with considerable socio-economic costs, especially to the poorest groups. Low productivity of affected and infected working population as well as the increasing number of orphaned children poses a country-wide challenge.
The reclassification to LMIC has resulted in a declining trend in Official Development Assistance (ODA) and restricts access to some funding sources, while, for those multilateral funds for which Namibia is eligible, it is competing against LIC countries and Least Developed Countries (LDCs). These developments are particularly worrisome in light of a UNDP Namibia3 estimated resource gap of NAD8.5 billion for achieving the MDGs and Vision 2030 development goals.
1.4 Relevant Policy Framework
Given the constraints to the unilateral use of monetary and trade policies because of its membership of the Common Monetary Area (CMA)4 and the Southern African Customs Union (SACU)5, the Namibian Government has used fiscal policy as the main tool to accelerate economic growth and development.
Free capital flows allow for more efficient allocation of capital among the CMA member countries. Access to South Africa’s financial markets helps financial institutions diversify risks. Similarly, the peg to the rand has helped reduce inflation and provide predictability in exchange markets. However, membership in the CMA means that Namibia’s monetary policy must follow South Africa’s and capital can flow rapidly in response to macroeconomic or exchange rate shocks. The open capital market also limits the "independence" of financial policies.
3 Apartheid has left a legacy of under-development among certain groups in society, mainly referring to black Namibians but also to white women, which are under the new, independent dispensation referred to as “historically disadvantaged groups”. 4 The CMA is the area of coordination of the monetary and exchange rate policies of Lesotho, Namibia, South Africa, and Swaziland. Under the CMA, the Namibian dollar is pegged one-to-one to the South African rand. The rand is also legal tender. The CMA guarantees free capital flows among the member countries and access for the Namibian Government and financial institutions to South Africa’s financial markets. South Africa also compensates Namibia for lost seigniorage due to the rand circulating in Namibia. 5 Namibia is a member of SACU together with South Africa, Botswana, Lesotho and Swaziland.
Final Draft 15.07.07 3

The CMA requires Namibia to conform to South Africa's foreign exchange control practices for countries outside the CMA. This requirement limits options for global diversification and hence constrains the investment options of pension funds and insurance companies. The on-going South African liberalization should, however, reduce distortions induced by exchange controls. (IMF, 2007b)
1.5 Summary
Namibia’s main economic activity is centred on mining, services (government services, financial services, telecommunications, tourism and transport, marine fisheries and agriculture (extensive livestock farming). Large investments in mining are typically FDI financed. Recent large-scale investments in the telecommunications sector were also FDI resourced.
Physical and services infrastructure coverage faces obvious constraints in Namibia due to its sheer size and low population density. High income disparities and wide disparities in infrastructure coverage reflects a typical dualistic economy where abject poverty exists alongside extremes of wealth.
Due to Namibia’s membership of the CMA and SACU, fiscal policy has been the main tool to accelerate economic growth and development.
Final Draft 15.07.07 4
2 Trends in Domestic Savings and related Indicators
2.1 Domestic Savings
Gross National Savings (GNS) comprise of public savings – the difference between Government current revenue and expenditure – and private savings. Private savings in Namibia consists of personal and corporate savings. In the national accounts the two types of private savings are not separated. A substantial amount of personal private savings is accounted for by contractual savings, which essentially involves individuals committing themselves to a series of payments such as premiums on insurance policies and contributions to pension funds. A 2003 paper on the structure and nature of savings in Namibia by the Research Department of BoN estimates contractual savings at 60% of total private domestic savings (Uanguta, E. and others, 2004). Contractual savings are not as strongly influenced by typical factors that affect savings, making total private domestic savings relatively robust.
It should be noted that non-contractual savings by individuals is relatively low, given high levels of poverty among one-third of households, limited access to financial services in the rural areas, relatively low real deposit rates and a strong inclination to consumerism among the middle to high income groups. These factors are further explored below and in Section 4 of this paper.
Cross-country econometric evidence indicates that private savings are mainly determined by income per capita, economic growth and demographic factors (particularly, dependency ratios). Other determinants include interest rates, liquidity and borrowing constraints, fiscal policy, macro-economic stability, external debt and the terms of trade (Brownbridge, M., 2007). There are quite a number of economic theories around these variables, more and less conclusive. A central point in the discussion is the extent to which domestic savings stimulate economic growth.
The finance-growth nexus debate experienced a renaissance in the last decade. Most of the research in the 1990s supported the hypothesis that finance plays a determining factor in economic growth. However, more recent approaches conclude that the impact of finance on growth runs primarily through productivity and not through savings per se. Money will follow opportunity; to make money available for domestic development does not create growth automatically. The more recent empirical and theoretical literature suggests that the financial system does, however, play a significant role in the growth process. This means that from a policy perspective, the further deepening of the financial sector is an important instrument to stimulate investment and therefore long-term economic growth. (Ritter, R., 2007)
A 2000 study on the determinants of private domestic savings in Namibia (Uanguta, E.N., 2000) ventured into an in-depth econometric analysis covering the period 1980-1998, focusing on income, interest rates, liquidity and borrowing constraints, public savings and macro-economic stability.
Final Draft 15.07.07 5

Despite the scientific approach, the study provided only limited insight into the determinants of private domestic savings in Namibia. The empirical analysis (applying various models) found a weak causality running from private domestic savings to growth but no causality from growth to savings. A more conclusive and positive linkage was found between the income and tax variables in the model and private domestic savings, in both the short- and long run. No discernable effect of inflation and the rate of return (the real deposit rate) on private domestic savings could be established.
The trend analysis applied by the UNCTAD series of case studies is far less sophisticated and merely places Gross National Savings (GNS) in context. In the absence of any econometric analysis, only some crude observations can be made. It is further important to note that data sources vary quite considerably and this study has opted to make use of the published National Accounts data by the Central Bureau of Statistics (CBS) as the basis, with all its known and unknown shortcomings6. The period under review is 1993-20057.
6 Various instances of “creative” categorization may artificially be boosting GFCF. For instance, operational expenditure of the national carrier, Air Namibia, was recorded as capital formation. 7 Namibia gained Independence in 1990 and its National Accounts had to be set up in line with international standards. The Central Bureau of Statistics (CBS) is comfortable to share the detailed data tables as from 1993 only with a summary table on GDP available for the period 1980-2005, which does not include most of the relevant indicators. As a result, the trend analysis limits itself to the period 1993-2005.
Final Draft 15.07.07 6

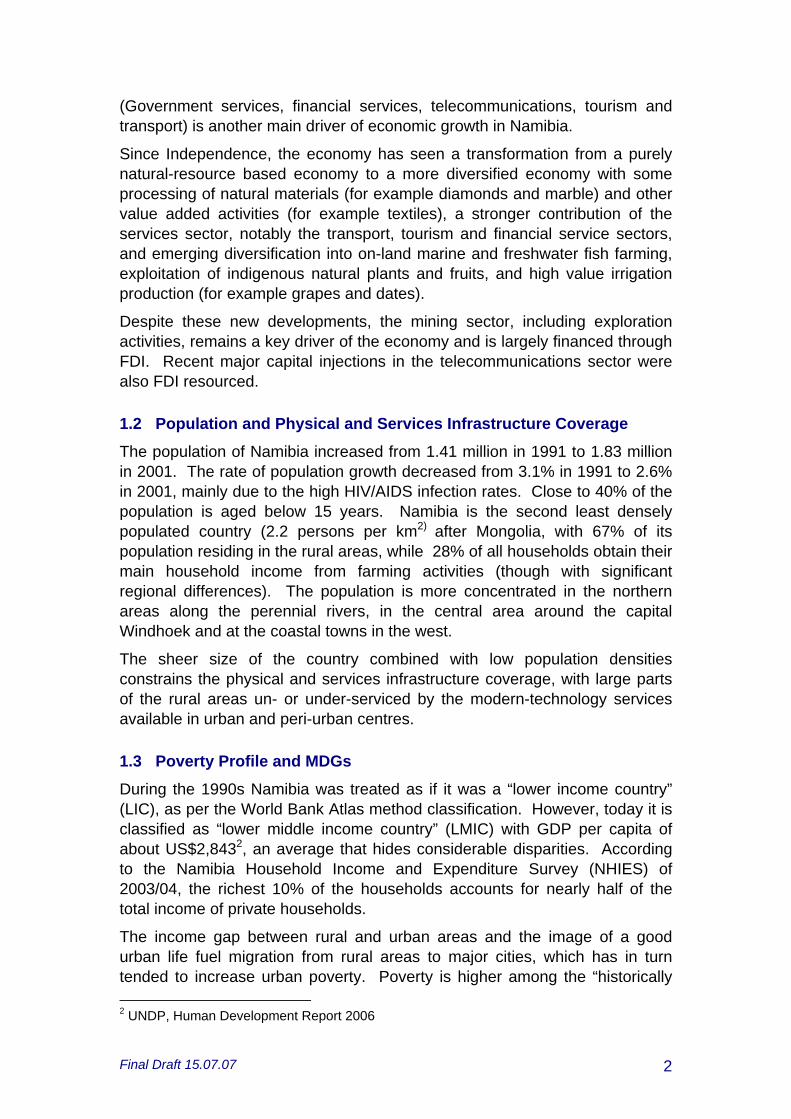
Fig. 2.1: Gross National Savings compared to Gross Fixed Capital Formation
0
5
10
15
20
25
30
35%
GFCF/GDP (%) 21 20 22 24 20 23 23 19 22 21 29 26 27GNS/GDP (%) 23 28 29 26 22 25 22 25 24 28 33 30 28
1993 1994 1995 1996 1997 1998 1999 2000 2001 2002 2003 2004 2005
Source: Republic of Namibia: Central Bureau of Statistics/National Planning Commission, 2006
In 2004, Namibia’s saving rate (30%) was well above the SSA average (16%), and even above the average for the middle income countries. The rate of capital investment (26%) was also well above the SSA average (19%), and matched the rate for the middle income countries. Government savings in Namibia are low within 0-4% for the period of 1995-2003, above the SSA average (just over 2% of GDP)
Namibia is in a rather unique yet challenging situation whereby the financial sector experiences excessive liquidity while economic expansion in the real sector is unable to tap into these resources, for various reasons that are explored in this paper.
Final Draft 15.07.07 7

Fig. 2.2: GNS in relation to GDP per Capita
-
2,000
4,000
6,000
8,000
10,000
12,000
N$
mill
ion
0
2,000
4,000
6,000
8,000
10,000
12,000
14,000
16,000
18,000
20,000
N$
GNS, private (N$ mill) 1,914 2,908 3,398 3,819 3,288 4,142 3,851 5,514 6,434 8,878 11,220 9,710 9,321 GDP per capita, current (N$) 6,204 7,469 7,971 9,136 9,877 10,736 11,459 12,723 14,853 17,220 17,293 18,081 18,874
1993 1994 1995 1996 1997 1998 1999 2000 2001 2002 2003 2004 2005
Source: Republic of Namibia: Central Bureau of Statistics/National Planning Commission, 2006
There appears to be a reasonably strong trend correlation between GDP per capita and GNS private. This observation would square with cross-country econometric evidence (Brownbridge, M., 2007) and with the empirical analysis carried out by the Namibian Economic Policy Research Unit (Uanguta, E.N., 2000) and earlier econometric work on savings and investments in Namibia by the BoN Research Department (Shiimi, I.W. and G. Kadhikwa, 1999), which suggested that saving in Namibia is only significantly influenced by real disposable income
Pension fund contributions for salary earners are determined by a fixed percentage of the salary. Higher incomes will result in higher total private savings. Premiums for long-term insurance policies may fluctuate according to the policy taker’s level of income. Corporate savings are likely to follow contractions and expansions of the economy.
Final Draft 15.07.07 8
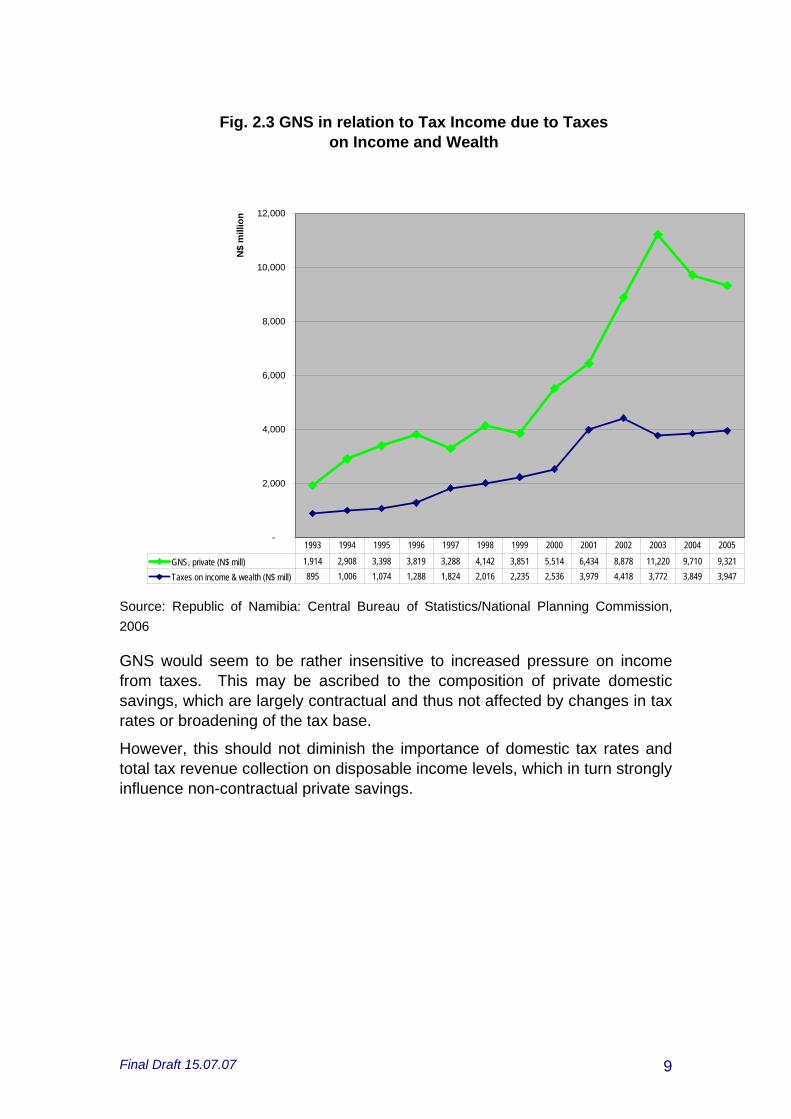
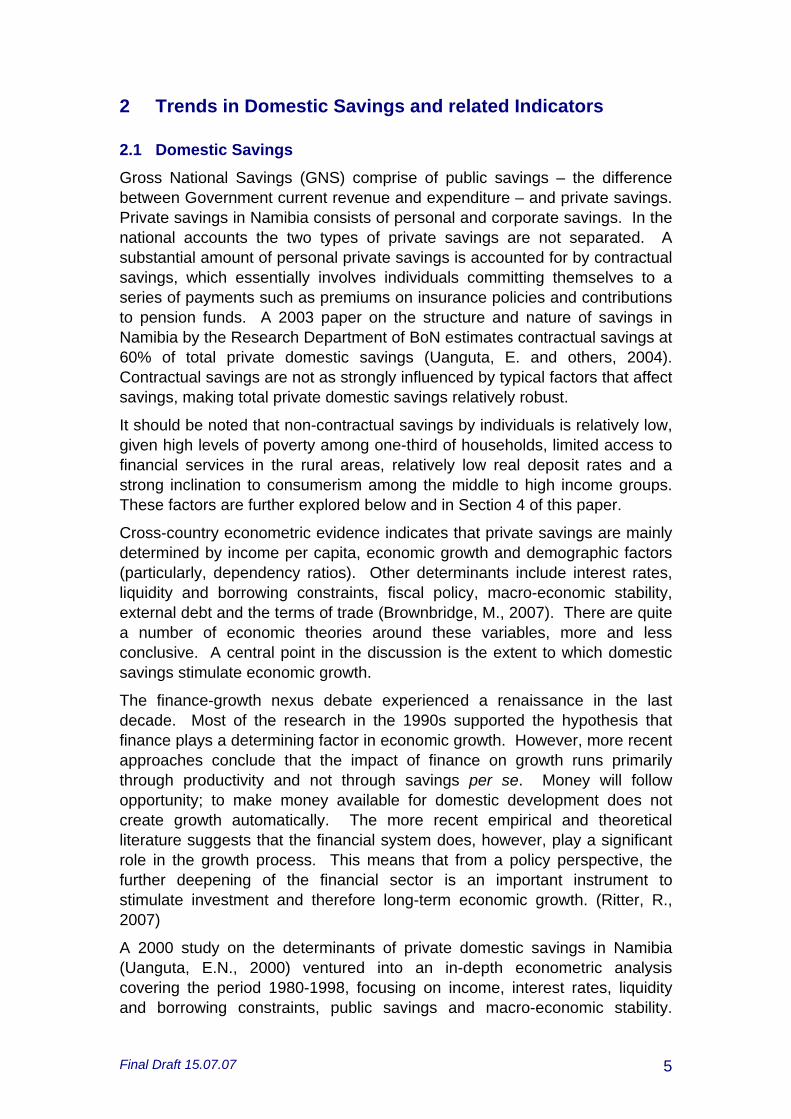
Fig. 2.3 GNS in relation to Tax Income due to Taxes on Income and Wealth
-
2,000
4,000
6,000
8,000
10,000
12,000
N$
mill
ion
GNS, private (N$ mill) 1,914 2,908 3,398 3,819 3,288 4,142 3,851 5,514 6,434 8,878 11,220 9,710 9,321 Taxes on income & wealth (N$ mill) 895 1,006 1,074 1,288 1,824 2,016 2,235 2,536 3,979 4,418 3,772 3,849 3,947
1993 1994 1995 1996 1997 1998 1999 2000 2001 2002 2003 2004 2005
Source: Republic of Namibia: Central Bureau of Statistics/National Planning Commission, 2006
GNS would seem to be rather insensitive to increased pressure on income from taxes. This may be ascribed to the composition of private domestic savings, which are largely contractual and thus not affected by changes in tax rates or broadening of the tax base.
However, this should not diminish the importance of domestic tax rates and total tax revenue collection on disposable income levels, which in turn strongly influence non-contractual private savings.
Final Draft 15.07.07 9

Fig. 2.4 GNS/GDP in relation to Real Deposit Rate
0.0
5.0
10.0
15.0
20.0
25.0
30.0
35.0
% o
f GD
P
-6.0
-4.0
-2.0
0.0
2.0
4.0
6.0
8.0 %
GNS, private (% of GDP) 20.6 25.2 26.7 25.4 19.6 22.0 18.6 23.3 23.2 27.0 33.2 26.8 24.2Real Deposit Rate (%) 1.1 -1.6 1.7 3.5 3.9 6.7 2.2 -1.9 -2.4 -3.6 1.5 2.2 3.9
1993 1994 1995 1996 1997 1998 1999 2000 2001 2002 2003 2004 2005
Source: Republic of Namibia: Central Bureau of Statistics/National Planning Commission, 2006 and Data supplied by BoN, 2007
The composition of private savings, typified by a high proportion of contractual savings, offers a good explanation for the lack in correlation between the real deposit rate and GNS private.
However, this does not imply the ineffectiveness of the real deposit rate as an instrument to stimulate private savings. The non-contractual portion of the private savings is sensitive to a higher real deposit rate. The real deposit rate showed a declining trend from 1998 and even recorded a negative rate for the period 2000-2002. Deposits held at commercial banks followed this trend. (Uanguta, E. and others, 2004) This implies that in order for the commercial banks to sustain or strengthen their deposit mobilization efforts, they should ensure a fair rate of return to the depositors.
Final Draft 15.07.07 10

2.2 Capital Outflow
Capital outflows, mainly to South Africa, are high and ever increasing. The Capital and Financial Account (of the Balance of Payments) moved from a deficit position of NAD833 million in 1999 to a NAD3.1 billion deficit by 2005(p) (BoN, 2004 and 2007).
Fig. 2.5 Capital and Financial Account, excl. reserves
-7,000.0
-6,000.0
-5,000.0
-4,000.0
-3,000.0
-2,000.0
-1,000.0
0.0
1,000.0
2,000.0
3,000.0
4,000.0N$ million
Net Capital Transfers 140.0 777.7 815.7 429.0 510.0 498.0 505.0
Direct Investment 124.3 1,275.2 3,252.8 1,969.0 1,204.0 1,602.0 2,293.0
Portfolio Investment -35.2 -965.3 -1,659.2 -4,441.0 -4,792.0 -5,430.0 -6,639.0
Other Investment - long-term -683.6 -2,591.0 -2,983.0 612.0 418.0 -501.0 238.0
Other Investment - short-term -378.4 -173.9 477.5 410.0 406.0 151.0 489.0
1999 2000 2001 2002 2003 2004 2005 (p)
Source: BoN (2004 and 2007)
In an attempt to stem the capital outflows, already in 1994 the Government introduced a domestic asset requirement for institutional investors, known as Regulation 288. Accordingly institutional investors must hold 35% of their portfolio in Namibian assets. Dual listings on the Namibian Stock Exchange (NSX) and Johannesburg Stock Exchange (JSX) are deemed as “domestic assets” in Regulation 28.
8 In 1994 when Regulation 28 was introduced, only 10% of the portfolio was to be held in Namibian assets. This percentage has been increased over time to the current 35%.
Final Draft 15.07.07 11

In a further attempt, in July 2004 Cabinet approved a tightening of the domestic asset requirement, by:
(i) Reducing the percentage of dual-listed companies on the NSX that qualify as a domestic investment to 10% from the current 100%;
(ii) Requiring all institutional investors to place a minimum of 5% in unlisted Namibian securities; and
(iii) Subjecting unit trust management companies to a domestic asset requirement and remove the tax holiday on income from unit trusts.
Due to the controversy around the appropriateness of the proposed measures they have to date not been implemented. In practice these measures would translate into a situation whereby between NAD7.5-14 billion, depending on final interpretation of the measures, would need to be brought back to and invested in Namibia (Interview with NSX Chief Executive Officer, May 2007). This would seem inappropriate given the constraints on local investment opportunities, outside of the dual listings on the NSX and unit trusts. The IMF also advises against regulatory steps to stem the high capital outflows and instead recommends market-based measures to boost reserves and create domestic investment opportunities (IMF, 2007a).
2.3 Workers’ Remittances
Workers’ remittances do not play a role in the mobilization of non-debt creating domestic resources. Namibia does not have a large section of the workforce employed outside its borders. Professional nurses find their way to European and Australian destination and a proportion of students pursuing their studies overseas do not return home but the income remitted by these individuals is of little if any consequence to the economy as a whole.
The BoN does not keep record of workers remittances due to its insignificance (interview with BoN Research Department, July 2007). In the Balance of Payments (BoN, 2006), “income” covers two types of transactions between residents and nonresidents:
(i) Those involving compensation of employees, which is paid to non-resident workers (for example, border, seasonal and other short-term workers); and
(ii) Those involving investment income receipts and payments on external financial assets and liabilities9.
2.4 Summary
Further research into the determinants of the three types of savings, public, contractual private and non-contractual private savings will need to be carried 9 Included are receipts and payments on direct investment, portfolio investment and other investments and receipts on reserve assets. Income derived from the use of tangible asset, for example, car rental by a nonresident is excluded from income and is classified under services such as travel.
Final Draft 15.07.07 12
out to arrive at a more conclusive assessment of the savings landscape in Namibia.
Combined, the literature, previous econometric focused on savings in Namibia and this paper’s simple trend analysis suggest the following key access points for policy makers and financial institutions to increase domestic savings mobilization in Namibia:
• Healthy growth in disposable income (through solid macro-economic policy resulting in managed inflation, interest rates and tax burden);
• Fair rate of return on savings deposits;
• Stimulate non-contractual private savings.
It is clear from the analysis to date that the mobilization of domestic savings in Namibia is, however, not sufficient to accelerate economic growth. Namibia is in a rather unique yet challenging situation whereby the financial sector experiences excessive liquidity while economic expansion in the real sector is unable to tap into these resources.
Namibia faces a huge challenge in redirecting at least a significant portion of the high and ever increasing capital outflows towards productive investments in the country.
Final Draft 15.07.07 13

3 Domestic Non-Debt Generating Resource Mobilization
3.1 Overview
Namibia is typified by an exceptionally high level of contractual savings – mainly through pension funds and insurance companies. Yet, while national savings are high overall, there are still a number of constraints. In the assessment of the constraints to private domestic savings in Namibia, a number of factors should be highlighted, namely, high poverty levels, extremely high proportion of young people, duality of the financial sector, tax rates and incentives, and (credit-driven) consumerism.
Constraints to government revenue mobilization are mainly related to the small size of the Namibian economy and workforce compared to the vastness of the country combined with low population density and the subsequent high cost of service provision per capita.
3.2 Poverty and Inequality
As highlighted in Section 2, the richest 10% of the households in Namibia earn nearly half of the total income of private households. The 2003/4 NHIES further indicates that the proportion of households that are considered poor – with a Food Consumption Ration (FCR) of 60% or more – was 28%, with a further 4% of households living in extreme poverty (FCR over 80%).
The impact on non-contractual savings by individuals is self-evident; with one-third of Namibian households spending most of their income on food leaves little for other necessary expenditures let alone savings.
3.3 Dependency Ratios10
With close to 40% of the population aged below 15 years, the income generating capacity of the Namibian population and related savings capacity are constrained. Persons older than 60 comprise a small proportion (6.7%) of the total population.
Adding to this, the HIV/AIDS pandemic is having a devastating impact and has already led to a significant overall reduction in life expectancy for both men and women11. Low productivity of the affected and infected working population reduces even further Namibia’s capacity to create income and savings.
10 Republic of Namibia, Central Bureau of Statistics/National Planning Commission, 2003 11 Life expectancy reduced between the 1991 and 2001 Census from 59.1 to 47.6 years for men and from 62.8 to 50.2 years for women.
Final Draft 15.07.07 14

3.4 Financial Infrastructure12
Namibia has one of the most sophisticated and highly developed financial systems in Africa. It comprises a diverse range of institutions, which are mostly private, with strong ownership links to South African institutions. Access to the even more developed South African financial market, through Namibia’s membership of the CMA, fills in any gaps. Total financial system assets represented about 170% of GDP, in 2004. The banking sector is mature, very profitable, and well-capitalized. Namibia has a well-developed contractual savings sector (pension funds and life insurance companies) with total assets of around 100% of GDP, in 2004. The total assets of the non-banking financial institutions (NBFIs) amounted to some NAD42 billion in 2004 (Table 3.1) and continue to expand. This places Namibia in a unique position in SSA13.
Table 3.1: Total assets for NBFIs, NAD million 2001 2002 2003 2004 2005 2006p
Pension Funds - 16,050 15,434 20,661 26,401 36,000*Long-term Insurance
6,188 9,256 10,307 13,275 16,008 17,609*
Unit Trusts* 2,601 4,298 6,366 7,880 9,600 11,100*TOTAL ASSETS 29,604 32,107 41,816 52,009 64,709*
Source: Ritter, R., 2007 (NAMFISA)
Yet, Namibia is also typified by duality at all levels of society, with huge disparity between its formal and informal sectors. The financial system serves the formal sector well, but has been unable to achieve a satisfactory level of access for the urban poor and the rural population. While access to finance in Namibia is better than in other Sub-Saharan African (SSA) countries, it is still very limited. In 2004, research by Finscope (a FinMark Trust initiative that aims at making financial markets work for the poor) found that 45.2% of the Namibian population remained unbanked. (Intermedia Marketing Communication, 2007) This reflects pervasive rural poverty and the growing population of urban shack dwellers, who suffer from widespread unemployment. The situation is aggravated by relatively high fees for the use of banking services, especially checking accounts. The Government's efforts to broaden access to specific financial products by way of specialized financial institutions, aside from the NamPost Savings Bank, have had limited success.
Savings and credit cooperatives (SACCOs), credit unions or informal savings groups are not common to Namibia.
For a large portion of the population, the accumulation of livestock (cattle, goats and sheep) continues to be the preferred savings instrument. Animals are converted into cash as and when needed for traditional feasts, weddings and funerals, school fees and uniforms and other household needs. 12 This sub-section draws heavily on IMF, 2007b. 13 In comparison to leading OECD countries (Australia, Canada, Iceland, Netherlands, Switzerland, UK and USA), Namibia is ranked in seventh position in terms of total pension funds asset ratio to GDP, 2004. (Ritter, R., 2007)
Final Draft 15.07.07 15
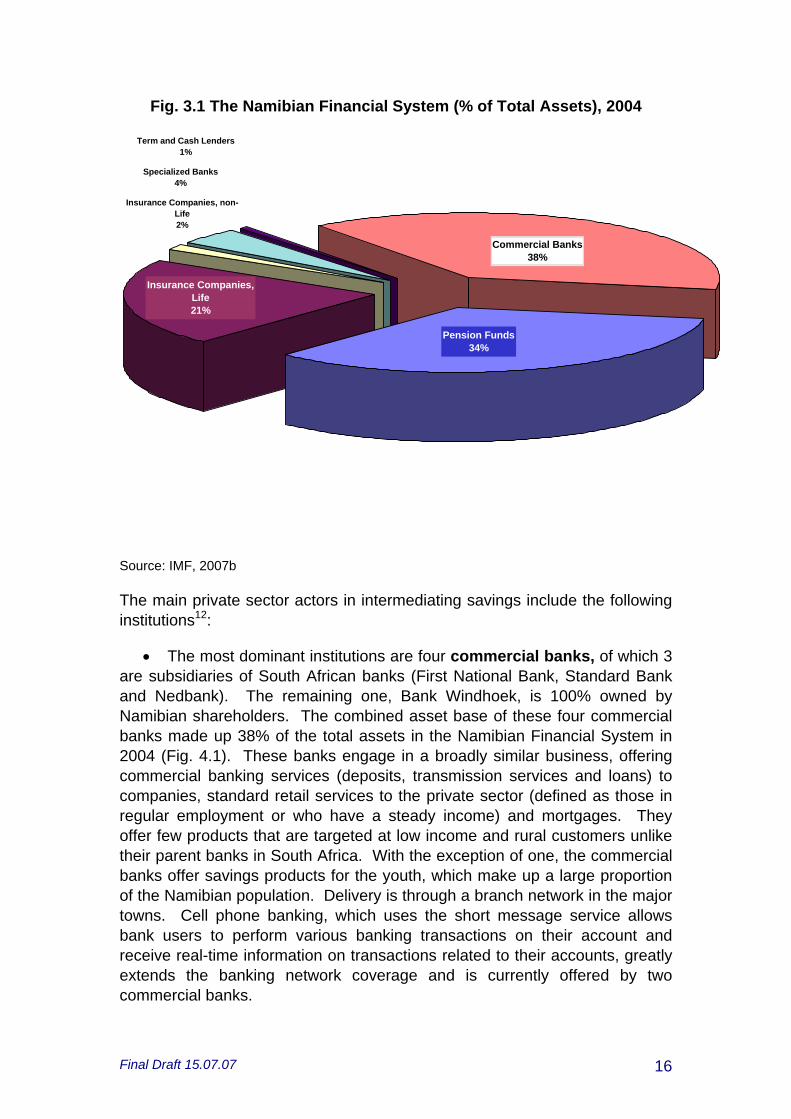
Fig. 3.1 The Namibian Financial System (% of Total Assets), 2004
Specialized Banks4%
Term and Cash Lenders1%
Insurance Companies, non-Life2%
Pension Funds34%
Insurance Companies, Life21%
Commercial Banks38%
Source: IMF, 2007b
The main private sector actors in intermediating savings include the following institutions12:
• The most dominant institutions are four commercial banks, of which 3 are subsidiaries of South African banks (First National Bank, Standard Bank and Nedbank). The remaining one, Bank Windhoek, is 100% owned by Namibian shareholders. The combined asset base of these four commercial banks made up 38% of the total assets in the Namibian Financial System in 2004 (Fig. 4.1). These banks engage in a broadly similar business, offering commercial banking services (deposits, transmission services and loans) to companies, standard retail services to the private sector (defined as those in regular employment or who have a steady income) and mortgages. They offer few products that are targeted at low income and rural customers unlike their parent banks in South Africa. With the exception of one, the commercial banks offer savings products for the youth, which make up a large proportion of the Namibian population. Delivery is through a branch network in the major towns. Cell phone banking, which uses the short message service allows bank users to perform various banking transactions on their account and receive real-time information on transactions related to their accounts, greatly extends the banking network coverage and is currently offered by two commercial banks.
Final Draft 15.07.07 16

Text Box 3.1: Bank Windhoek drives Innovation in Banking Sector Bank Windhoek appears to be the frontrunner in terms of banking innovation in Namibia, especially in the area of SME financing (see Text Box 4.1) and specialized savings products for lower income groups. This bank was also the first to introduce cell phone banking. In an effort to meet the needs of Namibians who are low income earners and first-time users of banking services, Bank Windhoek launched in 2005 and 2006 respectively, the EasySave and EasyCredit facilities. EasySave targets Namibians who earn NAD15,000 or less per annum. Employers can deposit wages electronically into the account. Main features of “EasySave” are free deposits, very low service fees (typically between NAD8-10 per month), minimum balance of NAD20 only, up to 4% interest and added-on free life cover of NAD2,500. EasyCredit provides customers with a small loans of up to NAD2,500. Since the launch of EasySave and EasyCredit in 2005 and 2006 respectively, over 30,000 clients have signed up for these products. First National Bank followed suit with the introduction of CardWise, later in 2005, also targeting low income groups. More than 80,000 CardWise accounts have been opened. Source: www.bankwindhoek.com.na and Intermedia Marketing Communications, 2007
• One of 4 state-owned specialized financial institutions accepts deposits, the other three focus on lending operations14. The NamPost Savings Bank has the greatest geographical outreach of all banks, partially through mobile banking activities, and over 40% of households have savings accounts with this bank. The bank’s operations are limited to savings. Its charges are substantially lower and the accounts carry a fiscal incentive in that interest income is tax free. Its asset base is relatively small (NAD600 million in 2004).
• Pension Funds offer a main vehicle for savings. They contributed a total of 34.3% to the Namibian Financial System assets in 2004. The total pension asset ratio to GDP stood at 57.2% in 2004. While there are over 500 Pension Funds, the Government Institutions Pension Fund (GIPF) dominates the sector, representing in 2004 73% of total pension fund assets. The GIPF covers public servants and employees of other public agencies and operates on a defined benefit plan.
• The insurance industry is also well developed, yet highly concentrated. While there are 16 long-term insurers and 12 short-term insurers (including one re-insurer), the top 3 companies in each segment of the market accounted in 2004 for 85% and 86% respectively of total gross premiums written for long-term and short-term insurance. The total assets of long-term insurers amounted to NAD13.3 billion in March 2004, corresponding to 39.2% of GDP, 2003. Adding the assets of short-term insurers raises total insurance assets to 42.3% of GDP.
• Driven by money market portfolios and the tax free status, the unit trust industry has grown rapidly (see Table 3.1). While there is (as yet, refer 14 Agribank is not currently taking deposits from the general public but could do so upon approval of the Minister of Finance. The National Housing Enterprise is authorized to take deposits yet its current deposits are minimal (NAD5 million in 2004).
Final Draft 15.07.07 17

to Section 4.2) no requirement for localization of investments in unit trust schemes, management companies generally observe the 35% domestic asset requirement in order to attract investments from institutional investors. Corporate investors also invest in money market unit trusts, mainly for tax reasons. There are eight registered unit trust management companies which have accumulated assets under management of NAD8 billion, of which NAD7 billion in money market portfolios and the balance in equity and balanced portfolios. Management companies controlled by two domestic commercial banks have a 60% market share.
• Namibia has a well-developed government securities market, government bonds and treasury bills (TBs), with active trading in TBs. All commercial banks hold Government securities. Private individuals have easy access to TBs through their commercial bank.
• The Namibian Stock Exchange (NSX) lists and trades both equities and bonds. The NSX is dominated by dual listed companies and trading is not active. It plays a relatively small role in the country's economy, mainly due to the limited number of local listings (10 by 2007). In 2005, companies listed only on the NSX represented a market capitalization of a mere 6.8% of GDP and turnover ratio of 0.09%. In contrast, the market capitalization of the dual listed companies (JSX and London Stock Exchange) were 972% and 1,017% respectively in 2005 with related turnover ratio of 6.3% and 2.3%. It is, however, noted, that albeit growing from a small base, the NSX is growing. Market capitalization has more than doubled (increased by factor 2.3) between 2000 when the NSX was established and 2006, with related turnover increasing by factor 1.7. (NSX, 2007)
Text Box 3.2: Namibia Trade Index (NATRIX) The NSX is developing a new low cost investment vehicle, accessible to the general public. NATRIX will follow the NSX index and is a liquid investment/savings option. For as little as NAD100 per month, NATRIX units can be bought. NATRIX is similar to Unit Trusts yet unlike in that it does not attract management fees due to the automatic linkage to the NSX index. It is anticipated that NATRIX, modeled on the South African SATRIX, will create activity on the NSX. Source: Interview with John Mandy, CEO of NSX (May 2007)
Final Draft 15.07.07 18

3.5 (Credit-driven) Consumerism
There is excessive (luxury) consumption in Namibia among the rich and middle income groups. A significant increase in the supply of credit is evident over the last 3 years as commercial banks are competing for this small section of the population.
It is easy to get consumer credit in Namibia. The market offers a large variety of credit facilities to buy goods, especially by the South Africa based chain department stores for furniture, clothing and household appliances. All types of hire-purchase (HP) and lay-bye arrangements15 are available. Most Namibians also purchase their vehicle, new and second-hand on HP. These store-based credit facilities make consumptive expenditure more accessible, also to the lower income groups. In the semi-informal and informal sectors, local and farm shops sell general household goods (even alcohol) on credit. Finally, micro-lending companies, the number of which has grown exponentially over the past few years, are providing easy access to money over and above one’s earnings.
The impact on non-contractual savings by individuals is self-evident though its magnitude is unknown; when more than one’s earnings are committed to consumer spending, there are no funds left for saving.
3.6 Tax Rates and Incentives
Namibia’s marginal corporate tax rate is amongst the highest in the Southern African region (SAR), and compares poorly against one of the higher performing economies in this sub-region, Botswana.
Its highest marginal individual tax rate (and individual income thresholds) competes well with South Africa yet poorly with other selected countries in SAR, especially with Botswana.
Table 4.2: Regional Comparison of Tax Rates 2004 Highest Marginal
Tax Rate: CorporateHighest Marginal Tax Rate: Individual
On income over (USD):
Namibia 35% 35% 29,851South Africa 30% 40% 38,060Botswana 25% 25% 20,950Zambia 35% 30% 368Swaziland 30% 33% 5,496Mozambique 32% 32% 42,314
Source: World Development Indicators, 2006 (Table 5.6)
Income tax legislation provides for deductions from both corporate and individual income tax of the proceeds from unit trust investments. The IMF
15 Hire-purchase agreements are typified by “get now, pay over time” and lay-bye agreements by “set aside, pay at month-end or over a few months and get”. HP agreements have a longer lifespan than lay-bye agreements. Both are in-store arrangements.
Final Draft 15.07.07 19
notes that corporate investors invest in money market unit trusts, mainly for tax reasons. (IMF, 2007b)
Further, individual tax payers benefit from tax deductions of premiums paid to pension fund, provident or retirement funds well as study policies. Interest income from savings accounts held at the NamPost Savings Bank is also tax exempt to encourage savings amongst the lower income groups. Tax exemption on interest received is very low at NAD500 and uncompetitive against South Africa where the threshold is NAD10,000.
The Government has not made a concerted effort to stimulate private non-contractual savings. While at macro-economic level there appears to be an excess of funds, household-level income security would improve if saving – using financial sector savings vehicles – becomes a more wide-spread habit at all levels of income. Too many Namibians are but one month salary away from insolvency, and many are struggling to manage their debts and seek refuge from micro-lending companies.
As to the “cattle factor” in the savings landscape, the Government in partnership with the private sector is embarking upon a programme of transformation in the livestock sector, encouraging communal farmers to increasingly market their cattle and become integrated in the cash economy. Increasing the animal off-take16, from a low 4-5%, to more commercial levels, typically around 25%, is expected to result in higher incomes for the communal farmers as younger cattle attracts a better price. Instead of holding reserves in the form of animals such reserves could then be held in financial products, which are not affected by drought and animal diseases. A condition for success in this programme is for the commercial financial institutions to offer attractive savings vehicles for the communal farmers.
3.7 Government Revenue Mobilization
The main sources of Government revenue are taxes on income and profit, with normal tax on individuals providing a considerably larger portion of the total than corporate tax; international trade; and domestic taxes on goods and services, mainly comprising of Value Added Tax (VAT).
16 The off-take rate refers to the % of the total herd that is presented to the market for sale or slaughter.
Final Draft 15.07.07 20

Fig. 3.2 Composition of Tax Revenue (2003/4-2005/6)
3,619
1,951
3,036
4,024
2,057
4,207
4,576
3,272
3,892
0%
10%
20%
30%
40%
50%
60%
70%
80%
90%
100%% of Total Tax Revenue
Other Taxes (N$ million) 83 94 113
Taxes on Property (N$ million) 75 86 110
Taxes on International Trade (N$ million) 3,036 4,207 3,892
Domestic Taxes on Goods and Services (N$million)
1,951 2,057 3,272
Taxes on Income and Profits (N$ million) 3,619 4,024 4,576
2003/2004 2004/2005 2005/2006
Source: Republic of Namibia: Ministry of Finance, 2006
As per Fig. 3.2, taxes on income and profits provided some 39% to total revenue over this three year period; international trade taxes 36% and domestic taxes on goods and services 23%. Tax revenue ratios (Total tax revenue/GDP) jumped over the same period from 25% to 30%. This is high compared to the average for low (10.5% in 2004), middle (12.4% in 2004) and high income countries (14.6% in 2004).
Dividends from state-owned enterprises (SOEs) contribute a small portion to non-tax revenue of the Government and this is an area of concern. Over the same period, total dividends amounted to a mere NAD138 million. Less than half of the SOEs in fact paid dividends to the Government during the 2003/4-2005/6 period. Overall, the non-tax revenue plays a minor role in total revenue generation.
Final Draft 15.07.07 21

Text Box 3.3: Forensic Tax Audits Forensic tax audits were introduced in 2004 with the establishment of a small Forensic Audit Unit in the Directorate of Inland Revenue, led by the previous Head of the Legal Unit. Its limited in-house capacity is strengthened by the extensive use of private auditing firms. Oshakati, which receives tax returns from the North-Central regions, was the first Regional Office to come under scrutiny. Four types of investigations were performed, namely, (1) desk audits focusing on the quality of tax assessments by Government tax officials, (2) forensic audits of selected small taxpayers, both corporate and individual, (3) a border initiative focusing on VAT returns and (4) forensic audits of “the big fish”, multi-millionaire entrepreneurs suspected of large-scale tax avoidance and evasion. When the forensic audit initiative started, the Oshakati regional office recorded a negative net income; the income from taxes did not cover its operational expenditure. This situation was turned around. The exact amount of additional tax collected directly attributable to Phase 1 of the forensic audit project has not yet been established (a good few millions were collected and some court cases are still on-going) though the Forensic Tax Audit Unit points out that the ripple effect in the region and the country as a whole towards improved tax compliance is the ultimate performance indicator for the project. Phase 1 was concluded towards the end of 2006 and the Oshakati Regional Office now uses own staff to continue routine and more detailed audits Phase 2 of the forensic audit project started in late 2006, focusing on the Windhoek Regional Office. This time a sector approach was taken, commencing with industries suspected of improper tax behaviour. Farming and tourism close corporations were first to be scrutinized, likely to be followed by the motor vehicle industry and taxpayers registered as trusts. Again, private sector auditing firms are engaged by the Unit. The objective of the Forensic Audit Unit is to eventually have each taxpayer subject to an audit once every five years. The success of the project is evident, yet the country-wide roll-out will require substantial additional resources to realize this overall objective. Source: Interview with Jac leRoux, Head Forensic Audit Unit, Ministry of Finance
A series of changes in revenue management are undertaken by the Goverment to enhance the efficiency of revenue collection and to broaden the revenue base. These include the introduction of large-scale forensic tax audits; anti-abuse measures to discourage taxpayers from claiming excessive VAT returns; a withholding tax on interest; payment of transfer duties when shares or membership interests relating to immovable property are alienated in a company or close corporation.
In a further effort, the physical presence of the Receiver of Revenue (RoR) is strengthened in the South and Central-North regions with regional offices under construction for Keetmanshoop and Otjiwarongo. Since Independence, new offices were opened in Walvis Bay and Rundu to service the central-north coastal and north-western region respectively. Keetmanshoop and Otjiwarongo were initially established as satellite offices but are now being upgraded to full RoR offices. The regional offices are fully self-contained and all tax assessments are done at regional level. They report to the Inland Revenue Head Office in Windhoek. Also, technical support has been secured for the Directorate of Inland Revenue in tax administration, tax legislation, audit and collection procedures.
And finally, the Government is zooming in on the lack of financial performance by SOEs. Under the 2006 State Owned Enterprises Act, which is to provide better checks and balances on public companies’ finances, it will shortly introduce the State Owned Enterprise Governance Council. The Council is to establish generally accepted common principles of corporate governance and good practice and to develop common policy frameworks relating to human
Final Draft 15.07.07 22

resources and assets performance. From 2007/8, general financial support from a ministry to a SOE will no longer be permitted; funds should be linked explicitly to outputs/ results. The Ministry of Finance is to fine-tune and adopt the draft Dividend Policy Framework during the current Medium Term Expenditure Framework (MTEF), 2007/8 to 2009/10.
Despite all these interventions – planned or already under implementation – the MTEF forecasts a reduction in the tax revenue ratio to 26.4% by 2009/10. The overall revenue ratio (tax revenue, non-tax revenue, grants and loans) is also declining, to 30.7% by 2009/10 from an estimated 36.8% in 2007/817. These projections call for expenditure restraint in support of continued fiscal sustainability (refer to Section 4).
3.8 Summary
The challenge for Namibia is to utilize the abundant savings held by contractual savings institutions for productive investments without compromising the returns on the invested savings. While there are good investment opportunities across a number of sectors – mining, power supply, telecommunications, infrastructure, tourism, horticulture, mariculture – these need to be packaged to provide a suitable investment vehicle for the excess capital. The nature of savings in Namibia is predominantly contractual, which does not make it suitable for high-risk investments. Investments in “green fielders” and unlisted companies are not likely to absorb the excess of funds in the market. The numbers are intimidating. The assets held by NBFIs amount to NAD60 million and even translating only a portion thereof into productive investments poses a serious challenge, given the nature of the Namibian economy and its drivers.
There would appear to be ample scope for the expansion of non-contractual savings in Namibia. A large proportion of the Namibian population is not yet actively participating in the banking system and measures to encourage savings among the lower income groups would include information campaigns on the value of banking and saving, improved banking coverage, wider introduction of low cost banking products and fair returns on deposits. A concerted effort (by commercial banks, the large retail outlets that offer credit facilities, consumer groups and Government) should be made to reduce the over-utilization of credit facilities to protect consumers from financial crisis.
As to public savings, Government expenditures need to be tightened considerably given the considerable reduction in projected tax and other revenues during the current MTEF, unless other sources of income can be secured.
17 For the MTEF period, only very moderate growth of dividends from SOEs is anticipated, with total dividends projected at NAD218.8 million, compared to NAD137.9 over the period 2003/4 to 2005/6. Dividends declared in 2006/7 (est.) at NAD695.5 million are unusually high due to income of NAD648.0 million from the sale of Mobile Tele-Communications (MTC) under the umbrella of Namibia Post and Telecommunications Ltd.
Final Draft 15.07.07 23
4 Domestic Non-Debt Generating Resource Utilization
4.1 Overview
In assessing the utilization of domestic non-debt generating resources, a number of observations are made relating to access to finance for productive investments, typical funding of large capital investments, limited investment opportunities, the investment climate, and Government expenditure.
4.2 Access to Finance for productive Investments When seeking financing for productive investments, a number of options are available to business in Namibia.
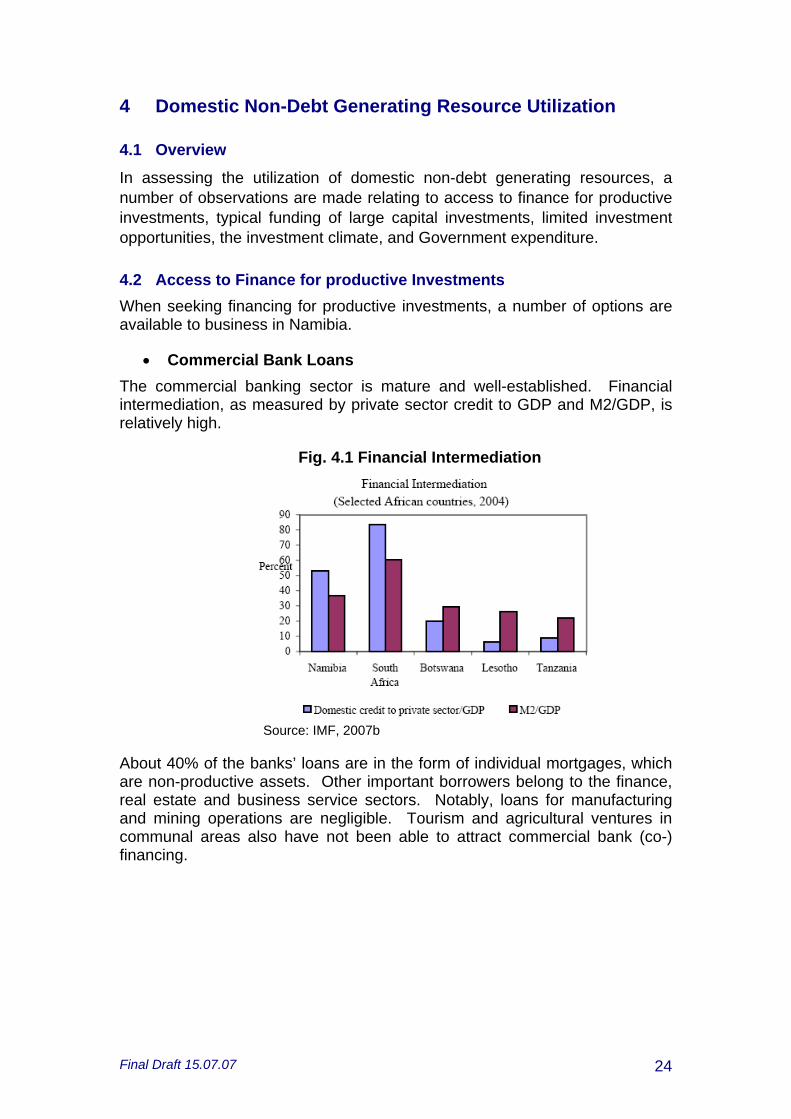
• Commercial Bank Loans The commercial banking sector is mature and well-established. Financial intermediation, as measured by private sector credit to GDP and M2/GDP, is relatively high.
Fig. 4.1 Financial Intermediation
Source: IMF, 2007b
About 40% of the banks’ loans are in the form of individual mortgages, which are non-productive assets. Other important borrowers belong to the finance, real estate and business service sectors. Notably, loans for manufacturing and mining operations are negligible. Tourism and agricultural ventures in communal areas also have not been able to attract commercial bank (co-) financing.
Final Draft 15.07.07 24

Fig. 4.2: Composition of Bank Loans and Advances, 2004
Source: IMF, 2007b
Compared to their South African parent companies, commercial banks in Namibia lag behind in introducing innovative and appropriate growth-focused products. A case in point is the tourism sector, which despite recording robust and rapid growth, has to date not been able to entice interest of commercial banks in sector-tailored solutions, not even from the banks with parent companies in South Africa that offer exactly that. FNB South Africa offers a suite of options for tourism ventures – tourism finance solutions that cater for seasonality, comprehensive insurance packages tailored to the needs of different tourism activities and specialist solutions that include franchising, a special foreign exchange offering plus BEE expertise18. The problem in Namibia appears to be a lack of experienced, well-exposed bankers with a greater appetite for innovation and risk.
• SME Finance Options
SME access to finance is limited. Important reasons for the lack of access include commercial banks’ preference for collateral, the underdevelopment of leasing and factoring services, the nascent state of development of private equity and venture capital funds, and the ineffectiveness of specialized financial institutions and the Small Business Credit Guarantee Trust (SBCGT). In particular, the guarantees issued by the SBCGT suffer from poor credit appraisals and monitoring, as well as weak loan recovery efforts by participating banks, resulting in a limited amount of small firm operations. Land tenure arrangements in communal areas (refer to Section 1) exacerbate this situation.
18 www.fnb.co.za/frames/content/campaign/tourismhome.htm
Final Draft 15.07.07 25

Two commercial banks have only recently established specialized divisions to serve SMEs.
Text Box 4.1: Bank Windhoek DBN Partnership unlocks Opportunities for SMEs Bank Windhoek has been financing Small and Medium Enterprises (SMEs) since 2000, but has in 2005 as part of its new approach towards Emerging SMEs, introduced a restructured, dedicated SME branch. The vision of the ESME branch is to see an increasing number of ESMEs grow into sustainable businesses, creating new wealth and new opportunities for the benefit of the Namibian economy. The Bank’s strategy is therefore to provide SMEs an enabling environment through the delivery of responsive, innovative financial products and complimentary support services. Bank Windhoek and DBN entered into a partnership in August 2005 with DBN investing a minimum of NAD30 million over a period of three years and Bank Windhoek channelling these funds – combined with business management support – through its ESME branch to Namibian entrepreneurs. Since the launch of the partnership, an average of 80 applications per month have been received and appraised. To date, loan applications to the value of NAD36 million have been approved. Businesses financed through the partnership are in the field of steel works, printing; legal services; aviation and flight training; property development; automotive; transportation, technology, hotel, restaurant and medical. Start-up businesses, owned by Namibians or permanent residents, which are registered in Namibia and require between NAD250,000 and NAD3 million qualify for ESME financing. Source: www.bankwindhoek.com.na and www.dbn.com.na
• Specialized Financial Institutions
Two of the four Specialized Financial Institutions are engaged in productive sector financing, namely, the Agribank and the Development Bank of Namibia (DBN).
Agribank, the largest specialized financial institution, supports agricultural activity through short term loans for crop production and medium- and long-term loans for investment in farmland and equipment. This bank also provides special loans in support of the Government's affirmative action programs, national agricultural credit programs, and the tractor scheme. Agribank is not currently taking deposits from the general public but could do so upon approval of the minister of finance.
DBN has only recently started operations. It provides funding to new investment activities for development either directly or through lines of credit to other financial institutions. It does not take deposits.
Table 4.1: DBN Portfolio Loans & Investments
(NAD million) 2005 2006 2007
(up to May) SME Facility at Bank Windhoek 4.4 24.8 6.9DBN in-house SME Facility 3.9 2.4Private Sector Facility 50.0 30.0 10.0Enterprise Development Facility 10.7 20.3 18.2Public Sector Facility 50.0 30.5 39.7TOTAL 115.2 109.5 77.2
Source: DBN
Final Draft 15.07.07 26
Its predecessor, the Development Fund of Namibia (DFN), got absorbed into the DBN structures. The Namibia Development Corporation (NDC) is being closed down with assets to be transferred to DBN. DBN seeks to maintain a more balanced approach between development objectives and financial and economic feasibility and long-term sustainability. Its loan portfolio is slowly expanding, supported by a solid partnership with Bank Windhoek (refer to Text Box 4.1).
Through its own lending and investment operations since 2005, DBN has positively impacted on nearly 4,500 jobs (of which 1,168 new, 2,234 existing and 1,055 temporary jobs). Its portfolio now stands at NAD300 million and is reportedly healthy, paving the way for further expansion. (data supplied by DBN, 2007) DBN is establishing itself as a reliable, long-term partner in development finance.
• NSX
Local and foreign companies may decide to raise funds by listing on the NSX. The exchange has reasonably modern rules on listing and an efficient infrastructure for trading and settlement but because of its small size it operates with minimum non-negotiable commissions (IMF, 2007a). This poses a barrier to listing, especially for smaller amounts. Further, the NSX is constrained in its efforts to attract local listings by foreign companies as these are subject to foreign exchange control regulations. The BoN does not issue standard rules and regulations for such listings and is assessing applications on a case-by-case basis.
Text Box 4.2: TRUSTCO Listing on NSX In 2006, TRUSTCO Group Holdings, a wholly owned Namibian company, brought in close to 3,000 subscribers through its initial public offering. This listing was the first primary listing on the NSX in 4 years. Following the listing, TRUSTCO brought its market capitalization to NAD400 million. Trustco had set out to raise NAD150 million yet succeeded to only raise half. The funds are being used for the expansion of the Institute of Open Learning (IOL) and a 10-year, 2,000 units, medium cost housing development in Windhoek. IOL extends loans, mostly to government employees (80%), to partake in distance education through recognized institutions, mainly in South Africa. The loan repayments are deducted from the students’ salaries by agreement with the Government. The number of student loans was increased from 3,000 to 9,000 through the listing and the first phase of development, the servicing of the land, for the housing project has started. The NAD75 million was taken up by two local asset companies (some 25%), 3 foreign fund managers from Europe and USA (just over 50%) with the remainder by a mix of ordinary citizens for which the smallest lot of 100 shares at NAD3.20 was affordable and more well-to-do Namibians. TRUSTCO ascribes the relatively low take-up of 50% to a total lack of education in Namibia about (and exposure to) the concept of holding shares. In the run up to the listing, the Managing Director himself and his team undertook a road show to all major towns in Namibia drawing large crowds. Extensive use was made of the local media and in total NAD5 million was spent on the listing. While the cost of the listing was high and only half of the expected funds were raised, TRUSTO is hopeful that any next public listing will benefit from the earlier (and planned on-going) public outreach and strong financial results. The maiden results are expected by June
Final Draft 15.07.07 27

2007. Source: Interview with Quinton van Rooyen, MD, TRUSTO Group Holdings
• GIPF Development Capital Portfolio
The GIPF manages a Development Capital Portfolio, directed at domestic unlisted companies. This portfolio, while representing a limited portion of total funds managed by the GIPF, has not performed well recording large losses of over 50% (IMF, 2007b). Investments were made in and loans extended to large operations in the mining, agro-processing and tourism industry. The selection of the beneficiary companies may have been driven by strategic economic development considerations, notably value-addition and regional development, yet strong political forces appear to also have been at play.
4.3 Typical Funding of large capital Investments
Recent years have seen an expansion in the capital-intensive mining industry with large-scale investments in offshore diamond mining operations and prominent projects such as the Scorpion Zinc mine and the Langer Heinrich uranium mine. A considerably investment was made in the Mobile Tele-Communications (MTC), a SOE and the establishment of second mobile telecommunications operator, Cell One. These investments are financed largely through FDI.
Apart from the GIPF and DBN (see section 4.2), financial investors are playing it safe and are not likely to venture into large-scale green field investments. The Namibian economy does not offer many sizable and secure investment opportunities that match the requirements of the considerable pool of contractual savings.
In a new development, which may be a trendsetter, NamPower, a SOE, has initiated the issue of a NAD3 billion bond to be listed on the Bond Exchange of South Africa (BESA), which would make it a dual listing and thus qualify as a Namibian asset. The funds raised are to be utilized for the 200-400MW Caprivi Link Inter Connector that will connect Namibia to the Zambian and Zimbabwean grids. This approach may also be appropriate for other SOEs such as Namport, Telecom Namibia, Namdeb and the Roads Authority. Much needed strategic economic investments that have the potential to generate good returns while unlocking productive private sector activity may be pursued using this mechanism.
Final Draft 15.07.07 28

4.4 Limited Investment Opportunities
Namibia is not a nation of entrepreneurs. Business leaders have expressed their concern about the business culture which they see as re-active rather than pro-active, non-service oriented, non-transparent with little consideration for corporate governance, inward looking and typified by limited interaction across racial lines (Stork, C. and E. van der Linden, 2005). To create a culture of vibrant entrepreneurship is a process, which has started in Namibia through various initiatives by the public and private sectors, yet needs to be accelerated in earnest if the economy is to capitalize on the large pool of funds potentially available for investment in Namibia. While there are plenty of good ideas and initiatives floating in the private sector, they are not packaged and presented as to make them suitable for banking and non-banking financial institutions alike to invest in. Another constraint to investment is the lack of clarity around property rights in the communal areas, which seriously hampers investments in tourism and commercial agriculture as banks and other financial institutions perceive lending to ventures in communal areas as high risk. Large tracts of land in Namibia are state-owned, communal land19.
4.5 Investment Climate
Namibia’s positive investment climate is evidenced by macro-economic stability, low inflation and interest rates, stable financial system, and low external debt. While ranking within the top five countries in the region both in the World Economic Forum Global Competitiveness Index for 2006 (84 out of 125) and in the World Bank Doing Business Survey (42 out of 175), Namibia has seen some slippage in recent years in performance on some of the international indicators.
Prompted by this concern, in 2006 the Government requested the Foreign Investment Advisory Group (FIAS) of the World Bank Group to carry out a detailed analysis of Namibia’s investment and export promotion landscape (FIAS, 2006).
While Namibia still offers an attractive investment climate overall, there are a number of areas that could be improved. FIAS concluded that the various mostly tax-based incentives introduced since Independence to boost manufacturing and export processing zones (EPZs) have not had the anticipated effect. The general strategy it recommends is to eliminate the targeted sector-specific incentives and move towards a regime that is simples and less discretionary, with a lower overall corporate income tax rate while
19 All the land north of the Veterinary Cordon Fence (VCF) is communal, state-owned (with the exception of proclaimed town and village areas). The VCF cuts across from the Atlantic Ocean to the Botswana border, some 200km south of the Angolan border, and affects 7 of Namibia’s 13 regions.
Final Draft 15.07.07 29

preserving appropriate general tax incentives (existing generous depreciation rates and unlimited loss carry-forward)20.
FIAS also noted the private sector concerns about the low labour productivity and uncertainty about the Government's commitment to property rights, especially in view of recent forced land sales. Clarifying policies and procedures with regard to expatriate immigration will assist in alleviating some of the human resource capacity constraints in the short run. Another area of reform identified by FIAS is at institutional level, streamlining the Ministry of Trade and Industry, focusing on trade policy and regulatory matters, and establishing autonomous bodies to interact with the private sector on investment and export promotion. (FIAS, 2006)
It is now up to the Government to review the recommendations for reform of the investment climate. In the meantime, it has acknowledged the critical role of human capital in the envisioned (as per Vision 2030) transformation of the economy towards greater industrialisation and equity within a knowledge-based society. The implementation of the Education and Training Sector Improvement Programme (ETSIP), a comprehensive multi-billion 15 year strategic plan, which started in 2006, is expected to change the way Namibians learn and result in school leavers being much better equipped for the labour market. ETSIP is co-financed by the Government, development partners and private sector.
4.6 Government Expenditure Namibia has stuck to several key principles in the formulation of its budgets. Although the country ran a budget deficit every year since its independence up to 2006/7 when it recorded a first time surplus, the Government has been reluctant to borrow in foreign currencies to finance the gap between revenue and expenditure. While conscious efforts have been made to develop a local debt market which allows it to borrow to finance the deficit, the Government has borrowed abroad only for specific projects and on concessional terms, even if these loans have not always been included in the annual budget structures. Overall, the Government has tried to limit the public finances and introduced several fiscal targets five years ago to formalize this approach. These targets included a budget deficit of 3% of GDP, the stock of public debt not exceeding 25% of GDP and public spending not exceeding 30% of GDP. The official strategy to finance public deficit locally rather than abroad has provides a vehicle for some of the excess funds in the financial market. The BoN has also taken steps to create a liquid and deep government securities market comprising of bonds or Internal Registered Stock (IRS) which go from 1-20 years and TBs which are issued on a discount basis with maturity of 91, 182 and 365 days. The outstanding amount of the public securities has steadily increased, reaching NAD10.5 billion in September 2005. In an effort 20 More specifically, these are (1) a 3-year equipment write-off rate which is high relative to economic depreciation (for all sectors) and quite fast by international standards , (2) a 20% investment allowance for all buildings coupled with 20 years straight line depreciation which is also quite generous by international standards and (3) unlimited loss carry-forward.
Final Draft 15.07.07 30

to facilitate and improve pricing, the Government has benchmarked its IRS against the most liquid South African government benchmark bonds. (IMF, 2007b) As per the MTEF (2006/7 to 2008/9), the high and increasing wage bill of 37.7% to 41.8% of total expenditure severely restricts the Government's flexibility to set priorities, especially relating to the Development Budget which is decreasing from 11.6% to 10.7% of total expenditures during MTEF. Its first priority has consistently been education. Health and social services, defence and interest on debt are other main expenditure items, followed by security and works, transport and communication with. The Government has made an allocation of NAD300 million during MTEF to ETSIP.
Table 4.2: Government Expenditure, by main Votes (MTEF) Main Votes % of Total Expenditure (recurrent and development) 2007/2008 2008/2009 2009/2010 Education 20.7% 23.0% 23.0% Health 9.4% 11.0% 11.0% Finance (debt) 15.4% 10.0% 10.9% Defence 9.4% 10.2% 9.5% Security 5.5% 6.2% 6.1% Works, transport & communication 6.0% 5.2% 5.0%
Source: Republic of Namibia: Ministry of Finance, 2006
Namibia is one of the leading exponents of public finance management (PFM) in Africa and, as stated in Vision 2030, aims at being on par with the best in the developed world. In this context and responding to challenges in fiscal discipline, the Government has started a PFM reform process, as announced in the Medium Term Expenditure Framework (MTEF) 2005/06. The reform aims at improving the budget process through further promotion of programme-based budgeting and accounting using an Integrated Financial Management System21. The PFM aims to address the critical constraint to decentralization in terms of financial planning, allocation of resources and accounting at regional level. In 2006/7 each budget vote applied the Performance Effectiveness Management Programme (PEMP) in an on-going effort to improve efficiency and effectiveness to service delivery.
21 The IFMS is an IT based financial management information system (budgeting and accounting) that will assist government to initiate, spend and monitor its budget, initiate and process its payments, and manage and report on its financial activities. It bundles the essential financial management functions into one suite of applications.
Final Draft 15.07.07 31

4.7 Summary
Boosting the capacity of the Namibian economy to absorb an ever increasing portion of the excess funding in the financial market is no easy task. This old problem has been a serious concern of many stakeholders. Yet, to date it has not been awarded the prominence it deserves at national-level strategic policy decision-making level. In true partnership, a concerted effort should be made by the public and private sector to map out a coordinated and strategic approach to investment policy and economic development, guided by international best practice. It would appear time for real, focused action.
Final Draft 15.07.07 32

5 Policy Recommendations22
5.1 Domestic Resource Mobilization
Further research into the determinants of the three types of domestic savings – public, contractual private and non-contractual private savings – will facilitate better informed decision-making in relation to domestic resource mobilization by both Government and the private sector.
The Government will need to maintain a stable and conducive overall macro-economic environment to facilitate a healthy growth in disposable income and related domestic savings. Further, Government may wish to consider increasing the NAD500 tax deduction for interest received.
The NamPost Savings Bank should seek new avenues to encourage savings and where necessary call upon Government to support its efforts.
The commercial banks in an effort to sustain or strengthen their deposit mobilization efforts should ensure a fair rate of return to the depositors. Greater competition in the financial sector could be encouraged by NAMFISA requiring more transparency in rates and products offered by the banks and NBFIs. Self-regulation by the industry will complement these measures. (IMF, 2007 and NFSC, 2007)
While acknowledging recent initiatives by the private financial institutions to broaden the financial services coverage, much more will need to be done in order to engage the large proportion of the Namibian population that remains unbanked. Additional branches, extended mobile phone banking services, new products targeting low income groups should all be explored.
In public-private partnership (PPP), Government and the financial should seek to enhance the financial literacy amongst Namibians, strengthening their appreciation of savings and a clear understanding of the product choices available.
In a further PPP effort, Government and the financial sector may seek to encourage communal farmers to increasingly market their cattle. Joint sensitization and mobilization activities to educate the farmers about the benefits to household income security of financial sector savings products will allow private financial institutions easy access to a large section of the rural population. The introduction of a specific product for this target group may be considered.
22 The financial sector is in the process of developing the Namibian Financial Sector Charter (NFSC). The NFSC is a voluntary adopted transformation charter, based on the principle of self-regulation. It is scheduled to become operational in January 2008. The Charter focuses on Black Economic Empowerment (BEE), Employment Equity (EE) and consumer protection and education and has set clear targets for each in its industry scorecard for 2012 and 2017. The proposed measures go along way in promoting domestic resource mobilization and utilization. The transformation targets are attached in Annex 1.
Final Draft 15.07.07 33

The Usury Act is not protecting the poor and should be replaced with a consumer-credit act with truth-in-lending provisions. Consumers need to be educated to take well-informed decisions about saving, banking, and purchasing. A concerted effort by commercial banks, the large retail outlets that offer credit facilities, consumer groups and Government should be made to reduce the over-utilization of credit facilities to protect consumers from financial crisis.
5.2 Domestic Resource Utilization
The challenge for Namibia is to utilize the abundant savings held by contractual savings institutions for productive investments without compromising the returns on the invested savings. As a matter of priority, the uncertainty around the Government proposed more stringent domestic asset requirements for NBFIs should be resolved without delay. The absorption capacity of the Namibian economy does not support a forced increase in domestic placement of capital. A process-oriented and multi-pronged approach, driven by self-regulation, would be more appropriate.
Government may consider financial incentives targeting the development of energy, mining, agriculture, manufacturing and financial sectors to reverse capital outflows and promote domestic savings and investment. International best practice should be explored23.
Following a PPP approach, a coordinated and strategic approach to investment policy and economic development, guided by international best practice, should be mapped out with further delay. This would culminate in a national economic growth strategy.
As part of such a national economic growth strategy, the Government may need to reconsider its fiscal policy. On the tax side, sector focused tax incentives may be replaced by an overall reduction of the corporate tax rate, and the individual tax rate may be cut as well to bring both in line with more competitive rates in the region. The forensic audits may be up-scaled to enhance revenue mobilization. On the expenditure side, efforts to strengthen the Public Management System (PMS) should continue and seek to – in addition to improving efficiency and effectiveness – reduce overall public spending to ensure long-term fiscal sustainability. The envisaged SOE reforms are expected to relief some of the expenditure burden and bring in some additional Government revenue. The provisions of the 2006 State Owned Enterprises Act should thus be implemented without delay. Combined, these reforms may create the necessary room for tax rate reductions.
23 For example, in the mining industry in Canada, tax incentives have played a key role in creating the enabling environment for fund holders to release part of their portfolio to productive or riskier investment purposes. Fund holders who invested in mining exploration received tax incentives to compensate for the short-term returns on their assets foregone. (BoN, 2004)
Final Draft 15.07.07 34
The Government should strengthen its economic management infrastructure to facilitate the implementation of the national economic growth strategy.
In turn, the financial sector (commercial financial institutions and Specialized Financial Institutions alike) should explore the introduction of new products to facilitate local investments. These may include asset based lending (securitization) and factoring and leasing. Further development of private equity as well as domestic money and foreign exchange markets, plus corporate bonds (to be listed on BESA) should also be explored. (IMF, 2007b and BoN, 2004) The introduction of tourism-tailored financial products is long overdue. Government needs to encourage and possibly incentivize such product diversification with suitable, market driven measures.
GIPF, being the largest pension fund in Namibia, will need to rapidly turn-around the performance of its Development Capital Portfolio if other contractual savings holders are ever to venture into investments into unlisted companies. GIPF has to set the example. The Development Capital Portfolio should be re-established guided by more prudent decision-making, carefully balancing development objectives and financial and economic feasibility and long-term sustainability.
The BoN should assist the NSX to aggressively market local listings among domestic and foreign companies. The NSX should identify and groom potential domestic companies for eventual listing, while the BoN should issue standard rules and regulations for such listings, making the assessment process more transparent and predictable.
The NSX initiative to introduce NATRIX (see Text Box 4.2) is commended and product innovation should be encouraged. The Exchange is currently studying the possibility of packaging the “Green Scheme”, a large-scale horticulture initiative based on the out-growers model (with private-to-private sector mentoring and support) and may wish to also look into the “bush-to-power” industry, transforming invader bush into electricity, feeding into the national power grid. This type of transformational socio-economic development programmes, that are profit-driven, are needed to stem the high capital outflows.
The Government and the financial sector may wish to embrace a PPP approach to SME lending. The successful PPP between DBN and Bank Windhoek could serve as a model. Working with the SME sector requires a different set of skills that will need to be developed throughout the commercial banking system, throughout the country, for SME finance to rapidly expand. For the SME sector to grow and for SME businesses to graduate to the next level of economic operations, the translation of good business ideas into viable businesses will need to be facilitated and accelerated. This is a joint responsibility for Government, the private sector and civil society. Another joint responsibility relates to the development and implementation of a national response to the dearth of entrepreneurial aspiration amongst Namibians.
Final Draft 15.07.07 35
To facilitate investments in communal areas, the Government regulations regarding the ownership arrangements over communal land need to be clarified. The Communal Land Reform Act (Act no. 5 of 2002) and the recently approved Concession Policy provide a good basis. Security of tenure is crucial for investments in the communal areas.
Industry associations may wish to study the financial products available elsewhere and lobby the financial sector for the introduction of selected, appropriate products.
Important other interventions that are beyond the scope of the current study but that have a profound impact on the utilization of domestic resources relate to human capital formation, the response to the HIV/AIDS epidemic and poverty reduction strategies. While ETSIP is on the go, interim measures would seem crucial. This may include a revisit of the stringent immigration procedures and allow well-trained and exposed professionals to work in the financial sector, and other sectors of the economy, to stem the high outflow of capital. The Government's response to HIV/AIDS, a multi-sectoral strategy, appears to be well placed to bring the epidemic under control and ensure the optimal participation of people living with AIDS in all spheres of life. The roll out of the various programmes should continue unabated. Although the economy already now feels the costs of HIV/AIDS in terms of lost productivity, high cost of care and the care of orphans, Namibia has not yet reached the turn-around point and HIV prevalence remains high. And finally, joint efforts by Government, private sector and civil society to implement the 1998 Poverty Reduction Strategy and supporting National Poverty Reduction Action Plan continue unabated. Poverty reduction through economic growth is a central theme for the 3rd National Development Plan, Vision 2030 and development partner funded programmes.
Final Draft 15.07.07 36
Documents Consulted
Bank of Namibia (2004, 2006 and 2007), Annual Reports 2003, 2005 and 2006, Windhoek, Namibia.
Brownbridge, M. (2007), Mobilizing non debt generating foreign and domestic resources for achieving MDGs in Africa, Concept Paper, Geneva, Switzerland.
Intermedia Marketing Communications CC (2007), Namibian Financial Sector Review 2007, Windhoek, Namibia.
International Monetary Fund (2006), International Financial Statistics, November 2006, Washington D.C., USA.
International Monetary Fund (2007a), Namibia: Article IV Consultation – Staff Report; Public Information Notice on the Executive Board Discussion; and Statement by the Executive Director for Namibia, Washington D.C., USA.
International Monetary Fund (2007b), Namibia: Financial System Stability Assessment, including Report on the Observations of Standards and Codes on Banking Supervision, Washington D.C., USA.
Foreign Investment Advisory Service (FIAS) (2006), Namibia Investment Legislation, Incentives, and Institutions: Recommendations for Reform, Namibia.
Namibian Stock Exchange (2007), Annual Report 31 December 2006, Windhoek, Namibia.
NFSC (2007), Namibian Financial Sector Charter (NFSC), Fourth Draft, May 2007, Windhoek, Namibia. Republic of Namibia: Central Bureau of Statistics/National Planning Commission (2003), 2001 Population and Housing Census, National Report, Basic Analysis with Highlights, Windhoek, Namibia.
Republic of Namibia: Ministry of Finance (2006), Medium Term Expenditure Framework for 2007/8 to 2009/10, presented to Parliament, Windhoek, Namibia.
Republic of Namibia: Central Bureau of Statistics/National Planning Commission (2006), National Accounts 1995-2005, Windhoek, Namibia.
Republic of Namibia: Ministry of Finance (2007), Medium Term Expenditure Framework for 2007/8 to 2009/10, presented to Parliament, Windhoek, Namibia.
Resource Futures International (2006), Feasibility Study for a Resource Mobilization Strategy to Support Development Priorities of the Government of the Republic of Namibia, Submitted to the Office of the Resident Representative of UNDP Namibia, Ottawa, Canada.
Ritter, Rainer (2007), Discussion Paper on the Recommendations regarding Domestic Asset Requirements, A Regulator’s Perspective, Namibian Financial Institutions Supervisory Agency, Windhoek, Namibia.
Sherbourne, Robin (2006), Strategies to Promote Foreign Direct Investment in Namibia, Produced for the Bank of Namibia’s 8th Annual Symposium “The assessment of FDI versus domestic investment in Namibia”, Windhoek, Namibia.
Shiimi, Ipumbu W. and Gerson Kadhikwa (1999), Savings and Investment in Namibia, Bank of Namibia Occasional Paper No.2, Windhoek, Namibia.
Stork, C. and E. van der Linden (2005), City of Windhoek: Local Economic Development, Namibian Economic Policy Research Unit, Windhoek, Namibia.
Final Draft 15.07.07 37

Uanguta, E.N. (2000), Determinants of Private Domestic Savings in Sub-Sahara Africa: The Case Study of Namibia (1980-1998), Namibian Economic Policy Research Unit (NEPRU), Working Paper no.75, Windhoek, Namibia.
Uanguta, E., E. Haiyambo, G. Kadhikwa and S. Chimana (2004), The Structure and Nature of Savings in Namibia, Bank of Namibia Occasional Paper, 8/4/1OP-1/2004, Windhoek, Namibia.
World Bank (2006), World Development Indicators, Washington D.C., USA.
Final Draft 15.07.07 38

Annex 1: NFSC Targets for Transformation Work stream Action/Indicators Measures/Targets 2012 2017 Weigh-
ting EE targets aligned with EE legislation
EE legislation
EE legislation
Spend on black employees Spend on critical/executive roles for black employees
Bursaries for skills development
Human Resource Development
Percentage (%) black junior management
20%
Procurement Policies and Practices
Procurement budget spent 30% 60% 15%
Access and Affordability Consumer education 2% of after tax
profit
2% of after tax
profit
10%
Black ownership at holding company level
20%
Direct ownership by black people 10% Black people on board of directors
40%
Black women on board of directors
11%
Black people at executive level 25%
Ownership and Control
Black women at executive level 10%
20%
Banking institutions: Business loans towards investing in or financing BEE transactions
2% 4%
Business loans towards financing black SMEs
2%
Non-banking: Investing in or financing of BEE transactions
6%
Empowerment Financing
Maximum committed to investment portfolios for investment in BEE companies
5%
10%
Enterprise Development 5%Corporate Social Investment (CSI)
After tax income spent on CSI 0.25% 10%
Consumer Protection and Education
10%