united kingdom - oecd.org - oecd worry that i will get poor at school even if i am well prepared...
TRANSCRIPT
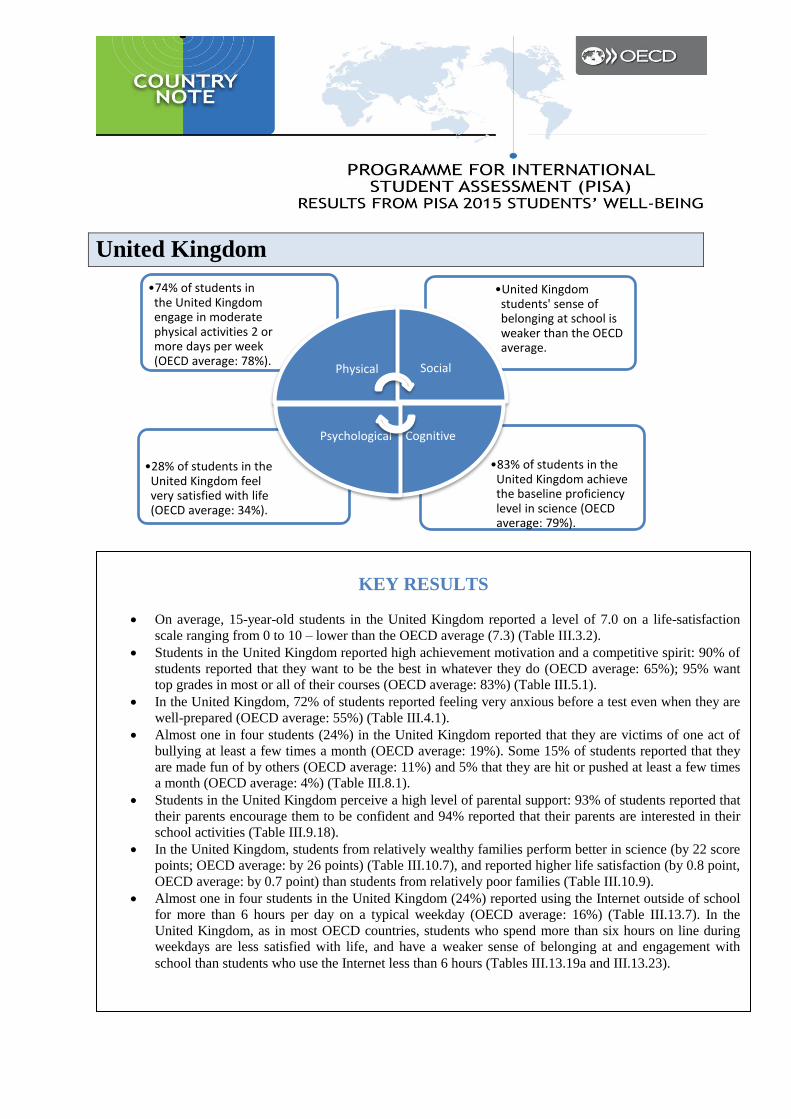
•83% of students in the United Kingdom achieve the baseline proficiency level in science (OECD average: 79%).
•28% of students in the United Kingdom feel very satisfied with life (OECD average: 34%).
•United Kingdom students' sense of belonging at school is weaker than the OECD average.
•74% of students in the United Kingdom engage in moderate physical activities 2 or more days per week (OECD average: 78%).
Physical Social
Cognitive Psychological
United Kingdom
KEY RESULTS
On average, 15-year-old students in the United Kingdom reported a level of 7.0 on a life-satisfaction
scale ranging from 0 to 10 – lower than the OECD average (7.3) (Table III.3.2).
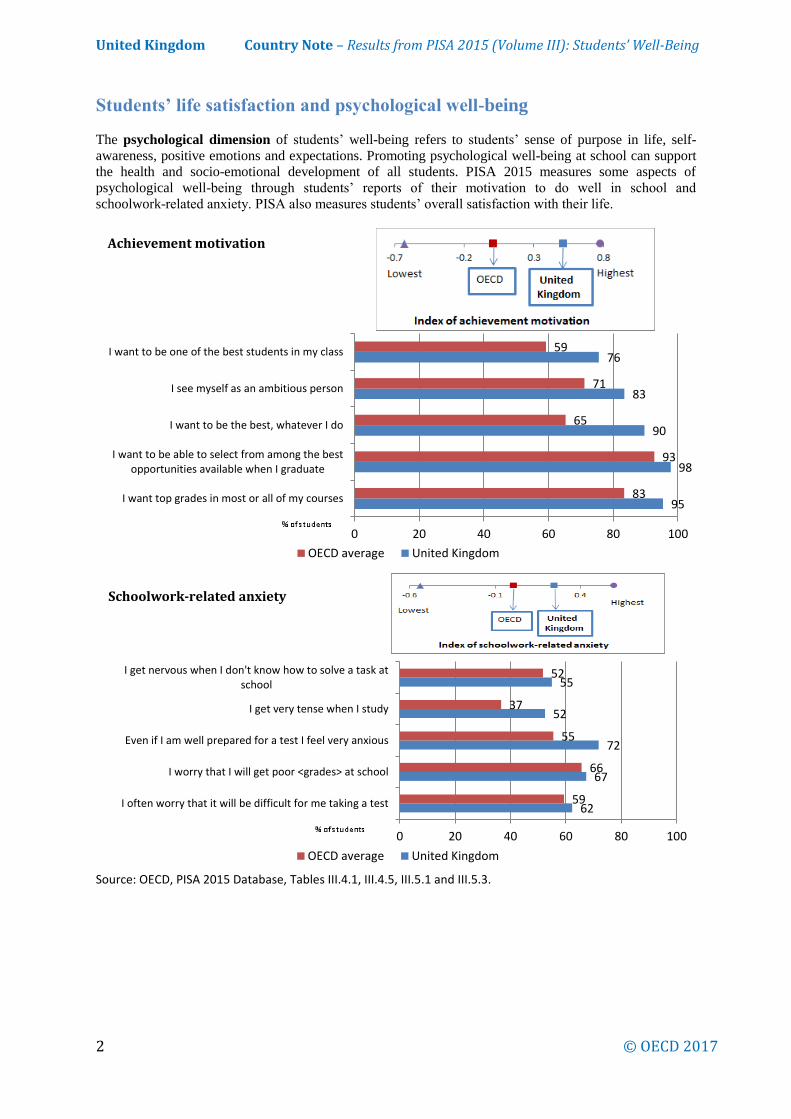
Students in the United Kingdom reported high achievement motivation and a competitive spirit: 90% of
students reported that they want to be the best in whatever they do (OECD average: 65%); 95% want
top grades in most or all of their courses (OECD average: 83%) (Table III.5.1).
In the United Kingdom, 72% of students reported feeling very anxious before a test even when they are
well-prepared (OECD average: 55%) (Table III.4.1).
Almost one in four students (24%) in the United Kingdom reported that they are victims of one act of
bullying at least a few times a month (OECD average: 19%). Some 15% of students reported that they
are made fun of by others (OECD average: 11%) and 5% that they are hit or pushed at least a few times
a month (OECD average: 4%) (Table III.8.1).
Students in the United Kingdom perceive a high level of parental support: 93% of students reported that
their parents encourage them to be confident and 94% reported that their parents are interested in their
school activities (Table III.9.18).
In the United Kingdom, students from relatively wealthy families perform better in science (by 22 score
points; OECD average: by 26 points) (Table III.10.7), and reported higher life satisfaction (by 0.8 point,
OECD average: by 0.7 point) than students from relatively poor families (Table III.10.9).
Almost one in four students in the United Kingdom (24%) reported using the Internet outside of school
for more than 6 hours per day on a typical weekday (OECD average: 16%) (Table III.13.7). In the
United Kingdom, as in most OECD countries, students who spend more than six hours on line during
weekdays are less satisfied with life, and have a weaker sense of belonging at and engagement with
school than students who use the Internet less than 6 hours (Tables III.13.19a and III.13.23).
United Kingdom Country Note – Results from PISA 2015 (Volume III): Students’ Well-Being
2 © OECD 2017
Students’ life satisfaction and psychological well-being
The psychological dimension of students’ well-being refers to students’ sense of purpose in life, self-
awareness, positive emotions and expectations. Promoting psychological well-being at school can support
the health and socio-emotional development of all students. PISA 2015 measures some aspects of
psychological well-being through students’ reports of their motivation to do well in school and
schoolwork-related anxiety. PISA also measures students’ overall satisfaction with their life.
Source: OECD, PISA 2015 Database, Tables III.4.1, III.4.5, III.5.1 and III.5.3.
95
98
90
83
76
83
93
65
71
59
0 20 40 60 80 100
I want top grades in most or all of my courses
I want to be able to select from among the bestopportunities available when I graduate
I want to be the best, whatever I do
I see myself as an ambitious person
I want to be one of the best students in my class
OECD average United Kingdom
62
67
72
52
55
59
66
55
37
52
0 20 40 60 80 100
I often worry that it will be difficult for me taking a test
I worry that I will get poor <grades> at school
Even if I am well prepared for a test I feel very anxious
I get very tense when I study
I get nervous when I don't know how to solve a task atschool
OECD average United Kingdom
Achievement motivation
Schoolwork-related anxiety

United Kingdom Country Note – Results from PISA 2015 (Volume III): Students’ Well-Being
© OECD 2017 3
Key findings about students’ life satisfaction and psychological well-being
As in the majority of countries, boys in the United Kingdom reported higher life satisfaction
than girls (0.7 point higher) (Table III.3.2).
In the United Kingdom, 50% of students reported studying less than 40 hours per week in and
outside of school (OECD average: 48%), whereas 11% of students reported studying more
than 60 hours (OECD average: 13%). Students who study more than 60 hours per week
reported lower life satisfaction than those who study less than 40 hours by 0.3 point (OECD
average: no difference between the two groups) (Table III.3.7).
In the United Kingdom, students in the top quarter of the index of achievement motivation (i.e.
students who want to be the best in their class, want to select from the best opportunities
when they graduate, want top grades and are ambitious) score 29 points higher in science –
the equivalent of one school year – than students in the bottom quarter of the index (Table
III.5.5a).
Low-achieving students reported higher levels of schoolwork-related anxiety than high-
achieving students (Table III.4.3b).
In all countries, girls reported significantly higher levels of schoolwork-related anxiety than
boys. In the United Kingdom, this gender difference is larger among top-performing students
(Table III.4.4).
Girls in the United Kingdom are 10 percentage points more likely than boys to expect to
complete a university degree; and first-generation immigrant students are 20 percentage
points more likely than non-immigrant students to expect to earn a university degree (Table
III.6.2).
Some 65% of disadvantaged students in the United Kingdom (the 25% of students with the
lowest socio-economic status) do not expect to continue on to higher education after
secondary school, whereas only 26% of advantaged students (the 25% of students with the
highest socio-economic status) do not expect to do so (Table III.6.4).

United Kingdom Country Note – Results from PISA 2015 (Volume III): Students’ Well-Being
4 © OECD 2017
Students’ social life at school
The social dimension of students’ well-being refers to the quality of their social lives. It includes students’
relationships with their family, their peers and their teachers, and students’ feelings about their social life
in and outside of school. PISA 2015 measures students’ social well-being with questions on students’
sense of belonging at school, exposure to bullying, and relationships with teachers.
Source: OECD, PISA 2015 Database, Tables III.7.1, III.7.6 and III.8.1.
20
79
68
20
88
14 17
78 73
19
82
15
0102030405060708090
100
I feel like anoutsider
I make friends easilyat school
I feel like I belong atschool
I feel awkward andout of place in my
school
Other studentsseem to like me
I feel lonely atschool
Students' sense of belonging at school
United Kingdom OECD average
11 15
6 5 5
11
24
7 11
4 4 4 8
19
0
5
10
15
20
25
30
Other studentsleft me out of
things onpurpose
Other studentsmade fun of me
I was threatenedby otherstudents
Other studentstook away or
destroyed thingsthat belong to
me
I got hit orpushed by other
students
Other studentsspread nasty
rumours aboutme
Any type
Students who reported being victims of bullying a few times a month or more during the last year
United Kingdom OECD average
% of students

United Kingdom Country Note – Results from PISA 2015 (Volume III): Students’ Well-Being
© OECD 2017 5
Key findings about students’ social life at school
Boys in the United Kingdom reported a stronger sense of belonging at school than girls. Some 23%
of girls, and 17% of boys, reported feeling like an outsider at school. This gender difference is
larger than the OECD average (Table III.7.2).
Advantaged students reported a stronger sense of belonging than disadvantaged students (Table
III.7.2). Compared to previous PISA cycles, students in the United Kingdom reported a weaker
sense of belonging in 2015 (Tables III.7.4 and III.7.5).
In the United Kingdom, around 21% reported that their teachers disciplined them more harshly
than others (OECD average: 14%) at least a few times a month; 17% perceived that their teachers
ridiculed them in front of others (OECD average: 10%) at least a few times a month (Table
III.7.15).
Boys in the United Kingdom were less likely than girls to report that they are victims of nasty
rumours or are left out by others. However, boys were more likely to encounter other types of
bullying at least a few times a month (Table III.8.2).
In the United Kingdom, students with an immigrant background were no more likely to report
being bullied than non-immigrant students and reported an equally strong sense of belonging at
school (Table III.8.3).
Students who are more frequently bullied (in the top quarter of the index of bullying) reported
much lower life satisfaction (by 1.7 points in the United Kingdom) than students who are less
frequently bullied (in the bottom quarter of the index) (Table III.8.9).
In the United Kingdom, schools with a high incidence of bullying (where more than 10% of
students are frequently bullied) score 38 points lower in science, on average, than schools with a
low incidence of bullying (where less than 5% of students are frequently bullied). This difference
shrinks to 12 score points when accounting for differences in schools’ socio-economic profile
(Table III.8.10).
Parents and the home environment
Families are the first social unit in which children learn and develop. Good parenting can take different
forms and is shaped by various social and cultural influences, but it invariably involves providing their
children with the support, care, love, guidance and protection that set the conditions for healthy physical,
mental and social development. PISA collects data from students on their perception of parental support,
and from parents on activities they do with their children at home or at their children’s schools. In the
United Kingdom, data from parents were collected only in Scotland. PISA data also provide information
on families’ wealth and other characteristics of the home environment that might affect students’ cognitive
and socio-emotional development.

United Kingdom Country Note – Results from PISA 2015 (Volume III): Students’ Well-Being
6 © OECD 2017
Note: The estimates take into account differences in students' socio-economic status.
Source: OECD, PISA 2015 Database, Figure III.9.7 and Table III.9.24.
Key findings about parents and the home environment
Advantaged students in the United Kingdom were more likely to report that their parents are
interested in their school activities (and give them greater emotional support) than disadvantaged
students. Advantaged students were also more likely to report talking with parents before or after
school, even if this type of communication between parents and children occurs relatively
frequently among both groups of children (Table III.9.19).
The 6% of students in the United Kingdom who reported that their parents are not interested in
their school activities score around 43 points lower in science (OECD average: 28 points lower)
and were much more likely to report low satisfaction with their life than student who perceive
their parents are interested (Table III.9.22).
According to their parents, around 12% of students in Scotland read books about science or visited
websites about science regularly when they were 10 years old (Table III.9.6). The students who
showed an early interest in science perform better in science, are more confident about their
abilities in science, and are more likely to expect a career in science (Table III.9.9). Students
whose parents have a university degree were more likely to engage in these activities at age 10
than students whose parents do not have a university degree (Table III.9.7).
Around 88% of parents in Scotland (and 78% of parents in 11 other OECD economies with
comparable data) reported that they had attended a scheduled meeting or conference for parents in
the previous academic year (Table III.9.1). About 15% of parents in Scotland reported that they
discussed their child's behaviour with a teacher on their own initiative in the last academic year
(average for other 11 OECD countries: 52%) and 26% that they discussed their child’s progress
with a teacher on their own initiative in the last academic year (average for other 11 OECD
countries: 52%).
About 18% of parents in Scotland reported that their participation at school was hindered by
inconvenient meeting times and difficulty of getting off work (Table III.9.26).
3.1
1.7
3.6
2.3
2.5
1.9
3.4
2
Wanting top grades Being very satisfiedwith life
Being not satisfiedwith life
Feeling lonely atschool
Students are...
Parents' interest in their child's activities at school and their well-being
United Kingdom OECD average... to report
mo
re li
kely
le
ss li
kely
Students whose parents are interested in their child's activities at school are 3.6 times less likely to report being dissatisfied with life

United Kingdom Country Note – Results from PISA 2015 (Volume III): Students’ Well-Being
© OECD 2017 7
1
8
16
29
22 24
3
16
21
27
16 16
0
5
10
15
20
25
30
35
...not at all ...one hour orless
…between 1 and 2 hours
…between 2 and 4 hours
…between 4 and 6 hours
…more than 6 hours
%
Use the Internet outside of school on a typical weekday
United Kingdom OECD average
Students’ use of their time and living habits outside of school
Students’ well-being is reinforced by the adoption of a healthy lifestyle and by the quality of leisure time.
PISA 2015 provides information on how much physical activity students engage in, on whether they eat
regularly, and on how many hours they spend using the Internet.
Source: OECD, PISA 2015 Database, Tables III.11.9 and III.13.7.
Key findings about students’ use of time outside of school
Boys in the United Kingdom are 3 percentage points more likely than girls (OECD average: 2
percentage points more likely) to engage in some moderate or vigorous physical activity outside of
school (Table III.11.10).
In the United Kingdom, students who exercise or practice sports after school are more satisfied
with their life (by 0.6 point; OECD average: 0.5 point) than those who do not (Table III.11.8).
Some 36% of girls and 22% of boys in the United Kingdom reported that they do not eat breakfast
before school, compared with 26% of girls and 18% of boys on average across OECD countries
(Table III.11.22).
In the United Kingdom, 60% of boys (OECD average: 70%) and 62% of girls (OECD average:
75%) reported helping out around the house (Table III.12.2). Some 27% of boys and 19% of girls
have a job outside the house before or after school, compared with 29% of boys and 18% of girls
on average across OECD countries (Table III.12.7). After accounting for socio-economic status,
UK students who have a job outside the house score 50 points lower in science (OECD average:
55 points lower) than students who do not work for pay (Table III.12.8).
Some 28% of students reported that they started using the Internet when they were 6 years old or
younger (OECD average: 18%) (Table III.13.6). Students reported spending at least 188 minutes
per day using the Internet during weekdays (OECD average: 146 minutes), and 224 minutes
during weekends (OECD average: 184 minutes) (Tables III.13.7 and III.13.8). Some 27% of UK
students strongly agreed that they feel really bad when they can’t connect to the Internet (OECD
average: 19%) (Table III.13.15).
Students who reported using the Internet for more than 6 hours a day during weekdays were more
likely to report feeling like an outsider at school (by 11 percentage points; OECD average: by 7
percentage points), feeling awkward and out of place at school (by 12 percentage points; OECD
average: by 8 percentage points), and arriving late at school (by 14 percentage points; OECD
average: by 11 percentage points) than students using the Internet less frequently (Tables
III.13.19a and III.13.21).
74
59
78 69
0
20
40
60
80
100
Moderate physicalactivity
Vigorous physicalactivity
Percentage of students doing moderate or visorous physical
activities twice a week or more
United Kingdom OECD
%

United Kingdom Country Note – Results from PISA 2015 (Volume III): Students’ Well-Being
8 © OECD 2017
What is PISA?
The Programme for International Student Assessment (PISA) is an ongoing triennial survey that
assesses the extent to which 15-year-olds students near the end of compulsory education have
acquired key knowledge and skills that are essential for full participation in modern societies. The
assessment does not just ascertain whether students can reproduce knowledge; it also examines how
well students can extrapolate from what they have learned and apply that knowledge in unfamiliar
settings, both in and outside of school. This approach reflects the fact that modern economies reward
individuals not for what they know, but for what they can do with what they know.
PISA offers insights for education policy and practice, and helps monitor trends in students’
acquisition of knowledge and skills across countries and in different demographic subgroups within
each country. The findings allow policy makers around the world to gauge the knowledge and skills
of students in their own countries in comparison with those in other countries, set policy targets
against measurable goals achieved by other education systems, and learn from policies and practices
applied elsewhere.
Key features of PISA 2015
The PISA 2015 survey focused on science, with reading, mathematics and collaborative problem
solving as minor areas of assessment. For the first time, PISA 2015 delivered the assessment of
all subjects via computer. Paper-based assessments were provided for countries that chose not to
test their students by computer, but the paper-based assessment was limited to questions that
could measure trends in science, reading and mathematics performance.
The students
Around 540 000 students completed the assessment in 2015, representing about 29 million 15-
year-olds in the schools of the 72 participating countries and economies.
The assessment
Computer-based tests were used, with assessments lasting a total of two hours for each student.
Test items were a mixture of multiple-choice questions and questions requiring students to
construct their own responses. The items were organised in groups based on a passage setting out
a real-life situation. About 810 minutes of test items were covered, with different students taking
different combinations of test items.
Students also answered a background questionnaire, which took 35 minutes to complete. The
questionnaire sought information about the students themselves, their homes, and their school
and learning experiences. School principals completed a questionnaire that covered the school
system and the learning environment. For additional information, some countries/economies
decided to distribute a questionnaire to teachers. It was the first time that this optional teacher
questionnaire was offered to PISA-participating countries/economies. In some
countries/economies, optional questionnaires were distributed to parents, who were asked to
provide information on their perceptions of and involvement in their child’s school, their support
for learning in the home, and their child’s career expectations, particularly in science. Countries
could choose two other optional questionnaires for students: one asked students about their
familiarity with and use of information and communication technologies (ICT); and the second
sought information about students’ education to date, including any interruptions in their
schooling, and whether and how they are preparing for a future career.

United Kingdom Country Note – Results from PISA 2015 (Volume III): Students’ Well-Being
© OECD 2017 9
United Kingdom Country Note – Results from PISA 2015 (Volume III): Students’ Well-Being
10 © OECD 2017
This work is published under the responsibility of the Secretary-General of the OECD. The opinions expressed and
arguments employed herein do not necessarily reflect the official views of OECD member countries.
This document and any map included herein are without prejudice to the status of or sovereignty over any territory, to the
delimitation of international frontiers and boundaries and to the name of any territory, city or area.
Note regarding data from Israel
The statistical data for Israel are supplied by and are under the responsibility of the relevant Israeli authorities. The use of
such data by the OECD is without prejudice to the status of the Golan Heights, East Jerusalem and Israeli settlements in the
West Bank under the terms of international law.
This work is available under the Creative Commons Attribution-NonCommercial-ShareAlike 3.0 IGO (CC BY-NC-SA 3.0
IGO). For specific information regarding the scope and terms of the licence as well as possible commercial use of this work
or the use of PISA data please consult Terms and Conditions on www.oecd.org.
Contacts:
Andreas Schleicher
Director for the Directorate for Education and Skills
Email: [email protected]
Telephone: +33 1 45 24 93 66
[email protected] [email protected]
For more information on the Programme for International
Student Assessment and to access the full set of PISA 2015
results, visit:
www.oecd.org.edu/pisa