unit iii data mining what motivated data mining? why · pdf fileunit iii data mining what...
TRANSCRIPT

Sri Vidya College of Engineering & Technology, Virudhunagar Course Material (Lecture Notes)
UNIT III DATA MINING What motivated data mining? Why is it important? The major reason that data mining has attracted a great deal of attention in information industry
in recent years is due to the wide availability of huge amounts of data and the imminent need for
turning such data into useful information and knowledge. The information and knowledge gained
can be used for applications ranging from business management, production control, and market
analysis, to engineering design and science exploration. The evolution of database technology
IT6702 Data warehousing and Data Mining Unit III Page 1

Sri Vidya College of Engineering & Technology, Virudhunagar Course Material (Lecture Notes)
What is data mining? Data mining refers to extracting or mining" knowledge from large amounts of data”. There are
many other terms related to data mining, such as knowledge mining, knowledge extraction,
data/pattern analysis, data archaeology, and data dredging. Many people treat data mining as a
synonym for another popularly used term, Knowledge Discovery in Databases", or KDD Essential step in the process of knowledge discovery in databases Knowledge discovery as a process is depicted in following figure and consists of an iterative
sequence of the following steps:
data cleaning: to remove noise or irrelevant data
data integration: where multiple data sources may be combined
data selection: where data relevant to the analysis task are retrieved from the database
data transformation: where data are transformed or consolidated into forms appropriate
for mining by performing summary or aggregation operations
data mining :an essential process where intelligent methods are applied in order to extract
data patterns
Pattern evaluation: to identify the truly interesting patterns representing knowledge based
on some interestingness measures knowledge presentation: where visualization and
knowledge representation techniques are used to present the mined knowledge to the
user.
CS2032 Data warehousing and Data Mining Unit III Page 2

Sri Vidya College of Engineering & Technology, Virudhunagar Course Material (Lecture Notes)
Architecture of a typical data mining system/Major Components Data mining is the process of discovering interesting knowledge from large amounts of data
stored either in databases, data warehouses, or other information repositories. Based on this
view, the architecture of a typical data mining system may have the following major
components: 1. A database, data warehouse, or other information repository, which consists of the set of
databases, data warehouses, spreadsheets, or other kinds of information repositories containing
the student and course information. 2. A database or data warehouse server which fetches the relevant data based on users‟ data mining requests. 3. A knowledge base that contains the domain knowledge used to guide the search or to evaluate
the interestingness of resulting patterns. For example, the knowledge base may contain metadata
which describes data from multiple heterogeneous sources. 4. A data mining engine, which consists of a set of functional modules for tasks such as
classification, association, classification, cluster analysis, and evolution and deviation analysis. 5. A pattern evaluation module that works in tandem with the data mining modules by employing
interestingness measures to help focus the search towards interestingness patterns. 6. A graphical user interface that allows the user an interactive approach to the data mining
system.
CS2032 Data warehousing and Data Mining Unit III Page 3

Sri Vidya College of Engineering & Technology, Virudhunagar Course Material (Lecture Notes)
How is a data warehouse different from a database? How are they similar?
Differences between a data warehouse and a database: A data warehouse is a repository
of information collected from multiple sources, over a history of time, stored under a
unified schema, and used for data analysis and decision support; whereas a database, is a
collection of interrelated data that represents the current status of the stored data. There
could be multiple heterogeneous databases where the schema of one database may not
agree with the schema of another. A database system supports ad-hoc query and online
transaction processing. For more details, please refer to the section “Differences
between operational database systems and data warehouses.”
Similarities between a data warehouse and a database: Both are repositories of
information, storing huge amounts of persistent data. Data mining: on what kind of data? Describe the following advanced database systems and applications: object-relational
databases, spatial databases, text databases, multimedia databases, the World Wide Web.
In principle, data mining should be applicable to any kind of information repository. This
includes relational databases, data warehouses, transactional databases, advanced database
systems, flat files, and the World-Wide Web. Advanced database systems include object-oriented
and object relational databases, and special c application-oriented databases, such as spatial
databases, time-series databases, text databases, and multimedia databases. Flat files: Flat files are actually the most common data source for data mining algorithms,
especially at the research level. Flat files are simple data files in text or binary format with a
structure known by the data mining algorithm to be applied. The data in these files can be
transactions, time-series data, scientific measurements, etc. Relational Databases: a relational database consists of a set of tables containing either values of
entity attributes, or values of attributes from entity relationships. Tables have columns and rows,
where columns represent attributes and rows represent tuples. A tuple in a relational table
corresponds to either an object or a relationship between objects and is identified by a set of
attribute values representing a unique key. In following figure it presents some relations
Customer, Items, and Borrow representing business activity in a video store. These relations are
just a subset of what could be a database for the video store and is given as an example.
CS2032 Data warehousing and Data Mining Unit III Page 4

Sri Vidya College of Engineering & Technology, Virudhunagar Course Material (Lecture Notes) The most commonly used query language for relational database is SQL, which allows retrieval
and manipulation of the data stored in the tables, as well as the calculation of aggregate functions
such as average, sum, min, max and count. For instance, an SQL query to select the videos
grouped by category would be:
SELECT count(*) FROM Items WHERE type=video GROUP BY category. Data mining algorithms using relational databases can be more versatile than data mining
algorithms specifically written for flat files, since they can take advantage of the structure
inherent to relational databases. While data mining can benefit from SQL for data selection,
transformation and consolidation, it goes beyond what SQL could provide, such as predicting,
comparing, detecting deviations, etc. Data warehouses A data warehouse is a repository of information collected from multiple sources, stored under a
unified schema, and which usually resides at a single site. Data warehouses are constructed via a
process of data cleansing, data transformation, data integration, data loading, and periodic data
refreshing. The figure shows the basic architecture of a data warehouse
CS2032 Data warehousing and Data Mining Unit III Page 5

Sri Vidya College of Engineering & Technology, Virudhunagar Course Material (Lecture Notes)
In order to facilitate decision making, the data in a data warehouse are organized around major
subjects, such as customer, item, supplier, and activity. The data are stored to provide
information from a historical perspective and are typically summarized. A data warehouse is usually modeled by a multidimensional database structure, where each
dimension corresponds to an attribute or a set of attributes in the schema, and each cell stores the
value of some aggregate measure, such as count or sales amount. The actual physical structure of
a data warehouse may be a relational data store or a multidimensional data cube. It provides a
multidimensional view of data and allows the pre computation and fast accessing of summarized
data.
CS2032 Data warehousing and Data Mining Unit III Page 6

Sri Vidya College of Engineering & Technology, Virudhunagar Course Material (Lecture Notes)
The data cube structure that stores the primitive or lowest level of information is called a base
cuboid. Its corresponding higher level multidimensional (cube) structures are called (non-base)
cuboids. A base cuboid together with all of its corresponding higher level cuboids form a data
cube. By providing multidimensional data views and the precomputation of summarized data,
data warehouse systems are well suited for On-Line Analytical Processing, or OLAP. OLAP
operations make use of background knowledge regarding the domain of the data being studied in
order to allow the presentation of data at different levels of abstraction. Such operations
accommodate different user viewpoints. Examples of OLAP operations include drill-down and
roll-up, which allow the user to view the data at differing degrees of summarization, as
illustrated in above figure. Transactional databases In general, a transactional database consists of a flat file where each record represents a
transaction. A transaction typically includes a unique transaction identity number (trans ID), and
a list of the items making up the transaction (such as items purchased in a store) as shown below:
Advanced database systems and advanced database applications
An objected-oriented database is designed based on the object-oriented programming
paradigm where data are a large number of objects organized into classes and class
hierarchies. Each entity in the database is considered as an object. The object contains a
set of variables that describe the object, a set of messages that the object can use to
communicate with other objects or with the rest of the database system and a set of
methods where each method holds the code to implement a message.
A spatial database contains spatial-related data, which may be represented in the form of
raster or vector data. Raster data consists of n-dimensional bit maps or pixel maps, and
vector data are represented by lines, points, polygons or other kinds of processed
primitives, Some examples of spatial databases include geographical (map) databases,
VLSI chip designs, and medical and satellite images databases.
CS2032 Data warehousing and Data Mining Unit III Page 7
Sri Vidya College of Engineering & Technology, Virudhunagar Course Material (Lecture Notes)
Time-Series Databases: Time-series databases contain time related data such stock
market data or logged activities. These databases usually have a continuous flow of new
data coming in, which sometimes causes the need for a challenging real time analysis.
Data mining in such databases commonly includes the study of trends and correlations
between evolutions of different variables, as well as the prediction of trends and
movements of the variables in time.
A text database is a database that contains text documents or other word descriptions in
the form of long sentences or paragraphs, such as product specifications, error or bug
reports, warning messages, summary reports, notes, or other documents.
A multimedia database stores images, audio, and video data, and is used in applications
such as picture content-based retrieval, voice-mail systems, video-on-demand systems,
the World Wide Web, and speech-based user interfaces.
The World-Wide Web provides rich, world-wide, on-line information services, where
data objects are linked together to facilitate interactive access. Some examples of
distributed information services associated with the World-Wide Web include America
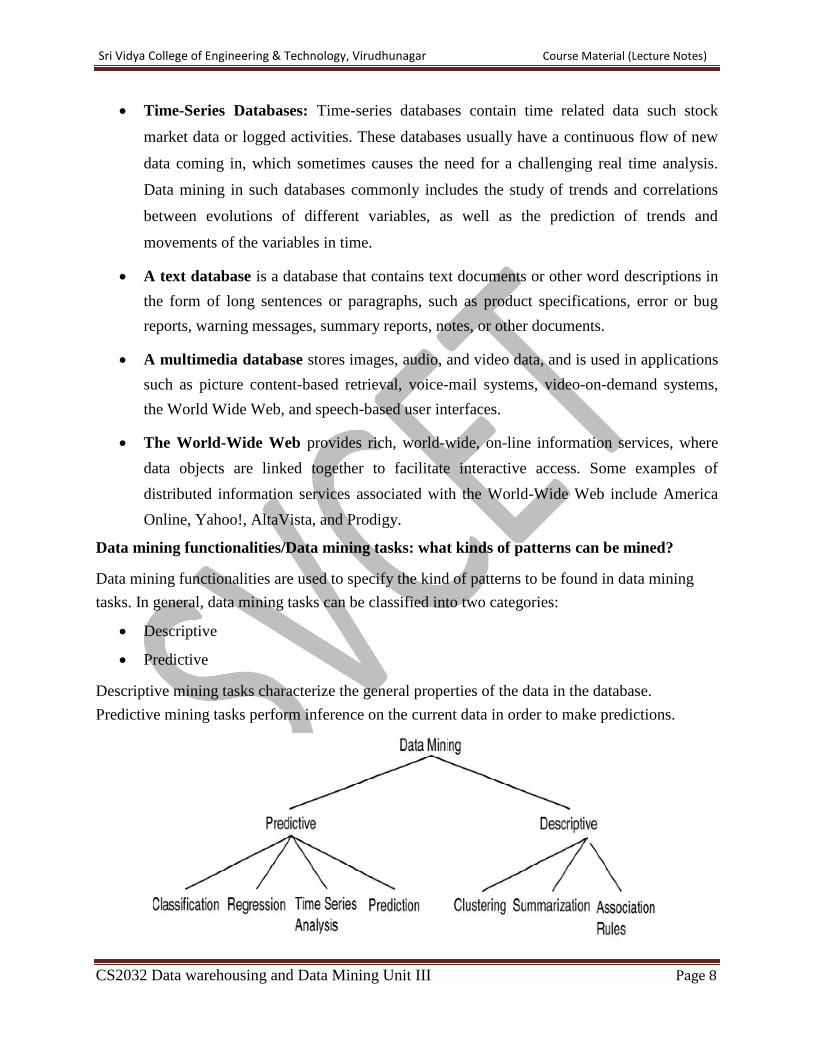
Online, Yahoo!, AltaVista, and Prodigy. Data mining functionalities/Data mining tasks: what kinds of patterns can be mined? Data mining functionalities are used to specify the kind of patterns to be found in data mining
tasks. In general, data mining tasks can be classified into two categories:
Descriptive
Predictive Descriptive mining tasks characterize the general properties of the data in the database.
Predictive mining tasks perform inference on the current data in order to make predictions.
CS2032 Data warehousing and Data Mining Unit III Page 8

Sri Vidya College of Engineering & Technology, Virudhunagar Course Material (Lecture Notes)
Describe data mining functionalities, and the kinds of patterns they can
discover (or) Define each of the following data mining functionalities: characterization, discrimination,
association and correlation analysis, classification, prediction, clustering, and evolution analysis.
Give examples of each data mining functionality, using a real-life database that you are familiar
with. 1 Concept/class description: characterization and discrimination Data can be associated with classes or concepts. It describes a given set of data in a concise and
summarative manner, presenting interesting general properties of the data. These descriptions
can be derived via
1. data characterization, by summarizing the data of the class under study (often called
the target class)
2. data discrimination, by comparison of the target class with one or a set of
comparative classes
3. both data characterization and discrimination Data characterization It is a summarization of the general characteristics or features of a target class of data. Example: A data mining system should be able to produce a description summarizing the characteristics of
a student who has obtained more than 75% in every semester; the result could be a general
profile of the student. Data Discrimination is a comparison of the general features of target class data objects with the
general features of objects from one or a set of contrasting classes. Example The general features of students with high GPA‟s may be compared with the general features of
students with low GPA‟s. The resulting description could be a general comparative profile of the
students such as 75% of the students with high GPA‟s are fourth-year computing science
students while 65% of the students with low GPA‟s are not. The output of data characterization can be presented in various forms. Examples include pie
charts, bar charts, curves, multidimensional data cubes, and multidimensional tables, including
CS2032 Data warehousing and Data Mining Unit III Page 9

Sri Vidya College of Engineering & Technology, Virudhunagar Course Material (Lecture Notes)
crosstabs. The resulting descriptions can also be presented as generalized relations, or in rule
form called characteristic rules. Discrimination descriptions expressed in rule form are referred to as discriminant rules. 2 Association It is the discovery of association rules showing attribute-value conditions that occur frequently
together in a given set of data. For example, a data mining system may find association rules like major(X, “computing science””) ⇒ owns(X, “personal computer”) [support = 12%, confidence = 98%] where X is a variable representing a student. The rule indicates that of the students under study,
12% (support) major in computing science and own a personal computer. There is a 98%
probability (confidence, or certainty) that a student in this group owns a personal computer. Example: A grocery store retailer to decide whether to but bread on sale. To help determine the impact of
this decision, the retailer generates association rules that show what other products are frequently
purchased with bread. He finds 60% of the times that bread is sold so are pretzels and that 70%
of the time jelly is also sold. Based on these facts, he tries to capitalize on the association
between bread, pretzels, and jelly by placing some pretzels and jelly at the end of the aisle where
the bread is placed. In addition, he decides not to place either of these items on sale at the same
time. 3 Classification and prediction Classification: Classification:
It predicts categorical class labels
It classifies data (constructs a model) based on the training set and the values (class
labels) in a classifying attribute and uses it in classifying new data
Typical Applications credit approval
target marketing
medical diagnosis
treatment effectiveness analysis
CS2032 Data warehousing and Data Mining Unit III Page 10

Sri Vidya College of Engineering & Technology, Virudhunagar Course Material (Lecture Notes)
Classification can be defined as the process of finding a model (or function) that describes and
distinguishes data classes or concepts, for the purpose of being able to use the model to predict
the class of objects whose class label is unknown. The derived model is based on the analysis of
a set of training data (i.e., data objects whose class label is known). Example: An airport security screening station is used to deter mine if passengers are potential terrorist or
criminals. To do this, the face of each passenger is scanned and its basic pattern(distance
between eyes, size, and shape of mouth, head etc) is identified. This pattern is compared to
entries in a database to see if it matches any patterns that are associated with known offenders A classification model can be represented in various forms, such as 1) IF-THEN rules,
student ( class , "undergraduate") AND concentration ( level, "high") ==> class
A student (class ,"undergraduate") AND concentrtion (level,"low") ==> class B
student (class , "post graduate") ==> class C 2) Decision tree 3) Neural network
CS2032 Data warehousing and Data Mining Unit III Page 11

Sri Vidya College of Engineering & Technology, Virudhunagar Course Material (Lecture Notes)
Prediction: Find some missing or unavailable data values rather than class labels referred to as prediction.
Although prediction may refer to both data value prediction and class label prediction, it is
usually confined to data value prediction and thus is distinct from classification. Prediction also
encompasses the identification of distribution trends based on the available data. Example: Predicting flooding is difficult problem. One approach is uses monitors placed at various points
in the river. These monitors collect data relevant to flood prediction: water level, rain amount,
time, humidity etc. These water levels at a potential flooding point in the river can be predicted
based on the data collected by the sensors upriver from this point. The prediction must be made
with respect to the time the data were collected. Classification vs. Prediction Classification differs from prediction in that the former is to construct a set of models (or
functions) that describe and distinguish data class or concepts, whereas the latter is to predict
some missing or unavailable, and often numerical, data values. Their similarity is that they are
both tools for prediction: Classification is used for predicting the class label of data objects and
prediction is typically used for predicting missing numerical data values. 4 Clustering analysis
Clustering analyzes data objects without consulting a known class label.
The objects are clustered or grouped based on the principle of maximizing the intraclass
similarity and minimizing the interclass similarity.
Each cluster that is formed can be viewed as a class of objects.
Clustering can also facilitate taxonomy formation, that is, the organization of
observations into a hierarchy of classes that group similar events together as shown
below: Are All the “Discovered” Patterns Interesting?
A data mining system/query may generate thousands of patterns, not all of them are
interesting.
Suggested approach: Human-centered, query-based, focused mining
CS2032 Data warehousing and Data Mining Unit III Page 12

Sri Vidya College of Engineering & Technology, Virudhunagar Course Material (Lecture Notes)
Interestingness measures: A pattern is interesting if it is easily understood by humans,
valid on new or test data with some degree of certainty, potentially useful, novel, or
validates some hypothesis that a user seeks to confirm
Objective vs. subjective interestingness measures:
Objective: based on statistics and structures of patterns, e.g., support, confidence, etc.
Subjective: based on user‟s belief in the data, e.g., unexpectedness, novelty, actionability, etc.
Find all the interesting patterns: Completeness Can a data mining system find all the interesting patterns?
Association vs. classification vs. clustering
Search for only interesting patterns: Optimization Can a data mining system find only the interesting patterns?
Highly desirable, progress has been made, but still a challenge
Approaches
First general all the patterns and then filter out the uninteresting ones
Generate only the interesting patterns—mining query optimization Pattern evaluation: refers to interestingness of pattern: A data mining system can uncover
thousands of patterns. Many of the patterns discovered may be uninteresting to the given user,
representing common knowledge or lacking novelty. Several challenges remain regarding the
development of techniques to assess the interestingness of discovered patterns, Performance issues. These include efficiency, scalability, and parallelization of data
mining algorithms.
Efficiency and scalability of data mining algorithms: To effectively extract information from a huge amount of data in databases, data mining algorithms must be
efficient and scalable.
Parallel, distributed, and incremental updating algorithms: Such algorithms divide the data into partitions, which are processed in parallel. The results from the partitions are
then merged.
3. Issues relating to the diversity of database types
CS2032 Data warehousing and Data Mining Unit III Page 13

Sri Vidya College of Engineering & Technology, Virudhunagar Course Material (Lecture Notes)
Handling of relational and complex types of data: Since relational databases and data
warehouses are widely used, the development of efficient and effective data mining
systems for such data is important.
Mining information from heterogeneous databases and global information systems:
Local and wide-area computer networks (such as the Internet) connect many sources of
data, forming huge, distributed, and heterogeneous databases. The discovery of
knowledge from different sources of structured, semi-structured, or unstructured data
with diverse data semantics poses great challenges to data mining.
Consider a classic example of the following rule: IF (patient is pregnant) THEN (patient is female).
This rule is very accurate and comprehensible, but it is not interesting, since it represents the obvious. Another Example from real world data set,
IF (used_seat_belt = „yes‟) THEN (injury = „no‟).......................................................(1)
IF ((used_seat_belt = „yes‟) Λ (passenger = child)) THEN (injury = „yes‟)...............(2)
Rule (1) is a general and an obvious rule. But rule (2) contradicts the knowledge represented by rule (1) and so the user's belief. This kind of knowledge is unexpected
from users preset beliefs and it is always interesting to extract this interesting (or
surprising) knowledge from data sets. “Unexpectedness” means knowledge which is
unexpected from the beliefs of users i.e. A decision rule is considered to be interesting (or
surprising) if it represents knowledge that was not only previously unknown to the users
but also contradicts the original beliefs of the users.
I hope, these examples may help you to understand the concept more clearly.
Edit
Yes, firstly, discover the general rules and then discover exceptions to these general rules. For example, A general rule : If bird then fly
However, there are few exceptional birds like emu and penguin that do not fly. It would definitely be valuable to discover such exceptions along with the rule, making the rule
more accurate, comprehensible as well as interesting.
CS2032 Data warehousing and Data Mining Unit III Page 14

Sri Vidya College of Engineering & Technology, Virudhunagar Course Material (Lecture Notes)
Classification of data mining systems There are many data mining systems available or being developed. Some are specialized systems
dedicated to a given data source or are confined to limited data mining functionalities, other are
more versatile and comprehensive. Data mining systems can be categorized according to various
criteria among other classification are the following:
Classification according to the type of data source mined: this classification
categorizes data mining systems according to the type of data handled such as spatial
data, multimedia data, time-series data, text data, World Wide Web, etc.
Classification according to the data model drawn on: this classification categorizes
data mining systems based on the data model involved such as relational database, object-
oriented database, data warehouse, transactional, etc.
Classification according to the king of knowledge discovered: this classification
categorizes data mining systems based on the kind of knowledge discovered or data
mining functionalities, such as characterization, discrimination, association,
classification, clustering, etc. Some systems tend to be comprehensive systems offering
several data mining functionalities together.
Classification according to mining techniques used: Data mining systems employ and
provide different techniques. This classification categorizes data mining systems
according to the data analysis approach used such as machine learning, neural networks,
genetic algorithms, statistics, visualization, database oriented or data warehouse-oriented,
etc. The classification can also take into account the degree of user interaction involved
in the data mining process such as query-driven systems, interactive exploratory systems,
or autonomous systems. A comprehensive system would provide a wide variety of data
mining techniques to fit different situations and options, and offer different degrees of
user interaction. Five primitives for specifying a data mining task
Task-relevant data: This primitive specifies the data upon which mining is to be
performed. It involves specifying the database and tables or data warehouse containing
the relevant data, conditions for selecting the relevant data, the relevant attributes or
dimensions for exploration, and instructions regarding the ordering or grouping of the
data retrieved.
CS2032 Data warehousing and Data Mining Unit III Page 15

Sri Vidya College of Engineering & Technology, Virudhunagar Course Material (Lecture Notes)
Knowledge type to be mined: This primitive specifies the specific data mining function
to be performed, such as characterization, discrimination, association, classification,
clustering, or evolution analysis. As well, the user can be more specific and provide
pattern templates that all discovered patterns must match. These templates or meta
patterns (also called meta rules or meta queries), can be used to guide the discovery
process.
Background knowledge: This primitive allows users to specify knowledge they have
about the domain to be mined. Such knowledge can be used to guide the knowledge
discovery process and evaluate the patterns that are found. Of the several kinds of
background knowledge, this chapter focuses on concept hierarchies.
Pattern interestingness measure: This primitive allows users to specify functions that
are used to separate uninteresting patterns from knowledge and may be used to guide the
mining process, as well as to evaluate the discovered patterns. This allows the user to
confine the number of uninteresting patterns returned by the process, as a data mining
process may generate a large number of patterns. Interestingness measures can be
specified for such pattern characteristics as simplicity, certainty, utility and novelty.
Visualization of discovered patterns: This primitive refers to the form in which
discovered patterns are to be displayed. In order for data mining to be effective in
conveying knowledge to users, data mining systems should be able to display the
discovered patterns in multiple forms such as rules, tables, cross tabs (cross-tabulations),
pie or bar charts, decision trees, cubes or other visual representations.
Major issues in data mining Major issues in data mining is regarding mining methodology, user interaction, performance, and
diverse data types 1 Mining methodology and user-interaction issues:
Mining different kinds of knowledge in databases: Since different users can be interested
in different kinds of knowledge, data mining should cover a wide spectrum of data analysis and
knowledge discovery tasks, including data characterization, discrimination, association,
classification, clustering, trend and deviation analysis, and similarity analysis. These tasks may
CS2032 Data warehousing and Data Mining Unit III Page 16

Sri Vidya College of Engineering & Technology, Virudhunagar Course Material (Lecture Notes)
use the same database in different ways and require the development of numerous data mining
techniques. Interactive mining of knowledge at multiple levels of abstraction: Since it is difficult to know
exactly what can be discovered within a database, the data mining process should be interactive. Incorporation of background knowledge: Background knowledge, or information regarding
the domain under study, may be used to guide the discovery patterns. Domain knowledge related
to databases, such as integrity constraints and deduction rules, can help focus and speed up a data
mining process, or judge the interestingness of discovered patterns. Data mining query languages and ad-hoc data mining: Knowledge in Relational query
languages (such as SQL) required since it allow users to pose ad-hoc queries for data retrieval. Presentation and visualization of data mining results: Discovered knowledge should be
expressed in high-level languages, visual representations, so that the knowledge can be easily
understood and directly usable by humans Handling outlier or incomplete data: The data stored in a database may reflect outliers: noise,
exceptional cases, or incomplete data objects. These objects may confuse the analysis process,
causing over fitting of the data to the knowledge model constructed. As a result, the accuracy of
the discovered patterns can be poor. Data cleaning methods and data analysis methods which can
handle outliers are required. Pattern evaluation: refers to interestingness of pattern: A data mining system can uncover
thousands of patterns. Many of the patterns discovered may be uninteresting to the given user,
representing common knowledge or lacking novelty. Several challenges remain regarding the
development of techniques to assess the interestingness of discovered patterns. 2. Performance issues. These include efficiency, scalability, and parallelization of data mining algorithms. Efficiency and scalability of data mining algorithms: To effectively extract information from
a huge amount of data in databases, data mining algorithms must be efficient and scalable. Parallel, distributed, and incremental updating algorithms: Such algorithms divide the data
into partitions, which are processed in parallel. The results from the partitions are then merged.
CS2032 Data warehousing and Data Mining Unit III Page 17

Sri Vidya College of Engineering & Technology, Virudhunagar Course Material (Lecture Notes)
3. Issues relating to the diversity of database types Handling of relational and complex types of data: Since relational databases and data
warehouses are widely used, the development of efficient and effective data mining systems for
such data is important. Mining information from heterogeneous databases and global information systems: Local
and wide-area computer networks (such as the Internet) connect many sources of data, forming
huge, distributed, and heterogeneous databases. The discovery of knowledge from different
sources of structured, semi-structured, or unstructured data with diverse data semantics poses
great challenges to data mining. Data Integration Information Data Integration Data integration involves combining data from several disparate sources, which are stored using
various technologies and provide a unified view of the data. Data integration becomes
increasingly important in cases of merging systems of two companies or consolidating
applications within one company to provide a unified view of the company's data assets. Data Migration Data Migration is the process of transferring data from one system to another while changing the
storage, database or application. In reference to the ETL (Extract-Transform-Load) process, data
migration always requires at least Extract and Load steps. Data Synchronization Data Synchronization is a process of establishing consistency among systems and subsequent
continuous updates to maintain consistency. The word 'continuous' should be stressed here as the
data synchronization should not be considered as a one-time task. ETL ETL comes from Data Warehousing and stands for Extract-Transform-Load. ETL covers a
process of how the data are loaded from the source system to the data warehouse. Business Intelligence Business Intelligence (BI) is a set of tools supporting the transformation of raw data into useful
information which can support decision making. Business Intelligence provides reporting
functionality, tools for identifying data clusters, support for data mining techniques, business
performance management and predictive analysis.
CS2032 Data warehousing and Data Mining Unit III Page 18

Sri Vidya College of Engineering & Technology, Virudhunagar Course Material (Lecture Notes)
Master Data Management Master Data Management (MDM) represents a set of tools and processes used by an enterprise
to consistently manage their non-transactional data.
DW and OLAP are essential elements of decision support. They are complementary
technologies - a DW stores and manages data while OLAP transforms the data into possibly
strategic information. Decision support usually requires consolidating data from many
heterogeneous sources: these might include external sources in addition to several operational
databases. The different sources might contain data of varying quality, or use inconsistent
representations, codes and formats, which have to be reconciled. Since data warehouses contain
consolidated data, perhaps from several operational databases, over potentially long periods of
time, they tend to be orders of magnitude larger than operational databases. In data warehouses
historical and summarized data is more important than detailed. Many organizations want to
implement an integrated enterprise warehouse that collects information about all subjects
spanning the whole organization. Some organizations are settling for data marts instead, which
are departmental subsets focused on selected subjects (e.g., a marketing data mart, personnel data
mart).
A popular conceptual model that influences the front-end tools, database design, and the
query engines for OLAP is the multidimensional view of data in the warehouse. In a
multidimensional data model, there is a set of numeric measures that are the objects of analysis.
Examples of such measures are sales, revenue, and profit. Each of the numeric measures depends
on a set of dimensions, which provide the context for the measure. For example, the dimensions
associated with a sale amount can be the store, product, and the date when the sale was made.
The dimensions together are assumed to uniquely determine the measure. Thus, the
multidimensional data views a measure as a value in the multidimensional space of dimensions.
Often, dimensions are hierarchical; time of sale may be organized as a day-month-quarter-year
hierarchy, product as a product-category-industry hierarchy.
Typical OLAP operations, also called cubing operation, include rollup (increasing the
level of aggregation) and drill-down (decreasing the level of aggregation or increasing detail)
along one or more dimension hierarchies, slicing (the extraction from a data cube of summarized
data for a given dimensionvalue), dicing (the extraction of a “sub-cube”, or intersection of
several slices), and pivot (rotating of the axes of a data cube so that one may examine a cube
CS2032 Data warehousing and Data Mining Unit III Page 19

Sri Vidya College of Engineering & Technology, Virudhunagar Course Material (Lecture Notes)
from different angles). Other technology that can be used for querying the warehouse is Data
Mining.
Knowledge Discovery (KD) is a nontrivial process of identifying valid, novel, potentially
useful, and ultimately understandable patterns from large collections of data [6]. One of the KD
steps is Data Mining (DM). DM is the step that is concerned with the actual extraction of
knowledge from data, in contrast to the KD process that is concerned with many other things like
understanding and preparation of the data, verification of the mining results etc. In practice,
however, people use terms DM and KD as synonymous.
Mining Methodology & User Interaction Issues 1. Mining different kinds of knowledge in database.
Different users-different knowledge-different way (with same database) 2. Interactive Mining of knowledge at multiple levels of abstraction.
Focus the search patterns
Different angles 3. Incorporation of background knowledge.
Background & Domain knowledge. 4. Data mining query languages and ad hoc data mining
High level data mining query language
Conditions and constraints 5. Presentation and visualization of data mining results.
Use visual representations
Expressive forms like graph, chart, matrices, curves, tables, etc… CS2032 Data warehousing and Data Mining Unit III Page 20

Sri Vidya College of Engineering & Technology, Virudhunagar Course Material (Lecture Notes) 6. Handling noisy or incomplete data.
Confuse the process
Over fit the data (apply any outlier analysis, data cleaning methods) 7. Pattern evaluation- the interestingness problem.
Pattern may be uninteresting to the user
Solve by user specified constraints Performance Issues Efficiency and scalability of data mining algorithms
Running time.
Should be opt for huge amount of data. Parallel, Distributed and incremental mining algorithms
Huge size of database
Wide distribution of data
High cost
Computational complexity
Data mining methods
Solve by; efficient algorithms. Diversity of data Types Issues Handling of relational and complex types of data.
One system-> to mine all kinds of data
Specific data mining system should be constructed. Mining information from heterogeneous databases and global information systems
Web mining
uncover knowledge about web contents, web structure, web usage and web dynamics
Data preprocessing
Data preprocessing describes any type of processing performed on raw data to prepare it
for another processing procedure. Commonly used as a preliminary data mining practice, data
preprocessing transforms the data into a format that will be more easily and effectively processed
for the purpose of the user.
Data preprocessing describes any type of processing performed on raw data to prepare it
for another processing procedure. Commonly used as a preliminary data mining practice, data
preprocessing transforms the data into a format that will be more easily and effectively processed
for the purpose of the user CS2032 Data warehousing and Data Mining Unit III Page 21

Sri Vidya College of Engineering & Technology, Virudhunagar Course Material (Lecture Notes)
Why Data Preprocessing? Data in the real world is dirty. It can be in incomplete, noisy and inconsistent from. These data
needs to be preprocessed in order to help improve the quality of the data, and quality of the
mining results.
If no quality data, then no quality mining results. The quality decision is always based on
the quality data.
If there is much irrelevant and redundant information present or noisy and unreliable
data, then knowledge discovery during the training phase is more difficult Incomplete data: lacking attribute values, lacking certain attributes of interest, or containing
only aggregate data. e.g., occupation=“ ”.
Noisy data: containing errors or outliers data. e.g., Salary=“-10”
Inconsistent data: containing discrepancies in codes or names. e.g., Age=“42” Birthday=“03/07/1997” Incomplete data may come from
“Not applicable” data value when collected
Different considerations between the time when the data was collected and when it is analyzed
Human/hardware/software problems Noisy data (incorrect values) may come from
Faulty data collection by instruments
Human or computer error at data entry
Errors in data transmission Inconsistent data may come from
Different data sources
Functional dependency violation (e.g., modify some linked data) Major Tasks in Data Preprocessing Data cleaning: Fill in missing values, smooth noisy data, identify or remove outliers, and resolve inconsistencies Data integration: Integration of multiple databases, data cubes, or files Data transformation: Normalization and aggregation Data reduction: Obtains reduced representation in volume but produces the same or similar
analytical results
CS2032 Data warehousing and Data Mining Unit III Page 22

Sri Vidya College of Engineering & Technology, Virudhunagar Course Material (Lecture Notes) Data discretization: Part of data reduction but with particular importance, especially for numerical data Forms of Data Preprocessing Data cleaning: Data cleaning routines attempt to fill in missing values, smooth out noise while identifying
outliers, and correct inconsistencies in the data. Various methods for handling this problem: The various methods for handling the problem of missing values in data tuples include: (a) Ignoring the tuple: This is usually done when the class label is missing (assuming the
mining task involves classification or description). This method is not very effective unless the
tuple contains several attributes with missing values. It is especially poor when the percentage of
missing values per attribute varies considerably. (b) Manually filling in the missing value: In general, this approach is time-consuming and may
not be a reasonable task for large data sets with many missing values, especially when the value
to be filled in is not easily determined. (c) Using a global constant to fill in the missing value: Replace all missing attribute values by
the same constant, such as a label like “Unknown,” or −∞. If missing values are replaced by, say,
“Unknown,” then the mining program may mistakenly think that they form an interesting
CS2032 Data warehousing and Data Mining Unit III Page 23

Sri Vidya College of Engineering & Technology, Virudhunagar Course Material (Lecture Notes) concept, since they all have a value in common — that of “Unknown.” Hence, although this method is simple, it is not recommended. (d) Using the attribute mean for quantitative (numeric) values or attribute mode for
categorical (nominal) values, for all samples belonging to the same class as the given tuple: For example, if classifying customers according to credit risk, replace the missing value with the
average income value for customers in the same credit risk category as that of the given tuple. (e) Using the most probable value to fill in the missing value: This may be determined with
regression, inference-based tools using Bayesian formalism, or decision tree induction. For example, using the other customer attributes in your data set, you may construct a decision tree to
predict the missing values for income. Noisy data: Noise is a random error or variance in a measured variable. Data smoothing tech is used for removing
such noisy data. Several Data smoothing techniques: 1 Binning methods: Binning methods smooth a sorted data value by consulting the
neighborhood", or values around it. The sorted values are distributed into a number of 'buckets',
or bins. Because binning methods consult the neighborhood of values, they perform local
smoothing. In this technique, 1. The data for first sorted 2. Then the sorted list partitioned into equi-depth of bins. 3. Then one can smooth by bin means, smooth by bin median, smooth by bin boundaries, etc.
a. Smoothing by bin means: Each value in the bin is replaced by the mean value of the bin.
b. Smoothing by bin medians: Each value in the bin is replaced by the bin median.
c. Smoothing by boundaries: The min and max values of a bin are identified as the
bin boundaries. Each bin value is replaced by the closest boundary value. Example: Binning Methods for Data Smoothing
Sorted data for price (in dollars): 4, 8, 9, 15, 21, 21, 24, 25, 26, 28, 29, 34
Partition into (equi-depth) bins(equi depth of 3 since each bin contains three values):
- Bin 1: 4, 8, 9, 15
CS2032 Data warehousing and Data Mining Unit III Page 24

Sri Vidya College of Engineering & Technology, Virudhunagar Course Material (Lecture Notes)
- Bin 2: 21, 21, 24, 25
- Bin 3: 26, 28, 29, 34
Smoothing by bin means:
- Bin 1: 9, 9, 9, 9
- Bin 2: 23, 23, 23, 23
- Bin 3: 29, 29, 29, 29
Smoothing by bin boundaries:
- Bin 1: 4, 4, 4, 15
- Bin 2: 21, 21, 25, 25
- Bin 3: 26, 26, 26, 34
In smoothing by bin means, each value in a bin is replaced by the mean value of the bin. For
example, the mean of the values 4, 8, and 15 in Bin 1 is 9. Therefore, each original value in this
bin is replaced by the value 9. Similarly, smoothing by bin medians can be employed, in which
each bin value is replaced by the bin median. In smoothing by bin boundaries, the minimum and
maximum values in a given bin are identified as the bin boundaries. Each bin value is then
replaced by the closest boundary value. Suppose that the data for analysis include the attribute age. The age values for the data tuples are
(in increasing order): 13, 15, 16, 16, 19, 20, 20, 21, 22, 22, 25, 25, 25, 25, 30, 33, 33, 35, 35, 35,
35, 36, 40, 45, 46, 52, 70. (a) Use smoothing by bin means to smooth the above data, using a bin depth of 3. Illustrate your
steps. Comment on the effect of this technique for the given data. The following steps are required to smooth the above data using smoothing by bin means with a
bin depth of 3. Step 1: Sort the data. (This step is not required here as the data are already sorted.) Step 2: Partition the data into equidepth bins of depth 3. Bin
1: 13, 15, 16 Bin 2: 16, 19, 20 Bin 3: 20, 21, 22 Bin
4: 22, 25, 25 Bin 5: 25, 25, 30 Bin 6: 33, 33, 35 Bin
7: 35, 35, 35 Bin 8: 36, 40, 45 Bin 9: 46, 52, 70 Step 3: Calculate the arithmetic mean of each bin.
CS2032 Data warehousing and Data Mining Unit III Page 25

Sri Vidya College of Engineering & Technology, Virudhunagar Course Material (Lecture Notes)
Step 4: Replace each of the values in each bin by the arithmetic mean calculated for the bin.
Bin 1: 14, 14, 14 Bin 2: 18, 18, 18 Bin 3: 21, 21, 21
Bin 4: 24, 24, 24 Bin 5: 26, 26, 26 Bin 6: 33, 33, 33
Bin 7: 35, 35, 35 Bin 8: 40, 40, 40 Bin 9: 56, 56, 56 2 Clustering: Outliers in the data may be detected by clustering, where similar values are
organized into groups, or „clusters‟. Values that fall outside of the set of clusters may be
considered outliers.
3 Regression : smooth by fitting the data into regression functions.
Linear regression involves finding the best of line to fit two variables, so that one variable
can be used to predict the other.
Multiple linear regression is an extension of linear regression, where more than two
variables are involved and the data are fit to a multidimensional surface. Using regression to find a mathematical equation to fit the data helps smooth out the noise. CS2032 Data warehousing and Data Mining Unit III Page 26

Sri Vidya College of Engineering & Technology, Virudhunagar Course Material (Lecture Notes)
Field overloading: is a kind of source of errors that typically occurs when developers compress
new attribute definitions into unused portions of already defined attributes. Unique rule is a rule says that each value of the given attribute must be different from all other
values of that attribute Consecutive rule is a rule says that there can be no missing values between the lowest and
highest values of the attribute and that all values must also be unique. Null rule specifies the use of blanks, question marks, special characters or other strings that may
indicate the null condition and how such values should be handled.
CS2032 Data warehousing and Data Mining Unit III Page 27