unit 5 ecology - phsbio2201phsbio2201.weebly.com/uploads/4/4/5/1/44518025/interactions_of... ·...
TRANSCRIPT
9/9/2013
1
Unit 5 EcologyUnit 5 Ecology
Ch. 19 PopulationsCh. 19 Populations
Characteristics of Populations
Characteristics of Populations
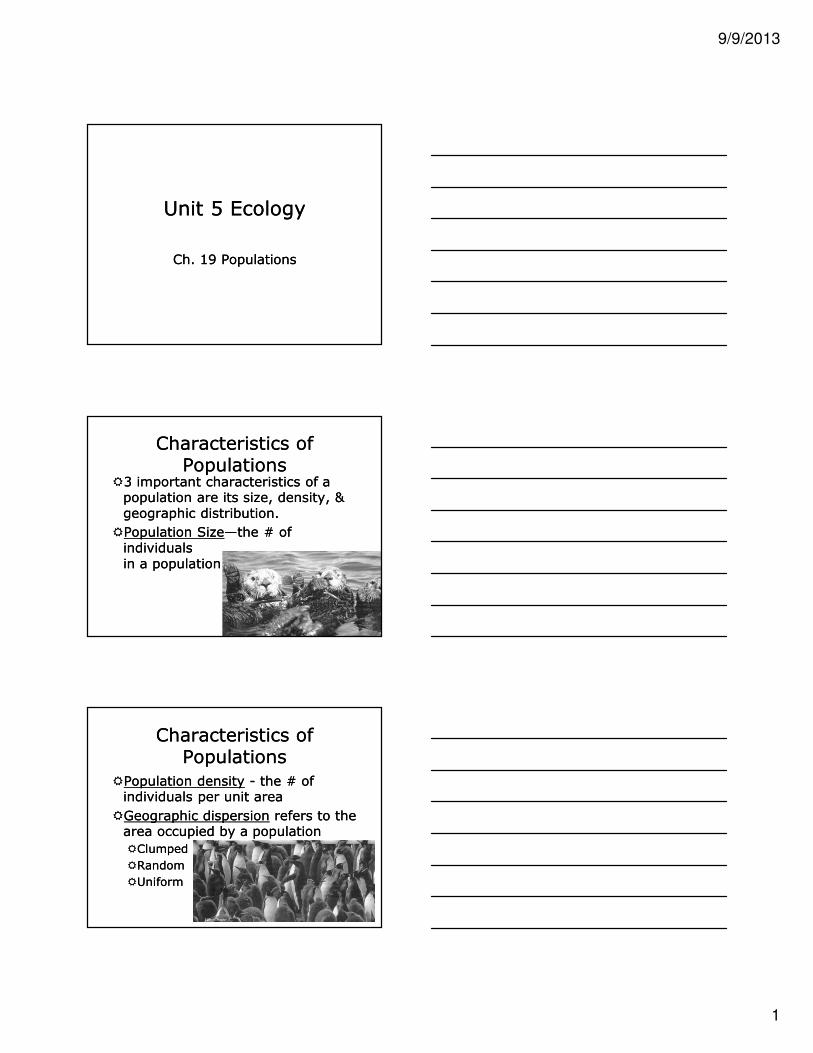
�3 important characteristics of a population are its size, density, & geographic distribution.
�Population Size—the # of individuals in a population
�3 important characteristics of a population are its size, density, & geographic distribution.
�Population Size—the # of individuals in a population
Characteristics of Populations
Characteristics of Populations
�Population density - the # of individuals per unit area
�Geographic dispersion refers to the area occupied by a population
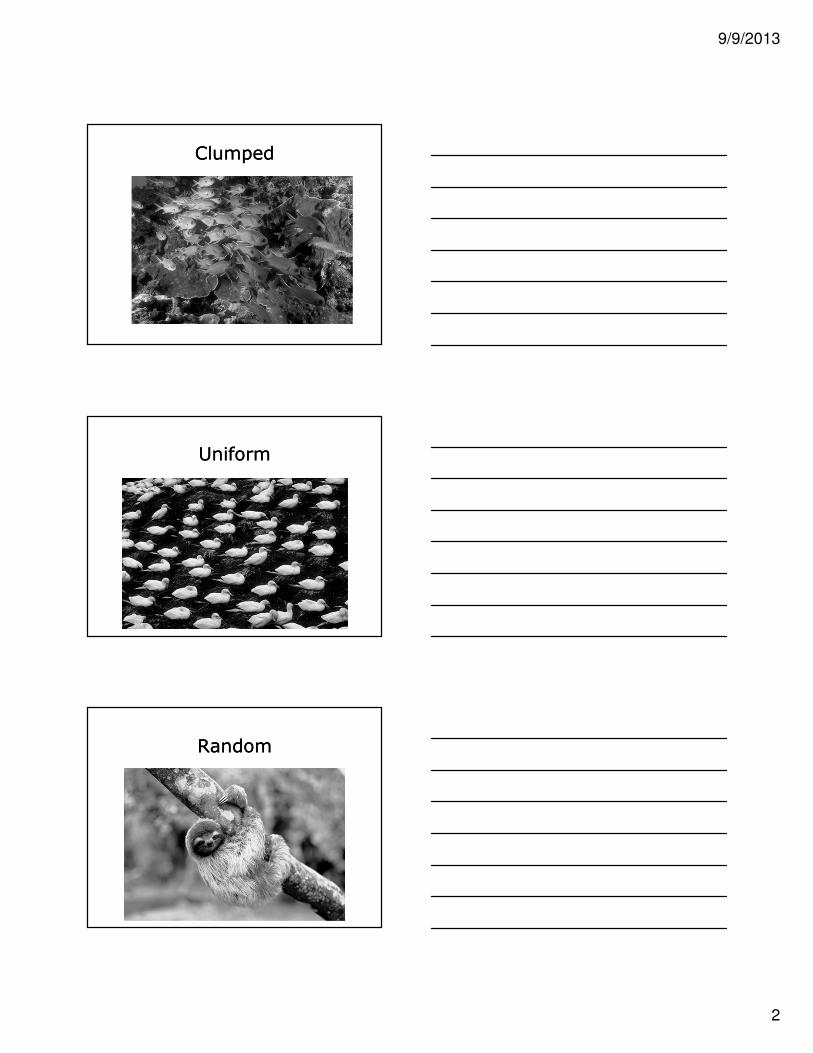
�Clumped
�Random
�Uniform
�Population density - the # of individuals per unit area
�Geographic dispersion refers to the area occupied by a population
�Clumped
�Random
�Uniform
9/9/2013
2
ClumpedClumped
UniformUniform
RandomRandom

9/9/2013
3
Population DynamicsPopulation Dynamics
�Populations are always changing due to:
�Birth rate—
�Death rate—
�Populations are always changing due to:
�Birth rate—
�Death rate—
Survivorship curvesSurvivorship curves
�A survivorship curve is a diagram showing the number of surviving members over time from a measured set of births.
�Help to describe the reproductive strategy of a species.
�A survivorship curve is a diagram showing the number of surviving members over time from a measured set of births.
�Help to describe the reproductive strategy of a species.
�Survivorship curves can be type I, II or III.
�Survivorship curves can be type I, II or III.
– Type I —low level of infant mortality and an older population
– common to large mammals and humans
– Type II —survivorship rate is equal at all stages of life
– common to birdsand reptiles
– Type III —very high birth rate, very high infant mortality
– common to invertebrates and plants

9/9/2013
4
Population Growth RatePopulation Growth Rate
�Growth rate refers to the speed of a population increasing or decreasing in size
�4 factors affect population size: the birth rate, the death rate (mortality rate), the # of individuals that enter a population (immigration) & the number that leave the population (emigration)
�Growth rate refers to the speed of a population increasing or decreasing in size
�4 factors affect population size: the birth rate, the death rate (mortality rate), the # of individuals that enter a population (immigration) & the number that leave the population (emigration)
Population GrowthPopulation Growth
�Immigration - movement of individuals into an area, can cause a population to grow
�Emigration - movement of individuals out of an area, can cause a population to decrease
�Immigration - movement of individuals into an area, can cause a population to grow
�Emigration - movement of individuals out of an area, can cause a population to decrease
Population GrowthPopulation Growth
�A population can grow when its birth rate is greater than its death rate
�If the birth rate = death rate, the population will stay the same
�If the death rate is greater than the birth rate, the population will decrease
�A population can grow when its birth rate is greater than its death rate
�If the birth rate = death rate, the population will stay the same
�If the death rate is greater than the birth rate, the population will decrease
9/9/2013
5
Exponential GrowthExponential Growth
�If a population has plenty of space & food, & is protected from predators & disease, then organisms in that population will multiply & it will increase in size
�Exponential growth - occurs when the individuals in a population reproduce at a constant rate
�If a population has plenty of space & food, & is protected from predators & disease, then organisms in that population will multiply & it will increase in size
�Exponential growth - occurs when the individuals in a population reproduce at a constant rate
Exponential GrowthExponential Growth
�Model in which pop. grows without limit at its maximum rate.
�This rate = biotic potential and symbol is r.
�r = (b-d) + (i-e)
�b = birth rate i = immigration (coming)
�d = death rate e = emigration
(leaving)
�Sometimes a population can be increased more by immigration than the birth rate.
�Model in which pop. grows without limit at its maximum rate.
�This rate = biotic potential and symbol is r.
�r = (b-d) + (i-e)
�b = birth rate i = immigration (coming)
�d = death rate e = emigration
(leaving)
�Sometimes a population can be increased more by immigration than the birth rate.
Exponential Cont.Exponential Cont.
�Exponential growth usually only occurs for a short period of time.�ex. algae colonizing a new pond
�organisms in a new habitat
�Eventually all populations will reach the carrying capacity (the number of individuals a place can support)�symbolized by k
�J-shaped curve
�Exponential growth usually only occurs for a short period of time.�ex. algae colonizing a new pond
�organisms in a new habitat
�Eventually all populations will reach the carrying capacity (the number of individuals a place can support)�symbolized by k
�J-shaped curve

9/9/2013
6
Logistic GrowthLogistic Growth
�Occurs when a population’s growth stops or slows down
�S-curve
�Usually occurs after a period of exponential growth.
�Occurs when a population’s growth stops or slows down
�S-curve
�Usually occurs after a period of exponential growth.
Logistic GrowthLogistic Growth
�Carrying capacity - the # of individuals in a population, that an environment can support
�Shown in a graph, when a population levels off
�Carrying capacity - the # of individuals in a population, that an environment can support
�Shown in a graph, when a population levels off

9/9/2013
7
Logistic GrowthLogistic Growth
�Model in which population grows and growth rate slows as it reaches carrying capacity.
�As N approaches K, the rate of pop. growth slows. (N= # of individuals present at any one time)
�Factors that create this are:
�increasing competition for limited resources
�buildup of waste
�increased predation
�S-shaped curve
Population Growth Cont.Population Growth Cont.
Phases of population growth:
1. Lag phase- a period of very slow growth in a population
2. Exponential phase- a period of rapid growth in a population
3. Stabilization phase- a period when no growth in a population occurs because it has reached carrying capacity.
Phases of population growth:
1. Lag phase- a period of very slow growth in a population
2. Exponential phase- a period of rapid growth in a population
3. Stabilization phase- a period when no growth in a population occurs because it has reached carrying capacity.
Applying Growth ModelsApplying Growth Models
�r - selected adaptation:�adaptations favor a high rate of increase, no limits as of yet.�ex.. dandelion, aphids, mice, cockroaches
�k - selected adaptations:�all favor reproduction near the carrying capacity of the species.�ex.. whooping cranes, whales, coconut palm
�What is the difference in offspring and rate of reproduction between the r & k selected species?

9/9/2013
8
Limits to GrowthLimits to Growth
�Limiting factor - a factor that causes population growth to decrease
�Limiting factor - a factor that causes population growth to decrease
Limits to GrowthLimits to Growth
�Density-dependent factor - a limiting factor that depends on population size
�EXAMPLES:�Competition
�Predation
�Parasitism
�Disease
�Density-dependent factor - a limiting factor that depends on population size
�EXAMPLES:�Competition
�Predation
�Parasitism
�Disease
Limits to GrowthLimits to Growth
�Competition:
�When populations become crowded, organisms compete with each other for food, water, space, sunlight, etc.
�Competition will cause 2 different species to evolve over time, to occupy separate niches, therefore, less competition
�Competition:
�When populations become crowded, organisms compete with each other for food, water, space, sunlight, etc.
�Competition will cause 2 different species to evolve over time, to occupy separate niches, therefore, less competition
9/9/2013
9
Limits to GrowthLimits to Growth�Predation:
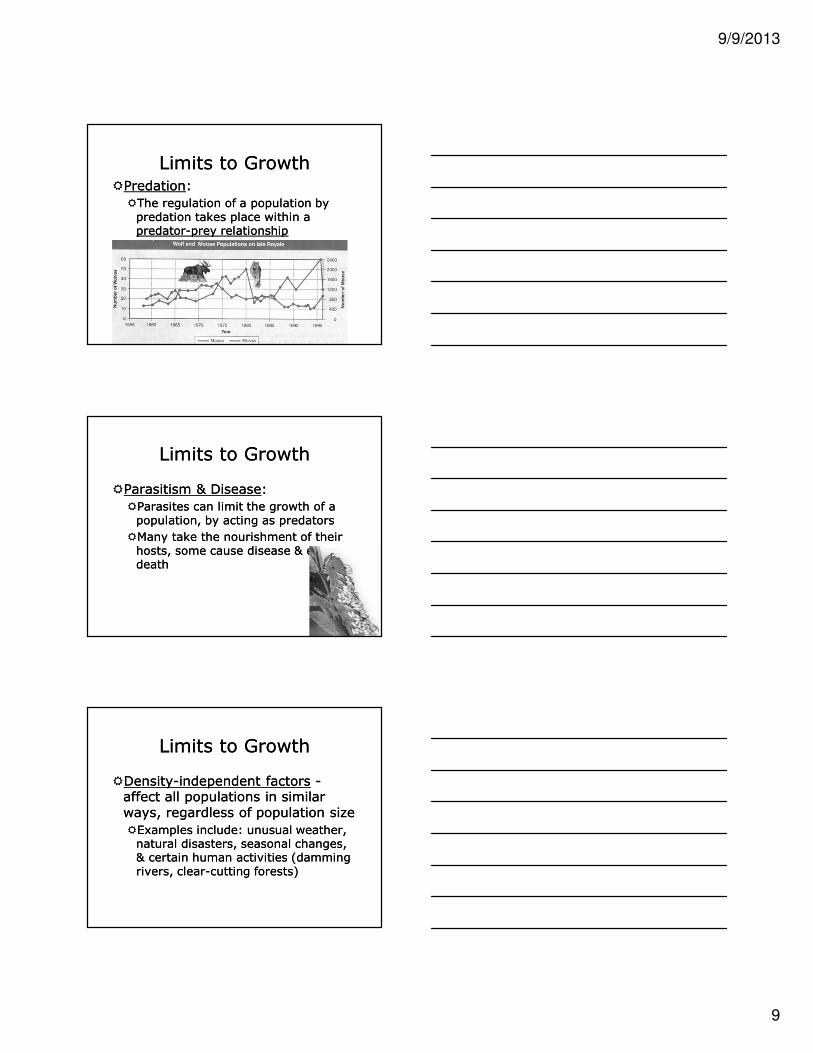
�The regulation of a population by predation takes place within a predator-prey relationship
�Predation:
�The regulation of a population by predation takes place within a predator-prey relationship
Limits to GrowthLimits to Growth
�Parasitism & Disease:
�Parasites can limit the growth of a population, by acting as predators
�Many take the nourishment of their hosts, some cause disease & even death
�Parasitism & Disease:
�Parasites can limit the growth of a population, by acting as predators
�Many take the nourishment of their hosts, some cause disease & even death
Limits to GrowthLimits to Growth
�Density-independent factors -affect all populations in similar ways, regardless of population size
�Examples include: unusual weather, natural disasters, seasonal changes, & certain human activities (damming rivers, clear-cutting forests)
�Density-independent factors -affect all populations in similar ways, regardless of population size
�Examples include: unusual weather, natural disasters, seasonal changes, & certain human activities (damming rivers, clear-cutting forests)

9/9/2013
10
Influence of Population
DensityDensity-Dependent Effects- only become limiting factors
when the population density (# of organisms in a certain area) reaches a certain level.
3 density-dependent factors:
1.Competition - when populations are crowded, there is a
struggle for food
2.Predation - controls a population size
predator-prey relationship- most well-known population
control
Ex.. wolves and moose, as moose population fall, soon after
wolf population fall, etc..
3.Parasitism and Disease - take nourishment from the host and
weaken it or kill it.
Influence of Population
Density� Density-Independent Effects- affect all populations in a
similar way regardless of population size.
Some types of density-independent factors are:
1. Unusual weather
2. Natural disaster
3. Seasonal cycles
4. Certain human activities- damage to rivers or
lakes, clear cut forests
Limits to GrowthLimits to Growth
9/9/2013
11
Human Population GrowthHuman Population Growth
�In the US & other developed countries, the current growth rate is very low
�In some developing countries, the population growth rate is nearly 3 people per second
�Because of this, the human population is on its way to reaching 9 billion people within your lifetime
�In the US & other developed countries, the current growth rate is very low
�In some developing countries, the population growth rate is nearly 3 people per second
�Because of this, the human population is on its way to reaching 9 billion people within your lifetime
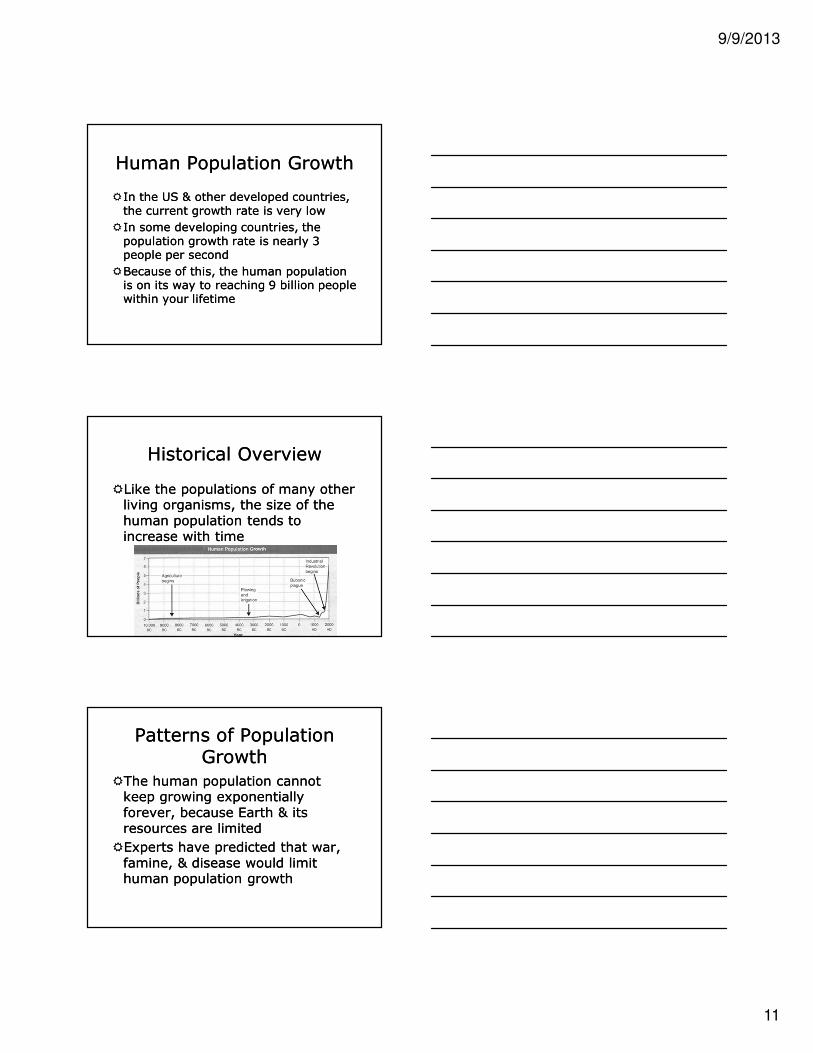
Historical OverviewHistorical Overview
�Like the populations of many other living organisms, the size of the human population tends to increase with time
�Like the populations of many other living organisms, the size of the human population tends to increase with time
Patterns of Population Growth
Patterns of Population Growth
�The human population cannot keep growing exponentially forever, because Earth & its resources are limited
�Experts have predicted that war, famine, & disease would limit human population growth
�The human population cannot keep growing exponentially forever, because Earth & its resources are limited
�Experts have predicted that war, famine, & disease would limit human population growth

9/9/2013
12
Population DemographyPopulation Demography
�Demography- the statistical study of populations to make predictions.
�Age structure:�cohort- group of individuals the same age.
�fecundity- characteristic birth rate of a cohort
�mortality- characteristic death rate of a cohort
�A population’s growth depends directly on fecundity and mortality.
�Demography- the statistical study of populations to make predictions.
�Age structure:�cohort- group of individuals the same age.
�fecundity- characteristic birth rate of a cohort
�mortality- characteristic death rate of a cohort
�A population’s growth depends directly on fecundity and mortality.
Patterns of Population Growth
Patterns of Population Growth
�Population growth depends on how many people of different ages make up a given population
�Age-structure diagrams -population profiles that demographers can use to predict future growth
�Population growth depends on how many people of different ages make up a given population
�Age-structure diagrams -population profiles that demographers can use to predict future growth
Patterns of Population Growth
Patterns of Population Growth

9/9/2013
13
An Uncertain FutureAn Uncertain Future
� The rapidly growing human population is the biosphere’s greatest challenge!
�250 new babies a day
�1 million people every 3 days
�Of the new billion people in the 1990’s, 90% will live in developing countries.
� 85% of the worlds wealth in developed countries & 15% in developing countries
� 23% of the world’s pop. lives in developed countries while 77% live in developing countries.
Future Population GrowthFuture Population Growth
�Demographers predict that the human population will be growing more slowly over the next 50 years
�Demographers predict that the human population will be growing more slowly over the next 50 years