unit 1- slides
DESCRIPTION
TRANSCRIPT

Psychology 3800, Lab 002
Unit 1: Introduction and t-Test

In Today’s Lab…
• intro to me and to the lab
• accessing SPSS
• writing good reports in Psych 3800
• t-test (with example)
• this week’s assignment

Your TA: Livia
E-mail: [email protected] Office: SSC 9336 (ninth floor)
Office hours: Tuesdays, 9:30AM - 11:30AM SSC 9336
Lab hours: Thursdays, 2:30PM – 4:30PM SSC 3133

Lab Resources Sakai/OWL
https://owl.uwo.ca/portal

Lab Resources
https://owl.uwo.ca/portal
Sakai/OWL: Accessing Example Data
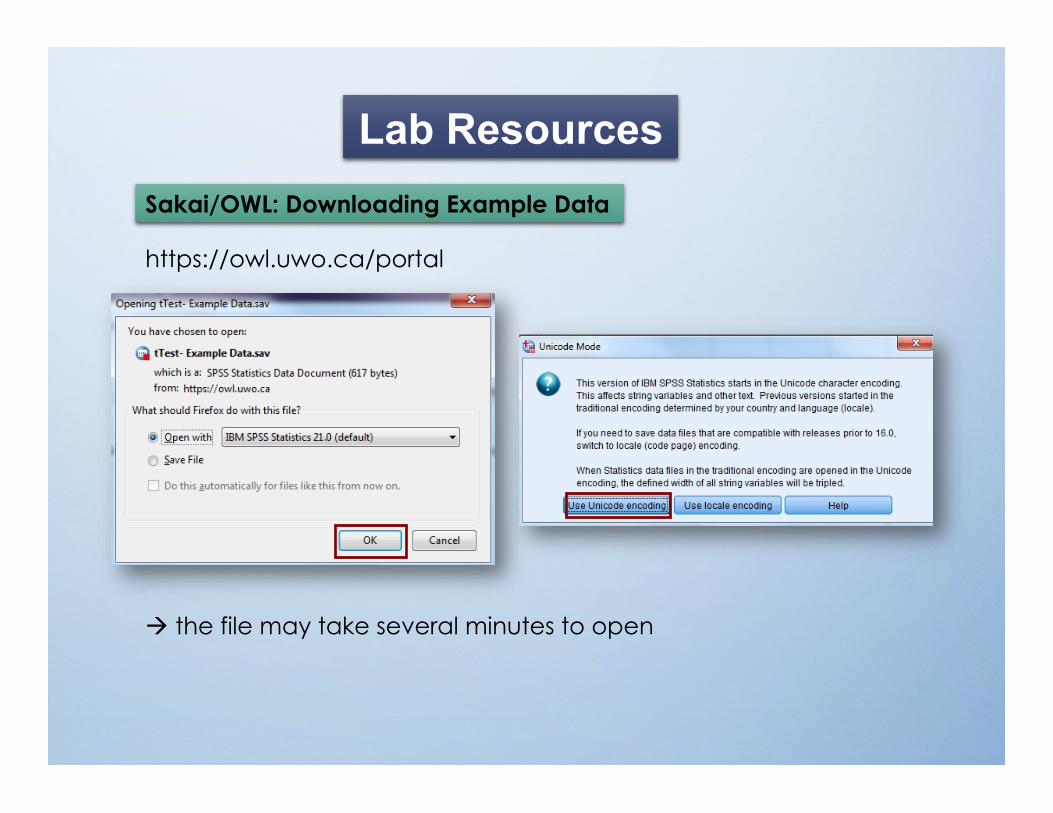
Lab Resources
https://owl.uwo.ca/portal
the file may take several minutes to open
Sakai/OWL: Downloading Example Data

Lab Resources Lab Blog
http://uwo3800g.tumblr.com/

How Labs Work
• meet every Thursday at 9:30AM
• I review/elaborate on the week’s topic, as introduced in lecture
• we walk through an example analysis in SPSS (and/or any other program) using example data
• you download the week’s assignment from Sakai and have the opportunity to work through it in lab
• you write up a report based on your results and submit your work the following week

Submitting Assignments assignments are due at the beginning of lab the following week
(no more than 15 minutes late or else a grade of 0 must be given)
Submitting at start of lab: • drop off your assignment in my assignment folder • make sure all pages are attached • double-sided printing is fine
Submitting in person before lab deadline: • drop off assignment with me in SSC 9336 • if I am out of the office, slide it under my door and send me an e-mail ([email protected]) telling me it’s there
Submitting by e-mail: • if you are running late/printer is dead/other emergency, submissions can be made via e-mail ([email protected]) • make sure to include assignment and all outputs/calculations
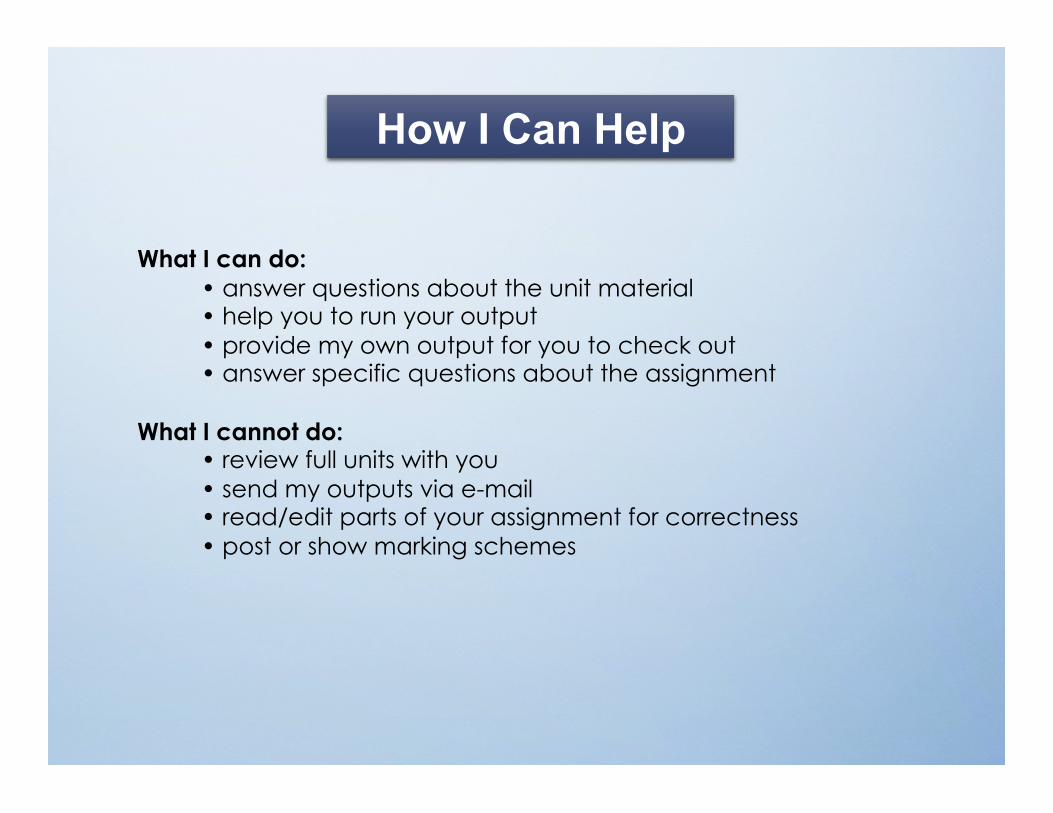
How I Can Help
What I can do: • answer questions about the unit material • help you to run your output • provide my own output for you to check out • answer specific questions about the assignment
What I cannot do: • review full units with you • send my outputs via e-mail • read/edit parts of your assignment for correctness • post or show marking schemes
A Note on Plagiarism
• group-work is okay for running analyses
• assignments are to be written individually
• output must be created by you (syntax tells me who generated the submitted output)
• assignments are compared across lab sections, so copying across sections = bad as well (and won’t help you in the long run)


Social Science Network
Start All Programs IBM SPSS Statistics IBM SPSS Statistics 21

• locations: HSB, NCB, NSC, SH, SSC
• weekdays, 9:00 AM - 10:00 PM (but check online schedule!)
• bring your print cards
General Student Computing Lab
http://www.uwo.ca/its/genlabs/

MyVLab
http://myvlab.uwo.ca
• runs a UWO network desktop on your home computer (Mac or PC)
• provides access to SPSS and other software (no MONTE, POSTHOC)
• link above provides instructions for setting up MyVLab on your computer (detailed instructions for Mac and PC)

Remote Access of Social Science Network
http://sscnet.uwo.ca
• runs the SSC network on your home computer (Mac or PC)
• provides access to SPSS, MONTE, POSTHOC, and other software
• link above provides instructions for accessing the network on your computer (detailed instructions for Mac and PC)
Note: this option is slightly dated, but still working

* the little things matter*
Writing Your Reports
• assignments should be written as the results section of a full APA paper unless otherwise specified
if you are not writing a results section, still adhere to APA formatting as much as possible
• it is assumed that you know the basics of APA formatting from Psych 2800 (and other courses)

Writing Your Reports
• check out formatting in slides for guidelines
• attend labs regularly for hints and tips
• review APA style (APA 6 manual and online resources)
• when in doubt, ask me

Formatting Your Reports • header: your name in top, right-hand corner
• double-spaced and left-justified
• one-inch (2.54 cm) margins for sides, top, and bottom
• 12-point, serif-type font throughout (must be typed)
• two pages of writing max (can be less, but I will not read more than two pages)
• append your labeled output to your report (worth marks)
• any hand calculations should be attached as the last sheet (handwritten)
Note: be careful of default settings on your current version of Word (extra spacing, uneven margins, etc.)


Type 1: Single-Sample t-Test
1) collect data on a single variable from one group 2) calculate the average (mean) score for that group 3) compare that group mean to a population average
Hypotheses (where x = some population value)
HO: μ = x HA: μ ≠ x or HO: μ ≤ x HA: μ > x or HO: μ ≥ x HA: μ < x
Example
Chihuahuas in London have a reputation of being exceptionally yappy, but how does it compare to the national average? Are Chihuahuas from London yappier than the national average of 6.0 (on a 7-point Likert scale where greater values indicate greater yappiness) ?
Null: HO: μ ≤ 6.0 Alternative: HA: μ > 6.0

Type 2: Independent Samples t-Test
1) collect data on a single variable from two separate groups (each group is composed of completely different subjects) 2) calculate the average (mean) score for each group 3) compare the two groups means
Hypotheses
HO: μ1 = μ2 HA: μ1 ≠ μ2 or HO: μ1 ≤ μ2 HA: μ1 > μ2 or HO: μ1 ≥ μ2 HA: μ1 < μ2
Example
Does the average level of yappiness seen among Chihuahuas differ from that seen in Great Danes?
Null: HO: μChihuahua = μDane Alternative: HA: μChihuahua ≠ μDane

Type 3: Paired Samples t-Test
1) collect data on a single variable from the same group twice (repeated measures) or from two matched groups (matched pair) 2) calculate the average (mean) score for each group 3) compare the two groups means
Hypotheses
HO: μ1 = μ2 HA: μ1 ≠ μ2 or HO: μ1 ≤ μ2 HA: μ1 > μ2 or HO: μ1 ≥ μ2 HA: μ1 < μ2
Example
Do Chihuahuas exhibit less yappiness at home than they do in the park?
Null: HO: μHome ≥μPark Alternative: HA: μHome < μPark

One-Tailed vs. Two-Tailed Tests
One-Tailed Test interested in whether differences between groups/values occur in either one direction or the other, but not both e.g., HA: μ > 6.0; HA: μHome < μPark
Two-Tailed Test interested in whether any differences between groups/values exist, regardless of direction e.g., HA: μChihuahua ≠ μDane
• it is up to you to decide which type of test should be carried out based on the question/hypotheses of interest
• SPSS gives p-values for two-tailed tests to turn it into a one-tailed value, divide the p-value in half

Levene’s Test: Homogeneity of Variance
* pertains to the independent samples t-test only
• assesses assumption of the t-test that the two groups being compared have approximately equal variances (equality of variances)
• this is one of the few tests that you DON’T want to be significant not significant = variances do not differ significantly = variances are approximately equal

Levene’s Test: Homogeneity of Variance
• if Levene’s test is significant (i.e., p < .05), the variances of your two groups are significantly different from each other
• significantly different variances create statistical problems (we’ll see evidence of this next week)
difficult to compare populations in multiple ways
• if significant Levene’s test observed, we must adjust our statistics and interpretations
report statistics from “equal variances not assumed” row indicate that results should be interpreted with caution

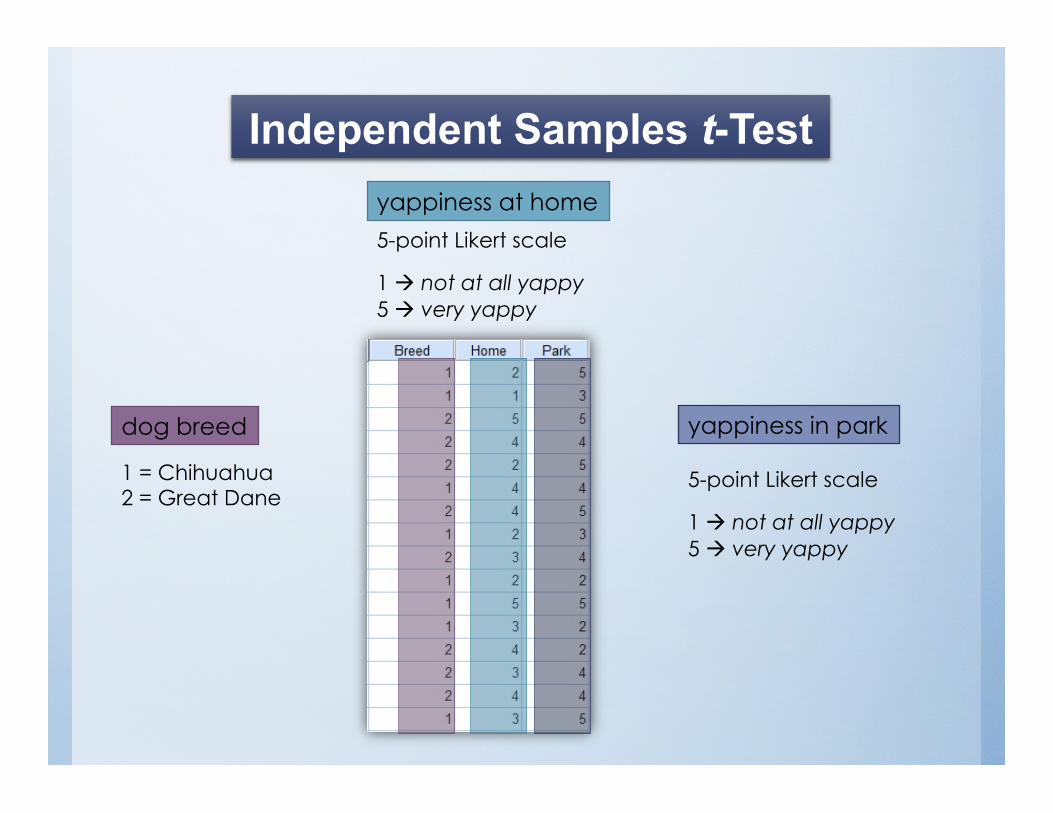
Independent Samples t-Test
dog breed
1 = Chihuahua 2 = Great Dane
yappiness at home
5-point Likert scale
1 not at all yappy 5 very yappy
yappiness in park
5-point Likert scale
1 not at all yappy 5 very yappy

Independent Samples t-Test Viewing Your Data
Data View is used when typing in data or when viewing raw data scores that make up your dataset.
Variable View is used when specifying the characteristics of your variables (i.e., columns in data file): name, number of decimals, etc. note: spaces are not allowed when entering variable names; use underscores instead

Independent Samples t-Test Does the average level of yappiness seen among Chihuahuas differ
from that seen in Great Danes when they are at home?
Analyze Compare Means Independent-Samples T Test…

Independent Samples t-Test
measured/dependent variable
grouping/independent variable (contains coding for participant groups)
click to define study groups using coding

Independent Samples t-Test
specify that the first group is coded as “1” (Chihuahuas)
specify that the second group is coded as “2” (Great Danes)
… click “Continue” to return to the main menu
click “OK” to obtain output of the test in a separate window

Independent Samples t-Test Output: Descriptive Statistics
Descriptive statistics for the level of yappiness reported in the home for Chihuahuas (1) versus Great Danes (2):
Chihuahuas: M = 2.75, SE = 0.45 Great Danes: M = 3.63, SE = 0.32

Independent Samples t-Test Output: Levene’s Test
• Levene’s test output is non-significant (p = .374) and so our group variances do not differ significantly (equal variances assumed)
• report Levene statistics (F, Sig.) as highlighted (numbers will only appear in the “equal variances assumed” row for this test)
• report degrees of freedom (df) according to whether the test is significant (equal variances not assumed) or not (equal variances assumed)
Levene F(1, 14) = 0.85, ns

Independent Samples t-Test Output: t-Test
read row in accordance with Levene’s test results:
• report same degrees of freedom as for the Levene’s F-test
t(14) = -1.57, ns
• conclude that Chihuahuas and Great Danes do not differ significantly in their level of yappiness when at home

Paired Samples t-Test Do dogs differ significantly in their level of yappiness when at home versus
when they are in the park?
Analyze Compare Means Paired-Samples T Test…

Paired Samples t-Test
insert the two measurement time points (Home, Park)
… click “OK” to obtain output in separate window

Paired Samples t-Test Output: Descriptive Statistics
Descriptive statistics for the level of yappiness reported in the home and in the park for all dogs:
Home: M = 3.19, SE = 0.29 Park: M = 3.88, SE = 0.29

Paired Samples t-Test Output: t-Test
• conclude that dogs do not differ significantly in their level of yappiness when at home versus when they are in the park
t(15) = -2.03, ns

Saving Your Output
From the output window: File Save

Saving Your Output
select your “U” drive as the location where the file will be saved
enter a file name of choice and then click “Save”

Exporting Your Output
this window will pop up when you click on the export button

Exporting Your Output
open up the drop-down menu under “Type” and select format of choice (recommended: PDF or Excel)
in the “File Name” panel, click on the “Browse” button

Exporting Your Output
select your “U” drive as the location where the file will be saved
enter a file name of choice and then click “Save”

Exporting Your Output
click “OK” when ready to export
…exporting may take a few seconds (or minutes)

Finding Your Output
Start My Computer
double-click the U-drive icon to access all exported or saved files on
your personal drive


This Week’s Assignment
• type the assignment data into a blank SPSS document (to get a blank document in SPSS: File New Data)
• run all necessary analyses before doing so, close the output file that was created when running the example data (SPSS does not create new output files for new datasets; will lump everything together in one file)
• write up your 2-page report using APA style
• include all output with the submitted assignment

Order of Information in Results Sections for the First Analysis
1) short description of study design and variables purpose of study design of study (IV, DV) coding of measured variable
2) type of test being carried out
4) Levene’s F-test result and interpretation, if applicable
5) descriptive statistics (mean, standard error)
6) inferential statistics (e.g., t-obtained with df)
7) restate the result in relation to the hypothesis (single sentence without reference to statistics)
t-Test: Elements of the Results Section
can be lumped together

A researcher was interested in determining the effectiveness of different pain
medications for decreasing back pain. One group of participants received Drug A and another
group received Drug B. Both groups rated the amount of back pain they were experiencing 60
minutes after taking the drug from 1 (no pain at all) to 7 (extreme pain). An independent
samples t-test was used to test the hypothesis that Drug A would decrease pain more than
would Drug B (HO: µDrugA ≥ µDrugB; HA: µDrugA < µDrugB). Levene’s test of homogeneity of
variance was not significant, so equal variances were assumed, Levene F(1, 38) = 1.22, ns. It
was found that the average pain felt by participants who took Drug A (M = 4.56, SE = 0.45)
was less than the pain felt by participants who took Drug B (M = 6.02, SE = 0.67), t (38) =
4.62, p < .001. Therefore, the researcher’s hypothesis that Drug A is best for treating back pain
was correct.
t-Test: Sample Results Section

t-Test: Remaining Assignment Questions
Question #1 -state null ad alternative hypotheses in statistical terms (see my slides) -point-form is acceptable here
Questions #2-4 -answer all questions in full sentences -provide relevant statistics where appropriate (use your own judgment) -full APA-style results sections are not needed for these questions

Things to Watch Out For
• if a result is significant (i.e., p < .05), follow with the appropriate significance level (three options: p < .05, p < .01, p < .001)
• report the smallest p value possible if significance value is .03 t(19) = 5.37, p < .05 if significance value is .009 t(19) = 5.37, p < .01 if significance value is .0007 t(19) = 5.37, p < .001
• if a result is not significant (i.e., p > .05), follow with ns Example: t(19) = 3.56, ns
Significance (p) Values

Things to Watch Out For Reporting Effects Accurately
• when reporting an effect, state it in reference to the study variables and include descriptive statistics
Bad: There was a significant effect, t(42) = 7.20, p < .05.
Good: Subjects in the depressed group (M = 7.20, SE = 0.20) drank significantly more beer per hour than did subjects in the non-depressed group (M = 6.60, SE = 0.20), t(42) = 7.20, p < .001.
• report standard error (sample size accounted for) rather than standard deviation

Things to Watch Out For The Little Things
• statistic labels are italicized (e.g., p, t, F, M, SE)
• insert spaces in accordance with APA style e.g., t(42) = 7.20, p < .001
• use correct number of decimals consistently (2 or 3 decimal places) with correct rounding
• insert a zero (0) before a decimal only if the value could rationally be greater than 1.00
e.g., p < .05; SE = 0.34
• use good spelling, grammar, punctuation (marks for writing style)

• write up the t-test assignment (due Thursday, January 30 at 2:30PM)
• check out the lab blog and Sakai/OWL to ensure that you have proper access
• read over the material on Monte Carlo in preparation for the lab
For Next Week…