union station – queens quay transit link study · city of toronto . union station – queens quay...
TRANSCRIPT

City of Toronto
Union Station – Queens Quay Transit Link Study
Initial Business Case Final | April 1, 2019
This report takes into account the particular instructions and requirements of our client.
It is not intended for and should not be relied upon by any third party and no responsibility is undertaken to any third party. Job number 265754-00
Arup Canada Inc. 2 Bloor Street East Suite 2400 Toronto ON M4W 1A8 Canada www.arup.com

| Final | April 1, 2019 | Arup Canada Inc. UQQL INITIAL BUSINESS CASE REPORT FINAL.DOCX
Document Verification
Job title Union Station – Queens Quay Transit Link Study Job number
265754-00 Document title Initial Business Case File reference
Document ref Revision Date Filename UQQL Initial Business Case Report v1.docx Draft 1 Mar 5,
2019 Description First draft
Prepared by Checked by Approved by
Name Stuart Hamre Felipe Camargo Marc-Paul Gauthier
Signature Draft 2 Mar 15,
2019 Filename UQQL Initial Business Case Report v2.docx Description Second draft
Prepared by Checked by Approved by
Name Stuart Hamre Felipe Camargo Marc-Paul Gauthier
Signature Final Apr 1,
2019 Filename UQQL Initial Business Case Report v3.docx Description
Prepared by Checked by Approved by
Name Marc-Paul Gauthier Daniel Haufschild Daniel Haufschild
Signature Filename
Description
Prepared by Checked by Approved by
Name
Signature Issue Document Verification with Document

City of Toronto Union Station – Queens Quay Transit Link Study Initial Business Case
| Final | April 1, 2019 | Arup Canada Inc. UQQL INITIAL BUSINESS CASE REPORT FINAL.DOCX
Contents Page
1 Executive Summary 1
2 The Case for Change 5
2.1 Problem and opportunity 5 2.2 The Proposed Solution 11
3 Investment Options 12
3.1 Option Development 12 3.2 Short-listed options 12 3.3 Option Definition 13
4 Strategic Case 14
4.1 2041 RTP 14 4.2 City of Toronto RTEF Criteria 17 4.3 Strategic Evaluation Summary 17
5 Economic Case 19
5.1 Methodology, Data Sources and Assumptions 19 5.2 Costs 23 5.3 User Impacts 24 5.4 External Impacts 26 5.5 Wider Economic Impacts 27 5.6 Conclusions 27
6 Financial Case 30
6.1 Financial case analysis 30 6.2 Financial impact 31 6.3 Financial Analysis Summary 33
7 Deliverability and Operations Case 35
7.1 Overview 35 7.2 Project Delivery 35 7.3 Procurement 37 7.4 Operations and Maintenance 39 7.5 Risk management 40 7.6 Conclusion 40

City of Toronto Union Station – Queens Quay Transit Link Study Initial Business Case
| Final | April 1, 2019 | Arup Canada Inc. UQQL INITIAL BUSINESS CASE REPORT FINAL.DOCX
Table 1: Economic analysis summary and BCR 3 Table 2: Financial components (to nearest $10 million) 3 Table 3: Key considerations during options screening process 13 Table 4: Evaluation of options against 2041 RTP Goals 15 Table 5: Evaluation of options against 2041 RTP Goals (Con't) 16 Table 6: Evaluation summary 18 Table 7: Generalized journey time factors 24 Table 8: Appraisal summary (1,000s) 27 Table 9: Financial case assumptions 30 Table 10: Operating Costs (rounded to nearest thousand) 32 Table 11: Incremental revenue (nearest $10 million) 33 Table 12: Financial impact summary 33 Figure 1: Waterfront Transit Network Plan, City of Toronto 1 Figure 2: Proposed developments in the Waterfront Transit Reset study area
7 Figure 3: Existing and future transit demand in the Bay Street corridor 9 Figure 4: Existing (solid) and future (dashed) waterfront LRT lines 10 Figure 5: Waterfront Transit Network Plan 14 Figure 6: Data sources and process 22 Figure 7: Waterfront Transit Network improvements 31 Figure 8: Existing Waterfront Transit Network 3 Appendices Appendix A: Strategic Case Materials Appendix B: Economic Case Materials Appendix C: Financial Case Materials

City of Toronto Union Station – Queens Quay Transit Link Study Initial Business Case
| Final | April 1, 2019 | Arup Canada Inc.
Page 1
1 Executive Summary The Union Station – Queens Quay Transit Link Study (the Study) considered two technologies for enhancing the connection between Union Station and Queens Quay: an expanded streetcar loop at Union Station; or, an Automated People Mover (APM) using the existing tunnel replacing the existing streetcar.
This Initial Business Case (IBC) accompanies the Study and provides a strategic, economic, financial and operations appraisal of the two technology options. While the Study focusses on the Link itself, this IBC considers the benefits and costs associated with the full Waterfront Transit Network (WTN) which the Link serves.
Context
The expansion of the Union Station – Queens Quay Transit Link (USQQL) was originally contemplated as part of the approved East Bayfront Transit EA. At the time, streetcar loop expansion was configured to accommodate four independent streetcar stops which was sufficient to accommodate the East Bayfront plus the wider waterfront and the Bremner extension.
The USQQL was studied further as part of the Waterfront Transit Reset study, led by the City of Toronto, which refined plans for a Waterfront West and Waterfront East LRT; both identified as ‘in-development’ projects in the Regional Transportation Plan (RTP) by Metrolinx. In January 2018, Council directed staff to review more cost-effective options for the USQQL, including an funicular (or APM).
As identified during the Waterfront Transit Reset, the USQQL is a critical piece of the overall WTN which will enable the full development of LRT service to the East Bayfront and beyond. These network enhancements will help to support the rapid pace of development along the waterfront.
Figure 1: Waterfront Transit Network Plan, City of Toronto
The evaluation of the Union Station – Queens Quay Transit Link Study identified that an expanded streetcar loop, as originally contemplated in the EA, is the preferred solution for the USQQL.
City of Toronto Union Station – Queens Quay Transit Link Study Initial Business Case
| Final | April 1, 2019 | Arup Canada Inc.
Page 2
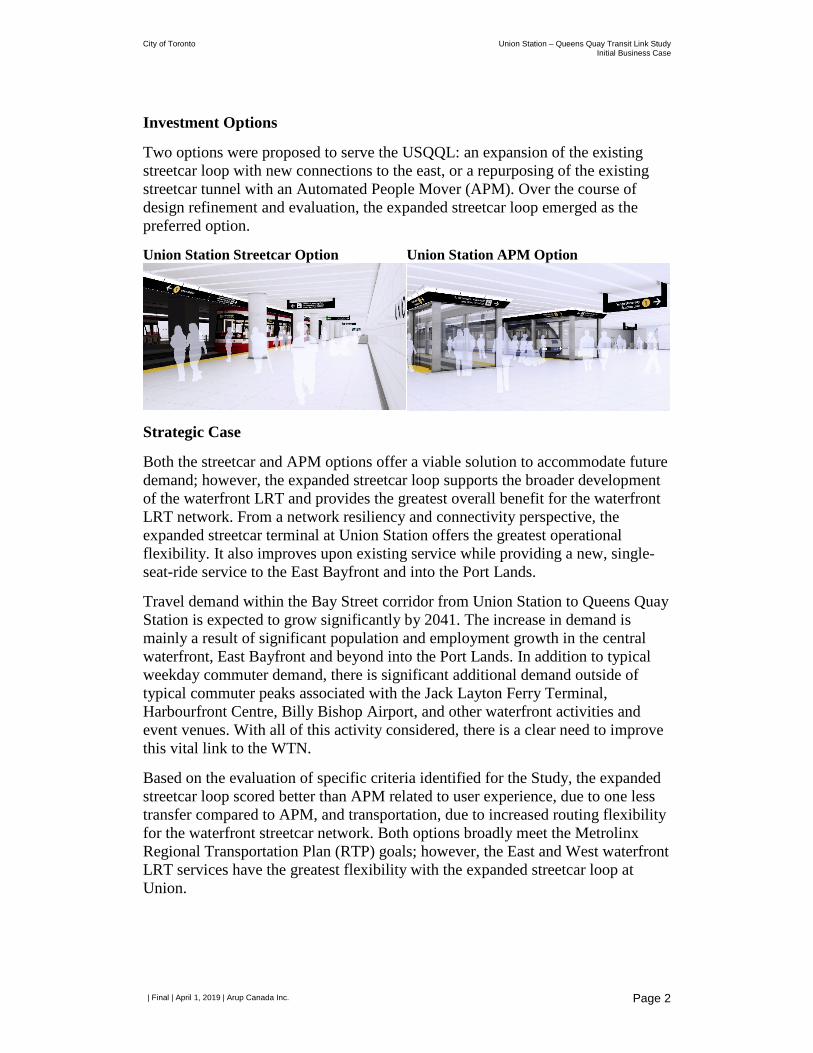
Investment Options
Two options were proposed to serve the USQQL: an expansion of the existing streetcar loop with new connections to the east, or a repurposing of the existing streetcar tunnel with an Automated People Mover (APM). Over the course of design refinement and evaluation, the expanded streetcar loop emerged as the preferred option.
Union Station Streetcar Option Union Station APM Option
Strategic Case
Both the streetcar and APM options offer a viable solution to accommodate future demand; however, the expanded streetcar loop supports the broader development of the waterfront LRT and provides the greatest overall benefit for the waterfront LRT network. From a network resiliency and connectivity perspective, the expanded streetcar terminal at Union Station offers the greatest operational flexibility. It also improves upon existing service while providing a new, single-seat-ride service to the East Bayfront and into the Port Lands.
Travel demand within the Bay Street corridor from Union Station to Queens Quay Station is expected to grow significantly by 2041. The increase in demand is mainly a result of significant population and employment growth in the central waterfront, East Bayfront and beyond into the Port Lands. In addition to typical weekday commuter demand, there is significant additional demand outside of typical commuter peaks associated with the Jack Layton Ferry Terminal, Harbourfront Centre, Billy Bishop Airport, and other waterfront activities and event venues. With all of this activity considered, there is a clear need to improve this vital link to the WTN.
Based on the evaluation of specific criteria identified for the Study, the expanded streetcar loop scored better than APM related to user experience, due to one less transfer compared to APM, and transportation, due to increased routing flexibility for the waterfront streetcar network. Both options broadly meet the Metrolinx Regional Transportation Plan (RTP) goals; however, the East and West waterfront LRT services have the greatest flexibility with the expanded streetcar loop at Union.

City of Toronto Union Station – Queens Quay Transit Link Study Initial Business Case
| Final | April 1, 2019 | Arup Canada Inc.
Page 3
Economic Case
The economic analysis indicates additional benefits for APM when compared to the streetcar option but likely underrepresents the quality of transfer with the streetcar option, resulting in an underestimation of streetcar ridership. This is due to limitations to modelling parameters at Union Station.
Table 1 presents a summary of the economic analysis and resulting benefits, costs and Benefit Cost Ratios (BCRs). Even though the resulting BCRs of 0.41 and 0.55 are relatively close, the gap would be even smaller if the streetcar benefits were accurately captured.
Table 1: Economic analysis summary and BCR Item Streetcar APM Total Present Value of Benefits (PVB) $990,000,000 $1,340,000,000 Total Present Value of Costs (PVC) $2,420,000,000 $2,440,000,000 Total Net Present Value (NPV) -$1,520,000,000 -$1,100,000,000 Expanded Benefits Cost Ratio (BCR) 0.41 0.55
Financial Case
The financial case prepared for this IBC includes capital costs, operating and maintenance (O&M) costs and incremental revenue all in present value (PV). Costs are for the full waterfront streetcar network from Park Lawn to Leslie, including the Union Station – Queens Quay Transit Link and operational improvement from Park Lawn to Long Branch.
The economic case is also based on the Metrolinx method which requires different assumptions resulting in costs slightly different than the economic case. The difference is primarily due to the discount rates. The economic case uses a ‘social discount rate’ of 3.5% compared to financial case which uses a ‘financial discount rate’ of 5.5%. The resulting costs are indicated in Table 2.
Table 2: Financial components (to nearest $10 million) Item Streetcar APM Total Costs (PV) Capital Costs (PV) 60-year O&M Costs (PV)
$2,150,000,000 $1,760,000,000
$390,000,000
$2,160,000,000 $1,760,000,000
$400,000,000 60-year Total Incremental Revenue (PV) $80,000,000 $120,000,000 Total Costs (PV) – Revenue (PV) $2,070,000,000 $2,040,000,000

City of Toronto Union Station – Queens Quay Transit Link Study Initial Business Case
| Final | April 1, 2019 | Arup Canada Inc.
Page 4
Deliverability and operations
Both projects are feasible and would require a coordinated project delivery team between the City, TTC and Waterfront Toronto. The TTC indicated a reluctance to operate the APM; however, governance was not finalized as part of the Study.
Design-bid-build (DBB) is likely the simplest procurement method. An alternative financing and procurement (AFP) model could be considered; however, given the interconnectedness of the network, this would be a complex arrangement that would require further detailed analysis.
There are additional risks associated with building the expanded streetcar loop below the active GO rail viaduct. These risks are understood and accepted given experience with existing work underway at Union Station which is an example of similar construction efforts in highly constrained and complex environments. APM has a lower construction risk profile with a shorter construction period.
Conclusions
• Context. The Waterfront Transit Network is in the approved plans from the City and Metrolinx; The Link is a vital enabling component of those plans.
• Strategic Case. Both technologies can support increased demand due to development and special uses such as Harbourfront centre, Exhibition Place, Billy Bishop Airport, etc. The expanded streetcar loop is preferred because it supports the wider transit network and with improved service flexibility.
• Economic Case. Both technology options produce similar BCRs which are similar to other surface transit projects. The streetcar loop option is artificially low due to limitations to modelling parameters at Union Station.
• Financial Case. The financial case shows that the two technology options are essentially the same cost. The APM has somewhat higher operating costs due to reduced streetcar routing flexibility plus the APM operating costs.
• Deliverability and operations case. Both projects are feasible and would require a coordinated project delivery team between the City, TTC and Waterfront Toronto. Design-bid-build is likely the most straight-forward procurement method. Construction risks are higher for the streetcar loop but the risks are understood from recent works at Union Station.
Next Steps
Next, following endorsement by Council and securing funding, additional investigation and design refinement will be required. Alongside these project stages, the business case should be updated in sequence including: Preliminary Design Business Case; Full Business Case; and Post In-Service Business Case. The function and purpose of each of these subsequent stages of business case development is defined on the Metrolinx business case guidance website.

City of Toronto Union Station – Queens Quay Transit Link Study Initial Business Case
| Final | April 1, 2019 | Arup Canada Inc.
Page 5
2 The Case for Change The waterfront sees millions of annual visitors at its many venues and natural amenities and is increasingly becoming a mixed-use environment with new residences and workplaces. In the coming years, thousands of new residents will call the waterfront home, and many more will travel to and from the area on a daily basis to work and play. Supporting existing residents, businesses, tourism, and future growth will depend on the success of the WTN.
Overall, the Union Station – Queens Quay Transit Link represents a project of key strategic importance to the future buildout of the waterfront. This section is broken into:
• The problem and/or opportunity – including a problem and/or opportunity statement and key drivers.
• The proposed solution – including value proposition, solution and relevant experience.
For the connection between Union Station and Queens Quay, Council directed a focused comparative study of a repurposed tunnel with APM transit technology and streetcar loop expansion options.
2.1 Problem and opportunity
2.1.1 The Problem Statement There is significant growth in the waterfront and the ability for the area to grow relies on the implementation of reliable, higher-order transit that can serve residential and employment lands. Developments on the waterfront, planned and proposed to come on line in the coming years, and growth in tourism and special events at key waterfront destinations, will put pressure on the existing transit network. If not expanded, current transit service will not adequately support the growth that is foreseen along the waterfront.
The current transit network is insufficient to accommodate future growth. Currently, light rail transit is provided along the waterfront west of Bay Street, to Harbourfront and Spadina with a direct link to Union Station. In the future, light rail transit is planned to connect to new communities east of Bay Street into the Port Lands as part of the overall expansion of the existing waterfront network. There is currently insufficient capacity in the Union Station streetcar loop to permit the addition of eastern LRT service. Additional capacity is required to accommodate forecasted future demand.

City of Toronto Union Station – Queens Quay Transit Link Study Initial Business Case
| Final | April 1, 2019 | Arup Canada Inc.
Page 6
2.1.2 External Drivers
2.1.2.1 Government policy There are several policies and plans which call for improved public transit in Toronto, on the waterfront and in the Central Waterfront. These are:
• City of Toronto Official Plan. The Official Plan contains several policy objectives geared towards reducing auto dependency by shifting travel modes towards transit and active transportation.
• Central Waterfront Secondary Plan. The Secondary Plan called for a ‘transit first’ approach. This approach was a call to have transit precede development such that new developments would be planned and built with transit already available. This approach would ensure that people new to the area would be accustomed to using transit from day one.
• East Bayfront Transit EA. In 2010, City Council approved the East Bayfront Transit EA. This EA proposed building transit from Union Station to Parliament Street where a temporary loop would be built for turning back streetcars. Ultimately, when Queens Quay would be extended to Cherry Street and beyond, the loop could be decommissioned.
• Waterfront Transit Reset. In 2018, City Council approved the Waterfront Transit Network Plan to 2041. This included a complete dedicated streetcar network on the waterfront from Park Lawn in the West to Leslie Barns in the East. New connections would be made to Dufferin and Broadview with a central terminal at Union Station. Direction from council was to identify potential cost-saving solutions for the USQQL which is the subject of the current studies underway by the City and their partners.
Metrolinx’ Regional Transportation Plan (RTP) provides an overarching vision for the region: The GTHA will have a sustainable transportation system that is aligned with land use, and supports healthy and complete communities. The system will provide safe, convenient and reliable connections, and support a high quality of life, a prosperous and competitive economy, and a protected environment.1
2.1.2.2 Population and employment growth Land use and demographic changes result in forecasts for significant population and employment growth in the waterfront. Additionally, there are significant special ridership generators such as the Ferry Docks, Harbourfront Centre, Billy Bishop Airport, and more.
1 http://www.metrolinx.com/en/regionalplanning/rtp/, Executive Summary, page iv

City of Toronto Union Station – Queens Quay Transit Link Study Initial Business Case
| Final | April 1, 2019 | Arup Canada Inc.
Page 7
Those who live and work along the waterfront, and the many more who will join them in the coming decades, will require higher-order transit to move in and around the area and greater region.
Figure 2 shows proposed development in the Waterfront Transit Reset study area. The map only shows development in the "pipeline" as of 2017. The 2041 population and employment forecasts include more growth that is not captured on this map but that is included in the travel demand forecast. Further to this, there are areas of the waterfront which have already, or will outpace growth scenarios reflected in the model and ridership forecast including Humber Bay Shores and Lower Yonge precinct.
Figure 2: Proposed developments in the Waterfront Transit Reset study area
2.1.2.3 Special uses and attractions In addition to thousands of daily commuter and leisure trips in the Bay Street and Queens Quay corridors, the area also draws thousands of additional daily tourists, recreation, and special event riders destined for the waterfront and key regional amenities. Toronto is Canada’s largest tourist destination, with over 40 million visitors welcomed in 20152. Many of these tourists visit one or more key waterfront venues during their stay, including those in the Bay Street corridor.
Tourist and special event ridership is not well-captured through transit demand forecasting but represent a large proportion of overall riders, given the number of special event venues and destinations accessible via the USQQL. These riders could surpass the typical peak hour trip activity in the corridor and have peak
2 https://www.toronto.ca/business-economy/industry-sector-support/tourism/

City of Toronto Union Station – Queens Quay Transit Link Study Initial Business Case
| Final | April 1, 2019 | Arup Canada Inc.
Page 8
ridership periods outside of typical hours (e.g. weekend and holiday peaks as opposed to morning and evening commute peaks). Key waterfront destinations and attractions include:
• Billy Bishop Airport, which draws approximately 2.8 million passengers per year3
• Harbourfront Centre (17 million visitors per year)
• Scotiabank Arena (3 million visitors per year)
• Jack Layton Ferry Terminal / Toronto Islands (1.5 million visitors /year)
• Exhibition Place (5.5 million visitors per year)
These riders could surpass the typical peak hour trip activity in the corridor and are a particularly important consideration given Toronto’s status as Canada’s largest tourist destination.
2.1.2.4 Stakeholder Input The City of Toronto, TTC and Waterfront Toronto all support the USQQL. Special interest groups including BIAs and resident associations are also keen to see more transit within the waterfront. During the course of the Union Station-Queens Quay Link Transit Study, there was overwhelming support and calls for action. The general sentiment is that waterfront transit had be studied enough and now it is time it is time to move forward with implementation.
2.1.3 Internal Drivers
2.1.3.1 Travel behaviour Current users of transit in the central waterfront are primarily destined to and from the west on the existing streetcar. Ridership is approximately 1,000 passengers southbound in the AM peak hour and 1,300 passengers in the PM peak hour. Additionally, thousands of walk trips are made along Bay Street and in the PATH network between Union Station and destinations at Queens Quay and Bay.
As the waterfront develops, transit ridership will continue to grow. The majority of transit riders in the East Bayfront are destined to or bound from Union Station. Future AM peak hour transit demand in the corridor is projected to be 4,000 to 8,000 passengers southbound in the AM peak hour by 2041. Demand projections assume all Council-approved transit projects including the Relief Line South, and fare integration assumptions. This included all GO trips originating/destined within Toronto and TTC fare.
3 https://www.portstoronto.com/portstoronto/media-room/portstoronto-facts/billy-bishop-airport-facts.aspx

City of Toronto Union Station – Queens Quay Transit Link Study Initial Business Case
| Final | April 1, 2019 | Arup Canada Inc.
Page 9
Figure 3 shows existing and future projected southbound transit flow in the AM peak hour in the Bay Street corridor.
Figure 3: Existing and future transit demand in the Bay Street corridor
Per the City of Toronto, approximately 40-45% of AM peak hour trips between Union Station and Queens Quay, in the Bay Street corridor, are destined to Queens Quay and Bay, and 55-60% are destined to the wider waterfront. For both groups of riders, the USQQL is a key component of the journey, permitting riders to connect to additional transit networks that serve the GTHA.
Given the projected four- to eight-fold increase in peak hour, peak direction transit ridership, the USQQL plays a critical role in supporting the employment, residential, and recreational opportunities that are increasing along the waterfront. The growth in demand along the waterfront is driven by a number of key factors; namely, increased development in the East Bayfront, Lower Don Lands, and Port Lands, as well as growth in tourism and special events traffic. The East Bayfront is anticipated to accommodate 6,000 residential units and 8,000 jobs, with millions of square feet of employment space4.
2.1.3.2 Transit service provision Current transit service is a mix of existing streetcar lines serving the west, and bus lines serving the east and north. A map of the WTN is included in Appendix A. While these services provide some of the capacity needed, they will not be 4 https://waterfrontoronto.ca/nbe/portal/waterfront/Home/waterfronthome/precincts/east-bayfront

City of Toronto Union Station – Queens Quay Transit Link Study Initial Business Case
| Final | April 1, 2019 | Arup Canada Inc.
Page 10
sufficient to support the significant transit demand projections for the waterfront network given the amount of development forecasted.
2.1.3.3 Transit Infrastructure and Technology The WTN is only partially constructed through the Central Waterfront, west of Bay Street, with streetcar service connecting Exhibition Place and Spadina Avenue to Union Station via surface running streetcar along Queens Quay. Streetcars run between Queens Quay and Union Station via a streetcar tunnel below Bay Street which terminates in a loop at Union Station, immediately south of the Line 1 subway station.
The East Bayfront is currently not served by higher-order transit. To support growth in the East Bayfront and beyond, future network expansion will provide LRT service to destinations east of Bay Street into East Bayfront and ultimate into the port Lands to Leslie. In the west, new lines are required to connect to Park Lawn with operational improvements between Park Lawn and Long Branch. The central component of this network is the USQQL.
To enable buildout of the waterfront, an upgrade of the existing USQQL is required due to:
• Insufficiently sized platform areas for present and future passenger volumes at Union Station due to single track layout, curved platforms, and insufficient space for boarding and alighting passengers.
• Inability to accommodate additional service added to the east without substantial changes made to the Link to handle the anticipated demand.
Figure 4 shows the existing and future WTN, with the Union Station – Queens Quay Link the notable central connection of the entire network.
Figure 4: Existing (solid) and future (dashed) waterfront LRT lines
All levels of government have invested significantly in the Port Lands Flood Protection (PLFP) project to unlock the Port Lands for development. For the

City of Toronto Union Station – Queens Quay Transit Link Study Initial Business Case
| Final | April 1, 2019 | Arup Canada Inc.
Page 11
vision and benefits of this investment to be fully realized, the new communities that rise here will need to be supported by investment in sustainable transportation infrastructure. Part of the PLFP investment includes the reconstruction of parts of Cherry Street and Commissioners Street (including a new bridge over Keating Channel) with protection for a dedicated transit right-of-way on Villiers Island. These projects are funded and approaching implementation.
2.2 The Proposed Solution An enhanced Union Station - Queens Quay Transit Link will provide much-needed additional capacity to connect waterfront communities and destinations to downtown, the GO Transit network and TTC subway network via Union Station.
There are two proposed alternatives for the upgrade of the Link: first, the expansion of the existing streetcar loop, as approved in the East Bayfront Transit EA; second, the replacement of the existing streetcar loop with an Automated People Mover (APM) which would connect to LRT on the waterfront at an expanded Queens Quay Station at the foot of Bay Street.
The upgraded link will benefit not only riders in the immediate Bay Street corridor and those in the wider waterfront, but also the region as a whole. Accessibility to destinations such as Billy Bishop Airport, Exhibition Place, and the Toronto Islands relies on a resilient connection between Union Station—Canada’s busiest transit hub—and the waterfront, where many daily and special event riders are destined.
City of Toronto Union Station – Queens Quay Transit Link Study Initial Business Case
| Final | April 1, 2019 | Arup Canada Inc.
Page 12
3 Investment Options
3.1 Option Development When the USQQL study began in the fall of 2018, a variety of streetcar and APM options were under considered to serve the Link. Though a preliminary options screening process, two preferred options were defined for further design refinement and cost estimation. These preferred options are discussed in depth in the USQQL Study Report.
3.2 Short-listed options Based on these findings, Arup concluded that the two preferred options for design development should be:
• APM from Union Station to Queens Quay Station/Ferry Docks, using the existing streetcar tunnel, with reconfiguration of the stations at either end to accommodate the APM. The streetcar on Queens Quay would travel below grade using the existing portal west of Bay and a new portal east of Bay Street.
• This option would introduce a significant change to the existing transit network with the addition of a new technology.
• Streetcar from Union Station to Queens Quay Station/Ferry Docks, using the existing streetcar tunnel, with significant expansion of the Union Loop and reconfiguration of the Queens Quay Station to accommodate new streetcar services to the east. The streetcar on Queens Quay would travel below grade using the existing portal west of Bay and a new portal east of Bay Street.
• This option would add to existing service through substantial expansion of the Union Station streetcar loop using existing TTC streetcars.
In both cases, the portal could be east of Yonge (as in the approved EA) or west of Yonge. For this exercise, costs for the portal east of Yonge were used; however, the location of the portal does not impact the decision of a preferred technology and is therefore not decision relevant to the selection of a technology option to serve the Union Station – Queens Quay Transit Link.

City of Toronto Union Station – Queens Quay Transit Link Study Initial Business Case
| Final | April 1, 2019 | Arup Canada Inc.
Page 13
3.3 Option Definition Key considerations that were evaluated during the options screening process are summarized in Table 3. These must be considered in subsequent phases of design.
Table 3: Key considerations during options screening process
Streetcar APM
Impact on customers and communities
Travel demand would increase relative to existing ridership levels on all segments of the waterfront LRT network. Existing streetcar service to Union Station would be maintained following construction, with new and similarly-operated service introduced to the East Bayfront.
Travel demand would increase relative to existing ridership levels on all segments of the waterfront LRT network. Trips within the Bay Street corridor would be higher than streetcar but trips beyond would be lower. Existing streetcar service would be modified to a through service with a transfer to APM at Queens Quay Station required for passengers travelling to/from Union Station.
Cost and design assumptions
All stations will be designed to relevant standards (OBC, AODA, NFPA 130, City of Toronto PATH guidelines). At least one traffic lane must remain open per direction on all roads during construction. Secant wall construction is used unless otherwise noted. Noise and vibration mitigation will be an important consideration, particularly at Union Station, given Metrolinx construction tolerances. Premium finishes in stations are assumed given that this station is the gateway to the waterfront.
Interdependencies
Current TTC fare policies would apply to the streetcar expansion. Landowners whose properties are impacted by the expansion at the Union loop (1 Front Street and 141 Bay Street) assumed to be amenable to agreements with the City of Toronto to use a portion of their basement levels for station expansion. Impacts to pedestrian movement in the Bay Street corridor will be an important consideration, given the need to close teamways during construction (one teamway to remain open at all times).
Current TTC fare policies would apply to the streetcar expansion. The APM will be operated as part of the TTC network. A TTC fare will apply to rider the APM, including the $1.50 “double discount fare” transfer to/from GO transit.

City of Toronto Union Station – Queens Quay Transit Link Study Initial Business Case
| Final | April 1, 2019 | Arup Canada Inc.
Page 14
4 Strategic Case Both the Regional Transportation Plan and City planning documents reference USQQL. The RTP identifies the Waterfront LRT as part of the 2041 Frequent Rapid Transit Network, and the Waterfront East LRT has been identified as an “In Development” project, with Strategy 1.2 being to “advance the in-development transit projects through preliminary design, detailed design, and construction”.
Figure 5: Waterfront Transit Network Plan
For the purposes of this Initial Business Case (IBC), the two technology options were evaluated using the 2041 Regional Transportation Plan5 (RTP) Goals. The project was also evaluated using criteria from the City of Toronto’s Rapid Transit Evaluation Framework (RTEF); those criteria were focused on project- and context-specific considerations. Please refer to the Union Station – Queens Quay Transit Link Study Final Report for the analyses supporting some of the conclusions made as part of this strategic case.
4.1 2041 RTP The following section evaluates how well each option responds to the following RTP goals:
• Strong connections: Connecting people to the places that make their lives better, such as homes, jobs, community services, parks and open spaces, recreation, and cultural activities.
• Complete travel experiences: Designing an easy, safe, accessible, affordable and comfortable door-to-door travel experience that meets the diverse needs of travellers.
• Sustainable and healthy communities: Investing in transportation for today and for future generations by supporting land use intensification, climate resiliency and a low-carbon footprint, while leveraging innovation.
5 http://www.metrolinx.com/en/regionalplanning/rtp/

City of Toronto Union Station – Queens Quay Transit Link Study Initial Business Case
| Final | April 1, 2019 | Arup Canada Inc.
Page 15
Table 4 provides a high-level assessment of how each option responds to the 2041 RTP Goals.
Table 4: Evaluation of options against 2041 RTP Goals
2041 RTP Goal Streetcar APM
Strong connections
Connectivity to key cultural and entertainment venues and assets
Streetcar provides strong connections to many assets beyond the immediate study area and better serves medium- to long-distance trips to Billy Bishop Airport and Harbourfront Centre
APM provides direct and high-frequency connections to important assets within the immediate study area including the Jack Layton Ferry Terminal
Connectivity to places of employment
Streetcar provides transfer-free connections to growing employment lands in the East Bayfront and Don Lands
APM provides fast connections to offices at Queens Quay and Bay Street
Connectivity between waterfront communities
Streetcar configuration does not support a through service on Queens Quay with a stop at Bay. To continue through one must transfer, ride the entire loop or an express service would need to bypass Queens Quay Station
APM configuration supports a continuous east-west service along the waterfront with a stop at Bay, facilitating direct connection across the waterfront
Connectivity beyond the waterfront, to the wider region
Streetcar provides transfer-free connections between waterfront residential and employment lands and the wider region via Union Station
Riders bound to the wider region via GO transit and other rail services from Union Station must transfer from streetcar to APM if bound from further east or west along the waterfront

City of Toronto Union Station – Queens Quay Transit Link Study Initial Business Case
| Final | April 1, 2019 | Arup Canada Inc.
Page 16
Table 5: Evaluation of options against 2041 RTP Goals (Con't)
2041 RTP Goal Streetcar APM
Complete travel experiences
Designing easy, safe, accessible, affordable, and comfortable door-to-door travel
Streetcar provides accessible and comfortable door-to-door travel by maintaining existing single-seat ride to Union from Central Waterfront and expanding the same level of service to the East Bayfront
APM facilitates comfortable east-west travel along the waterfront but introduces an additional transfer at Queens Quay Station for passengers destined to other areas of the city or region via Union Station
Sustainable and healthy communities
Supports land use intensification
Streetcar strongly supports the development of the wider waterfront by introducing higher-order transit to and from Union Station, where most trips begin or end
APM moderately supports the development of the waterfront but shows some trips take alternate, non-waterfront routes to enter the waterfront
Supports climate resiliency and a low-carbon footprint
Streetcar provides higher-order transit to the waterfront, contributing to reduced auto dependency and higher network ridership
APM serves high volume of Bay Street corridor riders while connecting waterfront to Union Station and maintaining overall network ridership
Leverages innovation Streetcar uses existing, proven technology to build up existing TTC network but does not, at the present time, offer automation or cost savings
APM introduces a new, proven, and convenient technology to a critical travel corridor in the city
Overall, both options offer advantages and disadvantages but respond well to the 2041 RTP Goals. The key difference is that, with the APM, users travelling beyond the Bay Street corridor must transfer at Queens Quay Station to get on the streetcar. For many users already transferring from the subway or GO at Union, the APM introduces a second transfer increasing travel timing and diminishing

City of Toronto Union Station – Queens Quay Transit Link Study Initial Business Case
| Final | April 1, 2019 | Arup Canada Inc.
Page 17
user experience. With either technology, the Link connects multiple existing and proposed networks including surface streetcar, subway, and GO rail service, which terminate at Union Station.
4.2 City of Toronto RTEF Criteria For the Union Station – Queens Quay Transit Link Study, project-specific evaluation framework was developed focusing on key differentiating outcomes between the two options in the following categories of strategic importance: user experience, transportation operations, and constructability/construction management. The evaluation results in a preliminary preferred option in each category based on outcome of the assessment. The full evaluation of the two options by criterion is part of the overall study report. The conclusion of that evaluation was also that the streetcar outperformed the APM in terms of user experience and transportation. Specifically, the streetcar network offered a single seat ride for trips beyond the Bay Street corridor, and the expanded loop greatly enhanced the resiliency and flexibility of the waterfront LRT network.
4.3 Strategic Evaluation Summary The need to serve the waterfront with higher-order transit is clear. Given this, both preferred options would contribute in a meaningful way to the sustainable development of waterfront communities. Overall, though both options offer advantages and disadvantages relative to one another when assessed against the 2041 RTP Goals, the waterfront LRT is in the ‘in development’ project list in the RTP.
While an APM was not considered as part of the RTP, it is a form of rapid transit, and has some distinct benefits that were considered as part of this study. In this case, however, the differentiator is how markets are served, and the network context. While the APM supports a strong link to the local waterfront, ultimately the network advantages of the streetcar are that the East Bayfront is better served, and overall operations of the streetcar are improved.
The RTEF assessment focused on key differentiators reveals that the streetcar option provides certain key advantages, namely:
• An expanded streetcar terminal at Union Station offers the greatest advantages from a TTC operations perspective, helping accommodate service adjustments during operating hours and providing a strategic central hub at the busiest transit node in the GTA.
• An expanded streetcar terminal at Union Station facilitates the future integration of the Bremner streetcar line, increasing the overall resiliency of the investment. Based on a high-level evaluation, both options broadly meet the 2041 RTP Goals and will accommodate the forecasted transit demands while providing a connection to key destinations on the waterfront.

City of Toronto Union Station – Queens Quay Transit Link Study Initial Business Case
| Final | April 1, 2019 | Arup Canada Inc.
Page 18
• An expanded streetcar terminal at Union attracts higher levels of forecasted waterfront ridership to/from the east and west including Harbourfront and the East Bayfront, helping justify overall investments in the WTN.
Based on a refined, project-specific strategic evaluation undertaken using a modified version of the City’s RTEF, the streetcar performs better than the APM with respect to user experience and transportation.
Table 6: Evaluation summary
Strategic evaluation criterion
Streetcar APM
2041 RTP Goals Preliminary preferred. Achieves all strategies but LRT (Streetcar) is more
consistent with wider network envisioned for waterfront
Achieves all strategies however does not offer the
service and routing flexibility of the streetcar loop
expansion
RTEF Criteria Preliminary preferred. -
Overall Preliminary preferred -

City of Toronto Union Station – Queens Quay Transit Link Study Initial Business Case
| Final | April 1, 2019 | Arup Canada Inc.
Page 19
5 Economic Case The Economic Case is based on analysis of the entire WTN assuming full buildout of the network from Humber Bay Shores to the Port Lands. Consequently, the costs and benefits have been estimated for the WTN as a whole.
Following the Metrolinx Business Case Guidance, the Economic Case is based on a 60-year appraisal period. Note that this differs from the Financial Case assessment which is based on a 30-year period, causing a minor difference in numbers.
5.1 Methodology, Data Sources and Assumptions
5.1.1 Methodology The development of the Economic Case follows the methodology set out by Metrolinx in the draft Business Case Guidance that has been recently published and is available for download on the Metrolinx website. The Economic Case seeks to assess the investment options in terms of their benefits and costs to society, and is based on the estimation of consumer surplus, defined as the difference between what people are willing to pay for a good (in this case, for time or comfort) and the actual cost incurred.
The methodology describes a set of costs and benefits that should be included in the appraisal and also includes specific parameters to be used in the calculations. The costs and benefits listed in the guidance include:
Costs
Metric Description Data Source
Include in BCA?
Capital Costs
Fixed one-time costs in the initial project investment Estimation based on unit costs
Yes
Operating and Maintenance Costs
Recurring and periodical costs associated to keeping the infrastructure up and running
Estimation based on unit costs
Yes
User Impacts
Metric Description Data Source
Include in BCA?
Travel Time
(Transit Users)
Change in total transit user travel time (including in-vehicle time, access time, and wait time)
GTA Model
Yes

City of Toronto Union Station – Queens Quay Transit Link Study Initial Business Case
| Final | April 1, 2019 | Arup Canada Inc.
Page 20
Reliability Change in the punctuality of transit, based on the standard deviation of travel times between origin-destination zones
TTC on-time
departures
Yes
Crowding Change in perceived travel cost associated with crowded conditions based on number of persons seated / standing
GTA Model
Yes
Journey Amenity
Change in perceived travel cost relating to service quality (i.e. information / cleanliness in stations)
Wardman (2014);
TfL
Yes
User Costs Change to out-of-pocket costs (e.g. fares, tolls, operating costs, etc.)
GTA Model
Yes
Travel Time
(Auto Users)
Change in total auto user travel time resulting from changes to infrastructure or reduction in congestion
GTA Model /
Aimsun Model
Yes
External impacts
Metric Description Data Source
Include in BCA?
Health Benefits (Active Travel)
Benefits derived from new walking activity, measured as new distance (km) on walking feeding into transit
GTA Model
Yes
Road Safety Benefits
Change in motor vehicle accidents resulting injury or death, monetized based on a reduction of vehicle kilometres travelled (VKT)
GTA Model
Yes
Greenhouse Gas Emissions
Change in carbon emissions, monetized based on a reduction of vehicle kilometres travelled (VKT)
GTA Model
Yes
Air Quality Change in emissions affecting local air quality, monetized based on a reduction of vehicle kilometres travelled (VKT)
GTA Model
Yes
Noise Changes to noise impacts along corridor -- No
Wider Economic Impacts
Metric Description Data Source
Include in
BCA? Agglomeration Improvements to productivity for firms and works
that locate closer together along RT corridors based on travel generalized costs, employment, average GDP per worker, and productivity elasticity
Toronto Employment
Data
Yes (over long-term)
Imperfect Competition
Improvements to transport increases level of economic output. In a market with imperfect competition, the consumer’s willingness to pay exceeds the costs of production, therefore there is a benefit. Benefit based on a standard markup of 10% of business travel time savings
GTA Model Yes

City of Toronto Union Station – Queens Quay Transit Link Study Initial Business Case
| Final | April 1, 2019 | Arup Canada Inc.
Page 21
Employment Impacts
Transport improvements may induce economically inactive individuals to enter the labour market (increasing productivity). It may also lead to the relocation of employment which may change economic output through spatial inequality of productivity.
-- No
Please refer to the Metrolinx Business Case Guidance for further details.
5.1.2 Data sources Three main data sources have been used to develop the Economic Case for Union Station – Queens Quay Transit Link: City of Toronto’s GTAModel v4.0; the Metrolinx Business Case Guidance; and, cost estimates from the January 10 2018 staff report.
The information extracted from the GTAModel by the City Planning modelling team includes, for all modelled time periods and scenarios:
• Transit Demand Origin-Destination (O-D) matrices
• Generalized Cost O-D matrices
• Crowded Cost O-D matrices
• Total Fare O-D matrices
• Auto Demand Origin-Destination (O-D) matrices
• Auto Travel Time Origin-Destination (O-D) matrices
• Total vehicle kilometres travelled
• Total demand by mode
From the Metrolinx Guidance, the information used includes, among others:
• Value of Time
• Social discount rate
• Appraisal period length
• Monetary values for estimation of benefits (air quality, emissions, safety, etc.)
The flowchart shown in Figure 6 shows how the model outputs relate to the benefits being estimated. A comprehensive list of the parameters, with their values, is included as Appendix B.

City of Toronto Union Station – Queens Quay Transit Link Study Initial Business Case
| Final | April 1, 2019 | Arup Canada Inc.
Page 22
Figure 6: Data sources and process
GTA Model
Transit Demand
Generalized Cost
Crowding Cost O-D Fare Auto
DemandAuto Travel
Time Total veh-km
Travel TimeTT = GC –
Crowding – Fare
Value of Time
Transit User Impacts (calculated by O-D pair)
Travel TimeCrowding
Other User Impacts (calculated by corridor)
Journey AmenityReliability
Road User Impacts (calculated by O-D pair)
Road Decongestion Benefit
Benefits calculation (user impacts)
Benefit = VoT x ( ½ x (T0 + T1) x (P0 - P1))
Where, T0 = Do-min demandT1 = Do-Something demandP0 = Do-min costP1 = Do Something cost
External Impacts (calculated model-wide)
Road safetyGreenhouse gasAir quality
Benefits calculation (external impacts)
Benefit = (vkt1 – vkt0) x constant
Where,vkt0 = Do-min total veh-km travelledvkt1 = Do-Something total veh-km travelled
City of Toronto Union Station – Queens Quay Transit Link Study Initial Business Case
| Final | April 1, 2019 | Arup Canada Inc.
Page 23
5.2 Costs Costs are typically segregated into two categories; Capital Costs, also known as Capital Expenditures or CapEx, and Operating Costs, also known as Operating Expenditures or OpEx. This section describes the high-level cost analysis for the WTN.
5.2.1 Capital Costs (PV) Capital costs include one-time investments associated to the project. For this specific project, these include elements such as:
• Design and PMO • Stations • Rail infrastructure/track • Communications systems and Signalling • Traction power • Rolling stock (for the streetcar option)
The costs also include $120 million worth of operational improvements between Long Branch and Legion Rd in the approved WTN plan. It should be noted that the improvements would not have been fully reflected in the waterfront model outputs provided to Arup; however, we anticipate any difference in benefits to be relatively minor overall and not impact the conclusions of the IBC. Present value of capital costs for the economic analysis are:
• Both options: $1.9 million
Present value of costs is slightly different between the economic and financial cases due primarily to different assumptions for discount rates.
5.2.2 Operating Costs (PV) Operating costs include recurring and periodical investments associated to keeping the infrastructure up and running. The most relevant operations costs included in this specific project are:
• Operative staff and administration • Maintenance • Cleaning • Utilities
Total operating costs in a 60-year period for this project have been estimated at:
• Streetcar: $500 million
• APM: $520 million

City of Toronto Union Station – Queens Quay Transit Link Study Initial Business Case
| Final | April 1, 2019 | Arup Canada Inc.
Page 24
5.3 User Impacts
5.3.1 Transit Travel Time Change
The economic benefit to transit users of a reduction in their travel time results from changes in trip patterns, mode choice and service improvements. Changes in travel times are extracted from the GTAModel and are in the form of generalized minutes, which include all the individual components of overall travel time: the in-vehicle travel time (IVTT), wait time, access/egress time. In order to reflect travellers’ perceptions, each of these components of travel time is factored, and an additional transfer penalty is added. These factors are based on those used in the City of Toronto GTAModel V4 and reflects the same penalties applied to assessments of transit projects across the city. It is noted that TTC applies different generalized journey time factors (e.g. a flat 10-minute transfer penalty). The factors are listed below:
Table 7: Generalized journey time factors
Component Factor
IVTT 1.0
Wait Time 2.5
Access/Egress walk time 2.0
Transfer penalty 5.0 minutes (0 for transfers to subway and APM)
The overall travel time impacts are estimated based on the average generalized times and the total number of transit trips for each origin-destination pair, for each scenario and the do minimum.
The present value of the total economic benefit resulting from the estimated reduction in travel times for travel in and around the Greater Toronto Area, after the implementation of the options is:
• Streetcar: $768 million
• APM: $1.126 million
Crowding
Crowding benefits are estimated from outputs generated by the GTAModel V4. Based on the relationship of assigned passengers and transit service capacity, the model applies a factor to the IVTT to represent users’ discomfort, resulting in a perceived travel time, greater than or equal to the non-crowded IVTT that is calculated for each stop-to-stop segment of all transit routes in the model.

City of Toronto Union Station – Queens Quay Transit Link Study Initial Business Case
| Final | April 1, 2019 | Arup Canada Inc.
Page 25
The difference between the perceived, crowded time, and the base IVTT, multiplied by the number of passengers travelling on each segment of the transit services, results in a total number of ‘crowded minutes’, which are then monetized by applying the Value of Time.
The implementation of the WTN partially reduces crowding on adjacent transit services. This can be either due to additional capacity provided or, as is the case for the WTN, the result of changes in travel patterns. The present value of the monetized crowding benefits is:
• Streetcar: $69.2 million
• APM: $3.7 million
Reliability
Reliability benefits represent the potential improvement in reliability that may be achieved by the implementation of a transit intervention.
At this stage, the reliability benefits have not yet been estimated.
Amenity
Amenity benefits represent to transit users of improved facilities. These can include items such as weather protection, perception of safety/security, provision of information, etc.
At this stage, the amenity benefits have not yet been estimated.
5.3.2 Auto Congestion
The implementation of transit interventions may result in a reduction in auto travel times and congestion, due to changes in trip patterns and modal preferences.
In the case of the WTN, model results indicate that there is an increase in total auto vehicle kilometres travelled (VKT), which generally results in increased congestion. This dis-benefit, however, is not currently being quantified following advice provided by City Planning team’s modelling group suggesting that the auto travel times output of the GTAModel V4 is volatile and not suitable for use in this business case.
User Costs
Auto user costs are a direct result of the change in auto VKT and are calculated based on the average auto operating cost per kilometer recommended by Metrolinx.
The present value of the impacts on user costs of the WTN is of:

City of Toronto Union Station – Queens Quay Transit Link Study Initial Business Case
| Final | April 1, 2019 | Arup Canada Inc.
Page 26
• Streetcar: -$5.7 million
• APM: -$19.4 million
The negative values indicate a dis-benefit to users, driven by an increase in auto VKT.
5.4 External Impacts
5.4.1 Wellbeing Health Benefits (Active Travel)
Health benefits from increased active travel represent the additional distance travelled by people who switch from auto to transit or walking.
In the case of the WTN, there is an increase in overall transit ridership, which is generally used as an indication of active travel health benefits. However, based on the characteristics of the WTN, it is expected that a large proportion of the new transit riders are transferring from walking to the faster transit option. The GTAModel, however, does not have sufficient resolution to accurately provide an estimate of the impact on active mode share.
Overall, it is expected that the switch from walking to transit would offset the benefit of any new transit users and, therefore, it has been assumed that the health-benefits impact is negligible for both WTN options.
Road Safety Benefits
Road safety benefits arise from the reduction in auto VKT and are based on average accident rates and an estimated economic cost per accident.
The present value of the impacts on road safety of the WTN is of:
• Streetcar: -$1.1 million
• APM: -$3.6 million
As is the case with auto user costs, the negative values indicate a dis-benefit, driven by an increase in auto VKT.
5.4.2 Environmental Green House Gas and Local Air Quality
As is the case with the road safety benefits, green house gas and local air quality benefits are estimated as a function of the change in auto VKT and are based on the estimated to society of environmental impacts.

City of Toronto Union Station – Queens Quay Transit Link Study Initial Business Case
| Final | April 1, 2019 | Arup Canada Inc.
Page 27
The present value of the impacts on green house gas and local air quality of the WTN is of:
• Streetcar: -$0.4 million
• APM: -$1.3 million The negative values indicate a dis-benefit, driven by an increase in auto VKT.
5.5 Wider Economic Impacts
5.5.1 Imperfect Competition The lack of accessibility can incentivize monopolistic or oligopolistic behaviours such as rent or sale of specific goods. Accessibility improvements, specifically transport infrastructure investments, help reduce travel time and costs that indirectly impact costs of specific goods and other services. This is known as imperfect competition and is an important wider economic impact.
For the WTN business case, imperfect competition is assumed as 10%.
5.5.2 Agglomeration Agglomeration economies, or productivity impacts, can be explained by an increase in productivity due to the proximity of different firms or employers within a certain area. Competition between firms due to proximity can boost productivity and innovation.
For the WTN business case, agglomeration economies have not been considered.
5.6 Conclusions
5.6.1 Appraisal Summary The summary economic analysis is presented in Table 8. The incremental increases are in addition to the business as usual (BAU) scenario includes all Council-approved transit projects including the Relief Line South, and current TTC fare assumptions. BAU however does not included any unfunded projects which is most of the WTN.
Table 8: Appraisal summary (1,000s) Streetcar APM User Benefits
Transit Time Savings $768,205 $1,126,440 Transit Reliability $- $- Transit Crowding $69,245 $3,696

City of Toronto Union Station – Queens Quay Transit Link Study Initial Business Case
| Final | April 1, 2019 | Arup Canada Inc.
Page 28
Transit Amenity $- $- Auto Costs -$5,691 -$19,427
Producer Benefits Incremental Fare Revenue $80,167 $116,213
External Benefits Health / Active Travel $78,169 $113,316 Road Safety -$1,062 -$3,624 GHG Emissions -$316 -$1,079 Local Air Quality -$63 -$216
Wider Economic Impacts Agglomeration $- $- Imperfect Competition $1,268 $1,859
Conventional PV of Benefits $988,654 $1,335,319 Expanded PV of Benefits $989,921 $1,337,178 Costs Capital Costs $1,917,469 $1,917,469 O&M Costs $499,642 $519,816
Rehabilitation Costs $- $- Total PV of Costs (PVC) $2,417,112 $2,437,285 Conventional NPV (PVB - PVC) -$1,428,458 -$1,101,966 Conventional BCR (PVB / PVC) 0.41 0.55 Expanded NPV (PVB - PVC) -$1,427,190 -$1,100,108 Expanded BCR (PVB / PVC) 0.41 0.55
The analysis indicates additional benefits for APM when compared to the streetcar option. However, this is based on a conservative approach taken to the representation of streetcars in dedicated rights-of-way within GTAModel V4, the model on which ridership calculations are based. The model includes a 5-minute boarding (transfer) penalty for all streetcar routes, representing such factors as the relative comfort of transferring and the reliability of the service to which riders are transferring. In the case of transfers to streetcars in dedicated rights-of-way, particularly in a weather protected Union Station with higher frequency, this likely overstates the size of the transfer penalty, resulting in underestimates of ridership. The APM option, as a new technology in the model, was treated similar to a subway with a boarding penalty of zero which results in it accruing high ridership between Union Station and Queens Quay. City transportation planning staff felt that this was a fair representation of the boarding penalty component of user experience for this technology but that it overstates the benefit of the APM relative to the streetcar, which has a structural disadvantage in modelled parameters at Union Station. Given the above, the team felt that the value of overall benefits for the streetcar are underreported.
City of Toronto Union Station – Queens Quay Transit Link Study Initial Business Case
| Final | April 1, 2019 | Arup Canada Inc.
Page 29
5.6.2 Risks and Uncertainty Additional benefits such as land value uplift and agglomeration economies were not considered within the business case. If considered in a more detailed analysis, they would provide for higher benefits and BCR. Capital cost estimates were taken from City of Toronto estimates provided in the Waterfront Transit Network Plan staff report to Executive Committee dated 10 January 20186. Of note:
• Capital cost estimates in the staff report are to a Class 5 level with a significant allowable margin of error.
• Capital cost estimates for other segments of work are in 2017$ and have been escalated to 2019$ using a 2% escalation rate.
• Capital cost estimates in the staff report do not reflect updates stemming from design changes or estimate refinements that may have occurred subsequent to the publication of the report.
• There is a large delta in the cost estimate for the completion of the entire WTN of approximately $330M in 2017$ (i.e. significant margin of error).
5.6.3 Conclusions Overall benefits are higher for APM, with similar costs as the streetcar, yielding a better result for the BCR. Benefits are related primarily to travel time savings, health and incremental fare revenue. It should be noted that the streetcar is structurally disadvantaged in this assessment because of the transfer penalty assumed at Union Station for those boarding the streetcar. The project team agrees that, given the quality of the transfer and high frequency service, users would not necessarily perceive a significant boarding penalty. In this case, ridership of the streetcar may be higher than what is modelled which would result in greater benefits that what are currently reported.
6 https://www.toronto.ca/legdocs/mmis/2018/ex/bgrd/backgroundfile-110749.pdf

City of Toronto Union Station – Queens Quay Transit Link Study Initial Business Case
| Final | April 1, 2019 | Arup Canada Inc.
Page 30
6 Financial Case
6.1 Financial case analysis The Financial Case uses parameters and assumptions consistent with Metrolinx’s Business Case Guidance as shown in Table 9. All analysis in the Financial Case is incremental to the Business as Usual (BAU – scenario without waterfront transit expansion) scenario – meaning all costs and revenue impacts only consider those directly related to the waterfront transit program above and beyond existing spending.
Table 9: Financial case assumptions
Line item Description Assumption(s)
Discount Rate A rate used to convert future year financial figures into nominal values
5.5%/year
Inflation Rate Inflation reflects how the value of money varies over time. Under conditions of inflation, 1 dollar today could not purchase what 1 dollar could purchase last year, nor 1 dollar in the future. The inflation rate adjusts financial considerations based on how costs and revenues change over time against overall prices
2%/year
Capital, operating and maintenance cost escalation
Certain GO Expansion elements may increase in value above the rate of inflation. This increase is considered as a ‘cost escalation
1%/year until 2031
Evaluation period The evaluation period is the lifecycle of the project included in the financial appraisal
60 years of operation
Fares The rate at which fares increase over time Assume growth in line with historic trends for fare growth

City of Toronto Union Station – Queens Quay Transit Link Study Initial Business Case
| Final | April 1, 2019 | Arup Canada Inc.
Page 31
6.2 Financial impact
6.2.1 Capital Costs Capital costs for other waterfront lines were taken from the City’s January 2018 Staff report7. In that report, the range was quoted as ‘$1.980 billion to $2.310 billion 2017 dollars’. For simplicity, this analysis assumes the midpoint of that range or $2.150 billion dollars (rounded to the nearest $10 million). Escalated by 2% inflation, compounded annually, the overall capital cost is estimated at $2.240 billion in 2019 dollars. Assuming a 4-year construction period beginning in 2022, using a 5.5% discount rate, the resultant present value of capital cost is $1,760,000,000.
These costs include the USQQL project with associated surface works to Parliament, extensions east into the Port Lands to Leslie and Extension west to Park Lawn. Also included is approximately $120 million in operational improvements from Park Lawn to Long Branch.
Figure 7: Waterfront Transit Network improvements
For the Union Station – Queens Quay Transit Link Study, capital cost estimates were developed for streetcar and APM options and include all works from Union Station to the interim Parliament Street streetcar loop. The estimates were ASCE Class 4 accuracy-based, intended to be approximately +/- 25%. Various contingencies are included in the estimates; further details are in the cost estimation report included in the Study. The overall resulting capital costs from that work were $612 million for the expanded streetcar loop option and $600 million for the APM option. Those costs fell within the range of costs presented in the January 2018 staff report for the overall WTN and, therefore, the overall numbers from the January 2018 staff report were used.
7 https://www.toronto.ca/legdocs/mmis/2018/ex/bgrd/backgroundfile-110749.pdf

City of Toronto Union Station – Queens Quay Transit Link Study Initial Business Case
| Final | April 1, 2019 | Arup Canada Inc.
Page 32
6.2.2 Operating and Maintenance Costs The operating and maintenance (“O&M”) costs generally include the following components:
• Vehicle revenue kilometres (“VRK”): the total distance travelled by all the streetcar vehicles, expressed in vehicle-kilometres;
• Vehicle revenue hours (“VRH”): the total hours travelled by all the streetcar vehicles, expressed in vehicle-hours;
• Non-vehicle maintenance: the blended cost of non-vehicular components such as track, stop/station, and other infrastructure maintenance costs; and
• General admin (“GA”): the blended cost for system operations and maintenance, separate from vehicle-specific figures above.
The vehicle-dependent components – the VRK and VRH – are generally the operating costs associated with labour costs and vehicular maintenance, and as implied by its definition, scale with usage of the vehicles.
Estimates of the above components are based on the operational assessment, completed in the Study. In the assessment, the streetcar operating plans (for both streetcar and APM Options) were developed based on the peak point ridership as provided by the City’s demand model. Fleet requirement and service levels were calculated, and then processed into VRK and VRH. Table 10 summarizes the O&M costs between the two options which are less than 1% apart.
Table 10: Operating Costs (rounded to nearest thousand)
Item Streetcar APM
Daily streetcar costs (vehicle) $53,000 $49,000
Daily streetcar costs (non-vehicle) $36,000 $36,000
Annual cost (306 days) $27,309,000 $26,019,000
APM annual O&M Cost - $2,000,000
Total annual cost $27,309,000 $28,019,000
Present value (60 year) $390,000,000 $400,000,000

City of Toronto Union Station – Queens Quay Transit Link Study Initial Business Case
| Final | April 1, 2019 | Arup Canada Inc.
Page 33
6.2.3 Revenue Impacts Overall, the APM option results in higher revenue due to higher overall ridership of the Link due to some walk trips being converted to APM trips. Over 60 years, this results in an additional $40,000,000 (PV) in incremental revenue. This is based on the assumption that the APM would operate using a TTC fare, as with the streetcar, and with a $1.50 transfer from GO Transit.
Table 11: Incremental revenue (nearest $10 million)
Item Streetcar APM
60-year incremental revenue (PV)
$80,000,000 $120,000,000
6.3 Financial Analysis Summary
6.3.1 Financial Impact Summary Capital costs from the Union Station – Queens Quay Link Transit Study included costs from Union Station to Parliament loop. Given that the benefits measured are for the broader waterfront, the capital and costs considered in the economic analysis must also be from the wider waterfront network.
Table 12: Financial impact summary
Item Streetcar APM Total Costs (PV) Capital Costs (PV) 60-year O&M Costs (PV)
$2,150,000,000 $1,760,000,000
$390,000,000
$2,160,000,000 $1,760,000,000
$400,000,000 60-year Total incremental revenue (PV) $80,000,000 $120,000,000 Total Costs PV – PV Revenue $2,070,000,000 $2,040,000,000
6.3.2 Option Comparison The costs for the two options are within 2% and do not appear to be decision relevant when considering the full WTN. The Study also found that the streetcar and APM technologies had no significant price difference at $612 million and $600 million, respectively. The operating costs also appeared to be quite similar. While the APM resulted in lower passenger demand on the streetcar network, the loss of the streetcar loop at Union resulted in a less-efficient service plan and similar operating costs to serve fewer passengers. In addition, the streetcar option would likely have higher ridership due to previously noted limitations in modelling parameters at Union Station which result in a conservative estimate of streetcar ridership. Incremental revenue was higher for APM because, modelled
City of Toronto Union Station – Queens Quay Transit Link Study Initial Business Case
| Final | April 1, 2019 | Arup Canada Inc.
Page 34
with no boarding penalty, the APM attracted significant ridership from walking in the Bay corridor.
6.3.3 Funding Sources and Risks It is assumed that the funding source for the construction, operation, and maintenance of the preferred option will be similar to existing City of Toronto transit projects, with the following primary sources:
• City of Toronto and TTC
• Provincial and federal funding
The City will report to council in April 2019 on all on-going transit projects including the USQQL. Any funding decisions will follow this report to council. Based on the public consultation carried out for this project, there is an overall public expectation that completing the next steps and implementing solutions will be a key priority for the City, the TTC and Waterfront Toronto.
The primary risk associated with this funding request will be how this project ranks in the list of priority projects for the City and for Canada, given that the fund is federal. That said, this is a key enabling link to unlock development potential on the entire Toronto waterfront; the case for improving this connection is clear as a critical enabler to successful waterfront development.
6.3.4 Recommendations The two technology options are essentially the same cost. When considered in the wider waterfront network, for which the economic benefits have been quantified, the USQQL is only a fraction of the total costs, but essential to enable the rest of the network plan. It is the recommendation of this report that Council approve the USQQL to the next steps of implementation.

City of Toronto Union Station – Queens Quay Transit Link Study Initial Business Case
| Final | April 1, 2019 | Arup Canada Inc.
Page 35
7 Deliverability and Operations Case
7.1 Overview The Economic Case and Financial Case discussed earlier focus on the wider waterfront because the costs associated with the USQQL project benefit the entire network. The deliverability and operations case, however, focusses primarily on the USQQL component of the waterfront network. This section is broken in into:
• Project Delivery – Description of a suggested delivery strategy to use to implement the USQQL.
• Procurement – Description of a suggested procurement strategy for the USQQL.
• Operations and Maintenance – Description of a suggested approach to operate and maintain the USQQL.
• Risk Management – Description of key risks and how they are being addressed, managed and mitigated.
7.2 Project Delivery
7.2.1 Overview The suggested approach for project delivery considers:
• Governance – including considerations on how the project(s) contemplated as part of the WTN will move forward and who (what agency) will lead the project(s).
• Integrated Project Team – including thoughts on how the project team could be set up for implementation.
• Project Optimization – including various consideration for optimizing the project(s) including refinements to the design, operations, service planning and cost estimates.
• Consultation – including potential approaches for further public and stakeholder consultation as the project(s) and designs are developed.
• Project Readiness – including considerations for operational readiness of the project(s).
7.2.2 Governance The City, TTC, Metrolinx, and Waterfront Toronto all have substantial roles in delivering this project in careful alignment with existing planned and in-progress projects in the area.

City of Toronto Union Station – Queens Quay Transit Link Study Initial Business Case
| Final | April 1, 2019 | Arup Canada Inc.
Page 36
The Waterfront Transit Reset was led by the City of Toronto and the East Bayfront Transit EA was led by the TTC. It is not yet determined who would take forward the procurement of the project, however it would likely be either one of the City of Toronto, Waterfront Toronto (WT) or TTC. Depending on which entity is the proponent, the other two would likely be co-proponents.
Should the project be approved at Council in April 2019 and later funded, the project team (City, TTC, WT) will need to determine if EA addenda are required. Addenda could be as simple as a letter to the Ontario Ministry of Environment and Climate Change (MOECC) informing of the change up to and including additional public consultation if the changes are significant. Many of the changes contemplated as part of the USQQL study could be considered design development and may not be subject to additional consultation. Finally, the City may also wish to migrate the project to the Transit Project Assessment Process (TPAP).
7.2.3 Integrated project team It remains to be determined how the project will be structured and managed. The project will continue to require collaboration between the City, TTC, and Waterfront Toronto, as it has since 2015, with Metrolinx as a key stakeholder given their interests at Union Station. We anticipate the following key areas of focus from the partner agencies:
• City of Toronto will be primarily concerned with the city planning, transportation planning, traffic operations, traffic signal design.
• Waterfront Toronto will have particular interest in ensuring consistency with Queens Quay west.
• Toronto Transit Commission will have a primary interest in the guideway design, station stop design, track and systems.
• Metrolinx will have a primary interest in maintaining operations at Union Station and reinstating any commercial floor space lost or disrupted during construction.
7.2.4 Project optimization Many of the project optimization considerations are included in the USQQL Final Report as ‘next steps’. A summary of those proposed next steps is included here:
• During the next stages of design refinement, if the streetcar option is selected to proceed, the potential to optimize with double-ended streetcars at Union Station may be an additional consideration. This would represent a potentially significant study as it is unlikely that double-ended streetcars could be introduced at the Union loop without significant expansion which could

City of Toronto Union Station – Queens Quay Transit Link Study Initial Business Case
| Final | April 1, 2019 | Arup Canada Inc.
Page 37
require eliminating rail viaduct piers and result in impacts to adjacent properties.
• Evaluate the delivery of the USQQL in the context of existing TTC, Metrolinx, and Waterfront Toronto projects to reduce length of disruptions to transit and other surface operations.
• Further cost refinement to AACE Class 3 or CIQS-C.
• Ground penetrating radar to understand required utility relocations.
• Full geotechnical studies to understand soil conditions.
Significant preliminary design work has already been completed for the project; next steps would need to leverage that work and build on the work already done by others.
7.2.5 Public Consultation The East Bayfront Transit EA may require addenda depending on the significance of the changes made to the project through this process. Many of the updates since the EA can be considered design development; however, any significant changes such as moving the portal west of Yonge Street, as contemplated in the long list of options, would require an addendum. In this case, it would be a significant design change and may include additional public consultation.
As the Study progresses, the project lead agency may wish to hold additional public and/or stakeholder consultation sessions regarding the design details if appropriate. This could include the ultimate design and/or strategy for traffic management during construction which would affect existing users of the area.
7.3 Procurement
7.3.1 Conventional Design-Build Conventional Design-Bid-Build (DBB) procurements are commonly used to deliver public infrastructure, where requirements are clearly defined, integration risks are low, and there are specific detailed requirements and therefore limited potential for design innovation. Private contractors are selected through a competitive tender process responding to a prescriptive specification. A more permissive Design-Build (DB) model is widely used where the output requirement is clearly defined, for example a road-rail grade separation, but there may be opportunity for innovation in the detailed design
Design-Bid-Build (DBB), or traditional procurement, appears to be the most straight-forward approach to deliver the Union Station – Queens Quay Transit Link. This approach was used on Queens Quay West with several lessons learned by Waterfront Toronto, the City, and TTC.

City of Toronto Union Station – Queens Quay Transit Link Study Initial Business Case
| Final | April 1, 2019 | Arup Canada Inc.
Page 38
7.3.2 Public-Private Partnerships (PPP) PPP models include Design-Build-Finance (DBF), PPP models where contractors must finance work during construction with payment only on substantial completion. This motivates timely project completion. It also includes Design-Build-Finance-Maintain (DBFM) model that transfers responsibility for long term maintenance, and Design-Build-Finance-Operate-Maintain (DBFOM) model that also transfers responsibility for long term operations. PPP models can transfer delivery and wholelife performance risks to the contractor. To the extent these risks are transferred, specifications can be less prescriptive and more performance based. This incentivizes contractors to optimize their design and delivery approach to maximize long term benefits and minimize life cycle costs.
Given the integrated and interconnected nature of the WTN, Alternative Financing and Procurement (AFP) would be complex to arrange for the streetcar option. The complexities would arise in attempting to reach arrangements related primarily to maintenance of track and other infrastructure, and the relationship between streetcar service operated on TTC tracks and service operated on the waterfront network tracks. The APM itself could be considered for AFP because it would be largely separate from the existing WTN, with the exception of interchange facilities at Queens Quay Station, and with no shared track or maintenance facilities. Given these complexities, a traditional procurement to build the infrastructure which would then be operated by the TTC appears to be the most logical approach for the streetcar option. AFP models for financing and constructing the APM option could be more feasible.
7.3.3 Procurement structure The procurement structure for the USQQL project has not been fully defined. From an initial qualitative assessment, one approach would be to split the project into three packages:
• Union Station – including all works between Front Street and Lake Shore Boulevard. This would include the expanded station beneath the rail viaduct and associated tunnel reconfiguration(s) south of the viaduct.
• Queens Quay Station – including all associated works south of Harbour Street to Queens Quay, the new station, new tunnel beneath Queens Quay and new portal at Freeland Street.
• Surface works – including surface guideway, intersections, new Martin Goodman Trail and promenade to Parliament Street including the new streetcar loop at Parliament (as per the approved East Bayfront Transit EA).
Given that Queens Quay Station, the tunneling, portal and surface works are all closely related, it may be prudent to group the Queens Quay Station and Surface works packages.

City of Toronto Union Station – Queens Quay Transit Link Study Initial Business Case
| Final | April 1, 2019 | Arup Canada Inc.
Page 39
7.3.4 Sequencing and coordination Given the higher ridership projections on Queens Quay under the streetcar loop expansion option, it is recommended that should streetcar be the preferred option, the Union loop be expanded concurrently or prior to the completion of additional segments east and west (e.g. to the Port Lands or Humber Bay Shores). Were the loop expansion to be delayed such that the remainder of the waterfront LRT network came online before its completion, the loop would not be able to accommodate the increased demand.
It is recommended that the retrofit of Queens Quay Station be accelerated to the extent possible and that the through-track for streetcar be installed along with surface works to an interim loop at Parliament Street. This construction sequencing will allow service to continue along Queens Quay without the requirement to terminate at the Spadina loop, allowing east-west trips along the waterfront to continue to be served by LRT.
Following completion of the through-track permitting east-west operation along the waterfront, construction of the remainder of Queens Quay Station and Union Station portions of the project can occur while east-west streetcar service is resumed on Queens Quay.
Neither option permits the operation of streetcar between Queens Quay and Union Station during construction. In both cases, replacement bus service would be required between Queens Quay and Union Station for the duration of the project. Given that bus service alone is unlikely to be able to accommodate the volume of transfers at Union Station, temporary improvements to pedestrian infrastructure between Union Station and Queens Quay may also be required.
7.3.5 Industry capability The industry has significant experience designing and building surface transit infrastructure in Toronto and with the special considerations on the waterfront. The Union Station Revitalization project has provided considerable experience on building down beneath the active rail corridor. Surface transit expansion is well underway in Toronto with significant experience and lessons learned on Queens Quay West and other location sin the TTC’s extensive streetcar network. Experience and lessons learned from those projects can also be brought to bear in developing the WTN.
7.4 Operations and Maintenance The assumption throughout these studies is that WTN would be owned, operated and maintained by the TTC. It is assumed that an incremental increase in staff will be required for operations and maintenance as a factor of the growth in the number of streetcars and in overall station areas. Streetcars would be operated as per existing TTC requirements and procedures.

City of Toronto Union Station – Queens Quay Transit Link Study Initial Business Case
| Final | April 1, 2019 | Arup Canada Inc.
Page 40
Maintenance of the APM system would require specialized technicians trained on the systems, which are not currently operated by the TTC. The APM system would be operated by two staff people in an on- or off-site control room. The APM vehicles would not be staffed.
7.5 Risk management Below are some key risks associated with the deliverability of the Union Station – Queens Quay Link preferred option:
• Constructing the expanded streetcar loop will require underpinning the existing rail viaduct piers. A similar construction has recently been done as part of the Union Station Revitalization; however, it does come with cost and schedule risks.
• Construction of the expanded streetcar loop may require temporary closure of one or both of the Bay Street teamways which would result in either: significant additional pedestrian demand within the Bay Street concourse; or, temporary bridge structures to keep the teamways open during construction. Further pedestrian modelling will be required to determine impacts and mitigation.
• Property risks associated with the need to acquire portions of 1 Front Street and 141 Bay Street basements to allow for the Union loop streetcar option expansion.
• There are risks associated with utilities; subsequent phases should include SUE level B at minimum to accurately cost utility relocations.
7.6 Conclusion The Union Station – Queens Quay Transit Link is the central piece of the entire WTN without which the expansion of the remainder of the network cannot feasibly occur. The deliverability of the Link may be somewhat more challenging than typical surface LRT projects in Toronto, but risks associated with the project are well-understood. As design progresses, further detailed investigations will be required to fully understand the subsurface conditions beneath the GO rail viaduct. The following next steps are suggested:
• Advancing the design to a minimum 30% stage and updating the cost estimate to the AACE-3 or CIQS-C level, fully assessing risks with construction;
• A review of delivery options with funding partners; and,
• An assessment of the impacts to pedestrian circulation and access during construction.

Appendix A Strategic Case Materials

City of Toronto Union Station – Queens Quay Transit Link Study Initial Business Case
| Final | April 1, 2019 | Arup Canada Inc.
Page A1
A1 Billy Bishop Airport Facts8 • In 2017, Billy Bishop Toronto City Airport welcomed 2.8 million business
and leisure passengers. • With flights to more than 20 destinations in Canada and the United States, and
connections to 80 locations around the world, Billy Bishop Toronto City Airport is the ninth-busiest airport in Canada and the sixth-busiest Canadian airport serving the United States.
• Billy Bishop Airport is an important international gateway and a key driver to Toronto’s economy, accounting for $2.1 billion in economic output each year and supporting 6,500 jobs, including 1,960 directly associated with the airport operations.
• More than 90 per cent of Torontonians view Billy Bishop Airport as an asset to the City (source: August 2014 Ipsos Reid survey)
• 97 per cent of travellers who have used the airport report an overall positive experience at Billy Bishop Airport (source: August 2014 Ipsos Reid survey)
• The airport is located a convenient 2.8 kilometres from Toronto’s downtown financial district, closer than the longest runway at Toronto Pearson International Airport.
• Two world-class, award-winning commercial carriers, Porter Airlines and Air Canada, operate out of Billy Bishop Airport.
• Billy Bishop Airport is a base for air ambulance service, which flew more than 4,600 flights in 2014.
• Billy Bishop Airport is home to a sizable personal aviation community that includes two fixed-base operation facilities (FBO), approximately 50 private planes and one flight school.
• Billy Bishop Airport has a curfew that is strictly enforced and prohibits commercial aircraft from landing or taking off between the hours of 11:00 p.m. and 6:45 a.m.
• 90% of flight paths originating or destined for Billy Bishop Airport are over water. Only flight to/from Thunder Bay and Sudbury are over the city of Toronto.
• In 2017, Billy Bishop Airport officially opened its Ground Run-up Enclosure. The three-sided open-top facility accommodates commercial aircraft and is designed to dampen the noise associated with high-power aircraft engine ground run-up operations.
8 https://www.portstoronto.com/portstoronto/media-room/portstoronto-facts/billy-bishop-airport-facts.aspx, Accessed March 20 2019

City of Toronto Union Station – Queens Quay Transit Link Study Initial Business Case
| Final | April 1, 2019 | Arup Canada Inc.
Page A2
• More than one-third (37 per cent) of travellers walk, bike or take public transit to access Billy Bishop Airport.
• In 2017, Billy Bishop Toronto City Airport was recognized by the Skytrax World Airport Awards and Airport Council International’s Airport Service Quality Awards as one of North America’s top airports. The airport was also named one of the Top Ten Most Beautiful Airport Approaches by PrivateFly

City of Toronto Union Station – Queens Quay Transit Link Study Initial Business Case
| Final | April 1, 2019 | Arup Canada Inc.
Page A3
A2 Existing Transit Service Provision Current transit service is a mix of existing streetcar lines serving the west, and bus lines serving the east and north. A map of the WTN is included in Figure 8.
Figure 8: Existing Waterfront Transit Network
Bus services include:
• 6 Bay – serving Bay Street, part of Yonge and Queens Quay to Lower Sherbourne to serve the George Brown College Waterfront Campus.
• 72B Pape – serving Queens Quay East, Cherry Street and Commissioners until Carlaw.
• 75 Sherbourne – serving the George Brown Waterfront Campus and providing a connection north into the east downtown.
• 97 Yonge – serving the Yonge Street corridor from Queens Quay to Steeles Avenue.
• 510A Spadina – Serving the central waterfront on Queens Quay west to Lower Spadina Avenue.
• 509 Harbourfront – serving the central waterfront on Queens Quay west to Exhibition.
While these services provide some of the capacity needed, they will not be sufficient to support the significant transit demand projections for the waterfront network given the amount of development forecasted.

Appendix B Economic Case Materials
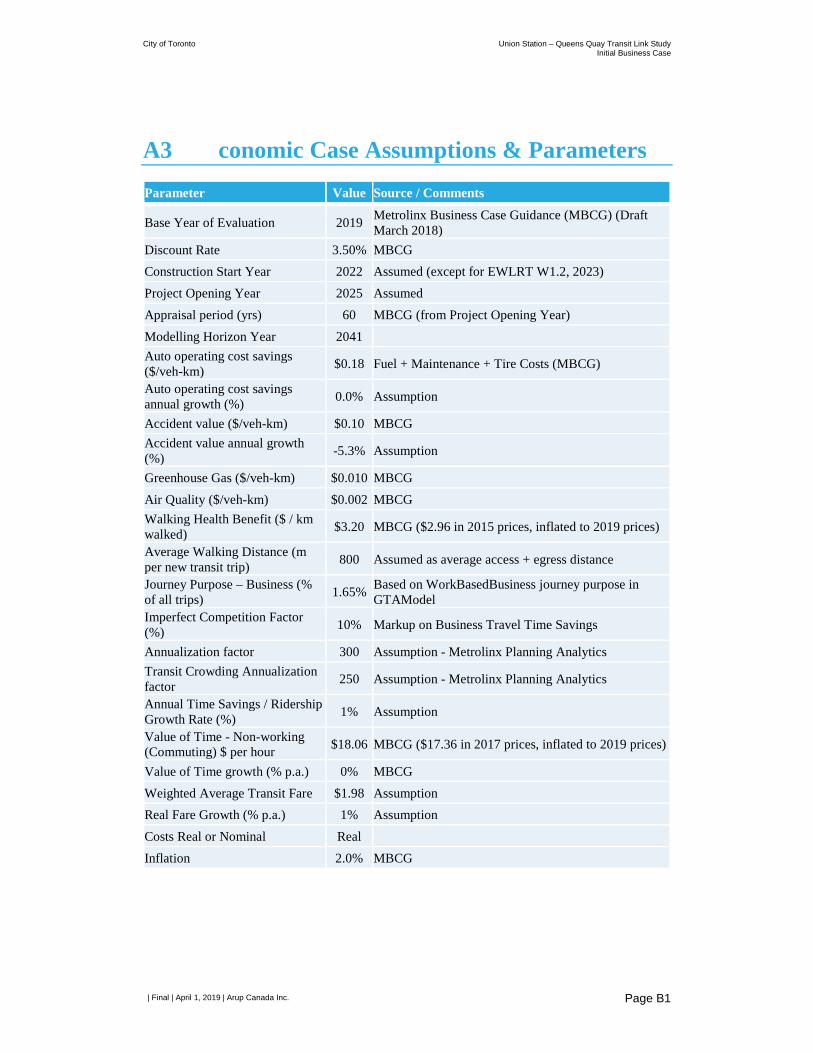
City of Toronto Union Station – Queens Quay Transit Link Study Initial Business Case
| Final | April 1, 2019 | Arup Canada Inc.
Page B1
A3 conomic Case Assumptions & Parameters Parameter Value Source / Comments
Base Year of Evaluation 2019 Metrolinx Business Case Guidance (MBCG) (Draft March 2018)
Discount Rate 3.50% MBCG Construction Start Year 2022 Assumed (except for EWLRT W1.2, 2023) Project Opening Year 2025 Assumed Appraisal period (yrs) 60 MBCG (from Project Opening Year) Modelling Horizon Year 2041
Auto operating cost savings ($/veh-km) $0.18 Fuel + Maintenance + Tire Costs (MBCG)
Auto operating cost savings annual growth (%) 0.0% Assumption
Accident value ($/veh-km) $0.10 MBCG Accident value annual growth (%) -5.3% Assumption
Greenhouse Gas ($/veh-km) $0.010 MBCG Air Quality ($/veh-km) $0.002 MBCG Walking Health Benefit ($ / km walked) $3.20 MBCG ($2.96 in 2015 prices, inflated to 2019 prices)
Average Walking Distance (m per new transit trip) 800 Assumed as average access + egress distance
Journey Purpose – Business (% of all trips) 1.65% Based on WorkBasedBusiness journey purpose in
GTAModel Imperfect Competition Factor (%) 10% Markup on Business Travel Time Savings
Annualization factor 300 Assumption - Metrolinx Planning Analytics Transit Crowding Annualization factor 250 Assumption - Metrolinx Planning Analytics
Annual Time Savings / Ridership Growth Rate (%) 1% Assumption
Value of Time - Non-working (Commuting) $ per hour $18.06 MBCG ($17.36 in 2017 prices, inflated to 2019 prices)
Value of Time growth (% p.a.) 0% MBCG Weighted Average Transit Fare $1.98 Assumption Real Fare Growth (% p.a.) 1% Assumption Costs Real or Nominal Real Inflation 2.0% MBCG

Appendix B
Financial Case Materials

City of Toronto Union Station – Queens Quay Transit Link Study Initial Business Case
| Final | April 1, 2019 | Arup Canada Inc.
Page D1
B1 Financial Case Assumptions General timeline assumptions:
• Construction start: 2022
• Construction period: 4 years
• Construction end: 2026
• Operations start: 2026
Labour force requirements Costs associated with labour force requirements are included in the O&M costs estimated in Section 6. Overall labour force requirements between the two technology options are similar and not a key differentiator between the options. This section describes the total Vehicle Revenue Hours (VRH) of each option.
Overall, the VRH of each option are similar. The streetcar option has slightly higher VRH due to requirements for one additional fleet vehicle during off-peak hours as a result of higher overall streetcar network ridership. The APM option needs one less fleet vehicle in the off-peak period. Of note, both options are subject to TTC optimization which is likely to result in a different service plan in the field.
The VRH calculations for both options are consistent with the TTC methodology for: duration of each service period, estimating fleet requirements for off-peak service based on peak AM period. AM peak period is determined by calculations which are based on peak point ridership.
Existing requirements Nine streetcars currently serve the portion of track that is constructed between Exhibition and Union loops (seven on the 509 route for the entire length and two on the 510 route). When assessing the overall future fleet requirements, these nine streetcars can be subtracted from the overall requirements as they represent vehicles which would already have been required were neither option to be constructed.
Streetcar option requirements Streetcar VRH requirements assume service between Exhibition and Parliament loops with two independent loops entering Union Station, as previously identified as the most efficient means of providing the required level of service. Overall:

City of Toronto Union Station – Queens Quay Transit Link Study Initial Business Case
| Final | April 1, 2019 | Arup Canada Inc.
Page D2
• The streetcar option requires 29 streetcars; a net increase of 20 considering the existing nine streetcars that are already serving the line.
• The VRH is 481 vehicle-hours (weekday, 1-day). Accounting for the eight existing streetcars that will operate on this route, the net additional VRH is 354 vehicle-hours.
APM option requirements APM option VRH requirements assume streetcar service between Exhibition and Parliament loops with a stop at Queens Quay Station where passengers would transfer to the APM link, as previously identified as the most efficient means of providing the required level of service. Overall:
• The APM option requires 29 streetcars; a net increase of 20 considering the existing nine streetcars that are already serving the line.
• In addition, the APM requires operators in a control room to monitor the operations of the APM (though no drivers are required in the vehicles themselves).
• The VRH is 474 vehicle-hours (weekday, 1-day), excluding APM operators. Accounting for the eight existing streetcars that will operate on this route, the net additional VRH is 347 vehicle-hours.
• It is assumed that two operators will be required, operating 20 hours per day. This is equal to 40 operator-hours. There are no additional costs associated with this because the blended operating costs assumptions for APM include the cost of these operators.
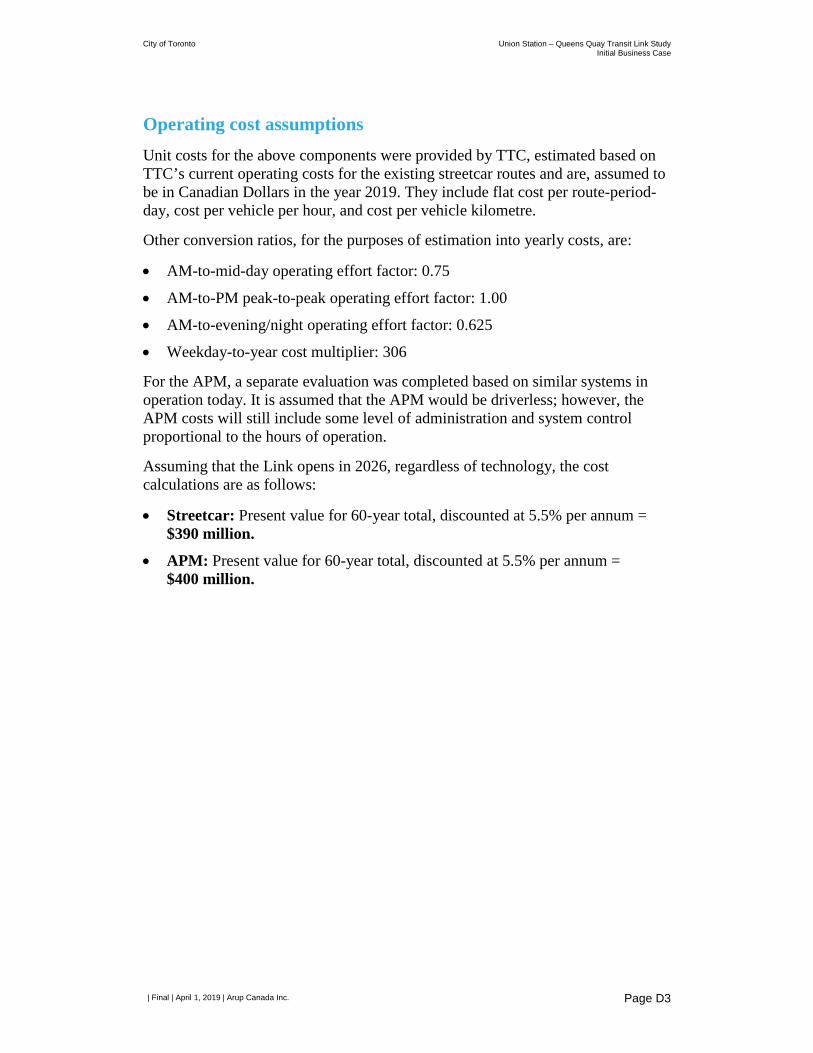
City of Toronto Union Station – Queens Quay Transit Link Study Initial Business Case
| Final | April 1, 2019 | Arup Canada Inc.
Page D3
Operating cost assumptions Unit costs for the above components were provided by TTC, estimated based on TTC’s current operating costs for the existing streetcar routes and are, assumed to be in Canadian Dollars in the year 2019. They include flat cost per route-period-day, cost per vehicle per hour, and cost per vehicle kilometre.
Other conversion ratios, for the purposes of estimation into yearly costs, are:
• AM-to-mid-day operating effort factor: 0.75
• AM-to-PM peak-to-peak operating effort factor: 1.00
• AM-to-evening/night operating effort factor: 0.625
• Weekday-to-year cost multiplier: 306
For the APM, a separate evaluation was completed based on similar systems in operation today. It is assumed that the APM would be driverless; however, the APM costs will still include some level of administration and system control proportional to the hours of operation.
Assuming that the Link opens in 2026, regardless of technology, the cost calculations are as follows:
• Streetcar: Present value for 60-year total, discounted at 5.5% per annum = $390 million.
• APM: Present value for 60-year total, discounted at 5.5% per annum = $400 million.