unintentional overdose deaths in the north carolina ... · look at the types of drugs associated...
TRANSCRIPT
No. 162 August 2010
1 State Center for Health Statistics, Division of Public Health, North Carolina Department of Health and Human Services, Raleigh, NC 2 Clinical Policy and Programs Section, Division of Medical Assistance, North Carolina Department of Health and Hum an Services, Raleigh, NC
Unintentional Overdose Deaths in the North Carolina Medicaid Population:
Prevalence, Prescription Drug Use, and Medical Care Servicesby
J. Timothy Whitmire, Ph.D.1 Glenda Waslaski Adams, Pharm.D., R.Ph.2
AbstractPurpose: Between 2000 and 2007, the unintentional overdose (UO) death rate in North Carolina more than doubled (106.3% increase). A majority of the 2007 deaths were caused by opioid analgesic use, and methadone was associated with 34.1 percent of the deaths. To gain a better understanding of unintentional overdoses, we examined medical and prescription drug paid claims among the North Carolina Medicaid population.
Methods: North Carolina UO death certificate records were linked to Medicaid enrollment and paid claim records for calendar year 2007. All 2006 and 2007 claim records were examined for the UO death and methadone prescription populations, focusing on medical care and associated costs for these two groups. Results were compared with a random sample of the Medicaid population.
Results: Of the 901 UO deaths in 2007, 301 (33.4%) were enrolled in Medicaid. Methadone was a contributing cause of death for 98 (32.6%) of the UO deaths. Of the 98 methadone-related deaths among Medicaid enrollees, only 26 (26.5%) had received a Medicaid-paid methadone prescription or methadone clinic services within one year of death.
Conclusions: The North Carolina Medicaid population experienced a much higher rate of overdose deaths than the North Carolina population. This study suggests that fatal overdose among the Medicaid population are associated with claims for mental health disorders, substance abuse, and routine medical care for pain management. Most of the methadone-related deaths among the Medicaid population did not involve a prescription for the drug, suggesting methadone was obtained by illegal or unauthorized means.

SCHS Study No. 162 ♦ August 2010 2 State Center for Health Statistics N.C. Unintentional Overdose Deaths North Carolina Division of Public Health
IntroductionUnintentional overdosea (UO) deaths have become the second leading cause of unintentional injury deaths in the United States, exceeded only by motor vehicle injuries. Current UO death rates are four to five times higher than they were during the black tar heroin epidemic of the mid-1970s and twice as high as they were during the peak of crack cocaine use in the early 1990s.1–3 An examination of UO deaths since 1990 reveals a dramatic shift, not only in the rise in UO death rates, but in the specific types of drugs associated with UO deaths.
Reports from the Centers for Disease Control and Prevention (CDC) show that during much of the 1990s, U.S. deaths increased for all types of unintentional overdoses. From 1990–2001, the U.S. unintentional and undetermined (in intent) overdose death rate increased 56 percent, from 5.0/100,000 to 7.8/100,000 in 2001.4 In a subsequent report presenting age-adjusted unintentional and undetermined overdose death rates between 1999 and 2004, a 62.5 percent increase was observed.5
North Carolina UO death rates exceed the national average.4,6 Mortality data from the State Center for Health Statistics show that between 2000 and 2007, the UO death rate increased from 4.8 to 9.9/100,000, representing a 106.3 percent change.7 The 2007 North Carolina UO death rate was higher than the death rates for hypertension, chronic liver disease and cirrhosis, homicide, and human immunodeficiency virus disease.8
Historically, unintentional overdoses in the United States have been caused primarily by illicit drugs, such as cocaine and heroin, but in the last decade prescription drugs have played a greater role in UO deaths.9–11 A closer look at the types of drugs associated with UO deaths in 2002 reveals that 36.5 percent involve prescription opioid analgesic drugs.10 Although deaths by illicit drugs have increased in recent years as well, opioid analgesics have replaced heroin and cocaine as the leading causes of UO deaths.9 Opioid analgesic deaths in the United States increased 91 percent between 1999 and 2002; and deaths due to methadone (an opioid analgesic) increased 213 percent during the same time period.10 A recent report by the National Center for Health Statistics shows that the number of deaths mentioning methadone increased 468 percent from 1999 to 2005.3
A similar increase in methadone deaths has occurred in North Carolina. Mortality data for 2000–2005 for unintentional and undetermined methadone deaths from the State Center for Health Statistics show a 240 percent
increase in the unintentional and undetermined methadone death rate.7 Sanford observed that methadone caused or contributed to 23 percent of drug deaths in 2001.6 In 2006, the percentage of drug deaths attributed to methadone increased to 32 percent. In addition, other synthetic and unspecified opioid analgesics accounted for approximately 30 percent of UO deaths and cocaine comprised another 32 percent.6 By 2007 methadone contributed to approximately one-third of poison deaths.7
Methadone has been successfully used to treat heroin addiction since the 1960s and has also been used for the treatment of prescription drug addiction. In addition, it is used as an effective analgesic for pain.12,13 The overriding public health concern is with the misuse and abuse of methadone that may lead to overdose.
Although the research literature suggests that methadone deaths have been associated with substance abuse,10,12,14 studies also suggest the rise in methadone deaths since 1990 coincides with large increases in opioid analgesic prescriptions.3,6,10 Until recently, it has been unclear to what extent methadone deaths may be attributed to substance abuse versus prescribing practices, improper taking of the medications, or diversion of methadone from the patient to someone else.3 Using multiple data sources, Hall, et al. found that among West Virginia decedents with methadone as a contributing cause of death in 2006, only 32.1 percent actually received a valid prescription for methadone.15
The objective of this study was to gain a better understanding of the prevalence, population characteristics, prescription trends, and medical care services associated with unintentional overdoses among the North Carolina Medicaid population. We focused on the Medicaid population because of the availability of medical claim data and higher prevalence of prescription opioid use among lower income and Medicaid populations.15,16 Results from this study may guide Medicaid pharmacy policy in an effort to help reduce the chances of overdose among Medicaid recipients.
MethodsAll 75,803 North Carolina resident death records for calendar year 2007 were examined for an underlying (primary) diagnosis of unintentional overdose, using the International Classification of Disease, Tenth Revision (ICD-10) codes X40–X49, “Accidental poisoning by and exposure to noxious substances.” There were 901 unintentional overdose deaths identified. Contributing cause of death fields indicating “Poisoning by drugs,

State Center for Health Statistics 3 SCHS Study No. 162 ♦ August 2010 North Carolina Division of Public Health N.C. Unintentional Overdose Deaths
medicaments, and biological substances” were identified using ICD-10 codes T36–T50. Methadone deaths were identified using the code T40.3. Age, sex, race, county of residence, education, and marital status were examined from the death certificate records.
Of the 901 UO decedents in 2007, 888 had death records that contained Social Security numbers that were used for matching to Medicaid records. Of the 888, 301 (33.4%) matched with Medicaid enrollment records during the same calendar year. From these enrollment records, Medicaid ID numbers were obtained and used to match to Medicaid paid claim records. There were 40,415 paid claims selected in 2006 and 2007 for 281 of the 301 Medicaid decedents.
Two decedent populations were examined. The UO death population consists of the 301 overall unintentional overdose deaths matched to Medicaid enrollment records. The methadone death population is a subset of the UO death population, consisting of the 98 decedents that had methadone listed as a contributing cause of death.
Living arrangements and eligibility status were drawn from the Medicaid paid claim records. Emergency department paid claims were identified using revenue procedure codes RC450–RC459. Inpatient hospital stays and prescription drug claims were identified by claim type. A rural/urban classification variable was created based on the North Carolina Accountability Regions.17 To examine drug and medical claims near the time of death, a length-of-time variable was created based on claim service dates and the date of death.
We aggregated ICD-9-CM diagnosis codes recorded on Medicaid medical paid claims to create diagnostic categories. Mental disorders were defined by primary diagnosis codes 290–303 and 306–319; drug dependence, 304–305; circulatory system, 390–459; respiratory system, 460–519; musculoskeletal and connective tissue, 710–739; and injury and poisoning, 800–999.
The North Carolina Controlled Substances Reporting System (CSRS) is a prescription drug monitoring program that captures prescriptions for controlled substances dispensed statewide.18 The CSRS was used to identify methadone prescriptions where there may have been a cash payment or payment by some other provider than Medicaid. Since the CSRS began data collection on July 1, 2007, prescription information was only obtained for 37 decedents with death dates between August and December 2007. Only Medicaid, third party, and cash transactions between July and December 2007 were captured.
To compare all paid Medicaid claims within 12 months of death for the two Medicaid death populations with the overall Medicaid population, a simple random sample of 2,500 living Medicaid participants was drawn from Medicaid eligibility records located in the North Carolina Medicaid data warehouse. Since the age and sex distributions of the Medicaid population (32% 21–64 and 60% female) in state fiscal year 200719 were significantly different (p < .001 and p <.01, respectively) from the UO population (85% 25–64 and 52.2% female), the sample was drawn using the same sex distribution as the overall UO population. In addition, the comparison sample was restricted to only those Medicaid enrollees between the ages 25 and 64 and no one from the decedent population was included in the sample. The Medicaid IDs for the comparison sample were used to select their paid claims with service dates in 2007. The data set for the comparison sample contained 143,972 paid claim records. We conducted z and t tests to check for significant differences in the means and percentages between the decedent populations and the comparison sample.
ResultsAmong the Medicaid population, the age-adjusted UO death rates was 34.9/100,000. In 2007, the North Carolina UO death rate was 9.9/100,000. Of the 901 North Carolina UO deaths identified in 2007, 301 (33.4%) were enrolled in Medicaid in 2007. Another 161 decedents (17.9%) were enrolled in Medicaid at some time during 2003–2006, but were not counted in the Medicaid group for purposes of this study.
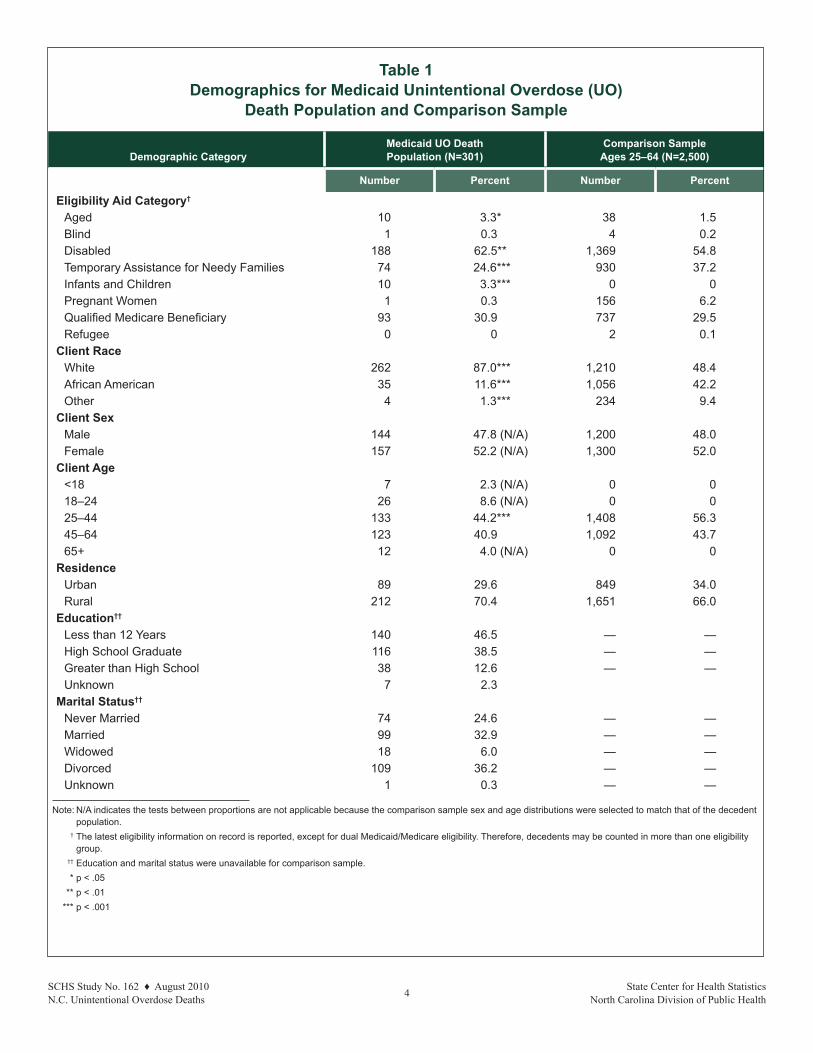
DemographicsWe compared the demographic information for the Medicaid UO death population and the comparison sample. This information is presented in Table 1. Information regarding descedent’s education and marital status were obtained from death certificate records and as such were not available for the Medicaid comparison sample.
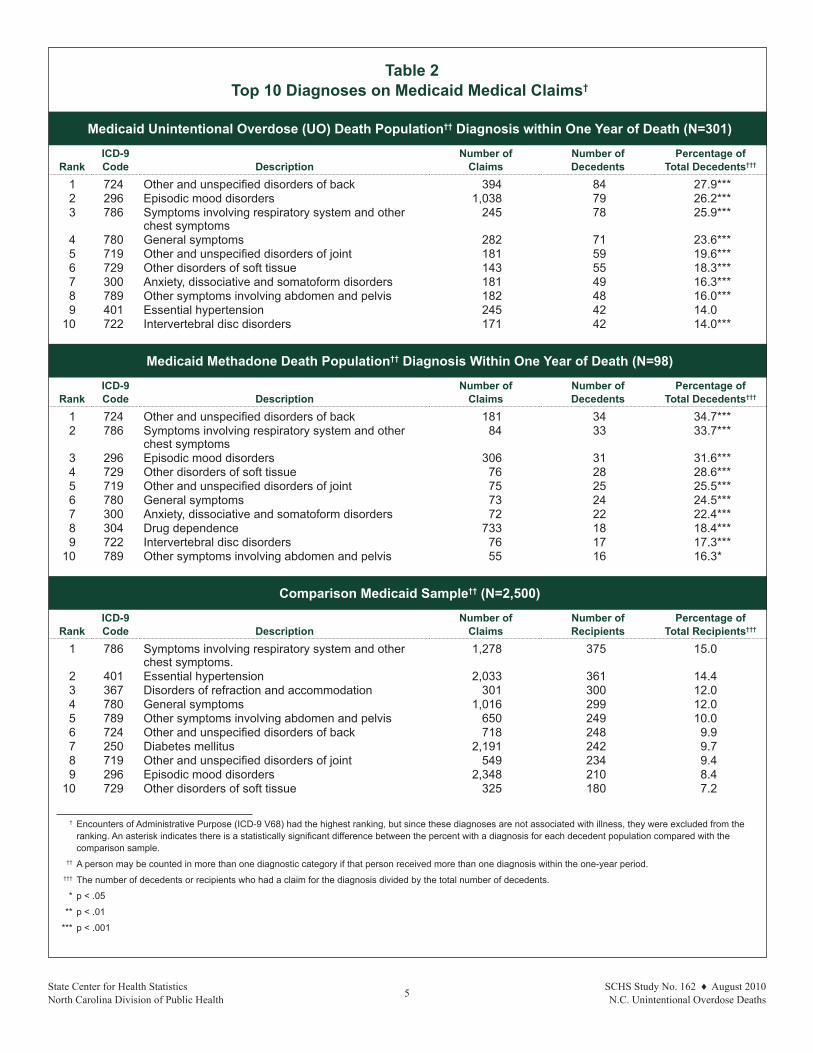
Diagnostic patternsTable 2 shows the 10 most frequent diagnoses recorded on the Medicaid paid claims within one year of death for the decedent population and recorded during 2007 for the comparison sample, along with z test results. The most frequently occurring diagnosis code was “other and unspecified disorders of the back” for the Medicaid UO population, but ranked sixth among those in the
SCHS Study No. 162 ♦ August 2010 4 State Center for Health Statistics N.C. Unintentional Overdose Deaths North Carolina Division of Public Health
Table 1 Demographics for Medicaid Unintentional Overdose (UO)
Death Population and Comparison Sample
Demographic Category
Medicaid UO Death Population (N=301)
Comparison Sample Ages 25–64 (N=2,500)
Number Percent Number Percent
Eligibility Aid Category†
Aged 10 3.3* 38 1.5Blind 1 0.3 4 0.2Disabled 188 62.5** 1,369 54.8Temporary Assistance for Needy Families 74 24.6*** 930 37.2Infants and Children 10 3.3*** 0 0Pregnant Women 1 0.3 156 6.2Qualified Medicare Beneficiary 93 30.9 737 29.5Refugee 0 0 2 0.1
Client RaceWhite 262 87.0*** 1,210 48.4African American 35 11.6*** 1,056 42.2Other 4 1.3*** 234 9.4
Client SexMale 144 47.8 (N/A) 1,200 48.0Female 157 52.2 (N/A) 1,300 52.0
Client Age<18 7 2.3 (N/A) 0 018–24 26 8.6 (N/A) 0 025–44 133 44.2*** 1,408 56.345–64 123 40.9 1,092 43.765+ 12 4.0 (N/A) 0 0
Residence Urban 89 29.6 849 34.0Rural 212 70.4 1,651 66.0
Education††
Less than 12 Years 140 46.5 — —High School Graduate 116 38.5 — —Greater than High School 38 12.6 — —Unknown 7 2.3
Marital Status††
Never Married 74 24.6 — —Married 99 32.9 — —Widowed 18 6.0 — —Divorced 109 36.2 — —Unknown 1 0.3 — —
Note: N/A indicates the tests between proportions are not applicable because the comparison sample sex and age distributions were selected to match that of the decedent population.
† The latest eligibility information on record is reported, except for dual Medicaid/Medicare eligibility. Therefore, decedents may be counted in more than one eligibility group.
†† Education and marital status were unavailable for comparison sample. * p < .05 ** p < .01 *** p < .001
State Center for Health Statistics 5 SCHS Study No. 162 ♦ August 2010 North Carolina Division of Public Health N.C. Unintentional Overdose Deaths
Table 2 Top 10 Diagnoses on Medicaid Medical Claims†
Medicaid Unintentional Overdose (UO) Death Population†† Diagnosis within One Year of Death (N=301)
RankICD-9 Code Description
Number of Claims
Number of Decedents
Percentage of Total Decedents†††
1 724 Other and unspecified disorders of back 394 84 27.9***2 296 Episodic mood disorders 1,038 79 26.2***3 786 Symptoms involving respiratory system and other
chest symptoms 245 78 25.9***
4 780 General symptoms 282 71 23.6***5 719 Other and unspecified disorders of joint 181 59 19.6***6 729 Other disorders of soft tissue 143 55 18.3***7 300 Anxiety, dissociative and somatoform disorders 181 49 16.3***8 789 Other symptoms involving abdomen and pelvis 182 48 16.0*** 9 401 Essential hypertension 245 42 14.0
10 722 Intervertebral disc disorders 171 42 14.0***
Medicaid Methadone Death Population†† Diagnosis Within One Year of Death (N=98)
RankICD-9 Code Description
Number of Claims
Number of Decedents
Percentage of Total Decedents†††
1 724 Other and unspecified disorders of back 181 34 34.7***2 786 Symptoms involving respiratory system and other
chest symptoms84 33 33.7***
3 296 Episodic mood disorders 306 31 31.6***4 729 Other disorders of soft tissue 76 28 28.6***5 719 Other and unspecified disorders of joint 75 25 25.5***6 780 General symptoms 73 24 24.5***7 300 Anxiety, dissociative and somatoform disorders 72 22 22.4***8 304 Drug dependence 733 18 18.4***9 722 Intervertebral disc disorders 76 17 17.3***
10 789 Other symptoms involving abdomen and pelvis 55 16 16.3*
Comparison Medicaid Sample†† (N=2,500)
RankICD-9 Code Description
Number of Claims
Number of Recipients
Percentage of Total Recipients†††
1 786 Symptoms involving respiratory system and other chest symptoms.
1,278 375 15.0
2 401 Essential hypertension 2,033 361 14.43 367 Disorders of refraction and accommodation 301 300 12.04 780 General symptoms 1,016 299 12.05 789 Other symptoms involving abdomen and pelvis 650 249 10.06 724 Other and unspecified disorders of back 718 248 9.97 250 Diabetes mellitus 2,191 242 9.78 719 Other and unspecified disorders of joint 549 234 9.49 296 Episodic mood disorders 2,348 210 8.4
10 729 Other disorders of soft tissue 325 180 7.2
† Encounters of Administrative Purpose (ICD-9 V68) had the highest ranking, but since these diagnoses are not associated with illness, they were excluded from the ranking. An asterisk indicates there is a statistically significant difference between the percent with a diagnosis for each decedent population compared with the comparison sample.
†† A person may be counted in more than one diagnostic category if that person received more than one diagnosis within the one-year period.
††† The number of decedents or recipients who had a claim for the diagnosis divided by the total number of decedents.
* p < .05
** p < .01
*** p < .001

SCHS Study No. 162 ♦ August 2010 6 State Center for Health Statistics N.C. Unintentional Overdose Deaths North Carolina Division of Public Health
comparison sample. Drug dependence ranked eighth (18.4% of decedents) among the methadone death population and ranked 48th (2.3%) among those in the comparison sample. All percentages for the decedent populations were significantly different from the percentages for the comparison sample with the exception of essential hypertension.
In Table 3, individual diagnoses were grouped into broader diagnostic categories and are presented for the UO death population, the Methadone death population (as subset of the UO deaths), and the comparison sample. The percentages for the comparison sample are for one or more diagnoses in the category on a medical claim in 2007. The decedent populations had higher percentages for every diagnosis category shown in the table. Furthermore, all decedent percentages were significantly different from the percentages for the comparison sample at the p < .001 significance level, with the exception of the circulatory system category for the methadone death population.
Prescription drug patternsTable 4 presents the percentages and z test results for the 10 most frequently prescribed Medicaid-paid prescription drugs. For the UO death population and methadone death population, this includes Medicaid drug claims paid within one year of death. For the comparison sample, the 10 most frequent prescription drugs paid by Medicaid in 2007 are presented. See Appendix A for information regarding the brand name and therapeutic class for all generic drugs listed in Table 4.
Prescription trends show hydrocodone is the leading prescription and alprazolam ranks second for both decedent populations. Results show 36.5 percent of the UO death population and 43.9 percent of the methadone death population received a prescription for hydrocodone/acetaminophen in the year prior to death. For the comparison sample it was 20.6 percent. Results also showed that 30.9 percent of the UO death population and 37.8 percent of the methadone death population received a prescription for oxycodone/acetaminophen, compared to 15.1 percent of the comparison sample.
Additionally, we grouped Medicaid-paid prescriptions with clinical methadone administration to examine the burden of authorized use of methadone within Medicaid. We found that among the 98 methadone death population, only 26 (26.5%) received a Medicaid-paid prescription for methadone or received a Medicaid-paid methadone administration within one year of death. A review of Medicaid medication history showed that of the 26 methadone decedents, eight (30.7%) had a Medicaid-paid claim for methadone drug services (HCPCS code H0020) and 15 (57.7%) had a methadone prescription filled within 34 daysb of death. Also within 34 days of death, 21 (80.7%) were prescribed anti-anxiety medications, 13 (50.0%) were prescribed antidepressants, 12 (46.2%) had other narcotics prescriptions, 11 (46.3%) were prescribed antipsychotics, nine (34.6%) muscle relaxants, and eight (30.7%) anticonvulsants. Four (15.4%) decedents had a dual eligibility status and may have had other drug claims paid by Medicare that are not reflected in the above prescription patterns.
Table 3 Percentage of Unintentional Overdose (UO) Death Population and
Comparison Sample with Medical Claims within One Year by Select Diagnosis Groups
ICD-9 CM Class UO Death Population
(N=301Methadone Death Population
(N=98)Comparison Sample
(N=2,500)
Number Percent Number Percent Number Percent
Musculoskeletal 130 43.2*** 52 53.1*** 623 24.9Mental Disorders† 125 41.5*** 47 48.0*** 525 21.0Injury and Poisoning 108 35.9*** 45 45.9*** 397 15.9Respiratory System 94 31.2*** 34 34.7*** 497 19.9Circulatory System 90 29.9*** 25 25.5 500 20.0Drug Dependence 47 15.6*** 23 23.5*** 91 3.6
† Excludes drug dependence.
* p < .05
** p < .01
*** p < .001

State Center for Health Statistics 7 SCHS Study No. 162 ♦ August 2010 North Carolina Division of Public Health N.C. Unintentional Overdose Deaths
Table 4 10 Most Commonly Prescribed Drugs†
Unintentional Overdose Death Population Prescriptions within One Year of Death (N=301)
Rank Generic Drug Number of Claims Number of Decedents Percentage of Deaths††
1 Hydrocodone/Acetaminophen 701 110 36.5***2 Alprazolam 811 101 33.6***3 Oxycodone/Acetaminophen 416 93 30.9***4 Clonazepam 521 76 25.2***5 Diazepam 302 50 16.6***6 Quetiapine Fumarate 284 47 15.6***7 Zolpidem Tartrate 220 44 14.6***8 Promethazine 136 41 13.6***9 Cyclobenzaprine 98 38 12.6***
10 Lorazepam 186 37 12.3***
Methadone Death Population Prescriptions within One Year of Death (N=98)
Rank Generic Drug Number of Claims Number of Decedents Percentage of Deaths††
1 Hydrocodone/Acetaminophen 240 43 43.9***2 Alprazolam 334 40 40.8***3 Oxycodone/Acetaminophen 165 37 37.8***4 Clonazepam 238 35 35.7***5 Methadone 141 18 18.4***6 Promethazine 64 18 18.4***7 Quetiapine Fumarate 106 18 18.4***8 Zolpidem Tartrate 93 17 17.3***9 Diazepam 84 16 16.3***
10 Trazodone 72 16 16.3***
Medicaid Comparison Sample Prescriptions within CY 2007 (N=2,500)
Rank Generic Drug Number of Claims Number of Recipients Percentage of Population††
1 Hydrocodone/Acetaminophen 1,821 514 20.62 Oxycodone/Acetaminophen 1,172 377 15.13 Ibuprofen 463 269 10.84 Azithromycin 283 212 8.55 Omeprazole 684 203 8.16 Alprazolam 1,249 189 7.67 Amoxicillin Trihydrate 255 187 7.58 Clonazepam 1,085 164 6.69 Promethazine 336 162 6.5
10 Cyclobenzaprine 339 156 6.2
† Decedents and those in the Medicaid comparison sample may be counted in more than one drug category if they were prescribed more than one drug type during the time period.
†† The number of decedents or recipients who had a claim for a drug divided by the total number of decedents.
* p < .05
** p < .01
*** p < .001

SCHS Study No. 162 ♦ August 2010 8 State Center for Health Statistics N.C. Unintentional Overdose Deaths North Carolina Division of Public Health
For the 37 Methadone decedents that we were able to match to the CSRS, Medicaid prescription profiles were compared with CSRS data. No additional methadone prescriptions were found in the CSRS for these 37 decedents, indicating that there were no cash or third-party transactions and all of the methadone prescriptions during July through December 2007 were billed to Medicaid.
Medical servicesWe examined the types of medical services used among those who had paid claims within one year of death. Medicaid services for decedent population and comparison sample are presented (with t test results) in Table 5. Among those who received any Medicaid service, the average cost of Medicaid claims per person was $12,653 for the UO death population, $13,266 for the methadone death population, and $9,771 for the comparison sample. On average, there were approximately 104 paid claims within one year of death for the UO death population, 114 paid claims for the methadone death population, and 58
paid claims in 2007 for the comparison sample.
Among those who received any Medicaid services, 88 percent of the UO death population and 92 percent of the methadone death population received one or more Medicaid-paid prescription drugs within one year of death, compared with 68 percent of the comparison sample receiving one or more Medicaid-paid prescription drugs in 2007. The average cost of prescription drugs per person was much higher among the decedent populations than among the comparison sample. The average annual amount paid for prescriptions was $2,831 for the methadone death population, $3,484 for the UO death population, and $1,753 for the comparison sample.
Among those who received any Medicaid service, 80.3 percent of the UO death population, 84.1 percent of the methadone death population, and 41.6 percent of the comparison sample had one or more emergency department visits within the year. The average number of emergency department visits for the decedent population
Table 5 Use of Medicaid Medical Services
Unintentional Overdose Death Population†
Methadone Death Population†
Comparison Sample
Total ServicesTotal number of persons with claims†† 274 (91.0%) 88 (89.8%) 2,500 (100%)†††
Average number of claims per person with a claim 103.9*** 113.5*** 57.5Average cost per person with a claim $12,653*** $13,253* $9,771
PrescriptionsTotal number of persons with drug claims 240 (87.6%) 81 (92.0%) 1,702 (68.0%)Average number of prescriptions per person with a claim 41*** 45*** 25Average drug cost per person with a claim $2,831*** $3,484*** $1,753
Emergency Department (ED) VisitsTotal number of persons with ED visit 220 (80.3%) 74 (84.1%) 1,040 (41.6%)Average number of ED visits per person with a claim 5.0*** 5.0*** 2.6Average ED cost per person with a claim $562*** $657*** $299
Inpatient Hospital StaysTotal number of persons hospitalized 84 (30.5%) 30 (34.1%) 421 (16.8%)Average number of hospitalizations per person with a claim 2.2*** 2.1** 1.5Average hospital cost per person with a claim $11,140 $11,503 $9,400
† Total use of Medicaid-paid services within one year of death. †† The number of decedents who had one or more Medicaid-paid claims in 2007. ††† Unlike the decedent populations which were matched to eligibility, the comparison sample was selected from the Medicaid claims. * p < .10 ** p < .05 *** p < .01

State Center for Health Statistics 9 SCHS Study No. 162 ♦ August 2010 North Carolina Division of Public Health N.C. Unintentional Overdose Deaths
was 5.0, versus an average of 2.5 for the comparison sample.
The rates for inpatient hospitalization among the decedent populations were also much higher than the comparison sample. The UO death population had an average of 2.2 hospital stays within the year before death and the methadone death population had an average of 2.1 stays, versus 1.5 for the comparison sample in 2007. Average costs of inpatient hospitalization per person were $11,140 for the UO death population, $11,503 for the methadone death population, and $9,400 for the comparison sample.
Discussion
Implications of resultsThe Medicaid population represented approximately 20 percent of the overall state population in 2007, but it experienced one-third of the unintentional overdose deaths. Consistent with the overall North Carolina population in 2007, about one-third of the UO deaths could be attributed to methadone. Medicaid decedent populations had about twice the average number of emergency department visits, higher than average inpatient hospital stays, and higher than average numbers of prescriptions filled than the comparison sample.
Those who died from unintentional overdoses received more Medicaid-paid services for drug dependence, mental disorders, joint and back disorders, diseases of the musculoskeletal system and soft tissue, and diseases of the respiratory and circulatory system than the comparison sample. Diagnoses for mental disorders occurred at about twice the rate for the UO death population than in the comparison sample. Several of the drugs on the Top 10 list for the decedent populations were for the treatment of mental health disorders, such as anxiety. Findings for diagnoses also suggest that substance abuse may be associated with unintentional overdose deaths.
With the emphasis that has been given in the literature to the problem of methadone overdose by legitimate prescriptions, one unexpected finding was that only around one-fourth of the Medicaid decedents that had methadone as a contributing cause of death on the death certificate were found to have a Medicaid-paid prescription for methadone or received Medicaid-paid methadone clinic services. Based on our match of Medicaid UO decedents with the Controlled Substance Reporting System data, it appears that a large proportion of the methadone
deaths occurred as a result of taking methadone that was unauthorized or purchased illegally. We do acknowledge that we were unable to capture any authorized prescriptions that may have occurred prior to the July 1, 2007 CSRS start date.
LimitationsOne limitation of the study was that the number of deaths caused by unintentional overdose could have been undercounted because, in some cases, the cause of death may be pending an autopsy from the Office of the Chief Medical Examiner (OCME). The annual vital statistics death files produced by the State Center for Health Statistics are updated for at least six months following the file year and are closed out thereafter. In contrast, the OCME files are never closed and may be updated at any time. Consequently, there may be 2007 deaths that were determined to be unintentional overdoses at a later point in time and not captured in the present study.
There were trade-offs in setting the cut-offs for the examination of prescription and medical services away from the date of death. Frequently occurring prescriptions were also examined within one month of the date of death. Although the ranking was slightly different than what was observed at one year, only carisoprodol and pregabalin dropped from the 10 most frequently occurring prescriptions at one year.
Given the sharp rise in the methadone death rates over the past few years, we decided to focus on methadone in the current study. Other opioid analgesics, such as hydrocodone and oxycodone, continue to be of public health concern because of the level of abuse and occurrences of overdose, and warrant further study.20,21 Oxycodone was also prescribed at high rates among our decedent populations. Further research needs to examine the relationship between oxycodone use and unintentional overdose deaths.
Policy implicationsNumerous studies have shown a rise in unintentional overdose death rates in the United States that coincides with a large increase in opioid analgesic prescriptions.9–11 The present study of North Carolina Medicaid decedent populations suggests that opioid analgesic overdoses may be more closely associated with substance abuse and mental health disorders than with routine medical care for pain management. However, given the complexity of the problem, a broader set of prevention strategies

SCHS Study No. 162 ♦ August 2010 10 State Center for Health Statistics N.C. Unintentional Overdose Deaths North Carolina Division of Public Health
are needed. The North Carolina Drug Overdose Task Force has recognized this complexity and outlines 24 recommendations across seven categories.22 As outlined by the North Carolina Drug Overdose Task Force, comprehensive prevention programs which merge the efforts of law enforcement, mental health, public health, and medical community organizations are urgently needed. Unintentional overdose death rates may be reduced to some extent by educating the general public about the dangers of taking drugs and educating prescribers about following opioid treatment guidelines.
Notes a Unintentional overdose deaths described in this
report are the result of accidental overdose of drugs, medicaments, and biological substances as defined by the International Classification of Diseases, Ninth Revision codes ‘960’–‘979’ and International Classification of Diseases Tenth Revision codes ‘X40’–‘X49.’ Leonard Paulozzi, of the National Center for Injury Prevention and Control, provided a definition of these overdoses in a 2007 testimony before the U.S. Congress, describing poisonings as, “. . . any substance that is harmful to your body when ingested (eaten), inhaled (breathed), injected, or absorbed through the skin. Any substance, taken in excess, including a prescription drug, can be a poison. Therefore the CDC categorizes drug overdoses as drug poisonings. Drug overdose does not include adverse reactions to medications taken in correct amounts.” (Source: Paulozzi, 2007.)5
b A 34-day window was examined because a Medicaid recipient may get up to a 34-day supply of a medication each month.
References 1. Paulozzi L. Medical Epidemiologist, National Center
for Injury Prevention and Control, Centers for Disease Control and Prevention. CDC Congressional Testimony, “Statement on Trends in Unintentional Poisoning Deaths” before the United States Senate Subcommittee on Crime & Drugs Committee on the Judiciary and the Caucus on International Narcotics Control. March 12, 2008. www.hhs.gov/asl/testify/2008/03/t20080312b.html.
2. Paulozzi L. Medical Epidemiologist, National Center for Injury Prevention and Control, Centers for Disease Control and Prevention. Statement on, “Trends in Unintentional Poisoning Deaths” before the House Energy and Commerce Oversight and
Investigations, U.S. House of Representatives. October 24, 2007. www.hhs.gov/asl/testify/2007/10/t20071024a.html.
3. Fingerhut LA. Increases in poisoning and methadone-related deaths: United States, 1999–2005. National Center for Health Statistics. Health E-Stats. Last modified, July 31, 2008. www.cdc.gov/nchs/data/hestat/poisoning/poisoning.pdf.
4. Singleton M, et. al. Unintentional and undetermined poisoning deaths—11 states, 1990–2001. Morbidity and Mortality Weekly Report. 2004;53(11):233–8. www.cdc.gov/mmwr/preview/mmwrhtml/mm5311a2.htm.
5. Paulozzi L. Unintentional poisoning deaths—United States, 1999–2004. Morbidity and Mortality Weekly Report. 2007;56(05):93–6. www.cdc.gov/mmwr/preview/mmwrhtml/mm5605a1.htm.
6. Sanford C. An unrelenting epidemic of deaths from prescription drugs in North Carolina. North Carolina Medical Board Forum, 2008;2:4–7.
7. North Carolina Department of Health and Human Services, Division of Public Health, State Center for Health Statistics. Electronic death record files.
8. State Center for Health Statistics. North Carolina Vital Statistics 2007 Leading Causes of Death: Volume 2. 2008.
9. Paulozzi L, Xi Y. Recent changes in drug poisoning mortality in the United States by urban-rural status and by drug type. Pharmacoepidemiology and Drug Safety. 2008;DOI:10.1002/pds.1626.
10. Paulozzi L, Budnitz D, Xi Y. Increasing deaths from opioid analgesics in the United States. Pharmacoepidemiology and Drug Safety. 2006;15:618–27.
11. Paulozzi LJ, Ryan GW. Opioid analgesics and rates of fatal drug poisoning in the United States. American Journal of Preventive Medicine. 2006;31(6):506–11.
12. Meldrum ML. A capsule history of pain management. Journal of the American Medical Association. 2003;290(18):2470–5.
13. Trick M. State issue brief on methadone overdose deaths. The National Association of State Alcohol and Drug Abuse Directors, Inc. June 2007. www.nasadad.org/resource.php?base_id=1159.
14. Paulozzi LJ, Logan JE, Hall AJ, McKinstry E, Kaplan JA, Crosby AE. A comparison of drug overdose deaths involving methadone and other opioid analgesics in West Virginia. Addiction. 2009;104(9):1541–8.
15. Hall AJ, Logan JE, Tobin RL, Kaplan JA, Kraner JC, Bixler D, Crosby AE, Paulozzi LJ. Patterns of abuse among unintentional pharmaceutical overdose fatalities. Journal of the American Medical Association. 2008;300(22):2613–20.

State Center for Health Statistics 11 SCHS Study No. 162 ♦ August 2010 North Carolina Division of Public Health N.C. Unintentional Overdose Deaths
16. Department of Health and Human Services. National survey on drug use and health: National findings. Substance Abuse and Mental Health Services Administration. Office of Applied Studies. September 2006. www.oas.samhsa.gov/nsduh/2k5nsduh/2k5results.htm.
17. North Carolina Department of Health and Human Services, Division of Public Health, Office of North Carolina Healthy Carolinians. www.healthycarolinians.org/objectives/userGuide/definitions.aspx.
18. North Carolina Controlled Substances Reporting System, North Carolina Division of Mental Health, Developmental Disabilities and Substance Abuse Services. www.dhhs.state.nc.us/MHDDSAS/controlledsubstance/index.htm.
19. North Carolina Department of Health and Human Services, Division of Medical Assistance. Medicaid in North Carolina: Annual report state fiscal year 2007. www.dhhs.state.nc.us/DMA/2007report/2007report.pdf.
20. Cicero TJ, Inciardi JA, Munoz A. Trends in abuse of OxyContin and other opioid analgesics in the United States: 2002–2004. The Journal of Pain. 2005;662–72.
21. Zee AV. The promotion and marketing of OxyContin: commercial triumph, public health tragedy. American Journal of Public Health. 2009;99:221–7.
22. North Carolina Department of Health and Human Services, Division of Public Health, Injury and Violence Prevention Branch. Findings and recommendations of the task force to prevent deaths from unintentional drug overdoses in North Carolina, 2003. April, 2004.
Appendix A Commonly Prescribed Drugs from Table 4
with Associated Brand Names and Therapeutic Class
Generic Name Brand Name Therapeutic Class
Alprazolam Xanax Benzodiazepine AntianxietyAmoxicillin Amoxil, Trimox Penicillin Anti-infectiveAzithromycin Zithromax Macrolide Anti-infectiveClonazepam Klonopin Benzodiazepine AntianxietyCarisoprodol Soma Muscle RelaxantCyclobenzaprine Flexeril, Flexmid, Amrix Muscle RelaxantDiazepam Valium Benzodiazepine AntianxietyHydrocodone/Acetaminophen Vicodin, Lortab, Anexsia, Norco, Zydone Opioid AnalgesicIbuprofen Motrin Nonsteroidal Anti-inflammatoryLorazepam Ativan Benzodiazepine AntianxietyMethadone Methadose, Dolophine Opioid AnalgesicOmeprazole Prilosec Proton Pump Inhibitor, Gastrointestinal AgentOxycodone/Acetaminophen Percocet, Roxicet, Tylox Opioid AnalgesicPregabalin Lyrica Anticonvulsant/FibromyalgiaPromethazine Phenergan AntinauseaQuetiapine Fumarate Seroquel Atypical AntipsychoticTrazodone Desyrel AntidepressantZolpidem Tartrate Ambien Sedative Hypnotic
Acknowledgments
The authors would like to thank the following people for their very helpful contributions: T. Stephen Jones, M.D., M.P.H., Retired, Centers for Disease Control and Prevention; Kathleen Jones-Vessey, M.S., Dorothee Schmid, M.S., Paul Buescher, Ph.D., Donald R. Akin, M.S., Pedro Luna-Orea, Ph.D., and Karen L. Knight, M.S. of the State Center for Health Statistics; Lisa Weeks, D.Pharm. of the Pharmacy Section, North Carolina Division of Medical Assistance; Scott Proescholdbell, M.P.H. of the Injury and Violence Prevention Branch, North Carolina Division of Public Health; John Womble, North Carolina Controlled Substances Reporting System.

Department of Health and Human Services State Center for Health Statistics 1908 Mail Service Center Raleigh, NC 27699-1908 919-733-4728
State of North Carolina
Beverly Eaves Perdue, Governor
Department of Health and Human ServicesLanier M. Cansler, Secretary
www.ncdhhs.gov
Division of Public HealthJeffrey P. Engel, M.D., State Health Director
www.ncpublichealth.com
Chronic Disease and Injury SectionRuth Petersen, M.D., M.P.H., Chief
State Center for Health StatisticsKaren L. Knight, M.S., Director
www.schs.state.nc.us/SCHS
The North Carolina Department of Health and Human Services does not discriminate on the basis of race, color, national origin, sex, religion, age, or disability in employment or the provision of services. 08/10