ungulate harvest and population trend data in areas of washington … · ungulate harvest and...
TRANSCRIPT
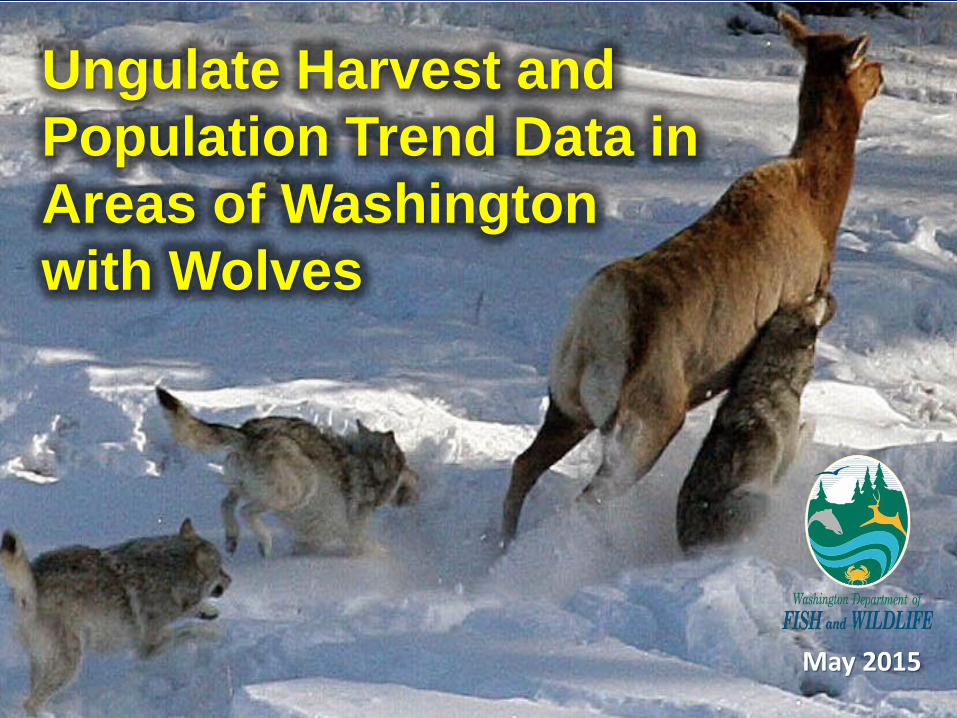
May 2015
Ungulate Harvest and
Population Trend Data in
Areas of Washington
with Wolves

Can Wolves Impact Prey Numbers?
Yes, there are examples where wolves have caused or contributed to declines in prey numbers. However, in most areas, wolves were not the limiting factor for prey abundance.
Wolf impacts on ungulates is a concern for hunters and rural communities
2

3
The potential impacts of wolves to Washington’s ungulate species was considered in the development of the Wolf Conservation and Management Plan.
The Plan discusses wolf predation and the potential resulting management of wolves in page 116.
Washington Wolf Conservation and Management Plan
Washington’s wolf plan has a strategy that allows the state to address wolf impacts to “at risk” deer,
elk, moose, or other ungulates.
WDFW could consider reducing wolf abundance in the localized area occupied by the ungulate population if wolf predation is found to be a
primary limiting factor
4
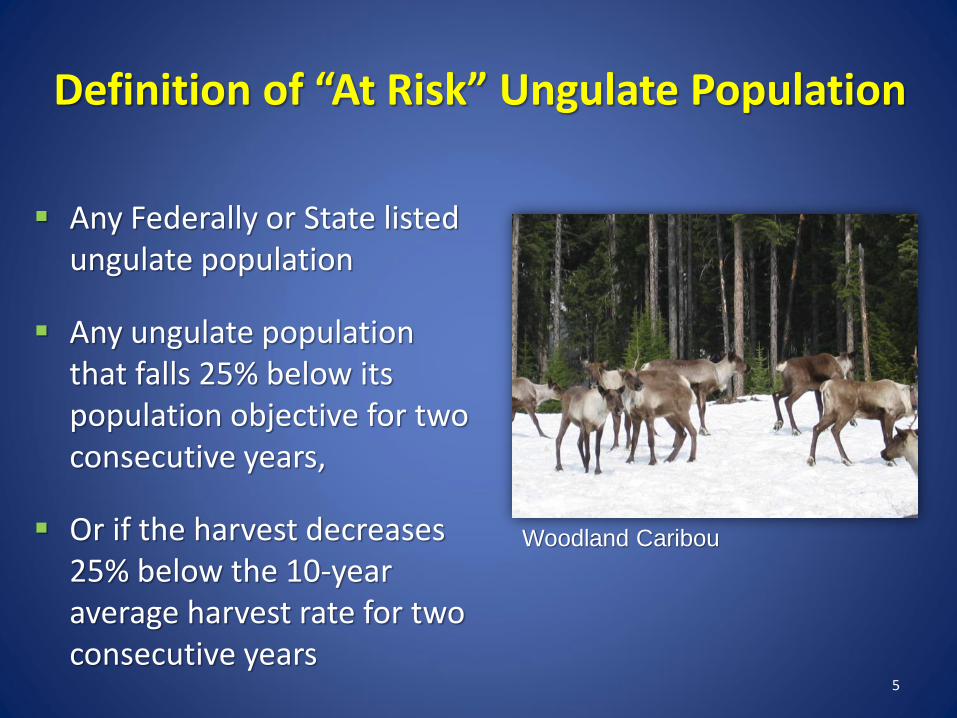
Definition of “At Risk” Ungulate Population
Any Federally or State listed ungulate population
Any ungulate population that falls 25% below its population objective for two consecutive years,
Or if the harvest decreases 25% below the 10-year average harvest rate for two consecutive years
5
Woodland Caribou

How will we know if there is a decline in an ungulate population?
Monitor Ungulates
• Population estimates
• Indexes
• Composition counts
• Harvest trends
6
Blue Mountains elk survey
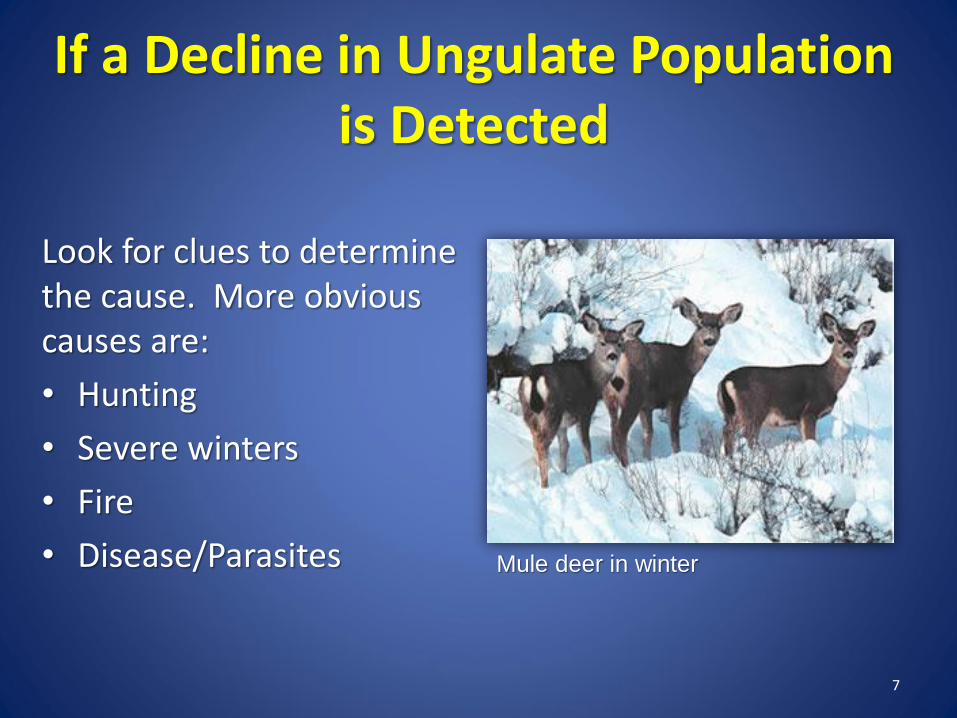
If a Decline in Ungulate Population is Detected
Look for clues to determine the cause. More obvious causes are:
• Hunting
• Severe winters
• Fire
• Disease/Parasites
7
Mule deer in winter

Less obvious causes are:
• Drought
• Changes in habitat
• Changes in vulnerability
• Predation effects
8
Cougar predation
If a Decline in Ungulate Population is Detected

9
• Look at ungulate trends in surrounding areas
• Look at subtle weather patterns
• Intensify prey surveys
• Look for a change in survival rates of young or female prey
Cow and calf elk
If a Decline in an Ungulate Population is Detected

• Assess the available scientific information
• Conduct risk assessment
• If warranted, define appropriate wolf removal action
• Conduct public review of the proposed removal action
• Implement wolf removal
• Monitor results to prey and wolf population
10
If a Decline is Detected and Predation is the Suspected Cause?
Elk capture
Wolf Status
11
12
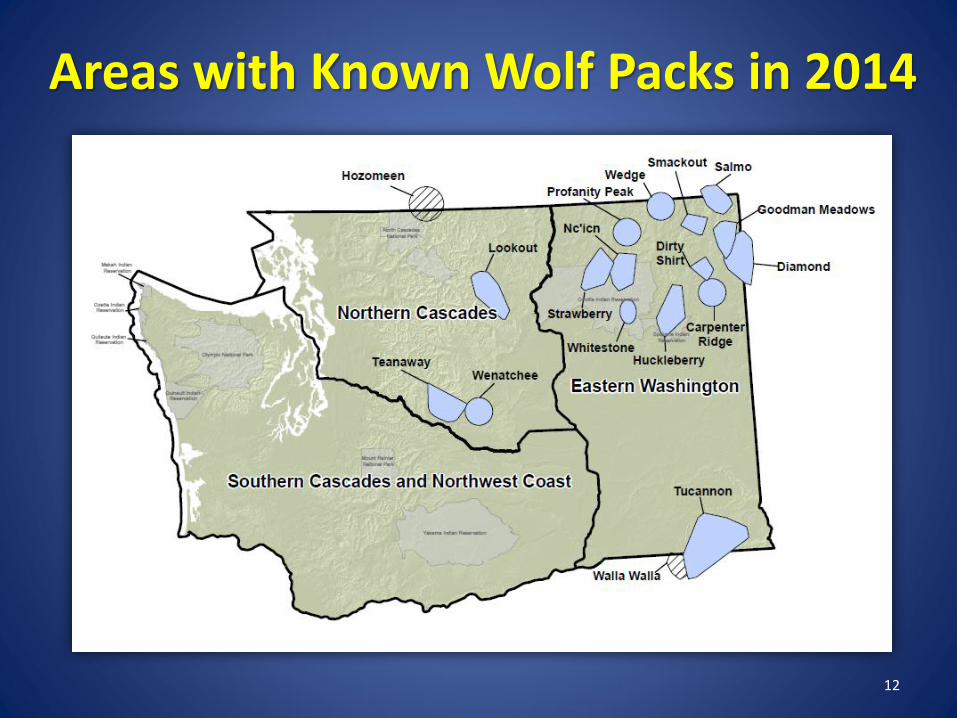
Areas with Known Wolf Packs in 2014

13
At least 54 wolves
At least
12 wolves
At least
2 wolves

14
Minimum Number of Wolves Expect population to continue increasing
Deer, Elk, and Moose Status in Areas with Wolves
Northeastern Washington
15
Information From Collaborative Ungulate Research in Washington
• Moose abundance, distribution, and demographic characteristics in eastern Washington: Univ. of Montana: http://wdfw.wa.gov/publications/01699/
• NE White-tailed deer habitat use, movements, and mortality rates: Univ. of Montana
• NE White-tailed deer abundance: WDFW
• Predation impacts on mule deer and white-tailed deer populations: Univ. of Washington
16

Buck Harvest in Core GMUs with Wolves GMUs 101 – 121
17

18
0
1,000
2,000
3,000
4,000
5,000
6,000
7,000
20
07
20
08
20
09
*
20
10
20
11
**
20
12
20
13
20
14
De
er H
arve
st
Buck Harvest
Buck harvest
declined significantly
after two hard
winters in 2007 &
2008
In 2011 a four point
buck restriction was
implemented in the
two largest units
(117 & 121)
The first wolf pack
was documented in
2009 and there
were twelve in 2014
Buck Harvest in Core GMUs with Wolves GMUs 101 – 121

Causes of Mortality in White-tailed Deer GMUs 101-121
19
0
1
2
3
4
5
6
Cougar Domestic Dog Undetermined Capture Related Auto Collision
Cause of death of radio-marked adult female deer

20
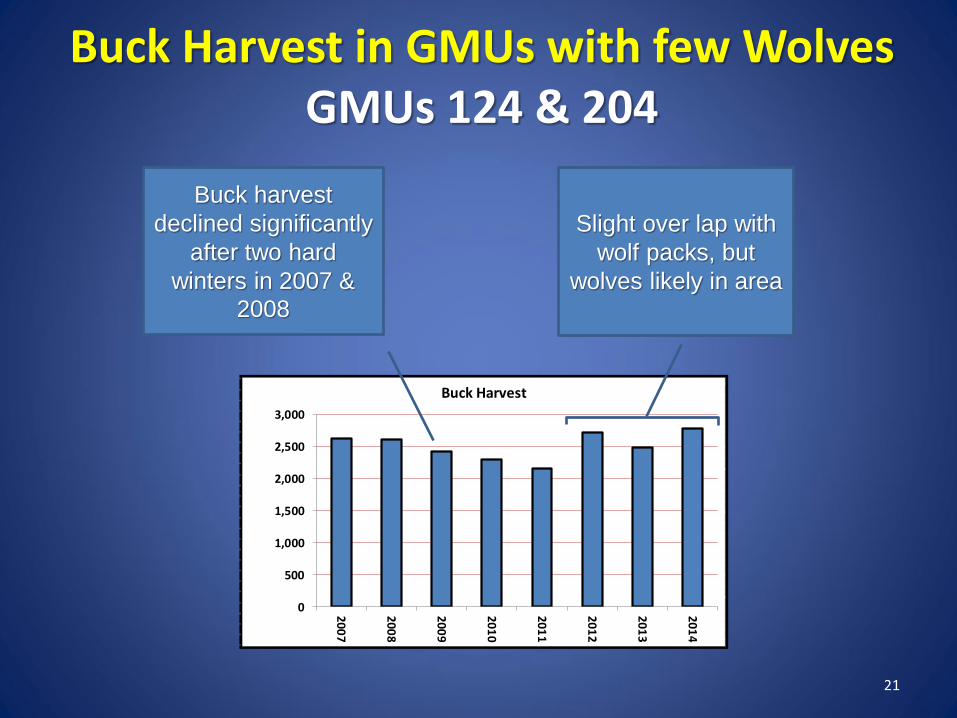
Buck Harvest in GMUs with few Wolves GMUs 124 & 204
21
0
500
1,000
1,500
2,000
2,500
3,000
20
07
2008
2009
2010
2011
20
12
2013
20
14
De
er H
arve
st
Buck Harvest
Buck harvest
declined significantly
after two hard
winters in 2007 &
2008
Slight over lap with
wolf packs, but
wolves likely in area
Buck Harvest in GMUs with few Wolves GMUs 124 & 204

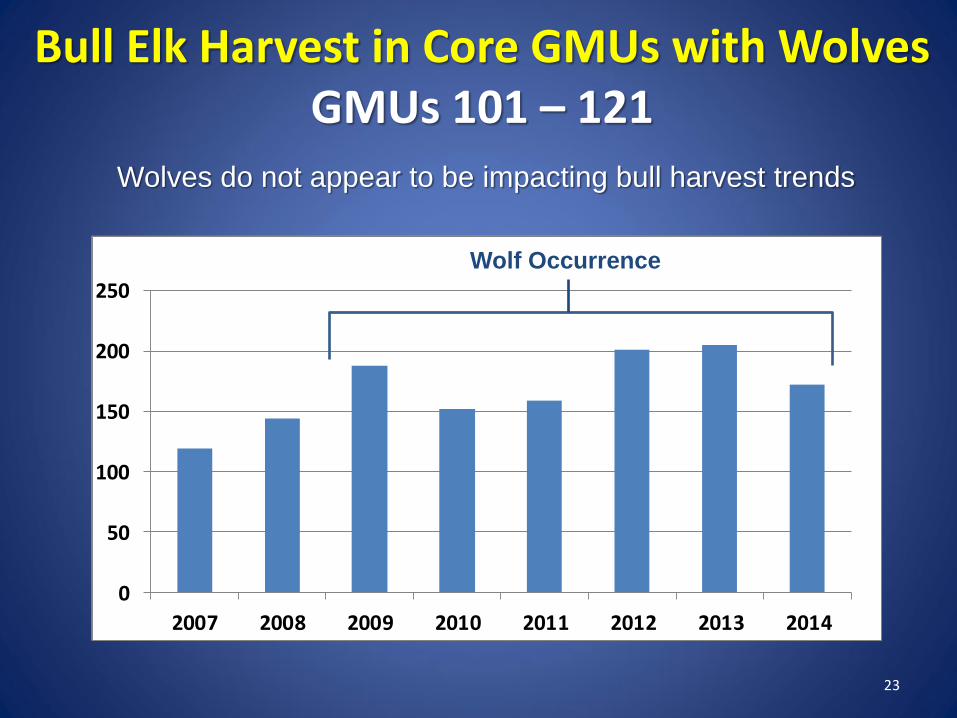
Bull Elk Harvest in Core GMUs with Wolves GMUs 101 – 121
22
23
0
50
100
150
200
250
2007 2008 2009 2010 2011 2012 2013 2014
Wolves do not appear to be impacting bull harvest trends
Wolf Occurrence
Bull Elk Harvest in Core GMUs with Wolves GMUs 101 – 121
24
0
20
40
60
80
100
120
140
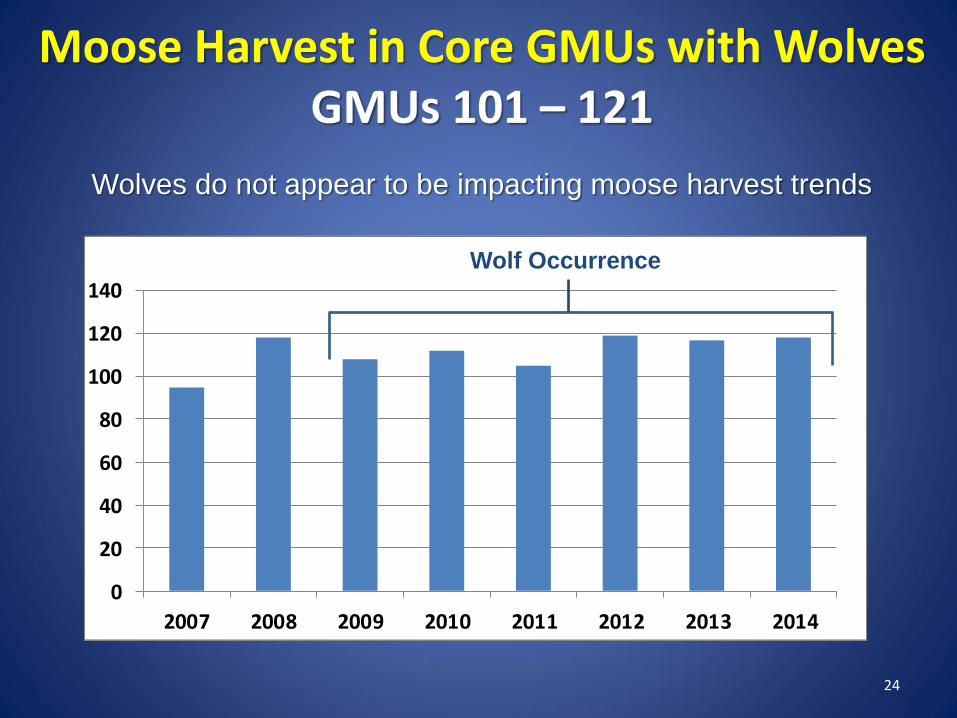
2007 2008 2009 2010 2011 2012 2013 2014
Moose Harvest in Core GMUs with Wolves GMUs 101 – 121
Wolves do not appear to be impacting moose harvest trends
Wolf Occurrence

25
• The Nc’icn Pack has been documented since 2012 and straddles the northern boarder of the Colville Indian Reservation
• The Profanity Pack (which was likely the expected Boulder Pack in 2012) was documented in 2014
Wolf Packs in GMU 101
Nc’icn
Profanity

400
500
600
700
800
900
1000
2007 2008 2009 2010 2011 2012 2013 201426
Buck Harvest in GMU 101
Likely period of
established wolf
packs

27
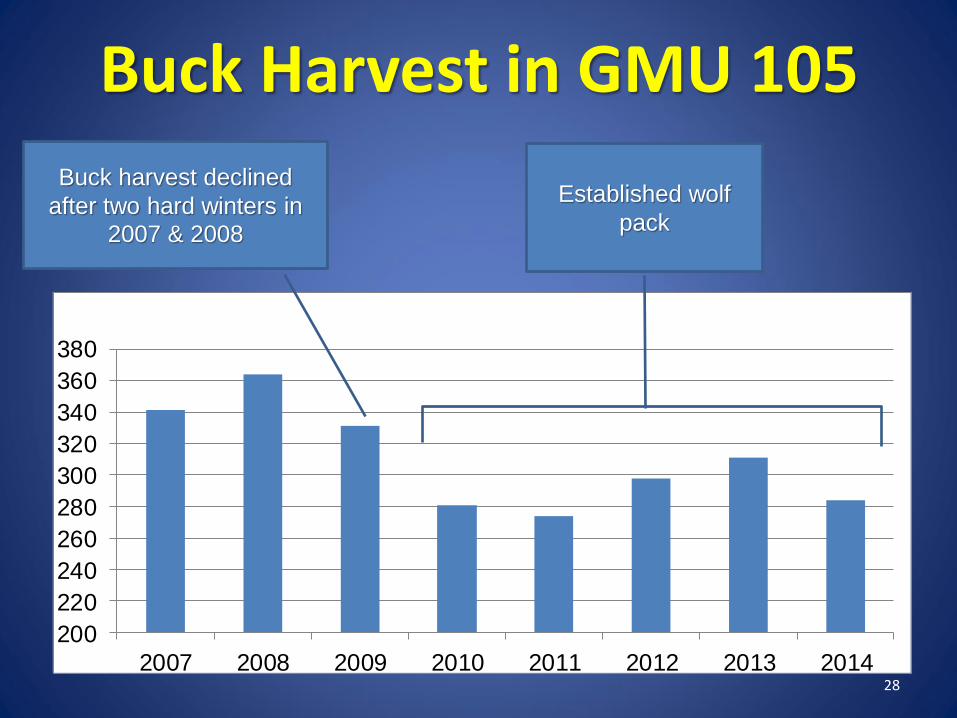
• The Wedge pack was documented in 2012
• Most of the pack was removed the same year after they killed cattle
• There have been at least two wolves in this area each year since 2012
Wolf Pack in GMU 105
Wedge
200
220
240
260
280
300
320
340
360
380
2007 2008 2009 2010 2011 2012 2013 201428
Buck Harvest in GMU 105
Established wolf
pack
Buck harvest declined
after two hard winters in 2007 & 2008

Wolf Packs in GMU 113
29
The first wolf pack was documented in this area in 2009; there are currently three packs
Salmo
Diamond
Goodman

200
250
300
350
400
450
2007 2008 2009 2010 2011 2012 2013 201430
Buck Harvest in GMU 113
Buck harvest declined
significantly after two hard
winters in 2007 & 2008 Established wolf packs

31
The first pack was documented here in 2012; there are two in this area currently
Wolf Packs in GMU 117
Carpenter
Dirty
Shirt
400
500
600
700
800
900
1000
1100
1200
1300
2007 2008 2009 2010 2011 2012 2013 2014
32
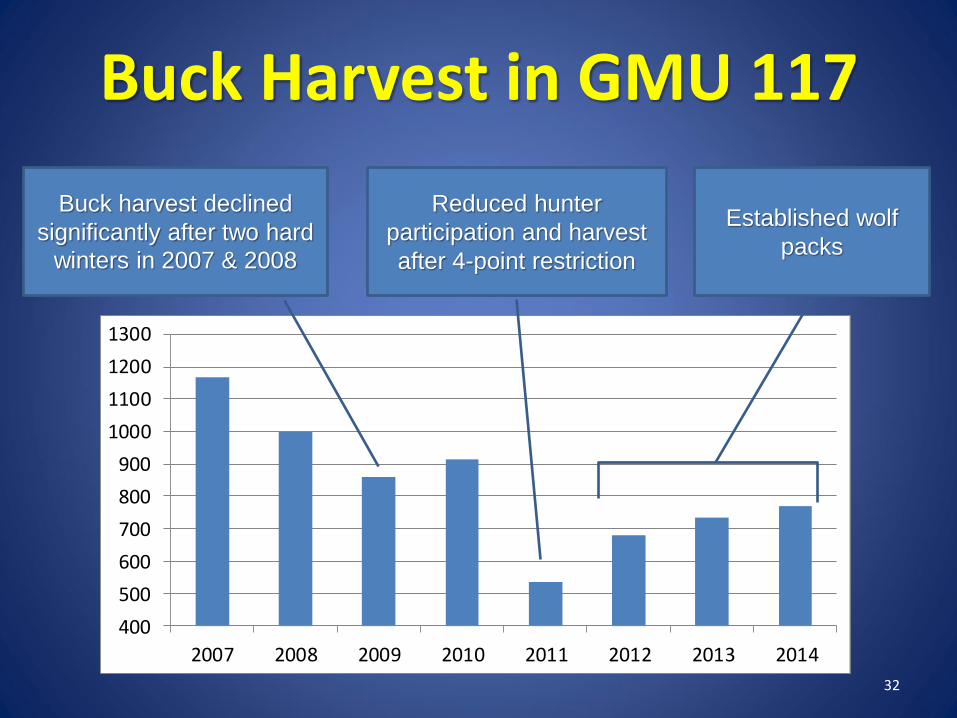
Buck Harvest in GMU 117
Buck harvest declined
significantly after two hard
winters in 2007 & 2008
Established wolf
packs
Reduced hunter
participation and harvest
after 4-point restriction
33
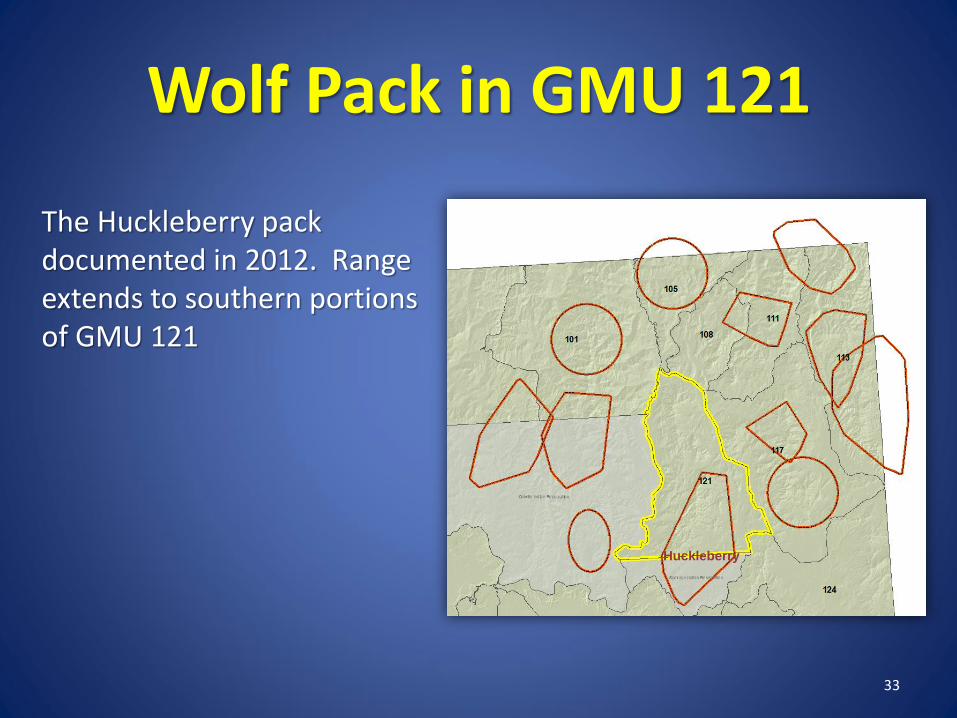
The Huckleberry pack documented in 2012. Range extends to southern portions of GMU 121
Wolf Pack in GMU 121
Huckleberry

400
600
800
1000
1200
1400
1600
1800
2007 2008 2009 2010 2011 2012 2013 2014
34
Buck Harvest in GMU 121 Buck harvest declined
significantly after two hard winters in 2007 & 2008
Established wolf
pack
Reduced hunter
participation and buck
harvest after 4-point
restriction

Deer and Elk Status in Areas with Wolves
Central and Northcentral Washington
35

36
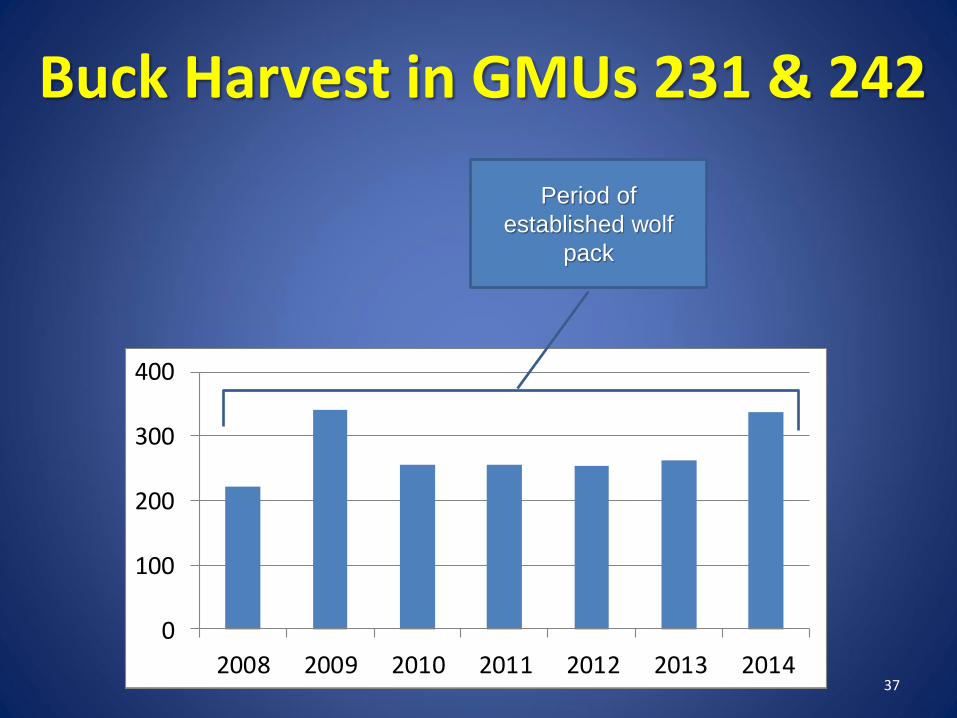
• Lookout Pack documented in 2008
• Pack size likely small from 2009-2011 due to poaching
Wolf Pack in GMUs 231 & 242
Lookout
37
0
100
200
300
400
2008 2009 2010 2011 2012 2013 2014
Buck Harvest in GMUs 231 & 242
Period of
established wolf
pack
38
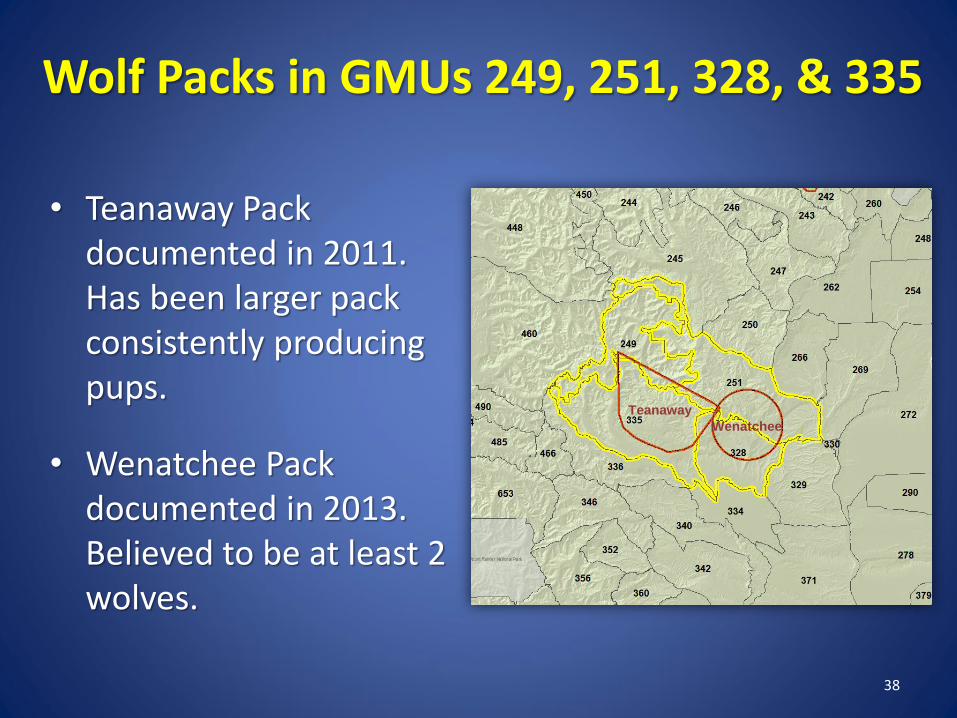
• Teanaway Pack documented in 2011. Has been larger pack consistently producing pups.
• Wenatchee Pack documented in 2013. Believed to be at least 2 wolves.
Wolf Packs in GMUs 249, 251, 328, & 335
Teanaway
Wenatchee

39
0
100
200
300
400
500
600
2008 2009 2010 2011 2012 2013 2014
Buck Harvest in GMUs 249, 251, 328, & 335
Period of
established wolf
packs

Wolf Packs in Colockum Elk Herd Area
40
• Teanaway Pack documented in 2011. Has been larger pack consistently producing pups.
• Wenatchee Pack documented in 2013. Believed to be at least 2 wolves.
Teanaway
Wenatchee

Colockum Elk Population Estimate
41
3306
3891
4621 4626
4880
5305
5712
3000
3500
4000
4500
5000
5500
6000
2007 2008 2009 2010 2011 2012 2013
WDFW is planning to reduce this population with hunting because the elk herd is above objective (green lines)
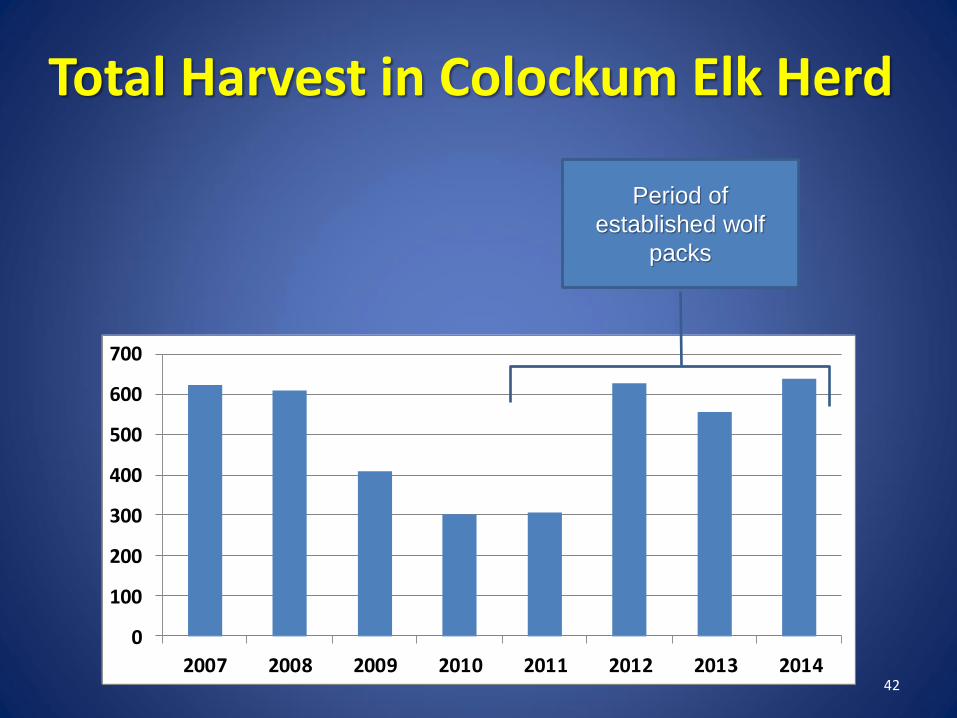
Total Harvest in Colockum Elk Herd
42
0
100
200
300
400
500
600
700
2007 2008 2009 2010 2011 2012 2013 2014
Period of
established wolf
packs
Elk Status in Areas with Wolves
Blue Mountains
43

Wolf Pack in Blue Mountains
44
• Tucannon Pack documented in 2014, with at least 2 wolves.
• Other dispersing wolves from Oregon documented travelling through Blue Mountains.
Tucannon
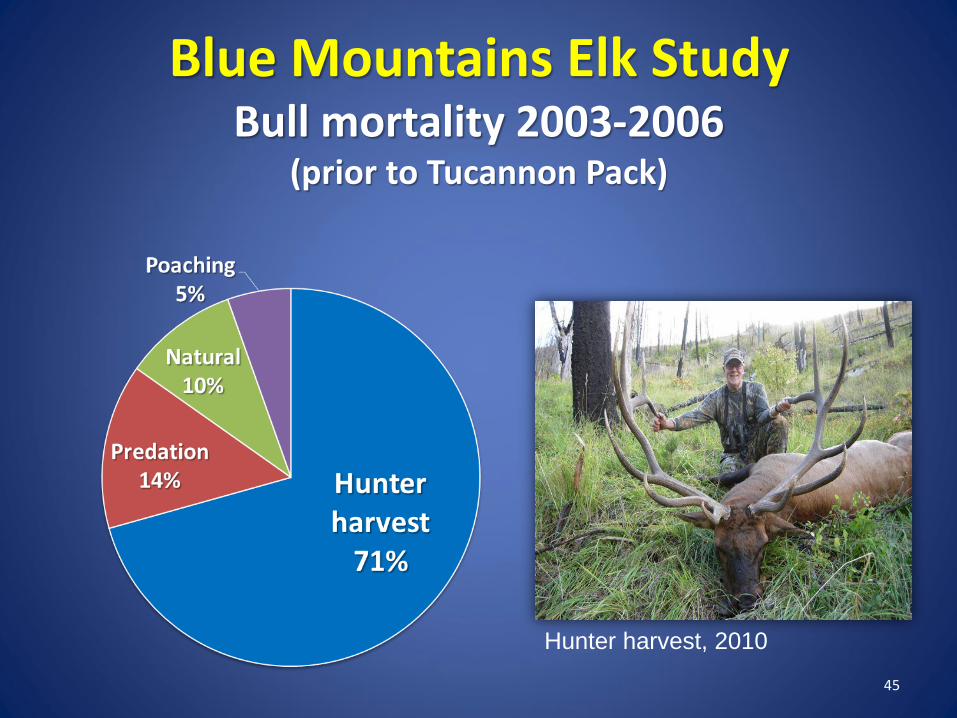
Blue Mountains Elk Study Bull mortality 2003-2006
(prior to Tucannon Pack)
45
Hunter harvest, 2010

Blue Mountains Elk
46
First wolf pack
detected in 2014

• WDFW identified high (exceeded 15%) cow harvest by hunters was limiting elk in the Blue Mountains
• The elk population grew when cow harvest was reduced and the elk herd currently is meeting the population objective in the herd plan.
• There were other factors affecting the population growth as well, such as two large fires that created substantial habitat improvement (over 100,000 acres)
47
Blue Mountains Elk Study

Summary
48

Summary of Prey Status in NE Washington
• Elk numbers are increasing and we plan to allow them to increase a little more by cutting back on antlerless harvest
• Mule deer numbers appear to be increasing, mostly in the western units
• Moose appear to be continuing their long term increase and expansion; although based on 2014 body condition work, they may have reached carrying capacity
• White-tailed deer populations are still low after the decline experienced with the hard winters of 2007-08, but there is some indication we may have turned the corner
49

Summary
• Ungulate population changes can be detected in a variety of ways
• As of today, WDFW does not have any measurable indication that wolves are having an impact on ungulate populations
• If changes in population levels are suspected, additional efforts will be employed to verify the cause
50

Summary
• Washington is fairly well positioned to understand potential impacts to ungulate populations from wolves
• The Wolf Conservation and Management Plan allows for wolf management for “at risk” ungulate populations
• Once delisted, wolf management options likely will expand
51

Questions:
Website: http://wdfw.wa.gov
Email: [email protected]
Phone: (360) 902-2515
Mail: Washington Department of Fish & Wildlife
Wolf Management Program
600 Capitol Way North
Olympia, WA 98501-1091
52