unfolding the outcomes of surgical treatment of lumbar
TRANSCRIPT
Vol.:(0123456789)1 3
European Spine Journal (2020) 29:2231–2242 https://doi.org/10.1007/s00586-020-06424-5
ORIGINAL ARTICLE
Unfolding the outcomes of surgical treatment of lumbar spinal stenosis—a prospective 5‑ and 10‑year follow‑up study
I. Tuomainen1,2 · T Aalto3 · J. Pesonen1,2 · M. Rade1,4 · M. Pakarinen5 · V. Leinonen6,7 · H. Kröger8 · O. Airaksinen1,2
Received: 13 September 2019 / Revised: 25 February 2020 / Accepted: 13 April 2020 / Published online: 27 April 2020 © The Author(s) 2020
AbstractPurpose In this prospective study, we aim to determine surgical outcomes in patients with lumbar spinal stenosis (LSS) 10 years after surgery.Methods The study population consisted of 96 LSS patients who underwent decompressive surgery, 72 of whom partici-pated in the 10-year follow-up. The patients completed a questionnaire preoperatively and 3 months, 5 years, and 10 years postoperatively. Outcome measures were satisfaction with the surgical outcomes, the Oswestry Disability Index (ODI), the visual analog scale (VAS), the numeric rating scale (NRS-11), and walking ability quantified in meters. Postoperative improvements at 5 and 10 years were analyzed using linear mixed models. Furthermore, comparisons between postoperative time points were made for clinical courses of pain, disability, and walking ability.Results At the 10-year follow-up, 68% of the patients were satisfied with the surgical outcomes. All the measured outcomes showed statistically significant improvement from baseline to the 5- and 10-year follow-up. The mean VAS score was 9.8 mm higher at the 5-year follow-up and 7.8 mm at the 10-year follow-up compared to the 3-month follow-up point. Similarly, the mean ODI was 4.8% higher at the 10-year follow-up compared to the 3-month follow-up point.Conclusion This study reports the clinical course of pain, disability, and walking distance after LSS surgery with the 10-year follow-up. Based on our study results, patients with LSS could expect to have positive effects of their back surgery up to 10 years. However, minor worsening in pain and disability may occur and one-fourth of the patients may need a reoperation during the 10-year follow-up period.
Keywords Lumbar spinal stenosis · Surgery · Decompression · 10-year follow-up
Introduction
Lumbar spinal stenosis (LSS) is a leading cause of low back surgery in patients older than 65 years [1], for whom the overall surgical hospitalization rate has grown in the last decade [2]. LSS is a complex clinical syndrome mainly
caused by degenerative changes and commonly diagnosed in patients with symptoms related to a narrowing of the lumbar spinal canal seen in imaging studies [3]. However, significant associations between radiological findings and the degree of severity of clinical symptoms have rarely been found [4].
* I. Tuomainen [email protected]
1 Department of Physical and Rehabilitation Medicine, Kuopio University Hospital, PL 100, 70029 KYS Kuopio, Finland
2 Department of Surgery (Incl. Physiatry), Institute of Clinical Medicine, University of Eastern Finland, Kuopio, Finland
3 Medical Center Ikioma, Mikkeli, Finland4 Faculty of Medicine, Orthopaedic and Rehabilitation
Hospital “Prim. Dr.Martin Horvat”, Josip Juraj Strossmayer University of Osijek, Osijek, Croatia
5 Department of Psychiatry, Kuopio University Hospital, University of Eastern Finland, Kuopio, Finland
6 Department of Neurosurgery, Institute of Clinical Medicine—Neurosurgery, Kuopio University Hospital, , University of Eastern Finland, Kuopio, Finland
7 Unit of Clinical Neuroscience, Neurosurgery, Medical Research Center, Oulu University Hospital, University of Oulu, Oulu, Finland
8 Department of Orthopaedics and Traumatology, Kuopio University Hospital and Kuopio Musculoskeletal Research Unit, University of Eastern Finland, Kuopio, Finland

2232 European Spine Journal (2020) 29:2231–2242
1 3
The most indicative clinical finding for symptomatic LSS is the presence of neurogenic claudication with improvement of symptoms while patients are bending forward, or sitting. Other related findings, such as low back, buttock, and/or lumbopelvic pain, are easily confused with other related conditions [5]. The first line of treatment in LSS is usually conservative [3]. If the conservative treatment fails to lead to an improvement in symptoms in 3 to 6 months, surgi-cal treatment can be considered as an option for symptom relief [6]. Invasive therapies are considered when neurogenic claudication is present with positive findings from diagnos-tic imaging [3]. Surgery has been shown to provide better outcomes for at least 4 years in terms of disability and pain with a narrowing of the benefits over time compared with conservative treatment [6–8].
In their meta-analysis, Fritsch et al. [9] concluded that patients who underwent surgery for LSS experienced the most substantial symptom relief in the first 3 months, and that some improvements could still occur at up to 5 years. Furthermore, Fekete et al. [10] showed that surgical outcome achieved after 1 year persisted stable up to 5-year follow-up also in patients with spinal stenosis. Despite this, the long-term benefits of surgical treatment compared to conservative treatment are uncertain [11], and only limited data are avail-able from prospective long-term studies investigating surgi-cal outcomes in patients with LSS. Consequently, the aim of this prospective study was to describe long-term benefits of surgical treatment of LSS and fill the gap of insufficient outcome results beyond 5 years.
Materials and methods
Study population
The original study population was selected from LSS patients being treated at Kuopio University Hospital, Kuo-pio, Finland, between 2001 and 2004. Selection for surgery was carried out either at the department of orthopedics or at the department of neurosurgery, with 102 LSS patients meet-ing the inclusion criteria for the current study at the baseline. The inclusion criteria were as follows: (1) presence of severe pain in the back, buttocks, or lower extremities, with radio-graphic proof (computed tomography (CT), magnetic reso-nance imaging (MRI), or rhizography) of compression of the cauda equina or exiting nerve roots linked to degenerative changes (ligamentum flavum, facet joints, osteophytes, and/or disk material) and (2) the surgeon’s judgment that the patient had clinically significant, degenerative LSS as the main diagnosis, indicative of a need for operative treatment. Additionally, all the patients showed a history of insuffi-cient responses to conservative treatment for several months before undergoing clinical evaluation for degenerative LSS
requiring operative treatment. A previous spine surgery and coexisting disk herniation were not considered exclusion criteria if LSS was confirmed as the main reason for the surgery. However, patients with only low back pain were not included.
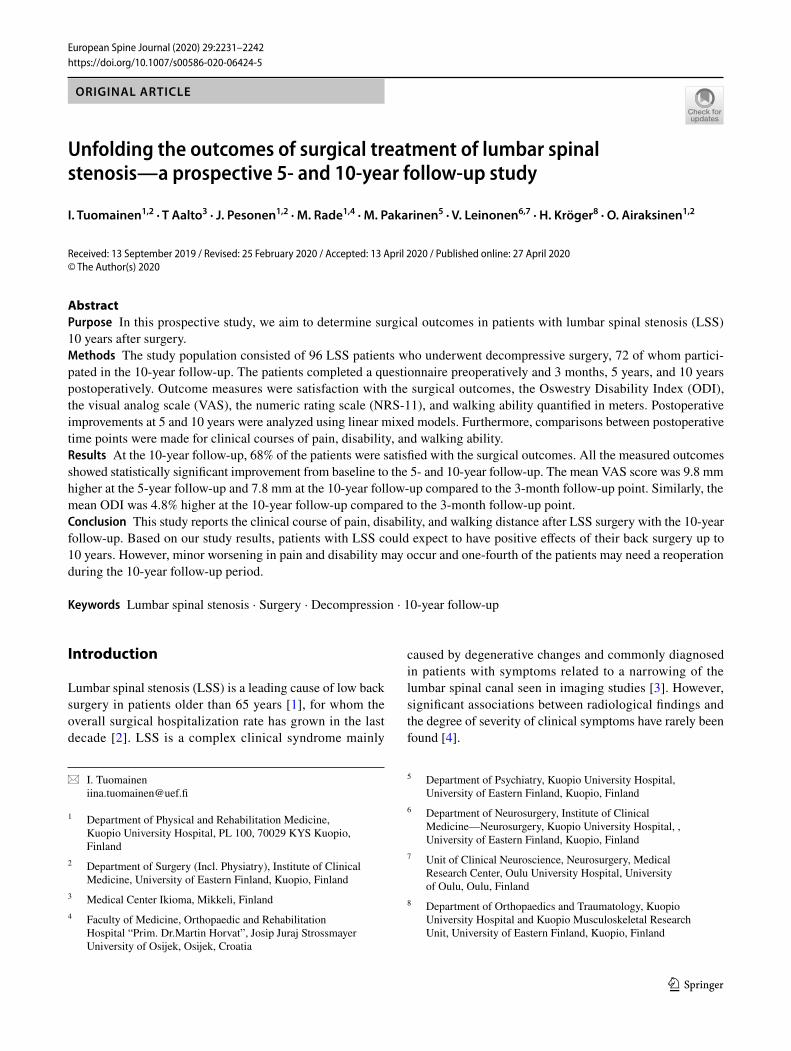
An urgent or emergency spinal surgery preventing recruit-ment, cognitive impairment prohibiting completion of the questionnaires or other failures in cooperation, and the presence of metallic instrumentation particles in the body preventing the radiological investigation were the exclusion criteria [12]. Follow-up data at all three follow-up points (3 months, 5 years, and 10 years) were missing for two patients, and 4 patients had missing measure for mean dural sac area at most stenotic level, bringing the final sample size to 96. A flowchart illustrating the patients’ flow during follow-up periods is shown in Fig. 1, with patients’ demo-graphics being presented in Table 1. Ethical approval was granted by the Kuopio University Research Ethics Board.
Study intervention and reoperations
The operating surgeons filled in a surgical intervention form after every surgery. Missing data were filled in from surgery reports in the medical charts. All the patients had either open or microscopic decompression of the affected level(s) (i.e., laminotomy, hemilaminectomy, or laminectomy, with under-cutting facetectomy). Nineteen patients had an additional fusion, two of them with instrumentation. The indication for additional lumbar fusion was concomitant spondylolisthe-sis [13]. Reoperations and other major operations after the study intervention were evaluated retrospectively from medi-cal charts in patients who responded after 5-year follow-up. Postoperative medical charts during the follow-up time were not available in 7 cases.
Study population was divided in two groups according to type of operation (fusion or decompression alone) and type of stenosis (central and lateral stenosis or lateral stenosis only). Moreover, study group was divided in two groups according to levels of decompression (1 and 2 or 3) and mean dural sac area at most stenotic level. Mean dural sac area was evaluated through the borders of the dural sac, which were manually traced on the axial image showing the smallest cross-sectional area upon visual examination. Patients were divided into two groups: (1) patients with dural sac area less than 75 mm2 and (2) patients with dural sac area equal to or greater than 75 mm2 [14, 15]. The sur-gical interventions are described in more detail in Table 2.
Outcome measures
Surgical outcomes were collected using self-reported assess-ment methods with the primary outcome measure being overall satisfaction with surgical outcomes. The secondary
2233European Spine Journal (2020) 29:2231–2242
1 3
outcome measures were functional disability, pain (such as overall pain, low back pain at rest, and leg pain while walking), and walking ability. The patients completed the detailed questionnaires before surgery and at follow-ups at 3 months, 5 years, and 10 years after the intervention.
Satisfaction with the surgical outcome was evaluated by the specific question: “How satisfied are you with the sur-gical outcomes?”. Patients were considered satisfied with the surgical outcome if their reply was either 3, “condition has been totally cured,” or 2, “condition has considerably
Fig. 1 Flowchart illustrating the study population’s progress dur-ing the follow-up periods
6
96
0
6 9
7
10
3
Table 1 Patients’ demographics at baseline (n = 96) and 3-month, 5-year, and 10-year follow-ups
ODI Oswestry Disability Index, VAS visual analog scale, NRS-11 numeric rating scale, LBP Low back pain at rest, LP leg pain while walking, SD standard deviation
Follow-up point Baseline (n = 96) 3 months (n = 96) 5 years (n = 70) 10 years (n = 69)
Age: mean (SD) 61.6 (11.2) 62.1 (11.1) 67.4 (11.3) 68.5 (9.8)Gender: female (%) 59% 59% 67% 64%ODI: mean (SD) 43.6 (15.3) 27.1 (18.7) 28.7 (18.0) 29.8 (20.8)VAS overall: mean (SD) 55.2 (27.0) 26.0 (22.3) 35.4 (27.8) 33.4 (28.1)LBP NRS-11: mean (SD) 4.2 (2.6) 1.9 (2.4) 1.9 (2.3) 2.2 (2.5)LP NRS-11: mean (SD) 6.4 (2.6) 3.1 (2.7) 3.3 (2.8) 3.2 (2.6)Walking ability: median (min; max) 900
(10; 10,000)2000(20; 20,000)
1500(10; 15,000)
2000 (0; 10,000)
Comorbidities: mean (SD) 5.5 (3.2) 6.4 (3.5) 5.6 (3.7) 4.4 (2.4)

2234 European Spine Journal (2020) 29:2231–2242
1 3
improved” on a seven-point scale from − 3 to 3. Other reply options are presented in Fig. 3.
Subjectively assessed disability was measured by the vali-dated Finnish version of the Oswestry Disability Index (ODI, 0–100%) [16]. A visual analog scale (VAS, 0–100 mm) was used to describe the patients’ current overall pain intensity [17]. Low back pain at rest (LBP) and leg pain while walk-ing (LP), both during the preceding week, were separately assessed with a numeric rating scale ranging from 0 to 10 [numeric rating scale (NRS-11)] [18]. In addition, self-reported walking distance in meters (continuous scale) was also evaluated and included in the analysis. Furthermore, comorbidities were evaluated using the Work Ability Index (WAI) [19], in which the number of current diseases or inju-ries diagnosed by a physician was recorded.
Statistical analysis
Comparisons between two independent groups were made using Student’s t test and the Mann–Whitney test if neces-sitated by data normality values. The distribution of the data was determined using histograms and QQ-plots. Cate-gorical variables were evaluated using the Chi-square test.
McNemar’s test was used to evaluate satisfaction with the surgical outcome between two follow-up time points.
Due to the availability of longitudinal data, linear mixed models were used to evaluate the changes in outcomes (ODI, VAS, LBP, LP, and walking ability) over time. To evaluate the surgical outcomes of disability, pain scores, and walking ability, the analysis included outcome pair-wise comparisons between the baseline and the 5- and 10-year follow-up points. Moreover, to evaluate the post-operative clinical course of disability, pain scores, and walking ability, the analysis included outcome pairwise comparisons between the 3-month and 5-year and 10-year points, as well as between the 5-year and 10-year points. Analyses were adjusted for type of operation, type of ste-nosis, level of stenosis operated, and the mean dural sac area at the most stenotic level. Time and adjusted variables were set as a fixed factor, and unstructured covariance was used for repeated measures. The assumption of a normal distribution was visually checked from the residuals. Miss-ing values were assumed to be completely random. Sta-tistical analysis was performed using SPSS (version 25.0, SPSS/Chicago, IL, USA).
Table 2 Baseline demographics of the study population and character of the surgical treatment
All study patients (n = 96) Patients who respondent after10 years(n = 69)
Type of stenosisCentral stenosis and Lateral stenosis 79 (82%) 56 (81%)Only lateral stenosis 17 (18%) 13 (19%)Mean dural sac area at most stenotic level 68.6 mm2 68.0 mm2
Less than 75 mm2 64 4675 mm2 or more 32 23Level of decompression One level 58 46 (67%) Two levels 34 19 (28%) Three levels 8 4 (6%)
Spondylolisthesis 23 (24%) 18 (26%) L1–L2 0 0 L2–L3 0 0 L3–L4 6 4 L4–L5 16 13 L5–S1 1 1
Fusions performed 18 (19%) 16 (23%) Single level 16 14 Two levels 2 2
Extirpation of concomitant disk herniation 7 4 (6%) L2–L3 1 0 L3–L4 1 0 L4–L5 4 3 L5–S1 1 1

2235European Spine Journal (2020) 29:2231–2242
1 3
Results
Of initial population, 15 patients (16%) died and there were 12 (13%) dropout patients at the 10-year follow-up. Thus, there was an overall participation rate of 72% at the 10-year follow-up, with dropout patients being signifi-cantly older and showing more comorbidities at baseline than other patients. However, other pre- or postoperative variables showed no statistically significant differences between the dropout and the follow-up patient groups (Table 3).
During the 10-year follow-up period, one or more reoperations were performed on 21 patients (reoperation rate = 25%). Of these, three patients underwent two reop-erations and one patient underwent three reoperations, resulting in 28 reoperations during the follow-up period. The reoperations are described in more detail in Fig. 2. An emergency operation was performed in six cases (21% of all reoperations), with the indication for emergency sur-gery being disk herniation in four cases (intolerable pain n = 3, cauda equina syndrome n = 1), synovial cyst and stenosis in one case (intractable pain), and posterior ele-ment hypertrophy and myelopathy (Th12-L1) in one case. Reoperated patients were found to be younger at baseline, but other baseline characteristics showed no statistically significant differences between groups (Table 4).
During the 10-year follow-up period, 25% of patients (n = 24) underwent hip or knee replacement surgery, and 2% (n = 2) underwent surgery due to peripheral athero-sclerosis. However, outcome measures did not show any significant differences between reoperation and no-reoper-ation groups in a cross-sectional analysis at 5- and 10-year follow-up times (Table 5).
In this study, 68% of the patients were satisfied with the surgical outcomes after 5 and 10 years. The distribution of
the responses can be seen in Fig. 3. Between postoperative time points, no statistical differences were found, as seen in Table 6.
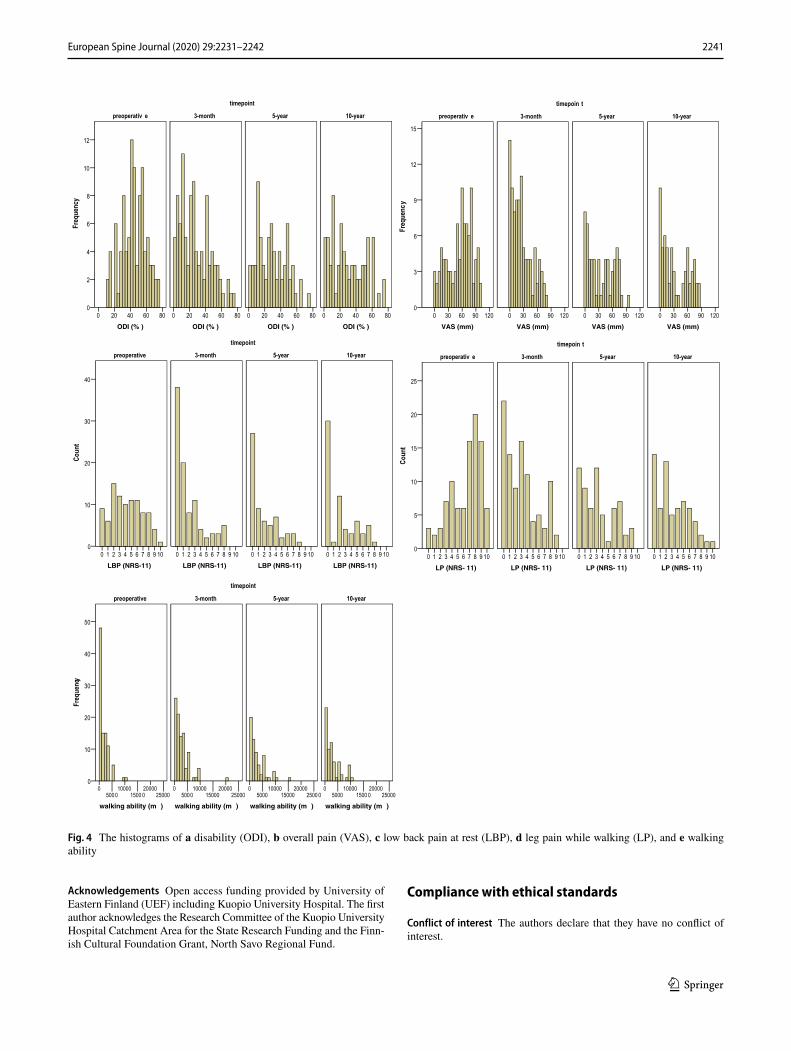
In subgroup analyses, patients who had decompression in 2 or 3 levels had higher leg pain at 10-year follow-up when compared to patients with 1-level decompression. How-ever, no further significant differences were found between the subgroups (Table 7). In the linear mixed model, all the outcome measures showed statistically significant improve-ments at the 5- and 10-year follow-up times when compared with preoperative variables (for all, p < 0.05). Figure 4 shows the histograms of outcome measures at the different time points. On further analysis, the mean ODI values showed a statistically significant deterioration at the 10-year follow-up when compared with data from the 3-month follow-up (p = 0.040). Mean VAS values increased during the 5-year (p = 0.003) and 10-year follow-up periods (p = 0.030) when compared with the 3-month follow-up. However, the ODI and VAS scores did not show significant differences between the 5-year and 10-year follow-ups. In addition, other out-come variables (LPB, LP, and walking ability) remained stable during all the follow-up time, and no statistically sig-nificant difference was found between the follow-up points. Minor worsening in low back and leg pain scores was seen after 3 months, but the differences between postoperative time points were not statistically significant.
Discussion
In this study, we described the surgical outcome of decom-pressive surgery in patients with LSS, along with clinical course of disability, painful symptoms, and walking dis-tance during the 10-year follow-up period. We found that 68% of the study patients were satisfied with the achieved results 5 years and 10 years after surgery. Decompressive
Table 3 Comparison of the study group characteristics at baseline between 10-year follow-up and dropout patient groups
ODI Oswestry Disability Index, VAS visual analog scale, NRS-11 numeric rating scale, LBP low back pain at rest, LP leg pain while walking, SD standard deviation*16 patients died during the 10-year follow-up period
Follow-up patients(N = 69)
Dropout patients*(N = 27)
pvalue
Age: mean (SD) 58.0 (9.8) 70.9 (9.5) 0.000Gender: women (%) 63.8% 48.1% 0.161ODI (%): mean (SD) 42.5 (15.6) 46.4 (14.4) 0.270VAS overall (mm): mean (SD) 56.6 (25.7) 51.3 (30.5) 0.468LBP NRS-11 (0–10): mean (SD) 4.2 (2.7) 4.3 (2.5) 0.957LP NRS-11 (0–10): mean (SD) 6.3 (2.7) 6.9 (2.3) 0.386Walking distance (m): median (min; max) 1000 (20; 10,000) 500 (10; 3400) 0.258Comorbidities: mean (SD) 5.0 (2.8) 6.8 (3.7) 0.037Satisfaction at 3 months (scale − 3 to 3):
median (min, max)2 (− 2,3) 2 (− 1,3) 0.732

2236 European Spine Journal (2020) 29:2231–2242
1 3
surgery seems to provide significant improvement in pain, disability, and walking distance even at 10 years after sur-gery. On the other hand, our study showed approximately one-fourth of the studied patients underwent reoperation
before the 10-year follow-up. Furthermore, overall pain and disability showed a minor worsening after 3 months during extended follow-up period.
Fig. 2 Characteristics of reoperations during the 10-year follow-up
Time of first reoperation Number of reoperationsBefore the 5-year follow-up Before the 10-year follow-up
1 reoperation2 reoperations3 reoperations
Number of levels operated
Decompression in 1 level Decompression in 2 levels
n=10(48%)
n=11(52%)
Segment operated
Fusion performed (n=5)Instrumented Bone craft
Same segment as the initial surgeryAdjacent segment to the initial surgery Different segment from the initial surgery
no yes
Extirpation of disc herniaton
n=18(69%)
n=8(31%)
n=3(60%)
n=2(40%)
n=17(81%)
n=3(14%)
n=1(5%)
n=8(31%)
n=14(54%)
n=4(15%)
n=18(69%)
n=8(31%)
Table 4 Patients’ baseline demographics according to status of reoperation
ODI Oswestry Disability Index, VAS visual analog scale, NRS-11 numeric rating scale, LBP low back pain at rest, LP leg pain while walking, SD standard deviation
Reoperation (n = 21) No reoperation (n = 62) p value
Age: mean (SD) 56.1 (12.4) 62.4 (10.4) 0.026Gender: women (%) 47.6% 66.1% 0.194ODI (%): mean (SD) 47.6 (13.3) 42.2 (15.2) 0.154VAS (mm): mean (SD) 57.0 (23.4) 56.3 (27.1) 0.925LBP NRS-11 (0–10): mean (SD) 4.1 (2.2) 3.9 (2.8) 0.630LP NRS-11 (0–10): mean (SD) 5.9 (2.6) 6.6 (2.6) 0.190Walking distance in meters: median
(min; max)1000 (20; 5000) 500 (20; 10,000) 0.788
Comorbidities: mean (SD) 5.5 (2.9) 5.1 (3.0) 0.508

2237European Spine Journal (2020) 29:2231–2242
1 3
The satisfaction rate at 10 years corresponds to the rate reported in our earlier studies, showing a 66% satisfaction rate with the results of surgery at the 3-month follow-up [20]. Hence, even though the benefits of surgery were seen to decline after 3 months, patients were still satisfied with the results of surgery. Moreover, previous long-term follow-up studies have also reported satisfaction rates of 55–78% [8, 21]. The main goal of surgical treatment in LSS is to decompress the neural structures in the spinal canal or in the neural foramina [5] and thereby improve a patient’s dis-ability and walking ability and reduce painful symptoms. However, patient satisfaction with the surgical outcome is also an important outcome measure in order to evaluate sur-gical outcomes extensively in the long term, which describes most accurately the link between patients’ experiences and expectations of the treatment [22]. Furthermore, a study by Parai et. al. [23] suggested that patients’ global assessment of pain improvement after surgery can be an efficient tool to measure a successful outcome of degenerative lumbar spinal surgery.
The tendency of increased satisfaction with the sur-gical outcome over time despite the relative increase in overall pain and disability values is of particular interest. This is in line with the results of our previous study with a 5-year follow-up, which demonstrated that satisfaction was higher at the 5-year than at the 3-month follow-up points among patients with a higher sense of coherence [24]. The
Table 5 Outcome measures at the 5-year and 10-year follow-ups according to status of reoperation
ODI Oswestry Disability Index, VAS visual analog scale, NRS-11 numeric rating scale, LBP low back pain at rest, LP leg pain while walking, SD standard deviation
Reoperation No reoperation p value
ODI (%): mean (SD) 5-year 32.6 (14.3) 27.6 (18.9) 0.332 10-year 36.7 (16.7) 27.4 (21.7) 0.051
VAS (mm): mean (SD) 5-year 34.4 (23.5) 35.8 (29.3) 0.936 10-year 34.4 (24.4) 33.0 (29.6) 0.583
LBP NRS-11 (0–10): mean (SD) 5-year 2.1 (2.0) 1.9 (2.4) 0.443 10-year 2.4 (2.3) 2.1 (2.6) 0.416
LP NRS-11 (0–10): mean (SD) 5-year 3.0 (2.2) 3.4 (2.9) 0.864 10-year 3.5 (2.6) 3.0 (2.7) 0.469
Walking distance (m): median (min; max) 5-year 1750 (500; 9000) 1350 (10; 15,000) 0.301 10-year 1750 (0; 8000) 2000 (0; 10,000) 0.499
Satisfaction with the outcome (scale − 3 to 3): median (min; max) 5-year 2 (− 2;2) 2 (− 3;3) 0.161 10-year 2 (− 2;3) 2 (− 3;3) 0.065
5-year follow-u 1p 0-year follow-up
surgery was a total failure (-3 )condition is now considerably worse (-2 )condition is now slightly worse (-1 )no change (0 )
condition has slightly improved (1 )condition has considerably improved (2)condition has been totally cured (3 )
n=16(23.2%)
n=3 (3.1%)
n=2(2.1%)
n=2 (2.1%)
n=1(1.0%)
n=14(14.6%)
n=33(34.4%)
n=13(13.5%)
n=13(13.5%)
n=32(33.3%)
n=15(15.6%)
n=1(1.0%)
n=2(2.1%)
n=2(2.1%)
n=1(1.0%)
Satisfaction with the surgical outcome
Fig. 3 Distribution of responses to the question “How satisfied are you with the surgical outcomes?”

2238 European Spine Journal (2020) 29:2231–2242
1 3
improvement in satisfaction could be explained by better adjustment to the chronic disease and its symptoms with increasing age. This might be due to the higher sense of coherence [25] or to other psychological factors related to better coping in later life [26].
In this study, all outcome measures (ODI, VAS, LBP, LP, and walking distance) showed significant improvements at up to 10 years; however, patients experienced more overall pain and disability at 10 years when compared to 3 months after the surgery. Even though ODI and VAS scores deterio-rated after 3 months in our study population, study subjects reported only minimal changes in LBP and LP symptoms and walking distance at up to 10 years. However, the greatest improvement in disability and pain scores occurred within 3 months after surgery. This is in line with the findings of the previous studies, which also described a considerable reduction in pain and disability in the first 3 months, and that an improving trend in outcomes remains almost stable up to 5 years after surgery [9, 10]. However, previous stud-ies have not included the clinical course of walking ability nor the satisfaction rate with the surgical outcome, and the follow-up time has only been up to 5 years.
Our findings concerning LP and LBP are in line with those of Mannion et al. [21] in which LP and LBP inten-sity seemed to remain stable during a 5-year follow-up after LSS surgery. In addition, in their meta-analysis by Fritch et al. [9], they describe only a slight increase in LBP after 3 months. However, a study by Anjarwalla et al. [27] showed a deteriorating trend in leg and back pain in a 5-year follow-up; however, they did not perform analyses between post-operative time points.
One reason why overall pain (VAS) and disability (ODI) increased while walking ability, LBP at rest, and LP while walking mostly remained constant in our study population may be the long 10-year follow-up period. This inevitably leads to
other comorbidities and musculoskeletal disorders related to aging. In this study group, 24% of the patients underwent hip or knee replacement surgery, but only 2% had surgery due to peripheral atherosclerosis. Moreover, previous studies have also shown a deterioration of the benefits of surgery after 4 years when compared to conservative treatment [6–8]. A meta-analysis by Zaina et al. [11] concluded that no recom-mendations can be made about the best treatment choices in patients with LSS. However, in extended follow-up studies of LSS surgery, patients have experienced improvements in pain and disability compared to the baseline [9, 21, 27]. Based on our results, after surgical treatment patients with LSS can experience improvements in disability and pain scores, as well as walking ability, even up to 10 years after the surgery, even though some worsening in symptoms may occur. Fekete et al. [10] concluded that surgical outcomes remained constant after greatest improvement up to 5 years. Based on our study results, after 5 years symptoms and satisfaction with the surgical out-come remain fairly stable up to 10 years. However, further studies are needed to investigate postoperative outcome results of LSS surgery over the 10-year follow-up.
There are some limitations to this study. First, the aging of the study subjects and the occurrence of musculoskeletal comorbidities may play a role in the natural course of func-tional ability and painful symptoms, so we cannot conclude that our study results are a direct consequence of the initial surgery. Moreover, 25% of the study subjects underwent reoperation procedures during the follow-up period, which is in accordance with findings in other long-term investiga-tions [8, 21]. Second, the loss of study subjects due to deaths and other reasons, and differences in baseline variables (age and comorbidities) might bias the results. Third, the pos-sible effects of the subjectivity of the outcome measures employed need to be considered as a limitation. Fourth, lack of non-surgical arm precludes to evaluate the effect of surgi-cal treatment exclusively. Furthermore, heterogeneity of the data has an impact on the generalization of data; neverthe-less, the results were adjusted with these variables.
One strength of this study is the high participation rate despite the long follow-up period. Another strength is its reporting of the clinical course of pain, walking distance, and disability, even up to 10 years. Moreover, the outcome measures used (ODI and VAS) are validated patient-reported tools in spinal research and regarded as useful in measuring patients’ disability and pain [28]. In addition, our study set-ting was pragmatic, so our findings are directly applicable to clinical settings. This study provides important informa-tion for clinicians as well as patients with LSS undergoing surgical treatment.
Table 6 Satisfaction with the surgical outcome according to postop-erative follow-up time points
McNemar’s test for all three time points, p > 0.05
5-year satisfied 5-year dissatisfied
3-month satisfied 38 93-month dissatisfied 8 11
10-year satisfied 10-year dissatisfied3-month satisfied 30 133-month dissatisfied 15 7
10-year satisfied 10-year dissatisfied5-year satisfied 30 45-year dissatisfied 8 10

2239European Spine Journal (2020) 29:2231–2242
1 3
Table 7 Surgical outcome measures at different time points according to type of operation, type of stenosis, levels of decompression and mean dural sac area at most stenotic level
Preoperative 3-month 5-year 10-year
ODI (%): mean (SD)Type of operation Fusion 43.5 (13.4) 22.9 (16.1) 29.4 (21.4) 27.7 (21.7) Decompression alone 43.6 (15.8) 28.1 (19.2) 28.5 (17.1) 30.5 (20.7) p value 0.975 0.345 0.898 0.536
Type of stenosis Central and lateral 44.4 (16.3) 27.9 (19.2) 30.5 (17.9) 31.9 (21.3) Lateral only 39.9 (9.4) 23.5 (15.8) 20.2 (16.3) 21.1 (16.8) p value 0.278 0.477 0.066 0.105
Levels of decompression 1 level 41.9 (15.8) 24.8 (17.6) 26.1 (17.5) 27.7 (21.2) 2 or 3 levels 46.2 (14.4) 30.5 (19.9) 33.1 (18.3) 34.0 (19.7) p value 0.179 0.175 0.082 0.190
Mean dural sac area at the most stenotic level Less than 75 mm2 43.8 (16.2) 26.6 (17.8) 30.7 (18.5) 31.8 (20.1) 75 mm2 or more 43.2 (13.6) 28.0 (20.6) 24.3 (16.3) 25.9 (22.2) p value 0.575 0.876 0.201 0.219
VAS (mm): mean (SD)Type of operation Fusion 58.2 (28.4) 21.2 (20.4) 38.6 (30.0) 35.7 (29.2) Decompression alone 54.5 (26.8) 27.1 (22.7) 34.5 (27.3) 32.6 (28.0) p value 0.511 0.372 0.661 0.575
Type of stenosis Central and lateral 54.3 (28.8) 26.5 (22.9) 36.9 (27.3) 34.7 (28.7) Lateral only 59.2 (16.9) 23.4 (19.7) 29.1 (29.9) 27.2 (25.7) p value 0.705 0.655 0.336 0.567
Levels of decompression 1 level 56.8 (24.5) 23.6 (19.7) 36.8 (29.3) 30.1 (28.5) 2 or 3 levels 52.7 (30.7) 29.5 (25.6) 33.1 (25.4) 40.1 (26.8) p value 0.677 0.502 0.748 0.197
Mean dural sac area at the most stenotic level Less than 75 mm2 53.9 (28.5) 26.3 (22.9) 37.3 (27.6) 34.5 (27.9) 75 mm2 or more 57.7 (24.1) 25.4 (21.3) 31.1 (28.4) 31.1 (29.1) p value 0.652 0.892 0.409 0.524
LBP NRS-11 (0–10): mean (SD)Type of operation Fusion 3.4 (2.6) 1.2 (1.4) 1.7 (2.2) 1.9 (2.7) Decompression alone 4.4 (2.6) 2.0 (2.5) 2.0 (2.3) 2.2 (2.5) p-value 0.192 0.638 0.655 0.420
Type of stenosis Central and lateral 4.1 (2.6) 1.8 (2.4) 2.0 (2.2) 2.3 (2.5) Lateral only 4.6 (2.8) 1.9 (2.3) 1.6 (2.7) 1.8 (2.5) p value 0.494 0.775 0.325 0.474
Levels of decompression 1 level 4.3 (2.6) 1.8 (2.2) 2.1 (2.5) 1.8 (2.3) 2 or 3 levels 4.1 (2.8) 2.0 (2.6) 1.7 (1.9) 2.9 (2.7) p-value 0.572 0.860 0.876 0.076
Mean dural sac area at the most stenotic level Less than 75 cm 4.1 (2.7) 1.8 (2.2) 1.8 (2.1) 2.2 (2.5) 75–100 mm 4.4 (2.6) 1.9 (2.7) 2.2 (2.7) 2.1 (2.4) p-value 0.587 0.800 0.987 0.866

2240 European Spine Journal (2020) 29:2231–2242
1 3
Conclusion
In conclusion, this study shows the clinical course of pain, disability, and walking distance along with a high satis-faction rate with surgical outcomes of LSS in a 10-year
follow-up. Based on our study results, patients with LSS could expect to have positive effects of their back surgery up to 10 years. However, minor worsening in pain and disability may occur and one-fourth of the patients may need a reoperation during the 10-year follow-up period.
ODI Oswestry Disability Index, VAS visual analog scale, NRS-11 numeric rating scale, LBP Low back pain at rest, LP leg pain while walking, SD standard deviation
Table 7 (continued) Preoperative 3-month 5-year 10-year
LP NRS-11 (0–10): mean (SD)Type of operation Fusion 6.9 (2.7) 2.4 (2.5) 3.5 (2.8) 3.8 (3.0) Decompression alone 6.3 (2.6) 3.2 (2.8) 3.3 (2.8) 2.9 (2.5) p value 0.266 0.256 0.782 0.324
Type of stenosis Central and lateral 6.4 (2.7) 3.1 (2.7) 3.5 (2.7) 3.3 (2.6) Lateral only 6.4 (2.1) 2.8 (2.9) 2.7 (3.1) 2.6 (2.7)
p value 0.652 0.573 0.310 0.383Level of decompression 1 level 6.3 (2.6) 3.0 (2.7) 3.2 (2.8) 2.6 (2.6) 2 or 3 levels 6.6 (2.7) 3.2 (2.8) 3.5 (2.7) 4.1 (2.5) p-value 0.473 0.879 0.604 0.015
Mean dural sac area at the most stenotic level Less than 75 mm2 6.4 (2.8) 2.9 (2.6) 3.2 (2.7) 3.4 (2.7) 75 mm2 or more 6.6 (2.2) 3.4 (3.0) 3.6 (2.9) 2.6 (2.4) p value 0.908 0.465 0.673 0.291
Walking distance (m): median (min; max)Type of operation Fusion 1500 [100; 10,000] 2000 [200; 20,000] 2000 [10; 10,000] 1500 [15; 9999] Decompression alone 650 [10; 9999] 1500 [20; 9999] 1350 [30; 15,000] 2000 [0; 10,000] p-value 0.233 0.444 0.858 0.946
Type of stenosis Central and lateral 500 [10; 10,000] 1500 [20; 20,000] 1200 [10; 10,000] 1500 [0; 9999] Lateral only 1000 [100; 5000] 3000 [300; 9000] 2000 [50; 15,000] 2000 [200; 10,000] p value 0.412 0.094 0.253 0.300
Levels of decompression 1 level 1000 [10; 10,000] 2000 [20; 20,000] 2000 [10; 15,000] 2000 [0; 10,000] 2 or 3 levels 500 [20; 9999] 1250 [200; 9999] 1050 [30; 9999] 1000 [0; 9999] p value 0.472 0.183 0.461 0.330
Mean dural sac area at the most stenotic level Less than 75 mm2 1000 [20; 10,000] 1750 [100; 20,000] 1500 [10; 10,000] 1500
[0; 9999] 75 mm2 or more 500
[10; 5000]2000[20; 9999]
1750[50; 15,000]
2000 [0; 10,000]
p value 0.737 0.988 0.958 0.568
2241European Spine Journal (2020) 29:2231–2242
1 3
Acknowledgements Open access funding provided by University of Eastern Finland (UEF) including Kuopio University Hospital. The first author acknowledges the Research Committee of the Kuopio University Hospital Catchment Area for the State Research Funding and the Finn-ish Cultural Foundation Grant, North Savo Regional Fund.
Compliance with ethical standards
Conflict of interest The authors declare that they have no conflict of interest.
ODI (% )
806040200
Frequency
12
10
8
6
4
2
0
ODI (% )
806040200ODI (% )
806040200ODI (% )
806040200
timepoint
10-year5-year3-monthpreoperativ e
VAS (mm)
1209060300
Frequenc
y
15
12
9
6
3
0
VAS (mm)
1209060300VAS (mm)
1209060300VAS (mm)
1209060300
timepoin t
10-year5-year3-monthpreoperativ e
LBP (NRS-11)
109876543210
Coun
t
40
30
20
10
0
LBP (NRS-11)
109876543210LBP (NRS-11)
109876543210LBP (NRS-11)
109876543210
timepoint
10-year5-year3-monthpreoperative
LP (NRS- 11)
109876543210
Count
25
20
15
10
5
0
LP (NRS- 11)
109876543210LP (NRS- 11)
109876543210LP (NRS- 11)
109876543210
timepoin t
10-year5-year3-monthpreoperativ e
walking ability (m )
2500020000
1500 010000
50000
Frequency
50
40
30
20
10
0
walking ability (m )
2500020000
1500010000
50000
walking ability (m )
2500 020000
1500010000
50000
walking ability (m )
2500020000
1500 010000
50000
timepoint
10-year5-year3-monthpreoperative
Fig. 4 The histograms of a disability (ODI), b overall pain (VAS), c low back pain at rest (LBP), d leg pain while walking (LP), and e walking ability

2242 European Spine Journal (2020) 29:2231–2242
1 3
Open Access This article is licensed under a Creative Commons Attri-bution 4.0 International License, which permits use, sharing, adapta-tion, distribution and reproduction in any medium or format, as long as you give appropriate credit to the original author(s) and the source, provide a link to the Creative Commons licence, and indicate if changes were made. The images or other third party material in this article are included in the article’s Creative Commons licence, unless indicated otherwise in a credit line to the material. If material is not included in the article’s Creative Commons licence and your intended use is not permitted by statutory regulation or exceeds the permitted use, you will need to obtain permission directly from the copyright holder. To view a copy of this licence, visit http://creat iveco mmons .org/licen ses/by/4.0/.
References
1. Ciol MA, Deyo RA, Howell E, Kreif S (1996) An assessment of surgery for spinal stenosis: time trends, geographic variations, complications, and reoperations. J Am Geriatr Soc 44:285–290. https ://doi.org/10.1111/j.1532-5415.1996.tb009 15.x
2. Skolasky RL, Maggard AM, Thorpe RJ et al (2013) United States Hospital admissions for lumbar spinal stenosis. Spine 38:2272–2278. https ://doi.org/10.1097/BRS.0b013 e3182 a3d39 2
3. Genevay S, Atlas SJ (2010) Lumbar spinal stenosis. Best Pract Res Clin Rheumatol 24:253–265. https ://doi.org/10.1016/j.berh.2009.11.001
4. Weber C, Giannadakis C, Rao V et al (2016) Is there an associa-tion between radiological severity of lumbar spinal stenosis and disability, pain, or surgical outcome? Spine 41:E78–E83. https ://doi.org/10.1097/BRS.00000 00000 00116 6
5. Katz JN, Harris MB (2008) Lumbar spinal stenosis. N Engl J Med 358:818–825. https ://doi.org/10.1056/NEJMc p0708 097
6. Kovacs FM, Urrútia G, Alarcón JD (2011) Surgery versus con-servative treatment for symptomatic lumbar spinal stenosis. Spine 36:E1335–E1351. https ://doi.org/10.1097/BRS.0b013 e3182 0c97b 1
7. Lurie JD, Tosteson TD, Tosteson A et al (2015) Long-term out-comes of lumbar spinal stenosis: eight-year results of the spine patient outcomes research trial (SPORT). Spine 40:63–76. https ://doi.org/10.1097/BRS.00000 00000 00073 1
8. Atlas SJ, Keller RB, Wu YA et al (2005) Long-term outcomes of surgical and nonsurgical management of lumbar spinal steno-sis: 8–10 year results from the maine lumbar spine study. Spine 30:936–943. https ://doi.org/10.1097/01.brs.00001 58953 .57966 .c0
9. Fritsch CG, Ferreira ML, Maher CG et al (2017) The clinical course of pain and disability following surgery for spinal stenosis: a systematic review and meta-analysis of cohort studies. Eur Spine J 26:324–335. https ://doi.org/10.1007/s0058 6-016-4668-0
10. Fekete TF, Loibl M, Jeszenszky D et al (2018) How does patient-rated outcome change over time following the surgical treatment of degenerative disorders of the thoracolumbar spine? Eur Spine J 27:700–708. https ://doi.org/10.1007/s0058 6-017-5358-2
11. Zaina F, Tomkins-Lane C, Carragee E, Negrini S (2016) Surgical versus non-surgical treatment for lumbar spinal stenosis. Cochrane Database Syst Rev. https ://doi.org/10.1002/14651 858.CD010 264.pub2
12. Sinikallio S, Aalto T, Airaksinen O et al (2006) Depression and associated factors in patients with lumbar spinal stenosis. Disabil Rehabil 28:415–422. https ://doi.org/10.1080/09638 28050 01924 62
13. Aalto TJ, Leinonen V, Herno A et al (2011) Postoperative reha-bilitation does not improve functional outcome in lumbar spinal
stenosis: a prospective study with 2-year postoperative follow-up. Eur Spine J 20:1331–1340. https ://doi.org/10.1007/s0058 6-011-1781-y
14. Kuittinen P, Sipola P, Aalto TJ et al (2014) Correlation of lateral stenosis in MRI with symptoms, walking capacity and EMG find-ings in patients with surgically confirmed lateral lumbar spinal canal stenosis. BMC Musculoskelet Disord 15:247. https ://doi.org/10.1186/1471-2474-15-247
15. Schönström N, Lindahl S, Willén J, Hansson T (1989) Dynamic changes in the dimensions of the lumbar spinal canal: an experi-mental study in vitro. J Orthop Res 7:115–121. https ://doi.org/10.1002/jor.11000 70116
16. Fairbank JC, Pynsent PB (2000) The Oswestry disability index. Spine 25:2940–52 (discussion 2952)
17. Price DD, McGrath PA, Rafii A, Buckingham B (1983) The vali-dation of visual analogue scales as ratio scale measures for chronic and experimental pain. Pain 17:45–56
18. Breivik EK, Björnsson GA, Skovlund E (2000) A comparison of pain rating scales by sampling from clinical trial data. Clin J Pain 16:22–28
19. Tuomi K, Ilmarinen J, Jahkola A, Katajarinne L TA (1998) Work ability index. 2nd ed. Helsinki: Finnish Institute of Occupational Health. Occupational Health Care 19
20. Sinikallio S, Aalto T, Airaksinen O et al (2007) Lumbar spinal stenosis patients are satisfied with short-term results of sur-gery—younger age, symptom severity, disability and depression decrease satisfaction. Disabil Rehabil 29:537–544. https ://doi.org/10.1080/09638 28060 09026 46
21. Mannion AF, Denzler R, Dvorak J, Grob D (2010) Five-year outcome of surgical decompression of the lumbar spine without fusion. Eur Spine J 19:1883–1891. https ://doi.org/10.1007/s0058 6-010-1535-2
22. Bederman SS (2013) Commentary: Patient satisfaction in spi-nal surgery: should we be addressing customer service or health improvement? Spine J 13:507–509. https ://doi.org/10.1016/j.spine e.2013.02.031
23. Parai C, Hägg O, Lind B, Brisby H (2018) The value of patient global assessment in lumbar spine surgery: an evaluation based on more than 90,000 patients. Eur Spine J 27:554–563. https ://doi.org/10.1007/s0058 6-017-5331-0
24. Pakarinen M, Sinikallio S, Koivumaa-Honkanen H et al (2017) Low sense of coherence during postoperative recovery is associ-ated with a poorer lumbar spinal stenosis – surgical outcome: A 5-year follow-up study. J Health Psychol 22:347–355. https ://doi.org/10.1177/13591 05315 60347 1
25. Nilsson KW, Leppert J, Simonsson B, Starrin B (2010) Sense of coherence and psychological well-being: improvement with age. J Epidemiol Community Health 64:347–352. https ://doi.org/10.1136/jech.2008.08117 4
26. Vaillant GE (2003) Mental Health. Am J Psychiatry 160:1373–1384. https ://doi.org/10.1176/appi.ajp.160.8.1373
27. Anjarwalla NK, Brown LC, McGregor AH (2007) The outcome of spinal decompression surgery 5 years on. Eur Spine J 16:1842–1847. https ://doi.org/10.1007/s0058 6-007-0393-z
28. DeVine J, Norvell DC, Ecker E et al (2011) Evaluating the cor-relation and responsiveness of patient-reported pain with function and quality-of-life outcomes after spine surgery. Spine 36:S69–74. https ://doi.org/10.1097/BRS.0b013 e3182 2ef6d e
Publisher’s Note Springer Nature remains neutral with regard to jurisdictional claims in published maps and institutional affiliations.