unequal chances and unjust outcomes -...
TRANSCRIPT

Mirna Jusić
Unequal Chances and Unjust Outcomes Confronting Inequality in Southeast Europe
May 2018


Mirna Jusić
Sarajevo 2018
Unequal Chances and Unjust OutcomesConfronting Inequality in Southeast Europe


Preface 3
Executive Summary 5
1 Introduction 7
2 Inequality: Concepts and Debates 9
3 SEE Inequality in Figures 13
4 The SEE Labor Markets and Inequality 21
5 Social Protection and Inequality 31
6 Tax Policy and Inequality 41
7 Education and Inequality 47
8 Placing Inequality on the Policy Agendas of SEE Governments 57
9 Leveling the Playing Field, Leveling the Scores: Framework Recommendations 63
References 65
Contents


3
The Western Balkans remain a space defined not only by their shared history and culture but by their comparative economic stagnation. As a whole, the region still registers high unemployment, stagnant educational frameworks, and endemic brain drain. Despite a recent recovery with a substantive num-ber of jobs created, labor markets are marked by low activity rates, especially among women and youth, with long-term unemployment rates reach-ing up to 80 %, and a high degree of informality.
Struck by zero real growth since the finan-cial and economic crises of 2008, growth rates of around 6 percent should be both attainable and in-deed necessary for actual convergence with the Eu-ropean Union. While the current moderate growth is largely due to favorable external dynamics, struc-tural challenges remain ubiquitous. One such struc-tural issue at the core of many other problems – but seemingly overlooked by both local and external stakeholders – is inequality.
That is the central topic taken up by this study, which is one of the first in-depth comparative ex-aminations of inequality in Southeast Europe to date, a colossal task due to the challenges of con-ducting research in an area with both limited data and limited comparability between countries. Its analysis casts into stark relief the incomplete pro-cess of economic transition and transformation in the poorest corner of Europe. The report suggests that at the heart of the region’s economic malaise is a staggering degree of income inequality result-ing in disadvantages for some – in treatment, in op-portunities, and in shares. The cleavages detailed in this report are quite profound and indeed worse than what has been suggested by comparable re-search relying on consumption data alone.
Worse yet, the report argues that local govern-ment responses to inequality have been not only inadequate but that inequality has not been the substance of policy at all. Concentrating merely on poverty reduction, externally-induced reform agendas have also fallen short in addressing in-equality. The focus on free-market incentives has further compounded inequality when met by the weak state structures and social safety nets of the Western Balkan states. Failure to challenge corrup-tion and state capture have similarly led to unequal outcomes for citizens. This state of affairs has seri-ous consequences, ones manifested in the region’s aforementioned massive rates of emigration as well as anti-government protests.
This dynamic weighs heavily on the collective stability and integrity of the region, fuelling a cycle of hopelessness and disillusionment into which even well-intentioned reform initiatives struggle to make headway. Nevertheless, this report sug-gests several concrete policy directions for the revitalization of the Western Balkans in three broad categories. Labour market policy should be bolstered by including robust collective bargain-ing, greater income security and unemployment services, as well as active labour market policies targeted for underrepresented groups. Tax policy should be made progressive and social security nets made stronger by offering broader parental leave and a more robust social welfare regime. Lastly, education must be overhauled in order to assure equality of opportunity as well as of out-come – this includes making tertiary education more accessible as well as improving the quality of education and ensuring it reflects labour market needs.
Preface

4
Unequal Chances and Unjust Outcomes
All of this matters, of course, because the re-gion’s economic health is at the heart of its political future. The EU’s aspirations for genuine change and a generational turn towards peace and reconciliation all depend on the Western Balkans’ economic recov-ery. To accomplish as much will require an economic program with a genuine social agenda, one that will place at the center of its intentions the welfare of the so-called “losers of transition” – that is, the ordinary working peoples of Southeast Europe.
In its enlargement strategy of February 2018, the European Commission envisions a ‘new re-inforced social dimension’. This policy should be brought to life by extending the principles of the recently adopted European Pillar of Social Rights to pre-accession states. This recognition is timely, for emigration will remain the logical choice for too many as long as the region lacks secure, decent em-ployment, adequate incomes, and high-quality pub-lic services that allow everyone to partake equally in the economies of their home countries.
Felix Henkel, Director, Friedrich-Ebert-Stiftung, Dialogue Southeast Europe, May 2018

5
This report explores economic inequality in six countries of Southeast Europe (SEE): Albania, Bos-nia and Herzegovina (BiH), Croatia, Kosovo, Mac-edonia and Serbia. It looks at the ways in which inequality is mitigated through governments’ policy responses and reform priorities in light of EU inte-gration, concentrating on employment policy, tax and transfer systems, and education. The report’s key findings are summarized below:
• Income inequality is high in Southeast Eu-rope. European Union Statistics on Income and Living Conditions (EU-SILC) data show that Serbia and Macedonia have among the highest levels of income inequality in Europe. Only Croatia has moderate to low income ine-quality, on par with the EU28 average. EU-SILC data are not available for Albania, BiH and Ko-sovo, but estimates based on limited sources of survey data from different years suggest high income inequality in these countries. Income data imply higher levels of inequality than con-sumption data, as consumption expenditures are more equally distributed.
• Labor markets are a major cause of inequality in SEE. Income inequality is driven by unem-ployment and inactivity, precarious and infor-mal work. SEE economies’ labor market per-formance is generally poor, with high levels of unemployment, vulnerable and informal em-ployment. Youth unemployment is particularly high, and a significant cohort of young people remain outside of employment and education. Significant gender gaps in employment and pay persist. Roma tend to be at a greater risk
of unemployment and informal employment than non-Roma. Persons with disabilities in SEE have limited opportunities to engage in work.
• Tax and transfer systems do little to reduce inequality in the region. Tax systems are gen-erally insufficiently progressive and redistribu-tive, while social transfers tend to be meagre and cover only a small segment of the popula-tion.
• Lack of access to quality education increases inequality of opportunity and outcome. Stu-dents and pupils do not have access to educa-tion on an equal basis: students with disabilities, of Roma background, of poor socio-economic status and residing in rural areas are particu-larly disadvantaged. Low student performance on OECD’s PISA exams suggest poor quality education in SEE, which may result in young people’s social exclusion.
• Socioeconomic reforms fail to address in-equality. Despite its great repercussions, SEE governments have neglected economic in-equality in their socioeconomic reforms. La-bor market flexibilization and deregulation policies, along with the erosion of social safety nets to meet fiscal consolidation targets, have been detrimental to equality.
Broad recommendations for reducing inequality are offered, to be considered in light of countries’ idiosyncratic political and institutional setups and the prevalence of inequality’s specific generators:
Executive Summary

6
Unequal Chances and Unjust Outcomes
• In the labor market realm, strengthening so-cial dialogue and collective bargaining mecha-nisms for better working conditions and qual-ity jobs; extending the coverage and generosity of income security schemes; improving active labor market policy design, coverage, and tar-geting towards hard-to-employ groups; and strengthening capacities of public employ-ment services.
• In the taxation realm, increasing the progres-sivity of personal income tax and lowering the tax burden on low-wage earners to encourage their transition from inactivity or informal to formal employment; introducing various ‘make work pay’ schemes; and stepping up efforts to curb tax avoidance and evasion to improve governments’ ability to fund important public services.
• In the social protection realm, a move towards more universal entitlements, with greater cov-erage and more generous social transfers to protect individuals against social risks; dein-stitutionalization and the expansion of social services; and better family and work reconcili-ation policies.
• In the education realm, greater investment in early childhood education; comprehensive measures to increase access to all levels of education for disadvantaged students; and in-creasing the quality of education systems for easier education-to-work transitions and bet-ter integration in society.

7
With an ever-greater awareness of its worldwide rise in the last three decades,1 economic inequality has become front and center of political debates in recent years. A rise in income and wealth inequality has been powered by a number of forces, not lim-ited to globalization and technological progress. At the same time, there has been an absence of multi-faceted policy responses to mediate the effects of such forces, including policies on social protection, the labor market, taxation or education. In addition to grave social repercussions, such as poverty and social exclusion, high inequality has been shown to drag down economic growth, limit people’s oppor-tunities, and fuel the rise of right-wing populism.
The late and troublesome transformation from a planned to a market economy has made its mark on economic inequality in the countries of South-east Europe (SEE), where levels of income inequal-ity tend to be among the highest in Europe. Even more troublesome are indications that inequality in SEE has risen largely through the malign forces of state capture, corruption, and policy failures, rather than as a result of higher rewards to innovation, en-trepreneurship, and skills.
This report aims to understand and contex-tualize inequality in six countries that belong to SEE and the Western Balkans: Albania, Bosnia and Herzegovina (BiH), Croatia, Kosovo, Macedonia and Serbia. It primarily concentrates on income in-equality, linking it to other important dimensions of social inequality, such as gender, ethnicity, or place of residence. Potential causes of inequality are ex-amined by looking at policies in the realms of social
1 For instance, see: Facundo Alvaredo et al, World Inequality Report 2018 (Paris: World Inequality Lab, 2017), p. 9.
protection, education, taxation, the labor market and employment, which considerably determine how public resources are (re)distributed in these countries. In light of the EU accession prospects of five countries, the report explores the ways in which inequality is tackled through current socio-economic reform programs in the region.
Available indicators of inequality are not di-rectly comparable for the region, as they stem from different surveys and rely on different types of data (on income or consumption). As such, they paint a rather uneven picture on inequality in the region. Serbia and Macedonia have among the highest lev-els of income inequality in Europe, while income inequality in Croatia is lower and on par with the EU average. Consumption-based indicators suggest that inequality in BiH is moderate, but indicators re-lying on limited income data suggest the country’s income inequality to be even higher than in Serbia and Macedonia. Consumption inequality appears to be low in Albania and Kosovo, but indicators re-lying on limited income data suggest moderate to high levels of income inequality in both countries.
While there is some variety in their policy re-sponses, governments in the region have not done enough to mitigate the serious economic and po-litical consequences of inequality. In fact, policies that have sought to deregulate labor markets and make working conditions more flexible in the name of economic efficiency have fueled the rise of non-standard and precarious work. Despite high levels of structural unemployment, employment policies have remained weak and ineffective in most coun-tries. Inadequate social safety nets, characterized by poor coverage, ungenerous and largely income-tested social benefits, as well as underprovided
1 Introduction

8
Unequal Chances and Unjust Outcomes
social services, have also made their contribution to inequality in the region. Due to its low levels of progressivity, the tax burden on labor has dispro-portionally affected low wage earners, reducing their incentives to engage in (formal) employment. Although education is crucial for social mobil-ity, countries of the region face challenges both in terms of education quality and its accessibility.
At the same time, governments’ national re-form programs, largely prepared as part of coun-tries’ EU integration aspirations, have not placed measures to reduce inequality at their core in any substantial manner. Rather, reform packages tend to stress more fiscal consolidation, labor market deregulation, and other measures that may further fuel inequality in these countries.
The countries considered by this report be-long to a region which is undergoing systemic changes related to democratization and economic transition, while simultaneously facing tremendous obstacles, including unfavorable economic condi-tions and poor labor market performance, corrup-tion and bad governance, weak civil society, as well as a surge in authoritarianism or political conflict in some of them. Through the prism of inequality, the report seeks to provoke new thinking and discus-sion surrounding the issues of socio-economic re-form in the region, especially in light of its current course of EU integration.

9
Social inequality as a concept encompasses several dimensions, including economic, racial/ethnic, po-litical, and gender inequality, as well as inequality based on ability or one’s sexual orientation. Moreo-ver, it incorporates both inequality of outcome, pertaining to the unequal distribution of income or wealth among households or individuals; and inequality of opportunity, understood to mean that differences in the circumstances that are out-side of one’s control, such as family background, gender, or location, determine one’s income or wealth.2 Inequality of opportunity may arise as a result of inequality of treatment, where persons may be discriminated against due to circumstances such as gender, family background, or race. It may also arise because of unequal access to important public services, such as healthcare and education.3 Although the term inequality may mean “differ-ent things to different people,”4 various types of inequality are unavoidably intertwined. Atkinson, arguing against the notion that a ‘levelled’ playing field does not require intervention by means of re-distribution, points out that inequality of outcome “directly affects equality of opportunity – for the next generation.”5
In recent years, increasing attention has been paid to the inequality of income and wealth, after a
2 Anthony B. Atkinson, Inequality: What can be done? (Cam-bridge, MA: Cambridge University Press, 2015), p. 10.
3 Unequal access to services, on the other hand, may also occur because of discrimination, or because of differenc-es in conditions, such as location or parents’ educational background. See Ricardo Paes de Barros et al, Measuring Inequality of Opportunities in Latin America and the Carib-bean (Washington, D.C.: World Bank, 2009), pp. 29–37.
4 Atkinson, Inequality: What can be done? p. 2.
5 Ibid, p. 11.
number of influential scholarly works pointed to its rise in most of the world’s regions over the past dec-ades.6 Although there are great variations in income inequality across regions, with the highest being in the Middle East, and the lowest in Europe, the top 10 % income shares have risen worldwide.7 Looking at the dynamics of global income distributions in an era of “high globalization” (1988–2008), Milanovic points to an overall fall in global inequality fueled by a rise of real incomes of a “global middle class” in China and several other Asian economies, yet a simultaneous rise of the global super-rich and stag-nation of real incomes of the predominantly lower-middle cases in developed countries.8 According to the OECD, persons with lower and the lowest incomes have profited very little from economic growth in the past two decades; their incomes have, in the case of some countries, even fallen in real terms,9 especially after the last financial crisis. At the same time, there has been an unprecedented surge of incomes at the top 1 % of the income distribution.10
Scholars tend to agree that some inequality is inevitable, as there are bound to be differences in economic rewards due to individuals’ effort or luck, or because rewards are distributed differently
6 See, for instance, Thomas Piketty’s Capital in the Twenty-First Century (2014), Anthony Atkinson’s Inequality: What can be done? (2015) or Branko Milanovic’s Global Inequality (2016).
7 Alvaredo et al, World Inequality Report 2018, pp. 8–10.
8 Branko Milanovic, Global Inequality: A New Approach for the Age of Globalization (Cambridge, MA: The Belknap Press of Harvard University Press, 2016), pp. 11–24.
9 Organization for Economic Cooperation and Development (OECD), In it Together: Why Less Inequality Benefits All (Paris: OECD, 2015), pp. 20–21.
10 Ibid, p. 23.
2 Inequality: Concepts and Debates

10
Unequal Chances and Unjust Outcomes
depending on economic and social arrangements.11 However, high levels of inequality are seen to lead to grave repercussions. High inequality can result in poverty and social exclusion, which can ulti-mately undermine the social fabric. Societies that have high levels of economic inequality have been shown to have low levels of equality of opportunity,12 especially in terms of access to quality education and healthcare, making social mobility a difficult task and undermining individual and collective so-cial and economic potential.13 This means that in-equality “may jeopardise people’s ability to invest in their human capital or develop new ideas.”14 High inequality has, moreover, been shown to reduce economic growth and generally lower economic opportunities:15 according to the OECD, a rise of income inequality in the 1985–2005 period is esti-mated to have reduced cumulative growth for an average of 4.7 percentage points in OECD coun-tries for which data is available.16 Moreover, the so-cial discontent that stems from economic depriva-tion linked to inequality is seen to have given rise to right-wing populism in Europe and other parts of the world.17
Despite its repercussions, inequality has only recently become recognized as an acute social problem. This is usually credited to assumptions that have for a long time dominated the global economic discourse, especially since the dominant shift in thinking towards neoliberalism during the 1980s and 1990s. One such assumption has been the so-called inequality-economic performance trade-off, or the notion that greater equality can only be reached by sacrificing economic growth, as greater redistribution would negatively affect economic in-centives and thus undermine performance.18 How-
11 See, for instance, Atkinson, Inequality: What can be done? p. 9; Dani Rodrik, “Good and Bad Inequality,” Project Syndi-cate, Dec. 11, 2014.
12 Joseph E. Stiglitz, Rewriting the Rules of the American Economy: An Agenda for Growth and Shared Prosperity (New York, NY: Roosevelt Institute, 2015), p. 11.
13 OECD, In it Together, p. 15.
14 European Bank for Reconstruction and Development (EBRD), Transition Report 2016–2017, Transition for all: Equal oppor-tunities in an unequal world (London: EBRD, 2016), pp. 12–13.
15 OECD, In it Together, p. 15.
16 Ibid, p. 15.
17 For a discussion, see Milanovic, Global Inequality, pp. 192–211 Also see: Mark Gradstein and Branko Milanovic, “Does libertè = egalité? A survey of the empirical links between democracy and inequality with some evidence on the tran-sition economies,” Journal of Economic Surveys 18, no. 4 (2004): 515–537; Hanspeter Kriesi and Takis S. Pappas (eds), European Populism in the Shadow of the Great Recession (Colchester, UK: ECPR Press, 2015).
18 Arthur M. Okun, Equality and Efficiency: The Big Tradeoff (Washington, DC: Brookings Institution Press, 1975). For a discussion, also see Rodik, “Good and Bad Inequality.”
ever, such a notion has in the meantime been dis-missed. According to recent research by the IMF, “redistribution appears generally benign in terms of its impact on growth; only in extreme cases is there some evidence that it may have direct nega-tive effects on growth.”19 Related is the idea of the so-called “trickle-down economics,” where the awards of economic progress reaped by those at the top are expected to seep towards those at the bot-tom. However, this idea was also shown not to have worked,20 as trends towards greater inequality – de-spite a simultaneous rise in GDP growth – illustrate.
What is seen to drive income inequality, or conversely, reduce it? Forces such as globalization and technological progress are assumed to increase inequality. The former is seen to exert a downward pressure on wages and labor standards, and the lat-ter to lead to a greater remuneration of some skills (e. g. in information and communication technolo-gies) over others,21 and generally to widen the gap between high- and low-skilled workers in developed countries. However, research is rather inconclusive, especially with regards to the role of globalization. A 2011 OECD report, for instance, finds that “nei-ther rising trade integration nor financial openness had a significant impact on either wage inequality or employment trends within the OECD countries.” However, an increase in imports from low-income economies has had a tendency to increase wage dis-persion, albeit only in countries that have weaker employment protection legislation.22 There is more evidence of technological change having had an im-pact on inequality, as it has been shown to contrib-ute to a rise in overall wage dispersion, mainly in the upper half of the income distribution.23 On the other hand, Milanovic refers to ‘malign’ and ‘benign’ forces that have reduced income inequality throughout his-tory. In the former category are unfortunate events like wars and epidemics, while the latter pertains to “rising education, declining skilled wage premiums, and greater demand for social security.”24
Some authors believe that negative effects of globalization can be softened by deploying ade-quate policy measures as “equalizing mechanisms.”25 The OECD, for instance, sees globalization and
19 Jonathan D. Ostry, Andrew Berg, and Charalambos G. Tsan-garides, “Redistribution, Inequality and Growth,” IMF Staff Discussion Note, April 2014, p. 4.
20 Stiglitz, Rewriting the Rules, p. 14.
21 Ibid, p. 13.
22 OECD, Divided We Stand: Why Inequality Keeps Rising (Paris: OECD, 2011), p. 29.
23 OECD, Divided We Stand, p. 29.
24 For more, see Milanovic, Global Inequality, pp. 162–163; p. 4.
25 Atkinson, Inequality: What can be done? p. 2.

11
Inequality: Concepts and Debates
technological change to affect policies – and poli-cies, in turn, to affect income inequality.26 Stiglitz portrays the daily experience of inequality as being the tip of an iceberg, the drivers of inequality – laws and policies that affect the economy – to be just underneath the surface of that iceberg, while at its base are forces such as technological progress, glo-balization, and demographic change. It is through the “shapers” in the middle – the institutions or the “the intermediating structures that determine how global forces manifest themselves” – that such global forces are to be tackled.27 According to At-kinson, “technological progress is not a force of nature but reflects social and economic decisions” which impact the income distribution.28
Thus, in the recent thinking about inequality, ever greater importance is being afforded to institu-tions and their role in managing and shaping mar-kets, not just in terms of curbing market failures such as information asymmetries or monopolies, but in terms of restraining socially unfavorable outcomes.29
Broadly speaking, a rise in inequality is, inter alia, attributed to regulatory reforms that have been promoted and implemented worldwide in the 1980s and 1990s. Such reforms entail a combination of policies that were seen to enhance competition and economic growth, including, but not limited to, more relaxed product-market regulations, weak-ened employment protection legislation (EPL), es-pecially pertaining to workers on temporary con-tracts, a decline in minimum wages, deregulation of labor market institutions, including wage-setting mechanisms, the lowering of unemployment ben-efits and their replacement rates, the reduction of taxes on labor as to promote greater employment, etc.30 While some of these reforms, such as more flexible product market regulation or lower labor tax wedges, are seen to have enhanced labor mar-ket performance in terms of greater labor demand, they have also contributed to an increased disper-sion and inequality in wages.31
Structural discrimination between men and women on the labor market also translates into greater income inequality. While there have gener-ally been increases in the number of women join-ing the workforce in the past decades, the gender employment gap is still considerable (estimated at 16 percentage points between men and women in
26 OECD, Divided We Stand, p. 27.
27 Stiglitz, Rewriting the Rules, pp. 19–20.
28 Atkinson, Inequality: What can be done? p. 3.
29 For more, see Stiglitz, Rewriting the Rules, p. 15.
30 OECD, Divided We Stand, p. 30.
31 Ibid, p. 31.
the OECD, and 24 percentage points when adjust-ed for working hours, given the higher incidence of part-time work among women), as is the wage gap (women were estimated to earn, on average, 15 % less than men in the OECD in 2013). 32 Such gaps can primarily be attributed to a lack of adequate policies, including paid family leave, affordable childcare, proactive policies to promote women’s participation in the labor market, and equal pay policies, inter alia.33
The setup of a country’s tax and transfer system – which encompasses income and other taxes, differ-ent social security transfers, welfare and unemploy-ment benefits – may also contribute to inequality. This is especially so in the case of lower progressivity of taxes.34 The absence of sufficiently counter-cycli-cal social policies during economic downturns, when incomes experience sharp drops, also contributes to inequality.35 Although tax and benefit systems are seen to largely offset increases in market income ine-quality, their effectiveness in doing so has been shown to have decreased since the 1990s, especially as ben-efit eligibility criteria have been tightened, benefits have been cut and the progressivity in taxes has been reduced.36 In some countries, such as the US, lower-ing the marginal tax rates on the top earners and on capital gains, as to stimulate economic growth, has in fact amounted to a greater concentration of income and wealth at the top.37 A higher concentration of wealth (which is more concentrated than income), also enabled through the absence of adequate poli-cies on taxing capital gains or inheritance,38 has been shown both to increase inequality, limit investment and “can weaken potential growth.”39
Quality education and training is dubbed by the OECD as the key “transition mechanism” be-tween inequality and growth.40 Its reduced access, as well as a lack of investment in human capital of those with low incomes, leads to unused potential and lower social mobility.41 In his influential book Capital in the Twenty-First Century, Piketty finds a major force of convergence towards a reduction of inequality to be “the diffusion of knowledge and in-vestment in training and skills […] Knowledge and skill diffusion is key to overall productivity growth
32 OECD, In it Together, p. 32.
33 Stiglitz, Rewriting the Rules, p. 53.
34 OECD, In it Together, p. 15.
35 Ibid, p. 23.
36 OECD, Divided We Stand, p. 38.
37 Stiglitz, Rewriting the Rules, pp. 39–40
38 Ibid, p. 49.
39 OECD, In it Together, p. 16.
40 Ibid, p. 15.
41 Ibid.

12
Unequal Chances and Unjust Outcomes
as well as the reduction of inequality both within and between countries.”42 Investment in early child-hood education of disadvantaged children has been shown to deliver a host of beneficial outcomes, not limited to greater health, quality of life, higher in-comes of participants and their mothers, and a re-duced incidence of crime.43 Moreover, policies on investment in higher education and skill enhance-ment (through scholarships, tuition financing, de-velopment of vocational training systems, etc.) can significantly reduce income inequality.
Last but not least, how societies are governed also determines levels of inequality. Empirical evi-dence shows that high corruption may increase both income inequality and poverty. This is, inter alia, due to tax exemption for those with social connections, which ultimately undermines govern-ment’s ability to redistribute, and may weaken so-cial safety nets and public services, including edu-cation. It may also limit the effectiveness of social and healthcare spending by extending benefits to those relatively well-off.44
What may be the remedies to tackle inequal-ity of income and wealth? Some obvious ones ap-pear to include redistributive tax systems, effective employment policies, measures that enhance the quality and access to education or successful cor-ruption control. In light of the recognition of the fiscal pressures that social welfare states increas-ingly face, the focus of recent policy debates in the inequality realm has also been on the concept of “predistribution.” A predistributive strategy recog-nizes the importance of labor market institutions such as collective bargaining and a minimum wage in reducing income inequality, and seeks to “ad-dress the structural context of contemporary capi-talism: the quality of work and the satisfaction it generates; the allocation of ‘good’ and ‘lousy’ jobs; the prevailing framework of employment rights and market flexibility; and the extent to which markets work in the public interest by treating all consumers, including the most vulnerable, equita-bly,” thus decreasing the need for post-hoc state interventions.45
42 Thomas Piketty, Capital in the Twenty-First Century (London: The Belknap Press of Harvard University Press, 2014), p. 21.
43 For instance, see: Jorge Luis García, James J. Heckman, Dun-can Ermini Leaf, María José Prados, “The Life-cycle Benefits of an Influential Early Childhood Program,” HCEO Working Paper, 2016.
44 Sanjeev Gupta, Hamid Davoodi and Rosa Alonso-Terme, “Does corruption affect income inequality and poverty?” Economics of Governance 3, Issue 1 (March 2002): 23–45.
45 Claudia Chwalisz and Patrick Diamond, “Predistribution: A New Governing Prospectus for the Centre-left,” The Predis-tribution Agenda, eds. Claudia Chwalisz and Patrick Dia-mond (London: I. B. Tauris, 2015), pp. 2–3.
Ultimately, the complexity and mutual interac-tion of policies from different realms means that the underlying root causes of inequality may be dif-ficult to identify and tackle. This is especially true for transition economies, where the impact of insti-tutional and structural change on the distribution of income is compounded by other commonly rec-ognized drivers of inequality, and thus makes them difficult to distinguish.46 According to Perugini and Pompei, in such contexts “[…] basically every so-cial, economic, structural and institutional change affects the distribution of income, either directly or indirectly.”47 Fully cognizant of such challenges, some of the main culprits of inequality in the coun-tries of SEE are identified and discussed in the fur-ther text.
46 Cristiano Perugini and Fabrizio Pompei, “Income Distri-bution During and After Transition: A Conceptual Frame-work,” Inequalities During and After Transition in Central and Eastern Europe, eds. Cristiano Perugini and Fabrizio Pompei (Basingstoke: Palgrave Macmillan, 2015), p. 14.
47 Ibid, p. 12.

13
Inequality Measures and Challenges in the SEE Region
Income, consumption, or wealth inequality may be expressed by using different measures. The most widely used is the Gini coefficient, where 0 points denote perfectly equally distributed incomes, and 100 points signify that all income is accrued to one person. Given that the Gini coefficient does not provide information on whether or not income in-equality is a result of large differences in the lower or in the upper tails of the distribution, the S80/S20 quintile share ratio is also a useful indicator, as it al-lows us to compare the income gap between the top and bottom earners.48 It shows the ratio of the total disposable income received by the top quintile, or 20 % of the population with the highest income, to the bottom quintile, or 20 % of the population with the lowest income.
Inequality is usually measured on the basis of households and relies on household survey data on income or consumption. Differences may exist re-garding what is measured: for instance, in the case of ‘equivalized’ household income, an equivalence scale is applied to adjust household incomes for the composition of the household and economies of scale.49 Alternatively, in a ‘per capita’ approach,
48 Mario Piacentini, “Measuring Income Inequality and Poverty at the Regional Level in OECD countries,” OECD Statistics Working Papers, 2014/03 (Paris: OECD Publishing, 2014), p. 16
49 Commonly used is the OECD-modified equivalence scale, whereby a value of 1 is assigned to the household head, 0.5 to each additional adult household member and 0.3 to each child. Another increasingly used scale is the Square root scale, where household income is divided by the square root of the household size. OECD, “What are equivalence scales?” OECD Project on Income Distribution and Poverty, 2013.
the household income or consumption is divided by the number of household members.50 A house-hold’s market income denotes income from earn-ings, from capital, and private transfers, before tax-es and benefits; disposable income denotes income after taxes and benefits, and may include the value of public services or in-kind social transfers, such as education and healthcare.51
However, it is important to note that relying on household surveys, in general, comes with dif-ferent limitations, such as non-response rates or the downward bias in measuring inequality, as in-come shares accruing to the wealthiest households tend to remain undercounted for.52 Moreover, some vulnerable groups – including refugees, displaced persons, or ethnic groups such as the Roma – may not be covered by surveys. While administrative data such as income tax data may offer a more relia-ble glimpse into different sources of income, it also has its share of limitations. Besides the issue of tax avoidance and evasion, it may not capture as wide a variety of incomes as surveys (e. g. imputed rent for homes used by their owners),53 does not capture the incomes of those who do not file tax returns, or incomes from informal employment. In many re-
50 It should be noted, however, that there are various draw-backs to calculating inequality relying on ‘per capita’ con-sumption or income, not limited to the fact that it ignores economies of scale and different needs within a household. For more, see: Facundo Alvaredo and Leonardo Gasparini, “Recent Trends in Inequality and Poverty in Developing Countries,” CEDLAS Document no. 151, Nov. 2013, p. 9.
51 OECD, Divided We Stand, p. 26.
52 UNDP, Regional Human Development Report 2016, Pro-gress at Risk: Inequalities and Human Development in East-ern Europe, Turkey, and Central Asia (Istanbul: UNDP, 2016), p. 7.
53 Atkinson, Inequality: What can be done? p. 51.
3 SEE Inequality in Figures

14
Unequal Chances and Unjust Outcomes
gions of the world, including SEE, such data is also difficult to obtain.
Methodological challenges remain with re-spect to data comparability, given the different data sources available for the region. The European Union Statistics on Income and Living Conditions (EU-SILC) surveys, which collect information on income, living conditions, and labor market charac-teristics on a representative sample of households, are not available for all countries in the region. EU-SILC surveys have been conducted in Serbia (since 2013) and Macedonia (since 2010) and are available for Croatia as an EU member state. The BiH 2015 and 2011 Extended Household Budget Surveys, which focus on consumption, have integrated some EU-SILC variables, while Albania and Kosovo have also incorporated some EU-SILC variables in their Living Standards Measurement Survey (LSMS) and Household Budget Survey (HBS), respectively. As consumption is better recorded by HBS, and income sources are better recorded in EU-SILC, compara-bility of the data is an issue,54 as “the statement that inequality in one country is lower than in another is of limited meaning if the underlying statistics are not collected on a comparable basis.”55 In this case, the EU-SILC and HBS rely on different households and different time periods, define income and con-sumption components differently, and tend to use different equivalence scales. Moreover, while EU-SILC relies on a predefined and consistent set of variables as to ensure cross-country comparison, this is not the case for HBS in the region.56
Some authors have noted that the reliance on monetary income in measuring inequality and poverty in countries from the region, which have a substantial share of subsistence farming and non-market production, remittances or a large in-formal sector, may not lead to a reliable measure of inequality, and thus prefer consumption-based indicators.57 However, it is unclear to what extent such concerns generally hold for the region. For in-stance, while the inability to capture some in-kind items, such as the yields from farming consumed by households, is a limitation of EU-SILC surveys, remittances as well as incomes from informal em-
54 For more on differences between EU-SILC and HBS, see: Eurostat, Household Budget Survey 2010 Wave EU Quality report, 2015, p. 41.
55 Atkinson, Inequality: What can be done? p. 47.
56 Mihail Arandarenko, “Nejednaki dohoci, nejednaka potrošnja” [Unequal incomes, unequal consumption], Monitoring the So-cial Situation in Serbia (MONS) Platform, 6 July 2017.
57 For example, see: World Bank, “FYR of Macedonia: Measur-ing Welfare Using the Survey of Income and Living Condi-tions (SILC),” May 2015, p. 3, p. 8; World Bank, “An Update on Poverty and Inequality in Albania: 9 Stylized Facts,” May 2015, p. 25.
ployment are captured. While the inclusion of in-kind consumption might exert significant impact on the measurement of extreme or absolute poverty, its impact on the entire income distribution is dilut-ed and much weaker. The notion that in the coun-tries of SEE, almost all of which fall in the category of upper-middle income economies,58 subsistence agriculture makes up for a large part of income and consumption may be debated. Arandarenko, writing about Serbia, points out that the significance of in-kind income has declined with an overall increase in incomes and substantial changes in relative pric-es, also reflected in Serbia’s HBS: Such in-kind in-comes have declined from 7.3 % of total household income in 2003 to 4.3 % in 2016. Estimating the Gini coefficient for Serbia with and without income in-kind, Krstić finds the differences between the two estimates to be decreasing between 2006 and 2009, ranging between 2.5 and 1.7 Gini points.59
This report mainly relies on indicators of in-come inequality; consumption data is used where the former are not available. There are various methodological and practical reasons for this: Surveys relying on consumption tend to capture consumption expenditure, which means that ac-tual consumption may be exceeded by spending in some cases (e. g. when households buy durable goods), while in others, consumption may exceed spending (e. g. in the case of owner-occupied hous-ing). Questions of accuracy may also arise, as cer-tain items may be underreported.60 According to a 2016 UNDP report, decile data on the distribution of consumption in the wider SEE and CIS region “imply that virtually no one in the region earns (or at least spends) more than $ 100/day in purchasing-power-parity terms … [and] more than $ 50/day (in nominal terms). This corresponds to consumption expenditures of some $ 1,520 per month / $ 18,250 per year.”61 Moreover, consumption-based surveys do not reflect income saved, which may further un-derstate the income share of wealthy households, which have a high average propensity to save.62 Re-lying on income inequality estimates also ensures a better comparison with EU countries.
The income dispersion within and between countries may not suffice to understand inequal-ity’s structural traits, especially in light of recent
58 In line with GNI per capita calculations. Kosovo is a lower-middle income economy. World Bank, “World Bank Country and Lending Groups,” 2018.
59 Gorana Krstić, “Why Income Inequality is So High in Serbia: Empirical Evidence and Measurement of the Key Factors,” Economic Annals LXI, no. 2010 (July–Sept. 2016), p. 46.
60 Atkinson, Inequality: What Can be Done? pp. 33–34.
61 UNDP, Regional Human Development Report 2016, p. 17.
62 Ibid, p. 27.

15
SEE Inequality in Figures
influential studies that show that the distribution of capital ownership is habitually more concentrated than the distribution of income from labor. How-ever, the stock of wealth in post-communist coun-tries is considered to be relatively low compared to annual flows of income, as the transfer of property from state to private ownership began only very recently.64 In this report, a lack of reliable data on wealth is the main reason why wealth inequality is not addressed.
The Extent of Inequality in Six Countries of the SEE Region
The report primarily relies on available survey metadata and indicators on income (and where unavailable, on consumption). Both types of indica-tors reveal important trends over time. Figure 3.1 provides an overview of Gini coefficient estimates based on income data from Croatia, Macedonia, and Serbia.
63 Eurostat, “Gini coefficient of equivalised disposable income – EU-SILC survey.” For Macedonia, 2010 and 2011 based on Republic of Macedonia State Statistical Office, Survey of Income and Living Conditions 2012 (Skopje: State Statisti-cal Office, 2015). No EU-SILC data available for Albania, BiH and Kosovo.
64 Perugini and Pompei, “Income Distribution During and Af-ter Transition: A Conceptual Framework,” p. 13.
As can be discerned from Figure 3.1, inequal-ity levels in Croatia are moderate to low, showing a gradual, downward trend, converging with the aver-age level of inequality of EU28 countries and falling below this level in recent years. Inequality in Macedo-nia and Serbia is generally much higher, albeit show-ing opposite trends: while inequality remains high and is on a gradual rise in Serbia, it has decreased considerably in the past years in Macedonia. Albeit EU-SILC data are not available, limited income data from other surveys from different years suggests in-come inequality to be high in Albania, BiH and Ko-sovo. For instance, estimates of the Gini coefficient for Kosovo, provided for this report, calculated on an equivalized disposable household income basis using income data from a nationally representative survey on remittances,65 suggest that the Gini coeffi-cient was as high as 39.5 points in 2010.66 Relying on income data from the 2011 Extended HBS, inequal-ity in BiH was estimated to be as high as 44 points.67
65 United Nations Development Programme (UNDP), Kosovo Remittance Study 2010 (Prishtina: UNDP, 2010). Also see: Ju-dith Möllers and Wiebke Meyer, “The effects of migration on poverty and inequality in rural Kosovo,” IZA Journal of Labor & Development 3, no. 16 (2014), p. 12.
66 Based on the OECD modified equivalence scale. Calculation by Nermin Oruč, Director of Centre for Development Evalu-ation and Social Science Research (CDESS) from Sarajevo.
67 Ognjen Đukić and Nikolina Obradović, Nejednakost u BiH: Od praznih džepova do punih sefova (Banja Luka: GEA, 2016), p. 12.
Figure 3.1: Gini coefficients of equivalized disposable income (scale of 100), 2010–2016
Source: EU-SILC data, Eurostat63
30.5 30.8 30.5 30.5
30.9 31 30.8
31.631.2
30.9 30.9
30.2 30.4
29.7
40.9
38.5
38.8
3735.2
33.7 33.6
3838.6
38.2
38.6
25
27
29
31
33
35
37
39
41
43
2010 2011 2012 2013 2014 2015 2016
EU28 Croatia Macedonia Serbia

16
Unequal Chances and Unjust Outcomes
Calculations based on the 2015 Extended HBS, cal-culated on an equivalized disposable household in-come basis, suggest it was 41.4 Gini points in 2015. Similarly, estimates of income inequality in Albania, relying on equivalized household income data from the 2012 LSMS, suggest income inequality was 38.1 Gini points in 2012.69
Levels of inequality across the region, ex-pressed through Gini coefficient estimates that rely on household consumption data from different sur-vey sources, are shown in Figure 3.2.
Available data since 2000 paint a rather un-even picture of inequality in the region. Albeit there are some fluctuations, consumption inequality ap-pears to be low and falling in Kosovo.70 Although
68 For BiH, Croatia, Kosovo, Macedonia and Serbia, consump-tion data based on HBS; for Albania, based on LSMS data. Computed in World Bank’s Povcal database, available at: http://iresearch.worldbank.org/PovcalNet/.
69 Based on the OECD modified equivalence scale. Calculations by Oruč. For other estimates, please see: Edin Šabanović, “Basic consumption and income based indicators of eco-nomic inequalities in Bosnia and Herzegovina: evidence from household budget surveys,” Working Paper, United Nations Economic Commission for Europe Conference of European Statisticians, Expert meeting on measuring pov-erty and inequality, 25-27 Sept, 2017, Budva.
70 Recent indicators for Kosovo, albeit calculated on an equiv-alized, rather than per capita, basis, suggest that it con-sumption-based inequality was as low as 23.2 Gini points in 2015. For more, see: World Bank and Kosovo Agency of Statistics, Consumption Poverty in the Republic of Kosovo 2012–2015 (Washington, D.C: World Bank, 2017), p. 6.
data is scarce due to the infrequent administra-tion of surveys, in BiH, it appears to have risen since 2000 and has remained constant at moderate levels,71 while on a gradual decline and at relatively low levels in Albania. Consumption-based Gini coef-ficients for Serbia until 2010 suggest that inequal-ity had remained relatively constant and low, while it had fallen from moderate to relatively low levels in the case of Croatia. Having substantially risen since the turn of the millennium, inequality appears to have peaked during the economic crisis in Mac-edonia, and has, as Figure 3.1 suggests, been on a decline since.
Levels of inequality appear lower when using consumption rather than income data. However, disparities in levels of inequality suggested by in-come and consumption-based indicators should not be surprising for various reasons. According to the World Bank, “given that the marginal propensity to consume declines with income, or that savings increase with income, consumption expenditure tends to be more equally distributed than income.”72 According to Arandarenko, in order to claim that
71 A Gini coefficient of 31.2 points for 2015, calculated based on equivalized consumption using the extended HBS, sug-gested that inequality had remained constant in BiH. Agen-cy for Statistics of BiH, “First Release: Household Budget Survey 2015,” 28 July, 2017, p. 8.
72 World Bank, Poverty and Shared Prosperity 2016: Taking on Inequality (Washington, D.C.: World Bank Group, 2016), p. 79.
Figure 3.2: Gini coefficients (scale of 100), household consumption per capita, 2000–2013
Source: World Bank Povcal Database68
31.74
29.98
28.96
29.97
34.04
33.06
33.83
29.68
33.7133.18
27.4
28.95
31.24
30.3231.78
33.25
27.83
29.4
26.71
34.26
38.51 38.72
38.7739.31
42.64
44.05
31.97
32.9833.43
29.67 29.43
28.1828.67
29.6529.1
25
27
29
31
33
35
37
39
41
43
45
2000 2001 2002 2003 2004 2005 2006 2007 2008 2009 2010 2011 2012 2013
Albania BiH
Croatia Kosovo
Macedonia Serbia

17
SEE Inequality in Figures
the difference between a Gini coefficient based on income and one based on consumption for a given country was exceptionally great, an introspection is needed into the average difference between the two in a comparative perspective, relying on compara-ble data sources.73 In the case of the region, due to methodological differences between surveys, one cannot simply take the (disposable) income Gini coefficient from EU-SILC, for instance, and deduct from it the consumption-based Gini coefficient from HBS, using the difference for either national or international comparisons.74
While the immediate reasons behind trends in inequality are not always easy to discern, some evidence is available. Recent reductions in public sector wages and in pensions in Serbia are seen to have been conducive to reducing income inequal-ity, but other recent fiscal consolidation measures and structural reforms worked in the opposite di-rection; as a result, inequality has remained high and stable.75 In Macedonia, a substantial decrease in inequality is seen to be the result of greater em-ployment of workers in the bottom of the distri-bution, largely due to employment programs and public expenditure on construction projects.76 On the other hand, the small decline in inequality in Al-bania between 2008 and 2012 is attributed to a drop in consumption of those in the top 10 % following the economic crisis.77
73 According to Arandarenko, scarce empirical evidence rely-ing on the same or similar sources of data (e. g. survey on same household sample in the same period and using the same methodology) shows a difference between six and eight Gini points. Arandarenko, “Unequal incomes, un-equal consumption.”
74 One example of the methodological differences affecting such comparisons, both within and between countries, relates to the use of equivalence scales. While the income Gini from EU-SILC is calculated using equivalence scales, the consumption Gini calculated from HBS either places equal weight on each person, adult and child alike, or relies on standard OECD equivalence scales, which are different from the modified scales used by EU-SILC. As a result, the values of consumption Ginis from HBS very much depend on the demographic characteristics of a country in question, with ‘younger countries’ having, ceteris paribus, higher con-sumption Ginis than countries with less children and with smaller average household size. This would further imply that the difference between the income Ginis based on equivalized adults (as in EU-SILC) and HBS per capita con-sumption Ginis will, ceteris paribus, tend to be larger for countries with a higher share of children in the population. This is only one of several equally important reasons why it is not possible to directly compare the values of income Ginis from EU-SILC and consumption Ginis from HBS.
75 Mihail Arandarenko, Gorana Krstić and Jelena Žarković Rakić, “Analysing Income Inequality in Serbia: From Data to Policy,” Executive Summary (Belgrade: Friedrich-Ebert-Stiftung, 2017), pp. 6–7.
76 World Bank, “Macedonia, FYR,” Country Poverty Brief, Oc-tober 2017.
77 World Bank, “An Update on Poverty and Inequality in Al-bania.”
Where do such estimates place countries in a comparative perspective? Relying on an inter-national categorization of inequality by Alvaredo and Gasparini, countries predominantly fall in the ‘middle range’ category (30–40 Gini points). Croa-tia joins mainly EU countries in the ‘low’ inequality group (20–30 Gini points). Conversely, Serbia has the highest income inequality out of the countries measured by EU-SILC (EU28 and candidate coun-tries) in 2016, edging close to the ‘high’ inequality category (40–50 Gini points), a group that includes China, India, and Brazil.78 Consumption-based indi-cators suggest Kosovo and Albania to be in the ‘low’ inequality category, while limited income-based es-timates place them into the ‘middle range.’ While its consumption inequality may be moderate, vari-ous estimates of income inequality based on limited income data place BiH in the ‘high inequality’ cat-egory, making it the region’s most unequal country.79
Figures 3.3 and 3.4 show the S80/S20 income quintile share ratio using the income and consump-tion data available, respectively.
Looking at Figure 3.3, the richest 20 % in Ser-bia had almost ten times the income of the poor-est 20 %. This is in significant contrast with Croa-tia, where the richest fifth grossed five times the income of the poorest fifth of the population, ap-proximately on par with the EU28 average. Calcula-tions of income inequality in BiH in 2015, relying on data from the Extended HBS, suggest that the S80/S20 ratio was as high as 10.4. Relying on the 2012 LSMS, calculations suggest that the richest 20 % had seven times as much as the poorest 20 % in Albania in 2012.80 Due to different survey methodologies, these estimates are, however, not directly compara-ble with those generated through EU-SILC.
Calculations of consumption vs. income-based indicators highlight the same disparities as in the case of the Gini coefficient, as Figure 3.4 shows generally lower levels of inequality. Available per capita disposable household consumption data (Figure 3.4) suggest the lowest levels of inequality to be in Kosovo, with the richest fifth of the popula-tion having close to four times the income of the poorest fifth in 2013. Nevertheless, quintile share ratios suggest trends in inequality that are fairly consistent with those shown by Gini indices, both in the case of income and consumption data.
Available evidence seems to suggest that levels of inequality in the countries that were once a part
78 See Atkinson, Inequality: What can be done? pp. 21–23.
79 E. g. Alvaredo and Gasparini, “Recent Trends in Inequal-ity and Poverty,” p. 14. Atkinson, Inequality: What can be done? pp. 22–23.
80 Calculations for BiH and Albania by Oruč.

18
Unequal Chances and Unjust Outcomes
of former Yugoslavia are on par or higher than be-fore the country’s disintegration.81 Income inequal-ity in Yugoslavia was estimated to vary between 30 and 32 Gini points between the early and late 1980s.83 Of course, such indicators are not directly compa-rable with estimates of inequality from more recent years; moreover, disparities in income (and in lev-els of income inequality) between the republics of former Yugoslavia are well-documented.84 Limited data suggests that inequality may have, in fact, sub-stantially risen in some of the countries following Yugoslavia’s break-up. Available data for Croatia show, for instance, the Gini coefficient to be only 22.8 points in 1988; 28.8 points in 1998; and rising up to 33.7 points in 2008.85
It is important to note that national averages
81 Data not available for Albania for levels before transition.
82 Eurostat, “S80/S20 income quintile share ratio by sex and selected age group – EU-SILC survey.” For Macedonia, 2010 and 2011 based on Republic of Macedonia State Statistical Office, Survey of Income and Living Conditions 2012 (Skop-je: State Statistical Office, 2015). No EU-SILC data available for Bosnia and Herzegovina, Albania and Kosovo.
83 Branko Milanovic, “Poverty in Eastern Europe in the Years of Crisis, 1978 to 1987: Poland, Hungary, and Yugoslavia,” The World Bank Economic Review 5, no. 2 (1991): p. 198.
84 See, for instance, Branko Milanovic, The Haves and the Have-Nots: A Brief and Idiosyncratic History of Global In-equality (New York, NY: Basic Books, 2011), pp. 76–77.
85 Based on different sources of income and consumption data. For more, see Povcal database.
may cloak within-country regional disparities in in-come or consumption. Available indicators for SEE countries support empirical evidence showing a positive link between urbanization and inequality,86 with the exception of Serbia.87 For instance, a pov-erty and inequality map constructed for Albania shows that while the Gini coefficient for the coun-try was estimated at around 24 points using 2012 data, the highest level of inequality was found in the Tirana region (25.7 points), and the lowest in the country’s mountain region (22.7 points).88 In Kosovo and BiH, the Gini coefficient has also con-sistently been higher for urban areas.89 However, as
86 E. g. Kanbur and Zhuang (2013) in Piacentini, “Measuring In-come Inequality and Poverty at the Regional Level in OECD Countries,” p. 14.
87 In Serbia, available indicators suggest a slightly higher in-equality in rural rather than urban areas. For instance, see Statistical Office of the Republic of Serbia, “Serbia Income and Living Conditions 2013” (Belgrade: Statistical Office of the Republic of Serbia, 2015), p. 7.
88 For more, see María, E. Dávalos and Ledia Thomo, Portraits of poverty and inequality in Albania (Washington, D.C.: World Bank Group, 2016), p. 28.
89 World Bank and Kosovo Agency of Statistics, Consumption Poverty in Kosovo; World Bank, Poverty and Inequality in BiH 2007–2011 (Washington, D.C.: World Bank Group, 2015).
90 For BiH, Croatia, Kosovo, Macedonia and Serbia, consump-tion data based on HBS; for Albania, based on LSMS. Com-puted in World Bank’s Povcal database.
91 Pertains to the percentage of the population living below national poverty lines. Because of differences in estimating poverty, as well as country-specific poverty lines, estimates
Figure 3.3: S80/S20 income quintile share ratio, total population
Source: EU-SILC data, Eurostat82
4.9 5 5 5
5.2 5.2 5.2
5.5 5.65.4 5.3
5.15
10.2
8.4
7.2
6.6 6.6
8.6
9.8
9
9.7
4
5
6
7
8
9
10
11
2010 2011 2012 2013 2014 2015 2016
EU28 Croatia
Macedonia Serbia

19
SEE Inequality in Figures
Figure 3.4: Quintile share ratio S80/S20, consumption
Source: Authors’ calculation based on World Bank’s Povcal Database90
Figure 3.5: Poverty headcount ratio at national poverty lines (% of population)91
Source: World Development Indicators, World Bank
4.83 4.4
4.27
4.41
5.665.44
5.68
4.45
5.29 5.24
3.9
4.22
4.874.8 5.04
5.33
4.11
4.38
3.87
6.22
7.33 7.40 7.42
7.83
9.30 9.31
4.96
5.23
5.26
5.54
4.54 4.46
4.144.28
4.564.41
3
4
5
6
7
8
9
10
2000 2001 2002 2003 2004 2005 2006 2007 2008 2009 2010 2011 2012 2013
Albania BiH
Croatia Kosovo
Macedonia Serbia
12.4%
14.3%
17.9%
16.9%
20.6%20.9%
20.4%
19.5% 19.4%20.0%
19.5%
22.9%
17.5%
21.1%
17.6%
26.8%
26.2%
24.2%
22.1%
24.5%
25.4% 25.4% 25.5%
12,0%
16,0%
20,0%
24,0%
28,0%
2008 2009 2010 2011 2012 2013 2014 2015
Albania BiH
Croatia Kosovo
Macedonia Serbia

20
Unequal Chances and Unjust Outcomes
with other indicators, it is difficult to study the dis-parities between urban and rural inequality in more depth due to a lack of data, especially as “house-hold surveys are rarely designed to be representa-tive at the regional level.”93 This, in turn, may make it difficult for policy-makers to design measures that would target specific regions affected by high inequality.
It is, moreover, also important to empha-size that low levels of inequality do not necessar-ily mean a decent living for everyone. Kosovo, for instance, has low levels of consumption inequality; however, the poverty headcount ratio at the na-tional poverty line suggests that close to 18 % of the population had been living in poverty in 2015. The poverty headcount ratio at $ 5.50 per in Purchas-ing Power Parity (PPP) terms shows poverty levels to be among the highest in the region (Figures 3.5 and 3.6). In other words, a considerable part of the
across countries are not comparable and may not be com-parable within countries if methodologies are changed be-tween different years. For more, see: World Bank, World Development Indicators, 2018.
92 Pertains to the percentage of the population living on less than $ 5.50 a day at 2011 international prices. Reflects World Bank’s absolute poverty line for upper-middle in-come countries. Comparability issues remain due to differ-ent data sources. For more, see: World Bank, World Devel-opment Indicators, 2018.
93 Piacentini, “Measuring Income Inequality and Poverty at the Regional Level in OECD Countries,” p. 9, p. 15.
population may, in fact, find themselves to be equal in poverty.
Figure 3.6: Poverty headcount ratio at $ 5.50 per day (2011 PPP) (% of population)92
Source: World Development Indicators, World Bank
35.8
39.1
3.84.7
6.27.1 7.3
7.16.3
44.7 45.3
41.1
28.5
23.9
35
32 32
30.129
25.1
5.86.8
9.7 9.2
0
5
10
15
20
25
30
35
40
45
50
2008 2009 2010 2011 2012 2013 2014 2015
Albania BiH
Croatia Kosovo
Macedonia Serbia

21
Working in low-paying jobs or being excluded from work are important culprits of inequality in the SEE region. Almost all of the countries considered face a complex set of problems in their labor markets, which inevitably contribute to unequal outcomes. Although the job creation rate has picked up in re-cent years, it hasn’t sufficed in order “to address the many challenges”94 of these labor markets, not lim-ited to generally poor labor market performance, job vulnerability and the exclusion of a number of groups from employment.
High Inactivity and Unemployment, Low Employment
The problems of SEE labor markets are complex indeed. The percentage of economically active per-sons in the working-age population is lower than the EU28 average in most countries (Figure 4.1). Inactivity is especially high in Kosovo and BiH, where the share of those of working age who are inactive is greater than the share of those who are employed.
Data from the 2016 EU-SILC surveys shows that levels of work intensity in three countries of the region are among the lowest in Europe;95 in
94 World Bank and the Vienna Institute for International Eco-nomic Studies (wiiw), Western Balkans Labor Market Trends 2017 (Washington, D.C.: World Bank and wiiw, 2017), p. 1.
95 Serbia, Macedonia and Croatia are among the countries with the largest proportion of persons living in households with very low work intensity, with Serbia boasting the low-est work intensity in Europe at 21.2 %. Data not available for other countries. See: Eurostat, “People living in house-holds with very low work intensity by age and sex (popula-tion aged 0 to 59 years).”
Serbia, the number of households with a very low work intensity (members working on average less than 2.5 months per year) has been continuously increasing.96
Moreover, the region is generally marked by low employment and high unemployment. Employ-ment rates of women are considerably lower than those of men (Figure 4.2). Moreover, youth unem-ployment in the region is high, and exceptionally so in Kosovo and BiH (Figure 4.3). Largely due to the structural nature of unemployment, long-term unemployment is a serious issue throughout the re-gion, with the majority of job-seekers looking for employment for a year or longer.
Research from the region shows that inactiv-ity and unemployment have a highly significant im-pact on inequality, increasing the income share of those at the top and reducing the share of those at the bottom.97 Country-level evidence confirms the importance of salaried employment in understand-ing inequality and poverty. A World Bank report on Macedonia shows that poor households and the ones in the bottom 40 % were significantly less like-ly to have income from salaried employment than those that were not poor and belonged to the top 60 %.98 A recent FES study of inequality in Serbia has shown that, out of different sources of income, wages contributed the most to total income in-equality at 93 %, increasing inequality; while wages
96 Arandarenko, Krstić and Žarković Rakić, “Analysing Income Inequality in Serbia: From Data to Policy,” p. 3.
97 Zsoka Koczan, “Being Poor, Feeling Poorer: Inequality, Poverty and Poverty Perceptions in the Western Balkans,” WP/16/31 (Washington, D.C.: International Monetary Fund, 2016).
98 World Bank, “FYR of Macedonia: Measuring Welfare using SILC,” p. 14.
4 The SEE Labor Markets and Inequality

22
Unequal Chances and Unjust Outcomes
Figure 4.1: Activity rates, 2016, % of working-age population (15–64)99
SEE Jobs Gateway100/Eurostat101
Figure 4.2: Employment rates, 2016, % of working-age population (15–64)
Source: SEE Jobs Gateway / Eurostat
66.2%
54.2%
65.6%
39.6%
64.5% 65.6%
72.9%74.1%
66.2%
70.3%
59,0%
77.8%
73.1%
78.5%
58.3%
41.9%
60.9%
19.3%
50.8%
58.1%
67.3%
0%
10%
20%
30%
40%
50%
60%
70%
80%
90%
Albania BiH Croatia Kosovo Macedonia Serbia EU28
total male female
55.9%
40.2%
59.9%
28.7%
49.1%
55.2%
66.6%
61.9%
51.1%
61.4%
43.6%
58.6%
61.9%
71.8%
49.7%
29.1%
52.4%
13.1%
39.2%
48.4%
61.3%
0%
10%
20%
30%
40%
50%
60%
70%
80%
Albania BiH Croatia Kosovo Macedonia Serbia EU28
total male female

23
The SEE Labor Markets and Inequality
from self-employment tend to increase inequality in100 the101 EU, in Serbia, they had the opposite effect, as the self-employed generally earn very low incomes.102
Work intensity plays an important part in that regard: In Serbia, the lower income quintile “has a much higher share of persons (aged up to 59) who live in households with very low work inten-sity than the richest quintile group, which widens inequality.”103 The recent FES study on Serbia sug-gests that income inequality may be significantly reduced by employing or increasing the duration of the working period of working-age members of very low work intensity households.104 On the other hand, EU-SILC data show that the percentage of persons living in households with very low work intensity in Macedonia has been constantly de-creasing in recent years. The substantial decrease in inequality from 42.8 to 36.6 Gini points between
99 Refers to the percentage of the labor force – the employed and unemployed – in the overall working-age population.
100 World Bank and wiiw, “The Jobs Gateway in South Eastern Europe” database, available at: https://www.seejobsgateway.net/charts. Data based on national labor force surveys (LFS).
101 Eurostat, “Employment and unemployment statistics,” based on LFS data.
102 Arandarenko, Krstić and Žarković Rakić, “Analysing Income Inequality in Serbia: From Data to Policy,” pp. 4–5.
103 Krstić, “Why income inequality is so high in Serbia,” p. 33.
104 Arandarenko, Krstić and Žarković Rakić, “Analysing Income Inequality in Serbia: From Data to Policy,” p. 4.
2009 and 2014 in Macedonia is attributed to a rise in the incomes at the bottom of the distribution as a result of greater employment opportunities for low-skilled workers generated, inter alia, by em-ployment programs, government subsidies to FDI and a substantial increase in public expenditure on construction, “which raises concerns about the sus-tainability of these gains.”105
Job Vulnerability Increases Inequality
The proliferation of non-standard work, which lends itself to lower wages than those stemming from standard work and generally more irregular working hours and insecure working conditions,106 has also made its mark in the region. Reports of working conditions in SEE labor markets point to their multi-dimensional duality: ‘Standard,’ perma-nent jobs, vs. non-standard employment; formal vs. informal employment; and private vs. public sector employment, with the latter providing greater job security and higher wages.107 ‘Decent’ jobs, gener-
105 World Bank, “Macedonia, FYR,” Country Poverty Brief, Oc-tober 2017.
106 OECD, In it Together, p. 16.
107 A recent analysis shows that the average wages in the public sector in the Western Balkans were higher than wages in the private sector. Given that workers in the pub-
Figure 4.3: Unemployment rates (15+) and youth unemployment rates (15–24) for SEE and EU28 (15–74) in 2016, % of labor force
Source: SEE Jobs Gateway / Eurostat
15.2%
25.4%
13.1%
27.4%
23.7%
15.3%
8.4%
36.5%
54.3%
31.3%
52.3%
48.2%
34.9%
18.7%
0%
10%
20%
30%
40%
50%
60%
Albania BiH Croatia Kosovo Macedonia Serbia EU28
total youth

24
Unequal Chances and Unjust Outcomes
ally understood as jobs in the formal sector that give employees access to social protection, regular working hours, contracts and a decent wage, are considered to be scarce.109 Although job quality in-dicators are not available, the category of ‘vulner-able employment’ – which pertains to the sum of own-account workers and contributing (unpaid) family workers – may serve as a proxy. The share of vulnerable employment in most SEE states is con-siderably greater than the EU28 average, the largest being in Albania (Figure 4.4).
Country-specific research suggests that the type of employment and wage levels affect work-ers’ wellbeing and has an effect on inequality. Us-ing data from EU-SILC, Krstić shows that those who are self-employed, in temporary jobs or work-ing part time in Serbia are at a significantly higher
lic sector tend to be high-skilled, when adjusted for dif-ferences in workers’ characteristics, such wage differences were small in Montenegro, Albania and Kosovo, but were significantly more pronounced in Serbia, Macedonia and BiH. For more, see Marko Vladisavljević, Edlira Narazani and Vojin Golubović, “Public-private wage differences in the Western Balkan countries,” Foundation for the Ad-vancement of Economics (FREN) and Institute of Economic Sciences, Belgrade, Albanian Centre for Socio-Economic Research (ACSER), Institute for Strategic Studies and Prog-noses, Munich Personal RePEc Archive (MPRA) Paper no. 80739, 30 June 2017.
108 ILO modelled estimates and projections as of November 2016. Available at: http://ilo.org/ilostat.
109 UNDP, Regional Human Development Report 2016, pp. 36–37.
risk of poverty than persons engaged in standard, full-time work.110 For the self-employed, this is not surprising, as “a large proportion […] are informal workers who are outside social protection systems and generally in low-paid, low-productivity jobs.”111 Studies carried out in Croatia, Slovenia, and BiH point to differences in wages as a crucial source of income inequality in these countries.112 Thus, “inequalities among the employed can be as great, or greater, than those between the employed and unemployed.”113
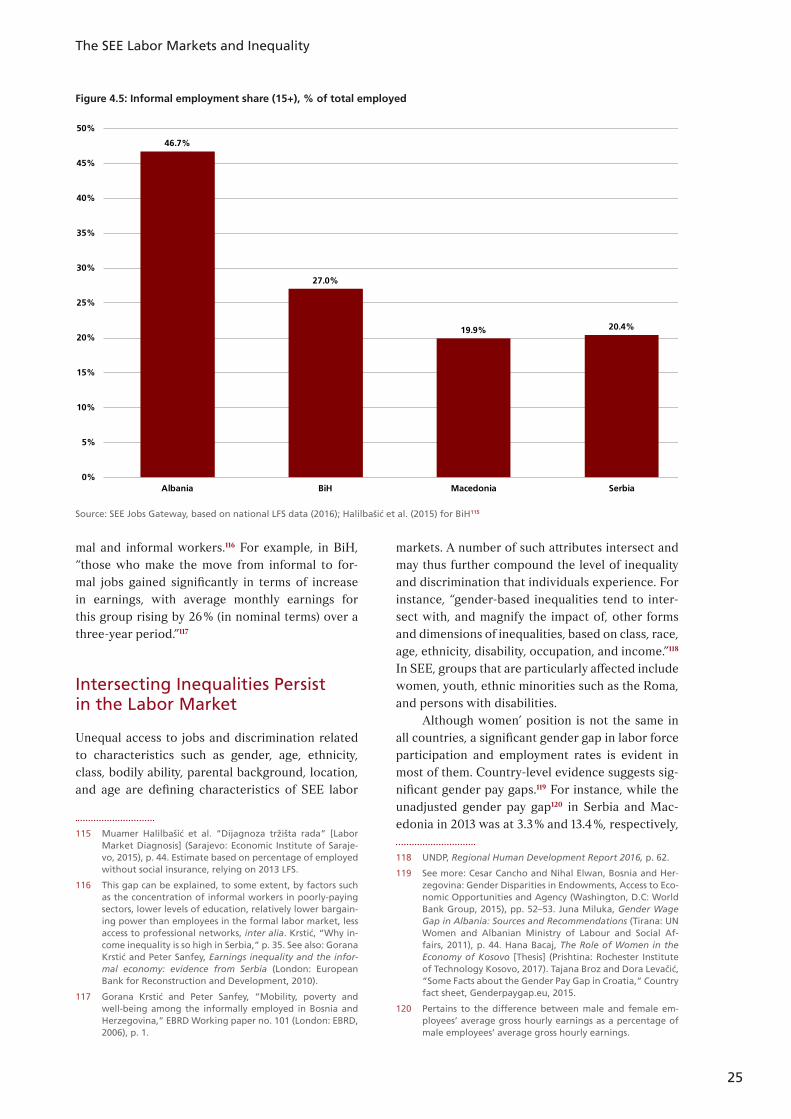
As the most vulnerable type of employment, informal employment is high in the countries of the region for which estimates are available (Fig-ure 4.5).114
Country-level evidence suggests that informal employment increases income inequality. Inter alia, this is due to significant earning gaps between for-
110 Krstić, “Why income inequality is so high in Serbia,” pp. 35–36.
111 Ibid, p. 35.
112 See, for example, Mitja Čok and Ivica Urban, “Distribution of Income and Taxes in Slovenia and Croatia,” Post-Com-munist Economies 19, no. 3 (2007). Đukić and Obradović, Nejednakost u BiH.
113 UNDP, Regional Human Development Report 2016, p. 30.
114 Informal employment pertains both to employment in in-formal or unregistered companies, or in registered com-panies under informal conditions (e. g. wages in cash, no benefits, labor rights or a written contract). UNDP, Regional Human Development Report 2016, pp. 30–31.
Figure 4.4: Vulnerable employment as % of total employment
Source: Author’s calculations based on ILOSTAT database108
56.6%
30.4%
21.8%20.3%
11.8%10.4%
0%
10%
20%
30%
40%
50%
60%
Albania Serbia Macedonia BIH EU28 Croatia
25
The SEE Labor Markets and Inequality
mal and informal workers.116 For example, in BiH, “those who make the move from informal to for-mal jobs gained significantly in terms of increase in earnings, with average monthly earnings for this group rising by 26 % (in nominal terms) over a three-year period.”117
Intersecting Inequalities Persist in the Labor Market
Unequal access to jobs and discrimination related to characteristics such as gender, age, ethnicity, class, bodily ability, parental background, location, and age are defining characteristics of SEE labor
115 Muamer Halilbašić et al. “Dijagnoza tržišta rada” [Labor Market Diagnosis] (Sarajevo: Economic Institute of Saraje-vo, 2015), p. 44. Estimate based on percentage of employed without social insurance, relying on 2013 LFS.
116 This gap can be explained, to some extent, by factors such as the concentration of informal workers in poorly-paying sectors, lower levels of education, relatively lower bargain-ing power than employees in the formal labor market, less access to professional networks, inter alia. Krstić, “Why in-come inequality is so high in Serbia,” p. 35. See also: Gorana Krstić and Peter Sanfey, Earnings inequality and the infor-mal economy: evidence from Serbia (London: European Bank for Reconstruction and Development, 2010).
117 Gorana Krstić and Peter Sanfey, “Mobility, poverty and well-being among the informally employed in Bosnia and Herzegovina,” EBRD Working paper no. 101 (London: EBRD, 2006), p. 1.
markets. A number of such attributes intersect and may thus further compound the level of inequality and discrimination that individuals experience. For instance, “gender-based inequalities tend to inter-sect with, and magnify the impact of, other forms and dimensions of inequalities, based on class, race, age, ethnicity, disability, occupation, and income.”118 In SEE, groups that are particularly affected include women, youth, ethnic minorities such as the Roma, and persons with disabilities.
Although women’ position is not the same in all countries, a significant gender gap in labor force participation and employment rates is evident in most of them. Country-level evidence suggests sig-nificant gender pay gaps.119 For instance, while the unadjusted gender pay gap120 in Serbia and Mac-edonia in 2013 was at 3.3 % and 13.4 %, respectively,
118 UNDP, Regional Human Development Report 2016, p. 62.
119 See more: Cesar Cancho and Nihal Elwan, Bosnia and Her-zegovina: Gender Disparities in Endowments, Access to Eco-nomic Opportunities and Agency (Washington, D.C: World Bank Group, 2015), pp. 52–53. Juna Miluka, Gender Wage Gap in Albania: Sources and Recommendations (Tirana: UN Women and Albanian Ministry of Labour and Social Af-fairs, 2011), p. 44. Hana Bacaj, The Role of Women in the Economy of Kosovo [Thesis] (Prishtina: Rochester Institute of Technology Kosovo, 2017). Tajana Broz and Dora Levačić, “Some Facts about the Gender Pay Gap in Croatia,” Country fact sheet, Genderpaygap.eu, 2015.
120 Pertains to the difference between male and female em-ployees’ average gross hourly earnings as a percentage of male employees’ average gross hourly earnings.
Figure 4.5: Informal employment share (15+), % of total employed
Source: SEE Jobs Gateway, based on national LFS data (2016); Halilbašić et al. (2015) for BiH115
46.7%
27.0%
19.9% 20.4%
0%
5%
10%
15%
20%
25%
30%
35%
40%
45%
50%
Albania BiH Macedonia Serbia

26
Unequal Chances and Unjust Outcomes
the adjusted one was 11 % and 17.9 %. Women would need to work 40 more days in Serbia and 65 more days in Macedonia to earn the same annual wage as an equivalent male worker.122 Sectoral segrega-tion, rooted in gender-specific specialization dur-ing the course of education, makes it less likely for women to work in the industry, where incomes and labor productivity are significantly higher than the national average.123 Women in the region also face glass ceilings and walls, and experience greater bar-riers as entrepreneurs in accessing finance, credit, and new technologies.124
Gender biases and traditional notions of gender roles have contributed to women’s over-representation in unpaid care work in the region.125
121 For the survey, data pertaining to non-Roma were collected from non-Roma respondents residing in proximity to Roma communities. UNDP, World Bank and European Commission regional Roma survey (2011).
122 Sonja Avlijaš et al., Gender Pay Gap in the Western Balkan Countries: Evidence from Serbia, Montenegro and Macedo-nia (Belgrade: FREN – Foundation for the Advancement of Economics, 2013), pp. 10–12.
123 UNDP, Regional Human Development Report 2016, p. 70. See also: Juna Miluka, “Not Just Education: The Gender Wage Gap in the Albanian Labor Markets Through Occupational Segregation, Work Experience, and Child Care,” Poverty and Exclusion in the Western Balkans, eds. Caterina Ruggeri Laderchi and Sara Savastano (New York, NY: Springer, 2013), p. 175.
124 UNDP, Regional Human Development Report 2016, pp. 64–65.
125 Ibid.
Time-use data suggests women’s unpaid work to be 7.5 times that of men in Albania, 3.3 times in Macedonia, and more than double in Serbia. When unpaid and paid work are combined, women work more than men.126 At the same time, there is an un-derinvestment in childcare services in these coun-tries, which makes it difficult for women to work full-time or at all.
Ethnic minorities, especially Roma, face sig-nificant discrimination in SEE labor markets. Ac-cording to a 2011 survey, Roma are more likely to be unemployed (Figure 4.6.) and earn lower wages (Figure 4.7) than non-Roma. In all countries but Croatia, the vast majority of Roma workers are en-gaged in the informal sector, and thus lack access to basic social security.
Due to numerous adverse circumstances, such as a skill mismatch between education systems and labor markets and a lack of demand for labor, young people in the region face difficult education-to-employment transitions and tend to work in pre-carious jobs.127 Statistical analysis of results of FES youth surveys, conducted in the wider SEE region
126 UN Women and UNDP, “Investing in social care for gender equality and inclusive growth in Europe and Central Asia,” Policy brief 2017/1.
127 Mirna Jusić and Amar Numanović, The Excluded Genera-tion: Youth in Southeast Europe (Sarajevo: FES Dialogue Southeast Europe, 2017), pp. 37–38.
Figure 4.6: Unemployment rate (15–64), Roma vs. non-Roma, 2011121
Source: UNDP, World Bank and European Commission regional Roma survey
65%
53% 54%
49%
23%23%
27%
30%
27%
18%
0%
10%
20%
30%
40%
50%
60%
70%
Croatia Macedonia BiH Serbia Albania
Roma Non-Roma

27
The SEE Labor Markets and Inequality
between 2011 and 2015, show that that young wom-en tend to be unemployed more often than men, while youth with lower levels of educational attain-ment are more likely to be employed in a profession that is not directly connected to their educational background.128 Besides their very high unemploy-ment rates (see Figure 4.3), the high incidence of youth who are “not in employment, education or training” (NEET) signals the exclusion of a signifi-cant share of young persons from socio-economic life in these countries (Figure 4.8).
Persons with disabilities are another group that is substantially affected by structural discrimi-nation in the labor markets of the region. Although systematic, comparative data on their labor market activity is not available, multiple accounts point to various legal, social, and infrastructural barriers to their job market entry. These are conditioned, inter alia, by “deep-rooted legacies of previous approach-es applied in the region, which were based on the assumption that disability needs to be treated or ‘fixed,’” often through confinement in institutional care.129 Another limiting factor is the still widespread preconception of specific types of occupations that persons with disabilities are able to take on.130
128 Ibid.
129 UNDP, Regional Human Development Report 2016, p. 47.
130 Ibid, p. 38.
Weak Policy Responses to Labor Market Exclusion and Inequality
The extraordinary challenges that labor markets in SEE face can be credited to the ways in which their difficult transformation from a planned to a market economy has been led. These include a rapid decline in the industry of the region, inadequate adaptation to new technological and business environments, the disruption in market ties between countries of the region, and the political capture and largely failed privatization of state enterprises. They are also tied to the rise of non-standard work, which has gone hand in hand with the reduced power of organized labor to defend job security in the region.
Despite such challenges, government respons-es to poor labor market performance in the region have been insufficiently effective – and even coun-terproductive in some cases. Public expenditure on active labor market measures – which relate to different types of support in finding jobs, self-em-ployment, training, the creation of jobs in the pub-lic sector and various employment incentives in the private sector – is below the EU average of 0.46 % of GDP,131 ranging from 0.05 % of GDP in Albania
131 These include, inter alia, different activation and other measures to help those who are unemployed or threatened by unemployment to find and keep their jobs, respectively.
Figure 4.7: Wage gap, average earnings related to employment, Roma vs. non-Roma, 2011
Source: UNDP, World Bank and European Commission regional Roma survey
48.0% 48.5%
44.9%
42.1%
37.7%
31.6%
0%
5%
10%
15%
20%
25%
30%
35%
40%
45%
50%
BiH Serbia Macedonia Regional average Croatia Albania

28
Unequal Chances and Unjust Outcomes
to 0.35 % of GDP in Croatia in 2015.133 Coverage by such measures is considered to be too low to make a significant impact. Moreover, their targeting is in-effective, as there is a lack of programs designed es-pecially for the most disadvantaged or hard-to-em-ploy groups (e. g. women, long-term unemployed, low-skilled etc.). On the other hand, groups that have a better prospect of finding employment, such as young persons with completed higher education, are frequently targeted instead.134
On the other hand, a dominant policy response of SEE governments in the labor market realm over the past two decades has been to reduce the rigidity of employment protection legislation (EPL), which has traditionally been seen as conducive to greater employment and lower unemployment. Labor laws have been amended to increase flexibility of work-ing conditions in line with recommendations stem-ming from international actors such as the IMF and
132 Eurostat, “Young people neither in employment nor in ed-ucation and training by sex, age and labour status (NEET rates),” 15–24 category.
133 Can Alkan, Statistical Bulletin No. 6 (Yenimahalle-Ankara: CPESSEC, 2016). Amar Numanović, Weak Labour Markets, Weak Policy Responses: Active Labour Market Policies in Al-bania, BiH and Macedonia (Sarajevo: Analitika – Center for Social Research, 2016).
134 Numanović, Weak Labour Markets, Weak Policy Responses; Hermine Vidovic et al., Developing Efficient Activation Ap-proaches and Identifying Elements for Regional Coopera-tion in the Western Balkans (Vienna: wiiw, 2011).
the World Bank, but also the European Commis-sion.135 This is despite previous evidence showing that EPL in the region was, comparatively speaking, not particularly stringent in the first place (with the exception of temporary contracts),136 and that the actual enforcement of such legislation was weak.137 More importantly, this is despite the fact that a number of influential studies in this realm have not shown a significant positive relationship between a more flexible EPL and aggregate employment,138 which has also been confirmed for the region.139 On the other hand, greater labor market flexibility may
135 E. g., see: EU Delegation to BiH, “Compact for Growth and Jobs in BiH” (Sarajevo: EU Delegation to BiH, 2014).
136 For instance, Cazes and Nesporova find that “the Western Balkan countries have, on average, more rigid employment protection legislation than all the other country groupings but that the differences are rather minor.” Sandrine Cazes and Alena Nesporova, “Combining flexibility and security for employment and decent work in the Western Balkans,” South-East Europe Review 2 (2006), pp. 15–16. Also see: See OECD Indicators of Employment Protection, 2018.
137 Cazes and Nesporova, “Combining flexibility and security for employment and decent work in the Western Balkans,” p. 16.
138 For a detailed overview of research in this area, see OECD, Employment Outlook 2013 (Paris: OECD, 2013).
139 See Cazes and Nesporova, “Combining flexibility and secu-rity for employment and decent work in the Western Bal-kans,” p. 19. For an overview of studies in the region, also see Mirna Jusić and Amar Numanović, Flexible Labor in an Inflexible Environment: Reforms of Labor Market Institu-tions in BiH in a Comparative Perspective (Sarajevo: Center for Social Research Analitika), p. 49.
Figure 4.8: Share of youth not in employment, education or training (NEET), 2016
Source: SEE Jobs Gateway / Eurostat132
11.6%
16.9%17.7%
24.3%
26.4%27.0%
29.5%
0%
5%
10%
15%
20%
25%
30%
EU28 Croatia Serbia Macedonia BiH Albania Kosovo

29
The SEE Labor Markets and Inequality
lend itself to greater precarity in the job market, which ultimately increases income inequality.
In line with the tendency to deregulate work-ing conditions, the region has also faced a continu-ous deterioration of union density rates and col-lective bargaining mechanisms,140 meant to ensure an “employment relationship, in particular, wages, working time and working standards.”141 This is de-spite the numerous positive effects of trade union organization on wage levels, working conditions and increased productivity, and the positive effects that wage coordination mechanisms have in terms of decreasing unemployment and wage inequali-ties.142 As a result, the ability of trade unions to in-fluence important policy processes in the region has been weakened.
Policies that would encourage the develop-ment of adequate support services for hard-to-employ categories and enhance their employment prospects remain underdeveloped in the region for various reasons. For instance, according to a UNDP report, in Serbia, low levels of funding allocated by national employment services to support the la-bor market participation of persons with disabili-ties (amounting to only 0.06 % of GDP in 2013) is a result of the low numbers of persons in this cat-egory who register as unemployed.143 Various pol-icy responses do exist (such as social enterprises, or quota systems for employment of persons with disabilities) in the region, but with mixed results in terms of labor market inclusion. For instance, lack of monitoring of non-compliance with quota limits the effectiveness of such policies.144
Moreover, family and work reconciliation poli-cies remain underdeveloped. In the region, “pater-nity and parental leave policies are essentially non-existent,” despite ample empirical evidence on the positive link between paternity leave and female la-bor force participation.145 There is, moreover, a lack of affordable childcare, despite its potential to im-prove women’s reintegration in the labor market.146
140 For instance, see the FES annual reviews of labor relations and social dialogue in SEE.
141 Sandrine, Cazes, Sameer Khatiwada and Miguel Malo, Em-ployment Protection and Collective Bargaining: Beyond the Deregulation Agenda, Employment Working Paper no. 133 (Geneva: ILO, 2012), p. 5–6.
142 For an overview, see Cazes, Khatiwada and Malo, Employ-ment Protection and Collective Bargaining, pp. 7–9. Also see: David Card, Thomas Lemieux and W. Craig Riddell, “Unioni-zation and Wage Inequality: A Comparative Study of the U.S, the U.K., and Canada.” NBER Working Paper No. 9473, 2003.
143 UNDP, Regional Human Development Report 2016, p. 46.
144 Ibid, p. 47
145 Ruben Atoyan and Jesmin Rahman, “Western Balkans: In-creasing Women’s Role in the Economy,” IMF Working Pa-per, WP/17/194, (Washington, D.C.: IMF, 2017), p. 9.
146 Ibid.
Planned reforms are outlined in annual, coun-try Economic Reform Programs (ERPs), prepared by governments in the region as a part of EU accession processes.147 In light of their pre-accession obliga-tions and dialogue with the European Commission in the socio-economic realm, two countries – Serbia and Macedonia – have also adopted employment and so-cial reform programs (ESRPs), which lay out planned interventions in the areas of employment, social policy and education. However, reform measures ori-ented towards labor markets and employment do not address inequality directly. They are mostly supply-side oriented, i. e. targeting the enhancement of skills of those affected by unemployment or inactivity. Main reform areas planned for the 2017–2020 period relate to the improvement of employment and interme-diation services, and of active labor market policies (not limited to improvement in targeting, coverage, and diversification of ALMP portfolios).148 Moreover, a decrease in regulatory burden on businesses and entrepreneurs (e. g. registration and administrative procedures,149 reducing parafiscal charges and taxes150 or the tax wedge on labor151) are further measures envisaged to improve labor market performance and enhance competitiveness. In some countries, tackling the informal economy is envisaged.152 With very few exceptions,153 concrete measures to strengthen the mechanisms of social dialogue and collective bar-gaining are not on governments’ reform agendas.
Governments’ increased focus in recent years on the inclusion of excluded and hard-to-employ groups, such as youth,154 ethnic minorities, women,
147 The government of Croatia’s National Reform Program is prepared as part of the European semester.
148 Countries’ 2017 and 2018 economic reform programs (ERPs) are considered here (2017 NRP for Croatia). Government of the Republic of Albania, “Economic Reform Programme 2017–2019” and “2018–2020”; Council of Ministers BiH, “Economic Reform Programme 2017–2019” and “2018–2020”; Govern-ment of the Republic of Macedonia, “Economic Reform Pro-gramme 2017–2019” and “2018–2020”; Government of the Republic of Kosovo, “Economic Reform Programme 2017” and “2018–2020”; Government of the Republic of Serbia, “Eco-nomic Reform Programme 2017– 2019,” and “2018–2020.”
149 Pertains especially to 2017 and 2018 reform programs of governments of Albania, BiH, Croatia and Serbia.
150 Government of the Republic of Croatia, “NRP 2017.”
151 Council of Ministers BiH, ERPs for 2017 and 2018.
152 For instance, see Government of Albania’s ERP for 2017; Government of Macedonia, “Employment and Social Re-form Programme 2020” (Skopje: July 2017).
153 For instance, one of the objectives of the Employment and Social Reform Program (ESRP) of Macedonia is to strengthen the capacities of social partners and social dialogue mecha-nisms. Government of Macedonia, “ESRP 2020,” pp. 83–84.
154 For instance, Macedonia’s government plans to pilot a ‘Youth guarantee’ measure in 2018, whereby all youth un-der the age of 29 are either to receive a job, education, training or internship offer within four months of complet-ing education or registering as unemployed. For more, see Government of Macedonia, “ERP 2018–2020.”

30
Unequal Chances and Unjust Outcomes
and low-skilled workers in employment measures is certainly laudable.155 Nevertheless, the foreseen competitiveness-oriented reforms depart from the EU’s policies of active inclusion,156 which foresee, inter alia, that job search assistance is complement-ed with adequate income support, that in-work poverty is challenged, and that getting back to work is facilitated through access to quality care and other services. Adequate income support is also a key component of the principle of ‘flexicurity’, an important element of the European Employment Strategy and a policy promoted as part of the Euro-pean semester.157 Flexicurity demands that the flex-ibility of working arrangements, embraced by SEE governments in the recent decade, is balanced with security of employment and income.
The foreseen competitiveness-oriented re-forms are generally also in stark contrast to the reform paths envisaged under the concept of pre-distribution, which would entail ensuring more equitable outcomes by enforcing policies such as ensuring adequate minimum wages, improving the quality of work,158 or strengthening employment rights and collective bargaining mechanisms.159
In other words, despite international evidence pointing otherwise, labor market reform strategies of governments in the region seem to imply that an efficiency vs. equity trade-off is inevitable, and that the efficiency course is preferred if better labor market performance is to be achieved.
155 To that end, governments are taking into account the rec-ommendations as part of policy guidance received from the European Commission through the Economic and Financial Dialogue between the EU and the countries of the region. For instance, see: European Commission, “2017 Economic Reform Programmes of Albania, the former Yugoslav Re-public of Macedonia, Montenegro, Serbia, Turkey, Bosnia and Herzegovina and Kosovo*: The Commission’s Overview and Country Assessments,” Institutional Paper 055 (Luxem-bourg: Publications Office of the European Union, 2017).
156 See, for instance, European Commission, “Active Inclusion,” Employment, Social Affairs & Inclusion, 2018.
157 See European Commission, “Flexicurity,” Employment, So-cial Affairs & Inclusion, 2018.
158 This would entail ensuring decent and more equal earnings across the workforce, improving labor market security and the quality of working conditions. See, for instance, OECD, “Job quality,” 2018.
159 See, for instance, Chwalisz and Diamond, “Predistribution: A New Governing Prospectus for the Centre-left.”

31
While conceptions of the purpose and the compo-sition of social protection systems differ between countries, they generally aim to enhance the well-being of the population by shielding it from various risks, such as illness, old-age, or loss of income. As such, they “provide for life contingencies and redress market-produced inequalities.”160 At the same time, they may offer more than basic social security by aim-ing to enhance quality of life or unleash the potential of individuals.161 Forms of social support may include contributory (e. g. pensions, healthcare, unemploy-ment benefits, disability pensions, sick leave, mater-nity leave, etc.) and non-contributory benefits (e. g. unemployment assistance, disability, or child ben-efits). Various types of social services complement benefits as an integral part of social protection.162
The common welfare state legacy of Yugosla-via has left a strong imprint on the contemporary social protection systems of its successor states. In-spired by Bismarckian social policies, the “Yugoslav model of the social welfare state”163 was predomi-nantly reliant on social insurance as the key mecha-nism of social protection, and thus favored workers and their families. However, social assistance was
160 Stephan Leibfried and Steffen Mau (eds), Welfare States. Construction, Deconstruction, Reconstruction. Analytical Approaches, Vol. 1 (Cheltenham: Edward Elgar Publishing, 2008), p. xv.
161 Alejandro Bonilla García and Jean-Victor Gruat, Social pro-tection: A life cycle continuum investment for social justice, poverty reduction and development, version 1.0 (Geneva: ILO, 2003), p. 1.
162 For more, see UNDP, Regional Human Development Report 2016, p. 49.
163 See Marija Stambolieva, “Conclusion: The Post-Yugoslav Welfare States – from Legacies to Actor Shaped Transforma-tions,” Welfare States in Transition: 20 Years after the Yu-goslav Welfare Model, ed. Stambolieva, Marija and Stefan Dehnert (Sofia: Friedrich-Ebert-Stiftung, 2011), pp. 350–356.
available in the form of extensive non-contributory cash benefits and in-kind public services.164 Due to their differences in ability to provide social protec-tion, “the commitment to welfare provision could not be equally upheld” by all republics, however, resulting in variety in the scope and quality of social programs.165 During the transition, some countries have made more incremental changes to their so-cial protection systems (e. g. Croatia) and have kept their spending levels relatively constant, while oth-ers have opted for more residual safety nets (e. g. Macedonia).166 Divergent reform pathways in the welfare realm have also influenced the extent to which countries have been able to tackle inequality.
Social Protection Systems Help Decrease Inequality in SEE to Varying Degrees
International empirical evidence demonstrates that income inequality tends to be substantially reduced by social transfers. Countries from the region are no exception in that regard. Figure 5.1 presents Gini coefficients of equivalized dispos-
164 See, for instance, William Bartlett, “The Political Economy of Welfare Reform in the Western Balkans,” Poverty and Exclusion in the Western Balkans, eds. Caterina Ruggeri Laderchi and Sara Savastano (New York, NY: Springer, 2013), pp. 247–248.
165 Marija Stambolieva, Welfare State Transformation in the Context of Socio-economic and Political Changes: A Com-parative Analysis of the post-Yugoslav States: Slovenia, Croatia, Serbia and Macedonia, PhD Dissertation, University of Kassel, 2014, pp. 36–37.
166 On the other hand, Albania, where a generous a system of social protection did not exist in the first place, has also opted for a more residual welfare state regime after the fall of Communism. Bartlett, “The Political Economy of Welfare Reform in the Western Balkans,” p. 255.
5 Social Protection and Inequality

32
Unequal Chances and Unjust Outcomes
able income before and after social transfers in countries for which data is available.167
The redistributive impact of social transfers and pensions in the countries considered varies: for in-stance, social transfers and pensions accounted for a reduction of 19 Gini points in Croatia, 15 points in Macedonia, and as much as 24 points in Serbia in 2015 (as opposed to 21 points for the EU28 in 2015). Old-age pensions appear to make the most difference in terms of reducing inequality, ranging from 12.5 points in Croatia and Macedonia to as much as 16.6 points in Serbia. The major impact of pensions on the reduction in inequality in Serbia “is a consequence of the fact that a pension is the only source of income for almost all elderly citizens.”168 Other forms of social transfers, including social assistance or unemploy-ment benefits, made less of a difference in Macedo-nia, but had a more substantial impact on inequality in Croatia and Serbia, similar to that of the EU28.
Data made available by the World Bank also point to the positive influence that social protec-tion systems have on both inequality and on poverty in the region (Figure 5.2).
167 Based on EU-SILC. No data available for Serbia for 2012. No data available for Albania, BiH and Kosovo. Eurostat, “In-come and living conditions database.”
168 Boško Mijatović, “Inequality in Serbia.” Serbia Income and Living Conditions 2013 (Belgrade: Statistical Office of the Republic of Serbia, 2015), p. 7.
Again, data suggests that social insurance schemes, dominated by old-age pensions, fulfil their “consumption smoothing” role and substan-tially decrease inequality and the risk of poverty in old age,169 especially in Croatia and Serbia. This is also confirmed by studies from the region: while looking at the pre- and post-tax-and-benefit in-come of households in Croatia, Urban finds the Croatian system to be highly redistributive, with public pensions contributing the most to such an outcome, followed by social security contributions and personal income tax.170
Underdeveloped Social Programs, Low Generosity and Weak Coverage
The lower impact of social assistance as opposed to social insurance schemes on inequality and poverty in the region may be attributed to the rather low levels of expenditure on the former. Pensions and, to a lesser extent, social insurance-related benefits for persons of active age (e. g. unemployment bene-fits, labor market programs, maternity, employment injury and disability benefits), make up the bulk of
169 UNDP, Regional Human Development Report 2016, p. 49.
170 Ivica Urban, “Income Redistribution in Croatia: The Role of Individual Taxes and Social Transfers,” Financial Theory and Practice 32, no. 3 (2008), p. 402.
Figure 5.1: Gini coefficient of equivalized disposable income before and after social transfers, 2012–2015 (scale of 100)
Source: Eurostat167
49.6 49.3 48.6 49.3
54.252.3
50.748.7
57.1
60.0
62.4
50.8 51.3 51.9 51.8
37.5 37.3 36.5 36.8
41.239.6
37.136.2
42.6 43.3
45.8
36.0 36.2 36.5 36.5
30.9 30.9 30.2 30.4
38.837.0
35.233.7
38.0 38.6 38.2
30.5 30.5 30.9 31.0
0
10
20
30
40
50
60
70
2012 2013 2014 2015 2012 2013 2014 2015 2013 2014 2015 2012 2013 2014 2015
Croatia Macedonia Serbia EU28
Gini before social transfers (pensions included)
Gini before social transfers (pensions excluded)
Gini after pensions and transfers

33
Social Protection and Inequality
social protection expenditures. On the other hand, general social assistance and social protection ex-penditures for children are low (Figure 5.3).
Albeit social transfers in the region certainly have a positive effect in terms of reducing inequal-ity and poverty, this effect could be greater. For instance, social benefits lack generosity, varying from only 7 to 20 percent of the minimum wage in respective countries.172 Though data for equivalent years is not available, only Serbia and Croatia ap-pear to have benefits at levels that are on par with the levels of most CEE countries (Figure 5.4.). Ac-cording to perceptions of households in the region, the role of social benefits in amortizing economic shocks is a minor one.173
On the other hand, social assistance in the re-gion is generally not regressive in character,174 and targeting accuracy appears to be higher than in other upper-middle income, and especially high-income countries (Figure 5.5). Looking at available indicators, the poorest quintiles generally appear to benefit the most from social assistance schemes
171 World Bank, The Atlas of Social Protection Indicators of Re-silience and Equity Database, available at: http://datatopics.worldbank.org/aspire/.
172 Koczan, “Being Poor, Feeling Poorer,” p. 30.
173 Turk (2013), cited in Koczan, “Being Poor, Feeling Poorer,” p. 30.
174 Koczan, “Being Poor, Feeling Poorer,” p. 29.
across the region, except for BiH, where benefits incidence in the poorest quintile of the population is actually 10 percentage points lower than in the richest quintile. Indeed, “around one fourth of so-cial assistance expenditures in BiH are targeted at the poor and socially excluded, whereas the rest is spent on status-based benefits for the veteran pop-ulation and their families,”175 which may not be the most disadvantaged, destitute groups.176 In Kosovo, where the social assistance is generally not means-tested, most benefits go to the poorest quintile.177
Social assistance in the Western Balkans re-gion is marked by low coverage rates.178 For in-stance, in BiH, social assistance reached only 22 % of the poorest quintile in 2007 (Figure 5.6.).
Weak coverage can be attributed to a number of factors, not limited to highly restrictive condi-tions for social assistance (e. g. granting civilian disability benefits only in the case of 90–100 % dis-
175 Amar Numanović, “Social Assistance System in BiH: The Ne-glected Potential of Active Social Policies” (Sarajevo: Anali-tika – Center for Social Research, 2016), p. 2.
176 UNDP, Regional Human Development Report 2016, p. 51.
177 Bartlett, “The Political Economy of Welfare Reform in the Western Balkans,” p. 254. Also see: Boryana Gotcheva and Ramya Sundaram, “Socal Safety Nets in the Western Bal-kans: Design, Implementation and Performance,” Poverty and Exclusion in the Western Balkans, eds. Caterina Rug-geri Laderchi and Sara Savastano (New York, NY: Springer, 2013), p. 227.
178 Koczan, “Being Poor, Feeling Poorer,” p. 11.
Figure 5.2: Impact of social protection on poverty and inequality reduction, poorest quintile
Source: World Bank ASPIRE database171
1.6%
11.0%
4.6%3.2%
22.2%
12.1%
3.9%2.4%
9.0%
3.8%
21.8%
7.5%
3.4%
21.2%
7.4%
13.3%
58.3%
36.2%
6.5%
36.9%
23.1%
26.2%
77.1%
54.1%
5.2%
31.7%
24.7%
31.6%
80.1%
56.9%
0%
10%
20%
30%
40%
50%
60%
70%
80%
90%
Reduction in inequality
(Gini)
Poverty gap reduction
Poverty headcount reduction
Reduction in inequality
(Gini)
Poverty gap reduction
Poverty headcount reduction
Reduction in inequality
(Gini)
Poverty gap reduction
Poverty headcount reduction
Reduction in inequality
(Gini)
Poverty gap reduction
Poverty headcount reduction
Reduction in inequality
(Gini)
Poverty gap reduction
Poverty headcount reduction
Albania (2012) BiH (2007) Croatia (2010) Kosovo (2013) Serbia (2013)
Social assistance Social insurance

34
Unequal Chances and Unjust Outcomes
Figure 5.3: Public social protection expenditure by guarantee, latest available year (% of GDP)
Source: ILO World Social Protection Reports 2014/15 and 2017/2019179
Figure 5.4: Average per capita transfer – total population (daily $ PPP), SEE and CEE countries
Source: World Bank ASPIRE database
11.1%
12.7%
9.3%
8.3%
9.4%
7.5%
5.0%
2.4%
3.1%
3.0%
0.8%
0.1%
0.9%
0.5%
0.2%
1.3%
0.1%
2.2%
1.3%
1.5%
0.8%
0.2%
1.4%
0% 2% 4% 6% 8% 10% 12% 14% 16% 18% 20%
Western Europe (2014/2015)
Serbia (2014)
Croatia (2014)
Central and Eastern Europe (2014/2015)
BiH (2011)
Albania (2015)
Older persons
Persons of active age (excluding general social assistance)
General social assistance
Child protection
1.4
2.3
3.9 3.94.4
7.1
8.3
9.4 9.6 9.7
22.0
0
5
10
15
20
25
Kosovo (2013) Albania (2012) Bulgaria (2007) Latvia (2009) BiH (2007) Slovak Republic (2009)
Serbia (2013) Hungary (2007) Croatia (2010) Poland (2012) Lithuania (2008)

35
Social Protection and Inequality
ability, as in the case of the Federation of BiH) or extreme means-testing (e. g. last-resort benefits).181 According to Gotcheva and Sundaram, “[c]over-age is extremely low even in countries which have multiple safety net programs designed to provide protection and mitigate risks related not just to poverty but also disability, temporary loss of job due to child care and an increase in the number of dependent children in the family.”182 Low coverage is seen to be due to political influence, which the poor – in contrast to pensioners or war veterans – lack across the region.183
Weak coverage also pertains to support based on social insurance, as data suggest that those who are unemployed do not have access to basic income
179 ILO, World Social Protection Report 2014/15: Building eco-nomic recovery, inclusive development and social justice (Ge-neva: ILO, 2014), p. 306, pp. 310–312; World Social Protec-tion Report 2017/19: Universal social protection to achieve the Sustainable Development Goals (Geneva: ILO, 2017), pp. 411–412. Latest available years used from both reports.
180 Pertains to the percentage of benefits going to each quin-tile of the post-transfer (pre-transfer) welfare distribution relative to the total benefits received by the population. For more, see: http://datatopics.worldbank.org/aspire/docuo-mentation.
181 Gotcheva and Sundaram, “Social Safety Nets in the Western Balkans,” p. 228.
182 Ibid.
183 Bartlett, “The Political Economy of Welfare Reform in the Western Balkans,” p. 254.
security. Despite the high incidence of the long-term unemployed in total unemployment, countries in the region do not provide non-contributory un-employment benefits, unlike most of the countries of Western Europe (Figure 5.7).
In fact, coverage of the unemployed with benefits in the region is among the lowest glob-ally (with the exception of Croatia) and the fourth lowest in the world in the case of BiH.184 In other words, social protection systems in the region ef-fectively fail to protect individuals against the risk of unemployment.
Data on the access to and the availability of so-cial services in the region is scarce and incomplete. However, many accounts point to services as being inadequate and underdeveloped.185 This especially relates to the provision of community-based social services (including various types of care services), which are side-lined in favor of state-run “residen-
184 See, for instance, ILO, World Social Protection Report 2014/15, p. 36.
185 UNDP, Regional Human Development Report 2016, pp. 52–53; Numanović, “Social Assistance System in BiH”; Aida Malkić and Amar Numanović, “Caring for Carers: An Analy-sis of Informal Care Policies in BiH,” Policy Brief (Sarajevo: Analitika – Center for Social Research, 2017); European Pol-icy Institute, “Who cares for the carers? Promoting Applied Policies for Informal Long-Term Care,” Policy brief (Skopje: EPI, 2016).
Figure 5.5: Social assistance targeting accuracy, benefits incidence, all social assistance180
Source: World Bank ASPIRE database; for BiH, IBHI (2013)
27.6%
15.5%
41.2%
50.6%
35.5%
27.7%
16.3%
18.3% 18.2%
22.2% 22.5%
20.5% 20.8%
14.4%
21.2%19.7%
13.9% 13.3%
16.1% 16.1%
13.3%
19.2%
21.2%
12.4%
4.8%
14.3%12.8%
18.1%
13.7%
25.4%
10.3%8.8%
13.6%
22.6%
37.9%
0%
10%
20%
30%
40%
50%
60%
Albania (2012) BiH (2011) Croatia (2010) Kosovo (2013) Serbia (2013) High income countries (2008-2016)
Upper middle income countries (2008-2016)
Poorest quintile 2nd quintile 3rd quintile 4th quintile richest quintile

36
Unequal Chances and Unjust Outcomes
Figure 5.6: Coverage of all social assistance in the poorest quintile and the total population
Source: World Bank ASPIRE database
Figure 5.7: Indicators of effective coverage: Unemployed who receive benefits (%)
Source: ILO World Social Protection Reports 2014/15 and 2017/2019186
27.7%
21.8%
47.9%
35.4%
26.5%
72.3%
65.7%
19.1%20.5%
24.6%
14.1%
11.7%
53.2%
44.4%
0%
10%
20%
30%
40%
50%
60%
70%
80%
Albania (2012) BiH (2007) Croatia (2010) Kosovo (2013) Serbia (2013) High income countries (2008-2016)
Upper middle income countries (2008-2016)
Poorest quintile Total population
2.0%
6.9%
8.8%
11.5%
20.0%21.1%
44.6%
0% 0% 0% 0% 0%
5.0%
19.0%
0%
5%
10%
15%
20%
25%
30%
35%
40%
45%
BiH (2011) Albania (2012) Serbia (2015) Macedonia (2015) Croatia (2013) CEE average (2014/2015)
Western Europe average (2014/2015)
Contributory schemes Non-contributory schemes

37
Social Protection and Inequality
tial provision, often in large, isolated institutions and with little or no social casework to ensure that time spent in residential care for vulnerable groups is minimized.”187 Moreover, services have yet to ma-ture into “enablers” for persons with disabilities to gain access to education, healthcare, and labor markets.188 There are, however, differences between countries in terms of the extent of regulation, fi-nancing, provision, monitoring, and evaluation of specific services, as well as their drive towards dein-stitutionalization and alternative service provision models. This is inevitably tied to differences in so-cio-economic circumstances and reform priorities.
In the realm of childcare specifically, avail-able data on childcare enrolment for three coun-tries from the region suggest that this service re-mains underdeveloped and underinvested in. For instance, while the average percentage of children younger than three enrolled in formal childcare in EU28 was 30 % in 2015, it was 14 % and 12 % in Ser-bia and Croatia, respectively, and as low as 6 % in Macedonia.189
186 ILO, World Social Protection Report 2014/15, p. 196, pp. 201–202, and World Social Protection Report 2017/2019, pp. 280–281.
187 European Commission, Social Protection and Social Inclu-sion in the Western Balkans: A Synthesis Report (Brussels: European Commission 2009), p. 44.
188 Ibid, p. 46.
189 See Eurostat, “Formal child care by duration and age group.”
Healthcare systems, an important component of equality of opportunity, have also faced a gradual decline in the region. Recurrent changes in entitle-ments have made health insurance more restric-tive in the region. This has been coupled with the emergence of a private health sector in most coun-tries, “catering to the elite higher income earners and successful entrepreneurs and professionals, as well as to highly placed public-sector bureaucrats and politicians.”190 With the exception of Croatia, households’ out-of-pocket payments on health re-main higher than in the EU (Figure 5.8).
Erosion of Welfare Regimes
Governments in the region have generally em-barked on different reform pathways in the social policy realm in the last two decades. This is due to a complex combination of conditions, including dif-ferent socio-economic and political circumstances in the course of transition, the nature of institutions in the social realm, the relative strength, interests and possibility of involvement of different actors and groups in policy-making processes, but also the extent to which they have accommodated the
190 Bartlett, “The Political Economy of Welfare Reform in the Western Balkans,” p. 250.
Figure 5.8: Out-of-pocket health expenditure (% of current health expenditure), 2014
Source: World Health Organization Global Health Expenditure database
11.2%
13.9%
27.9%
36.6% 36.7%
49.9%
0%
10%
20%
30%
40%
50%
60%
Croatia European Union BiH Serbia Macedonia Albania
38
Unequal Chances and Unjust Outcomes
advice of international organizations involved in reform processes.191
At times, social policy has meant populist pol-icy, as governments of some countries have chosen to appease parts of the electorate, such as war vet-erans or pensioners, through avoidance of reforms or an increase in spending on specific social pro-grams.192 However, underlying reform in most of the countries has been the policy orthodoxy on the need to cut down on categorical benefits, to intro-duce further means-testing and targeting, and elim-inate any disincentives to work which social safety nets may create. Such recommendations have been provided on a continuous basis by the interna-tional financial institutions such as the World Bank193 and the International Monetary Fund, but in part also by the European Union as part of an auster-ity agenda following the 2008 economic crisis. Less prominent (and impactful) has been the EU’s social inclusion agenda in the social policy discourse in the region, which relies on concepts such as social investment. Social investment encourages greater allocation of public resources to policies such as “(child)care, education, training, active labor mar-ket policies, housing support, rehabilitation and health services.”194
Faced with tremendous challenges underlying a difficult economic transition, many governments have espoused austerity measures in the social realm. In some countries, as in Macedonia, this was driven to the extreme through substantial cuts in benefits and in beneficiaries, despite persistent pov-erty.195 Not all countries have, however, espoused means-testing. In the case of Kosovo, there are “uni-versal social benefits delivered through the flat-rate
191 See, for instance, Stambolieva, Welfare State Transforma-tion in the Context of Socio-economic and Political Changes. Also see European Commission, Social Protection and Social Inclusion in the Western Balkans.
192 E. g. see Stambolieva, Welfare State Transformation in the Context of Socio-economic and Political Changes.
193 For instance, see World Bank, Social Safety Nets in the West-ern Balkans Design, Implementation, and Performance, Report No. 54396 (Washington, DC: World Bank, 2011). For more on the issue, see William Bartlett, “The Political Economy of Accession: Forming Economically Viable Mem-ber States.” The EU and Member State Building: European Foreign Policy in the Western Balkans, eds. Soeren Keil and Zeynep Arkan (London & New York: Routledge, 2014), p. 228.
194 European Commission, “Towards Social Investment for Growth and Social Cohesion – including and implementing the European Social Fund 2014–2020,” Brussels, 20 Febru-ary, 2013, p. 9.
195 E. g. Suzana Bornarova, “Development of the Social Pro-tection System in Post-Communist Macedonia: Social Policy-Making and Political Processes.” Welfare States in Transition: 20 Years After the Yugoslav Welfare Model, Stambolieva, Maria and Stefan Dehnert, eds (Sofia: Frie-drich-Ebert-Stiftung, 2011). Also see: Stambolieva, Welfare State Transformation in the Context of Socio-economic and Political Changes.
pension scheme and the non-means-tested social assistance,” albeit at extremely low benefit rates.196
Reform courses were summed up nicely in a 2009 European Commission Report:
Whilst trends are hard to determine, the nature of ‘locked in’ contributory insurance-based ben-efits in the context of a crisis in contributions puts great strain on those social programmes funded from the main state budget. At the same time, partly for political reasons, social programmes are oriented not only to the poor and excluded but to some interest groups, no-tably veterans who have ‘captured’ aspects of social protection policy. To complete the circle, International Financial Institutions, looking for reductions in public expenditure, sometimes ad-vise cuts in the very programmes which are de-signed to reach the poor and vulnerable, whilst arguing that such programmes should be better tailored to reach the poorest of the poor. In a situation where there is little incentive to develop more responsive programmes, these distortions play out in an erosion of welfare regimes.197
Dominant policy responses in the region are largely in contrast with the findings of influential empirical studies in the social realm. Korpi and Palme have pointed to the ‘paradox of redistribution’: the more social benefits are targeted at the poor and the greater the equality in the level of public benefits accorded via social insurance (i. e. the less pensions are earnings-related), the less likely poverty and in-equality are to be reduced. This seemingly incon-gruous finding is explained by the readiness of the middle class to support a system it benefits from directly. There are two assumptions behind the re-distribution paradox: the budget size intended for redistribution is not fixed; and welfare states’ in-stitutional structures “are likely to affect the defi-nitions of identity and interest among citizens.” Thus, a welfare state with a universalistic strat-egy geared towards the maintenance of a normal or accustomed standard of living will likely effect greater redistribution than a marginal welfare state rooted in targeting.198 Indeed, the welfare state is seen as “an indispensable element in the strength-ening of the European middle class and democratic
196 Bartlett, “The Political Economy of Welfare Reform in the Western Balkans,” p. 256.
197 European Commission, Social Protection and Social Inclu-sion in the Western Balkans. 45
198 Walter Korpi and Joakim Palme, “The Paradox of Redistribu-tion and Strategies of Equality: Welfare State Institutions, Inequality and Poverty in the Western Countries,” Luxem-bourg Income Study (LIS) Working Paper Series No. 174, p. 4.

39
Social Protection and Inequality
capitalism,”as, according to Milanovic, the mid-dle class has been both its “largest supporter and beneficiary.”201 Other authors have found that “no advanced economy achieved a low level of inequal-ity and/or relative income poverty with a low level of social spending.”202
Thus, it is questionable to what extent the current reform courses in SEE are conducive to mitigating unfavorable socio-economic outcomes. According to Bartlett, “despite the growth of mass unemployment and poverty, no countries have in-troduced social assistance schemes that have been anything other than residual means-tested arrange-ments with little impact on poverty reduction.” 203
Available data from annual economic reform programs in SEE countries suggest that most coun-try governments plan to keep their current levels
199 Pertains to 2017 and 2018 ERPs. COFOG classification not available in Serbia’s ERP. Eurostat for EU and Croatia. Eu-rostat, “Total general government expenditure on educa-tion,” 2015 (% of GDP % of total expenditure).” ‘P’ – pro-jected.
200 Eurostat, “Government expenditure on social protection.” Pertains to 2015 data.
201 Milanovic, Global Inequality, p. 207.
202 Ive Marx, Brian Nolan and Javier Olivera, “The Welfare State and Anti- Poverty Policy in Rich Countries,” IZA Discussion Papers, no. 8154 (2014), p. 18.
203 Bartlett, “The Political Economy of Welfare Reform in the Western Balkans,” pp. 253–254.
of expenditure on social protection and health con-stant or, in some instances, decrease the percent-age of GDP spent on these functions (Figure 5.9).
In the upcoming period, governments in SEE are planning interventions in social welfare sys-tems that mostly focus on making social programs more cost-effective. For instance, a reform of the pension system in FBiH is supposed to alleviate “‘pressure’ on the pension system by gradually tightening the conditions for exercising rights to old-age and family pension” and thus making it more sustainable. At the same time, the plan is to increase old-age pension coverage, create precon-ditions for “fair contribution rates for pension and disability insurance in the part that refers to more years of service” and make the organization of pen-sion and disability insurance more cost-effective.204 In Croatia, policy measures for discouraging early retirement will be introduced, while Albania’s gov-ernment plans to improve the financial sustainabil-ity of pensions. On the other hand, better targeting of social welfare benefits is envisaged in Croatia, Macedonia and Serbia.. The government in Albania plans to ‘activate’ social assistance by means of in-tegration of social protection and employment pol-
204 Council of Ministers BiH, “Economic Reform Programme 2017–2019.”
Figure 5.9: Current and planned public expenditure on social protection in SEE as a share of GDP and EU28 average (COFOG
classification)
Sources: Countries’ economic reform programs, Eurostat for Croatia199 and EU28200
0%
2%
4%
6%
8%
10%
12%
14%
16%
18%
20%
Social protection
Health Social protection
Health Social protection
Health Social protection
Health Social protection
Health Social protection
Health
Albania BiH Croatia Kosovo Macedonia EU28
2015 2016 2017 (p) 2018 (p) 2019 (p) 2020 (p)

40
Unequal Chances and Unjust Outcomes
icies. An exception to cost-effectiveness measures include a planned increase in benefits for children and youth with disabilities in Serbia and allocation of additional funding and improvement of capacity of various local-level social care services; a steady increase in various types of cash benefits, along with an improvement in the delivery of social ser-vices in Macedonia; Croatia’s government’s efforts to increase cash benefits for families, and govern-ment of Kosovo’s plans to increase social welfare benefits and provide health insurance for vulner-able groups.205
Generally speaking, social protection systems, especially social insurance schemes, play an im-portant role in reducing inequality and poverty in the region. Nevertheless, social insurance systems remain on unstable ground due to a general de-crease in social security contributors and an aging population. While there is some variation between countries, expenditures on social assistance in the region as a share of GDP are low in compari-son to the EU, and social assistance and insurance schemes are generally marked by poor coverage and low generosity. Important social services re-main underdeveloped and underinvested in. Thus, it is questionable to what extent social protection systems truly perform their basic function of pro-tecting those who are at risk of social exclusion and mitigate the effects of economic reforms such as deregulation, liberalization and privatization, as well as the effects of unfavorable labor market out-comes.
205 2017 and 2018 ERPs of governments of Albania, BiH, Ko-sovo and Serbia; 2017 National Reform Programme of the Government of Croatia. Government of Macedonia, “ESRP 2020.” Government of the Republic of Serbia, Social Inclu-sion and Poverty Reduction Unit, “Employment and Social Reform Programme in the Process of Accession to the Euro-pean Union” (Belgrade: May 2016).

41
Taxes such as personal income tax, value-added tax or tax on capital gains and inheritance have a ma-jor impact on inequality. Well-designed tax systems that are progressive in nature are seen to mitigate income and wealth inequality, as they alleviate the tax burden on those who are poorer, while levying a higher tax on those who are wealthier. In addition to their redistributive role, taxes also contribute to the reduction of inequality by supplying revenues for important public services, such as education and healthcare, which help level the playing field and encourage social mobility.
Lacking Tax Progressivity Increases Inequality
International empirical evidence shows that a high tax wedge on labor, inclusive of personal income tax and social security contributions,206 may create in-centives for low-wage earners to move to the infor-mal labor market or become inactive, making them dependent on unemployment and related welfare benefits. Conversely, taxation may incentivize em-ployment among low-wage earners where the tax burden is lower. With a few exceptions, those with lower earnings in the countries of the EU have a significantly lower tax burden.207 Countries with a directly progressive income tax (all Eurozone coun-tries and some New Member States) are typically able to achieve stronger progressivity, as measured
206 The tax wedge refers to the difference between the total cost of labor and employee’s “take-home” wage.
207 OECD, Taxing Wages 2014 (Geneva: ILO, 2015), pp. 45–46. Also see: European Commission, “European Semester The-matic Factsheet: Taxation,” 2017.
by the difference in the tax wedge between the worker receiving the average wage and the worker receiving two-thirds of the average wage.
When it comes to personal income tax (PIT), countries of the SEE region have seen numerous, and in some cases frequent shifts, in their PIT policies over the course of the transition. While some have moved towards greater progressivity in personal in-come taxation (e. g. Albania), others have maintained low (e. g. BiH) or have reduced tax progressivity (e. g. Macedonia).208 In many instances, progressivity may only be nominal, depending on how many persons are really affected by taxation in the highest brack-ets.209 Table 6.1 offers an overview of recent PIT rates.
Systematic comparative evidence on the effects of tax policy on income inequality and redistribution in the SEE region is not available. However, available econometric analyses on PIT suggest that insufficient-ly progressive taxation does little to reduce income inequality because of its generally weak redistributive effect. For instance, research from Albania suggests that a progressive tax policy is more appropriate than flat-rate taxation in reducing income inequality and
208 For an earlier overview of PIT rates, see: Mihail Arandarenko and Vladimir Vukojević, “Labor Costs and Labor Taxes in the Western Balkans” (Washington, D.C.: World Bank, 2008).
209 Arandarenko and Vukojević, “Labor Costs and Labor Taxes in the Western Balkans.” For instance, in Serbia, an annual tax return has to be filed by persons whose total net income exceeds RSD 2,375,136 (cca. 20,000 EUR); in that case, de-pending on the level of income, two rates are applied (10 % and 15 %). For more, see: KPMG, “Annual personal income tax for income generated in 2017,” 1 February 2018. Never-theless, the number of individuals who are seen to pay an-nual income tax is very small. E. g. see: Saša Ranđelović and Jelena Žarković-Rakić, “Distributional and Poverty Effects of Income Tax Reform in Serbia,” Working paper, World Bank International Conference on Poverty and Social Inclu-sion in the Western Balkans, Brussels, Dec. 14–15, 2010, p. 7.
6 Tax Policy and Inequality

42
Unequal Chances and Unjust Outcomes
achieving a better distribution of wealth,211 and that a flat-rate PIT deepens the labor market gender gap, as women, overrepresented in lower income brackets, are much harder hit by the tax burden.212 An analysis of flat-rate tax policy in the Federation of BiH shows that the share of total income of the top decile of the population was 33 % before and 50 % after taxation; it suggests that progressive PIT would be more suit-able for reducing inequality.213 In Macedonia, flat-rate PIT is seen to be of “the highest relevance as a factor” when it comes to income inequality, suggesting that a reintroduction of progressive tax policy could lead to a reduction in inequality.214 In Serbia, the redistribu-tive impact of the tax system is shown to be lower compared to EU countries (a reduction of 2.8 Gini in Serbia as opposed to 3.8 Gini points in the case of EU28), primarily due to low progressivity of PIT. 215 While taxes are shown decrease inequality in Serbia, the weak redistributive power of taxes and transfers is seen as the main reason for the high inequality of disposable income.216 On the other hand, progressive taxation in Croatia has been shown to achieve a sub-
210 Serbia follows a scheduler system, where different rates (and exemptions) are applied to different sources of per-sonal income. For more, see: Arandarenko and Vukojević, “Labor Costs and Labor Taxes in the Western Balkans,” p. 5.
211 See, for example, Armalda Redi, “Albanian Government and Its Challenges in Progressive Tax Implementing,” Jour-nal of Educational and Social Research 4, no. 2 (2014); Isilda Mara and Edlira Narazani, “The Effects of Flat Tax on In-equality and Informal Employment: The Case of Albania” (Vienna: The wiiw Balkan Observatory, 2011).
212 Raimonda Duka, Albanian tax system and its effects on gen-der equality (Stockholm: Indevelop, 2011).
213 Dželila Kramer, Personal income tax reform in the Federa-tion of Bosnia and Herzegovina, Doctoral Dissertation, Uni-versity of Ljubljana, 2016.
214 Sasho Kozuharov, Vladimir Pektovski, and Natasha Ristovska, “The Impact of Taxes Measured by Gini Index in Macedonia,” UTMS Journal of Economics 6, no. 1 (2015), pp. 41–52.
215 Krstić, “Why income inequality is so high in Serbia,” pp. 23–46.
216 Arandarenko, Krstić and Žarković Rakić, “Analysing Income Inequality in Serbia,” p. 5.
stantial redistributive effect,217 and may be “the most important element in reducing income inequality in Croatia.”218
While the overall burden on labor varies in the countries of the region, tax wedges are generally not very high in comparison to the EU28 average (Figure 6.1). Nevertheless, ample evidence illus-trates that the tax burden on low-wage earners is significant. Low progressivity of the tax wedge in most countries is seen to create disincentives for such workers to enter the formal labor market.
According to recent IMF calculations, the av-erage rate of labor tax progressivity – the ratio of change in the labor tax wedge per unit of change in income – in the region is either very high for low-wage earners whose incomes are below 50 percent of the average gross wage, or there is no progres-sivity at all. Taxation becomes regressive above a low-level income, as the effective tax burden falls with income. This may be attributed to minimum and maximum social security contribution thresh-old rates, respectively.219 According to Atoyan and Rahman, “this significantly decreases incentives for formal employment for low-skilled and low-paid workers” in three countries of the region: Albania, Macedonia, and Serbia.220 A study of labor taxation in the region by Arandarenko and Vukojević (2008) points to the distortionary effects that taxation of labor at the lower and higher ends of the wage dis-
217 Mitja Čok, Ivica Urban and Miroslav Verbič, “Income Redis-tribution through Taxes and Social Benefits: The Case of Slovenia and Croatia,” Panoeconomicus 60, no. 5 (2013), pp. 667–686.
218 Predrag Bejaković and Željko Mrnjavac, “The Role of the Tax System and Social Security Transfers in Reducing Income Inequality: The Case of the Republic of Croatia,” Ekonomski pregled 67, no. 5 (2016), p. 407.
219 Atoyan and Rahman, “Western Balkans: Increasing Wom-en’s Role in the Economy,” p. 13.
220 Ibid, p. 12.
Table 1: 2017 Personal income tax rates (PIT), SEE
Sources: Deloitte Highlights, 2017
Countries Rates
Albania Progressive: 0 %, 13 %, 23 %
BiH Flat: 10 % (tax-exempt fringe benefits in FBiH; not in RS)
Croatia Progressive: 24 %, 36 %
Kosovo Progressive: 0 %, 4 %, 8 %, 10 %
Macedonia Flat: 10 %
SerbiaDifferent-flat rate taxes depending on source of income: 10 % for employment and business income, 15 % for capital income, and 20 % from loyalties and other income.210

43
Tax Policy and Inequality
tribution has. Thus, “by enforcing high entry costs (in terms of high minimum mandatory bases for social security contribution payments and mod-est or entirely missing zero tax brackets for PIT), 221 the taxes discourage formalization of jobs for low-wage labor,”222 and encourage the dualization of labor markets.223
However, it is important to note that the over-all effect of the tax wedge on employment does not merely depend on actual labor cost; among other factors, such as the existence of a (binding) mini-mum wage, it also depends on the value that em-ployees afford to the benefits and the services that are financed by social contributions or taxes, such as old-age pensions, disability insurance, unemploy-ment insurance or healthcare.224 Unfortunately, the
221 For SEE (without Croatia): Data based on IMF staff calculations for 2016, Atoyan and Rahman, “Western Balkans: Increasing Women’s Role in the Economy,” p. 13. For OECD average, 2016 data, OECD Stat, “Taxing Wages – Comparative Tables.” For EU28 average and Croatia, 2015 data, available at: Eurostat, “Tax rate on low wage earners: Tax wedge on labour costs.”
222 Arandarenko and Vukojević, “Labor Costs and Labor Taxes in the Western Balkans,” p. 3.
223 See, for instance, Krstić, “Why income inequality is so high in Serbia,” pp. 23–46.
224 Arandarenko and Vukojević, “Labor Costs and Labor Taxes in the Western Balkans,” p. 60. Also see: Johannes Koettl and Michael Weber, “Does Formal Work Pay? The Role of Labor Taxation and Social Benefit Design in the New EU Member States,” IZA Discussion Paper no. 6313, January 2012, p. 3–4.
value attached to such benefits cannot be reliably measured.225 A decrease or withdrawal in income or means-tested social benefits may also influence whether a person may choose to work formally or work at all,226 as this increases the opportunity cost of working in the formal sector. Although there is little empirical evidence on the impact of benefit withdrawal policies on employment (and the for-malization of employment) in the region, benefits are generally considered to be too ungenerous to pose a disincentive to employment.227 Beyond taxes and benefits, the decision of whether or not to (re-turn to) work may depend on other factors, such as job quality or access to affordable childcare.
Another characteristic of personal income taxation that is often overlooked in the region re-lates to the fact that the tax wedges presented in Figure 6.1 are not the average tax wedges actually paid by the workers receiving two-thirds of the av-
225 Koettl and Weber, “Does Formal Work Pay,” p. 13.
226 Koettl and Weber, “Does Formal Work Pay,” p. 4.
227 There is, however, some evidence from Serbia that the loss of social assistance at very low wage levels, below 10 per-cent of the average wage, does present a disincentive to engage in formal work, as does the loss of family benefits at around 50 percent of the average wage. See Johannes Koettl, “Does Formal Work Pay in Serbia? The Role of Labor Taxes and Social Benefit Design in Providing Disincentives for Formal Work,” Poverty and Exclusion in the Western Balkans, eds. Caterina Ruggeri Laderchi and Sara Savastano (New York, NY: Springer, 2013), pp. 133–154.
Figure 6.1: Tax wedge in SEE, OECD and EU28: Single earners at 67 % of average wage, 2015/2016
Source: Atoyan and Rahman (2017), OECD (2016), Eurostat (2015)221
10%
26%
31%32%
35%
38% 38%39%
0%
5%
10%
15%
20%
25%
30%
35%
40%
45%
Kosovo Albania Macedonia OECD Croatia Serbia EU28 BiH

44
Unequal Chances and Unjust Outcomes
erage wage. These are the wedges paid by the hypo-thetical single worker without dependents and are actually lower in most OECD countries if a worker has children and a dependent spouse. However, in most of the countries considered, there are either no allowances for dependent family members, or such allowances tend to be low.228 Therefore, tak-ing into account that the majority of workers in the OECD can count on deductions for dependent family members, the effective PIT tax rates paid in the Western Balkans are, on average, comparatively much higher than implied by the published hypo-thetical wedges.
There is surprisingly little evidence on the im-pact of value-added tax (VAT) on income inequal-ity in the region. However, some country-level evidence confirms VAT’s expected regressive char-acter. For instance, authors suggest a negative im-pact of Croatia’s tax system on inequality, consider-ing a high share of regressive taxes (primarily VAT) in the tax system structure.229 However, another analysis conducted for Croatia claims that VAT has a negligible negative impact on income inequality.230 In Macedonia, research shows that a VAT of 18 % and a preferential tax rate of 5 %231 has a strong and significant positive impact on income inequality, explained by its regressive nature.
Further Progressivity of Tax Systems Not on Reform Agendas
For the most part, tax systems in SEE countries lack progressivity that would ensure a better redistribu-tive effect. Moreover, despite the high levels of un-employment, inactivity and informal employment in most countries of the region, features such as targeted tax reductions that would incentivize the (formal) employment of low-income earners and of
228 For instance, BiH and Croatia have allowances for de-pendent spouses and children in the form of deductions from taxable income, which decreases the tax base by the amount of the deduction to which a family is entitled. In Serbia, such an option is only available for persons filing the annual income tax (i. e. those whose total net income exceeds circa 20,000 EUR).
229 Dunja Skalamera – Alilović and Ivan Rubinić, “The Tax Sys-tem as a Generator of Economic Inequality in Croatia”, 16th
International Scientific Conference on Economic and Social Development – The Legal Challenges of Modern World, 1–2 Sept. 2016, Split.
230 Alka Obadić et al. “The effects of tax policy and labour market institutions on income inequality,” Zbornik radova Ekonomskog fakulteta Rijeka 32, no. 1 (2014).
231 A preferential tax rate in Macedonia is applied on various products, such as drinking water, publications, agricultural seeds and fertilizers, etc. Kozuharov, Pektovski, and Ristovs-ka, “The Impact of Taxes Measured by Gini Index in Mac-edonia,” p. 46.
second earners, as well as provide income support for vulnerable households, are generally underde-veloped or missing.
Generally speaking, working on more pro-gressive taxation and reducing the tax burden on low-wage earners does not appear to be a priority articulated in national reform programs in the so-cio-economic realm in the SEE region. In their eco-nomic reform programs for the 2017–2020 period, governments in SEE are primarily concerned about the fiscal and business effects of current or planned tax policies. In Kosovo and Serbia, reforms in this domain mostly deal with issues of efficiency of tax collection and administration.232 In BiH, the FBiH government plans to reform PIT by extending the tax base, taxing currently non-taxable allowances (e. g. meal and travel allowance), while reducing tax and contribution rates as to achieve a neutral fiscal effect.233 In the RS, the government aims to reduce the aggregate social contribution rate from 33 % to 31.6 % of the gross salary.234 The main ob-jectives of such reforms are to boost competitive-ness of domestic companies, attract investment, and stimulate economic growth and employment. At the same time, it remains unclear to what extent current or planned tax instruments have been de-signed with equity considerations in mind.
In Croatia, the government replaced the for-mer three PIT rates (12 %, 25 % and 40 %) with two (24 % and 36 %) in 2017, with the aim of making the tax system more coherent and simple, to ensure a better business environment, and boost competi-tiveness and job creation, inter alia.235 An analysis of the effect of recent changes to PIT in Croatia show that disposable income of the lowest deciles was generally unaffected by both the 2017 and an earlier 2015 reform; disposable income was only slightly increased in the third through sixth decile, while it increased more substantially (above 3 %) in higher deciles. In other words, “both reforms some-what increase income inequality,” by 0.4 and 0.3 Gini points in 2015 and 2017, respectively.236
Despite their potentially positive effect in
232 See, for example, 2017 and 2018 ERPs of the governments of Albania, Kosovo, Macedonia and Serbia.
233 Paradoxically, by taxing these previously non-taxable, fixed contributions, the de facto progressivity of the tax wedge in FBiH will be reduced. For more, see Jusić and Numanović, Flexible Labor in an Inflexible Environment, p. 59.
234 Council of Ministers BiH, “ERP 2017–2019” and “ERP 2018–2020.”
235 European Commission, “Croatia Country Report 2017,” 2017 European Semester: Assessment of progress on structural re-forms, prevention and correction of macroeconomic imbal-ances, and results of in-depth reviews under Regulation (EU) No 1176/2011, Feb. 2017, p. 34
236 Ibid.

45
Tax Policy and Inequality
terms of making work “worthwhile,” reducing high inactivity rates and curbing inequality,237 especially among low-wage workers, there is an absence of measures such as in-work benefits in national re-form programs. Such benefits – in the form of cash transfers or income tax credits – usually target low-wage earners and families with children and are conditional on formal employment. Moreover, combinations of various types of wage subsidies, tax credits or social security contribution credits targeting families and categories of workers at a risk of in-work poverty are not envisaged either.238
Most reforms in the tax and benefit realm geared towards a reduction in inequality come at the price of tax revenue forgone, especially meas-ures such as tax credits. Their financial feasibility may be questionable given that most governments of the region are facing fiscal restraints and have adopted fiscal consolidation measures to reduce public spending. However, increasing the progres-sivity of tax system is usually seen to be a fiscally neutral measure,239 and may thus make such reforms feasible even in the context of fiscal consolidation.
237 A tax and benefit micro-stimulation model conducted in Serbia suggests that an in-work benefit targeting single individuals would encourage their participation in the la-bor market, with behavioral changes occurring “among the poorest individuals with important redistributive effects.” Saša Ranđelović et al. “Labor Supply and Inequality Ef-fects of In-Work Benefits: Empirical Evidence from Serbia,” Working Paper (Prague: CERGE, 2012).
238 As part of their 2016 PIT reform, Croatia has increased the basic personal allowance of earners and the personal allow-ance coefficients for dependent family members. See Gov-ernment of Croatia, “NRP 2017,” p. 17.
239 Koettl and Weber, “Does Formal Work Pay,” pp. 29–30.


47
Educational attainment has a significant bearing on the economic status of individuals. Low lev-els of equality of opportunity that are related to a person’s educational background may pose a chal-lenge for social mobility. Beyond income, persons with a low level of skills are also more likely “to report poor health, to perceive themselves as ob-jects rather than actors in political processes, or to have less trust in others” than those with higher levels of skills, and are thus also less likely to fully participate in society.240 A lack of opportunity to access education, coupled with a lack of equity in education, where education outcomes are not determined by students’ effort but their personal circumstances, poses a serious threat to equality of opportunity and equality of outcome in the SEE region.
Low Levels of Education Affects Inequality, Poverty and Labor Market Prospects
In the SEE region, indicators show a strong asso-ciation between education and poverty, as persons with lower educational attainment are more often at risk of poverty or social exclusion (AROPE)241 than those with higher educational attainment (Fig-
240 OECD, PISA 2015 Results (Volume 1): Excellence and equity in education (Geneva: OECD, 2016), p. 204.
241 Used as an official measure of inequality in the EU, the at risk of poverty rate is defined at a threshold level of 60 % of national median income; as such, it refers to relative poverty, or the minimum acceptable standard for persons residing in a given country. Isabelle Marquet Engsted, “The European Context: Measuring Social Inclusion in the Euro-pean Union.” Poverty and Exclusion in the Western Balkans, eds. Caterina Ruggeri Laderchi and Sara Savastano, p. 17.
ure 7.1). Moreover, education is key when it comes to intergenerational transmission of poverty: chil-dren of parents with lower educational attainment are also more likely to be at risk of poverty or social exclusion (Figure 7.2).
While similar data is not consistently col-lected for Albania, BiH and Kosovo, indicators of poverty show similar trends. In terms of the wel-fare distribution, 66 % of the poor in Albania (2012) and 58.7 % in BiH (2011) lived in households whose head had primary education or less. In Kosovo (2015), 55 % of individuals aged 15 and over who had completed primary school or less lived in poor households, in comparison to 4 % of those with university degrees. Indicators on poverty head-count ratios by levels of education of individuals and household heads also show poverty incidence to be greater for lower educational attainment in the three countries.242
Higher levels of completed education have a positive bearing on one’s position in the labor market in the region. The incidence of unemploy-ment is (with some exceptions) lower among those who are better educated (Figure 7.3).243 Better-
242 The World Bank, “An Update on Poverty and Inequality in Albania,” p. 16; p. 37. World Bank, Agency for Statistics of BiH, FBiH Institute for Statistics and RS Institute for Statis-tics, Braving the Storm: Poverty and Inequality in Bosnia and Herzegovina 2007–2011 (Washington, D.C.: World Bank, 2015), pp. 17–18. World Bank and Kosovo Agency of Statistics, Consumption poverty in the Republic of Kosovo 2012–2015, p. 8.
243 See also: Olgica Ivančev, Milena Jovičić and Tijana Milojević, Income Inequality and Social Policy in Serbia (Vienna: The wiiw Balkan Observatory, 2010), p. 45; Nada Karaman Aksentijević, Nada Denona Bogović and Zoran Ježić, “Edu-cation, poverty and income inequality in the Republic of Croatia,” Zbornik radova Ekonomskog fakulteta Rijeka 24, no. 1 (2006), p. 33.
7 Education and Inequality

48
Unequal Chances and Unjust Outcomes
Figure 7.1: People at risk of poverty or social exclusion by educational attainment level (18+), 2015
Source: Eurostat244
Figure 7.2: AROPE of children by parental educational attainment (age 0–17), 2015
Source: Eurostat245
34.3%
48.2%
54.9%
57.7%
22.0%
25.5%
37.0%
39.6%
11.7%10.7%
18.8%
21.0%
0%
10%
20%
30%
40%
50%
60%
70%
EU28 Croatia Macedonia Serbia
Less than primary, primary and lower secondary education
Upper secondary and post secondary non-tertiary education
Tertiary education
52.3%
69.2%
49.6%
72.4%
23.7%21.4%
25.5%
31.9%
8.2%
3.1%
7.2%
10.5%
0%
10%
20%
30%
40%
50%
60%
70%
80%
EU28 Croatia Macedonia Serbia
Less than primary, primary and lower secondary educationUpper secondary and post-secondary non-tertiary educationTertiary education

49
Education and Inequality
educated workers in the region tend to have a higher income than persons with lower levels of completed education and are also at a lower risk of in-work poverty.246
Unequal in Access to Education, Equal in Poor Quality of Education
Education institutions in SEE are mainly public and free; they are generally considered to be ac-cessible to all.247 Primary and secondary education is free in principle, while tertiary education is in most cases provided by public institutions of high-er education, free of charge or with low fees, and the vast majority of students are attending public universities.248
244 Eurostat, “People at risk of poverty or social exclusion by educational attainment level (population aged 18 and over),” 2015. Based on EU-SILC.
245 Eurostat. “Children at risk of poverty or social exclusion by educational attainment level of their parents (population aged 0 to 17 years).” 2015. Based on EU-SILC data.
246 See: Eurostat, “Mean and median income by educational attainment level – EU-SILC survey”; “In-work at-risk-of-pov-erty rate by educational attainment level – EU-SILC survey.”
247 Koczan, “Being Poor, Feeling Poorer.”
248 Ibid. William Bartlett et al., From University to Employment: Higher Education Provision and Labour Market Needs in the Western Balkans – Synthesis Report (Luxembourg: Pub-lications Office of the European Union, 2016), p. 17.
Access to schooling is usually reflected in enrol-ment ratios, especially for school-age children and youth. Gross school enrolment ratios in the region are generally on par with EU28 countries, except for pre-primary and tertiary levels, where they are lower for most countries (Figure 7.4).
However, general enrolment or education completion rates cloak some important inequalities in opportunity that individuals face when it comes to access to education systems in the region. For in-stance, data on completion rates for the region sug-gest that persons with higher levels of education, especially upper secondary and tertiary education, live in urban areas (Figure 7.5).
When it comes to the completion of tertiary schools in particular, there is, moreover, a great discrepancy in terms of the socio-economic back-ground of students who complete this level of edu-cation (Figure 7.6).
In comparison to the general population, com-pleted levels of education are also lower for some ethnic groups, such as the Roma (Figure 7.7). Edu-cational attainment subsequently impacts the abil-ity of Roma to enter the labor market, as individuals with no or low levels of education are more likely to be jobless.249
249 UNDP, Regional Human Development Report, p. 48.
Figure 7.3: Employment and unemployment rates by level of education, 2016, annual average
Source: SEE Jobs Gateway
0%
10%
20%
30%
40%
50%
60%
70%
80%
90%Em
plo
ymen
t ra
te
Un
emp
loym
ent r
ate
Emp
loym
ent
rate
Un
emp
loym
ent r
ate
Emp
loym
ent
rate
Un
emp
loym
ent r
ate
Emp
loym
ent
rate
Un
emp
loym
ent r
ate
Emp
loym
ent
rate
Un
emp
loym
ent r
ate
Emp
loym
ent
rate
Un
emp
loym
ent r
ate
Albania BiH Croatia Kosovo Macedonia Serbia
Low (levels 0–2) Medium (levels 3–4) High (levels 5–8)

50
Unequal Chances and Unjust Outcomes
Figure 7.4: Gross enrolment ratio in SEE and EU28, pre-primary to tertiary education (%)
Source: UNESCO Institute for Statistics / UN Data250
Figure 7.5: Education completion rates, primary-tertiary (%), urban vs. rural areas
Source: World Inequality Database on Education251
0%
20%
40%
60%
80%
100%
120%
Albania (2008) BiH (2011) Croatia (2014) Macedonia (2011) Serbia (2013)
Primary Lower secondary Upper secondary Tertiary
88.6%
14,8
62.7%
36.4%
58.2%
96.6%
113.7%
100.2%98.0%
96.4%93.2%
101.3%104.1%
95.8%
88.7%
98.2%
92.5%
79.3%
96.7%
112.8%
58.1%
47.6%
69.1%
42.1%
58.3%
67.7%
0%
20%
40%
60%
80%
100%
120%
Albania BiH Croatia Kosovo Macedonia Serbia European Union
Pre-primary Primary Secondary Tertiary

51
Education and Inequality
Although systematic251 data on access to education are not available for the region, children and adults with disabilities also frequently face a risk of exclu-sion from education, may be separated into spe-cial programs or educational institutions, or tend to attend educational programs that are geared towards certain types of occupations that they are expected to take on due to widespread prejudices regarding their capabilities. 253 Moreover, although women’s enrolment rates in post-secondary educa-
250 UNESCO Institute for Statistics (uis.unesco.org) and UN Data (data.un.org). Years: 2014 for BiH and EU, 2015 for other countries. For Kosovo, average between upper and lower secondary education gross enrolment ratio (2013/2014). Ministry of Education of the Republic of Kos-ovo, Statistical Report with Education Indicators 2012/2013 and 2013/2014. Ratios may be above 100% because of the inclusion of pupils younger or older than the official age group for given level of education.
251 World Inequality Database on Education (www.education-inequalities.org). For: BIH and Macedonia based on MICS 2011; Croatia EU SILC 2014 and Serbia EU SILC 2013 data; DHS, 2008 for Albania. Tertiary completion rates for 25–29, 2 years of completion; other completion levels for gradua-tion age at respective level. No data for Kosovo.
252 For: BIH and Macedonia based on MICS 2011; Croatia EU SILC 2014 and Serbia EU SILC 2013; DHS, 2008 for Albania. Tertiary completion rates for 25–29, at least 2 years of edu-cation completed. No data for Kosovo. Based on classifica-tion of households into five groups, from the lowest to the highest value of the index or per capita income/consump-tion. Data sources vary: household characteristics and assets used in the case of DHS or MICS, disposable income in the case of EU SILC.
253 UNDP, Regional Human Development Report, p. 20.
tion in the region are almost one and a half times those of men,254 women are clustered in certain educational programs, which leads to sectoral seg-regation in the workplace and impacts their occu-pational prospects.
When it comes to students’ performance in school, available evidence suggests that students’ socio-economic status does not play a substantial part in explaining variation in test scores. Countries from the region that have participated in the OECD Programme for International Student Assessment (PISA) appear to grant relatively equal opportunity for students from diverse socio-economic back-grounds to benefit from education, also in compari-son to the OECD average (Figure 7.8).
Nevertheless, coverage gaps, calculated by the World Bank using 2012 data from PISA suggest that 55 % of children in Serbia coming from families that belonged to the poorest 20 % of the popula-tion did not have the basic level of skills in math, as opposed to 18 % coming from the richest 20 %. Such gaps were less pronounced in Croatia (44 % as opposed to 12 %), albeit still significant.255
Although education systems in the region boast high enrolment ratios for youth of school
254 Ibid, p. 33
255 Data for other countries not available. For more, see: World Bank, “PISA: Coverage Gaps.”
Figure 7.6: Tertiary education completion rates by level of student wealth, at least 2 years of education, latest available year
Source: World Inequality Database on Education252
1%
8%11%
4%
10%
59%
52%
43%
69%
51%
0%
10%
20%
30%
40%
50%
60%
70%
80%
Albania (2008) BiH (2011) Croatia (2014) Macedonia (2011) Serbia (2013)
Poorest Richest

52
Unequal Chances and Unjust Outcomes
Figure 7.7: Highest completed education (age 25–64), Roma vs. non-Roma, 2011
Source: UNDP / World Bank / European Commission Roma Surveys, 2011
Figure 7.8: Percentage of variation in science or math performance explained by students’ socio-economic status, PISA 2015
(2012 data for Serbia)256
Source: OECD PISA (2012, 2015)257
0%
10%
20%
30%
40%
50%
60%
70%
No
ne
Prim
ary
edu
cati
on
Low
er s
eco
nd
ary
Up
per
sec
on
dar
y
Post
-sec
on
dar
y
No
ne
Prim
ary
edu
cati
on
Low
er s
eco
nd
ary
Up
per
sec
on
dar
y
Post
-sec
on
dar
y
No
ne
Prim
ary
edu
cati
on
Low
er s
eco
nd
ary
Up
per
sec
on
dar
y
Post
-sec
on
dar
y
No
ne
Prim
ary
edu
cati
on
Low
er s
eco
nd
ary
Up
per
sec
on
dar
y
Post
-sec
on
dar
y
No
ne
Prim
ary
edu
cati
on
Low
er s
eco
nd
ary
Up
per
sec
on
dar
y
Post
-sec
on
dar
y
Albania BiH Croatia Macedonia Serbia
Roma Non-Roma
5%
9%
12% 12%
13%
15%
0%
2%
4%
6%
8%
10%
12%
14%
16%
Kosovo (Science) Macedonia(Science Serbia 2012 (Math) Croatia (Science) OECD 35 average 2015 (Science)
OECD 35 average 2012 (Math)

53
Education and Inequality
age and appear relatively equitable in terms of the extent to which socio-economic status de-termines school performance, the quality of the education they provide appears to be poor in most countries. This is shown by the high por-tion of 15-year-old students who scored below Level 2 proficiency, which relates to the ability to “read and understand simple texts and mas-ter basic mathematical scientific concepts and procedures.” Not attaining this baseline level be-fore the end of students’ compulsory education “is likely to lead to considerable disadvantage later in life”258 (Figure 7.9).
Beyond universal access to schooling, educa-tion quality is an important dimension of equity in education,259 which has recently also been rec-ognized in the 2015 United Nations’ Sustainable Development Goals.260 Results signal that most students in three of the countries – Albania, Ko-sovo, and Macedonia– lack access to high-quality education that would allow them to reach a base-line level of skills to partake in society. As a result, young people may be in a disadvantaged position in comparison to other cohorts of the population, which is also reflected in their difficult labor mar-ket position. According to the OECD, education systems where large cohorts of students have not mastered basic skills cannot be considered suffi-ciently inclusive.261
Education systems in the region are, moreo-ver, considered to have outdated curricula, and also to lack a practical orientation, which may hamper young people’s education-to-work tran-sitions.262 A skills mismatch between the labor market and education systems is usually cited as an important reason behind high structural unem-ployment, especially youth unemployment, in the region.263
256 Socio-economic status measured by PISA’s ESCS index, or index of economic, social and cultural status. The index is derived from several variables related to students’ family background.
257 OECD, PISA 2015 Results; OECD, PISA 2012 Results: What Students Know and Can Do: Student Performance in Math-ematics, Reading and Science, Volume 1 (Geneva: OECD, 2014).
258 OECD, PISA 2015 Results, pp. 205–206.
259 OECD, PISA 2015 Results, p. 204.
260 Whereas the earlier Millennium Development Goals placed focus on enrolment and access, Goal 4 of the SDGs pro-motes “inclusive and equitable quality education” [empha-sis added]. Ibid.
261 OECD, PISA 2015 Results, p. 205.
262 See, for instance, Jusić and Numanović, The Excluded Gen-eration, p. 7.
263 Mihail Arandarenko and Will Bartlett (eds.). Labour Market and Skills in the Western Balkans (Belgrade: Foundation for the Advancement of Economics, 2012).
Little Investment in Inclusive, Quality Education
Although there has been “little investment in up-grading education systems”264 in the region in the course of the past two decades, current reform programs suggest a general tendency of keeping spending on education stable, or even decreasing the current levels of spending in these countries, which are generally below the EU28 average of 4.8 % of GDP in 2016 (Figure 7.10).
In line with the recognition of the structural nature of unemployment in the region, a common policy priority of governments is reducing the skills mismatch between education systems and labor markets, with the majority of measures focusing on the strengthening of vocational education and training (VET) and lifelong learning systems, and to that end, the development of national qualifica-tion frameworks, revisions of curricula and teach-er training. Strengthening teachers’ professional development is envisaged by Kosovo’s ERP and Macedonia’s ESRP, while Albania’s and Macedo-nia’s governments are working on new curricula for different levels of education. Reform programs, however, generally do not devote sufficient atten-tion to the expansion of early childhood education schemes, despite their well-documented beneficial effects on children’s well-being and personal devel-opment and career prospects.265
Although the ability to attend and to excel in schooling should not be conditioned by factors such as socio-economic status, place of residence or ability, support mechanisms targeting students “usually focus on top performers, rather than those who need assistance because of their economic sta-tus” and would require “a major overhaul.”266 With very few exceptions,267 making education more in-
264 Ibid, p. 4.
265 The government of Serbia foresees measures to increase the accessibility of preschool education in their 2016 ESRP. Ac-cording to government of Albania’s 2018 ERP, a framework curriculum for preschool education has been prepared, to be applied as of 2017/2018.
266 Arandarenko, Krstić and Žarković Rakić, “Analysing Income Inequality in Serbia,” p. 6.
267 In Serbia, these include inter alia, an increase in the acces-sibility of preschool education, developing a system for an early identification of children at risk of early school leav-ing, designing special programs in order to provide incen-tives for various vulnerable groups to obtain qualifications, etc. Government of Serbia, “ESRP 2016.” The Government of Macedonia envisages a number of activities to include children from marginalized groups in primary and second-ary education, as well as facilitate greater inclusion of chil-dren with disabilities. Government of Macedonia, “ESRP 2020.” In Albania’s 2017 ERP, measures to encourage vul-nerable groups, such as ethnic minorities, to attend voca-tional schools are foreseen. Government of Albania, “ERP 2017–2019.”

54
Unequal Chances and Unjust Outcomes
Figure 7.9: Percentage of performers below Level 2 in subject areas, SEE countries and OECD averages (2012/2015 data)
Source: OECD PISA, 2015, 2012268
Figure 7.10: Public expenditure on education systems in respective SEE countries (% of GDP, COFOG classification)
Source: Countries’ economic reform programs, Eurostat for Croatia and EU28269
0%
10%
20%
30%
40%
50%
60%
70%
80%
90%
Albania Croatia Kosovo Macedonia Serbia (2012) OECD 35 average 2015 OECD 35 average 2012
% Performers below Level 2 in science % Performers below Level 2 in math % Performers below Level 2 in reading
0%
1%
2%
3%
4%
5%
6%
Albania BiH Croatia Kosovo Macedonia EU28
2015 2016 2017 (p) 2018 (p) 2019 (p) 2020 (p)

55
Education and Inequality
clusive by tackling policies that promote stratifica-tion in education and removing obstacles to access is currently not an articulated reform priority by governments in the region.
While measures that seek to address skills mis-matches are certainly necessary, they only target one aspect of the deep-rooted problems pertain-ing to the lack of quality, equity, and inclusion in education systems in SEE. A lack of emphasis on more comprehensive measures in this realm sug-gests the further ‘unlevelling’ of the playing field in these countries.
268 OECD, PISA 2015 Results; OECD, PISA 2012 Results.
269 Pertains to 2017 and 2018 ERPs. COFOG classification not available in Serbia’s ERP. Eurostat for EU and Croatia. Euro-stat, “Total general government expenditure on education,” 2015 (% of GDP % of total expenditure).” ‘P’ – projected.


57
The SEE countries in the focus of this report – Al-bania, BiH, Croatia, Kosovo, Macedonia, and Ser-bia – have experienced tremendous change in the past three decades. Social, political, and economic transformation after the fall of Communism has had immense consequences, not least of which has been a rise in inequality in the course of the transi-tion.
Inequality in SEE: Its Extent and Causes
It is not easy to establish a diagnosis of the region’s state of inequality given persistent problems with the absence and comparability of data, which stem from different types of household surveys that are available for different years. Nevertheless, looking at different sources of data and the overall trends, some conclusions may be drawn. In an interna-tional comparative perspective, most of the coun-tries considered display ‘mid-range’ (30–40 Gini points) economic inequality, but they show diver-gent trends. Serbia has the highest income inequal-ity in Europe (as measured by EU-SILC surveys in 2016) and is very close to qualifying as a ‘high’ in-equality country (above 40 Gini points). Its levels of inequality have been gradually rising in recent years. In Macedonia, income inequality has been on a steady decline, from a Gini in the mid-40s to the mid-30s, albeit still higher than the EU28 aver-age of 31 Gini points in 2016. Income inequality is lower in Croatia, showing a downward trend and converging with the EU28 average in recent years. In BiH, consumption-based indicators show a con-
sistent and moderate level of inequality, at 32 Gini points in 2015. However, estimates based on limited income data from the same survey suggest inequal-ity to be much higher – at 41.4 Gini points in 2015 – making BiH the most unequal country in the region, on par with India or many countries of South Amer-ica.270 On the other hand, with a Gini in the mid-20s in recent years, consumption-based indicators suggest that Kosovo may be the most equal country in the region, akin to countries such as Austria, the Czech Republic, or Slovenia. Nevertheless, income-based estimates, relying on limited data, show that inequality in Kosovo could be higher, with a Gini of 39.5 points in 2010. This is similar to Albania, where last available consumption data from 2012 indicate that consumption inequality was slightly below the EU28 average for that same year, but an estimate based on limited income data suggests income in-equality to be around 38 Gini points that year.
What has induced inequality in the region? Iso-lating its drivers is a difficult task due to the multidi-mensionality of the phenomenon. There are differ-ences in levels of inequality between the countries considered, which are inevitably linked to the vary-ing levels of progress of their economic, political and social transition. Nevertheless, available data for the region suggest the labor market to be a ma-jor culprit. Inequality can be attributed to the low work intensity of a substantial part of households in the region. In fact, labor markets are characterized by jobless growth, which has largely been attributed to a rise in productivity since the beginning of the
270 See, e. g. Atkinson, Inequality: What can be done? p. 22.
8 Placing Inequality on the Policy Agendas of SEE Governments

58
Unequal Chances and Unjust Outcomes
transition period. Labor markets display high levels of structural unemployment and a high incidence of vulnerable and informal employment. The gender gap in the labor market in terms of the participa-tion, employment, and wages of women in compari-son with men is substantial in most countries, as are women’s generally less favorable career prospects and pathways. Other groups, such as young per-sons, ethnic minorities, workers with low levels of acquired education and persons with disabilities are also largely excluded from labor markets.
Another commonly identified culprit for in-equality in these countries are the tax-and-benefit systems. With some exceptions, personal income taxes are marked by low progressivity and show weak redistributive effects. Moreover, a high tax wedge on low-wage earners may discourage (for-mal) employment. While there is a variation in the extent to which social protection systems ease the effects of market inequalities in the region, most of the governments provide meagre, usually means-tested social assistance, which is marked by low coverage. Crucial social services, especially community-based ones, remain underdeveloped in most countries.
271 The percentile rank (0 being the lowest, 100 the highest rank) suggests a country’s worldwide rank in terms of ef-forts to control corruption.
272 World Bank’s DataBank, “Worldwide Governance Indicators.”
Inequality in outcomes may be propelled by a lack of inequality in opportunity tied to education. This is demonstrated, for instance, by the disparity in tertiary education completion rates, connected to factors such as place of residence, ethnicity, or socio-economic status. Available evidence points to the disadvantages in the form of poverty and exclu-sion that persons with lower educational attainment experience. But beyond the ability to access and continue education, it is questionable to what extent its recipients are truly able to benefit from it: results of the OECD PISA indicate that a majority of sec-ondary school students from Albania, Kosovo and Macedonia did not have the basic skills to compre-hend simple texts and apply basic math and science concepts and procedures. While better achievers than their counterparts from the region, 15-year-olds from Croatia and Serbia also scored below the OECD average. Low achievement signals poor quality of education and reduces the chances of SEE youth to fully partake in society, also reflected in their difficult education-to-employment transitions.
Another serious, common, challenge – and culprit of inequality – remains in the form of insti-tutional inefficiencies, widespread clientelism, and ‘systemic’ corruption.273 These have also made their
273 Velina Lilyanova, “Anti-corruption efforts in the Western Balkans,” April 2017, Briefing, European Parliamentary Re-search Service.
Figure 8.1: World Bank Worldwide Governance Indicators: Control of Corruption, Percentile Rank271
Source: World Bank Worldwide Governance Indicators272
20
30
40
50
60
70
80
2002 2003 2004 2005 2006 2007 2008 2009 2010 2011 2012 2013 2014 2015 2016
Albania BiH Croatia
Kosovo Serbia Macedonia

59
Placing Inequality on the Policy Agendas of SEE Governments
imprint on the extent to which resources have been redistributed – or captured and funneled towards the needs of specific interest groups. While more or less pronounced in individual countries, elite capture of public resources has been a dominant characteristic of the transition period throughout the region. Corruption and poor governance have fueled the inability of governments to generate ad-equate policy response that could serve as “equaliz-ing mechanisms” 274 in the face of rising inequality275 (also see Figure 8.1).
Although the region has experienced sub-stantial economic growth during the 2000s and its economies are credited with attributes such as a strategic geographic position, macroeconomic sta-bility, or low unit labor costs,276 it lags significantly behind in terms of competitiveness and productiv-ity in comparison to EU countries. Moreover – in line with the findings from other countries – the “rising tide” of economic growth has not been able to “lift all boats.” In fact, growth alone has not suf-ficed to create enough jobs in the region, as there was no significant impact of growth on employment after the financial crisis, while the impact of growth on unemployment has been small.277 Indeed, the re-gion’s citizens may have to wait many decades be-fore seeing any signs of convergence with the EU in terms of income and living standards.
Concurrently, the economies of the region are dominated by labor- and resource-intensive and low-skill and technology-intensive industries, as opposed to medium or high skill- and technol-ogy- intensive ones.278 Overall levels of spending on research and development in the region are “close to negligible,”279 especially when compared to the EU. The scope of the ICT sector and its contribu-tion to GDP growth remains modest, while innova-tion policies are in their infancy.280 The proportion of the highly-skilled in the employment distribution remains lower in the region in comparison to other European countries.281
274 Atkinson, Inequality: What can be done? p. 2.
275 Stiglitz, Rewriting the Rules, pp. 19–20.
276 Peter Sanfey, Jakov Milatović and Ana Krešić, “How the Western Balkans can catch up,” Working Paper no. 186 (London: EBRD, 2016).
277 World Bank and wiiw, Western Balkans Labor Market Trends 2017, p. 26.
278 See Sanfey et al, pp. 25–26.
279 Ibid, p. 32. Refers to the Western Balkans, including Monte-negro, without Croatia.
280 With a stronger industry and access to EU resources such as the EU Regional Development Fund, Croatia is in a com-paratively much better position.
281 For more, see 2017 data on employment by occupation, ILO Stat.
Thus, although the roots of the problem of inequality are multifaceted, there appear to be suf-ficient indications that inequality in the region has not risen because of higher rewards to innovation, entrepreneurship, or skills, as in a number of ad-vanced economies, but because of malign forces that include widespread corruption, state capture, and policy failures.
What Is Being Done About Inequality and What Should Be Done?
Inequality is not the substance of policy in the re-gion. In fact, it is mentioned only occasionally in policy discourse. According to authors from Serbia, “there is no systematic official procedure for the as-sessment of the distributional impact of policy re-form measures,”282 which also holds true for other countries in the region.
The key focus of various strategic documents in the socio-economic realm has been on the relat-ed phenomena of poverty reduction, and to a lesser extent, social exclusion. This is not surprising given that poverty reduction has been at the forefront of the World Bank and IMF policy advice in the region, visible through initiatives such as poverty reduction strategy papers during the 2000s.
The focus on poverty reduction measures in the region is laudable and certainly necessary, con-sidering that a significant portion of the population in each country is in poverty or at a risk of poverty or social exclusion. However, it is also less contro-versial of an issue than focusing on measures for reducing inequality through redistributive means. At the same time, reducing inequality would require introducing more generous social welfare schemes that go against the mainstream poverty-reduction discourse of promoting means-testing as a way to target only those in need with scarce public re-sources. Rather, policy measures that seek to curb inequality tend to stress universalism in social wel-fare as being more conducive to an equal society. Paradoxically, universalistic elements of social wel-fare schemes have largely been abandoned in the countries of former Yugoslavia, and the conditions of universal service-provision have also deteriorat-ed in the realms of education and healthcare.
In light of EU accession requirements, candi-date countries in the region have adopted employ-ment and social reform programs, and both pro-spective candidates and candidate countries have
282 Arandarenko, Krstić and Žarković Rakić, “Analysing Income Inequality in Serbia: From Data to Policy,” p. 3.

60
Unequal Chances and Unjust Outcomes
developed economic reform programs. The former deal with social protection, the development of human capital and skills, and employment policy, while the latter outline a wider array of measures designed to enhance economic prospects, not lim-ited to employment and labor market reform, edu-cation and social protection. Nevertheless, besides the recent strategic drive to invest more in skills and employment policies in the region, many of the principles that are inherent to the Europe 2020 strategy and other important documents at the EU level, such as active inclusion, social investment, and flexicurity, are generally absent from these strategic documents.
In their reform documents, governments in the region have predominantly espoused reforms that aim to increase economic growth through measures seen to be conducive to improving competitiveness and attracting foreign direct investments, such as reducing the tax wedge on labor and various par-afiscal charges, as well as removing bureaucratic obstacles to business. Further fiscal consolidation efforts remain a prominent feature of most reform programs.
Missing are many of the components that are inherent to the EU’s ‘active inclusion’ and ‘flexicu-rity’ policies. While governments are giving increas-ing attention to employability through active labor market policies and life-long learning programs, adequate income support in the case of unemploy-ment or in-work poverty, and access to important social services to facilitate back-to-work transitions do not belong to reform priorities. Moreover, there is a complete absence of any discussion of pre-distribution in the policy debate283 as a means to reduce inequality at its roots through the market, and thus “reconcile productive efficiency with so-cial justice in a market capitalist economy.”284 Such measures could entail, inter alia, the strengthening of labor market institutions to ensure quality work, such as a minimum wage, efficient collective bar-gaining mechanisms, adequate legal protection of workers, basic social security in case of unemploy-ment, etc. In many of the countries, in fact, policies implemented in the name of efficiency have had an unfavorable effect on the very mechanisms that could lead to fairer outcomes.
283 The only exception is a recent contribution by the Center for Social Policy from Belgrade, which lays out predistribution as part of a one possible strategic avenue (and a part of a pre-ventive approach) for the development of the welfare state in the region. For more, see Gordana Matković, The Welfare State in Western Balkan Countries: Challenges and Options, Position Paper (Belgrade: Center for Social Policy, 2017), p. 54.
284 Chwalisz and Diamond, “Predistribution: A New Governing Prospectus for the Centre-left,” p. 1.
For instance, a dominant policy response in the labor market realm in the past years has been to make employment protection legislation (EPL) in the region more flexible, a remedy largely advised by international financial institutions based upon the view that stringent legislation hampers em-ployment and increases unemployment. However, numerous empirical studies have since pointed to inconclusive evidence concerning the relationship between EPL and aggregate employment and un-employment. It is questionable to what extent the ‘loosening’ of EPL in the region has made a positive impact on the performance of labor markets, con-sidering their persistently poor results. At the same time, much less attention has been paid to the labor market exclusion and discrimination of a substan-tial part of the population. Despite the high inac-tivity rates among women, countries in the region are marked by low investment in childcare, as well as the absence of adequate maternity and paternity leave policies that would help women maintain their position in the labor market while simultaneously enjoying adequate levels of social security. Despite high structural, long-term employment, activation measures for those who do not work or who work informally also remain underdeveloped, while pas-sive employment measures such as unemployment assistance have very low effective coverage rates in most countries of the region. Nevertheless, govern-ments have recently devoted greater attention to the strengthening of public employment services and active labor market programs targeting vulner-able groups, for which they have also garnered the support of the European Commission.285
Despite its beneficial role in reducing inequal-ity, the broadening of the scope of social protection systems generally does not appear to be a priority for governments in the region. While there is cer-tainly ample reason to question the social contract behind some expenditure schemes – such as the very high transfers for war veterans in BiH that crowd out other types of assistance – recommenda-tions for further means-testing of social assistance ought to be considered in a critical light, given international empirical evidence showing that in-creased concentration of benefits (as opposed to more universalistic schemes) increases inequality and poverty, and may lead to further deterioration of social welfare. In essence, in countries that, for the most part, have extremely high general and youth unemployment, low activity of the work-force and generally weak social security schemes,
285 See, for instance, World Bank and wiiw, Western Balkans Labor Market Trends 2017, p. 26.

61
Placing Inequality on the Policy Agendas of SEE Governments
enhancing, rather than further diminishing social insurance and social assistance schemes appears to be a more intuitive path to take in order to curb inequality and poverty.
Taxation for the sake of a reduction of differ-ences in household income is not an explicit policy aim in the countries considered. Rather, attention has been paid to reducing the tax wedge on labor – income taxes and social security benefits – primari-ly to reduce labor costs for employers and stimulate employment, while also encouraging transitions from informal to formal employment. However, de-spite the abundant empirical evidence that points to a significant link between higher progressivity of taxes and lower income inequality, progressiv-ity is, with some exceptions, generally low in the region and countries are doing little to reduce the tax wedge on the lowest salaries. Moreover, poli-cies on in-work benefits, tax credits or deductions for different types of workers (such as families with children or low-wage earners), redistributive mech-anisms that are generally seen as a means of activa-tion or that help to reduce in-work poverty, remain underdeveloped.
Last but not least, it appears that governments in the region are doing little to improve education as a means to increase equality of opportunity and thus ensure fairer outcomes. There remains a gen-eral underinvestment in early childhood education across the region, despite the beneficial effects of enrolment in early childhood education on per-sonal development and general well-being. While addressing the skills mismatch between secondary, vocational and higher education and the labor mar-ket has gained some traction among policy makers due to an ever-greater recognition that structural unemployment needs to be reduced, this is only one consequence of decades of underinvestment in inclusive, quality schooling.
As “disparities in income and wealth are of-ten reflections of other, deeper socioeconomic in-equalities” – invariably tied to gender, age, class, ethnicity or disability and reflected in unequal ac-cess to decent work and public services (education, health, etc.), equality of opportunity, and not only of income, is important to consider and measure.286 However, as the debate on improving equality of opportunity vs. equality of outcome (for instance, by means of redistribution) is slowly becoming ob-solete in light of substantial evidence that points to the importance of addressing unequal outcomes and enhancing opportunities, this fundamentally means that governments in the region have the dif-
286 UNDP, Regional Human Development Report 2016, p. 10.
ficult task of tackling both. Multifaceted responses in the realms of education, employment, taxation, and social policy, which would ensure that the root causes of labor market exclusion, often intersec-tional in nature, are appropriately addressed, ap-pear to be largely absent.
Certainly, it is important to consider that in-equality is to be tackled in a socio-economic and political climate characterized by a host of chal-lenges that are more or less pronounced in indi-vidual countries of the region, not limited to slow economic growth, poor labor market performance or high levels of corruption. Moreover, many gov-ernments of the region have adopted austerity measures to reduce budget deficits and made it their commitment to further reduce public spend-ing in the medium-term period. In that sense, any recommendations for further increases in spending on functions such as social protection or education may appear to be unrealistic. However, there is in-creasing evidence that austerity measures do more harm than good,287 and ever greater recognition that some of the region’s most pressing problems, such as poor labor market performance, won’t be solved through further fiscal consolidation.
In that light, a greater awareness among SEE policymakers of the harmful consequences of in-equality may bring impetus for reform that would have more equalizing effects on the distribution of incomes. These include a further rise in pov-erty, lower economic growth, a deterioration of the social fabric and a rise in populistic tenden-cies. Moreover, the culprits of inequality also need to be regarded with a sense of urgency because of numerous threats that may further increase gaps in prosperity. Due to a poor socio-economic situa-tion, joblessness, a corrosion of public services and security concerns, countries across the region are experiencing substantial emigration trends and a loss of human capital. While some may argue that emigration will alleviate the pressure on countries’ social welfare systems and may curb income ine-quality and poverty at home due to the inflow of remittances from abroad, such effects may only be felt in the short run, as the exodus of predominant-ly young and educated people288 from the region will have a detrimental effect on SEE economies. In fact, “the loss of qualified workers and the short-age of skills may have adversely affected competi-
287 Brad Plumer, “IMF: Austerity is much worse for the econ-omy than we thought,” The Washington Post, Oct. 12, 2012.
288 For instance, see World Bank and wiiw, Western Balkans Labor Market Trends 2018 (Washington, D.C.: World Bank Group and wiiw, 2018), p. 2.

62
Unequal Chances and Unjust Outcomes
tiveness, growth and economic convergence.”289 An ageing population will place a growing burden on the countries’ already weak social safety nets. Last but not least, like other regions of the world, the SEE region may increasingly be affected by the trend of ‘hollowing out’ of labor markets, whereby the share of employment in high- and low-skilled occupations may rise, while the share of middle-skilled employment – where the bulk of employ-ment in the region currently is – may go down. Such labor market polarization is attributed to machines’ increasing ability to do routine tasks that fall in the middle-skill category more rapidly and economi-cally than humans.290
Citizens of SEE may also give impetus for greater equality. Public awareness of the problem of inequality is high in the region, with a recent survey showing that over 88 % of respondents per-ceived that the gap between the rich and the poor in their countries was increasing.291 Nevertheless, as Arandarenko et al. point out for Serbia, “although preferences toward greater equality are dominant among the population at the level of individuals, as elsewhere, they are not articulated enough into a set of social preferences moving toward the re-duction of income inequality and the promotion of equality of possibility.”292 The public discourse should be directed towards a renewed focus on the foundations of the social contracts in these coun-tries, most of which emerged and were shaped in very turbulent times.
In light of the region EU integration prospects, a stronger impetus for equality needs to come from the European Commission. The EU’s new Enlarge-ment Strategy for the Western Balkans, adopted in February 2018, stresses the importance of a “new reinforced social dimension,” and to that end envis-ages the Commission’s support for employment and social reforms, including greater investment in edu-cation and health and a closer alignment of coun-tries’ ERPs with the European semester.293 To truly reinforce enlargement’s social dimension, the Eu-ropean Commission should actively promote all of the principles inherent to the recently proclaimed
289 Ibid, p. 2.
290 World Bank, Digital Dividends: World Development Report 2016 (Washington, D.C.: World Bank Group, 2016), pp. 21–22.
291 Pertains to Albania, BiH, Croatia, Kosovo, Macedonia, Mon-tenegro and Serbia. Regional Cooperation Council (RCC), Balkan Barometer 2017: Public Opinion Survey (Sarajevo: Regional Cooperation Council, 2017), p. 60.
292 Arandarenko, Krstić and Žarković Rakić, “Analysing Income Inequality in Serbia: From Data to Policy,” p. 7.
293 European Commission, “A Credible Enlargement Perspec-tive for and enhanced EU Engagement with The Western Balkans,” 6 February, 2018, Brussels, p. 13.
European Pillar of Social Rights,294 which form the basis for monitoring EU members’ socio-economic progress as part of the European semester. These principles include access to training and life-long learning and active labor market policies, which the EU has provided considerable support for through the Instrument of Pre-Accession Assistance (IPA) in the region. In the employment realm, principles also pertain to the security of employment and of income, quality working conditions, prevention of precarious work, minimum wages for a decent standard of living, robust social dialogue and col-lective bargaining mechanisms, work-life balance and a health and safety at work. In the social realm, they include healthcare, childcare and long-term care, and services tailored towards the inclusion of persons with disabilities; as well as adequate income support through unemployment benefits, minimum income benefits or old-age pensions. In other words, values inherent to the European Pil-lar of Social Rights and other important documents in the social realm should not be promoted on a selective basis through the EU’s political, financial and technical support to Western Balkans’ enlarge-ment. Residents of the region should not only be able to benefit from enhanced job prospects, but from secure, decent employment, adequate income and quality public services that allow them to par-take in society in a meaningful manner.
Provided the differences in the types of socio-economic and political challenges that countries in the region face, they will inevitably need to espouse heterogeneous approaches to addressing the multi-faceted problem of economic inequality. Neverthe-less, some policy responses that have been recog-nized and promoted in this realm are suggested as common points of departure in subsequent text.
294 The European Pillar of Social Rights was proclaimed by the European Parliament, the Council of the European Union and the European Commission in November of 2017. For more, see: European Union, The European Pillar of Social Rights (Luxembourg: The Publications Office of the EU, 2017).

63
Given that inequality is attributed to a complex in-teraction of various conditions, a multidimensional call for action across various policy fields is needed. Underneath, we offer some general recommenda-tions for containing inequality, with the qualifica-tion that policy priorities will depend on the idio-syncrasies inherent in the political and institutional arrangements in different countries, but also on the extent to which individual generators of inequality prevail. Specific measures may thus be of more or less relevance in reducing inequality.
Labor Market Policies
• It is important to strengthen social dialogue and collective bargaining mechanisms as means to ensure more equitable earnings, workers’ improved representation in corporate govern-ance, greater labor market security and a better quality of jobs.
• Income security should be extended through greater coverage and generosity of unemploy-ment benefits. The introduction of unemploy-ment assistance schemes for those without social insurance coverage in the event of un-employment should be considered to that end.
• The design, coverage and targeting of a mix of active labor market policies – not limited to training schemes and employment subsidies – should be improved, as to enhance the employ-ability of vulnerable and excluded groups, such as women, youth, persons with disabilities, na-
tional minorities, and persons with low levels of educational attainment. This is especially im-portant in light of further negative consequenc-es that labor markets in the region may face as increased premiums are placed on high-skilled workers in light of the technological change.
• The capacities of employment services need to be strengthened, as to ensure more effective support in the event of unemployment. Better integration of employment and social services may foster the inclusion of vulnerable groups in labor markets.
Tax Policies
• The progressivity of personal income tax should be increased, and the overall tax bur-den lowered on low-wage earners, as to en-courage their transition from inactivity or in-formal employment to formal employment.
• The introduction of a mix of schemes that would “make work pay,” not limited to in-work benefits, tax credits or wage subsidies, should be considered as to encourage the employ-ment of various categories of earners and to protect them against in-work poverty.
• Greater effort should be devoted to combatting tax avoidance and tax evasion, as to protect the tax base and increase tax revenues available for investment in the economy, and the financing of social transfers and important public services.
9 Leveling the Playing Field, Leveling the Scores: Framework Recommendations

64
Unequal Chances and Unjust Outcomes
Social Protection Policies
• Greater coverage and more generous social transfers are needed in order to protect indi-viduals against various social risks. A general expansion of social protection towards more universal entitlements should be considered in light of growing evidence that such entitle-ments reduce both poverty and inequality.
• Deinstitutionalization and further expansion of various types of social services should be promoted, with a special emphasis on ensur-ing greater access to services, as well as quality assurance in service provision.
• More effective family and work reconciliation policies should be designed and implement-ed, not limited to introducing paternity leave in countries where such policy has not been adopted and expanding access to affordable, quality childcare.
Education Policies
• In order to foster personal development and encourage greater equality of opportunity, es-pecially for children from low-income families, greater investment in early childhood educa-tion is required throughout the region.
• Comprehensive measures are needed to in-crease access to all levels of education, and es-pecially tertiary education, for various exclud-ed groups, such as students with disabilities, the Roma, residents of rural areas or children and young adults living in poverty. These may include scholarships or subsidized room and board; for students with disabilities, greater focus on removing physical obstacles in access to education is needed.
• In order to foster the inclusion of young per-sons in society, the quality of education sys-tems in the region needs to be improved. This may be done through measures such as teach-er education and training, quality assurance, and students’ access to appropriate learning resources. Modernizing curricula, expanding vocational education and improving the prac-tical orientation of secondary and university-level education is needed in order to ensure better matching between educational systems and labor markets.

65
Agency for Statistics of BiH. “First Release: Household Budg-
et Survey 2015.” 28 July, 2017. Available at: http://www.
bhas.ba/ankete/HBS_saopstenje_juli_BS_www.pdf [last
accessed: 1 March, 2018].
Alkan, Can. Statistical Bulletin No. 6. Yenimahalle-Ankara:
CPESSEC, 2016.
Alvaredo, Facundo, Lucas Chancel, Thomas Piketty, Em-
manuel Saez and Gabriel Zucman. World Inequality
Report 2018. Paris: World Inequality Lab, 2017. Available
at: http://wir2018.wid.world/files/download/wir2018-sum--
mary-english.pdf [last accessed: 1 March, 2018].
Alvaredo, Facundo and Leonardo Gasparini. “Recent Trends
in Inequality and Poverty in Developing Countries.” CEDLAS
Document no. 151. Nov. 2013. Available at: https://www.
gc.cuny.edu/CUNY_GC/media/CUNY-Graduate-Center/
PDF/Centers/LIS/Milanovic/readings/1.2/alvaredo_gasparini.
pdf [last accessed: 1 March, 2018].
Arandarenko, Mihail, Gorana Krstić and Jelena Žarković
Rakić. “Analysing Income Inequality in Serbia: From Data
to Policy.” Executive Summary. Belgrade: Friedrich-Ebert-
Stiftung, 2017. Available at: https://www.fren.org.rs/
node/653?lang=en [last accessed: 1 March, 2018].
Arandarenko, Mihail. “Nejednaki dohoci, nejednaka potrošnja”
[Unequal incomes, unequal consumption]. Monitoring the
Social Situation in Serbia (MONS) Platform. 6 July, 2017,
Available at: http://mons.rs/#/nejednaki-dohoci-nejednaka-
potrosnja [last accessed: 1 March, 2018].
Arandarenko, Mihail and Vladimir Vukojević. Labor Costs
and Labor Taxes in the Western Balkans. Washington,
D.C.: World Bank, 2008. Available at: http://siteresourc2-
es.worldbank.org/INTECAREGTOPHEANUT/Resources/
Betcherman&Arandarenko-labor_taxes_western_bal-
kans.pdf [last accessed: 1 March, 2018].
Atkinson, Anthony B. Inequality: What can be done? Cam-
bridge, MA: Cambridge University Press, 2015.
Atoyan, Ruben and Jesmin Rahman. “Western Balkans: In-
creasing Women’s Role in the Economy.” IMF Working Pa-
per, WP/17/194. Washington, D.C.: IMF, 2017. Available at:
https://www.imf.org/en/Publications/WP/Issues/2017/09/01/
Western-Balkans-Increasing-Women-s-Role-in-the-Econo-
my-45179 [last accessed: 1 March, 2018].
Avlijaš, Sonja et al. Gender Pay Gap in the Western Balkan
Countries: Evidence from Serbia, Montenegro and Mac-
edonia. Belgrade: FREN – Foundation for the Advance-
ment of Economics, 2013.
Bacaj, Hana. The Role of Women in the Economy of Kosovo
[Thesis]. Prishtina: Rochester Institute of Technology Ko-
sovo, 2017.
Bartlett, William. “The Political Economy of Welfare Reform
in the Western Balkans.” Poverty and Exclusion in the
Western Balkans, eds. Caterina Ruggeri Laderchi and Sara
Savastano. New York, NY: Springer, 2013. pp. 245–260.
Bartlett, William et al. From University to Employment: High-
er Education Provision and Labour Market Needs in the
Western Balkans – Synthesis Report. Luxembourg: Publi-
cations Office of the European Union, 2016.
Bartlett, William. “The Political Economy of Accession: Form-
ing Economically Viable Member States.” The EU and
Member State Building: European Foreign Policy in the
Western Balkans, eds. Soeren Keil and Zeynep Arkan.
London & New York: Routledge, 2014. pp. 209–232.
Bejaković, Predrag and Željko Mrnjavac. “The Role of the
Tax System and Social Security Transfers in Reducing In-
come Inequality: The Case of the Republic of Croatia.”
Ekonomski pregled 67, no. 5 (2016): 399–417.
Bornarova, Suzana. “Development of the Social Protection Sys-
tem in Post-Communist Macedonia: Social Policy-Making
and Political Processes.” Welfare States in Transition: 20
Years After the Yugoslav Welfare Model, eds. Stambolieva,
Maria and Stefan Dehnert. Sofia: Friedrich-Ebert-Stiftung,
References

66
Unequal Chances and Unjust Outcomes
2011. pp.135–164. Available at: http://library.fes.de/pdf-
files/bueros/sofia/08711.pdf [last accessed: 1 March, 2018].
Broz, Tajana and Dora Levačić. “Some Facts about the Gender
Pay Gap in Croatia.” Country fact sheet. Genderpaygap.eu,
2015. Available at: http://genderpaygap.eu/documents/
Factsheet_Croatia.pdf [last accessed: 1 March, 2018].
Cancho, Cesar and Nihal Elwan. Bosnia and Herzegovina:
Gender Disparities in Endowments, Access to Economic
Opportunities and Agency. Washington, D.C.: World
Bank Group, 2015.
David Card, Thomas Lemieux and W. Craig Riddell. “Un-
ionization and Wage Inequality: A Comparative Study of
the U.S, the U.K., and Canada.” NBER Working Paper No.
9473, 2003.
Cazes, Sandrine and Alena Nesporova. “Combining flexibility
and security for employment and decent work in the West-
ern Balkans.” South-East Europe Review 2 (2006): 7–23.
Cazes, Sandrine, Sameer Khatiwada and Miguel Malo.
Employment Protection and Collective Bargaining: Beyond
the Deregulation Agenda. Employment Working Paper
no. 133. Geneva: ILO, 2012. Available at: http://www.ilo.
org/wcmsp5/groups/public/@ed_emp/documents/publica-
tion/wcms_191726.pdf [last accessed: 1 March, 2018].
Chwalisz, Claudia and Patrick Diamond. “Predistribution: A
New Governing Prospectus for the Centre-left.” The Pre-
distribution Agenda, eds. Claudia Chwalisz and Patrick
Diamond. London: I. B. Tauris, 2015.
Council of Ministers of BiH. “Economic Reform Programme
2018–2020.” Available at: http://www.dep.gov.ba/naslov-
na/default.aspx?id=1894&langTag=en-US [last accessed:
1 March, 2018].
Council of Ministers of BiH. “Economic Reform Programme
2017–2019.” Available at: http://www.dep.gov.ba/naslov-
na/default.aspx?id=1810&langTag=bs-BA [last accessed:
1 March, 2018].
Čok, Mitja, Ivica Urban and Miroslav Verbič. “Income Redis-
tribution through Taxes and Social Benefits: The Case of
Slovenia and Croatia.” Panoeconomicus 60, no. 5 (2013):
667–686.
Čok, Mitja and Ivica Urban. “Distribution of Income and Tax-
es in Slovenia and Croatia.” Post-Communist Economies
19, no. 3 (2007): 299–316.
Dávalos, María E. and Ledia Thomo. Portraits of poverty and
inequality in Albania. Washington, D.C.: World Bank Group,
2016. Available at: http://documents.worldbank.org/cu-
rated/en/659991480409319302/Portraits-of-poverty-and-
inequality-in-Albania [last accessed: 1 March, 2018].
Deloitte. “International Tax: Bosnia and Herzegovina Highlights
2017.” 2017. Available at: https://www2.deloitte.com/con-
tent/dam/Deloitte/global/Documents/Tax/dttl-tax-bosniaher-
zegovinahighlights-2017.pdf [last accessed: 1 March, 2018].
Deloitte. “International Tax: Croatia Highlights 2017.” 2017.
Available at: https://www2.deloitte.com/content/dam/
Deloitte/global/Documents/Tax/dttl-tax-croatiahigh-
lights-2017.pdf [last accessed: 1 March, 2018].
Deloitte. “International Tax: Serbia Highlights 2017.” 2017.
Available at: https://www2.deloitte.com/content/dam/
Deloitte/cn/Documents/international-business-support/
deloitte-cn-ibs-serbia-int-tax-en-2017.pdf [last accessed:
1 March, 2018].
Deloitte. “International Tax: Albania Highlights 2017.” 2017.
Available at: https://www2.deloitte.com/content/dam/
Deloitte/cn/Documents/international-business-support/
deloitte-cn-ibs-albania-int-tax-en-2017.pdf [last accessed:
1 March, 2018].
Deloitte. “International Tax: FYR Macedonia Highlights 2017.”
2017. Available at: https://www2.deloitte.com/content/
dam/Deloitte/cn/Documents/international-business-sup-
port/deloitte-cn-ibs-macedonia-int-tax-en-2017.pdf [last
accessed: 1 March, 2018].
Deloitte. “International Tax: Kosovo 2018.” 2018. Available at:
https://www2.deloitte.com/content/dam/Deloitte/global/
Documents/Tax/dttl-tax-kosovohighlights-2018.pdf [last
accessed: 1 March, 2018].
Duka, Raimonda. Albanian tax system and its effects on gen-
der equality. Stockholm: Indevelop, 2011.
Đukić, Ognjen and Nikolina Obradović. Nejednakost u BiH:
Od praznih džepova do punih sefova. Banja Luka: GEA,
2016. Available at: https://www.gea.ba/nejednakost-u-
bih-od-praznih-dzepova-do-punih-sefova/ [last accessed:
1 March, 2018].
Engsted, Isabelle Marquet. “The European Context: Meas-
uring Social Inclusion in the European Union.” Poverty
and Exclusion in the Western Balkans, eds. Caterina Rug-
geri Laderchi and Sara Savastano. New York, NY: Spring-
er, 2013. pp. 13–28.
European Policy Institute. “Who Cares for the Carers? Pro-
moting Applied Policies for Informal Long-Term Care.”
Policy brief. Skopje: EPI, 2016. Available at: http://epi.
org.mk/docs/Policy_brief[EN].pdf [last accessed: 1 March,
2018].
European Commission. “A Credible Enlargement Perspective
for and enhanced EU Engagement With The Western
Balkans.” 6 February, 2018, Brussels. Available at: httk-
ps://ec.europa.eu/commission/publications/eu-western-
balkans-strategy-credible-enlargement-perspective_en
[last accessed: 1 March, 2018]
European Commission. “Active Inclusion.” Employment,
Social Affairs & Inclusion, 2018. Available at: http://
ec.europa.eu/social/main.jsp?catId=1059&langId=en
[last accessed: 1 March, 2018].
European Commission. “Flexicurity.” Employment, Social Af-
fairs & Inclusion, 2018. Available at: http://ec.europa.eu/
social/main.jsp?catId=102 [last accessed: 1 March, 2018].
European Commission. “2017 Economic Reform Programmes
of Albania, the former Yugoslav Republic of Macedonia,
Montenegro, Serbia, Turkey, Bosnia and Herzegovina and
Kosovo*: The Commission’s Overview and Country As-
sessments.” Institutional Paper 055. Luxembourg: Publi-
cations Office of the European Union, 2017.

67
References
European Commission. “European Semester Thematic Fact -
sheet: Taxation.” 2017. https://ec.europa.eu/info/sites/info/
files/file_import/european-semester_thematic-factsheet_
taxation_en.pdf.
European Commission. “Croatia Country Report 2017.” 2017
European Semester: Assessment of progress on structural
reforms, prevention and correction of macroeconomic im-
balances, and results of in-depth reviews under Regulation
(EU) No 1176/2011. February 2017.
European Commission. “Towards Social Investment for
Growth and Social Cohesion – including and implement-
ing the European Social Fund 2014–2020.” Brussels, 20
February, 2013. Available at: http://ec.europa.eu/social/Blo
bServlet?docId=9761&langId=en [last accessed: 1 March,
2018].
European Union. The European Pillar of Social Rights. Luxem-
bourg: The Publications Office of the EU, 2017. Available
at: https://ec.europa.eu/commission/sites/beta-political/
files/social-summit-european-pillar-social-rights-booklet_
en.pdf [last accessed: 1 March, 2018].
European Commission. Social Protection and Social Inclusion
in the Western Balkans: A Synthesis Report. Brussels: Eu-
ropean Commission, 2009. Available at: http://ec.europa.
eu/social/BlobServlet?docId=4442&langId=en.
European Bank for Reconstruction and Development
(EBRD). Transition Report 2016–2017, Transition for all:
Equal opportunities in an unequal world. London: EBRD,
2016. Available at: http://www.ebrd.com/documents/oce/
pdf-transition-report-201617-english.pdf [last accessed:
1 March, 2018].
Eurostat. “Children at risk of poverty or social exclusion by
educational attainment level of their parents (population
aged 0 to 17 years).” Available at: http://appsso.eurostat.
ec.europa.eu/nui/show.do?dataset=ilc_peps60&lang=en
last accessed: 1 March, 2018].
Eurostat. “Employment and unemployment statistics.” Avail-
able at: http://ec.europa.eu/eurostat/web/lfs/data/main-
tables [last accessed: 1 March, 2018].
Eurostat. “Formal child care by duration and age group.”
Available at: http://ec.europa.eu/eurostat/web/income-
and-living-conditions/data/main-tables last accessed: 1
March, 2018].
Eurostat. “Gini coefficient of equivalised disposable income
– EU-SILC survey.” Available at: http://ec.europa.eu/eui-
rostat/tgm/table.do?tab=table&language=en&pcode=te
ssi190 [last accessed: 1 March, 2018].
Eurostat. “Government expenditure on social protection.”
Available at: http://ec.europa.eu/eurostat/statistics-ex/-
plained/index.php/Government_expenditure_on_social_
protection [last accessed: 1 March, 2018].
Eurostat. Household Budget Survey 2010 Wave EU Quality
report. 2015. Available at: http://ec.europa.eu/eurostat/
documents/54431/1966394/2015-04-01_QualityRe-
port2010.pdf/418a037a-bfbc-486e-9ff7-4b140b543f39
[last accessed: 1 March, 2018].
Eurostat. “In-work at-risk-of-poverty rate by educational at-
tainment level – EU-SILC survey.” Available at: http://
appsso.eurostat.ec.europa.eu/nui/show.do?dataset=ilc_
iw04&lang=en [last accessed: 1 March, 2018].
Eurostat. “Mean and median income by educational attain-
ment level – EU-SILC survey.” Available at: http://appsso.
eurostat.ec.europa.eu/nui/show.do?dataset=ilc_di08
[last accessed: 1 March, 2018].
Eurostat. “People at risk of poverty or social exclusion by
educational attainment level (population aged 18 and
over).“ Available at: http://appsso.eurostat.ec.europa.
eu/nui/show.do?dataset=ilc_peps04&lang=en [last aco-
cessed: 1 March, 2018].
Eurostat. “People living in households with very low work in-
tensity by age and sex (population aged 0 to 59 years).”
Available at: http://appsso.eurostat.ec.europa.eu/nui/subo-
mitViewTableAction.do [last accessed: 1 March, 2018].
Eurostat. “S80/S20 income quintile share ratio by sex and se-
lected age group – EU-SILC survey.” Available at: thttp://
appsso.eurostat.ec.europa.eu/nui/show.do?dataset=ilc_
di11&lang=en [last accessed: 1 March, 2018].
Eurostat. “Tax rate on low wage earners: Tax wedge on labour
costs.” http://appsso.eurostat.ec.europa.eu/nui/show.do
?dataset=earn_nt_taxwedge&lang=en [last accessed:
1 March, 2018].
Eurostat. “Total general government expenditure on education.”
Available at: http://ec.europa.eu/eurostat/statistics-ex/-
plained/index.php/File:Total_general_government_expend-
iture_on_education,_2015_(%25_of_GDP_%25_of_total_
expenditure)-T1.png [last accessed: 1 March, 2018].
Eurostat. “Young people neither in employment nor in edu-
cation and training by sex, age and labour status (NEET
rates).” Available at: http://ec.europa.eu/eurostat/web/
education-and-training/data/database [last accessed: 1
March, 2018].
EU Delegation to BiH. “Compact for Growth and Jobs in BiH.”
Sarajevo: EU Delegation to BiH, 2014. Available at: https://
europa.ba/wp-content/uploads/2015/05/delegacijaEU_20
14090816171626eng.pdf [last accessed: 1 March, 2018].
Friedrich-Ebert-Stiftung. “FES Annual Reviews of Labor Re-
lations and Social Dialogue in SEE.” Available at: http://
www.fes-socialdialogue.org/news-list/e/the-2016-annu-
al-reviews-of-labour-relations-and-social-dialogue-for-
16-countries-in-central-eastern-europe-and-southeast-
europe-are-online/ [last accessed: 1 March, 2018].
García, Jorge Luis, James J. Heckman, Duncan Ermini Leaf
and María José Prados. “The Life-cycle Benefits of an In-
fluential Early Childhood Program.” HCEO Working Pa-
per, 2016. Available at: https://cehd.uchicago.edu/page/
paper-life-cycle-benefits-influential-early-childhood-pro-
gram [last accessed: 1 March, 2018].
García, Alejandro Bonilla and Jean-Victor Gruat. Social
protection: A life cycle continuum investment for social
justice, poverty reduction and development. Version 1.0.
Geneva: ILO, 2003.

68
Unequal Chances and Unjust Outcomes
Gotcheva, Boryana and Ramya Sundaram. “Socal Safety
Nets in the Western Balkans: Design, Implementation
and Performance.” Poverty and Exclusion in the Western
Balkans, eds. Caterina Ruggeri Laderchi and Sara Savas-
tano. New York, NY: Springer, 2013. pp. 221–244.
Government of the Republic of Albania. “Economic Reform
Programme 2018–2020.” Available at: http://www.fi-
nanca.gov.al/files/userfiles/Programimi_EkonomikoFiskal/
Ekonomia_ne_Fokus/2018/Economic_Reform_Pro-
gramme_2018-2020.pdf [last accessed: 15 March, 2018].
Government of the Republic of Albania. “Economic Re-
form Programme 2017–2019.”
Government of the Republic of Croatia. “National Re-
form Programme 2017.” Available at: https://vlada.gov.
hr/UserDocsImages/Europski%20semestar/NRP%20
HR%202017.pdf [last accessed: 1 March, 2018].
Government of the Republic of Kosovo. “Kosovo Economic
Reform Programme 2018–2020.” Available at: https://
mf.rks-gov.net/desk/inc/media/575DDCA8-52DD-451F-
AFE8-F5DBBC247F7A.pdf [last accessed: 15 March, 2018].
Government of the Republic of Kosovo. “Kosovo Eco-
nomic Reform Programme 2017.” https://mf.rks-gov.
net/desk/inc/media/57179C7A-9531-4E3D-AEDE-EC-
C703B75D55.pdf [last accessed: 1 March, 2018].
Government of the Republic of Macedonia. “Economic
Reform Programme 2018–2020.” Available at: https://
www.finance.gov.mk/files/Macedonia_ERP_2018.pdf
[last accessed: 15 March, 2018].
Government of the Republic of Macedonia. “Economic
Reform Programme 2017–2019.” Available at: https://
www.finance.gov.mk/files/ERP_2017_2019_MK.pdf [last
accessed: 1 March, 2018].
Government of the Republic of Macedonia. Ministry of
Labor and Social Policy. “Employment and Social Re-
form Programme 2020.” Skopje: July 2017. Available at:
http://www.mtsp.gov.mk/content/word/esrp_dokumenti/
ESRP%20Macedonia%20-%20final%20(ENG).pdf [last
accessed: 1 March, 2018].
Government of the Republic of Serbia. “Economic Reform
Programme for the Period 2018–2020.” Available at:
http://www.mfin.gov.rs/UserFiles/File/strategije/2018/
ERP%202018-2020%20ENG%20FINAL.pdf [last ac8-
cessed: 15 March, 2018].
Government of the Republic of Serbia. “Economic Reform
Programme for the Period 2017–2019.” Available at:
http://www.mfin.gov.rs/UserFiles/File/strategije/ERP%20
2017%20-%202019%20final_Eng.pdf [last accessed:
1 March, 2018].
Government of the Republic of Serbia. Social Inclusion and
Poverty Reduction Unit. “Employment and Social Reform
Programme in the Process of Accession to the European
Union.” Belgrade: May 2016. Available at: http://soci-
jalnoukljucivanje.gov.rs/wp-content/uploads/2016/06/
SIPRU-ESRP-2016-English.pdf [last accessed: 1 March,
2018].
Gradstein, Mark and Branko Milanovic. “Does libertè=egalité?
A survey of the empirical links between democracy and in-
equality with some evidence on the transition economies.”
Journal of Economic Surveys 18, no. 4 (2004): 515–537.
Gupta, Sanjeev, Hamid Davoodi and Rosa Alonso-Terme.
“Does corruption affect income inequality and poverty?”
Economics of Governance 3, Issue 1 (March 2002): 23–45.
Halilbašić, Muamer et al. “Dijagnoza tržišta rada” [Labor
Market Diagnosis]. Sarajevo: Economic Institute of Sara-
jevo, 2015.
International Labor Organization (ILO). World Social Pro-
tection Report 2017/19: Universal social protection to
achieve the Sustainable Development Goals. Geneva:
ILO, 2017. Available at: http://www.ilo.org/global/pub:-
lications/books/WCMS_604882/lang--en/index.htm [last
accessed: 1 March, 2018].
ILO. World Social Protection Report 2014/15: Building eco-
nomic recovery, inclusive development and social jus-
tice. Geneva: ILO, 2014. Available at: http://www.ilo.
org/global/research/global-reports/world-social-security-
report/2014/WCMS_245201/lang--en/index.htm [last ac1-
cessed: 1 March, 2018].
Institute of Statistics of Albania. “Living Standard Measure-
ment Survey 2012.” Available at: http://www.instat.gov.
al/en/figures/micro-data/ [last accessed: 1 March, 2018].
Ivančev, Olgica, Milena Jovičić and Tijana Milojević. Income
Inequality and Social Policy in Serbia. Vienna: The wiiw
Balkan Observatory, 2010. Available at: https://wiiw.ac.at/
income-inequality-and-social-policy-in-serbia-p-3207.html
[last accessed: 1 March, 2018].
Jusić, Mirna and Amar Numanović. The Excluded Generation:
Youth in Southeast Europe. Sarajevo: FES Dialogue South-
east Europe, 2017. Available at: http://library.fes.de/pdf-files/
bueros/sarajevo/13780.pdf [last accessed: 1 March, 2018].
Jusić, Mirna and Amar Numanović. Flexible Labor in an
Inflexible Environment: Reforms of Labor Market Insti-
tutions in BiH in a Comparative Perspective. Sarajevo:
Center for Social Research Analitika, 2015. Available
at: http://www.analitika.ba/sites/default/files/publikacije/
fleksibilan_rad_eng.pdf [last accessed: 1 March, 2018].
Karaman Aksentijević, Nada, Nada Denona Bogović and
Zoran Ježić. “Education, poverty and income inequality
in the Republic of Croatia.” Zbornik radova Ekonomskog
fakulteta Rijeka 24, no. 1(2006): 19–37. Available at:
https://hrcak.srce.hr/5170 [last accessed: 1 March, 2018].
Koczan, Zsoka. “Being Poor, Feeling Poorer: Inequality, Pov-
erty and Poverty Perceptions in the Western Balkans.”
WP/16/31. Washington, D.C.: International Monetary Fund,
2016. Available at: https://www.imf.org/external/pubs/ft/
wp/2016/wp1631.pdf [last accessed: 1 March, 2018].
Koettl, Johannes. “Does Formal Work Pay in Serbia? The Role
of Labor Taxes and Social Benefit Design in Providing Dis-
incentives for Formal Work.” Poverty and Exclusion in the
Western Balkans, eds. Caterina Ruggeri Laderchi and Sara
Savastano. New York, NY: Springer, 2013. pp. 133–154.

69
References
Koettl, Johannes and Michael Weber. “Does Formal Work
Pay? The Role of Labor Taxation and Social Benefit De-
sign in the New EU Member States.” IZA Discussion Pa-
per, no. 6313. January 2012. Available at: https://d-nb.
info/1021667374/34 [last accessed: 1 March, 2018].
Korpi, Walter and Joakim Palme. “The Paradox of Redistribution
and Strategies of Equality: Welfare State Institutions, Ine-
quality and Poverty in the Western Countries.” Luxembourg
Income Study (LIS) Working Paper Series no. 174. Available
at: https://www.econstor.eu/bitstream/10419/160846/1/lis-
wps-174.pdf [last accessed: 1 March, 2018].
Kozuharov, Sasho Vladimir Pektovski, and Natasha Ris-
tovska. “The Impact of Taxes Measured by Gini Index
in Macedonia.” UTMS Journal of Economics 6, no. 1
(2015): 41–52.
Kramer, Dželila. Personal income tax reform in the Federation
of Bosnia and Herzegovina. Doctoral Dissertation. Uni-
versity of Ljubljana, 2016.
KPMG. “Annual personal income tax for income generated
in 2017.” 1 February 2018. Available at: https://home.
kpmg.com/rs/en/home/insights/2018/02/Tax-Alert-
Annual-personal-income-tax-for-income-generated-in-
2017-February.html.
Kriesi, Hanspeter and Takis S. Pappas [eds]. European Pop-
ulism in the Shadow of the Great Recession. Colchester,
UK: ECPR Press, 2015.
Krstić, Gorana. “Why Income Inequality is So High in Serbia:
Empirical Evidence and Measurement of the Key Fac-
tors.” Economic Annals LXI, no. 2010 (July–Sept. 2016):
23–46. Available at: http://www.doiserbia.nb.rs/img/
doi/0013-3264/2016/0013-32641610023K.pdf [last ac-
cessed: 1 March, 2018].
Krstić, Gorana and Peter Sanfey. “Earnings inequality and
the informal economy: evidence from Serbia.” London:
EBRD, 2010. Available at: http://www.ebrd.com/down:-
loads/research/economics/workingpapers/wp0114.pdf
[last accessed: 1 March, 2018].
Krstić, Gorana and Peter Sanfey. “Mobility, poverty and well-be-
ing among the informally employed in Bosnia and Herzego-
vina.” EBRD Working paper no. 101. London: EBRD, 2006.
Leibfried, Stephan and Steffen Mau (eds). Welfare States.
Construction, Deconstruction, Reconstruction. Analytical Ap-
proaches. Vol. 1. Cheltenham: Edward Elgar Publishing, 2008.
Lilyanova, Velina. “Anti-corruption efforts in the Western
Balkans.” Briefing, April 2017. European Parliamentary
Research Service. http://www.europarl.europa.eu/RegDa-
ta/etudes/BRIE/2017/599417/EPRS_BRI(2017)599417_
EN.pdf [last accessed: 1 March, 2018].
Malkić, Aida and Amar Numanović. “Caring for Carers: An
Analysis of Informal Care Policies in BiH,” Policy Brief.
Sarajevo: Analitika, Center for Social Research, 2017.
Mara, Isilda and Edlira Narazani. “The Effects of Flat Tax
on Inequality and Informal Employment: The Case of
Albania.” Vienna: The wiiw Balkan Observatory, 2011.
Available at: https://wiiw.ac.at/the-effects-of-flat-tax-on-
inequality-and-informal-employment-the-case-of-alba-
nia-p-2732.html [last accessed: 1 March, 2018].
Marx, Ive, Brian Nolan and Javier Olivera. “The Welfare
State and Anti-Poverty Policy in Rich Countries.” IZA Dis-
cussion Papers No. 8154, 2014. Available at: https://pdfs.
semanticscholar.org/6bc8/b2991ead22361fe608cbfd-
286b82fc3a3276.pdf [last accessed: 1 March, 2018].
Matković, Gordana. The Welfare State in Western Balkan
Countries: Challenges and Options, Position Paper. Bel-
grade: Center for Social Policy, 2017. Available at: http://
csp.org.rs/en/news/the-welfare-state-in-western-balkan-
countries-–-challenges-and-options.html [last accessed:
1 March, 2018].
Mijatović, Boško. “Inequality in Serbia.” Serbia Income and Liv-
ing Conditions 2013. Belgrade: Statistical Office of the Re-
public of Serbia, 2015. pp. 1–12. Available at: http://webre-
zs.stat.gov.rs/WebSite/repository/documents/00/01/65/61/
Income_and_Living_Conditions_2013.pdf [last accessed:
1 March, 2018].
Milanovic, Branko. Global Inequality: A New Approach for
the Age of Globalization. Cambridge, MA: The Belknap
Press of Harvard University Press, 2016.
Milanovic, Branko. The Haves and the Have-Nots: A Brief and
Idiosyncratic History of Global Inequality. New York, NY:
Basic Books, 2011.
Milanovic, Branko. “Poverty in Eastern Europe in the Years of
Crisis, 1978 to 1987: Poland, Hungary, and Yugoslavia.”
The World Bank Economic Review 5, no. 2 (1991): 187–205.
Miluka, Juna. “Not Just Education: The Gender Wage Gap in
the Albanian Labor Markets Through Occupational Seg-
regation, Work Experience, and Child Care.” Poverty and
Exclusion in the Western Balkans, eds. Caterina Ruggeri
Laderchi and Sara Savastano. New York, NY: Springer,
2013. pp. 155–176.
Miluka, Juna. Gender Wage Gap in Albania: Sources and Rec-
ommendations. Tirana: UN Women and Albanian Minis-
try of Labour and Social Affairs, 2011.
Ministry of Education of the Republic of Kosovo. Statis-
tical Report with Education Indicators 2012/2013 and
2013/2014. Available at: http://masht.rks-gov.net/up.-
loads/2015/08/raport-statistikor-me-tregues-arsimore-
2012-13-dhe-2013-14_1.pdf [last accessed: 1 March, 2018].
Numanović, Amar. Weak Labour Markets, Weak Policy Re-
sponses: Active Labour Market Policies in Albania, Bosnia
and Herzegovina and Macedonia. Sarajevo: Analitika –
Center for Social Research, 2016. Available at: http://www.
analitika.ba/publications/weak-labour-markets-weak-poli-
cy-responses-active-labour-market-policies-albania-bosnia
[last accessed: 1 March, 2018].
Numanović, Amar. “Social Assistance System in BiH: The
Neglected Potential of Active Social Policies.” Sarajevo:
Analitika – Center for Social Research, 2016. Available at:
http://www.analitika.ba/publications/social-assistance-
system-bih-neglected-potential-active-social-policies [last
accessed: 1 March, 2018].

70
Unequal Chances and Unjust Outcomes
Obadić, Alka et al. “The effects of tax policy and labour mar-
ket institutions on income inequality.” Zbornik radova
Ekonomskog fakulteta Rijeka 32, no. 1 (2014): 121–140.
Okun, Arthur M. Equality and Efficiency: The Big Tradeoff.
Washington, D.C.: Brookings Institution Press, 1975.
Ostry, Jonathan D, Andrew Berg, and Charalambos G.
Tsangarides. “Redistribution, Inequality and Growth.”
IMF Staff Discussion Note. April 2014. Available at: htt -
ps://www.imf.org/external/pubs/ft/sdn/2014/sdn1402.
pdf [last accessed: 1 March, 2018].
Organization for Economic Cooperation and Develop-
ment (OECD). PISA 2015 Results (Volume 1): Excellence
and equity in education. Geneva: OECD, 2016. Available
at: http://www.oecd.org/education/pisa-2015-results-vol--
ume-i-9789264266490-en.htm [last accessed: 1 March,
2018].
OECD. In it Together: Why Less Inequality Benefits All. Paris: OECD,
2015. Available at: http://www.oecd.org/social/in-it-togeth/-
er-why-less-inequality-benefits-all-9789264235120-en.
htm [last accessed: 1 March, 2018].
OECD. PISA 2012 Results: What Students Know and Can Do:
Student Performance in Mathematics, Reading and Sci-
ence, Volume 1. Paris: OECD, 2014. Available at: https://
www.oecd.org/pisa/keyfindings/pisa-2012-results-vol-
ume-I.pdf [last accessed: 1 March, 2018].
OECD. Taxing Wages 2014. Geneva: OECD, 2015. Available at:
http://www.oecd-ilibrary.org/taxation/taxing-wages-2014_
tax_wages-2014-en [last accessed: 1 March, 2018].
OECD. Employment Outlook 2013. Paris: OECD, 2013.
OECD. “What are equivalence scales?” OECD Project on In-
come Distribution and Poverty, 2013. Available at: http://
www.oecd.org/eco/growth/OECD-Note-Equivalenc-
eScales.pdf [last accessed: 1 March, 2018].
OECD. Divided We Stand: Why Inequality Keeps Rising. Paris:
OECD, 2011.
OECD. “Job quality.” Available at: http://www.oecd.org/statis -
tics/job-quality.htm [last accessed: 1 March, 2018].
OECD. “OECD Indicators of Employment Protection.” Available
at: http://www.oecd.org/els/emp/oecdindicatorsofemo-
ploymentprotection.htm [last accessed: 1 March, 2018].
OECD Stat. “Taxing Wages – Comparative Tables.” Available at:
https://stats.oecd.org/Index.aspx?DataSetCode=AWCOMP
[last accessed: 1 March, 2018].
Paes de Barros, Ricardo, Francisco H. G. Ferreira, Jose R.
Molinas Vega, and Jaime Saavedra Chanduvi. Meas-
uring Inequality of Opportunities in Latin America and
the Caribbean, Washington, D.C.: World Bank, 2009.
Perugini, Cristiano and Fabrizio Pompei. “Income Distribu-
tion During and After Transition: A Conceptual Frame-
work.” Inequalities During and After Transition in Central
and Eastern Europe, eds. Cristiano Perugini and Fabrizio
Pompei. Basingstoke, UK: Palgrave Macmillan, 2015.
Piacentini, Mario. “Measuring Income Inequality and Poverty
at the Regional Level in OECD countries.” OECD Statistics
Working Papers 2014/03. Paris: OECD Publishing, 2014.
Available at: http://www.oecd-ilibrary.org/docserver/
download/5jxzf5khtg9t-en.pdf?expires=1520938997&id
=id&accname=guest&checksum=49C8A862991875726
108E6ADB6CDBBAD [last accessed: 1 March, 2018].
Piketty, Thomas. Capital in the Twenty-First Century. London:
The Belknap Press of Harvard University Press, 2014.
Plumer, Brad. “IMF: Austerity is much worse for the economy
than we thought.” The Washington Post. Oct. 12, 2012.
Available at: https://www.washingtonpost.com/news/
wonk/wp/2012/10/12/imf-austerity-is-much-worse-for-
the-economy-than-we-thought/?utm_term=.d9b5d-
83dcef0 [last accessed: 1 March, 2018].
Ranđelović, Saša et al. “Labor Supply and Inequality Effects
of In-Work Benefits: Empirical Evidence from Serbia.”
Working Paper. Prague: CERGE, 2012.
Ranđelović, Saša and Jelena Žarković-Rakić. “Distribution-
al and Poverty Effects of Income Tax Reform in Serbia.”
Working paper. World Bank International Conference on
Poverty and Social Inclusion in the Western Balkans, Brus-
sels, Dec. 14–15, 2010. Available at: http://siteresources.
worldbank.org/INTECAREGTOPPOVRED/Resources/Sasa-
RANDJELOVIC.pdf [last accessed: 1 March, 2018].
Redi, Armalda. “Albanian Government and Its Challenges in
Progressive Tax Implementing.” Journal of Educational
and Social Research 4, no. 2 (2014): 35–38.
Republic of Macedonia State Statistical Office. Survey of
Income and Living Conditions, 2012. Skopje: State Statis-
tical Office, 2015. Available at: http://www.stat.gov.mk/
Publikacii/2.4.15.01.pdf [last accessed: 1 March, 2018].
Rodrik, Dani. “Good and Bad Inequality.” Project Syndicate.
Dec. 11, 2014. Available at: https://www.project-syndia-
cate.org/commentary/equality-economic-growth-trade-
off-by-dani-rodrik-2014-12?barrier=accessreg [last acn-
cessed: 1 March, 2018].
Sanfey, Peter, Jakov Milatović and Ana Krešić. “How the
Western Balkans can catch up.” Working Paper no. 186.
London: EBRD, 2016. Available at: http://www.ebrd.com/
news/2016/how-the-western-balkans-can-catch-up.html
[last accessed: 1 March, 2018].
Skalamera-Alilović, Dunja and Ivan Rubinić. “The Tax Sys-
tem as a Generator of Economic Inequality in Croatia.”
16th International Scientific Conference on Economic and
Social Development – The Legal Challenges of Modern
World 2016, 1–2 Sept. 2016, Split. Available at: https://
bib.irb.hr/datoteka/857141.esd_Book_of_Proceedings_
Split_2016_Online-472-490.pdf [last accessed: 1 March,
2018].
Stambolieva, Marija. “Conclusion: The Post-Yugoslav Wel-
fare States – from Legacies to Actor Shaped Transforma-
tions.” Welfare States in Transition: 20 Years after the
Yugoslav Welfare Model, ed. Stambolieva, Marija and
Stefan Dehnert. Sofia: Friedrich-Ebert-Stiftung, 2011.
Stambolieva, Marija. Welfare State Transformation in the Con-
text of Socio-economic and Political Changes: A Compara-
tive Analysis of the post-Yugoslav States: Slovenia, Croatia,

71
References
Serbia and Macedonia. PhD Dissertation. University of Kas-
sel, 2014. Available at: https://kobra.bibliothek.uni-kas/-
sel.de/bitstream/urn:nbn:de:hebis:34-2015010747044/3/
DissertationMarijaStambolieva.pdf [last accessed: 1
March, 2018].
Statistical Office of the Republic of Serbia. “Serbia Income
and Living Conditions 2013.” Belgrade: Statistical Office
of the Republic of Serbia, 2015. Available at: http://webrzs.
stat.gov.rs/WebSite/repository/documents/00/01/65/61/
Income_and_Living_Conditions_2013.pdf [last accessed:
1 March, 2018].
Stiglitz, Joseph E. Rewriting the Rules of the American Econ-
omy: An Agenda for Growth and Shared Prosperity. New
York, NY: Roosevelt Institute, 2015.
Šabanović, Edin. “Basic consumption and income-based indi-
cators of economic inequalities in Bosnia and Herzegovi-
na: evidence from household budget surveys.” Working
Paper. United Nations Economic Commission for Europe
Conference of European Statisticians, Expert meeting on
measuring poverty and inequality, 25–27 Sept. 2017,
Budva. Available at: https://www.unece.org/fileadmin/
DAM/stats/documents/ece/ces/ge.15/2017/Expert-meet-
ing-Montenegro-2017/Bosnia_paper_formatted.pdf [last
accessed: 1 March, 2018]
United Nations Development Programme (UNDP). Region-
al Human Development Report 2016, Progress at Risk:
Inequalities and Human Development in Eastern Europe,
Turkey, and Central Asia. Istanbul: UNDP, 2016. Available
at: http://www.eurasia.undp.org/content/rbec/en/home/
library/human_development/regional-human-develop-
ment-report-2016--progress-at-risk.html [last accessed:
1 March, 2018].
UNDP. Kosovo Remittance Study 2010. Prishtina: UNDP, 2010.
UNDP, World Bank and European Commission. Regional
Roma survey, 2011. Available at: http://www.eurasia.
undp.org/content/rbec/en/home/ourwork/sustainable-
development/development-planning-and-inclusive-sus-
tainable-growth/roma-in-central-and-southeast-europe/
roma-data.html [last accessed: 1 March, 2018].
Urban, Ivica. “Income Redistribution in Croatia: The Role of
Individual Taxes and Social Transfers.” Financial Theory
and Practice 32, no. 3 (2008): 387–403.
Vladisavljević, Marko, Edlira Narazani and Vojin Golubović.
“Public-private wage differences in the Western Balkan
countries.” Foundation for the Advancement of Econom-
ics (FREN) and Institute of Economic Sciences, Belgrade, Al-
banian Centre for Socio-Economic Research (ACSER), Insti-
tute for Strategic Studies and Prognoses. Munich Personal
RePEc Archive (MPRA) Paper no. 80739. 30 June 2017.
Available at: https://mpra.ub.uni-muenchen.de/80739/1/
MPRA_paper_80739.pdf [last accessed: 1 March, 2018].
Vidovic, Hermine et al. Developing Efficient Activation Ap-
proaches and Identifying Elements for Regional Coopera-
tion in the Western Balkans. Vienna: The Vienna Institute
for International Economic Studies (wiiw), 2011.
World Bank. Data Bank: Worldwide Governance Indicators.
2018. Available at: http://databank.worldbank.org/data/
reports.aspx?source=worldwide-governance-indicators
[last accessed: 1 March, 2018].
World Bank. “Poverty Rates at National Poverty Lines.” World
Development Indicators. 2018. Available at: http://wdi.
worldbank.org/table/1.1 [last accessed: 1 March, 2018].
World Bank. “World Bank Country and Lending Groups.”
2018. Available at: https://datahelpdesk.worldbank.org/
knowledgebase/articles/906519-world-bank-country-
and-lending-groups [last accessed: 1 March, 2018]
World Bank. “Macedonia, FYR.” Country Poverty Brief. Oc-
tober 2017.
World Bank. Digital Dividends: World Development Report
2016. Washington, D.C.: World Bank Group, 2016.
Available at: http://www.worldbank.org/en/publication/
wdr2016 [last accessed: 1 March, 2018].
World Bank. Poverty and Shared Prosperity 2016: Taking on
Inequality. Washington, D.C.: World Bank Group, 2016.
Available at: http://www.worldbank.org/en/publication/
poverty-and-shared-prosperity [last accessed: 1 March,
2018].
World Bank. “An Update on Poverty and Inequality in Albania: 9
Stylized Facts.” May 2015. Available at: http://documents.
worldbank.org/curated/en/583911468187730890/
pdf/97639-WP-P132666-P145041-PUBLIC-Box393179B.
pdf [last accessed: 1 March, 2018].
World Bank. “FYR of Macedonia: Measuring Welfare using
the Survey of Income and Living Conditions (SILC).”
May 2015. Available at: http://documents.worldbank.
org/curated/en/450311467999987862/pdf/97645-WP-
P132666-P145041-PUBLIC-Box393179B.pdf [last ac1-
cessed: 1 March, 2018].
World Bank. Poverty and Inequality in BiH 2007–2011.
Washington, D.C.: World Bank Group, 2015. Avail-
able at: http://documents.worldbank.org/curated/
en/228531467999134102/Poverty-and-inequality-in-
Bosnia-and-Herzegovina-2007-2011 [last accessed: 1
March, 2018].
World Bank. “PISA: Coverage Gaps.” Available at: http://
www1.worldbank.org/poverty/visualizeinequality/PISA/
cov_gaps.html [last accessed: 1 March, 2018].
World Bank. Social Safety Nets in the Western Balkans: De-
sign, Implementation, and Performance. Report No.
54396. Washington, D.C.: World Bank, 2011. Avail-
able at: http://documents.worldbank.org/curated/
en/218461468167955198/Social-safety-nets-in-the-
Western-Balkans-design-implementation-and-perfor-
mance [last accessed: 1 March, 2018].
World Bank, Agency for Statistics of BiH, FBiH Institute
for Statistics and RS Institute for Statistics. Braving
the Storm: Poverty and Inequality in Bosnia and Herzego-
vina 2007–2011. Washington, D.C: World Bank, 2015.
Available at: https://openknowledge.worldbank.org/hanl-
dle/10986/22472 [last accessed: 1 March, 2018].

72
Unequal Chances and Unjust Outcomes
World Bank and Kosovo Agency of Statistics. Consumption
Poverty in the Republic of Kosovo 2012–2015. April 2017.
Available at: http://ask.rks-gov.net/media/3187/poverty-
report-2012-2015.pdf [last accessed: 1 March, 2018].
World Bank and the Vienna Institute for International
Economic Studies (wiiw). Western Balkans Labor Mar-
ket Trends 2018. Washington, D.C.: World Bank Group
and wiiw, 2018. http://documents.worldbank.org/curatl-
ed/en/565231521435487923/pdf/124354-WP-P158508-
PUBLIC-16-3-2018-10-13-39-WBLabormarkettrends.pdf
World Bank and wiiw. Western Balkans Labor Market Trends
2017. Washington, D.C.: World Bank and wiiw, 2017.
Available at: http://www.worldbank.org/en/region/eca/
publication/western-balkan-labor-market-report.
Databases and Links
ILO Stat: www.ilo.org/ilostat
UN Data: data.un.org
UNESCO Institute of Statistics: uis.unesco.org
World Bank Atlas of Social Protection Indicators of Resil-
ience and Equity Database (ASPIRE): http://datatopics.
worldbank.org/aspire/
World Bank Data Bank: http://databank.worldbank.org/
World Bank Povcal Database: http://iresearch.worldbank.org/
PovcalNet/
World Bank and wiiw “Jobs Gateway in South Eastern Eu-
rope” Database: https://www.seejobsgateway.net/charts
World Health Organization Global Health Expenditure
Database: http://apps.who.int/nha/database
World Inequality Database on Education: www.education-
inequalities.org


© 2018
Friedrich-Ebert-Stiftung
Publisher: Friedrich-Ebert-Stiftung Dialogue Southeast Europe
Kupreška 20, 71 000 Sarajevo, Bosnia and Herzegovina
www.fes-southeasteurope.org
Orders / Contact: [email protected]
Responsible: Felix Henkel, Director, Dialogue Southeast Europe
Project coordinator: Ana Manojlović-Stakić, Denis Piplaš
Author: Mirna Jusić
Econometric analysis: Nermin Oruč
Peer-review: Mihail Arandarenko
Design / Typesetting: pertext, Berlin
The views expressed in this publication are not necessarily those of the Friedrich-Ebert-Stiftung (FES), or of the organization for
which the authors work. The FES cannot guarantee the accuracy of all data stated in this publication. Commercial use of any me-
dia published by the Friedrich-Ebert-Stiftung is not permitted without the written consent of the FES. Any reference made to Ko-
sovo is without prejudice to positions on status, and is in line with UNSCR 1244/1999 and the ICJ Opinion on the Kosovo declaration
of independence. Any reference made to Macedonia is understood as reference to the Former Yugoslav Republic of Macedonia.
This publication has been produced in cooperation with:
Center for Social Research Analitika
Josipa Vancaša 23, 71000 Sarajevo, Bosnia and Herzegovina
www.analitika.ba
Contact: [email protected]
The Friedrich-Ebert-Stiftung in Southeast Europe
After more than two decades of engagement in southeastern Europe, the FES appreciates that the challenges and problems still facing this region can best be resolved through a shared regional framework. Our commitment to advancing our core interests in democratic consolidation, social and economic justice and peace through regional cooperation, has since 2015 been strengthened by establishing an infrastructure to coordinate the FES’ regional work out of Sarajevo, Bosnia and Herzegovina: the Regional Dia-logue Southeast Europe (Dialogue SOE).
Dialogue SOE provides analysis of shared challenges in the region and develops suitable regional programs and activities in close cooperation with the twelve FES country offices across Southeast Europe. Furthermore, we integrate our regional work into joint initiatives with our colleagues in Berlin and Brussels. We aim to inform and be informed by the efforts of both local and interna-tional organizations in order to further our work in southeastern Europe as effectively as possible.
Our regional initiatives are advanced through three broad working lines: • Social Democratic Politics and Values• Social and Economic Justice• Progressive Peace Policy
Our website provides information about individual projects within each of these working lines, past events, and future initiatives:
http://www.fes-southeasteurope.org

ISBN 978-9958-884-63-4