unemployment in the u.s.. the u.s. unemployment rate since 1960 sources : and, robert j. gordon,...
TRANSCRIPT

Unemployment in the U.S.
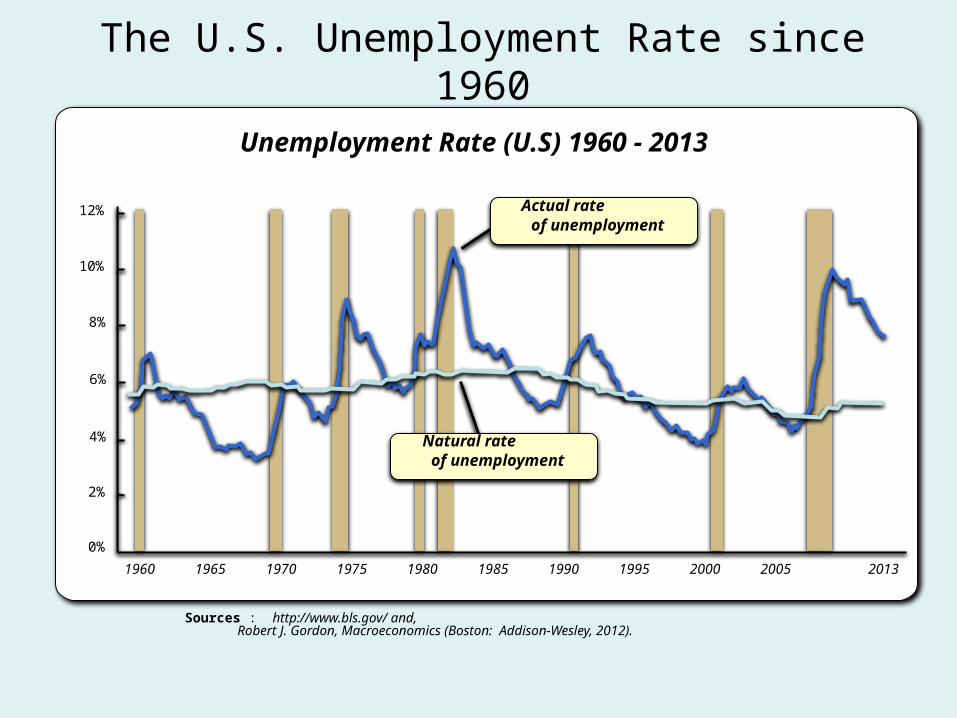
The U.S. Unemployment Rate since 1960
Sources : http://www.bls.gov/ and, Robert J. Gordon, Macroeconomics (Boston: Addison-Wesley, 2012).
Unemployment Rate (U.S) 1960 - 2013
1960 1965 1970 1975 1980 1985 1990 1995 2000 2005 2013
0%
2%
4%
6%
8%
10%
12%of unemployment
Actual rate
of unemploymentNatural rate

Learning Objective 21.3
FIGURE 21.10
How the Recession of 2001 Affected the Unemployment Rate
• The Effect of the Business Cycle on the Unemployment Rate
The Business Cycle• What Happens during a Business Cycle?
Costs of Unemployment
• Personal Cost
• Economic Cost

Why learn macroeconomics?1. The macroeconomy affects society’s well-
being. example: Unemployment and social problems
Each one-point increase in the u-rate is associated with: 920 more suicides 650 more homicides 4000 more people admitted to state mental institutions 3300 more people sent to state prisons 37,000 more deaths increases in domestic violence and homelessness
Each one-point increase in the u-rate is associated with: 920 more suicides 650 more homicides 4000 more people admitted to state mental institutions 3300 more people sent to state prisons 37,000 more deaths increases in domestic violence and homelessness
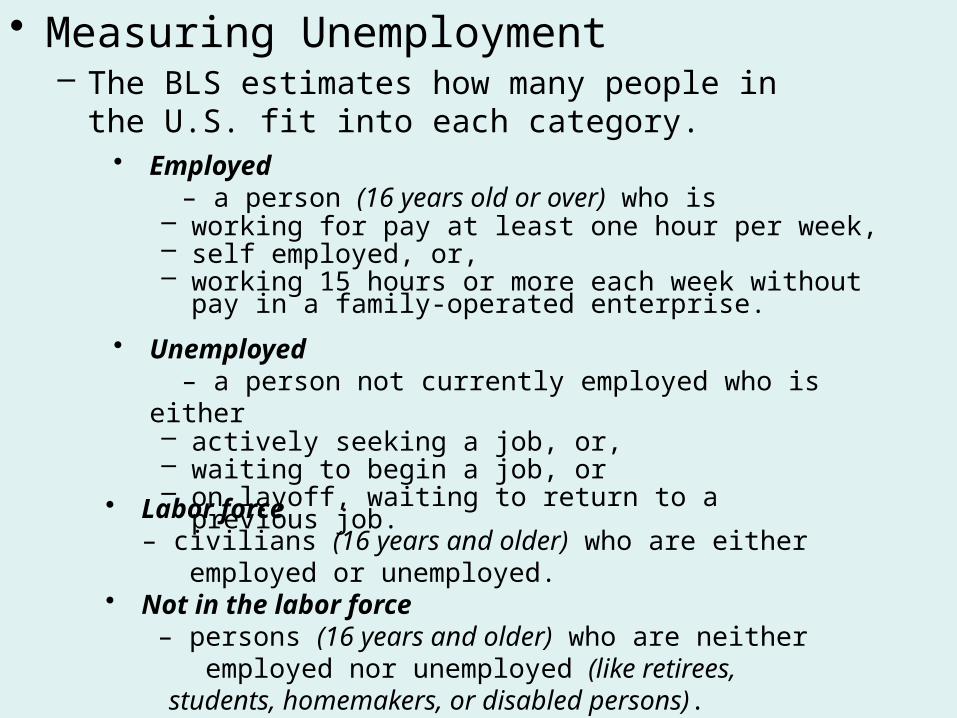
• Measuring Unemployment– The BLS estimates how many people in the U.S. fit
into each category.• Employed
– a person (16 years old or over) who is– working for pay at least one hour per week,– self employed, or,– working 15 hours or more each week without pay in a family-
operated enterprise.
• Unemployed – a person not currently employed who is either– actively seeking a job, or,– waiting to begin a job, or– on layoff, waiting to return to a previous job.
• Labor force – civilians (16 years and older) who are either employed or unemployed.
• Not in the labor force – persons (16 years and older) who are neither employed nor unemployed (like retirees, students, homemakers, or disabled persons).

U.S. Population, Employment, and Unemployment: April 2013
Civilian population 16 and over
Civilian labor force
Employed• Employees • Self-employed
workers
Unemployed• New entrants • Reentrants • Lost last job • Quit last job • Laid off
Not in the labor force
• Household workers • Students • Retirees • Disabled
Labor Force Participation Rate =
Civilian labor forceCivilian population (16+) = 63.3%
Employment / Population Ratio =
Number employedCivilian population (16+) = 58.6%
Rate ofUnemployment=
Number unemployedCivilian labor force = 7.5%
155.2 million
143.6 million
89.9 million
245.2 million
11.7 million
155.2245.2 =
143.6
245.2 =11.7
155.2 =

Labor Force Participation Rate of Men and Women, 1948-2012
•The labor force participation rate of women has been steadily increasing for several decades.
•During the same period the rate of men has been falling.
Labor Force Participation Rate of Men and Women
Source: www.bls.gov.
2012197519481960
83%
70 %
33 % 38 %
46 %
57.5 %
––––––– Men ––––––– –––––– Women ––––––1990 201219751948 1960 1990
78 %76 %
57.7 %
87 %
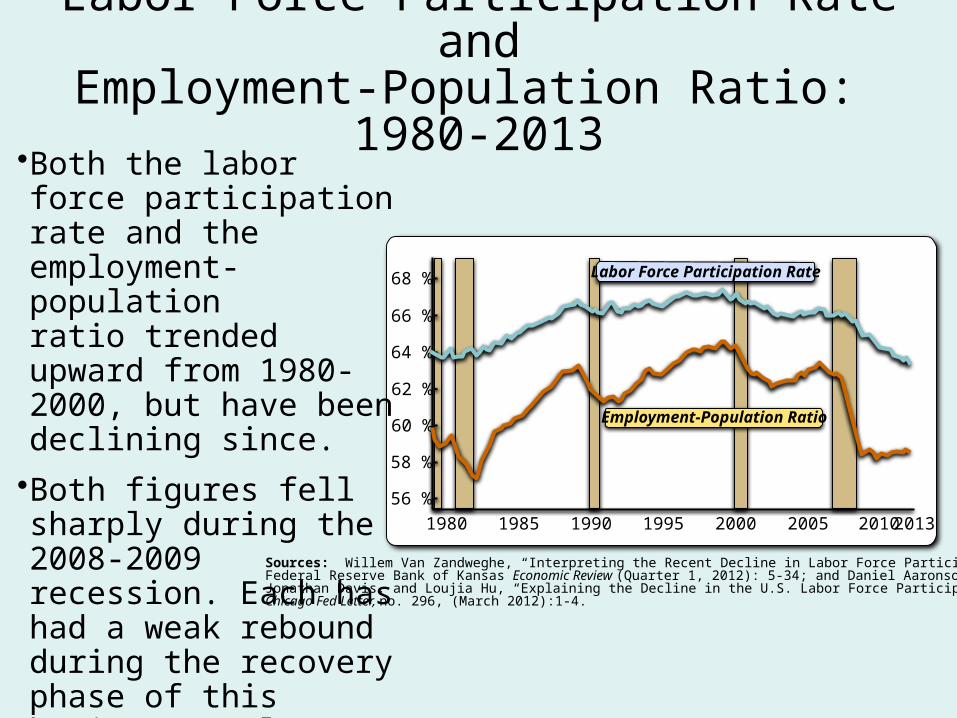
Labor Force Participation Rate andEmployment-Population Ratio: 1980-2013
•Both the labor force participation rate and the employment-population ratio trended upward from 1980-2000, but have been declining since.
•Both figures fell sharply during the 2008-2009 recession. Each has had a weak rebound during the recovery phase of this business cycle. In 2013, both were still below their 2007 levels.
Sources: Willem Van Zandweghe, “Interpreting the Recent Decline in Labor Force Participation,” Federal Reserve Bank of Kansas Economic Review (Quarter 1, 2012): 5-34; and Daniel Aaronson, Jonathan Davis, and Loujia Hu, “Explaining the Decline in the U.S. Labor Force Participation Rate,”Chicago Fed Letter, no. 296, (March 2012):1-4.
1980 1985 1990 1995 2000 2005 2013
56 %
58 %
60 %
62 %
64 %
66 %
68 %
2010
Employment-Population Ratio
Labor Force Participation Rate

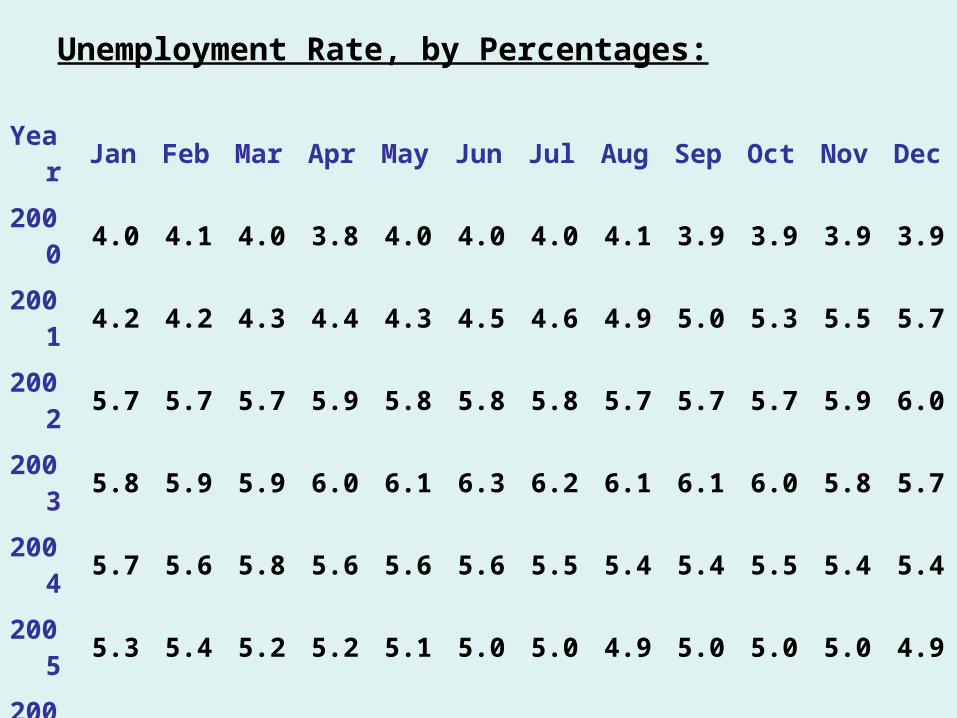
Year Jan Feb Mar Apr May Jun Jul Aug Sep Oct Nov Dec
2000 4.0 4.1 4.0 3.8 4.0 4.0 4.0 4.1 3.9 3.9 3.9 3.9
2001 4.2 4.2 4.3 4.4 4.3 4.5 4.6 4.9 5.0 5.3 5.5 5.7
2002 5.7 5.7 5.7 5.9 5.8 5.8 5.8 5.7 5.7 5.7 5.9 6.0
2003 5.8 5.9 5.9 6.0 6.1 6.3 6.2 6.1 6.1 6.0 5.8 5.7
2004 5.7 5.6 5.8 5.6 5.6 5.6 5.5 5.4 5.4 5.5 5.4 5.4
2005 5.3 5.4 5.2 5.2 5.1 5.0 5.0 4.9 5.0 5.0 5.0 4.9
2006 4.7 4.8 4.7 4.7 4.6 4.6 4.7 4.7 4.5 4.4 4.5 4.4
2007 4.6 4.5 4.4 4.5 4.4 4.6 4.6 4.6 4.7 4.7 4.7 5.0
2008 5.0 4.8 5.1 5.0 5.4 5.5 5.8 6.1 6.2 6.6 6.9 7.4
2009 7.7 8.2 8.6 8.9 9.4 9.5 9.4 9.7 9.8 10.1 10.0 10.0
2010 9.7 9.7 9.7 9.9 9.7 9.5 9.5 9.6 9.5 9.5 9.8 9.4
2011 9.1 9.0 8.9 9.0 9.0 9.1 9.1 9.1 9.0 8.9 8.7 8.5
Unemployment Rate, by Percentages:
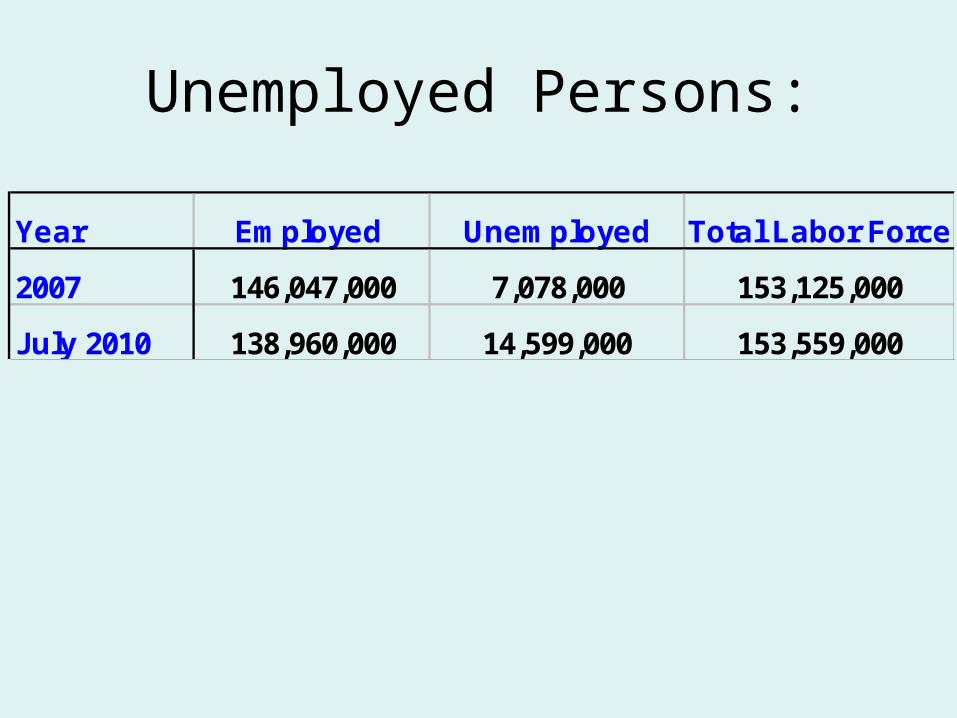
Unemployed Persons:
Year Employed Unemployed Total Labor Force
2007 146,047,000 7,078,000 153,125,000
July 2010 138,960,000 14,599,000 153,559,000

Composition of the Unemployed by Reason in 2013 (April)
•There are various reasons why persons were unemployed in April of 2013.
•Nearly one-half (44.8%) of the unemployed were dismissed from their previous jobs.
•More than a third (37.8%) of the unemployed were either new entrants or reentrants into the labor force.
Job leavers
7.4%10.9%
26.9%
10%
44.8%
New entrants
Reentrants
On Layoff
Dismissedfrom
Previous Job
Breakdown of Unemployed 2013 (April)

The Unemployment RateBy Age and Gender: April 2013
•In 2013, the unemployment rate for men was 7.7%, compared to only 7.3% for women.
•The observed differential between male and female workers was higher with younger workers.
•The unemployment rate itself was also much higher for those under the age of 25 than for those over the age of 25.
Source: www.bls.gov.
Both25+16-19 20-24–– Men aged ––
Allmen
Allwomen–– Women aged ––
25+ 16-1920-24
7.5%
26.2%
22.1%
14.0%
6.3%7.7% 7.3%
12.3%
5.9%
Civilian Rates of Unemployment (April 2013)

Unemployment Across Economies
•The unemployment rate in the United States, United Kingdom, and Japan has been persistently lower than the comparable rate of major continental European economies.
•The high unemployment countries have higher unemployment benefits, less flexible collective bargaining, and more regulated labor markets.
8.9 %
6.1 %
Germany
U.S.
Japan
Average Unemployment Rate(2001-2010)
France
Italy
U.K.
8.6 %
7.9 %
5.7 %
4.3 %

The Duration of Unemployment
– The impact of unemployment is influenced by how long individuals have been unemployed.• The unemployment spell• The duration of unemployment• Long-term unemployed• Chronically unemployed

• Unemployment Spell
• Duration
The Duration of Unemployment

Table 20-1
Duration of Unemployment
LENGTH OF TIME UNEMPLOYED
PERCENTAGE OF TOTAL UNEMPLOYED
Less than 5 weeks 35.6%
5 to 14 weeks 31.3
15 to 26 weeks 15.7
27 weeks or more 17.5
How Long Are People Usually Unemployed?

T a ble A-9 . P ercent D is tribtuio n o f D ura tio n o f Unemplo yment S pe lls
Se as onally adjus te dFe b. Oct. N ov. D e c. Jan. Fe b.2008 2008 2008 2008 2009 2009
Total une mploye d....................................... 100 100 100 100 100 100Le s s than 5 we e ks .................................... 35.6 30.3 31.4 29.2 31 26.95 to 14 we e ks ........................................ 32.3 29.7 30.3 30.4 29.8 31.415 we e ks and ove r.................................... 32.1 40 38.3 40.4 39.2 41.715 to 26 we e ks ..................................... 14.7 17.9 17 17.2 16.8 18.627 we e ks and ove r.................................. 17.3 22.1 21.3 23.2 22.4 23.1
Ave rage (me an) duration, in we e ks ...................... 16.6 19.8 18.9 19.7 19.8 19.8M e dian duration, in we e ks .............................. 8 .4 10.6 10 10.6 10.3 11
Unemployment Rate• Marginally attached workers would like to be
employed and have looked for a job in the recent past but are not currently looking for work.
• Discouraged workers are nonworking people who are capable of working but have given up looking for a job because of the state of the job market.
• Underemployment is the number of people who work part time because they cannot find full-time jobs.

Unemployment Rate

• Frictional Unemployment:
Types of Unemployment
• Cyclical Unemployment:
• Structural Unemployment:

• Full Employment: Level of employment resulting when the rate of unemployment is normal, considering both frictional and structural factors.– Full employment is closely related to the concept of
the natural rate of unemployment.• Natural Rate of Unemployment:
Level of unemployment that reflects “job shopping” in an economy of imperfect information and dynamic change.
The Concept of Full Employment

• The natural rate of unemployment is:– neither a temporary high nor temporary low.– a rate that is both achievable and sustainable. – the level of unemployment accompanying an
economy’s “maximum sustainable rate of output.”• Both demographic factors (e.g. young workers as a share
of the labor force) and public policy (e.g. the level of unemployment benefits) influence the natural rate of unemployment.
• Actual rate of unemployment generally rises above natural rate during a recession and falls below the natural rate during a boom.
The Concept of the Natural Rate of Employment

ECONOMICS IN ACTION

Unemployment, by Education Level
0
1
2
3
4
5
6
J-98
J-99
J-00
D-00
D-01
D-02
D-03
D-04
D-05
D-06
D-07
D-08
Date
Un
em
plo
ym
en
t R
ate