unemployment by constituency, july 2001
TRANSCRIPT

RESEARCH PAPER 01/6815 AUGUST 2001
Unemployment byConstituency, July 2001
This paper shows the number of unemployedclaimants recorded as resident in each constituency inthe United Kingdom in July 2001, together withcomparisons with the levels in July 2000 and July1997. This paper also presents residence-basedunemployment rates not published elsewhere for all659 constituencies in the United Kingdom.
Alex Adcock
STATISTICS RESOURCE UNIT
HOUSE OF COMMONS LIBRARY
Jane Hough
ECONOMIC POLICY AND STATISTICS SECTION

Library Research Papers are compiled for the benefit of Members of Parliament and theirpersonal staff. Authors are available to discuss the contents of these papers with Members andtheir staff but cannot advise members of the general public. Any comments on Researchpapers should be sent to the Research Publications Officer, Room 407, 1 Derby Gate, London,SW1A 2DG or e-mailed to [email protected].
ISSN 1368-8456
Recent Library Research Papers include:
01/53 Unemployment by Constituency, April 2001 16.05.01
01/54 General Election Results, 7 June 2001 12.06.01
01/55 Unemployment by Constituency, May 2001 13.06.01
01/56 Animal Experiments 20.06.01
01/57 The Irish Referendum on the Treaty of Nice 21.06.01
01/58 The Homelessness Bill [Bill 2 of 2001-02] 26.06.01
01/59 The Monetary Policy Committee: theory & performance 26.06.01
01/60 Economic Indicators 02.07.01
01/61 The European Communities (Amendment) Bill: Implementing the Treaty 28.06.01
of Nice [Bill 3 of 2001-02]
01/62 The European Communities (Finance) Bill [Bill 1 of 2001-02] 02.07.01
01/63 The Electoral Fraud (Northern Ireland) Bill [Bill 6 of 2001-02] 05.07.01
01/64 The Export Control Bill [Bill 5 of 2001-02] 05.07.01
01/65 Unemployment by Constituency, June 2001 18.07.01
01/66 The National Lottery 19.07.01
01/67 Farming after Foot and Mouth 20.07.01
Research Papers are available as PDF files:
• to members of the general public on the Parliamentary web site,URL: http://www.parliament.uk
• within Parliament to users of the Parliamentary Intranet,URL: http://hcl1.hclibrary.parliament.uk

Summary of main points
This research paper summarises data for UK parliamentary constituencies from the monthlycount of unemployed claimants. It includes residence-based unemployment rates, andchanges in the number of claimants compared with one and four years earlier. From February2000, these rates are based on the estimated economically active population in eachconstituency in 1997. Please see Research Paper 00/29, Unemployment by constituency:Revised rates, for details.
The unemployment rates given here differ from those published by National Statistics (NS),which express the number of unemployed claimants as a percentage of the number of jobsplus the number of unemployed people in the constituency. As the NS rates can be biased bylarge-scale net commuting, the Library believes that its residence-based unemployment ratesprovide a better measure of local deprivation.
Also shown in the paper are comparisons between the current level of unemployment in eachconstituency with that one year and four years earlier. Data for the current constituencies are notavailable before January 1996.
The political parties shown against each seat are as they stand currently. Erratum: in lastmonth’s edition Witney was shown as a Labour seat whereas it is a Conservative seat.

CONTENTS
I Introduction 7
II Residence-based unemployment rates, July 2001United Kingdom constituencies
A. Alphabetical listing 9
B. Highest and lowest 21
III Residence-based unemployment rate, July 2001ranked listing of constituencies by country
A. England 22
B. Wales 32
C. Scotland 33
D. Northern Ireland 35
IV Change in number of unemployed claimantsUnited Kingdom constituencies, July 1997-2001 andJuly 2000-2001
A. Alphabetical listing 36
B. Greatest changes 48
The source of all the data contained in this publication is National Statistics (NOMISdatabase) © Crown Copyright.
RESEARCH PAPER 01/68
7
I Introduction
The unemployment rates in this Research Paper use figures for the number of unemployed claimantsfrom the monthly count and estimates of the number of people who were economically active in 1997.1
The national and regional headline unemployment rates are now based on the International LabourOrganisation (ILO) definition of unemployment. Figures for constituencies are not, however, availableon this basis.
These residence-based rates should be regarded more as a social measure of relative deprivation than asan economic measure of the mismatch between the supply of and demand for labour, as they take noaccount of people’s ability to seek work outside the constituency in which they live. For a fullexposition of the methodology used to calculate these rates see Research Paper 96/63, NewUnemployment Rates for Parliamentary Constituencies.
Until June 1999, NS did not publish unemployment rates for parliamentary constituencies since most donot approximate to self-contained labour markets.2 Following local government reorganisation, NSdecided to publish unemployment rates for all unitary authorities, even though some of these do notmeet the normal self-containment criteria. From 16 June 1999, they have published officialunemployment rates for all constituencies.
The difference between the two sets of unemployment rates lies in the denominator used. The House ofCommons Library rates express the number of claimants resident in each constituency as a percentageof the estimated economically active population resident in each constituency in 1997. In contrast, theNS unemployment rates express the number of claimants resident in a constituency as a percentage ofthe 1999 workforce (the workforce is comprised of the number of jobs in the constituency, regardless ofwhether the jobholders are resident or not, plus the resident unemployed claimants).3
In May 1999, of the 659 constituencies in the United Kingdom, 148 (22%) had unemployment rateswhich varied by more than two percentage points on the two bases. For example, in the BirminghamLadywood constituency, the Library residence-based unemployment rate for May 1999 was 17.7% butthe official workforce rate was just 3.7%. The main factor that will affect the difference between thetwo denominators is the extent of commuting into and out of the constituency: this will determinewhether the workforce is significantly different in size from the resident economically active population.In addition, differences may arise due to differences in the definition of economic activity used (eg theNS workforce measure counts people with two jobs twice) and in the year to which the figures relate.
1 Details are given in Unemployment by constituency: Revised rates, Research Paper 00/29.2 Self contained labour markets are areas where the 70 per cent of the people who live in the area also work there, and
70 per cent of those who work in the area also live there.3 Under the definitions used for calculating the workforce, a person who has two part-time jobs counts twice.

RESEARCH PAPER 01/68
8
The following table explains how differences in the denominators used will affect the calculation of thetwo unemployment rates.
Factor affecting denominator Effect on unemployment rate
constituency has significant level of net inward commuting(i.e. more people commute into the constituency thancommute out)
NS unemployment rate will be lower than residence-basedunemployment rate
constituency has significant level of net outward commuting(i.e. more people commute out of the constituency thancommute in)
NS unemployment rate will be higher than residence-basedunemployment rate
The two sets of unemployment rates have different interpretations. If one is mainly interested inmeasures of relative local economic deprivation, then the Library’s residence-based measure is moreappropriate. If, however, one is more interested in the state of the local labour market then the NSmeasure is better.
Notes to tables:
1. The Boundary Commission reviews in 1995 defined 659 constituencies in the United Kingdom.These were defined in terms of electoral wards as they stood at the time of the review. For thepurposes of the unemployment statistics however, constituencies represent a best-fit of frozen1991 wards to the new constituencies.
Boundary alterations between 1991 and 1995 mean that there are inevitably approximations to1995 boundaries in many constituencies. In some cases, however, the changes to wardboundaries were substantial and some wards are now split between constituencies. Theseconstituencies are indicated with an asterisk (*) in the following tables.
Four wards with populations below the 1991 Census confidentiality threshold have had theirdata ‘exported’ to a ward which is in another constituency. In these cases, the data for the‘exported’ ward are included in the constituency to which the ward has been transferred.Constituencies losing data in this way are indicated by ‘>’, whereas those gaining data as aresult are indicated by ‘<’.4
2. The following abbreviations for parties have been used:
LAB Labour UU Ulster Unionist PartyCON Conservative DU Democratic Unionist PartyLD Liberal Democrat SDLP Social Democratic and Labour PartyPC Plaid Cymru SF Sinn FeinSNP Scottish National Party IND IndependentSPKR Speaker
4 Data are transferred from Bath to Wansdyke (one ward), Hereford to Leominster (one ward) and Clywd South toClwyd West (two wards).

RESEARCH PAPER 01/68
9
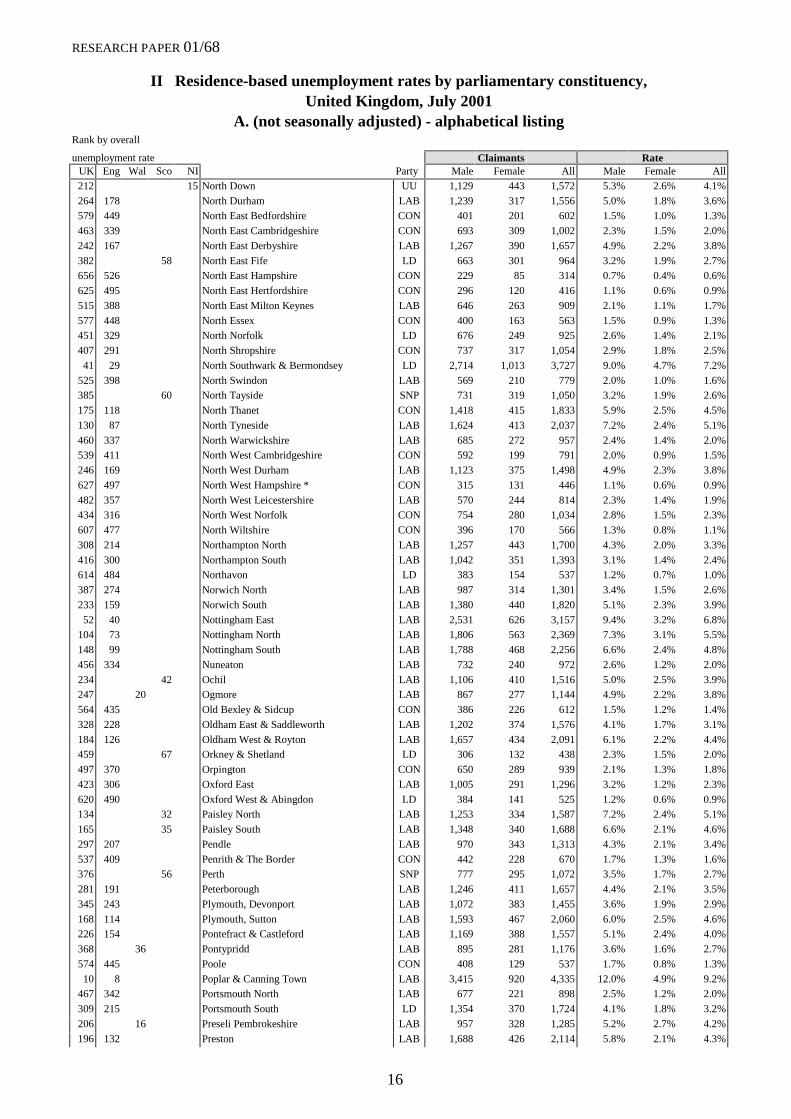
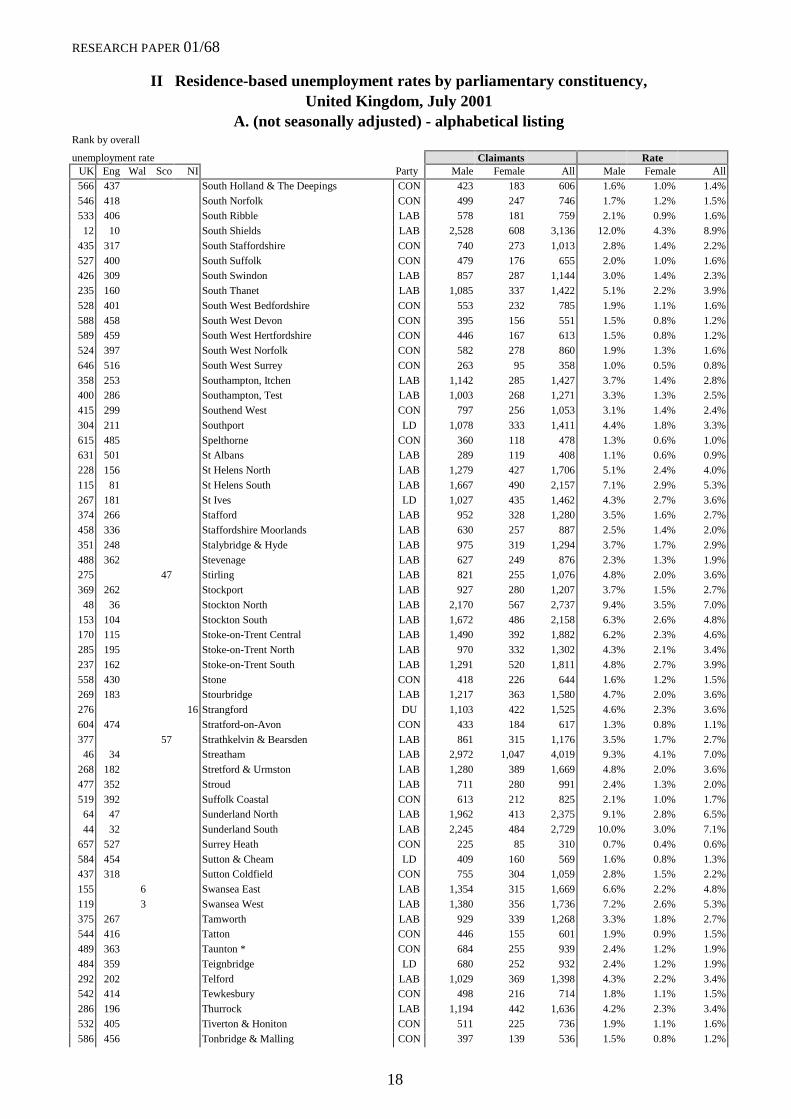
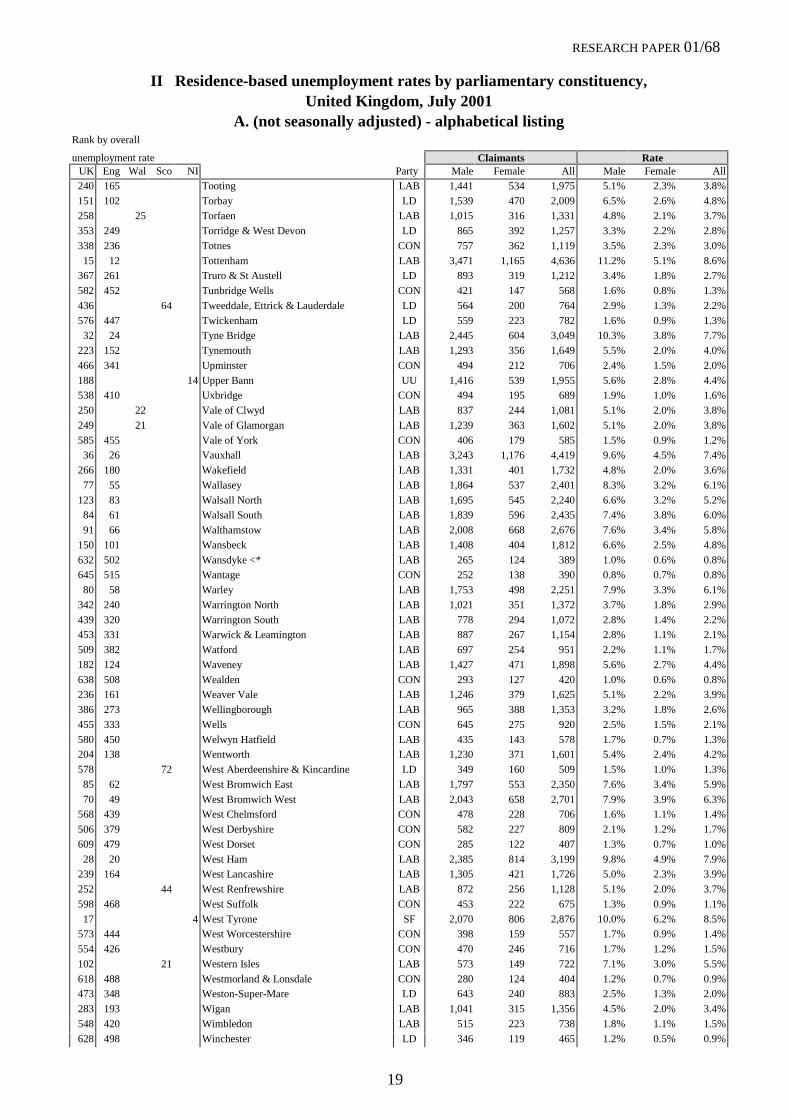
II Residence-based unemployment rates by parliamentary constituency,United Kingdom, July 2001
A. (not seasonally adjusted) - alphabetical listingRank by overall
unemployment rate Claimants RateUK Eng Wal Sco NI Party Male Female All Male Female All205 15 Aberavon LAB 864 255 1,119 5.4% 2.3% 4.2%352 53 Aberdeen Central LAB 880 242 1,122 3.9% 1.4% 2.9%
465 69 Aberdeen North LAB 466 168 634 2.6% 1.2% 2.0%
495 70 Aberdeen South LAB 593 216 809 2.3% 1.1% 1.8%89 16 Airdrie & Shotts LAB 1,454 482 1,936 7.5% 3.6% 5.9%
623 493 Aldershot CON 440 149 589 1.2% 0.6% 0.9%
359 254 Aldridge - Brownhills CON 800 331 1,131 3.4% 2.0% 2.8%
510 383 Altrincham & Sale West CON 592 188 780 2.2% 1.0% 1.7%347 34 Alyn & Deeside LAB 818 290 1,108 3.6% 1.8% 2.9%
379 269 Amber Valley LAB 923 330 1,253 3.3% 1.7% 2.7%
126 30 Angus SNP 1,237 531 1,768 6.2% 3.7% 5.2%
211 39 Argyll & Bute LD 1,004 277 1,281 5.5% 2.2% 4.1%639 509 Arundel & South Downs CON 242 87 329 1.0% 0.5% 0.8%
177 120 Ashfield LAB 1,416 574 1,990 5.4% 3.1% 4.5%
512 385 Ashford CON 606 230 836 2.1% 1.1% 1.7%
298 208 Ashton under Lyne LAB 1,272 373 1,645 4.5% 1.8% 3.3%602 472 Aylesbury CON 492 152 644 1.5% 0.6% 1.1%
101 20 Ayr LAB 1,341 428 1,769 7.3% 3.2% 5.6%
636 506 Banbury CON 345 156 501 1.0% 0.6% 0.8%
461 68 Banff & Buchan SNP 494 254 748 2.2% 1.7% 2.0%216 146 Barking * LAB 1,097 372 1,469 5.0% 2.6% 4.1%
172 116 Barnsley Central LAB 1,307 399 1,706 6.0% 2.5% 4.5%
174 117 Barnsley East & Mexborough LAB 1,285 427 1,712 5.6% 2.8% 4.5%
262 177 Barnsley West & Penistone LAB 1,040 383 1,423 4.6% 2.4% 3.6%272 186 Barrow & Furness LAB 1,201 320 1,521 4.8% 1.9% 3.6%
390 277 Basildon LAB 920 363 1,283 3.2% 1.8% 2.6%
634 504 Basingstoke * CON 352 134 486 1.1% 0.5% 0.8%
197 133 Bassetlaw LAB 1,288 485 1,773 5.2% 2.9% 4.2%502 375 Bath *> LD 562 238 800 2.2% 1.2% 1.8%
340 238 Batley & Spen LAB 943 326 1,269 3.7% 1.8% 2.9%
271 185 Battersea LAB 1,439 509 1,948 4.8% 2.1% 3.6%
621 491 Beaconsfield CON 306 135 441 1.1% 0.7% 0.9%378 268 Beckenham CON 1,041 349 1,390 3.5% 1.6% 2.7%
243 168 Bedford LAB 1,431 422 1,853 5.1% 2.1% 3.8%
186 13 Belfast East DU 1,312 389 1,701 6.3% 2.2% 4.4%
13 3 Belfast North DU 2,245 539 2,784 12.6% 3.9% 8.8%103 8 Belfast South UU 1,618 672 2,290 7.5% 3.4% 5.5%
2 1 Belfast West SF 3,482 707 4,189 17.4% 4.6% 11.9%
288 198 Berwick-upon-Tweed LD 845 288 1,133 4.3% 2.1% 3.4%
8 6 Bethnal Green & Bow LAB 3,655 1,033 4,688 12.4% 5.7% 9.9%330 230 Beverley & Holderness CON 1,046 404 1,450 3.8% 2.0% 3.1%
534 407 Bexhill & Battle CON 412 161 573 2.0% 1.0% 1.6%
475 350 Bexleyheath & Crayford LAB 563 253 816 2.3% 1.5% 2.0%
491 365 Billericay CON 674 260 934 2.2% 1.3% 1.9%22 16 Birkenhead LAB 2,342 656 2,998 11.0% 4.2% 8.1%
110 77 Birmingham, Edgbaston LAB 1,840 555 2,395 7.3% 2.9% 5.4%
79 57 Birmingham, Erdington LAB 2,124 583 2,707 8.2% 3.1% 6.1%
140 95 Birmingham, Hall Green LAB 1,398 459 1,857 6.5% 2.9% 5.0%23 17 Birmingham, Hodge Hill LAB 2,155 530 2,685 10.7% 4.0% 8.0%
1 1 Birmingham, Ladywood LAB 5,133 1,290 6,423 16.1% 7.1% 12.9%
99 71 Birmingham, Northfield LAB 1,472 412 1,884 7.8% 2.8% 5.6%
58 44 Birmingham, Perry Barr LAB 2,482 737 3,219 8.6% 3.9% 6.7%158 106 Birmingham, Selly Oak LAB 1,771 522 2,293 6.5% 2.5% 4.7%
4 2 Birmingham, Sparkbrook & Small Heath LAB 4,073 1,079 5,152 13.3% 6.9% 11.2%
129 86 Birmingham, Yardley LAB 1,352 410 1,762 6.8% 2.8% 5.1%
187 128 Bishop Auckland LAB 1,381 388 1,769 5.8% 2.3% 4.4%575 446 Blaby CON 447 209 656 1.6% 1.0% 1.3%

RESEARCH PAPER 01/68
10
II Residence-based unemployment rates by parliamentary constituency,United Kingdom, July 2001
A. (not seasonally adjusted) - alphabetical listingRank by overall
unemployment rate Claimants RateUK Eng Wal Sco NI Party Male Female All Male Female All139 94 Blackburn LAB 1,812 457 2,269 6.8% 2.5% 5.0%
293 203 Blackpool North & Fleetwood LAB 1,231 288 1,519 4.9% 1.5% 3.4%219 149 Blackpool South LAB 1,569 414 1,983 5.6% 2.0% 4.0%
75 2 Blaenau Gwent LAB 1,395 439 1,834 7.7% 3.7% 6.1%
315 219 Blaydon LAB 1,024 270 1,294 4.4% 1.5% 3.2%
176 119 Blyth Valley LAB 1,341 469 1,810 5.8% 2.7% 4.5%540 412 Bognor Regis & Littlehampton CON 463 164 627 2.0% 0.9% 1.5%
185 127 Bolsover LAB 1,234 464 1,698 5.4% 3.0% 4.4%
248 170 Bolton North East LAB 1,317 358 1,675 5.1% 1.9% 3.8%
159 107 Bolton South East LAB 1,546 447 1,993 6.2% 2.6% 4.7%474 349 Bolton West LAB 619 210 829 2.6% 1.2% 2.0%
16 13 Bootle LAB 2,339 517 2,856 12.1% 3.7% 8.6%
476 351 Boston & Skegness CON 583 207 790 2.5% 1.2% 2.0%
486 360 Bosworth CON 573 303 876 2.1% 1.6% 1.9%343 241 Bournemouth East CON 827 287 1,114 3.8% 1.7% 2.9%
392 279 Bournemouth West CON 790 199 989 3.6% 1.3% 2.6%
626 496 Bracknell CON 400 160 560 1.1% 0.6% 0.9%
68 48 Bradford North LAB 2,266 582 2,848 8.5% 3.2% 6.4%181 123 Bradford South LAB 1,652 473 2,125 6.1% 2.3% 4.4%
24 18 Bradford West LAB 2,863 710 3,573 10.0% 4.3% 8.0%
507 380 Braintree LAB 600 277 877 2.0% 1.4% 1.7%
321 32 Brecon & Radnorshire LD 657 317 974 3.6% 2.5% 3.1%87 63 Brent East LAB 1,935 622 2,557 7.8% 3.3% 5.9%
337 235 Brent North LAB 907 338 1,245 3.7% 2.0% 3.0%
95 68 Brent South LAB 1,992 659 2,651 7.4% 3.3% 5.7%
523 396 Brentford & Isleworth LAB 674 321 995 2.0% 1.2% 1.6%611 481 Brentwood & Ongar CON 330 110 440 1.3% 0.6% 1.0%
299 27 Bridgend LAB 859 305 1,164 4.2% 2.0% 3.3%
380 270 Bridgwater CON 849 303 1,152 3.3% 1.7% 2.7%
317 221 Brigg & Goole LAB 861 387 1,248 3.7% 2.4% 3.2%213 143 Brighton, Kemptown LAB 1,332 417 1,749 5.3% 2.3% 4.1%
162 110 Brighton, Pavilion LAB 1,546 620 2,166 5.8% 3.1% 4.6%
241 166 Bristol East LAB 1,458 457 1,915 5.0% 2.2% 3.8%
427 310 Bristol North West LAB 897 285 1,182 3.0% 1.3% 2.3%319 222 Bristol South LAB 1,244 375 1,619 4.1% 1.8% 3.2%
355 251 Bristol West LAB 1,289 471 1,760 3.6% 1.8% 2.8%
499 372 Bromley & Chislehurst CON 582 245 827 2.1% 1.2% 1.8%
457 335 Bromsgrove CON 738 233 971 2.7% 1.1% 2.0%504 377 Broxbourne CON 527 248 775 2.0% 1.3% 1.7%
448 327 Broxtowe LAB 744 296 1,040 2.6% 1.4% 2.1%
644 514 Buckingham CON 247 100 347 0.9% 0.5% 0.8%
354 250 Burnley LAB 952 259 1,211 3.9% 1.4% 2.8%356 252 Burton LAB 998 359 1,357 3.5% 1.8% 2.8%
446 325 Bury North LAB 758 255 1,013 2.7% 1.3% 2.1%
438 319 Bury South LAB 749 237 986 2.9% 1.3% 2.2%
543 415 Bury St Edmunds CON 510 232 742 1.8% 1.1% 1.5%173 10 Caernarfon PC 953 261 1,214 5.9% 2.4% 4.5%
190 12 Caerphilly LAB 1,235 380 1,615 5.7% 2.5% 4.4%
107 23 Caithness, Sutherland & Easter Ross LD 1,081 264 1,345 7.2% 2.7% 5.4%
384 272 Calder Valley LAB 972 341 1,313 3.5% 1.6% 2.6%7 5 Camberwell & Peckham LAB 2,750 940 3,690 13.5% 6.0% 10.2%
501 374 Cambridge LAB 755 223 978 2.4% 0.9% 1.8%
363 257 Cannock Chase LAB 905 404 1,309 3.2% 2.1% 2.8%
449 328 Canterbury CON 764 269 1,033 2.7% 1.3% 2.1%280 26 Cardiff Central LAB 1,129 335 1,464 4.7% 1.9% 3.5%
536 40 Cardiff North LAB 430 143 573 2.1% 0.9% 1.6%
164 8 Cardiff South & Penarth LAB 1,520 349 1,869 6.5% 2.1% 4.6%
192 13 Cardiff West LAB 1,356 292 1,648 6.2% 1.8% 4.3%

RESEARCH PAPER 01/68
11
II Residence-based unemployment rates by parliamentary constituency,United Kingdom, July 2001
A. (not seasonally adjusted) - alphabetical listingRank by overall
unemployment rate Claimants RateUK Eng Wal Sco NI Party Male Female All Male Female All273 187 Carlisle LAB 1,054 366 1,420 4.7% 2.1% 3.6%
311 30 Carmarthen East & Dinefwr PC 672 245 917 3.9% 2.1% 3.2%251 23 Carmarthen West & South Pembrokeshire LAB 905 263 1,168 4.9% 2.1% 3.8%
93 17 Carrick, Cumnock & Doon Valley LAB 1,685 571 2,256 7.4% 3.5% 5.7%
490 364 Carshalton & Wallington LD 646 242 888 2.4% 1.2% 1.9%
514 387 Castle Point CON 513 198 711 2.0% 1.2% 1.7%53 9 Central Fife LAB 1,795 618 2,413 8.9% 4.1% 6.8%
481 356 Central Suffolk & North Ipswich CON 628 218 846 2.4% 1.2% 1.9%
302 28 Ceredigion PC 740 294 1,034 4.0% 2.3% 3.3%
560 432 Charnwood CON 545 213 758 1.8% 0.9% 1.4%428 311 Chatham & Aylesford LAB 792 301 1,093 2.8% 1.6% 2.3%
581 451 Cheadle LD 417 152 569 1.7% 0.8% 1.3%
365 259 Cheltenham LD 990 276 1,266 3.7% 1.4% 2.8%
629 499 Chesham & Amersham CON 302 110 412 1.1% 0.6% 0.9%418 302 Chester, City of LAB 780 231 1,011 3.1% 1.3% 2.4%
135 90 Chesterfield LD 1,794 552 2,346 6.7% 2.9% 5.1%
583 453 Chichester CON 407 162 569 1.7% 0.8% 1.3%
419 303 Chingford & Woodford Green CON 697 290 987 2.9% 1.6% 2.4%421 305 Chipping Barnet CON 843 364 1,207 2.8% 1.7% 2.3%
452 330 Chorley LAB 785 259 1,044 2.7% 1.2% 2.1%
592 462 Christchurch CON 324 115 439 1.5% 0.8% 1.2%
344 242 Cities of London & Westminster CON 1,539 631 2,170 3.5% 2.0% 2.9%193 131 Cleethorpes LAB 1,295 504 1,799 5.2% 3.0% 4.3%
357 35 Clwyd South *> LAB 641 260 901 3.4% 2.0% 2.8%
303 29 Clwyd West <* LAB 753 226 979 4.4% 1.8% 3.3%
106 22 Clydebank & Milngavie LAB 1,311 380 1,691 7.4% 2.8% 5.5%201 38 Clydesdale LAB 1,147 491 1,638 5.0% 3.0% 4.2%
122 27 Coatbridge & Chryston LAB 1,260 369 1,629 7.0% 2.8% 5.2%
505 378 Colchester LD 668 265 933 2.1% 1.2% 1.7%
373 265 Colne Valley LAB 987 343 1,330 3.5% 1.6% 2.7%516 389 Congleton CON 543 202 745 2.1% 1.1% 1.7%
156 7 Conwy LAB 1,112 350 1,462 6.4% 2.6% 4.8%
133 89 Copeland LAB 1,351 392 1,743 6.6% 2.9% 5.1%
417 301 Corby LAB 830 303 1,133 3.0% 1.5% 2.4%622 492 Cotswold CON 287 124 411 1.1% 0.7% 0.9%
147 98 Coventry North East LAB 1,859 523 2,382 6.4% 2.6% 4.9%
314 218 Coventry North West LAB 1,218 378 1,596 4.2% 1.8% 3.2%
227 155 Coventry South LAB 1,388 401 1,789 5.3% 2.1% 4.0%590 460 Crawley LAB 501 129 630 1.7% 0.6% 1.2%
394 280 Crewe & Nantwich LAB 929 316 1,245 3.2% 1.6% 2.5%
270 184 Crosby LAB 959 288 1,247 4.9% 1.9% 3.6%
291 201 Croydon Central LAB 1,537 532 2,069 4.4% 2.0% 3.4%152 103 Croydon North LAB 2,189 805 2,994 6.2% 3.0% 4.8%
531 404 Croydon South CON 623 246 869 2.0% 1.1% 1.6%
259 45 Cumbernauld & Kilsyth LAB 928 325 1,253 4.8% 2.2% 3.7%
86 15 Cunninghame North LAB 1,467 520 1,987 7.4% 3.8% 5.9%19 2 Cunninghame South LAB 1,953 667 2,620 11.1% 5.1% 8.5%
200 14 Cynon Valley LAB 862 293 1,155 5.3% 2.6% 4.2%
231 157 Dagenham LAB 1,026 378 1,404 4.9% 2.6% 3.9%
154 105 Darlington LAB 1,614 436 2,050 6.5% 2.4% 4.8%520 393 Dartford LAB 587 236 823 2.0% 1.2% 1.7%
557 429 Daventry CON 532 310 842 1.6% 1.3% 1.5%
406 37 Delyn LAB 589 219 808 3.0% 1.6% 2.5%
391 278 Denton & Reddish LAB 928 269 1,197 3.6% 1.4% 2.6%284 194 Derby North LAB 1,352 414 1,766 4.5% 1.9% 3.4%
96 69 Derby South LAB 2,306 686 2,992 7.2% 3.3% 5.7%
601 471 Devizes CON 472 179 651 1.4% 0.7% 1.1%
306 213 Dewsbury LAB 1,021 318 1,339 4.3% 1.9% 3.3%

RESEARCH PAPER 01/68
12
II Residence-based unemployment rates by parliamentary constituency,United Kingdom, July 2001
A. (not seasonally adjusted) - alphabetical listingRank by overall
unemployment rate Claimants RateUK Eng Wal Sco NI Party Male Female All Male Female All300 209 Don Valley LAB 1,000 315 1,315 4.2% 2.0% 3.3%
109 76 Doncaster Central LAB 1,687 515 2,202 6.9% 3.1% 5.4%166 112 Doncaster North LAB 1,250 405 1,655 5.7% 2.8% 4.6%
320 223 Dover LAB 1,059 330 1,389 4.1% 1.8% 3.1%
138 93 Dudley North LAB 1,698 496 2,194 6.4% 2.9% 5.0%
203 137 Dudley South LAB 1,420 442 1,862 5.4% 2.4% 4.2%82 60 Dulwich & West Norwood LAB 2,120 882 3,002 7.7% 3.9% 6.0%
94 18 Dumbarton LAB 1,583 517 2,100 7.3% 3.4% 5.7%
195 37 Dumfries LAB 1,250 481 1,731 5.4% 2.7% 4.3%
27 4 Dundee East LAB 2,249 600 2,849 11.0% 3.8% 7.9%67 13 Dundee West LAB 1,819 523 2,342 9.0% 3.2% 6.4%
131 31 Dunfermline East LAB 1,444 414 1,858 6.8% 2.7% 5.1%
117 25 Dunfermline West LAB 1,169 371 1,540 7.0% 3.0% 5.3%
362 256 Durham, City of LAB 915 308 1,223 3.7% 1.6% 2.8%336 234 Ealing North * LAB 1,236 466 1,702 3.9% 1.8% 3.0%
265 179 Ealing Southall LAB 1,751 600 2,351 4.5% 2.4% 3.6%
128 85 Ealing, Acton & Shepherd’s Bush LAB 2,157 768 2,925 7.0% 3.0% 5.2%
137 92 Easington LAB 1,234 405 1,639 6.6% 2.9% 5.0%157 11 East Antrim UU 1,480 555 2,035 6.1% 3.0% 4.8%
571 442 East Devon CON 355 141 496 1.7% 0.9% 1.4%
47 35 East Ham LAB 2,426 741 3,167 8.6% 4.3% 7.0%
595 465 East Hampshire CON 447 143 590 1.5% 0.6% 1.1%307 49 East Kilbride LAB 1,099 354 1,453 4.4% 1.8% 3.3%
56 5 East Londonderry DU 1,760 702 2,462 8.2% 4.7% 6.8%
442 65 East Lothian LAB 598 172 770 2.9% 1.2% 2.2%
654 524 East Surrey CON 243 77 320 0.8% 0.3% 0.6%591 461 East Worthing & Shoreham CON 419 113 532 1.7% 0.6% 1.2%
238 163 East Yorkshire CON 1,177 431 1,608 4.8% 2.5% 3.9%
410 294 Eastbourne CON 838 242 1,080 3.4% 1.2% 2.4%
619 489 Eastleigh LD 335 131 466 1.2% 0.6% 0.9%422 62 Eastwood LAB 767 257 1,024 3.0% 1.4% 2.3%
341 239 Eccles LAB 1,015 285 1,300 4.0% 1.5% 2.9%
413 297 Eddisbury CON 693 271 964 2.9% 1.7% 2.4%
331 51 Edinburgh Central LAB 1,138 360 1,498 4.2% 1.6% 3.0%371 55 Edinburgh East & Musselburgh LAB 874 226 1,100 3.9% 1.3% 2.7%
229 41 Edinburgh North & Leith LAB 1,254 350 1,604 5.6% 1.9% 3.9%
383 59 Edinburgh Pentlands LAB 840 246 1,086 3.7% 1.4% 2.7%
393 61 Edinburgh South LAB 741 206 947 3.7% 1.2% 2.6%430 63 Edinburgh West LD 694 199 893 3.1% 1.2% 2.3%
112 78 Edmonton LAB 1,699 607 2,306 6.8% 3.4% 5.4%
398 284 Ellesmere Port & Neston LAB 822 217 1,039 3.4% 1.2% 2.5%
518 391 Elmet LAB 644 166 810 2.3% 0.8% 1.7%255 172 Eltham LAB 1,049 417 1,466 4.7% 2.5% 3.7%
257 174 Enfield North LAB 1,252 478 1,730 4.5% 2.5% 3.7%
295 205 Enfield, Southgate LAB 1,073 448 1,521 4.1% 2.4% 3.4%
496 369 Epping Forest CON 580 289 869 2.0% 1.4% 1.8%650 520 Epsom & Ewell CON 264 99 363 0.9% 0.5% 0.7%
348 245 Erewash LAB 1,058 417 1,475 3.5% 2.0% 2.9%
108 75 Erith & Thamesmead LAB 1,755 694 2,449 6.6% 3.7% 5.4%
651 521 Esher & Walton CON 282 97 379 0.9% 0.4% 0.7%395 281 Exeter LAB 1,085 346 1,431 3.4% 1.4% 2.5%
245 43 Falkirk East LAB 1,151 349 1,500 5.0% 2.1% 3.8%
124 28 Falkirk West LAB 1,222 396 1,618 6.9% 3.0% 5.2%
217 147 Falmouth & Camborne LAB 1,247 410 1,657 5.1% 2.5% 4.0%613 483 Fareham CON 333 128 461 1.2% 0.6% 1.0%
565 436 Faversham & Mid Kent CON 455 170 625 1.7% 0.9% 1.4%
447 326 Feltham & Heston LAB 809 297 1,106 2.6% 1.4% 2.1%
62 7 Fermanagh & South Tyrone SF 1,638 712 2,350 7.5% 5.1% 6.6%

RESEARCH PAPER 01/68
13
II Residence-based unemployment rates by parliamentary constituency,United Kingdom, July 2001
A. (not seasonally adjusted) - alphabetical listingRank by overall
unemployment rate Claimants RateUK Eng Wal Sco NI Party Male Female All Male Female All372 264 Finchley & Golders Green LAB 1,105 438 1,543 3.3% 1.8% 2.7%
316 220 Folkestone & Hythe CON 1,113 353 1,466 4.1% 1.9% 3.2%429 312 Forest of Dean LAB 632 281 913 2.6% 1.8% 2.3%
3 2 Foyle SDLP 3,590 1,117 4,707 15.0% 6.6% 11.5%
549 421 Fylde CON 496 166 662 1.9% 0.9% 1.5%
305 212 Gainsborough CON 869 358 1,227 3.9% 2.4% 3.3%143 33 Galloway & Upper Nithsdale CON 1,022 413 1,435 5.9% 3.5% 4.9%
253 171 Gateshead East & Washington West LAB 1,238 317 1,555 5.2% 1.8% 3.7%
405 290 Gedling LAB 819 300 1,119 3.2% 1.5% 2.5%
440 321 Gillingham LAB 783 288 1,071 2.7% 1.5% 2.2%40 8 Glasgow Anniesland LAB 1,442 302 1,744 10.7% 2.8% 7.2%
37 7 Glasgow Baillieston LAB 1,602 438 2,040 10.0% 3.6% 7.3%
125 29 Glasgow Cathcart LAB 1,130 299 1,429 7.2% 2.5% 5.2%
65 11 Glasgow Govan LAB 1,659 455 2,114 8.6% 3.4% 6.5%111 24 Glasgow Kelvin LAB 1,623 494 2,117 7.3% 2.9% 5.4%
34 5 Glasgow Maryhill LAB 1,901 533 2,434 10.3% 3.9% 7.6%
26 3 Glasgow Pollok LAB 1,569 328 1,897 11.6% 3.2% 7.9%
263 46 Glasgow Rutherglen LAB 983 260 1,243 5.1% 1.8% 3.6%61 10 Glasgow Shettleston LAB 1,730 426 2,156 8.9% 3.2% 6.6%
18 1 Glasgow Springburn SPKR 1,963 499 2,462 11.9% 4.0% 8.5%
261 176 Gloucester LAB 1,536 435 1,971 4.9% 1.9% 3.7%
561 71 Gordon LD 410 203 613 1.6% 1.2% 1.4%570 441 Gosport CON 462 165 627 1.8% 0.8% 1.4%
323 33 Gower LAB 776 269 1,045 4.0% 1.9% 3.1%
487 361 Grantham & Stamford CON 636 267 903 2.3% 1.3% 1.9%
327 227 Gravesham LAB 1,031 337 1,368 3.9% 1.9% 3.1%45 33 Great Grimsby LAB 2,163 662 2,825 9.1% 4.1% 7.1%
100 72 Great Yarmouth LAB 1,765 527 2,292 7.2% 3.2% 5.6%
98 19 Greenock & Inverclyde LAB 1,295 358 1,653 7.8% 2.8% 5.7%
51 39 Greenwich & Woolwich LAB 2,181 860 3,041 8.5% 4.6% 6.9%630 500 Guildford LD 339 104 443 1.1% 0.5% 0.9%
31 23 Hackney North & Stoke Newington LAB 2,575 920 3,495 9.8% 4.9% 7.7%
11 9 Hackney South & Shoreditch LAB 3,050 1,080 4,130 11.5% 5.4% 8.9%
208 140 Halesowen & Rowley Regis LAB 1,340 413 1,753 5.4% 2.4% 4.1%160 108 Halifax LAB 1,778 450 2,228 6.6% 2.2% 4.7%
462 338 Haltemprice & Howden CON 590 234 824 2.5% 1.4% 2.0%
167 113 Halton LAB 1,373 402 1,775 6.0% 2.5% 4.6%
118 26 Hamilton North & Bellshill LAB 1,464 463 1,927 6.9% 3.1% 5.3%146 34 Hamilton South LAB 1,111 331 1,442 6.5% 2.6% 4.9%
256 173 Hammersmith & Fulham LAB 1,771 712 2,483 4.9% 2.3% 3.7%
222 151 Hampstead & Highgate LAB 1,487 632 2,119 5.1% 2.7% 4.0%
478 353 Harborough CON 667 263 930 2.5% 1.3% 2.0%414 298 Harlow LAB 764 293 1,057 3.0% 1.6% 2.4%
563 434 Harrogate & Knaresborough LD 467 149 616 1.9% 0.7% 1.4%
408 292 Harrow East LAB 961 425 1,386 2.9% 1.8% 2.4%
483 358 Harrow West LAB 703 278 981 2.4% 1.3% 1.9%54 41 Hartlepool LAB 2,209 595 2,804 9.1% 3.5% 6.8%
274 188 Harwich LAB 1,056 318 1,374 4.6% 2.0% 3.6%
210 142 Hastings & Rye LAB 1,433 368 1,801 5.8% 2.0% 4.1%
396 282 Havant CON 775 280 1,055 3.2% 1.6% 2.5%401 287 Hayes & Harlington LAB 790 312 1,102 3.0% 1.7% 2.5%
517 390 Hazel Grove LD 538 172 710 2.2% 0.9% 1.7%
530 403 Hemel Hempstead LAB 564 222 786 2.0% 1.1% 1.6%
282 192 Hemsworth LAB 1,072 332 1,404 4.4% 2.0% 3.4%310 216 Hendon LAB 1,371 459 1,830 4.1% 1.9% 3.2%
648 518 Henley CON 243 102 345 0.9% 0.5% 0.8%
411 295 Hereford *> LD 768 303 1,071 3.0% 1.6% 2.4%
649 519 Hertford & Stortford CON 279 110 389 0.9% 0.5% 0.7%

RESEARCH PAPER 01/68
14
II Residence-based unemployment rates by parliamentary constituency,United Kingdom, July 2001
A. (not seasonally adjusted) - alphabetical listingRank by overall
unemployment rate Claimants RateUK Eng Wal Sco NI Party Male Female All Male Female All551 423 Hertsmere CON 506 191 697 1.8% 1.0% 1.5%
441 322 Hexham CON 571 216 787 2.8% 1.4% 2.2%289 199 Heywood & Middleton LAB 1,258 392 1,650 4.6% 1.9% 3.4%
454 332 High Peak LAB 718 304 1,022 2.5% 1.5% 2.1%
616 486 Hitchin & Harpenden CON 329 111 440 1.2% 0.6% 1.0%
50 38 Holborn & St Pancras LAB 2,412 901 3,313 8.9% 4.3% 6.9%479 354 Hornchurch LAB 564 225 789 2.3% 1.3% 1.9%
199 135 Hornsey & Wood Green LAB 1,815 767 2,582 5.2% 2.9% 4.2%
633 503 Horsham CON 339 119 458 1.1% 0.5% 0.8%
132 88 Houghton & Washington East LAB 1,530 474 2,004 6.8% 2.9% 5.1%312 217 Hove LAB 1,172 420 1,592 4.1% 2.0% 3.2%
105 74 Huddersfield LAB 1,728 544 2,272 7.1% 3.1% 5.5%
594 464 Huntingdon CON 485 202 687 1.4% 0.8% 1.2%
412 296 Hyndburn LAB 779 263 1,042 3.2% 1.4% 2.4%409 293 Ilford North LAB 793 310 1,103 3.1% 1.6% 2.4%
161 109 Ilford South * LAB 1,641 601 2,242 5.6% 3.2% 4.7%
360 54 Inverness East, Nairn & Lochaber LAB 927 285 1,212 3.7% 1.5% 2.8%
198 134 Ipswich LAB 1,428 368 1,796 5.7% 2.1% 4.2%277 189 Isle of Wight CON 1,534 436 1,970 4.7% 1.9% 3.6%
33 25 Islington North LAB 2,600 1,044 3,644 9.9% 4.9% 7.7%
71 50 Islington South & Finsbury LAB 1,951 835 2,786 7.7% 4.4% 6.3%
254 24 Islwyn LAB 767 296 1,063 4.6% 2.5% 3.7%88 64 Jarrow LAB 1,784 417 2,201 8.1% 2.7% 5.9%
287 197 Keighley LAB 1,176 367 1,543 4.5% 1.9% 3.4%
470 345 Kensington & Chelsea CON 920 464 1,384 2.3% 1.6% 2.0%
500 373 Kettering LAB 654 266 920 2.2% 1.2% 1.8%83 14 Kilmarnock & Loudoun LAB 1,725 628 2,353 7.6% 3.8% 6.0%
545 417 Kingston & Surbiton LD 632 245 877 1.9% 1.0% 1.5%
59 45 Kingston upon Hull East LAB 2,225 623 2,848 8.6% 3.7% 6.7%
57 43 Kingston upon Hull North LAB 2,373 697 3,070 8.7% 3.9% 6.8%39 28 Kingston upon Hull West & Hessle LAB 2,350 703 3,053 9.3% 4.2% 7.2%
555 427 Kingswood LAB 583 201 784 1.9% 0.9% 1.5%
35 6 Kirkcaldy LAB 1,829 532 2,361 10.2% 4.0% 7.6%
92 67 Knowsley North & Sefton East LAB 1,955 557 2,512 7.7% 3.0% 5.7%43 31 Knowsley South LAB 2,386 721 3,107 9.2% 4.0% 7.1%
404 18 Lagan Valley UU 807 375 1,182 2.9% 1.8% 2.5%
443 323 Lancaster & Wyre LAB 759 267 1,026 2.9% 1.3% 2.2%
29 21 Leeds Central LAB 2,882 708 3,590 10.5% 3.8% 7.8%78 56 Leeds East LAB 1,856 478 2,334 8.2% 3.1% 6.1%
260 175 Leeds North East LAB 1,212 368 1,580 4.9% 2.0% 3.7%
420 304 Leeds North West LAB 793 278 1,071 3.1% 1.4% 2.3%
183 125 Leeds West LAB 1,556 443 1,999 5.9% 2.3% 4.4%136 91 Leicester East LAB 1,598 642 2,240 6.2% 3.4% 5.1%
76 54 Leicester South LAB 2,311 741 3,052 7.8% 3.6% 6.1%
74 53 Leicester West LAB 2,041 728 2,769 7.9% 3.8% 6.2%
333 231 Leigh LAB 1,056 327 1,383 3.9% 1.7% 3.0%521 394 Leominster <* LAB 470 198 668 2.0% 1.2% 1.7%
498 371 Lewes LD 447 178 625 2.2% 1.2% 1.8%
127 84 Lewisham East LAB 1,413 545 1,958 6.7% 3.3% 5.2%
73 52 Lewisham West LAB 1,924 639 2,563 8.3% 3.5% 6.2%30 22 Lewisham, Deptford LAB 2,477 840 3,317 10.4% 4.4% 7.7%
149 100 Leyton & Wanstead LAB 1,586 524 2,110 6.3% 2.8% 4.8%
494 368 Lichfield CON 537 238 775 2.1% 1.4% 1.8%
207 139 Lincoln LAB 1,358 408 1,766 5.4% 2.3% 4.1%225 40 Linlithgow LAB 1,094 327 1,421 5.4% 2.1% 4.0%
90 65 Liverpool, Garston LAB 1,756 526 2,282 7.8% 3.2% 5.9%
6 4 Liverpool, Riverside LAB 3,486 953 4,439 13.8% 5.4% 10.3%
14 11 Liverpool, Walton LAB 2,783 694 3,477 11.9% 4.2% 8.7%

RESEARCH PAPER 01/68
15
II Residence-based unemployment rates by parliamentary constituency,United Kingdom, July 2001
A. (not seasonally adjusted) - alphabetical listingRank by overall
unemployment rate Claimants RateUK Eng Wal Sco NI Party Male Female All Male Female All49 37 Liverpool, Wavertree LAB 2,400 680 3,080 9.5% 3.5% 6.9%
20 14 Liverpool, West Derby LAB 2,688 686 3,374 11.3% 4.2% 8.4%278 48 Livingston LAB 1,176 418 1,594 4.6% 2.1% 3.5%
171 9 Llanelli LAB 1,043 332 1,375 5.8% 2.7% 4.5%
346 244 Loughborough LAB 982 375 1,357 3.6% 1.9% 2.9%
399 285 Louth & Horncastle CON 692 276 968 3.0% 1.7% 2.5%511 384 Ludlow LD 465 187 652 2.0% 1.2% 1.7%
370 263 Luton North LAB 921 331 1,252 3.4% 1.7% 2.7%
221 150 Luton South LAB 1,455 486 1,941 4.9% 2.6% 4.0%
569 440 Macclesfield CON 507 142 649 1.9% 0.7% 1.4%608 478 Maidenhead CON 384 139 523 1.3% 0.7% 1.1%
572 443 Maidstone & The Weald CON 509 176 685 1.8% 0.8% 1.4%
361 255 Makerfield LAB 942 279 1,221 3.7% 1.5% 2.8%
556 428 Maldon & East Chelmsford CON 441 192 633 1.7% 1.1% 1.5%63 46 Manchester, Blackley LAB 1,955 484 2,439 8.8% 3.2% 6.5%
5 3 Manchester, Central LAB 3,399 788 4,187 13.8% 5.0% 10.4%
25 19 Manchester, Gorton LAB 2,345 637 2,982 10.4% 4.3% 7.9%
179 122 Manchester, Withington LAB 1,406 456 1,862 5.9% 2.5% 4.5%202 136 Mansfield LAB 1,289 428 1,717 5.3% 2.5% 4.2%
326 226 Medway LAB 962 363 1,325 3.7% 2.1% 3.1%
244 19 Meirionnydd Nant Conwy PC 527 209 736 4.6% 2.7% 3.8%
322 224 Meriden CON 1,240 377 1,617 4.2% 1.7% 3.1%120 4 Merthyr Tydfil & Rhymney LAB 1,173 352 1,525 6.8% 3.0% 5.3%
597 467 Mid Bedfordshire CON 374 165 539 1.3% 0.8% 1.1%
617 487 Mid Dorset & North Poole LD 302 124 426 1.2% 0.7% 1.0%
541 413 Mid Norfolk CON 514 221 735 1.8% 1.1% 1.5%642 512 Mid Sussex CON 279 103 382 1.0% 0.5% 0.8%
169 12 Mid Ulster SF 928 583 1,511 4.6% 4.5% 4.6%
553 425 Mid Worcestershire CON 479 187 666 1.8% 1.0% 1.5%
9 7 Middlesbrough LAB 3,223 773 3,996 12.5% 4.4% 9.2%113 79 Middlesbrough South & East Cleveland LAB 1,811 501 2,312 7.1% 2.9% 5.4%
445 66 Midlothian LAB 544 144 688 3.0% 1.0% 2.2%
471 346 Milton Keynes South West LAB 782 304 1,086 2.5% 1.3% 2.0%
294 204 Mitcham & Morden LAB 1,196 459 1,655 4.2% 2.2% 3.4%659 529 Mole Valley CON 166 63 229 0.6% 0.3% 0.5%
450 38 Monmouth LAB 590 186 776 2.8% 1.2% 2.1%
485 39 Montgomeryshire LD 377 138 515 2.3% 1.3% 1.9%
325 50 Moray SNP 822 353 1,175 3.5% 2.4% 3.1%215 145 Morecambe & Lunesdale LAB 1,303 401 1,704 5.3% 2.3% 4.1%
425 308 Morley & Rothwell LAB 837 300 1,137 2.9% 1.4% 2.3%
66 12 Motherwell & Wishaw LAB 1,342 458 1,800 8.2% 3.9% 6.4%
180 11 Neath LAB 1,000 370 1,370 5.5% 2.9% 4.5%606 476 New Forest East CON 344 135 479 1.3% 0.7% 1.1%
605 475 New Forest West CON 291 109 400 1.4% 0.7% 1.1%
339 237 Newark CON 899 383 1,282 3.5% 2.2% 2.9%
637 507 Newbury LD 306 128 434 1.0% 0.6% 0.8%144 97 Newcastle upon Tyne Central LAB 1,712 456 2,168 6.7% 2.4% 4.9%
81 59 Newcastle upon Tyne East & Wallsend LAB 1,925 484 2,409 8.5% 2.8% 6.1%
290 200 Newcastle upon Tyne North LAB 1,159 277 1,436 4.8% 1.5% 3.4%
397 283 Newcastle-under-Lyme LAB 785 262 1,047 3.3% 1.5% 2.5%230 18 Newport East LAB 1,061 326 1,387 5.1% 2.3% 3.9%
141 5 Newport West LAB 1,376 402 1,778 6.6% 2.7% 5.0%
60 6 Newry & Armagh SDLP 1,966 767 2,733 7.9% 4.7% 6.6%
433 315 Normanton LAB 683 256 939 2.8% 1.4% 2.3%145 10 North Antrim DU 1,467 667 2,134 5.7% 3.7% 4.9%
350 247 North Cornwall LD 993 409 1,402 3.4% 2.1% 2.9%
349 246 North Devon LD 908 346 1,254 3.5% 1.9% 2.9%
624 494 North Dorset CON 267 129 396 1.0% 0.7% 0.9%
RESEARCH PAPER 01/68
16
II Residence-based unemployment rates by parliamentary constituency,United Kingdom, July 2001
A. (not seasonally adjusted) - alphabetical listingRank by overall
unemployment rate Claimants RateUK Eng Wal Sco NI Party Male Female All Male Female All212 15 North Down UU 1,129 443 1,572 5.3% 2.6% 4.1%
264 178 North Durham LAB 1,239 317 1,556 5.0% 1.8% 3.6%579 449 North East Bedfordshire CON 401 201 602 1.5% 1.0% 1.3%
463 339 North East Cambridgeshire CON 693 309 1,002 2.3% 1.5% 2.0%
242 167 North East Derbyshire LAB 1,267 390 1,657 4.9% 2.2% 3.8%
382 58 North East Fife LD 663 301 964 3.2% 1.9% 2.7%656 526 North East Hampshire CON 229 85 314 0.7% 0.4% 0.6%
625 495 North East Hertfordshire CON 296 120 416 1.1% 0.6% 0.9%
515 388 North East Milton Keynes LAB 646 263 909 2.1% 1.1% 1.7%
577 448 North Essex CON 400 163 563 1.5% 0.9% 1.3%451 329 North Norfolk LD 676 249 925 2.6% 1.4% 2.1%
407 291 North Shropshire CON 737 317 1,054 2.9% 1.8% 2.5%
41 29 North Southwark & Bermondsey LD 2,714 1,013 3,727 9.0% 4.7% 7.2%
525 398 North Swindon LAB 569 210 779 2.0% 1.0% 1.6%385 60 North Tayside SNP 731 319 1,050 3.2% 1.9% 2.6%
175 118 North Thanet CON 1,418 415 1,833 5.9% 2.5% 4.5%
130 87 North Tyneside LAB 1,624 413 2,037 7.2% 2.4% 5.1%
460 337 North Warwickshire LAB 685 272 957 2.4% 1.4% 2.0%539 411 North West Cambridgeshire CON 592 199 791 2.0% 0.9% 1.5%
246 169 North West Durham LAB 1,123 375 1,498 4.9% 2.3% 3.8%
627 497 North West Hampshire * CON 315 131 446 1.1% 0.6% 0.9%
482 357 North West Leicestershire LAB 570 244 814 2.3% 1.4% 1.9%434 316 North West Norfolk CON 754 280 1,034 2.8% 1.5% 2.3%
607 477 North Wiltshire CON 396 170 566 1.3% 0.8% 1.1%
308 214 Northampton North LAB 1,257 443 1,700 4.3% 2.0% 3.3%
416 300 Northampton South LAB 1,042 351 1,393 3.1% 1.4% 2.4%614 484 Northavon LD 383 154 537 1.2% 0.7% 1.0%
387 274 Norwich North LAB 987 314 1,301 3.4% 1.5% 2.6%
233 159 Norwich South LAB 1,380 440 1,820 5.1% 2.3% 3.9%
52 40 Nottingham East LAB 2,531 626 3,157 9.4% 3.2% 6.8%104 73 Nottingham North LAB 1,806 563 2,369 7.3% 3.1% 5.5%
148 99 Nottingham South LAB 1,788 468 2,256 6.6% 2.4% 4.8%
456 334 Nuneaton LAB 732 240 972 2.6% 1.2% 2.0%
234 42 Ochil LAB 1,106 410 1,516 5.0% 2.5% 3.9%247 20 Ogmore LAB 867 277 1,144 4.9% 2.2% 3.8%
564 435 Old Bexley & Sidcup CON 386 226 612 1.5% 1.2% 1.4%
328 228 Oldham East & Saddleworth LAB 1,202 374 1,576 4.1% 1.7% 3.1%
184 126 Oldham West & Royton LAB 1,657 434 2,091 6.1% 2.2% 4.4%459 67 Orkney & Shetland LD 306 132 438 2.3% 1.5% 2.0%
497 370 Orpington CON 650 289 939 2.1% 1.3% 1.8%
423 306 Oxford East LAB 1,005 291 1,296 3.2% 1.2% 2.3%
620 490 Oxford West & Abingdon LD 384 141 525 1.2% 0.6% 0.9%134 32 Paisley North LAB 1,253 334 1,587 7.2% 2.4% 5.1%
165 35 Paisley South LAB 1,348 340 1,688 6.6% 2.1% 4.6%
297 207 Pendle LAB 970 343 1,313 4.3% 2.1% 3.4%
537 409 Penrith & The Border CON 442 228 670 1.7% 1.3% 1.6%376 56 Perth SNP 777 295 1,072 3.5% 1.7% 2.7%
281 191 Peterborough LAB 1,246 411 1,657 4.4% 2.1% 3.5%
345 243 Plymouth, Devonport LAB 1,072 383 1,455 3.6% 1.9% 2.9%
168 114 Plymouth, Sutton LAB 1,593 467 2,060 6.0% 2.5% 4.6%226 154 Pontefract & Castleford LAB 1,169 388 1,557 5.1% 2.4% 4.0%
368 36 Pontypridd LAB 895 281 1,176 3.6% 1.6% 2.7%
574 445 Poole CON 408 129 537 1.7% 0.8% 1.3%
10 8 Poplar & Canning Town LAB 3,415 920 4,335 12.0% 4.9% 9.2%467 342 Portsmouth North LAB 677 221 898 2.5% 1.2% 2.0%
309 215 Portsmouth South LD 1,354 370 1,724 4.1% 1.8% 3.2%
206 16 Preseli Pembrokeshire LAB 957 328 1,285 5.2% 2.7% 4.2%
196 132 Preston LAB 1,688 426 2,114 5.8% 2.1% 4.3%

RESEARCH PAPER 01/68
17
II Residence-based unemployment rates by parliamentary constituency,United Kingdom, July 2001
A. (not seasonally adjusted) - alphabetical listingRank by overall
unemployment rate Claimants RateUK Eng Wal Sco NI Party Male Female All Male Female All513 386 Pudsey LAB 593 238 831 2.1% 1.1% 1.7%
389 276 Putney LAB 832 355 1,187 3.3% 1.8% 2.6%562 433 Rayleigh CON 436 198 634 1.6% 1.1% 1.4%
552 424 Reading East LAB 625 205 830 1.9% 0.9% 1.5%
550 422 Reading West LAB 640 155 795 2.1% 0.7% 1.5%
42 30 Redcar LAB 2,236 538 2,774 9.6% 3.4% 7.1%364 258 Redditch LAB 799 378 1,177 3.3% 2.1% 2.8%
114 80 Regent’s Park & Kensington North LAB 2,576 984 3,560 6.9% 3.4% 5.4%
653 523 Reigate CON 190 82 272 0.7% 0.4% 0.6%
220 17 Rhondda LAB 959 279 1,238 5.1% 2.3% 4.0%596 466 Ribble Valley CON 377 158 535 1.4% 0.8% 1.1%
508 381 Richmond CON 519 270 789 1.9% 1.4% 1.7%
547 419 Richmond Park LD 615 257 872 1.8% 1.0% 1.5%
163 111 Rochdale LAB 1,651 441 2,092 6.2% 2.4% 4.6%214 144 Rochford & Southend East CON 1,539 438 1,977 5.4% 2.2% 4.1%
480 355 Romford CON 539 229 768 2.3% 1.4% 1.9%
640 510 Romsey LD 277 91 368 1.0% 0.5% 0.8%
194 36 Ross, Skye & Inverness West LD 1,168 349 1,517 5.6% 2.4% 4.3%403 289 Rossendale & Darwen LAB 838 292 1,130 3.2% 1.5% 2.5%
279 190 Rother Valley LAB 1,135 401 1,536 4.4% 2.2% 3.5%
121 82 Rotherham LAB 1,497 405 1,902 6.9% 2.8% 5.3%
332 52 Roxburgh & Berwickshire LD 644 239 883 3.9% 1.9% 3.0%464 340 Rugby & Kenilworth LAB 757 297 1,054 2.5% 1.3% 2.0%
567 438 Ruislip - Northwood CON 410 189 599 1.7% 1.0% 1.4%
647 517 Runnymede & Weybridge CON 275 115 390 0.9% 0.5% 0.8%
529 402 Rushcliffe CON 620 221 841 2.0% 1.0% 1.6%603 473 Rutland & Melton CON 369 163 532 1.3% 0.8% 1.1%
503 376 Ryedale CON 474 210 684 2.0% 1.3% 1.7%
641 511 Saffron Walden CON 297 122 419 1.0% 0.6% 0.8%
189 129 Salford LAB 1,319 315 1,634 5.9% 2.1% 4.4%635 505 Salisbury CON 343 115 458 1.1% 0.5% 0.8%
232 158 Scarborough & Whitby LAB 1,370 383 1,753 5.3% 2.0% 3.9%
178 121 Scunthorpe LAB 1,241 412 1,653 5.6% 2.8% 4.5%
191 130 Sedgefield LAB 1,281 407 1,688 5.6% 2.6% 4.3%468 343 Selby LAB 630 266 896 2.4% 1.4% 2.0%
599 469 Sevenoaks CON 354 139 493 1.4% 0.8% 1.1%
218 148 Sheffield, Attercliffe LAB 1,410 425 1,835 5.2% 2.3% 4.0%
55 42 Sheffield, Brightside LAB 1,989 522 2,511 9.1% 3.5% 6.8%21 15 Sheffield, Central LAB 2,958 803 3,761 10.7% 4.5% 8.3%
431 313 Sheffield, Hallam LD 629 224 853 2.9% 1.4% 2.3%
142 96 Sheffield, Heeley LAB 1,665 412 2,077 6.8% 2.4% 5.0%
366 260 Sheffield, Hillsborough LAB 1,061 365 1,426 3.5% 1.7% 2.7%329 229 Sherwood LAB 1,028 371 1,399 3.9% 1.9% 3.1%
381 271 Shipley LAB 923 316 1,239 3.5% 1.5% 2.7%
472 347 Shrewsbury & Atcham LAB 718 231 949 2.6% 1.1% 2.0%
301 210 Sittingbourne & Sheppey LAB 1,022 395 1,417 3.9% 2.4% 3.3%559 431 Skipton & Ripon CON 464 201 665 1.8% 1.0% 1.4%
522 395 Sleaford & North Hykeham CON 515 218 733 2.0% 1.2% 1.6%
335 233 Slough LAB 1,173 398 1,571 3.9% 1.8% 3.0%
526 399 Solihull CON 582 254 836 2.0% 1.1% 1.6%587 457 Somerton & Frome * LD 411 158 569 1.5% 0.8% 1.2%
318 17 South Antrim DU 1,064 472 1,536 3.9% 2.2% 3.2%
643 513 South Cambridgeshire CON 282 115 397 1.0% 0.5% 0.8%
492 366 South Derbyshire LAB 715 265 980 2.3% 1.2% 1.9%493 367 South Dorset LAB 582 194 776 2.3% 1.1% 1.8%
116 9 South Down SDLP 1,502 683 2,185 6.2% 4.1% 5.3%
610 480 South East Cambridgeshire CON 405 173 578 1.2% 0.7% 1.0%
432 314 South East Cornwall LD 736 288 1,024 2.7% 1.6% 2.3%
RESEARCH PAPER 01/68
18
II Residence-based unemployment rates by parliamentary constituency,United Kingdom, July 2001
A. (not seasonally adjusted) - alphabetical listingRank by overall
unemployment rate Claimants RateUK Eng Wal Sco NI Party Male Female All Male Female All566 437 South Holland & The Deepings CON 423 183 606 1.6% 1.0% 1.4%
546 418 South Norfolk CON 499 247 746 1.7% 1.2% 1.5%533 406 South Ribble LAB 578 181 759 2.1% 0.9% 1.6%
12 10 South Shields LAB 2,528 608 3,136 12.0% 4.3% 8.9%
435 317 South Staffordshire CON 740 273 1,013 2.8% 1.4% 2.2%
527 400 South Suffolk CON 479 176 655 2.0% 1.0% 1.6%426 309 South Swindon LAB 857 287 1,144 3.0% 1.4% 2.3%
235 160 South Thanet LAB 1,085 337 1,422 5.1% 2.2% 3.9%
528 401 South West Bedfordshire CON 553 232 785 1.9% 1.1% 1.6%
588 458 South West Devon CON 395 156 551 1.5% 0.8% 1.2%589 459 South West Hertfordshire CON 446 167 613 1.5% 0.8% 1.2%
524 397 South West Norfolk CON 582 278 860 1.9% 1.3% 1.6%
646 516 South West Surrey CON 263 95 358 1.0% 0.5% 0.8%
358 253 Southampton, Itchen LAB 1,142 285 1,427 3.7% 1.4% 2.8%400 286 Southampton, Test LAB 1,003 268 1,271 3.3% 1.3% 2.5%
415 299 Southend West CON 797 256 1,053 3.1% 1.4% 2.4%
304 211 Southport LD 1,078 333 1,411 4.4% 1.8% 3.3%
615 485 Spelthorne CON 360 118 478 1.3% 0.6% 1.0%631 501 St Albans LAB 289 119 408 1.1% 0.6% 0.9%
228 156 St Helens North LAB 1,279 427 1,706 5.1% 2.4% 4.0%
115 81 St Helens South LAB 1,667 490 2,157 7.1% 2.9% 5.3%
267 181 St Ives LD 1,027 435 1,462 4.3% 2.7% 3.6%374 266 Stafford LAB 952 328 1,280 3.5% 1.6% 2.7%
458 336 Staffordshire Moorlands LAB 630 257 887 2.5% 1.4% 2.0%
351 248 Stalybridge & Hyde LAB 975 319 1,294 3.7% 1.7% 2.9%
488 362 Stevenage LAB 627 249 876 2.3% 1.3% 1.9%275 47 Stirling LAB 821 255 1,076 4.8% 2.0% 3.6%
369 262 Stockport LAB 927 280 1,207 3.7% 1.5% 2.7%
48 36 Stockton North LAB 2,170 567 2,737 9.4% 3.5% 7.0%
153 104 Stockton South LAB 1,672 486 2,158 6.3% 2.6% 4.8%170 115 Stoke-on-Trent Central LAB 1,490 392 1,882 6.2% 2.3% 4.6%
285 195 Stoke-on-Trent North LAB 970 332 1,302 4.3% 2.1% 3.4%
237 162 Stoke-on-Trent South LAB 1,291 520 1,811 4.8% 2.7% 3.9%
558 430 Stone CON 418 226 644 1.6% 1.2% 1.5%269 183 Stourbridge LAB 1,217 363 1,580 4.7% 2.0% 3.6%
276 16 Strangford DU 1,103 422 1,525 4.6% 2.3% 3.6%
604 474 Stratford-on-Avon CON 433 184 617 1.3% 0.8% 1.1%
377 57 Strathkelvin & Bearsden LAB 861 315 1,176 3.5% 1.7% 2.7%46 34 Streatham LAB 2,972 1,047 4,019 9.3% 4.1% 7.0%
268 182 Stretford & Urmston LAB 1,280 389 1,669 4.8% 2.0% 3.6%
477 352 Stroud LAB 711 280 991 2.4% 1.3% 2.0%
519 392 Suffolk Coastal CON 613 212 825 2.1% 1.0% 1.7%64 47 Sunderland North LAB 1,962 413 2,375 9.1% 2.8% 6.5%
44 32 Sunderland South LAB 2,245 484 2,729 10.0% 3.0% 7.1%
657 527 Surrey Heath CON 225 85 310 0.7% 0.4% 0.6%
584 454 Sutton & Cheam LD 409 160 569 1.6% 0.8% 1.3%437 318 Sutton Coldfield CON 755 304 1,059 2.8% 1.5% 2.2%
155 6 Swansea East LAB 1,354 315 1,669 6.6% 2.2% 4.8%
119 3 Swansea West LAB 1,380 356 1,736 7.2% 2.6% 5.3%
375 267 Tamworth LAB 929 339 1,268 3.3% 1.8% 2.7%544 416 Tatton CON 446 155 601 1.9% 0.9% 1.5%
489 363 Taunton * CON 684 255 939 2.4% 1.2% 1.9%
484 359 Teignbridge LD 680 252 932 2.4% 1.2% 1.9%
292 202 Telford LAB 1,029 369 1,398 4.3% 2.2% 3.4%542 414 Tewkesbury CON 498 216 714 1.8% 1.1% 1.5%
286 196 Thurrock LAB 1,194 442 1,636 4.2% 2.3% 3.4%
532 405 Tiverton & Honiton CON 511 225 736 1.9% 1.1% 1.6%
586 456 Tonbridge & Malling CON 397 139 536 1.5% 0.8% 1.2%
RESEARCH PAPER 01/68
19
II Residence-based unemployment rates by parliamentary constituency,United Kingdom, July 2001
A. (not seasonally adjusted) - alphabetical listingRank by overall
unemployment rate Claimants RateUK Eng Wal Sco NI Party Male Female All Male Female All240 165 Tooting LAB 1,441 534 1,975 5.1% 2.3% 3.8%
151 102 Torbay LD 1,539 470 2,009 6.5% 2.6% 4.8%258 25 Torfaen LAB 1,015 316 1,331 4.8% 2.1% 3.7%
353 249 Torridge & West Devon LD 865 392 1,257 3.3% 2.2% 2.8%
338 236 Totnes CON 757 362 1,119 3.5% 2.3% 3.0%
15 12 Tottenham LAB 3,471 1,165 4,636 11.2% 5.1% 8.6%367 261 Truro & St Austell LD 893 319 1,212 3.4% 1.8% 2.7%
582 452 Tunbridge Wells CON 421 147 568 1.6% 0.8% 1.3%
436 64 Tweeddale, Ettrick & Lauderdale LD 564 200 764 2.9% 1.3% 2.2%
576 447 Twickenham LD 559 223 782 1.6% 0.9% 1.3%32 24 Tyne Bridge LAB 2,445 604 3,049 10.3% 3.8% 7.7%
223 152 Tynemouth LAB 1,293 356 1,649 5.5% 2.0% 4.0%
466 341 Upminster CON 494 212 706 2.4% 1.5% 2.0%
188 14 Upper Bann UU 1,416 539 1,955 5.6% 2.8% 4.4%538 410 Uxbridge CON 494 195 689 1.9% 1.0% 1.6%
250 22 Vale of Clwyd LAB 837 244 1,081 5.1% 2.0% 3.8%
249 21 Vale of Glamorgan LAB 1,239 363 1,602 5.1% 2.0% 3.8%
585 455 Vale of York CON 406 179 585 1.5% 0.9% 1.2%36 26 Vauxhall LAB 3,243 1,176 4,419 9.6% 4.5% 7.4%
266 180 Wakefield LAB 1,331 401 1,732 4.8% 2.0% 3.6%
77 55 Wallasey LAB 1,864 537 2,401 8.3% 3.2% 6.1%
123 83 Walsall North LAB 1,695 545 2,240 6.6% 3.2% 5.2%84 61 Walsall South LAB 1,839 596 2,435 7.4% 3.8% 6.0%
91 66 Walthamstow LAB 2,008 668 2,676 7.6% 3.4% 5.8%
150 101 Wansbeck LAB 1,408 404 1,812 6.6% 2.5% 4.8%
632 502 Wansdyke <* LAB 265 124 389 1.0% 0.6% 0.8%645 515 Wantage CON 252 138 390 0.8% 0.7% 0.8%
80 58 Warley LAB 1,753 498 2,251 7.9% 3.3% 6.1%
342 240 Warrington North LAB 1,021 351 1,372 3.7% 1.8% 2.9%
439 320 Warrington South LAB 778 294 1,072 2.8% 1.4% 2.2%453 331 Warwick & Leamington LAB 887 267 1,154 2.8% 1.1% 2.1%
509 382 Watford LAB 697 254 951 2.2% 1.1% 1.7%
182 124 Waveney LAB 1,427 471 1,898 5.6% 2.7% 4.4%
638 508 Wealden CON 293 127 420 1.0% 0.6% 0.8%236 161 Weaver Vale LAB 1,246 379 1,625 5.1% 2.2% 3.9%
386 273 Wellingborough LAB 965 388 1,353 3.2% 1.8% 2.6%
455 333 Wells CON 645 275 920 2.5% 1.5% 2.1%
580 450 Welwyn Hatfield LAB 435 143 578 1.7% 0.7% 1.3%204 138 Wentworth LAB 1,230 371 1,601 5.4% 2.4% 4.2%
578 72 West Aberdeenshire & Kincardine LD 349 160 509 1.5% 1.0% 1.3%
85 62 West Bromwich East LAB 1,797 553 2,350 7.6% 3.4% 5.9%
70 49 West Bromwich West LAB 2,043 658 2,701 7.9% 3.9% 6.3%568 439 West Chelmsford CON 478 228 706 1.6% 1.1% 1.4%
506 379 West Derbyshire CON 582 227 809 2.1% 1.2% 1.7%
609 479 West Dorset CON 285 122 407 1.3% 0.7% 1.0%
28 20 West Ham LAB 2,385 814 3,199 9.8% 4.9% 7.9%239 164 West Lancashire LAB 1,305 421 1,726 5.0% 2.3% 3.9%
252 44 West Renfrewshire LAB 872 256 1,128 5.1% 2.0% 3.7%
598 468 West Suffolk CON 453 222 675 1.3% 0.9% 1.1%
17 4 West Tyrone SF 2,070 806 2,876 10.0% 6.2% 8.5%573 444 West Worcestershire CON 398 159 557 1.7% 0.9% 1.4%
554 426 Westbury CON 470 246 716 1.7% 1.2% 1.5%
102 21 Western Isles LAB 573 149 722 7.1% 3.0% 5.5%
618 488 Westmorland & Lonsdale CON 280 124 404 1.2% 0.7% 0.9%473 348 Weston-Super-Mare LD 643 240 883 2.5% 1.3% 2.0%
283 193 Wigan LAB 1,041 315 1,356 4.5% 2.0% 3.4%
548 420 Wimbledon LAB 515 223 738 1.8% 1.1% 1.5%
628 498 Winchester LD 346 119 465 1.2% 0.5% 0.9%

RESEARCH PAPER 01/68
20
II Residence-based unemployment rates by parliamentary constituency,United Kingdom, July 2001
A. (not seasonally adjusted) - alphabetical listingRank by overall
unemployment rate Claimants RateUK Eng Wal Sco NI Party Male Female All Male Female All600 470 Windsor CON 407 174 581 1.3% 0.8% 1.1%
388 275 Wirral South LAB 700 266 966 3.4% 1.7% 2.6%296 206 Wirral West LAB 931 300 1,231 4.5% 1.9% 3.4%
658 528 Witney CON 209 87 296 0.7% 0.4% 0.5%
655 525 Woking CON 241 80 321 0.8% 0.4% 0.6%
652 522 Wokingham CON 237 96 333 0.8% 0.5% 0.7%72 51 Wolverhampton North East LAB 1,741 563 2,304 8.0% 3.7% 6.2%
38 27 Wolverhampton South East LAB 1,771 588 2,359 8.8% 4.7% 7.3%
97 70 Wolverhampton South West LAB 1,796 532 2,328 7.4% 3.1% 5.7%
612 482 Woodspring CON 329 122 451 1.2% 0.6% 1.0%444 324 Worcester LAB 793 276 1,069 2.8% 1.3% 2.2%
224 153 Workington LAB 1,224 390 1,614 5.1% 2.4% 4.0%
334 232 Worsley LAB 1,049 323 1,372 4.0% 1.7% 3.0%
593 463 Worthing West CON 352 114 466 1.6% 0.7% 1.2%424 307 Wrekin, The LAB 671 262 933 2.8% 1.6% 2.3%
313 31 Wrexham LAB 751 241 992 4.2% 1.8% 3.2%
469 344 Wycombe CON 863 226 1,089 2.7% 1.0% 2.0%
402 288 Wyre Forest IND 874 327 1,201 3.1% 1.6% 2.5%209 141 Wythenshawe & Sale East LAB 1,512 390 1,902 5.8% 2.0% 4.1%
535 408 Yeovil * LD 564 191 755 2.0% 1.0% 1.6%
69 1 Ynys-Mon LAB 1,311 472 1,783 7.7% 4.3% 6.4%
324 225 York, City of LAB 1,271 369 1,640 4.3% 1.6% 3.1%
United Kingdom 724,060 237,761 961,821 4.3% 2.0% 3.3%
RESEARCH PAPER 01/68
21
II Residence-based unemployment rates by parliamentary constituency,United Kingdom, July 2001
B. (not seasonally adjusted) - highest and lowestRank by overallunemployment rate Claimants Rate
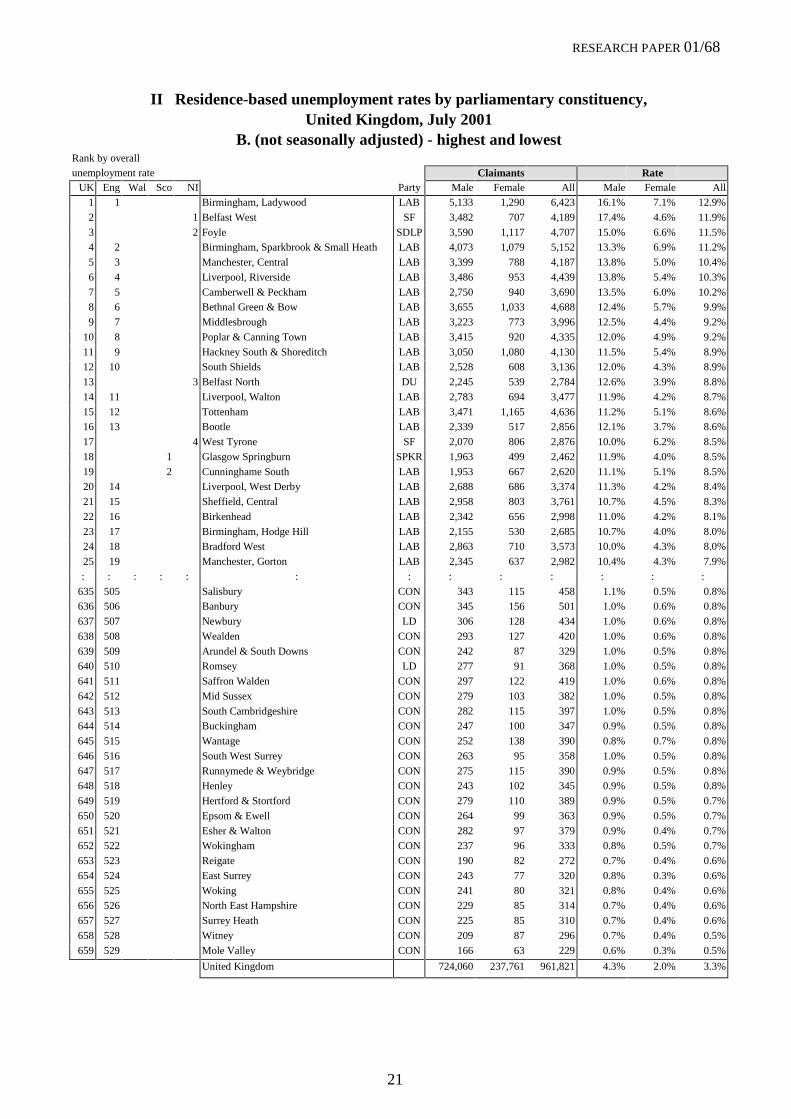
UK Eng Wal Sco NI Party Male Female All Male Female All1 1 Birmingham, Ladywood LAB 5,133 1,290 6,423 16.1% 7.1% 12.9%
2 1 Belfast West SF 3,482 707 4,189 17.4% 4.6% 11.9%
3 2 Foyle SDLP 3,590 1,117 4,707 15.0% 6.6% 11.5%4 2 Birmingham, Sparkbrook & Small Heath LAB 4,073 1,079 5,152 13.3% 6.9% 11.2%
5 3 Manchester, Central LAB 3,399 788 4,187 13.8% 5.0% 10.4%
6 4 Liverpool, Riverside LAB 3,486 953 4,439 13.8% 5.4% 10.3%
7 5 Camberwell & Peckham LAB 2,750 940 3,690 13.5% 6.0% 10.2%8 6 Bethnal Green & Bow LAB 3,655 1,033 4,688 12.4% 5.7% 9.9%
9 7 Middlesbrough LAB 3,223 773 3,996 12.5% 4.4% 9.2%
10 8 Poplar & Canning Town LAB 3,415 920 4,335 12.0% 4.9% 9.2%
11 9 Hackney South & Shoreditch LAB 3,050 1,080 4,130 11.5% 5.4% 8.9%12 10 South Shields LAB 2,528 608 3,136 12.0% 4.3% 8.9%
13 3 Belfast North DU 2,245 539 2,784 12.6% 3.9% 8.8%
14 11 Liverpool, Walton LAB 2,783 694 3,477 11.9% 4.2% 8.7%
15 12 Tottenham LAB 3,471 1,165 4,636 11.2% 5.1% 8.6%16 13 Bootle LAB 2,339 517 2,856 12.1% 3.7% 8.6%
17 4 West Tyrone SF 2,070 806 2,876 10.0% 6.2% 8.5%
18 1 Glasgow Springburn SPKR 1,963 499 2,462 11.9% 4.0% 8.5%
19 2 Cunninghame South LAB 1,953 667 2,620 11.1% 5.1% 8.5%20 14 Liverpool, West Derby LAB 2,688 686 3,374 11.3% 4.2% 8.4%
21 15 Sheffield, Central LAB 2,958 803 3,761 10.7% 4.5% 8.3%
22 16 Birkenhead LAB 2,342 656 2,998 11.0% 4.2% 8.1%
23 17 Birmingham, Hodge Hill LAB 2,155 530 2,685 10.7% 4.0% 8.0%24 18 Bradford West LAB 2,863 710 3,573 10.0% 4.3% 8.0%
25 19 Manchester, Gorton LAB 2,345 637 2,982 10.4% 4.3% 7.9%
: : : : : : : : : : : : :
635 505 Salisbury CON 343 115 458 1.1% 0.5% 0.8%636 506 Banbury CON 345 156 501 1.0% 0.6% 0.8%
637 507 Newbury LD 306 128 434 1.0% 0.6% 0.8%
638 508 Wealden CON 293 127 420 1.0% 0.6% 0.8%
639 509 Arundel & South Downs CON 242 87 329 1.0% 0.5% 0.8%640 510 Romsey LD 277 91 368 1.0% 0.5% 0.8%
641 511 Saffron Walden CON 297 122 419 1.0% 0.6% 0.8%
642 512 Mid Sussex CON 279 103 382 1.0% 0.5% 0.8%
643 513 South Cambridgeshire CON 282 115 397 1.0% 0.5% 0.8%644 514 Buckingham CON 247 100 347 0.9% 0.5% 0.8%
645 515 Wantage CON 252 138 390 0.8% 0.7% 0.8%
646 516 South West Surrey CON 263 95 358 1.0% 0.5% 0.8%
647 517 Runnymede & Weybridge CON 275 115 390 0.9% 0.5% 0.8%648 518 Henley CON 243 102 345 0.9% 0.5% 0.8%
649 519 Hertford & Stortford CON 279 110 389 0.9% 0.5% 0.7%
650 520 Epsom & Ewell CON 264 99 363 0.9% 0.5% 0.7%
651 521 Esher & Walton CON 282 97 379 0.9% 0.4% 0.7%652 522 Wokingham CON 237 96 333 0.8% 0.5% 0.7%
653 523 Reigate CON 190 82 272 0.7% 0.4% 0.6%
654 524 East Surrey CON 243 77 320 0.8% 0.3% 0.6%
655 525 Woking CON 241 80 321 0.8% 0.4% 0.6%656 526 North East Hampshire CON 229 85 314 0.7% 0.4% 0.6%
657 527 Surrey Heath CON 225 85 310 0.7% 0.4% 0.6%
658 528 Witney CON 209 87 296 0.7% 0.4% 0.5%
659 529 Mole Valley CON 166 63 229 0.6% 0.3% 0.5%
United Kingdom 724,060 237,761 961,821 4.3% 2.0% 3.3%
RESEARCH PAPER 01/68
22
III Residence-based unemployment rates, July 2001ranked listing of constituencies by country
A. England (not seasonally adjusted)Rank by overall
unemployment rate Claimants Rate
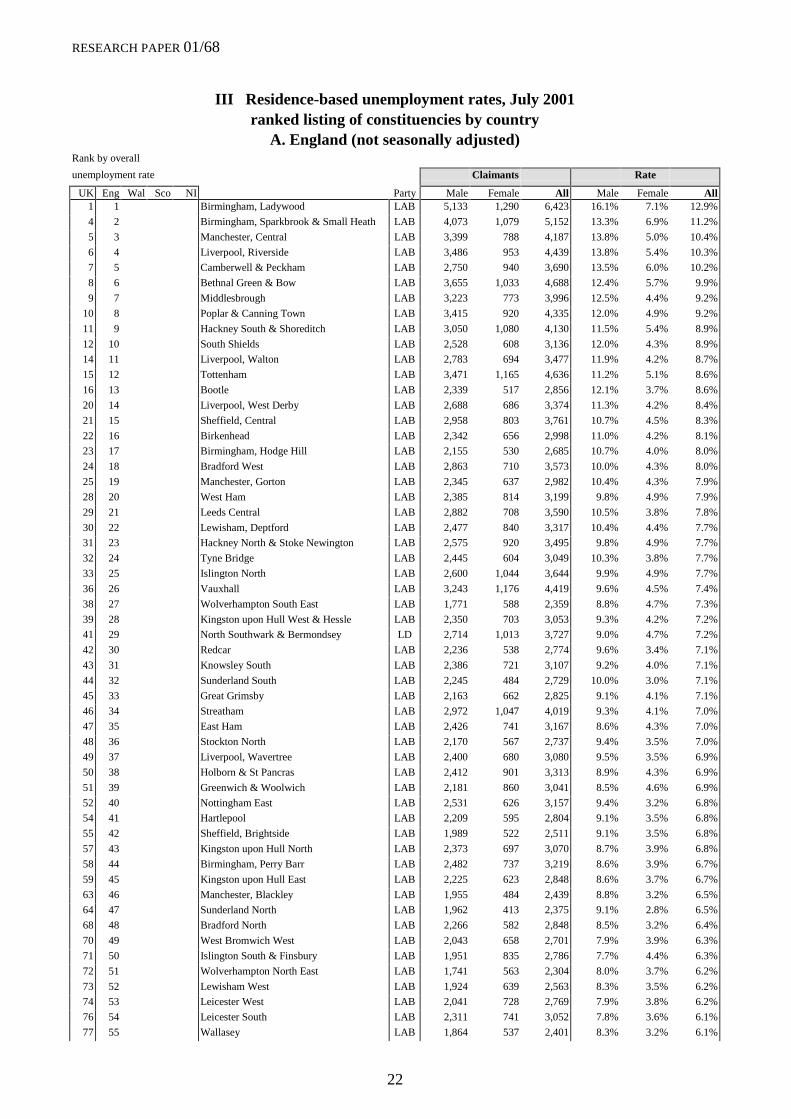
UK Eng Wal Sco NI Party Male Female All Male Female All1 1 Birmingham, Ladywood LAB 5,133 1,290 6,423 16.1% 7.1% 12.9%
4 2 Birmingham, Sparkbrook & Small Heath LAB 4,073 1,079 5,152 13.3% 6.9% 11.2%
5 3 Manchester, Central LAB 3,399 788 4,187 13.8% 5.0% 10.4%
6 4 Liverpool, Riverside LAB 3,486 953 4,439 13.8% 5.4% 10.3%
7 5 Camberwell & Peckham LAB 2,750 940 3,690 13.5% 6.0% 10.2%
8 6 Bethnal Green & Bow LAB 3,655 1,033 4,688 12.4% 5.7% 9.9%
9 7 Middlesbrough LAB 3,223 773 3,996 12.5% 4.4% 9.2%
10 8 Poplar & Canning Town LAB 3,415 920 4,335 12.0% 4.9% 9.2%
11 9 Hackney South & Shoreditch LAB 3,050 1,080 4,130 11.5% 5.4% 8.9%
12 10 South Shields LAB 2,528 608 3,136 12.0% 4.3% 8.9%
14 11 Liverpool, Walton LAB 2,783 694 3,477 11.9% 4.2% 8.7%
15 12 Tottenham LAB 3,471 1,165 4,636 11.2% 5.1% 8.6%
16 13 Bootle LAB 2,339 517 2,856 12.1% 3.7% 8.6%
20 14 Liverpool, West Derby LAB 2,688 686 3,374 11.3% 4.2% 8.4%
21 15 Sheffield, Central LAB 2,958 803 3,761 10.7% 4.5% 8.3%
22 16 Birkenhead LAB 2,342 656 2,998 11.0% 4.2% 8.1%
23 17 Birmingham, Hodge Hill LAB 2,155 530 2,685 10.7% 4.0% 8.0%
24 18 Bradford West LAB 2,863 710 3,573 10.0% 4.3% 8.0%
25 19 Manchester, Gorton LAB 2,345 637 2,982 10.4% 4.3% 7.9%
28 20 West Ham LAB 2,385 814 3,199 9.8% 4.9% 7.9%
29 21 Leeds Central LAB 2,882 708 3,590 10.5% 3.8% 7.8%
30 22 Lewisham, Deptford LAB 2,477 840 3,317 10.4% 4.4% 7.7%
31 23 Hackney North & Stoke Newington LAB 2,575 920 3,495 9.8% 4.9% 7.7%
32 24 Tyne Bridge LAB 2,445 604 3,049 10.3% 3.8% 7.7%
33 25 Islington North LAB 2,600 1,044 3,644 9.9% 4.9% 7.7%
36 26 Vauxhall LAB 3,243 1,176 4,419 9.6% 4.5% 7.4%
38 27 Wolverhampton South East LAB 1,771 588 2,359 8.8% 4.7% 7.3%
39 28 Kingston upon Hull West & Hessle LAB 2,350 703 3,053 9.3% 4.2% 7.2%
41 29 North Southwark & Bermondsey LD 2,714 1,013 3,727 9.0% 4.7% 7.2%
42 30 Redcar LAB 2,236 538 2,774 9.6% 3.4% 7.1%
43 31 Knowsley South LAB 2,386 721 3,107 9.2% 4.0% 7.1%
44 32 Sunderland South LAB 2,245 484 2,729 10.0% 3.0% 7.1%
45 33 Great Grimsby LAB 2,163 662 2,825 9.1% 4.1% 7.1%
46 34 Streatham LAB 2,972 1,047 4,019 9.3% 4.1% 7.0%
47 35 East Ham LAB 2,426 741 3,167 8.6% 4.3% 7.0%
48 36 Stockton North LAB 2,170 567 2,737 9.4% 3.5% 7.0%
49 37 Liverpool, Wavertree LAB 2,400 680 3,080 9.5% 3.5% 6.9%
50 38 Holborn & St Pancras LAB 2,412 901 3,313 8.9% 4.3% 6.9%
51 39 Greenwich & Woolwich LAB 2,181 860 3,041 8.5% 4.6% 6.9%
52 40 Nottingham East LAB 2,531 626 3,157 9.4% 3.2% 6.8%
54 41 Hartlepool LAB 2,209 595 2,804 9.1% 3.5% 6.8%
55 42 Sheffield, Brightside LAB 1,989 522 2,511 9.1% 3.5% 6.8%
57 43 Kingston upon Hull North LAB 2,373 697 3,070 8.7% 3.9% 6.8%
58 44 Birmingham, Perry Barr LAB 2,482 737 3,219 8.6% 3.9% 6.7%
59 45 Kingston upon Hull East LAB 2,225 623 2,848 8.6% 3.7% 6.7%
63 46 Manchester, Blackley LAB 1,955 484 2,439 8.8% 3.2% 6.5%
64 47 Sunderland North LAB 1,962 413 2,375 9.1% 2.8% 6.5%
68 48 Bradford North LAB 2,266 582 2,848 8.5% 3.2% 6.4%
70 49 West Bromwich West LAB 2,043 658 2,701 7.9% 3.9% 6.3%
71 50 Islington South & Finsbury LAB 1,951 835 2,786 7.7% 4.4% 6.3%
72 51 Wolverhampton North East LAB 1,741 563 2,304 8.0% 3.7% 6.2%
73 52 Lewisham West LAB 1,924 639 2,563 8.3% 3.5% 6.2%
74 53 Leicester West LAB 2,041 728 2,769 7.9% 3.8% 6.2%
76 54 Leicester South LAB 2,311 741 3,052 7.8% 3.6% 6.1%
77 55 Wallasey LAB 1,864 537 2,401 8.3% 3.2% 6.1%

RESEARCH PAPER 01/68
23
III Residence-based unemployment rates, July 2001ranked listing of constituencies by country
A. England (not seasonally adjusted)Rank by overall
unemployment rate Claimants Rate
UK Eng Wal Sco NI Party Male Female All Male Female All78 56 Leeds East LAB 1,856 478 2,334 8.2% 3.1% 6.1%
79 57 Birmingham, Erdington LAB 2,124 583 2,707 8.2% 3.1% 6.1%
80 58 Warley LAB 1,753 498 2,251 7.9% 3.3% 6.1%
81 59 Newcastle upon Tyne East & Wallsend LAB 1,925 484 2,409 8.5% 2.8% 6.1%
82 60 Dulwich & West Norwood LAB 2,120 882 3,002 7.7% 3.9% 6.0%
84 61 Walsall South LAB 1,839 596 2,435 7.4% 3.8% 6.0%
85 62 West Bromwich East LAB 1,797 553 2,350 7.6% 3.4% 5.9%
87 63 Brent East LAB 1,935 622 2,557 7.8% 3.3% 5.9%
88 64 Jarrow LAB 1,784 417 2,201 8.1% 2.7% 5.9%
90 65 Liverpool, Garston LAB 1,756 526 2,282 7.8% 3.2% 5.9%
91 66 Walthamstow LAB 2,008 668 2,676 7.6% 3.4% 5.8%
92 67 Knowsley North & Sefton East LAB 1,955 557 2,512 7.7% 3.0% 5.7%
95 68 Brent South LAB 1,992 659 2,651 7.4% 3.3% 5.7%
96 69 Derby South LAB 2,306 686 2,992 7.2% 3.3% 5.7%
97 70 Wolverhampton South West LAB 1,796 532 2,328 7.4% 3.1% 5.7%
99 71 Birmingham, Northfield LAB 1,472 412 1,884 7.8% 2.8% 5.6%
100 72 Great Yarmouth LAB 1,765 527 2,292 7.2% 3.2% 5.6%
104 73 Nottingham North LAB 1,806 563 2,369 7.3% 3.1% 5.5%
105 74 Huddersfield LAB 1,728 544 2,272 7.1% 3.1% 5.5%
108 75 Erith & Thamesmead LAB 1,755 694 2,449 6.6% 3.7% 5.4%
109 76 Doncaster Central LAB 1,687 515 2,202 6.9% 3.1% 5.4%
110 77 Birmingham, Edgbaston LAB 1,840 555 2,395 7.3% 2.9% 5.4%
112 78 Edmonton LAB 1,699 607 2,306 6.8% 3.4% 5.4%
113 79 Middlesbrough South & East Cleveland LAB 1,811 501 2,312 7.1% 2.9% 5.4%
114 80 Regent’s Park & Kensington North LAB 2,576 984 3,560 6.9% 3.4% 5.4%
115 81 St Helens South LAB 1,667 490 2,157 7.1% 2.9% 5.3%
121 82 Rotherham LAB 1,497 405 1,902 6.9% 2.8% 5.3%
123 83 Walsall North LAB 1,695 545 2,240 6.6% 3.2% 5.2%
127 84 Lewisham East LAB 1,413 545 1,958 6.7% 3.3% 5.2%
128 85 Ealing, Acton & Shepherd’s Bush LAB 2,157 768 2,925 7.0% 3.0% 5.2%
129 86 Birmingham, Yardley LAB 1,352 410 1,762 6.8% 2.8% 5.1%
130 87 North Tyneside LAB 1,624 413 2,037 7.2% 2.4% 5.1%
132 88 Houghton & Washington East LAB 1,530 474 2,004 6.8% 2.9% 5.1%
133 89 Copeland LAB 1,351 392 1,743 6.6% 2.9% 5.1%
135 90 Chesterfield LD 1,794 552 2,346 6.7% 2.9% 5.1%
136 91 Leicester East LAB 1,598 642 2,240 6.2% 3.4% 5.1%
137 92 Easington LAB 1,234 405 1,639 6.6% 2.9% 5.0%
138 93 Dudley North LAB 1,698 496 2,194 6.4% 2.9% 5.0%
139 94 Blackburn LAB 1,812 457 2,269 6.8% 2.5% 5.0%
140 95 Birmingham, Hall Green LAB 1,398 459 1,857 6.5% 2.9% 5.0%
142 96 Sheffield, Heeley LAB 1,665 412 2,077 6.8% 2.4% 5.0%
144 97 Newcastle upon Tyne Central LAB 1,712 456 2,168 6.7% 2.4% 4.9%
147 98 Coventry North East LAB 1,859 523 2,382 6.4% 2.6% 4.9%
148 99 Nottingham South LAB 1,788 468 2,256 6.6% 2.4% 4.8%
149 100 Leyton & Wanstead LAB 1,586 524 2,110 6.3% 2.8% 4.8%
150 101 Wansbeck LAB 1,408 404 1,812 6.6% 2.5% 4.8%
151 102 Torbay LD 1,539 470 2,009 6.5% 2.6% 4.8%
152 103 Croydon North LAB 2,189 805 2,994 6.2% 3.0% 4.8%
153 104 Stockton South LAB 1,672 486 2,158 6.3% 2.6% 4.8%
154 105 Darlington LAB 1,614 436 2,050 6.5% 2.4% 4.8%
158 106 Birmingham, Selly Oak LAB 1,771 522 2,293 6.5% 2.5% 4.7%
159 107 Bolton South East LAB 1,546 447 1,993 6.2% 2.6% 4.7%
160 108 Halifax LAB 1,778 450 2,228 6.6% 2.2% 4.7%
161 109 Ilford South * LAB 1,641 601 2,242 5.6% 3.2% 4.7%
162 110 Brighton, Pavilion LAB 1,546 620 2,166 5.8% 3.1% 4.6%
163 111 Rochdale LAB 1,651 441 2,092 6.2% 2.4% 4.6%
RESEARCH PAPER 01/68
24
III Residence-based unemployment rates, July 2001ranked listing of constituencies by country
A. England (not seasonally adjusted)Rank by overall
unemployment rate Claimants Rate
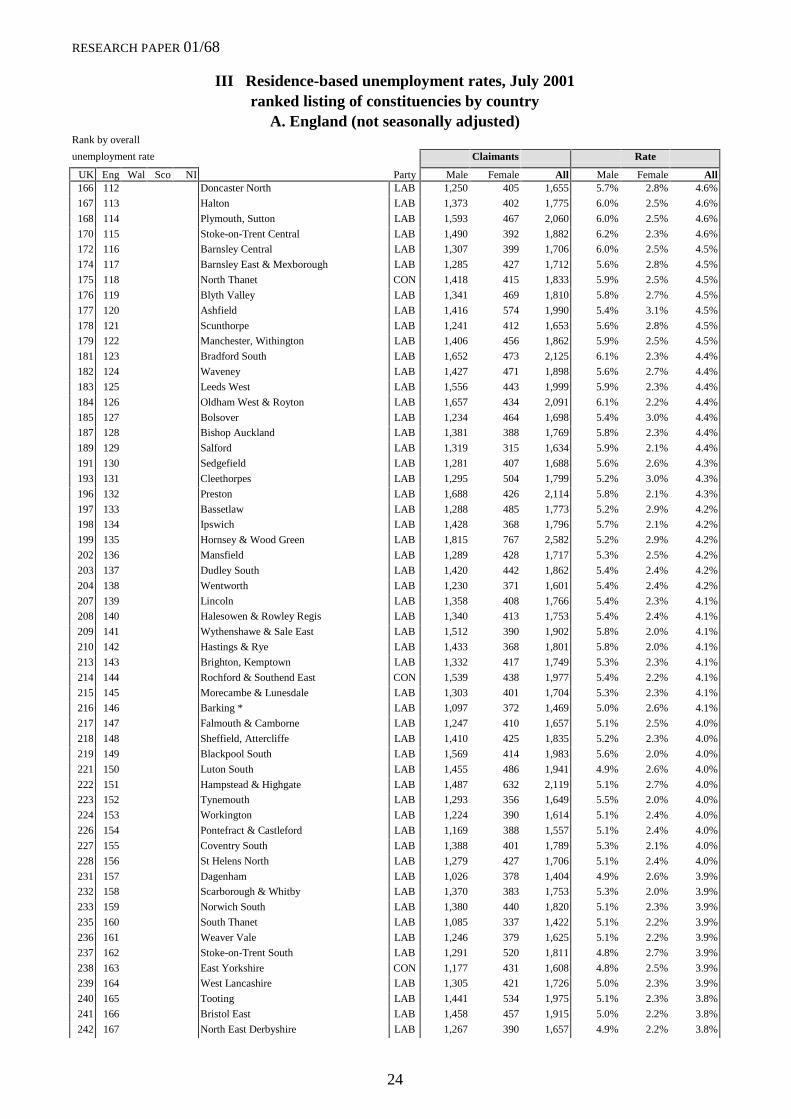
UK Eng Wal Sco NI Party Male Female All Male Female All166 112 Doncaster North LAB 1,250 405 1,655 5.7% 2.8% 4.6%
167 113 Halton LAB 1,373 402 1,775 6.0% 2.5% 4.6%
168 114 Plymouth, Sutton LAB 1,593 467 2,060 6.0% 2.5% 4.6%
170 115 Stoke-on-Trent Central LAB 1,490 392 1,882 6.2% 2.3% 4.6%
172 116 Barnsley Central LAB 1,307 399 1,706 6.0% 2.5% 4.5%
174 117 Barnsley East & Mexborough LAB 1,285 427 1,712 5.6% 2.8% 4.5%
175 118 North Thanet CON 1,418 415 1,833 5.9% 2.5% 4.5%
176 119 Blyth Valley LAB 1,341 469 1,810 5.8% 2.7% 4.5%
177 120 Ashfield LAB 1,416 574 1,990 5.4% 3.1% 4.5%
178 121 Scunthorpe LAB 1,241 412 1,653 5.6% 2.8% 4.5%
179 122 Manchester, Withington LAB 1,406 456 1,862 5.9% 2.5% 4.5%
181 123 Bradford South LAB 1,652 473 2,125 6.1% 2.3% 4.4%
182 124 Waveney LAB 1,427 471 1,898 5.6% 2.7% 4.4%
183 125 Leeds West LAB 1,556 443 1,999 5.9% 2.3% 4.4%
184 126 Oldham West & Royton LAB 1,657 434 2,091 6.1% 2.2% 4.4%
185 127 Bolsover LAB 1,234 464 1,698 5.4% 3.0% 4.4%
187 128 Bishop Auckland LAB 1,381 388 1,769 5.8% 2.3% 4.4%
189 129 Salford LAB 1,319 315 1,634 5.9% 2.1% 4.4%
191 130 Sedgefield LAB 1,281 407 1,688 5.6% 2.6% 4.3%
193 131 Cleethorpes LAB 1,295 504 1,799 5.2% 3.0% 4.3%
196 132 Preston LAB 1,688 426 2,114 5.8% 2.1% 4.3%
197 133 Bassetlaw LAB 1,288 485 1,773 5.2% 2.9% 4.2%
198 134 Ipswich LAB 1,428 368 1,796 5.7% 2.1% 4.2%
199 135 Hornsey & Wood Green LAB 1,815 767 2,582 5.2% 2.9% 4.2%
202 136 Mansfield LAB 1,289 428 1,717 5.3% 2.5% 4.2%
203 137 Dudley South LAB 1,420 442 1,862 5.4% 2.4% 4.2%
204 138 Wentworth LAB 1,230 371 1,601 5.4% 2.4% 4.2%
207 139 Lincoln LAB 1,358 408 1,766 5.4% 2.3% 4.1%
208 140 Halesowen & Rowley Regis LAB 1,340 413 1,753 5.4% 2.4% 4.1%
209 141 Wythenshawe & Sale East LAB 1,512 390 1,902 5.8% 2.0% 4.1%
210 142 Hastings & Rye LAB 1,433 368 1,801 5.8% 2.0% 4.1%
213 143 Brighton, Kemptown LAB 1,332 417 1,749 5.3% 2.3% 4.1%
214 144 Rochford & Southend East CON 1,539 438 1,977 5.4% 2.2% 4.1%
215 145 Morecambe & Lunesdale LAB 1,303 401 1,704 5.3% 2.3% 4.1%
216 146 Barking * LAB 1,097 372 1,469 5.0% 2.6% 4.1%
217 147 Falmouth & Camborne LAB 1,247 410 1,657 5.1% 2.5% 4.0%
218 148 Sheffield, Attercliffe LAB 1,410 425 1,835 5.2% 2.3% 4.0%
219 149 Blackpool South LAB 1,569 414 1,983 5.6% 2.0% 4.0%
221 150 Luton South LAB 1,455 486 1,941 4.9% 2.6% 4.0%
222 151 Hampstead & Highgate LAB 1,487 632 2,119 5.1% 2.7% 4.0%
223 152 Tynemouth LAB 1,293 356 1,649 5.5% 2.0% 4.0%
224 153 Workington LAB 1,224 390 1,614 5.1% 2.4% 4.0%
226 154 Pontefract & Castleford LAB 1,169 388 1,557 5.1% 2.4% 4.0%
227 155 Coventry South LAB 1,388 401 1,789 5.3% 2.1% 4.0%
228 156 St Helens North LAB 1,279 427 1,706 5.1% 2.4% 4.0%
231 157 Dagenham LAB 1,026 378 1,404 4.9% 2.6% 3.9%
232 158 Scarborough & Whitby LAB 1,370 383 1,753 5.3% 2.0% 3.9%
233 159 Norwich South LAB 1,380 440 1,820 5.1% 2.3% 3.9%
235 160 South Thanet LAB 1,085 337 1,422 5.1% 2.2% 3.9%
236 161 Weaver Vale LAB 1,246 379 1,625 5.1% 2.2% 3.9%
237 162 Stoke-on-Trent South LAB 1,291 520 1,811 4.8% 2.7% 3.9%
238 163 East Yorkshire CON 1,177 431 1,608 4.8% 2.5% 3.9%
239 164 West Lancashire LAB 1,305 421 1,726 5.0% 2.3% 3.9%
240 165 Tooting LAB 1,441 534 1,975 5.1% 2.3% 3.8%
241 166 Bristol East LAB 1,458 457 1,915 5.0% 2.2% 3.8%
242 167 North East Derbyshire LAB 1,267 390 1,657 4.9% 2.2% 3.8%

RESEARCH PAPER 01/68
25
III Residence-based unemployment rates, July 2001ranked listing of constituencies by country
A. England (not seasonally adjusted)Rank by overall
unemployment rate Claimants Rate
UK Eng Wal Sco NI Party Male Female All Male Female All243 168 Bedford LAB 1,431 422 1,853 5.1% 2.1% 3.8%
246 169 North West Durham LAB 1,123 375 1,498 4.9% 2.3% 3.8%
248 170 Bolton North East LAB 1,317 358 1,675 5.1% 1.9% 3.8%
253 171 Gateshead East & Washington West LAB 1,238 317 1,555 5.2% 1.8% 3.7%
255 172 Eltham LAB 1,049 417 1,466 4.7% 2.5% 3.7%
256 173 Hammersmith & Fulham LAB 1,771 712 2,483 4.9% 2.3% 3.7%
257 174 Enfield North LAB 1,252 478 1,730 4.5% 2.5% 3.7%
260 175 Leeds North East LAB 1,212 368 1,580 4.9% 2.0% 3.7%
261 176 Gloucester LAB 1,536 435 1,971 4.9% 1.9% 3.7%
262 177 Barnsley West & Penistone LAB 1,040 383 1,423 4.6% 2.4% 3.6%
264 178 North Durham LAB 1,239 317 1,556 5.0% 1.8% 3.6%
265 179 Ealing Southall LAB 1,751 600 2,351 4.5% 2.4% 3.6%
266 180 Wakefield LAB 1,331 401 1,732 4.8% 2.0% 3.6%
267 181 St Ives LD 1,027 435 1,462 4.3% 2.7% 3.6%
268 182 Stretford & Urmston LAB 1,280 389 1,669 4.8% 2.0% 3.6%
269 183 Stourbridge LAB 1,217 363 1,580 4.7% 2.0% 3.6%
270 184 Crosby LAB 959 288 1,247 4.9% 1.9% 3.6%
271 185 Battersea LAB 1,439 509 1,948 4.8% 2.1% 3.6%
272 186 Barrow & Furness LAB 1,201 320 1,521 4.8% 1.9% 3.6%
273 187 Carlisle LAB 1,054 366 1,420 4.7% 2.1% 3.6%
274 188 Harwich LAB 1,056 318 1,374 4.6% 2.0% 3.6%
277 189 Isle of Wight CON 1,534 436 1,970 4.7% 1.9% 3.6%
279 190 Rother Valley LAB 1,135 401 1,536 4.4% 2.2% 3.5%
281 191 Peterborough LAB 1,246 411 1,657 4.4% 2.1% 3.5%
282 192 Hemsworth LAB 1,072 332 1,404 4.4% 2.0% 3.4%
283 193 Wigan LAB 1,041 315 1,356 4.5% 2.0% 3.4%
284 194 Derby North LAB 1,352 414 1,766 4.5% 1.9% 3.4%
285 195 Stoke-on-Trent North LAB 970 332 1,302 4.3% 2.1% 3.4%
286 196 Thurrock LAB 1,194 442 1,636 4.2% 2.3% 3.4%
287 197 Keighley LAB 1,176 367 1,543 4.5% 1.9% 3.4%
288 198 Berwick-upon-Tweed LD 845 288 1,133 4.3% 2.1% 3.4%
289 199 Heywood & Middleton LAB 1,258 392 1,650 4.6% 1.9% 3.4%
290 200 Newcastle upon Tyne North LAB 1,159 277 1,436 4.8% 1.5% 3.4%
291 201 Croydon Central LAB 1,537 532 2,069 4.4% 2.0% 3.4%
292 202 Telford LAB 1,029 369 1,398 4.3% 2.2% 3.4%
293 203 Blackpool North & Fleetwood LAB 1,231 288 1,519 4.9% 1.5% 3.4%
294 204 Mitcham & Morden LAB 1,196 459 1,655 4.2% 2.2% 3.4%
295 205 Enfield, Southgate LAB 1,073 448 1,521 4.1% 2.4% 3.4%
296 206 Wirral West LAB 931 300 1,231 4.5% 1.9% 3.4%
297 207 Pendle LAB 970 343 1,313 4.3% 2.1% 3.4%
298 208 Ashton under Lyne LAB 1,272 373 1,645 4.5% 1.8% 3.3%
300 209 Don Valley LAB 1,000 315 1,315 4.2% 2.0% 3.3%
301 210 Sittingbourne & Sheppey LAB 1,022 395 1,417 3.9% 2.4% 3.3%
304 211 Southport LD 1,078 333 1,411 4.4% 1.8% 3.3%
305 212 Gainsborough CON 869 358 1,227 3.9% 2.4% 3.3%
306 213 Dewsbury LAB 1,021 318 1,339 4.3% 1.9% 3.3%
308 214 Northampton North LAB 1,257 443 1,700 4.3% 2.0% 3.3%
309 215 Portsmouth South LD 1,354 370 1,724 4.1% 1.8% 3.2%
310 216 Hendon LAB 1,371 459 1,830 4.1% 1.9% 3.2%
312 217 Hove LAB 1,172 420 1,592 4.1% 2.0% 3.2%
314 218 Coventry North West LAB 1,218 378 1,596 4.2% 1.8% 3.2%
315 219 Blaydon LAB 1,024 270 1,294 4.4% 1.5% 3.2%
316 220 Folkestone & Hythe CON 1,113 353 1,466 4.1% 1.9% 3.2%
317 221 Brigg & Goole LAB 861 387 1,248 3.7% 2.4% 3.2%
319 222 Bristol South LAB 1,244 375 1,619 4.1% 1.8% 3.2%
320 223 Dover LAB 1,059 330 1,389 4.1% 1.8% 3.1%

RESEARCH PAPER 01/68
26
III Residence-based unemployment rates, July 2001ranked listing of constituencies by country
A. England (not seasonally adjusted)Rank by overall
unemployment rate Claimants Rate
UK Eng Wal Sco NI Party Male Female All Male Female All322 224 Meriden CON 1,240 377 1,617 4.2% 1.7% 3.1%
324 225 York, City of LAB 1,271 369 1,640 4.3% 1.6% 3.1%
326 226 Medway LAB 962 363 1,325 3.7% 2.1% 3.1%
327 227 Gravesham LAB 1,031 337 1,368 3.9% 1.9% 3.1%
328 228 Oldham East & Saddleworth LAB 1,202 374 1,576 4.1% 1.7% 3.1%
329 229 Sherwood LAB 1,028 371 1,399 3.9% 1.9% 3.1%
330 230 Beverley & Holderness CON 1,046 404 1,450 3.8% 2.0% 3.1%
333 231 Leigh LAB 1,056 327 1,383 3.9% 1.7% 3.0%
334 232 Worsley LAB 1,049 323 1,372 4.0% 1.7% 3.0%
335 233 Slough LAB 1,173 398 1,571 3.9% 1.8% 3.0%
336 234 Ealing North * LAB 1,236 466 1,702 3.9% 1.8% 3.0%
337 235 Brent North LAB 907 338 1,245 3.7% 2.0% 3.0%
338 236 Totnes CON 757 362 1,119 3.5% 2.3% 3.0%
339 237 Newark CON 899 383 1,282 3.5% 2.2% 2.9%
340 238 Batley & Spen LAB 943 326 1,269 3.7% 1.8% 2.9%
341 239 Eccles LAB 1,015 285 1,300 4.0% 1.5% 2.9%
342 240 Warrington North LAB 1,021 351 1,372 3.7% 1.8% 2.9%
343 241 Bournemouth East CON 827 287 1,114 3.8% 1.7% 2.9%
344 242 Cities of London & Westminster CON 1,539 631 2,170 3.5% 2.0% 2.9%
345 243 Plymouth, Devonport LAB 1,072 383 1,455 3.6% 1.9% 2.9%
346 244 Loughborough LAB 982 375 1,357 3.6% 1.9% 2.9%
348 245 Erewash LAB 1,058 417 1,475 3.5% 2.0% 2.9%
349 246 North Devon LD 908 346 1,254 3.5% 1.9% 2.9%
350 247 North Cornwall LD 993 409 1,402 3.4% 2.1% 2.9%
351 248 Stalybridge & Hyde LAB 975 319 1,294 3.7% 1.7% 2.9%
353 249 Torridge & West Devon LD 865 392 1,257 3.3% 2.2% 2.8%
354 250 Burnley LAB 952 259 1,211 3.9% 1.4% 2.8%
355 251 Bristol West LAB 1,289 471 1,760 3.6% 1.8% 2.8%
356 252 Burton LAB 998 359 1,357 3.5% 1.8% 2.8%
358 253 Southampton, Itchen LAB 1,142 285 1,427 3.7% 1.4% 2.8%
359 254 Aldridge - Brownhills CON 800 331 1,131 3.4% 2.0% 2.8%
361 255 Makerfield LAB 942 279 1,221 3.7% 1.5% 2.8%
362 256 Durham, City of LAB 915 308 1,223 3.7% 1.6% 2.8%
363 257 Cannock Chase LAB 905 404 1,309 3.2% 2.1% 2.8%
364 258 Redditch LAB 799 378 1,177 3.3% 2.1% 2.8%
365 259 Cheltenham LD 990 276 1,266 3.7% 1.4% 2.8%
366 260 Sheffield, Hillsborough LAB 1,061 365 1,426 3.5% 1.7% 2.7%
367 261 Truro & St Austell LD 893 319 1,212 3.4% 1.8% 2.7%
369 262 Stockport LAB 927 280 1,207 3.7% 1.5% 2.7%
370 263 Luton North LAB 921 331 1,252 3.4% 1.7% 2.7%
372 264 Finchley & Golders Green LAB 1,105 438 1,543 3.3% 1.8% 2.7%
373 265 Colne Valley LAB 987 343 1,330 3.5% 1.6% 2.7%
374 266 Stafford LAB 952 328 1,280 3.5% 1.6% 2.7%
375 267 Tamworth LAB 929 339 1,268 3.3% 1.8% 2.7%
378 268 Beckenham CON 1,041 349 1,390 3.5% 1.6% 2.7%
379 269 Amber Valley LAB 923 330 1,253 3.3% 1.7% 2.7%
380 270 Bridgwater CON 849 303 1,152 3.3% 1.7% 2.7%
381 271 Shipley LAB 923 316 1,239 3.5% 1.5% 2.7%
384 272 Calder Valley LAB 972 341 1,313 3.5% 1.6% 2.6%
386 273 Wellingborough LAB 965 388 1,353 3.2% 1.8% 2.6%
387 274 Norwich North LAB 987 314 1,301 3.4% 1.5% 2.6%
388 275 Wirral South LAB 700 266 966 3.4% 1.7% 2.6%
389 276 Putney LAB 832 355 1,187 3.3% 1.8% 2.6%
390 277 Basildon LAB 920 363 1,283 3.2% 1.8% 2.6%
391 278 Denton & Reddish LAB 928 269 1,197 3.6% 1.4% 2.6%
392 279 Bournemouth West CON 790 199 989 3.6% 1.3% 2.6%

RESEARCH PAPER 01/68
27
III Residence-based unemployment rates, July 2001ranked listing of constituencies by country
A. England (not seasonally adjusted)Rank by overall
unemployment rate Claimants Rate
UK Eng Wal Sco NI Party Male Female All Male Female All394 280 Crewe & Nantwich LAB 929 316 1,245 3.2% 1.6% 2.5%
395 281 Exeter LAB 1,085 346 1,431 3.4% 1.4% 2.5%
396 282 Havant CON 775 280 1,055 3.2% 1.6% 2.5%
397 283 Newcastle-under-Lyme LAB 785 262 1,047 3.3% 1.5% 2.5%
398 284 Ellesmere Port & Neston LAB 822 217 1,039 3.4% 1.2% 2.5%
399 285 Louth & Horncastle CON 692 276 968 3.0% 1.7% 2.5%
400 286 Southampton, Test LAB 1,003 268 1,271 3.3% 1.3% 2.5%
401 287 Hayes & Harlington LAB 790 312 1,102 3.0% 1.7% 2.5%
402 288 Wyre Forest IND 874 327 1,201 3.1% 1.6% 2.5%
403 289 Rossendale & Darwen LAB 838 292 1,130 3.2% 1.5% 2.5%
405 290 Gedling LAB 819 300 1,119 3.2% 1.5% 2.5%
407 291 North Shropshire CON 737 317 1,054 2.9% 1.8% 2.5%
408 292 Harrow East LAB 961 425 1,386 2.9% 1.8% 2.4%
409 293 Ilford North LAB 793 310 1,103 3.1% 1.6% 2.4%
410 294 Eastbourne CON 838 242 1,080 3.4% 1.2% 2.4%
411 295 Hereford *> LD 768 303 1,071 3.0% 1.6% 2.4%
412 296 Hyndburn LAB 779 263 1,042 3.2% 1.4% 2.4%
413 297 Eddisbury CON 693 271 964 2.9% 1.7% 2.4%
414 298 Harlow LAB 764 293 1,057 3.0% 1.6% 2.4%
415 299 Southend West CON 797 256 1,053 3.1% 1.4% 2.4%
416 300 Northampton South LAB 1,042 351 1,393 3.1% 1.4% 2.4%
417 301 Corby LAB 830 303 1,133 3.0% 1.5% 2.4%
418 302 Chester, City of LAB 780 231 1,011 3.1% 1.3% 2.4%
419 303 Chingford & Woodford Green CON 697 290 987 2.9% 1.6% 2.4%
420 304 Leeds North West LAB 793 278 1,071 3.1% 1.4% 2.3%
421 305 Chipping Barnet CON 843 364 1,207 2.8% 1.7% 2.3%
423 306 Oxford East LAB 1,005 291 1,296 3.2% 1.2% 2.3%
424 307 Wrekin, The LAB 671 262 933 2.8% 1.6% 2.3%
425 308 Morley & Rothwell LAB 837 300 1,137 2.9% 1.4% 2.3%
426 309 South Swindon LAB 857 287 1,144 3.0% 1.4% 2.3%
427 310 Bristol North West LAB 897 285 1,182 3.0% 1.3% 2.3%
428 311 Chatham & Aylesford LAB 792 301 1,093 2.8% 1.6% 2.3%
429 312 Forest of Dean LAB 632 281 913 2.6% 1.8% 2.3%
431 313 Sheffield, Hallam LD 629 224 853 2.9% 1.4% 2.3%
432 314 South East Cornwall LD 736 288 1,024 2.7% 1.6% 2.3%
433 315 Normanton LAB 683 256 939 2.8% 1.4% 2.3%
434 316 North West Norfolk CON 754 280 1,034 2.8% 1.5% 2.3%
435 317 South Staffordshire CON 740 273 1,013 2.8% 1.4% 2.2%
437 318 Sutton Coldfield CON 755 304 1,059 2.8% 1.5% 2.2%
438 319 Bury South LAB 749 237 986 2.9% 1.3% 2.2%
439 320 Warrington South LAB 778 294 1,072 2.8% 1.4% 2.2%
440 321 Gillingham LAB 783 288 1,071 2.7% 1.5% 2.2%
441 322 Hexham CON 571 216 787 2.8% 1.4% 2.2%
443 323 Lancaster & Wyre LAB 759 267 1,026 2.9% 1.3% 2.2%
444 324 Worcester LAB 793 276 1,069 2.8% 1.3% 2.2%
446 325 Bury North LAB 758 255 1,013 2.7% 1.3% 2.1%
447 326 Feltham & Heston LAB 809 297 1,106 2.6% 1.4% 2.1%
448 327 Broxtowe LAB 744 296 1,040 2.6% 1.4% 2.1%
449 328 Canterbury CON 764 269 1,033 2.7% 1.3% 2.1%
451 329 North Norfolk LD 676 249 925 2.6% 1.4% 2.1%
452 330 Chorley LAB 785 259 1,044 2.7% 1.2% 2.1%
453 331 Warwick & Leamington LAB 887 267 1,154 2.8% 1.1% 2.1%
454 332 High Peak LAB 718 304 1,022 2.5% 1.5% 2.1%
455 333 Wells CON 645 275 920 2.5% 1.5% 2.1%
456 334 Nuneaton LAB 732 240 972 2.6% 1.2% 2.0%
457 335 Bromsgrove CON 738 233 971 2.7% 1.1% 2.0%
RESEARCH PAPER 01/68
28
III Residence-based unemployment rates, July 2001ranked listing of constituencies by country
A. England (not seasonally adjusted)Rank by overall
unemployment rate Claimants Rate
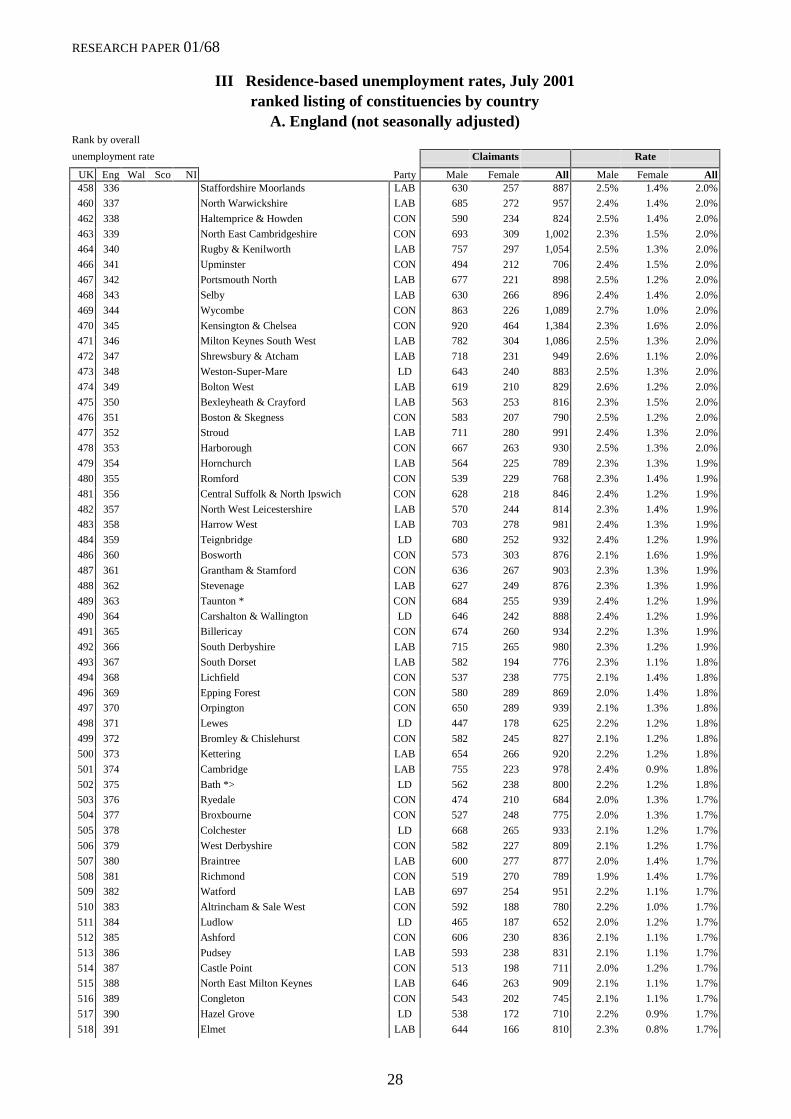
UK Eng Wal Sco NI Party Male Female All Male Female All458 336 Staffordshire Moorlands LAB 630 257 887 2.5% 1.4% 2.0%
460 337 North Warwickshire LAB 685 272 957 2.4% 1.4% 2.0%
462 338 Haltemprice & Howden CON 590 234 824 2.5% 1.4% 2.0%
463 339 North East Cambridgeshire CON 693 309 1,002 2.3% 1.5% 2.0%
464 340 Rugby & Kenilworth LAB 757 297 1,054 2.5% 1.3% 2.0%
466 341 Upminster CON 494 212 706 2.4% 1.5% 2.0%
467 342 Portsmouth North LAB 677 221 898 2.5% 1.2% 2.0%
468 343 Selby LAB 630 266 896 2.4% 1.4% 2.0%
469 344 Wycombe CON 863 226 1,089 2.7% 1.0% 2.0%
470 345 Kensington & Chelsea CON 920 464 1,384 2.3% 1.6% 2.0%
471 346 Milton Keynes South West LAB 782 304 1,086 2.5% 1.3% 2.0%
472 347 Shrewsbury & Atcham LAB 718 231 949 2.6% 1.1% 2.0%
473 348 Weston-Super-Mare LD 643 240 883 2.5% 1.3% 2.0%
474 349 Bolton West LAB 619 210 829 2.6% 1.2% 2.0%
475 350 Bexleyheath & Crayford LAB 563 253 816 2.3% 1.5% 2.0%
476 351 Boston & Skegness CON 583 207 790 2.5% 1.2% 2.0%
477 352 Stroud LAB 711 280 991 2.4% 1.3% 2.0%
478 353 Harborough CON 667 263 930 2.5% 1.3% 2.0%
479 354 Hornchurch LAB 564 225 789 2.3% 1.3% 1.9%
480 355 Romford CON 539 229 768 2.3% 1.4% 1.9%
481 356 Central Suffolk & North Ipswich CON 628 218 846 2.4% 1.2% 1.9%
482 357 North West Leicestershire LAB 570 244 814 2.3% 1.4% 1.9%
483 358 Harrow West LAB 703 278 981 2.4% 1.3% 1.9%
484 359 Teignbridge LD 680 252 932 2.4% 1.2% 1.9%
486 360 Bosworth CON 573 303 876 2.1% 1.6% 1.9%
487 361 Grantham & Stamford CON 636 267 903 2.3% 1.3% 1.9%
488 362 Stevenage LAB 627 249 876 2.3% 1.3% 1.9%
489 363 Taunton * CON 684 255 939 2.4% 1.2% 1.9%
490 364 Carshalton & Wallington LD 646 242 888 2.4% 1.2% 1.9%
491 365 Billericay CON 674 260 934 2.2% 1.3% 1.9%
492 366 South Derbyshire LAB 715 265 980 2.3% 1.2% 1.9%
493 367 South Dorset LAB 582 194 776 2.3% 1.1% 1.8%
494 368 Lichfield CON 537 238 775 2.1% 1.4% 1.8%
496 369 Epping Forest CON 580 289 869 2.0% 1.4% 1.8%
497 370 Orpington CON 650 289 939 2.1% 1.3% 1.8%
498 371 Lewes LD 447 178 625 2.2% 1.2% 1.8%
499 372 Bromley & Chislehurst CON 582 245 827 2.1% 1.2% 1.8%
500 373 Kettering LAB 654 266 920 2.2% 1.2% 1.8%
501 374 Cambridge LAB 755 223 978 2.4% 0.9% 1.8%
502 375 Bath *> LD 562 238 800 2.2% 1.2% 1.8%
503 376 Ryedale CON 474 210 684 2.0% 1.3% 1.7%
504 377 Broxbourne CON 527 248 775 2.0% 1.3% 1.7%
505 378 Colchester LD 668 265 933 2.1% 1.2% 1.7%
506 379 West Derbyshire CON 582 227 809 2.1% 1.2% 1.7%
507 380 Braintree LAB 600 277 877 2.0% 1.4% 1.7%
508 381 Richmond CON 519 270 789 1.9% 1.4% 1.7%
509 382 Watford LAB 697 254 951 2.2% 1.1% 1.7%
510 383 Altrincham & Sale West CON 592 188 780 2.2% 1.0% 1.7%
511 384 Ludlow LD 465 187 652 2.0% 1.2% 1.7%
512 385 Ashford CON 606 230 836 2.1% 1.1% 1.7%
513 386 Pudsey LAB 593 238 831 2.1% 1.1% 1.7%
514 387 Castle Point CON 513 198 711 2.0% 1.2% 1.7%
515 388 North East Milton Keynes LAB 646 263 909 2.1% 1.1% 1.7%
516 389 Congleton CON 543 202 745 2.1% 1.1% 1.7%
517 390 Hazel Grove LD 538 172 710 2.2% 0.9% 1.7%
518 391 Elmet LAB 644 166 810 2.3% 0.8% 1.7%

RESEARCH PAPER 01/68
29
III Residence-based unemployment rates, July 2001ranked listing of constituencies by country
A. England (not seasonally adjusted)Rank by overall
unemployment rate Claimants Rate
UK Eng Wal Sco NI Party Male Female All Male Female All519 392 Suffolk Coastal CON 613 212 825 2.1% 1.0% 1.7%
520 393 Dartford LAB 587 236 823 2.0% 1.2% 1.7%
521 394 Leominster <* LAB 470 198 668 2.0% 1.2% 1.7%
522 395 Sleaford & North Hykeham CON 515 218 733 2.0% 1.2% 1.6%
523 396 Brentford & Isleworth LAB 674 321 995 2.0% 1.2% 1.6%
524 397 South West Norfolk CON 582 278 860 1.9% 1.3% 1.6%
525 398 North Swindon LAB 569 210 779 2.0% 1.0% 1.6%
526 399 Solihull CON 582 254 836 2.0% 1.1% 1.6%
527 400 South Suffolk CON 479 176 655 2.0% 1.0% 1.6%
528 401 South West Bedfordshire CON 553 232 785 1.9% 1.1% 1.6%
529 402 Rushcliffe CON 620 221 841 2.0% 1.0% 1.6%
530 403 Hemel Hempstead LAB 564 222 786 2.0% 1.1% 1.6%
531 404 Croydon South CON 623 246 869 2.0% 1.1% 1.6%
532 405 Tiverton & Honiton CON 511 225 736 1.9% 1.1% 1.6%
533 406 South Ribble LAB 578 181 759 2.1% 0.9% 1.6%
534 407 Bexhill & Battle CON 412 161 573 2.0% 1.0% 1.6%
535 408 Yeovil * LD 564 191 755 2.0% 1.0% 1.6%
537 409 Penrith & The Border CON 442 228 670 1.7% 1.3% 1.6%
538 410 Uxbridge CON 494 195 689 1.9% 1.0% 1.6%
539 411 North West Cambridgeshire CON 592 199 791 2.0% 0.9% 1.5%
540 412 Bognor Regis & Littlehampton CON 463 164 627 2.0% 0.9% 1.5%
541 413 Mid Norfolk CON 514 221 735 1.8% 1.1% 1.5%
542 414 Tewkesbury CON 498 216 714 1.8% 1.1% 1.5%
543 415 Bury St Edmunds CON 510 232 742 1.8% 1.1% 1.5%
544 416 Tatton CON 446 155 601 1.9% 0.9% 1.5%
545 417 Kingston & Surbiton LD 632 245 877 1.9% 1.0% 1.5%
546 418 South Norfolk CON 499 247 746 1.7% 1.2% 1.5%
547 419 Richmond Park LD 615 257 872 1.8% 1.0% 1.5%
548 420 Wimbledon LAB 515 223 738 1.8% 1.1% 1.5%
549 421 Fylde CON 496 166 662 1.9% 0.9% 1.5%
550 422 Reading West LAB 640 155 795 2.1% 0.7% 1.5%
551 423 Hertsmere CON 506 191 697 1.8% 1.0% 1.5%
552 424 Reading East LAB 625 205 830 1.9% 0.9% 1.5%
553 425 Mid Worcestershire CON 479 187 666 1.8% 1.0% 1.5%
554 426 Westbury CON 470 246 716 1.7% 1.2% 1.5%
555 427 Kingswood LAB 583 201 784 1.9% 0.9% 1.5%
556 428 Maldon & East Chelmsford CON 441 192 633 1.7% 1.1% 1.5%
557 429 Daventry CON 532 310 842 1.6% 1.3% 1.5%
558 430 Stone CON 418 226 644 1.6% 1.2% 1.5%
559 431 Skipton & Ripon CON 464 201 665 1.8% 1.0% 1.4%
560 432 Charnwood CON 545 213 758 1.8% 0.9% 1.4%
562 433 Rayleigh CON 436 198 634 1.6% 1.1% 1.4%
563 434 Harrogate & Knaresborough LD 467 149 616 1.9% 0.7% 1.4%
564 435 Old Bexley & Sidcup CON 386 226 612 1.5% 1.2% 1.4%
565 436 Faversham & Mid Kent CON 455 170 625 1.7% 0.9% 1.4%
566 437 South Holland & The Deepings CON 423 183 606 1.6% 1.0% 1.4%
567 438 Ruislip - Northwood CON 410 189 599 1.7% 1.0% 1.4%
568 439 West Chelmsford CON 478 228 706 1.6% 1.1% 1.4%
569 440 Macclesfield CON 507 142 649 1.9% 0.7% 1.4%
570 441 Gosport CON 462 165 627 1.8% 0.8% 1.4%
571 442 East Devon CON 355 141 496 1.7% 0.9% 1.4%
572 443 Maidstone & The Weald CON 509 176 685 1.8% 0.8% 1.4%
573 444 West Worcestershire CON 398 159 557 1.7% 0.9% 1.4%
574 445 Poole CON 408 129 537 1.7% 0.8% 1.3%
575 446 Blaby CON 447 209 656 1.6% 1.0% 1.3%
576 447 Twickenham LD 559 223 782 1.6% 0.9% 1.3%
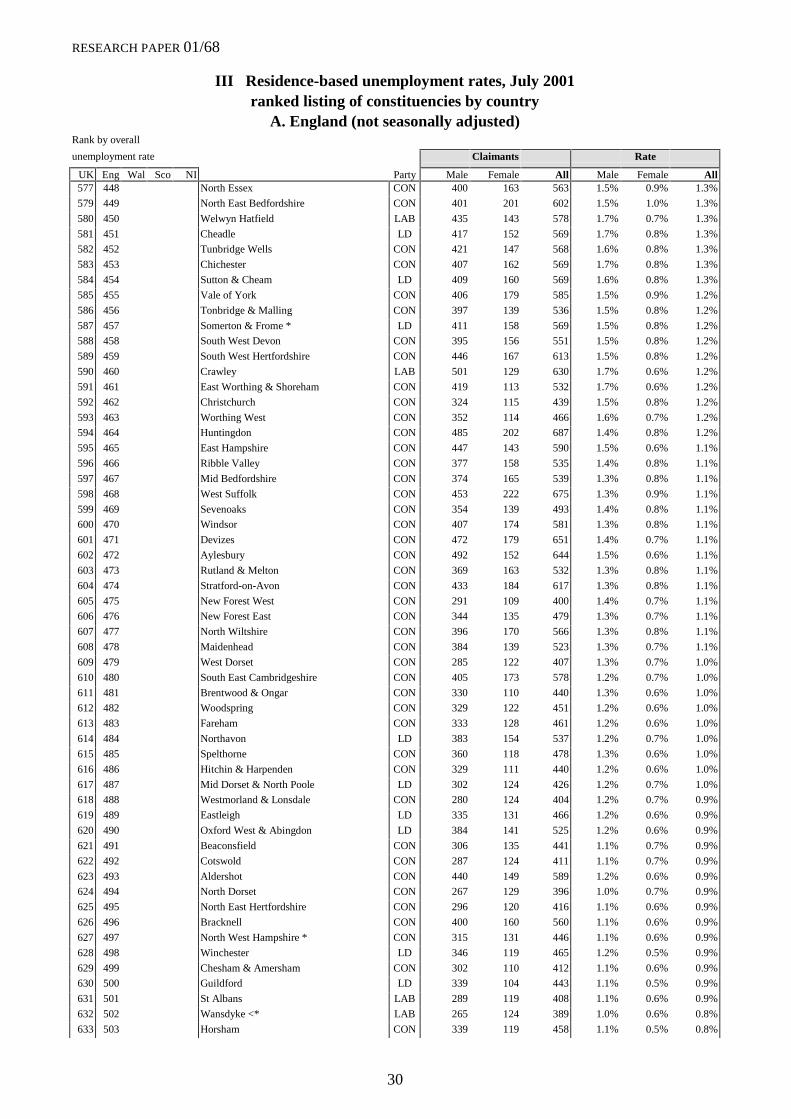
RESEARCH PAPER 01/68
30
III Residence-based unemployment rates, July 2001ranked listing of constituencies by country
A. England (not seasonally adjusted)Rank by overall
unemployment rate Claimants Rate
UK Eng Wal Sco NI Party Male Female All Male Female All577 448 North Essex CON 400 163 563 1.5% 0.9% 1.3%
579 449 North East Bedfordshire CON 401 201 602 1.5% 1.0% 1.3%
580 450 Welwyn Hatfield LAB 435 143 578 1.7% 0.7% 1.3%
581 451 Cheadle LD 417 152 569 1.7% 0.8% 1.3%
582 452 Tunbridge Wells CON 421 147 568 1.6% 0.8% 1.3%
583 453 Chichester CON 407 162 569 1.7% 0.8% 1.3%
584 454 Sutton & Cheam LD 409 160 569 1.6% 0.8% 1.3%
585 455 Vale of York CON 406 179 585 1.5% 0.9% 1.2%
586 456 Tonbridge & Malling CON 397 139 536 1.5% 0.8% 1.2%
587 457 Somerton & Frome * LD 411 158 569 1.5% 0.8% 1.2%
588 458 South West Devon CON 395 156 551 1.5% 0.8% 1.2%
589 459 South West Hertfordshire CON 446 167 613 1.5% 0.8% 1.2%
590 460 Crawley LAB 501 129 630 1.7% 0.6% 1.2%
591 461 East Worthing & Shoreham CON 419 113 532 1.7% 0.6% 1.2%
592 462 Christchurch CON 324 115 439 1.5% 0.8% 1.2%
593 463 Worthing West CON 352 114 466 1.6% 0.7% 1.2%
594 464 Huntingdon CON 485 202 687 1.4% 0.8% 1.2%
595 465 East Hampshire CON 447 143 590 1.5% 0.6% 1.1%
596 466 Ribble Valley CON 377 158 535 1.4% 0.8% 1.1%
597 467 Mid Bedfordshire CON 374 165 539 1.3% 0.8% 1.1%
598 468 West Suffolk CON 453 222 675 1.3% 0.9% 1.1%
599 469 Sevenoaks CON 354 139 493 1.4% 0.8% 1.1%
600 470 Windsor CON 407 174 581 1.3% 0.8% 1.1%
601 471 Devizes CON 472 179 651 1.4% 0.7% 1.1%
602 472 Aylesbury CON 492 152 644 1.5% 0.6% 1.1%
603 473 Rutland & Melton CON 369 163 532 1.3% 0.8% 1.1%
604 474 Stratford-on-Avon CON 433 184 617 1.3% 0.8% 1.1%
605 475 New Forest West CON 291 109 400 1.4% 0.7% 1.1%
606 476 New Forest East CON 344 135 479 1.3% 0.7% 1.1%
607 477 North Wiltshire CON 396 170 566 1.3% 0.8% 1.1%
608 478 Maidenhead CON 384 139 523 1.3% 0.7% 1.1%
609 479 West Dorset CON 285 122 407 1.3% 0.7% 1.0%
610 480 South East Cambridgeshire CON 405 173 578 1.2% 0.7% 1.0%
611 481 Brentwood & Ongar CON 330 110 440 1.3% 0.6% 1.0%
612 482 Woodspring CON 329 122 451 1.2% 0.6% 1.0%
613 483 Fareham CON 333 128 461 1.2% 0.6% 1.0%
614 484 Northavon LD 383 154 537 1.2% 0.7% 1.0%
615 485 Spelthorne CON 360 118 478 1.3% 0.6% 1.0%
616 486 Hitchin & Harpenden CON 329 111 440 1.2% 0.6% 1.0%
617 487 Mid Dorset & North Poole LD 302 124 426 1.2% 0.7% 1.0%
618 488 Westmorland & Lonsdale CON 280 124 404 1.2% 0.7% 0.9%
619 489 Eastleigh LD 335 131 466 1.2% 0.6% 0.9%
620 490 Oxford West & Abingdon LD 384 141 525 1.2% 0.6% 0.9%
621 491 Beaconsfield CON 306 135 441 1.1% 0.7% 0.9%
622 492 Cotswold CON 287 124 411 1.1% 0.7% 0.9%
623 493 Aldershot CON 440 149 589 1.2% 0.6% 0.9%
624 494 North Dorset CON 267 129 396 1.0% 0.7% 0.9%
625 495 North East Hertfordshire CON 296 120 416 1.1% 0.6% 0.9%
626 496 Bracknell CON 400 160 560 1.1% 0.6% 0.9%
627 497 North West Hampshire * CON 315 131 446 1.1% 0.6% 0.9%
628 498 Winchester LD 346 119 465 1.2% 0.5% 0.9%
629 499 Chesham & Amersham CON 302 110 412 1.1% 0.6% 0.9%
630 500 Guildford LD 339 104 443 1.1% 0.5% 0.9%
631 501 St Albans LAB 289 119 408 1.1% 0.6% 0.9%
632 502 Wansdyke <* LAB 265 124 389 1.0% 0.6% 0.8%
633 503 Horsham CON 339 119 458 1.1% 0.5% 0.8%

RESEARCH PAPER 01/68
31
III Residence-based unemployment rates, July 2001ranked listing of constituencies by country
A. England (not seasonally adjusted)Rank by overall
unemployment rate Claimants Rate
UK Eng Wal Sco NI Party Male Female All Male Female All634 504 Basingstoke * CON 352 134 486 1.1% 0.5% 0.8%
635 505 Salisbury CON 343 115 458 1.1% 0.5% 0.8%
636 506 Banbury CON 345 156 501 1.0% 0.6% 0.8%
637 507 Newbury LD 306 128 434 1.0% 0.6% 0.8%
638 508 Wealden CON 293 127 420 1.0% 0.6% 0.8%
639 509 Arundel & South Downs CON 242 87 329 1.0% 0.5% 0.8%
640 510 Romsey LD 277 91 368 1.0% 0.5% 0.8%
641 511 Saffron Walden CON 297 122 419 1.0% 0.6% 0.8%
642 512 Mid Sussex CON 279 103 382 1.0% 0.5% 0.8%
643 513 South Cambridgeshire CON 282 115 397 1.0% 0.5% 0.8%
644 514 Buckingham CON 247 100 347 0.9% 0.5% 0.8%
645 515 Wantage CON 252 138 390 0.8% 0.7% 0.8%
646 516 South West Surrey CON 263 95 358 1.0% 0.5% 0.8%
647 517 Runnymede & Weybridge CON 275 115 390 0.9% 0.5% 0.8%
648 518 Henley CON 243 102 345 0.9% 0.5% 0.8%
649 519 Hertford & Stortford CON 279 110 389 0.9% 0.5% 0.7%
650 520 Epsom & Ewell CON 264 99 363 0.9% 0.5% 0.7%
651 521 Esher & Walton CON 282 97 379 0.9% 0.4% 0.7%
652 522 Wokingham CON 237 96 333 0.8% 0.5% 0.7%
653 523 Reigate CON 190 82 272 0.7% 0.4% 0.6%
654 524 East Surrey CON 243 77 320 0.8% 0.3% 0.6%
655 525 Woking CON 241 80 321 0.8% 0.4% 0.6%
656 526 North East Hampshire CON 229 85 314 0.7% 0.4% 0.6%
657 527 Surrey Heath CON 225 85 310 0.7% 0.4% 0.6%
658 528 Witney CON 209 87 296 0.7% 0.4% 0.5%
659 529 Mole Valley CON 166 63 229 0.6% 0.3% 0.5%
England 573,351 188,918 762,269 4.0% 1.9% 3.1%
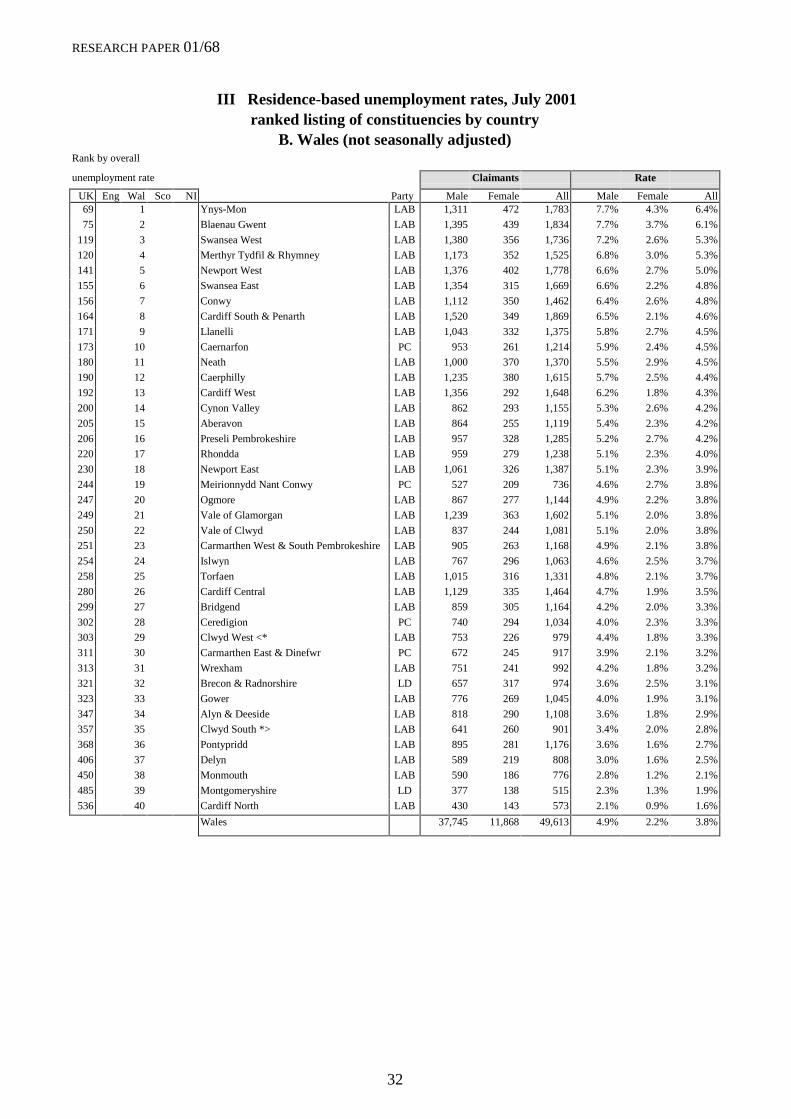
RESEARCH PAPER 01/68
32
III Residence-based unemployment rates, July 2001ranked listing of constituencies by country
B. Wales (not seasonally adjusted)Rank by overall
unemployment rate Claimants Rate
UK Eng Wal Sco NI Party Male Female All Male Female All69 1 Ynys-Mon LAB 1,311 472 1,783 7.7% 4.3% 6.4%
75 2 Blaenau Gwent LAB 1,395 439 1,834 7.7% 3.7% 6.1%
119 3 Swansea West LAB 1,380 356 1,736 7.2% 2.6% 5.3%
120 4 Merthyr Tydfil & Rhymney LAB 1,173 352 1,525 6.8% 3.0% 5.3%
141 5 Newport West LAB 1,376 402 1,778 6.6% 2.7% 5.0%
155 6 Swansea East LAB 1,354 315 1,669 6.6% 2.2% 4.8%
156 7 Conwy LAB 1,112 350 1,462 6.4% 2.6% 4.8%
164 8 Cardiff South & Penarth LAB 1,520 349 1,869 6.5% 2.1% 4.6%
171 9 Llanelli LAB 1,043 332 1,375 5.8% 2.7% 4.5%
173 10 Caernarfon PC 953 261 1,214 5.9% 2.4% 4.5%
180 11 Neath LAB 1,000 370 1,370 5.5% 2.9% 4.5%
190 12 Caerphilly LAB 1,235 380 1,615 5.7% 2.5% 4.4%
192 13 Cardiff West LAB 1,356 292 1,648 6.2% 1.8% 4.3%
200 14 Cynon Valley LAB 862 293 1,155 5.3% 2.6% 4.2%
205 15 Aberavon LAB 864 255 1,119 5.4% 2.3% 4.2%
206 16 Preseli Pembrokeshire LAB 957 328 1,285 5.2% 2.7% 4.2%
220 17 Rhondda LAB 959 279 1,238 5.1% 2.3% 4.0%
230 18 Newport East LAB 1,061 326 1,387 5.1% 2.3% 3.9%
244 19 Meirionnydd Nant Conwy PC 527 209 736 4.6% 2.7% 3.8%
247 20 Ogmore LAB 867 277 1,144 4.9% 2.2% 3.8%
249 21 Vale of Glamorgan LAB 1,239 363 1,602 5.1% 2.0% 3.8%
250 22 Vale of Clwyd LAB 837 244 1,081 5.1% 2.0% 3.8%
251 23 Carmarthen West & South Pembrokeshire LAB 905 263 1,168 4.9% 2.1% 3.8%
254 24 Islwyn LAB 767 296 1,063 4.6% 2.5% 3.7%
258 25 Torfaen LAB 1,015 316 1,331 4.8% 2.1% 3.7%
280 26 Cardiff Central LAB 1,129 335 1,464 4.7% 1.9% 3.5%
299 27 Bridgend LAB 859 305 1,164 4.2% 2.0% 3.3%
302 28 Ceredigion PC 740 294 1,034 4.0% 2.3% 3.3%
303 29 Clwyd West <* LAB 753 226 979 4.4% 1.8% 3.3%
311 30 Carmarthen East & Dinefwr PC 672 245 917 3.9% 2.1% 3.2%
313 31 Wrexham LAB 751 241 992 4.2% 1.8% 3.2%
321 32 Brecon & Radnorshire LD 657 317 974 3.6% 2.5% 3.1%
323 33 Gower LAB 776 269 1,045 4.0% 1.9% 3.1%
347 34 Alyn & Deeside LAB 818 290 1,108 3.6% 1.8% 2.9%
357 35 Clwyd South *> LAB 641 260 901 3.4% 2.0% 2.8%
368 36 Pontypridd LAB 895 281 1,176 3.6% 1.6% 2.7%
406 37 Delyn LAB 589 219 808 3.0% 1.6% 2.5%
450 38 Monmouth LAB 590 186 776 2.8% 1.2% 2.1%
485 39 Montgomeryshire LD 377 138 515 2.3% 1.3% 1.9%
536 40 Cardiff North LAB 430 143 573 2.1% 0.9% 1.6%
Wales 37,745 11,868 49,613 4.9% 2.2% 3.8%

RESEARCH PAPER 01/68
33
III Residence-based unemployment rates, July 2001ranked listing of constituencies by country
C. Scotland (not seasonally adjusted)Rank by overall
unemployment rate Claimants Rate
UK Eng Wal Sco NI Party Male Female All Male Female All18 1 Glasgow Springburn SPKR 1,963 499 2,462 11.9% 4.0% 8.5%
19 2 Cunninghame South LAB 1,953 667 2,620 11.1% 5.1% 8.5%
26 3 Glasgow Pollok LAB 1,569 328 1,897 11.6% 3.2% 7.9%
27 4 Dundee East LAB 2,249 600 2,849 11.0% 3.8% 7.9%
34 5 Glasgow Maryhill LAB 1,901 533 2,434 10.3% 3.9% 7.6%
35 6 Kirkcaldy LAB 1,829 532 2,361 10.2% 4.0% 7.6%
37 7 Glasgow Baillieston LAB 1,602 438 2,040 10.0% 3.6% 7.3%
40 8 Glasgow Anniesland LAB 1,442 302 1,744 10.7% 2.8% 7.2%
53 9 Central Fife LAB 1,795 618 2,413 8.9% 4.1% 6.8%
61 10 Glasgow Shettleston LAB 1,730 426 2,156 8.9% 3.2% 6.6%
65 11 Glasgow Govan LAB 1,659 455 2,114 8.6% 3.4% 6.5%
66 12 Motherwell & Wishaw LAB 1,342 458 1,800 8.2% 3.9% 6.4%
67 13 Dundee West LAB 1,819 523 2,342 9.0% 3.2% 6.4%
83 14 Kilmarnock & Loudoun LAB 1,725 628 2,353 7.6% 3.8% 6.0%
86 15 Cunninghame North LAB 1,467 520 1,987 7.4% 3.8% 5.9%
89 16 Airdrie & Shotts LAB 1,454 482 1,936 7.5% 3.6% 5.9%
93 17 Carrick, Cumnock & Doon Valley LAB 1,685 571 2,256 7.4% 3.5% 5.7%
94 18 Dumbarton LAB 1,583 517 2,100 7.3% 3.4% 5.7%
98 19 Greenock & Inverclyde LAB 1,295 358 1,653 7.8% 2.8% 5.7%
101 20 Ayr LAB 1,341 428 1,769 7.3% 3.2% 5.6%
102 21 Western Isles LAB 573 149 722 7.1% 3.0% 5.5%
106 22 Clydebank & Milngavie LAB 1,311 380 1,691 7.4% 2.8% 5.5%
107 23 Caithness, Sutherland & Easter Ross LD 1,081 264 1,345 7.2% 2.7% 5.4%
111 24 Glasgow Kelvin LAB 1,623 494 2,117 7.3% 2.9% 5.4%
117 25 Dunfermline West LAB 1,169 371 1,540 7.0% 3.0% 5.3%
118 26 Hamilton North & Bellshill LAB 1,464 463 1,927 6.9% 3.1% 5.3%
122 27 Coatbridge & Chryston LAB 1,260 369 1,629 7.0% 2.8% 5.2%
124 28 Falkirk West LAB 1,222 396 1,618 6.9% 3.0% 5.2%
125 29 Glasgow Cathcart LAB 1,130 299 1,429 7.2% 2.5% 5.2%
126 30 Angus SNP 1,237 531 1,768 6.2% 3.7% 5.2%
131 31 Dunfermline East LAB 1,444 414 1,858 6.8% 2.7% 5.1%
134 32 Paisley North LAB 1,253 334 1,587 7.2% 2.4% 5.1%
143 33 Galloway & Upper Nithsdale CON 1,022 413 1,435 5.9% 3.5% 4.9%
146 34 Hamilton South LAB 1,111 331 1,442 6.5% 2.6% 4.9%
165 35 Paisley South LAB 1,348 340 1,688 6.6% 2.1% 4.6%
194 36 Ross, Skye & Inverness West LD 1,168 349 1,517 5.6% 2.4% 4.3%
195 37 Dumfries LAB 1,250 481 1,731 5.4% 2.7% 4.3%
201 38 Clydesdale LAB 1,147 491 1,638 5.0% 3.0% 4.2%
211 39 Argyll & Bute LD 1,004 277 1,281 5.5% 2.2% 4.1%
225 40 Linlithgow LAB 1,094 327 1,421 5.4% 2.1% 4.0%
229 41 Edinburgh North & Leith LAB 1,254 350 1,604 5.6% 1.9% 3.9%
234 42 Ochil LAB 1,106 410 1,516 5.0% 2.5% 3.9%
245 43 Falkirk East LAB 1,151 349 1,500 5.0% 2.1% 3.8%
252 44 West Renfrewshire LAB 872 256 1,128 5.1% 2.0% 3.7%
259 45 Cumbernauld & Kilsyth LAB 928 325 1,253 4.8% 2.2% 3.7%
263 46 Glasgow Rutherglen LAB 983 260 1,243 5.1% 1.8% 3.6%
275 47 Stirling LAB 821 255 1,076 4.8% 2.0% 3.6%
278 48 Livingston LAB 1,176 418 1,594 4.6% 2.1% 3.5%
307 49 East Kilbride LAB 1,099 354 1,453 4.4% 1.8% 3.3%
325 50 Moray SNP 822 353 1,175 3.5% 2.4% 3.1%
331 51 Edinburgh Central LAB 1,138 360 1,498 4.2% 1.6% 3.0%
332 52 Roxburgh & Berwickshire LD 644 239 883 3.9% 1.9% 3.0%
352 53 Aberdeen Central LAB 880 242 1,122 3.9% 1.4% 2.9%
360 54 Inverness East, Nairn & Lochaber LAB 927 285 1,212 3.7% 1.5% 2.8%
371 55 Edinburgh East & Musselburgh LAB 874 226 1,100 3.9% 1.3% 2.7%

RESEARCH PAPER 01/68
34
III Residence-based unemployment rates, July 2001ranked listing of constituencies by country
C. Scotland (not seasonally adjusted)Rank by overall
unemployment rate Claimants Rate
UK Eng Wal Sco NI Party Male Female All Male Female All376 56 Perth SNP 777 295 1,072 3.5% 1.7% 2.7%
377 57 Strathkelvin & Bearsden LAB 861 315 1,176 3.5% 1.7% 2.7%
382 58 North East Fife LD 663 301 964 3.2% 1.9% 2.7%
383 59 Edinburgh Pentlands LAB 840 246 1,086 3.7% 1.4% 2.7%
385 60 North Tayside SNP 731 319 1,050 3.2% 1.9% 2.6%
393 61 Edinburgh South LAB 741 206 947 3.7% 1.2% 2.6%
422 62 Eastwood LAB 767 257 1,024 3.0% 1.4% 2.3%
430 63 Edinburgh West LD 694 199 893 3.1% 1.2% 2.3%
436 64 Tweeddale, Ettrick & Lauderdale LD 564 200 764 2.9% 1.3% 2.2%
442 65 East Lothian LAB 598 172 770 2.9% 1.2% 2.2%
445 66 Midlothian LAB 544 144 688 3.0% 1.0% 2.2%
459 67 Orkney & Shetland LD 306 132 438 2.3% 1.5% 2.0%
461 68 Banff & Buchan SNP 494 254 748 2.2% 1.7% 2.0%
465 69 Aberdeen North LAB 466 168 634 2.6% 1.2% 2.0%
495 70 Aberdeen South LAB 593 216 809 2.3% 1.1% 1.8%
561 71 Gordon LD 410 203 613 1.6% 1.2% 1.4%
578 72 West Aberdeenshire & Kincardine LD 349 160 509 1.5% 1.0% 1.3%
Scotland 82,387 25,825 108,212 5.7% 2.4% 4.3%

RESEARCH PAPER 01/68
35
III Residence-based unemployment rates, July 2001ranked listing of constituencies by country
D. Northern Ireland (not seasonally adjusted)Rank by overall
unemployment rate Claimants Rate
UK Eng Wal Sco NI Party Male Female All Male Female All2 1 Belfast West SF 3,482 707 4,189 17.4% 4.6% 11.9%
3 2 Foyle SDLP 3,590 1,117 4,707 15.0% 6.6% 11.5%
13 3 Belfast North DU 2,245 539 2,784 12.6% 3.9% 8.8%
17 4 West Tyrone SF 2,070 806 2,876 10.0% 6.2% 8.5%
56 5 East Londonderry DU 1,760 702 2,462 8.2% 4.7% 6.8%
60 6 Newry & Armagh SDLP 1,966 767 2,733 7.9% 4.7% 6.6%
62 7 Fermanagh & South Tyrone SF 1,638 712 2,350 7.5% 5.1% 6.6%
103 8 Belfast South UU 1,618 672 2,290 7.5% 3.4% 5.5%
116 9 South Down SDLP 1,502 683 2,185 6.2% 4.1% 5.3%
145 10 North Antrim DU 1,467 667 2,134 5.7% 3.7% 4.9%
157 11 East Antrim UU 1,480 555 2,035 6.1% 3.0% 4.8%
169 12 Mid Ulster SF 928 583 1,511 4.6% 4.5% 4.6%
186 13 Belfast East DU 1,312 389 1,701 6.3% 2.2% 4.4%
188 14 Upper Bann UU 1,416 539 1,955 5.6% 2.8% 4.4%
212 15 North Down UU 1,129 443 1,572 5.3% 2.6% 4.1%
276 16 Strangford DU 1,103 422 1,525 4.6% 2.3% 3.6%
318 17 South Antrim DU 1,064 472 1,536 3.9% 2.2% 3.2%
404 18 Lagan Valley UU 807 375 1,182 2.9% 1.8% 2.5%
Northern Ireland 30,577 11,150 41,727 7.4% 3.6% 5.8%

RESEARCH PAPER 01/68
36
IV Change in Unemployed Claimants July 1997-2001 and July 2000-2001United Kingdom Constituencies
A. (not seasonally adjusted) - alphabetical listingRank by %
change in UK(largest fall first) Claimants Change Jul 97-01 Change Jul 00-01
00-01 97-01 Party Jul 97 Jul 00 Jul 01 Number Percent Number Percent66 434 Aberavon LAB 1,759 1,418 1,119 -640 -36.4% -299 -21.1%
12 225 Aberdeen Central LAB 2,056 1,606 1,122 -934 -45.4% -484 -30.1%
6 227 Aberdeen North LAB 1,158 937 634 -524 -45.3% -303 -32.3%
15 321 Aberdeen South LAB 1,364 1,145 809 -555 -40.7% -336 -29.3%
351 454 Airdrie & Shotts LAB 2,988 2,189 1,936 -1,052 -35.2% -253 -11.6%
505 154 Aldershot CON 1,151 634 589 -562 -48.8% -45 -7.1%
583 508 Aldridge - Brownhills CON 1,680 1,178 1,131 -549 -32.7% -47 -4.0%
317 214 Altrincham & Sale West CON 1,443 890 780 -663 -45.9% -110 -12.4%
419 614 Alyn & Deeside LAB 1,459 1,229 1,108 -351 -24.1% -121 -9.8%
69 452 Amber Valley LAB 1,936 1,585 1,253 -683 -35.3% -332 -20.9%
252 538 Angus SNP 2,553 2,053 1,768 -785 -30.7% -285 -13.9%
367 550 Argyll & Bute LD 1,830 1,442 1,281 -549 -30.0% -161 -11.2%
276 88 Arundel & South Downs CON 698 380 329 -369 -52.9% -51 -13.4%
634 590 Ashfield LAB 2,731 1,964 1,990 -741 -27.1% 26 1.3%
197 49 Ashford CON 1,909 987 836 -1,073 -56.2% -151 -15.3%
409 457 Ashton under Lyne LAB 2,536 1,827 1,645 -891 -35.1% -182 -10.0%
117 65 Aylesbury CON 1,417 790 644 -773 -54.6% -146 -18.5%
521 580 Ayr LAB 2,439 1,896 1,769 -670 -27.5% -127 -6.7%
349 47 Banbury CON 1,154 567 501 -653 -56.6% -66 -11.6%
1 301 Banff & Buchan SNP 1,283 1,172 748 -535 -41.7% -424 -36.2%
500 243 Barking * LAB 2,646 1,584 1,469 -1,177 -44.5% -115 -7.3%
244 406 Barnsley Central LAB 2,732 1,985 1,706 -1,026 -37.6% -279 -14.1%
148 295 Barnsley East & Mexborough LAB 2,956 2,064 1,712 -1,244 -42.1% -352 -17.1%
156 435 Barnsley West & Penistone LAB 2,236 1,709 1,423 -813 -36.4% -286 -16.7%
120 235 Barrow & Furness LAB 2,752 1,864 1,521 -1,231 -44.7% -343 -18.4%
371 107 Basildon LAB 2,645 1,442 1,283 -1,362 -51.5% -159 -11.0%
57 10 Basingstoke * CON 1,300 622 486 -814 -62.6% -136 -21.9%
625 541 Bassetlaw LAB 2,557 1,771 1,773 -784 -30.7% 2 0.1%
72 3 Bath *> LD 2,395 1,009 800 -1,595 -66.6% -209 -20.7%
387 326 Batley & Spen LAB 2,130 1,420 1,269 -861 -40.4% -151 -10.6%
611 207 Battersea LAB 3,622 1,989 1,948 -1,674 -46.2% -41 -2.1%
382 188 Beaconsfield CON 832 494 441 -391 -47.0% -53 -10.7%
216 247 Beckenham CON 2,500 1,630 1,390 -1,110 -44.4% -240 -14.7%
653 553 Bedford LAB 2,643 1,728 1,853 -790 -29.9% 125 7.2%
392 297 Belfast East DU 2,928 1,901 1,701 -1,227 -41.9% -200 -10.5%
526 479 Belfast North DU 4,220 2,977 2,784 -1,436 -34.0% -193 -6.5%
453 179 Belfast South UU 4,337 2,508 2,290 -2,047 -47.2% -218 -8.7%
488 595 Belfast West SF 5,688 4,534 4,189 -1,499 -26.4% -345 -7.6%
145 461 Berwick-upon-Tweed LD 1,743 1,370 1,133 -610 -35.0% -237 -17.3%
458 592 Bethnal Green & Bow LAB 6,425 5,128 4,688 -1,737 -27.0% -440 -8.6%
573 598 Beverley & Holderness CON 1,957 1,519 1,450 -507 -25.9% -69 -4.5%
26 105 Bexhill & Battle CON 1,185 772 573 -612 -51.6% -199 -25.8%
210 62 Bexleyheath & Crayford LAB 1,802 958 816 -986 -54.7% -142 -14.8%
204 100 Billericay CON 1,936 1,100 934 -1,002 -51.8% -166 -15.1%
253 399 Birkenhead LAB 4,819 3,480 2,998 -1,821 -37.8% -482 -13.9%
256 546 Birmingham, Edgbaston LAB 3,431 2,778 2,395 -1,036 -30.2% -383 -13.8%
303 509 Birmingham, Erdington LAB 4,018 3,101 2,707 -1,311 -32.6% -394 -12.7%
391 565 Birmingham, Hall Green LAB 2,624 2,076 1,857 -767 -29.2% -219 -10.5%
384 607 Birmingham, Hodge Hill LAB 3,591 3,007 2,685 -906 -25.2% -322 -10.7%
455 633 Birmingham, Ladywood LAB 8,111 7,032 6,423 -1,688 -20.8% -609 -8.7%
355 608 Birmingham, Northfield LAB 2,518 2,125 1,884 -634 -25.2% -241 -11.3%
507 621 Birmingham, Perry Barr LAB 4,203 3,464 3,219 -984 -23.4% -245 -7.1%
219 473 Birmingham, Selly Oak LAB 3,486 2,685 2,293 -1,193 -34.2% -392 -14.6%
227 585 Birmingham, Sparkbrook & Small Heath LAB 7,080 6,020 5,152 -1,928 -27.2% -868 -14.4%
142 600 Birmingham, Yardley LAB 2,377 2,134 1,762 -615 -25.9% -372 -17.4%

RESEARCH PAPER 01/68
37
IV Change in Unemployed Claimants July 1997-2001 and July 2000-2001United Kingdom Constituencies
A. (not seasonally adjusted) - alphabetical listingRank by %
change in UK(largest fall first) Claimants Change Jul 97-01 Change Jul 00-01
00-01 97-01 Party Jul 97 Jul 00 Jul 01 Number Percent Number Percent264 573 Bishop Auckland LAB 2,474 2,048 1,769 -705 -28.5% -279 -13.6%
381 526 Blaby CON 959 735 656 -303 -31.6% -79 -10.7%
226 632 Blackburn LAB 2,869 2,653 2,269 -600 -20.9% -384 -14.5%
605 524 Blackpool North & Fleetwood LAB 2,226 1,556 1,519 -707 -31.8% -37 -2.4%
652 502 Blackpool South LAB 2,956 1,869 1,983 -973 -32.9% 114 6.1%
520 578 Blaenau Gwent LAB 2,541 1,966 1,834 -707 -27.8% -132 -6.7%
141 241 Blaydon LAB 2,332 1,568 1,294 -1,038 -44.5% -274 -17.5%
444 569 Blyth Valley LAB 2,549 1,992 1,810 -739 -29.0% -182 -9.1%
109 198 Bognor Regis & Littlehampton CON 1,176 771 627 -549 -46.7% -144 -18.7%
595 604 Bolsover LAB 2,283 1,757 1,698 -585 -25.6% -59 -3.4%
240 576 Bolton North East LAB 2,325 1,951 1,675 -650 -28.0% -276 -14.1%
535 647 Bolton South East LAB 2,423 2,125 1,993 -430 -17.7% -132 -6.2%
200 522 Bolton West LAB 1,218 977 829 -389 -31.9% -148 -15.1%
438 493 Bootle LAB 4,292 3,150 2,856 -1,436 -33.5% -294 -9.3%
354 221 Boston & Skegness CON 1,451 893 790 -661 -45.6% -103 -11.5%
275 658 Bosworth CON 925 1,012 876 -49 -5.3% -136 -13.4%
93 213 Bournemouth East CON 2,061 1,385 1,114 -947 -45.9% -271 -19.6%
11 20 Bournemouth West CON 2,508 1,421 989 -1,519 -60.6% -432 -30.4%
490 181 Bracknell CON 1,060 606 560 -500 -47.2% -46 -7.6%
540 591 Bradford North LAB 3,908 3,028 2,848 -1,060 -27.1% -180 -5.9%
549 582 Bradford South LAB 2,924 2,247 2,125 -799 -27.3% -122 -5.4%
550 603 Bradford West LAB 4,808 3,778 3,573 -1,235 -25.7% -205 -5.4%
471 144 Braintree LAB 1,729 954 877 -852 -49.3% -77 -8.1%
286 626 Brecon & Radnorshire LD 1,245 1,123 974 -271 -21.8% -149 -13.3%
268 174 Brent East LAB 4,878 2,958 2,557 -2,321 -47.6% -401 -13.6%
445 206 Brent North LAB 2,318 1,370 1,245 -1,073 -46.3% -125 -9.1%
85 97 Brent South LAB 5,543 3,312 2,651 -2,892 -52.2% -661 -20.0%
41 1 Brentford & Isleworth LAB 3,015 1,307 995 -2,020 -67.0% -312 -23.9%
572 32 Brentwood & Ongar CON 1,085 461 440 -645 -59.4% -21 -4.6%
246 417 Bridgend LAB 1,847 1,353 1,164 -683 -37.0% -189 -14.0%
61 177 Bridgwater CON 2,193 1,468 1,152 -1,041 -47.5% -316 -21.5%
422 400 Brigg & Goole LAB 2,004 1,383 1,248 -756 -37.7% -135 -9.8%
32 106 Brighton, Kemptown LAB 3,615 2,323 1,749 -1,866 -51.6% -574 -24.7%
20 77 Brighton, Pavilion LAB 4,688 2,979 2,166 -2,522 -53.8% -813 -27.3%
346 245 Bristol East LAB 3,448 2,169 1,915 -1,533 -44.5% -254 -11.7%
337 91 Bristol North West LAB 2,495 1,342 1,182 -1,313 -52.6% -160 -11.9%
132 75 Bristol South LAB 3,512 1,974 1,619 -1,893 -53.9% -355 -18.0%
144 123 Bristol West LAB 3,523 2,130 1,760 -1,763 -50.0% -370 -17.4%
284 133 Bromley & Chislehurst CON 1,641 954 827 -814 -49.6% -127 -13.3%
202 352 Bromsgrove CON 1,599 1,144 971 -628 -39.3% -173 -15.1%
81 136 Broxbourne CON 1,534 971 775 -759 -49.5% -196 -20.2%
231 307 Broxtowe LAB 1,774 1,214 1,040 -734 -41.4% -174 -14.3%
167 149 Buckingham CON 683 414 347 -336 -49.2% -67 -16.2%
552 617 Burnley LAB 1,593 1,279 1,211 -382 -24.0% -68 -5.3%
172 309 Burton LAB 2,310 1,616 1,357 -953 -41.3% -259 -16.0%
624 637 Bury North LAB 1,272 1,012 1,013 -259 -20.4% 1 0.1%
433 372 Bury South LAB 1,611 1,089 986 -625 -38.8% -103 -9.5%
440 230 Bury St Edmunds CON 1,350 818 742 -608 -45.0% -76 -9.3%
601 319 Caernarfon PC 2,055 1,249 1,214 -841 -40.9% -35 -2.8%
335 336 Caerphilly LAB 2,691 1,834 1,615 -1,076 -40.0% -219 -11.9%
47 386 Caithness, Sutherland & Easter Ross LD 2,176 1,745 1,345 -831 -38.2% -400 -22.9%
400 458 Calder Valley LAB 2,024 1,464 1,313 -711 -35.1% -151 -10.3%
435 488 Camberwell & Peckham LAB 5,559 4,075 3,690 -1,869 -33.6% -385 -9.4%
97 87 Cambridge LAB 2,077 1,213 978 -1,099 -52.9% -235 -19.4%
377 486 Cannock Chase LAB 1,973 1,469 1,309 -664 -33.7% -160 -10.9%
78 112 Canterbury CON 2,108 1,297 1,033 -1,075 -51.0% -264 -20.4%

RESEARCH PAPER 01/68
38
IV Change in Unemployed Claimants July 1997-2001 and July 2000-2001United Kingdom Constituencies
A. (not seasonally adjusted) - alphabetical listingRank by %
change in UK(largest fall first) Claimants Change Jul 97-01 Change Jul 00-01
00-01 97-01 Party Jul 97 Jul 00 Jul 01 Number Percent Number Percent82 153 Cardiff Central LAB 2,864 1,833 1,464 -1,400 -48.9% -369 -20.1%
8 92 Cardiff North LAB 1,207 833 573 -634 -52.5% -260 -31.2%
272 342 Cardiff South & Penarth LAB 3,109 2,160 1,869 -1,240 -39.9% -291 -13.5%
293 281 Cardiff West LAB 2,890 1,896 1,648 -1,242 -43.0% -248 -13.1%
429 489 Carlisle LAB 2,139 1,570 1,420 -719 -33.6% -150 -9.6%
424 347 Carmarthen East & Dinefwr PC 1,516 1,016 917 -599 -39.5% -99 -9.7%
38 145 Carmarthen West & South Pembrokeshire LAB 2,301 1,542 1,168 -1,133 -49.2% -374 -24.3%
454 606 Carrick, Cumnock & Doon Valley LAB 3,019 2,470 2,256 -763 -25.3% -214 -8.7%
516 117 Carshalton & Wallington LD 1,805 953 888 -917 -50.8% -65 -6.8%
56 25 Castle Point CON 1,782 911 711 -1,071 -60.1% -200 -22.0%
645 646 Central Fife LAB 2,941 2,334 2,413 -528 -18.0% 79 3.4%
568 288 Central Suffolk & North Ipswich CON 1,464 887 846 -618 -42.2% -41 -4.6%
451 460 Ceredigion PC 1,592 1,135 1,034 -558 -35.1% -101 -8.9%
494 537 Charnwood CON 1,095 819 758 -337 -30.8% -61 -7.4%
283 129 Chatham & Aylesford LAB 2,178 1,261 1,093 -1,085 -49.8% -168 -13.3%
487 310 Cheadle LD 968 616 569 -399 -41.2% -47 -7.6%
389 255 Cheltenham LD 2,261 1,416 1,266 -995 -44.0% -150 -10.6%
418 323 Chesham & Amersham CON 694 457 412 -282 -40.6% -45 -9.8%
461 119 Chester, City of LAB 2,035 1,105 1,011 -1,024 -50.3% -94 -8.5%
607 634 Chesterfield LD 2,959 2,401 2,346 -613 -20.7% -55 -2.3%
175 175 Chichester CON 1,085 677 569 -516 -47.6% -108 -16.0%
416 204 Chingford & Woodford Green CON 1,840 1,095 987 -853 -46.4% -108 -9.9%
617 407 Chipping Barnet CON 1,930 1,219 1,207 -723 -37.5% -12 -1.0%
203 414 Chorley LAB 1,663 1,230 1,044 -619 -37.2% -186 -15.1%
27 78 Christchurch CON 946 591 439 -507 -53.6% -152 -25.7%
309 474 Cities of London & Westminster CON 3,299 2,483 2,170 -1,129 -34.2% -313 -12.6%
503 429 Cleethorpes LAB 2,836 1,937 1,799 -1,037 -36.6% -138 -7.1%
546 504 Clwyd South *> LAB 1,341 954 901 -440 -32.8% -53 -5.6%
512 544 Clwyd West <* LAB 1,406 1,052 979 -427 -30.4% -73 -6.9%
519 523 Clydebank & Milngavie LAB 2,484 1,813 1,691 -793 -31.9% -122 -6.7%
525 571 Clydesdale LAB 2,297 1,754 1,638 -659 -28.7% -116 -6.6%
541 525 Coatbridge & Chryston LAB 2,385 1,731 1,629 -756 -31.7% -102 -5.9%
53 66 Colchester LD 2,052 1,200 933 -1,119 -54.5% -267 -22.3%
181 484 Colne Valley LAB 2,006 1,578 1,330 -676 -33.7% -248 -15.7%
473 441 Congleton CON 1,165 810 745 -420 -36.1% -65 -8.0%
336 376 Conwy LAB 2,376 1,660 1,462 -914 -38.5% -198 -11.9%
460 462 Copeland LAB 2,677 1,906 1,743 -934 -34.9% -163 -8.6%
623 531 Corby LAB 1,650 1,132 1,133 -517 -31.3% 1 0.1%
642 199 Cotswold CON 770 400 411 -359 -46.6% 11 2.8%
502 412 Coventry North East LAB 3,800 2,566 2,382 -1,418 -37.3% -184 -7.2%
232 291 Coventry North West LAB 2,760 1,863 1,596 -1,164 -42.2% -267 -14.3%
489 354 Coventry South LAB 2,943 1,936 1,789 -1,154 -39.2% -147 -7.6%
39 82 Crawley LAB 1,347 829 630 -717 -53.2% -199 -24.0%
506 343 Crewe & Nantwich LAB 2,069 1,340 1,245 -824 -39.8% -95 -7.1%
136 267 Crosby LAB 2,209 1,514 1,247 -962 -43.5% -267 -17.6%
306 300 Croydon Central LAB 3,551 2,368 2,069 -1,482 -41.7% -299 -12.6%
596 364 Croydon North LAB 4,908 3,092 2,994 -1,914 -39.0% -98 -3.2%
143 251 Croydon South CON 1,556 1,052 869 -687 -44.2% -183 -17.4%
547 459 Cumbernauld & Kilsyth LAB 1,930 1,326 1,253 -677 -35.1% -73 -5.5%
597 631 Cunninghame North LAB 2,529 2,049 1,987 -542 -21.4% -62 -3.0%
615 657 Cunninghame South LAB 2,954 2,648 2,620 -334 -11.3% -28 -1.1%
135 265 Cynon Valley LAB 2,051 1,404 1,155 -896 -43.7% -249 -17.7%
414 449 Dagenham LAB 2,176 1,558 1,404 -772 -35.5% -154 -9.9%
205 379 Darlington LAB 3,328 2,413 2,050 -1,278 -38.4% -363 -15.0%
153 11 Dartford LAB 2,200 990 823 -1,377 -62.6% -167 -16.9%
659 562 Daventry CON 1,192 694 842 -350 -29.4% 148 21.3%

RESEARCH PAPER 01/68
39
IV Change in Unemployed Claimants July 1997-2001 and July 2000-2001United Kingdom Constituencies
A. (not seasonally adjusted) - alphabetical listingRank by %
change in UK(largest fall first) Claimants Change Jul 97-01 Change Jul 00-01
00-01 97-01 Party Jul 97 Jul 00 Jul 01 Number Percent Number Percent190 371 Delyn LAB 1,321 956 808 -513 -38.8% -148 -15.5%
639 349 Denton & Reddish LAB 1,977 1,172 1,197 -780 -39.5% 25 2.1%
338 383 Derby North LAB 2,863 2,005 1,766 -1,097 -38.3% -239 -11.9%
332 480 Derby South LAB 4,534 3,401 2,992 -1,542 -34.0% -409 -12.0%
212 143 Devizes CON 1,284 764 651 -633 -49.3% -113 -14.8%
380 540 Dewsbury LAB 1,933 1,501 1,339 -594 -30.7% -162 -10.8%
88 114 Don Valley LAB 2,680 1,641 1,315 -1,365 -50.9% -326 -19.9%
399 196 Doncaster Central LAB 4,135 2,456 2,202 -1,933 -46.7% -254 -10.3%
262 201 Doncaster North LAB 3,088 1,917 1,655 -1,433 -46.4% -262 -13.7%
163 89 Dover LAB 2,936 1,663 1,389 -1,547 -52.7% -274 -16.5%
348 613 Dudley North LAB 2,890 2,484 2,194 -696 -24.1% -290 -11.7%
592 651 Dudley South LAB 2,222 1,930 1,862 -360 -16.2% -68 -3.5%
495 366 Dulwich & West Norwood LAB 4,915 3,242 3,002 -1,913 -38.9% -240 -7.4%
476 579 Dumbarton LAB 2,903 2,281 2,100 -803 -27.7% -181 -7.9%
398 594 Dumfries LAB 2,354 1,931 1,731 -623 -26.5% -200 -10.4%
529 609 Dundee East LAB 3,789 3,044 2,849 -940 -24.8% -195 -6.4%
544 557 Dundee West LAB 3,326 2,485 2,342 -984 -29.6% -143 -5.8%
658 599 Dunfermline East LAB 2,507 1,564 1,858 -649 -25.9% 294 18.8%
655 630 Dunfermline West LAB 1,963 1,428 1,540 -423 -21.5% 112 7.8%
51 274 Durham, City of LAB 2,160 1,577 1,223 -937 -43.4% -354 -22.4%
548 256 Ealing North * LAB 3,037 1,800 1,702 -1,335 -44.0% -98 -5.4%
428 381 Ealing Southall LAB 3,816 2,601 2,351 -1,465 -38.4% -250 -9.6%
237 270 Ealing, Acton & Shepherd’s Bush LAB 5,176 3,412 2,925 -2,251 -43.5% -487 -14.3%
564 596 Easington LAB 2,220 1,721 1,639 -581 -26.2% -82 -4.8%
465 533 East Antrim UU 2,954 2,218 2,035 -919 -31.1% -183 -8.3%
24 80 East Devon CON 1,062 674 496 -566 -53.3% -178 -26.4%
270 410 East Ham LAB 5,056 3,663 3,167 -1,889 -37.4% -496 -13.5%
358 58 East Hampshire CON 1,315 665 590 -725 -55.1% -75 -11.3%
281 440 East Kilbride LAB 2,273 1,677 1,453 -820 -36.1% -224 -13.4%
637 445 East Londonderry DU 3,838 2,422 2,462 -1,376 -35.9% 40 1.7%
304 138 East Lothian LAB 1,523 882 770 -753 -49.4% -112 -12.7%
90 7 East Surrey CON 884 399 320 -564 -63.8% -79 -19.8%
19 34 East Worthing & Shoreham CON 1,305 738 532 -773 -59.2% -206 -27.9%
632 622 East Yorkshire CON 2,073 1,593 1,608 -465 -22.4% 15 0.9%
426 330 Eastbourne CON 1,809 1,196 1,080 -729 -40.3% -116 -9.7%
68 70 Eastleigh LD 1,019 590 466 -553 -54.3% -124 -21.0%
155 317 Eastwood LAB 1,737 1,231 1,024 -713 -41.0% -207 -16.8%
432 350 Eccles LAB 2,145 1,436 1,300 -845 -39.4% -136 -9.5%
647 561 Eddisbury CON 1,365 926 964 -401 -29.4% 38 4.1%
508 242 Edinburgh Central LAB 2,699 1,612 1,498 -1,201 -44.5% -114 -7.1%
341 219 Edinburgh East & Musselburgh LAB 2,026 1,248 1,100 -926 -45.7% -148 -11.9%
266 134 Edinburgh North & Leith LAB 3,182 1,856 1,604 -1,578 -49.6% -252 -13.6%
598 233 Edinburgh Pentlands LAB 1,973 1,119 1,086 -887 -45.0% -33 -2.9%
161 68 Edinburgh South LAB 2,079 1,134 947 -1,132 -54.4% -187 -16.5%
427 237 Edinburgh West LD 1,613 988 893 -720 -44.6% -95 -9.6%
403 408 Edmonton LAB 3,685 2,569 2,306 -1,379 -37.4% -263 -10.2%
311 164 Ellesmere Port & Neston LAB 2,011 1,188 1,039 -972 -48.3% -149 -12.5%
131 150 Elmet LAB 1,592 988 810 -782 -49.1% -178 -18.0%
245 250 Eltham LAB 2,625 1,705 1,466 -1,159 -44.2% -239 -14.0%
269 359 Enfield North LAB 2,843 2,001 1,730 -1,113 -39.1% -271 -13.5%
522 419 Enfield, Southgate LAB 2,408 1,630 1,521 -887 -36.8% -109 -6.7%
105 155 Epping Forest CON 1,692 1,072 869 -823 -48.6% -203 -18.9%
49 14 Epsom & Ewell CON 953 469 363 -590 -61.9% -106 -22.6%
174 471 Erewash LAB 2,249 1,755 1,475 -774 -34.4% -280 -16.0%
383 234 Erith & Thamesmead LAB 4,438 2,743 2,449 -1,989 -44.8% -294 -10.7%
99 19 Esher & Walton CON 977 469 379 -598 -61.2% -90 -19.2%
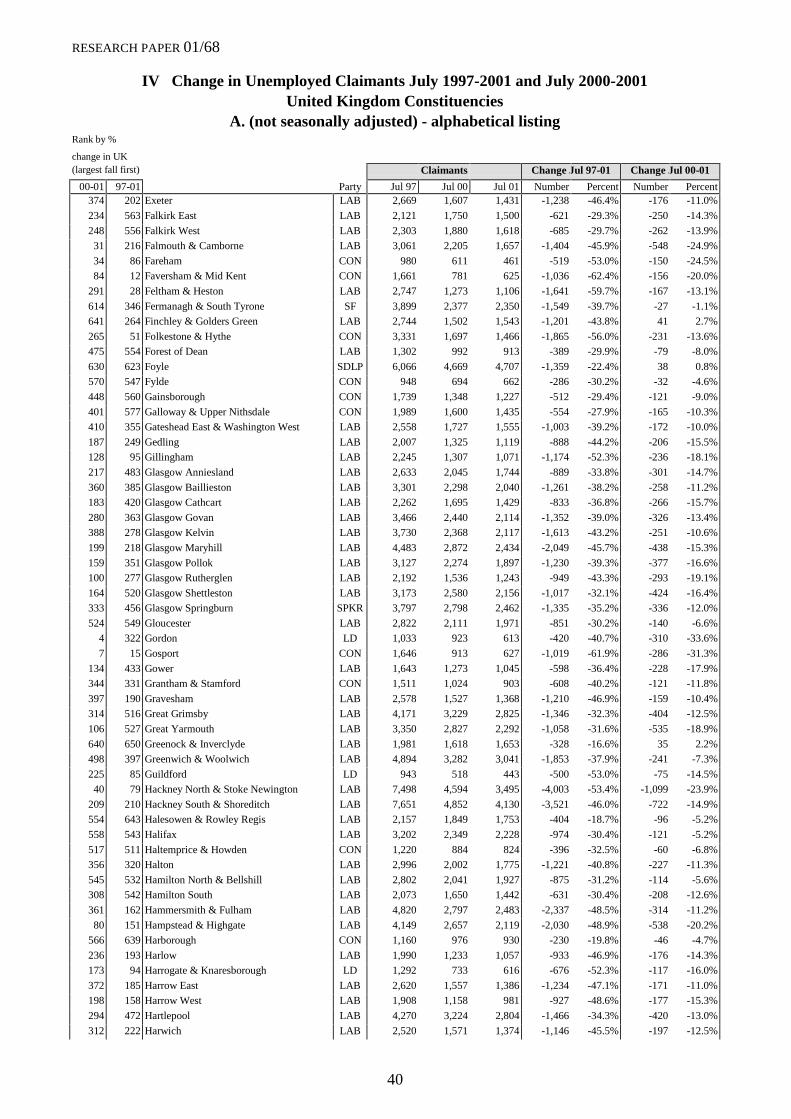
RESEARCH PAPER 01/68
40
IV Change in Unemployed Claimants July 1997-2001 and July 2000-2001United Kingdom Constituencies
A. (not seasonally adjusted) - alphabetical listingRank by %
change in UK(largest fall first) Claimants Change Jul 97-01 Change Jul 00-01
00-01 97-01 Party Jul 97 Jul 00 Jul 01 Number Percent Number Percent374 202 Exeter LAB 2,669 1,607 1,431 -1,238 -46.4% -176 -11.0%
234 563 Falkirk East LAB 2,121 1,750 1,500 -621 -29.3% -250 -14.3%
248 556 Falkirk West LAB 2,303 1,880 1,618 -685 -29.7% -262 -13.9%
31 216 Falmouth & Camborne LAB 3,061 2,205 1,657 -1,404 -45.9% -548 -24.9%
34 86 Fareham CON 980 611 461 -519 -53.0% -150 -24.5%
84 12 Faversham & Mid Kent CON 1,661 781 625 -1,036 -62.4% -156 -20.0%
291 28 Feltham & Heston LAB 2,747 1,273 1,106 -1,641 -59.7% -167 -13.1%
614 346 Fermanagh & South Tyrone SF 3,899 2,377 2,350 -1,549 -39.7% -27 -1.1%
641 264 Finchley & Golders Green LAB 2,744 1,502 1,543 -1,201 -43.8% 41 2.7%
265 51 Folkestone & Hythe CON 3,331 1,697 1,466 -1,865 -56.0% -231 -13.6%
475 554 Forest of Dean LAB 1,302 992 913 -389 -29.9% -79 -8.0%
630 623 Foyle SDLP 6,066 4,669 4,707 -1,359 -22.4% 38 0.8%
570 547 Fylde CON 948 694 662 -286 -30.2% -32 -4.6%
448 560 Gainsborough CON 1,739 1,348 1,227 -512 -29.4% -121 -9.0%
401 577 Galloway & Upper Nithsdale CON 1,989 1,600 1,435 -554 -27.9% -165 -10.3%
410 355 Gateshead East & Washington West LAB 2,558 1,727 1,555 -1,003 -39.2% -172 -10.0%
187 249 Gedling LAB 2,007 1,325 1,119 -888 -44.2% -206 -15.5%
128 95 Gillingham LAB 2,245 1,307 1,071 -1,174 -52.3% -236 -18.1%
217 483 Glasgow Anniesland LAB 2,633 2,045 1,744 -889 -33.8% -301 -14.7%
360 385 Glasgow Baillieston LAB 3,301 2,298 2,040 -1,261 -38.2% -258 -11.2%
183 420 Glasgow Cathcart LAB 2,262 1,695 1,429 -833 -36.8% -266 -15.7%
280 363 Glasgow Govan LAB 3,466 2,440 2,114 -1,352 -39.0% -326 -13.4%
388 278 Glasgow Kelvin LAB 3,730 2,368 2,117 -1,613 -43.2% -251 -10.6%
199 218 Glasgow Maryhill LAB 4,483 2,872 2,434 -2,049 -45.7% -438 -15.3%
159 351 Glasgow Pollok LAB 3,127 2,274 1,897 -1,230 -39.3% -377 -16.6%
100 277 Glasgow Rutherglen LAB 2,192 1,536 1,243 -949 -43.3% -293 -19.1%
164 520 Glasgow Shettleston LAB 3,173 2,580 2,156 -1,017 -32.1% -424 -16.4%
333 456 Glasgow Springburn SPKR 3,797 2,798 2,462 -1,335 -35.2% -336 -12.0%
524 549 Gloucester LAB 2,822 2,111 1,971 -851 -30.2% -140 -6.6%
4 322 Gordon LD 1,033 923 613 -420 -40.7% -310 -33.6%
7 15 Gosport CON 1,646 913 627 -1,019 -61.9% -286 -31.3%
134 433 Gower LAB 1,643 1,273 1,045 -598 -36.4% -228 -17.9%
344 331 Grantham & Stamford CON 1,511 1,024 903 -608 -40.2% -121 -11.8%
397 190 Gravesham LAB 2,578 1,527 1,368 -1,210 -46.9% -159 -10.4%
314 516 Great Grimsby LAB 4,171 3,229 2,825 -1,346 -32.3% -404 -12.5%
106 527 Great Yarmouth LAB 3,350 2,827 2,292 -1,058 -31.6% -535 -18.9%
640 650 Greenock & Inverclyde LAB 1,981 1,618 1,653 -328 -16.6% 35 2.2%
498 397 Greenwich & Woolwich LAB 4,894 3,282 3,041 -1,853 -37.9% -241 -7.3%
225 85 Guildford LD 943 518 443 -500 -53.0% -75 -14.5%
40 79 Hackney North & Stoke Newington LAB 7,498 4,594 3,495 -4,003 -53.4% -1,099 -23.9%
209 210 Hackney South & Shoreditch LAB 7,651 4,852 4,130 -3,521 -46.0% -722 -14.9%
554 643 Halesowen & Rowley Regis LAB 2,157 1,849 1,753 -404 -18.7% -96 -5.2%
558 543 Halifax LAB 3,202 2,349 2,228 -974 -30.4% -121 -5.2%
517 511 Haltemprice & Howden CON 1,220 884 824 -396 -32.5% -60 -6.8%
356 320 Halton LAB 2,996 2,002 1,775 -1,221 -40.8% -227 -11.3%
545 532 Hamilton North & Bellshill LAB 2,802 2,041 1,927 -875 -31.2% -114 -5.6%
308 542 Hamilton South LAB 2,073 1,650 1,442 -631 -30.4% -208 -12.6%
361 162 Hammersmith & Fulham LAB 4,820 2,797 2,483 -2,337 -48.5% -314 -11.2%
80 151 Hampstead & Highgate LAB 4,149 2,657 2,119 -2,030 -48.9% -538 -20.2%
566 639 Harborough CON 1,160 976 930 -230 -19.8% -46 -4.7%
236 193 Harlow LAB 1,990 1,233 1,057 -933 -46.9% -176 -14.3%
173 94 Harrogate & Knaresborough LD 1,292 733 616 -676 -52.3% -117 -16.0%
372 185 Harrow East LAB 2,620 1,557 1,386 -1,234 -47.1% -171 -11.0%
198 158 Harrow West LAB 1,908 1,158 981 -927 -48.6% -177 -15.3%
294 472 Hartlepool LAB 4,270 3,224 2,804 -1,466 -34.3% -420 -13.0%
312 222 Harwich LAB 2,520 1,571 1,374 -1,146 -45.5% -197 -12.5%
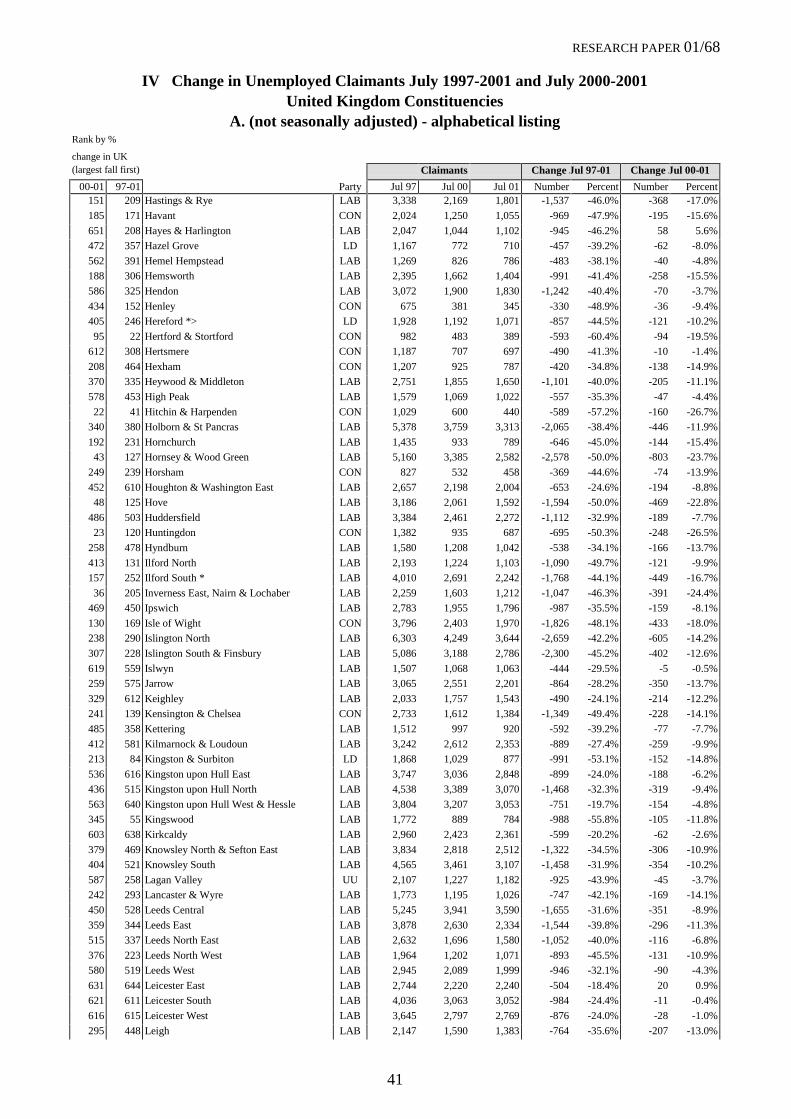
RESEARCH PAPER 01/68
41
IV Change in Unemployed Claimants July 1997-2001 and July 2000-2001United Kingdom Constituencies
A. (not seasonally adjusted) - alphabetical listingRank by %
change in UK(largest fall first) Claimants Change Jul 97-01 Change Jul 00-01
00-01 97-01 Party Jul 97 Jul 00 Jul 01 Number Percent Number Percent151 209 Hastings & Rye LAB 3,338 2,169 1,801 -1,537 -46.0% -368 -17.0%
185 171 Havant CON 2,024 1,250 1,055 -969 -47.9% -195 -15.6%
651 208 Hayes & Harlington LAB 2,047 1,044 1,102 -945 -46.2% 58 5.6%
472 357 Hazel Grove LD 1,167 772 710 -457 -39.2% -62 -8.0%
562 391 Hemel Hempstead LAB 1,269 826 786 -483 -38.1% -40 -4.8%
188 306 Hemsworth LAB 2,395 1,662 1,404 -991 -41.4% -258 -15.5%
586 325 Hendon LAB 3,072 1,900 1,830 -1,242 -40.4% -70 -3.7%
434 152 Henley CON 675 381 345 -330 -48.9% -36 -9.4%
405 246 Hereford *> LD 1,928 1,192 1,071 -857 -44.5% -121 -10.2%
95 22 Hertford & Stortford CON 982 483 389 -593 -60.4% -94 -19.5%
612 308 Hertsmere CON 1,187 707 697 -490 -41.3% -10 -1.4%
208 464 Hexham CON 1,207 925 787 -420 -34.8% -138 -14.9%
370 335 Heywood & Middleton LAB 2,751 1,855 1,650 -1,101 -40.0% -205 -11.1%
578 453 High Peak LAB 1,579 1,069 1,022 -557 -35.3% -47 -4.4%
22 41 Hitchin & Harpenden CON 1,029 600 440 -589 -57.2% -160 -26.7%
340 380 Holborn & St Pancras LAB 5,378 3,759 3,313 -2,065 -38.4% -446 -11.9%
192 231 Hornchurch LAB 1,435 933 789 -646 -45.0% -144 -15.4%
43 127 Hornsey & Wood Green LAB 5,160 3,385 2,582 -2,578 -50.0% -803 -23.7%
249 239 Horsham CON 827 532 458 -369 -44.6% -74 -13.9%
452 610 Houghton & Washington East LAB 2,657 2,198 2,004 -653 -24.6% -194 -8.8%
48 125 Hove LAB 3,186 2,061 1,592 -1,594 -50.0% -469 -22.8%
486 503 Huddersfield LAB 3,384 2,461 2,272 -1,112 -32.9% -189 -7.7%
23 120 Huntingdon CON 1,382 935 687 -695 -50.3% -248 -26.5%
258 478 Hyndburn LAB 1,580 1,208 1,042 -538 -34.1% -166 -13.7%
413 131 Ilford North LAB 2,193 1,224 1,103 -1,090 -49.7% -121 -9.9%
157 252 Ilford South * LAB 4,010 2,691 2,242 -1,768 -44.1% -449 -16.7%
36 205 Inverness East, Nairn & Lochaber LAB 2,259 1,603 1,212 -1,047 -46.3% -391 -24.4%
469 450 Ipswich LAB 2,783 1,955 1,796 -987 -35.5% -159 -8.1%
130 169 Isle of Wight CON 3,796 2,403 1,970 -1,826 -48.1% -433 -18.0%
238 290 Islington North LAB 6,303 4,249 3,644 -2,659 -42.2% -605 -14.2%
307 228 Islington South & Finsbury LAB 5,086 3,188 2,786 -2,300 -45.2% -402 -12.6%
619 559 Islwyn LAB 1,507 1,068 1,063 -444 -29.5% -5 -0.5%
259 575 Jarrow LAB 3,065 2,551 2,201 -864 -28.2% -350 -13.7%
329 612 Keighley LAB 2,033 1,757 1,543 -490 -24.1% -214 -12.2%
241 139 Kensington & Chelsea CON 2,733 1,612 1,384 -1,349 -49.4% -228 -14.1%
485 358 Kettering LAB 1,512 997 920 -592 -39.2% -77 -7.7%
412 581 Kilmarnock & Loudoun LAB 3,242 2,612 2,353 -889 -27.4% -259 -9.9%
213 84 Kingston & Surbiton LD 1,868 1,029 877 -991 -53.1% -152 -14.8%
536 616 Kingston upon Hull East LAB 3,747 3,036 2,848 -899 -24.0% -188 -6.2%
436 515 Kingston upon Hull North LAB 4,538 3,389 3,070 -1,468 -32.3% -319 -9.4%
563 640 Kingston upon Hull West & Hessle LAB 3,804 3,207 3,053 -751 -19.7% -154 -4.8%
345 55 Kingswood LAB 1,772 889 784 -988 -55.8% -105 -11.8%
603 638 Kirkcaldy LAB 2,960 2,423 2,361 -599 -20.2% -62 -2.6%
379 469 Knowsley North & Sefton East LAB 3,834 2,818 2,512 -1,322 -34.5% -306 -10.9%
404 521 Knowsley South LAB 4,565 3,461 3,107 -1,458 -31.9% -354 -10.2%
587 258 Lagan Valley UU 2,107 1,227 1,182 -925 -43.9% -45 -3.7%
242 293 Lancaster & Wyre LAB 1,773 1,195 1,026 -747 -42.1% -169 -14.1%
450 528 Leeds Central LAB 5,245 3,941 3,590 -1,655 -31.6% -351 -8.9%
359 344 Leeds East LAB 3,878 2,630 2,334 -1,544 -39.8% -296 -11.3%
515 337 Leeds North East LAB 2,632 1,696 1,580 -1,052 -40.0% -116 -6.8%
376 223 Leeds North West LAB 1,964 1,202 1,071 -893 -45.5% -131 -10.9%
580 519 Leeds West LAB 2,945 2,089 1,999 -946 -32.1% -90 -4.3%
631 644 Leicester East LAB 2,744 2,220 2,240 -504 -18.4% 20 0.9%
621 611 Leicester South LAB 4,036 3,063 3,052 -984 -24.4% -11 -0.4%
616 615 Leicester West LAB 3,645 2,797 2,769 -876 -24.0% -28 -1.0%
295 448 Leigh LAB 2,147 1,590 1,383 -764 -35.6% -207 -13.0%

RESEARCH PAPER 01/68
42
IV Change in Unemployed Claimants July 1997-2001 and July 2000-2001United Kingdom Constituencies
A. (not seasonally adjusted) - alphabetical listingRank by %
change in UK(largest fall first) Claimants Change Jul 97-01 Change Jul 00-01
00-01 97-01 Party Jul 97 Jul 00 Jul 01 Number Percent Number Percent511 226 Leominster <* LAB 1,224 718 668 -556 -45.4% -50 -7.0%
73 189 Lewes LD 1,179 788 625 -554 -47.0% -163 -20.7%
576 360 Lewisham East LAB 3,212 2,050 1,958 -1,254 -39.0% -92 -4.5%
499 393 Lewisham West LAB 4,137 2,765 2,563 -1,574 -38.0% -202 -7.3%
386 332 Lewisham, Deptford LAB 5,544 3,713 3,317 -2,227 -40.2% -396 -10.7%
180 148 Leyton & Wanstead LAB 4,155 2,504 2,110 -2,045 -49.2% -394 -15.7%
393 442 Lichfield CON 1,210 866 775 -435 -36.0% -91 -10.5%
278 146 Lincoln LAB 3,479 2,039 1,766 -1,713 -49.2% -273 -13.4%
553 652 Linlithgow LAB 1,671 1,500 1,421 -250 -15.0% -79 -5.3%
154 415 Liverpool, Garston LAB 3,632 2,744 2,282 -1,350 -37.2% -462 -16.8%
321 455 Liverpool, Riverside LAB 6,848 5,062 4,439 -2,409 -35.2% -623 -12.3%
406 499 Liverpool, Walton LAB 5,203 3,869 3,477 -1,726 -33.2% -392 -10.1%
158 392 Liverpool, Wavertree LAB 4,972 3,696 3,080 -1,892 -38.1% -616 -16.7%
250 432 Liverpool, West Derby LAB 5,305 3,919 3,374 -1,931 -36.4% -545 -13.9%
622 653 Livingston LAB 1,840 1,597 1,594 -246 -13.4% -3 -0.2%
60 338 Llanelli LAB 2,290 1,758 1,375 -915 -40.0% -383 -21.8%
551 624 Loughborough LAB 1,748 1,434 1,357 -391 -22.4% -77 -5.4%
162 283 Louth & Horncastle CON 1,691 1,159 968 -723 -42.8% -191 -16.5%
277 370 Ludlow LD 1,066 753 652 -414 -38.8% -101 -13.4%
320 276 Luton North LAB 2,209 1,428 1,252 -957 -43.3% -176 -12.3%
579 431 Luton South LAB 3,054 2,030 1,941 -1,113 -36.4% -89 -4.4%
417 168 Macclesfield CON 1,251 720 649 -602 -48.1% -71 -9.9%
364 262 Maidenhead CON 931 589 523 -408 -43.8% -66 -11.2%
288 43 Maidstone & The Weald CON 1,591 789 685 -906 -56.9% -104 -13.2%
260 269 Makerfield LAB 2,161 1,415 1,221 -940 -43.5% -194 -13.7%
127 60 Maldon & East Chelmsford CON 1,406 773 633 -773 -55.0% -140 -18.1%
497 513 Manchester, Blackley LAB 3,609 2,633 2,439 -1,170 -32.4% -194 -7.4%
555 517 Manchester, Central LAB 6,179 4,415 4,187 -1,992 -32.2% -228 -5.2%
510 425 Manchester, Gorton LAB 4,710 3,207 2,982 -1,728 -36.7% -225 -7.0%
316 103 Manchester, Withington LAB 3,855 2,125 1,862 -1,993 -51.7% -263 -12.4%
569 427 Mansfield LAB 2,711 1,800 1,717 -994 -36.7% -83 -4.6%
446 203 Medway LAB 2,471 1,457 1,325 -1,146 -46.4% -132 -9.1%
352 424 Meirionnydd Nant Conwy PC 1,163 832 736 -427 -36.7% -96 -11.5%
168 315 Meriden CON 2,746 1,928 1,617 -1,129 -41.1% -311 -16.1%
83 333 Merthyr Tydfil & Rhymney LAB 2,547 1,907 1,525 -1,022 -40.1% -382 -20.0%
599 345 Mid Bedfordshire CON 895 555 539 -356 -39.8% -16 -2.9%
14 8 Mid Dorset & North Poole LD 1,163 603 426 -737 -63.4% -177 -29.4%
9 50 Mid Norfolk CON 1,674 1,066 735 -939 -56.1% -331 -31.1%
483 83 Mid Sussex CON 815 414 382 -433 -53.1% -32 -7.7%
369 64 Mid Ulster SF 3,325 1,699 1,511 -1,814 -54.6% -188 -11.1%
215 421 Mid Worcestershire CON 1,054 781 666 -388 -36.8% -115 -14.7%
254 574 Middlesbrough LAB 5,573 4,638 3,996 -1,577 -28.3% -642 -13.8%
114 505 Middlesbrough South & East Cleveland LAB 3,441 2,839 2,312 -1,129 -32.8% -527 -18.6%
261 137 Midlothian LAB 1,361 797 688 -673 -49.4% -109 -13.7%
609 260 Milton Keynes South West LAB 1,935 1,109 1,086 -849 -43.9% -23 -2.1%
626 215 Mitcham & Morden LAB 3,058 1,651 1,655 -1,403 -45.9% 4 0.2%
28 9 Mole Valley CON 622 307 229 -393 -63.2% -78 -25.4%
33 197 Monmouth LAB 1,456 1,030 776 -680 -46.7% -254 -24.7%
182 567 Montgomeryshire LD 726 611 515 -211 -29.1% -96 -15.7%
18 280 Moray SNP 2,065 1,632 1,175 -890 -43.1% -457 -28.0%
478 507 Morecambe & Lunesdale LAB 2,532 1,848 1,704 -828 -32.7% -144 -7.8%
191 299 Morley & Rothwell LAB 1,953 1,345 1,137 -816 -41.8% -208 -15.5%
528 597 Motherwell & Wishaw LAB 2,438 1,924 1,800 -638 -26.2% -124 -6.4%
184 570 Neath LAB 1,927 1,624 1,370 -557 -28.9% -254 -15.6%
58 93 New Forest East CON 1,007 613 479 -528 -52.4% -134 -21.9%
52 35 New Forest West CON 975 515 400 -575 -59.0% -115 -22.3%

RESEARCH PAPER 01/68
43
IV Change in Unemployed Claimants July 1997-2001 and July 2000-2001United Kingdom Constituencies
A. (not seasonally adjusted) - alphabetical listingRank by %
change in UK(largest fall first) Claimants Change Jul 97-01 Change Jul 00-01
00-01 97-01 Party Jul 97 Jul 00 Jul 01 Number Percent Number Percent350 365 Newark CON 2,100 1,450 1,282 -818 -39.0% -168 -11.6%
542 178 Newbury LD 824 461 434 -390 -47.3% -27 -5.9%
169 294 Newcastle upon Tyne Central LAB 3,745 2,583 2,168 -1,577 -42.1% -415 -16.1%
64 356 Newcastle upon Tyne East & Wallsend LAB 3,960 3,056 2,409 -1,551 -39.2% -647 -21.2%
112 212 Newcastle upon Tyne North LAB 2,658 1,765 1,436 -1,222 -46.0% -329 -18.6%
509 487 Newcastle-under-Lyme LAB 1,578 1,126 1,047 -531 -33.7% -79 -7.0%
633 467 Newport East LAB 2,126 1,371 1,387 -739 -34.8% 16 1.2%
649 539 Newport West LAB 2,567 1,703 1,778 -789 -30.7% 75 4.4%
635 324 Newry & Armagh SDLP 4,598 2,694 2,733 -1,865 -40.6% 39 1.4%
459 238 Normanton LAB 1,696 1,027 939 -757 -44.6% -88 -8.6%
501 437 North Antrim DU 3,351 2,299 2,134 -1,217 -36.3% -165 -7.2%
273 312 North Cornwall LD 2,383 1,620 1,402 -981 -41.2% -218 -13.5%
300 491 North Devon LD 1,886 1,437 1,254 -632 -33.5% -183 -12.7%
150 126 North Dorset CON 792 477 396 -396 -50.0% -81 -17.0%
353 506 North Down UU 2,337 1,777 1,572 -765 -32.7% -205 -11.5%
165 361 North Durham LAB 2,552 1,862 1,556 -996 -39.0% -306 -16.4%
504 328 North East Bedfordshire CON 1,010 648 602 -408 -40.4% -46 -7.1%
220 99 North East Cambridgeshire CON 2,077 1,173 1,002 -1,075 -51.8% -171 -14.6%
557 587 North East Derbyshire LAB 2,276 1,747 1,657 -619 -27.2% -90 -5.2%
431 518 North East Fife LD 1,421 1,065 964 -457 -32.2% -101 -9.5%
87 24 North East Hampshire CON 788 392 314 -474 -60.2% -78 -19.9%
55 17 North East Hertfordshire CON 1,082 534 416 -666 -61.6% -118 -22.1%
589 275 North East Milton Keynes LAB 1,605 943 909 -696 -43.4% -34 -3.6%
301 224 North Essex CON 1,032 645 563 -469 -45.4% -82 -12.7%
75 187 North Norfolk LD 1,748 1,163 925 -823 -47.1% -238 -20.5%
211 566 North Shropshire CON 1,487 1,237 1,054 -433 -29.1% -183 -14.8%
223 466 North Southwark & Bermondsey LD 5,714 4,360 3,727 -1,987 -34.8% -633 -14.5%
411 438 North Swindon LAB 1,223 865 779 -444 -36.3% -86 -9.9%
279 384 North Tayside SNP 1,702 1,212 1,050 -652 -38.3% -162 -13.4%
228 340 North Thanet CON 3,050 2,141 1,833 -1,217 -39.9% -308 -14.4%
107 375 North Tyneside LAB 3,316 2,512 2,037 -1,279 -38.6% -475 -18.9%
67 248 North Warwickshire LAB 1,719 1,212 957 -762 -44.3% -255 -21.0%
375 167 North West Cambridgeshire CON 1,525 888 791 -734 -48.1% -97 -10.9%
91 313 North West Durham LAB 2,546 1,867 1,498 -1,048 -41.2% -369 -19.8%
63 186 North West Hampshire * CON 843 568 446 -397 -47.1% -122 -21.5%
449 377 North West Leicestershire LAB 1,322 894 814 -508 -38.4% -80 -8.9%
42 69 North West Norfolk CON 2,266 1,357 1,034 -1,232 -54.4% -323 -23.8%
539 104 North Wiltshire CON 1,171 603 566 -605 -51.7% -37 -6.1%
646 514 Northampton North LAB 2,515 1,638 1,700 -815 -32.4% 62 3.8%
618 404 Northampton South LAB 2,233 1,400 1,393 -840 -37.6% -7 -0.5%
395 122 Northavon LD 1,075 600 537 -538 -50.0% -63 -10.5%
94 184 Norwich North LAB 2,460 1,616 1,301 -1,159 -47.1% -315 -19.5%
79 157 Norwich South LAB 3,542 2,285 1,820 -1,722 -48.6% -465 -20.4%
178 253 Nottingham East LAB 5,641 3,748 3,157 -2,484 -44.0% -591 -15.8%
274 367 Nottingham North LAB 3,878 2,737 2,369 -1,509 -38.9% -368 -13.4%
160 314 Nottingham South LAB 3,832 2,703 2,256 -1,576 -41.1% -447 -16.5%
121 183 Nuneaton LAB 1,838 1,191 972 -866 -47.1% -219 -18.4%
296 444 Ochil LAB 2,364 1,741 1,516 -848 -35.9% -225 -12.9%
327 436 Ogmore LAB 1,797 1,303 1,144 -653 -36.3% -159 -12.2%
415 16 Old Bexley & Sidcup CON 1,592 679 612 -980 -61.6% -67 -9.9%
606 589 Oldham East & Saddleworth LAB 2,163 1,613 1,576 -587 -27.1% -37 -2.3%
602 641 Oldham West & Royton LAB 2,593 2,146 2,091 -502 -19.4% -55 -2.6%
3 304 Orkney & Shetland LD 749 663 438 -311 -41.5% -225 -33.9%
584 286 Orpington CON 1,629 978 939 -690 -42.4% -39 -4.0%
221 180 Oxford East LAB 2,454 1,517 1,296 -1,158 -47.2% -221 -14.6%
98 166 Oxford West & Abingdon LD 1,014 650 525 -489 -48.2% -125 -19.2%

RESEARCH PAPER 01/68
44
IV Change in Unemployed Claimants July 1997-2001 and July 2000-2001United Kingdom Constituencies
A. (not seasonally adjusted) - alphabetical listingRank by %
change in UK(largest fall first) Claimants Change Jul 97-01 Change Jul 00-01
00-01 97-01 Party Jul 97 Jul 00 Jul 01 Number Percent Number Percent463 510 Paisley North LAB 2,352 1,733 1,587 -765 -32.5% -146 -8.4%
330 430 Paisley South LAB 2,658 1,922 1,688 -970 -36.5% -234 -12.2%
423 654 Pendle LAB 1,511 1,455 1,313 -198 -13.1% -142 -9.8%
491 378 Penrith & The Border CON 1,088 725 670 -418 -38.4% -55 -7.6%
146 170 Perth SNP 2,060 1,295 1,072 -988 -48.0% -223 -17.2%
556 284 Peterborough LAB 2,891 1,747 1,657 -1,234 -42.7% -90 -5.2%
54 56 Plymouth, Devonport LAB 3,274 1,871 1,455 -1,819 -55.6% -416 -22.2%
29 44 Plymouth, Sutton LAB 4,774 2,760 2,060 -2,714 -56.8% -700 -25.4%
591 498 Pontefract & Castleford LAB 2,331 1,614 1,557 -774 -33.2% -57 -3.5%
189 273 Pontypridd LAB 2,078 1,392 1,176 -902 -43.4% -216 -15.5%
5 4 Poole CON 1,539 797 537 -1,002 -65.1% -260 -32.6%
239 601 Poplar & Canning Town LAB 5,841 5,051 4,335 -1,506 -25.8% -716 -14.2%
139 39 Portsmouth North LAB 2,114 1,089 898 -1,216 -57.5% -191 -17.5%
116 52 Portsmouth South LD 3,911 2,116 1,724 -2,187 -55.9% -392 -18.5%
46 165 Preseli Pembrokeshire LAB 2,485 1,678 1,285 -1,200 -48.3% -393 -23.4%
357 373 Preston LAB 3,454 2,383 2,114 -1,340 -38.8% -269 -11.3%
302 551 Pudsey LAB 1,186 952 831 -355 -29.9% -121 -12.7%
299 147 Putney LAB 2,338 1,361 1,187 -1,151 -49.2% -174 -12.8%
396 135 Rayleigh CON 1,255 708 634 -621 -49.5% -74 -10.5%
123 192 Reading East LAB 1,563 1,016 830 -733 -46.9% -186 -18.3%
224 272 Reading West LAB 1,406 930 795 -611 -43.5% -135 -14.5%
243 535 Redcar LAB 4,016 3,228 2,774 -1,242 -30.9% -454 -14.1%
347 303 Redditch LAB 2,015 1,333 1,177 -838 -41.6% -156 -11.7%
206 411 Regent’s Park & Kensington North LAB 5,683 4,186 3,560 -2,123 -37.4% -626 -15.0%
171 2 Reigate CON 824 324 272 -552 -67.0% -52 -16.0%
44 195 Rhondda LAB 2,327 1,623 1,238 -1,089 -46.8% -385 -23.7%
447 341 Ribble Valley CON 890 588 535 -355 -39.9% -53 -9.0%
343 362 Richmond CON 1,294 895 789 -505 -39.0% -106 -11.8%
126 102 Richmond Park LD 1,806 1,065 872 -934 -51.7% -193 -18.1%
480 490 Rochdale LAB 3,148 2,268 2,092 -1,056 -33.5% -176 -7.8%
285 81 Rochford & Southend East CON 4,233 2,280 1,977 -2,256 -53.3% -303 -13.3%
104 254 Romford CON 1,372 948 768 -604 -44.0% -180 -19.0%
466 23 Romsey LD 927 401 368 -559 -60.3% -33 -8.2%
65 296 Ross, Skye & Inverness West LD 2,614 1,923 1,517 -1,097 -42.0% -406 -21.1%
328 627 Rossendale & Darwen LAB 1,444 1,287 1,130 -314 -21.7% -157 -12.2%
298 229 Rother Valley LAB 2,804 1,762 1,536 -1,268 -45.2% -226 -12.8%
170 159 Rotherham LAB 3,698 2,266 1,902 -1,796 -48.6% -364 -16.1%
441 655 Roxburgh & Berwickshire LD 1,015 973 883 -132 -13.0% -90 -9.2%
408 405 Rugby & Kenilworth LAB 1,688 1,171 1,054 -634 -37.6% -117 -10.0%
267 176 Ruislip - Northwood CON 1,141 693 599 -542 -47.5% -94 -13.6%
289 36 Runnymede & Weybridge CON 949 449 390 -559 -58.9% -59 -13.1%
138 98 Rushcliffe CON 1,754 1,021 841 -913 -52.1% -180 -17.6%
420 334 Rutland & Melton CON 887 590 532 -355 -40.0% -58 -9.8%
648 497 Ryedale CON 1,025 656 684 -341 -33.3% 28 4.3%
37 21 Saffron Walden CON 1,060 554 419 -641 -60.5% -135 -24.4%
492 261 Salford LAB 2,911 1,768 1,634 -1,277 -43.9% -134 -7.6%
2 6 Salisbury CON 1,295 701 458 -837 -64.6% -243 -34.7%
538 536 Scarborough & Whitby LAB 2,533 1,868 1,753 -780 -30.8% -115 -6.2%
650 500 Scunthorpe LAB 2,470 1,568 1,653 -817 -33.1% 85 5.4%
567 645 Sedgefield LAB 2,061 1,771 1,688 -373 -18.1% -83 -4.7%
147 128 Selby LAB 1,787 1,081 896 -891 -49.9% -185 -17.1%
527 38 Sevenoaks CON 1,167 527 493 -674 -57.8% -34 -6.5%
482 451 Sheffield, Attercliffe LAB 2,837 1,989 1,835 -1,002 -35.3% -154 -7.7%
385 374 Sheffield, Brightside LAB 4,092 2,812 2,511 -1,581 -38.6% -301 -10.7%
467 387 Sheffield, Central LAB 6,084 4,098 3,761 -2,323 -38.2% -337 -8.2%
326 140 Sheffield, Hallam LD 1,684 972 853 -831 -49.3% -119 -12.2%

RESEARCH PAPER 01/68
45
IV Change in Unemployed Claimants July 1997-2001 and July 2000-2001United Kingdom Constituencies
A. (not seasonally adjusted) - alphabetical listingRank by %
change in UK(largest fall first) Claimants Change Jul 97-01 Change Jul 00-01
00-01 97-01 Party Jul 97 Jul 00 Jul 01 Number Percent Number Percent518 329 Sheffield, Heeley LAB 3,479 2,227 2,077 -1,402 -40.3% -150 -6.7%
92 173 Sheffield, Hillsborough LAB 2,723 1,777 1,426 -1,297 -47.6% -351 -19.8%
193 369 Sherwood LAB 2,288 1,654 1,399 -889 -38.9% -255 -15.4%
477 548 Shipley LAB 1,774 1,344 1,239 -535 -30.2% -105 -7.8%
493 402 Shrewsbury & Atcham LAB 1,523 1,026 949 -574 -37.7% -77 -7.5%
263 232 Sittingbourne & Sheppey LAB 2,576 1,641 1,417 -1,159 -45.0% -224 -13.7%
638 468 Skipton & Ripon CON 1,017 652 665 -352 -34.6% 13 2.0%
149 200 Sleaford & North Hykeham CON 1,369 883 733 -636 -46.5% -150 -17.0%
474 426 Slough LAB 2,481 1,708 1,571 -910 -36.7% -137 -8.0%
186 318 Solihull CON 1,416 990 836 -580 -41.0% -154 -15.6%
140 27 Somerton & Frome * LD 1,422 690 569 -853 -60.0% -121 -17.5%
530 476 South Antrim DU 2,334 1,641 1,536 -798 -34.2% -105 -6.4%
30 63 South Cambridgeshire CON 874 529 397 -477 -54.6% -132 -25.0%
108 194 South Derbyshire LAB 1,843 1,206 980 -863 -46.8% -226 -18.7%
119 48 South Dorset LAB 1,778 951 776 -1,002 -56.4% -175 -18.4%
610 339 South Down SDLP 3,637 2,231 2,185 -1,452 -39.9% -46 -2.1%
101 220 South East Cambridgeshire CON 1,062 714 578 -484 -45.6% -136 -19.0%
110 172 South East Cornwall LD 1,961 1,259 1,024 -937 -47.8% -235 -18.7%
322 423 South Holland & The Deepings CON 958 691 606 -352 -36.7% -85 -12.3%
111 61 South Norfolk CON 1,656 917 746 -910 -55.0% -171 -18.6%
89 302 South Ribble LAB 1,301 947 759 -542 -41.7% -188 -19.9%
255 620 South Shields LAB 4,098 3,639 3,136 -962 -23.5% -503 -13.8%
559 470 South Staffordshire CON 1,546 1,067 1,013 -533 -34.5% -54 -5.1%
334 141 South Suffolk CON 1,293 744 655 -638 -49.3% -89 -12.0%
462 388 South Swindon LAB 1,848 1,250 1,144 -704 -38.1% -106 -8.5%
125 211 South Thanet LAB 2,634 1,737 1,422 -1,212 -46.0% -315 -18.1%
582 259 South West Bedfordshire CON 1,399 819 785 -614 -43.9% -34 -4.2%
77 26 South West Devon CON 1,378 692 551 -827 -60.0% -141 -20.4%
588 368 South West Hertfordshire CON 1,003 636 613 -390 -38.9% -23 -3.6%
71 90 South West Norfolk CON 1,816 1,085 860 -956 -52.6% -225 -20.7%
103 109 South West Surrey CON 735 442 358 -377 -51.3% -84 -19.0%
74 110 Southampton, Itchen LAB 2,920 1,797 1,427 -1,493 -51.1% -370 -20.6%
21 30 Southampton, Test LAB 3,141 1,740 1,271 -1,870 -59.5% -469 -27.0%
363 33 Southend West CON 2,593 1,186 1,053 -1,540 -59.4% -133 -11.2%
325 396 Southport LD 2,271 1,608 1,411 -860 -37.9% -197 -12.3%
207 40 Spelthorne CON 1,119 562 478 -641 -57.3% -84 -14.9%
331 37 St Albans LAB 987 464 408 -579 -58.7% -56 -12.1%
310 477 St Helens North LAB 2,592 1,952 1,706 -886 -34.2% -246 -12.6%
315 584 St Helens South LAB 2,966 2,463 2,157 -809 -27.3% -306 -12.4%
137 163 St Ives LD 2,830 1,775 1,462 -1,368 -48.3% -313 -17.6%
421 656 Stafford LAB 1,464 1,419 1,280 -184 -12.6% -139 -9.8%
654 492 Staffordshire Moorlands LAB 1,334 826 887 -447 -33.5% 61 7.4%
201 311 Stalybridge & Hyde LAB 2,200 1,525 1,294 -906 -41.2% -231 -15.1%
195 72 Stevenage LAB 1,911 1,035 876 -1,035 -54.2% -159 -15.4%
368 395 Stirling LAB 1,734 1,211 1,076 -658 -37.9% -135 -11.1%
324 244 Stockport LAB 2,174 1,376 1,207 -967 -44.5% -169 -12.3%
115 446 Stockton North LAB 4,261 3,360 2,737 -1,524 -35.8% -623 -18.5%
176 485 Stockton South LAB 3,254 2,564 2,158 -1,096 -33.7% -406 -15.8%
534 552 Stoke-on-Trent Central LAB 2,685 2,007 1,882 -803 -29.9% -125 -6.2%
532 586 Stoke-on-Trent North LAB 1,789 1,390 1,302 -487 -27.2% -88 -6.3%
581 659 Stoke-on-Trent South LAB 1,900 1,890 1,811 -89 -4.7% -79 -4.2%
571 558 Stone CON 914 675 644 -270 -29.5% -31 -4.6%
585 648 Stourbridge LAB 1,917 1,645 1,580 -337 -17.6% -65 -4.0%
235 382 Strangford DU 2,475 1,779 1,525 -950 -38.4% -254 -14.3%
531 115 Stratford-on-Avon CON 1,257 659 617 -640 -50.9% -42 -6.4%
282 287 Strathkelvin & Bearsden LAB 2,039 1,357 1,176 -863 -42.3% -181 -13.3%
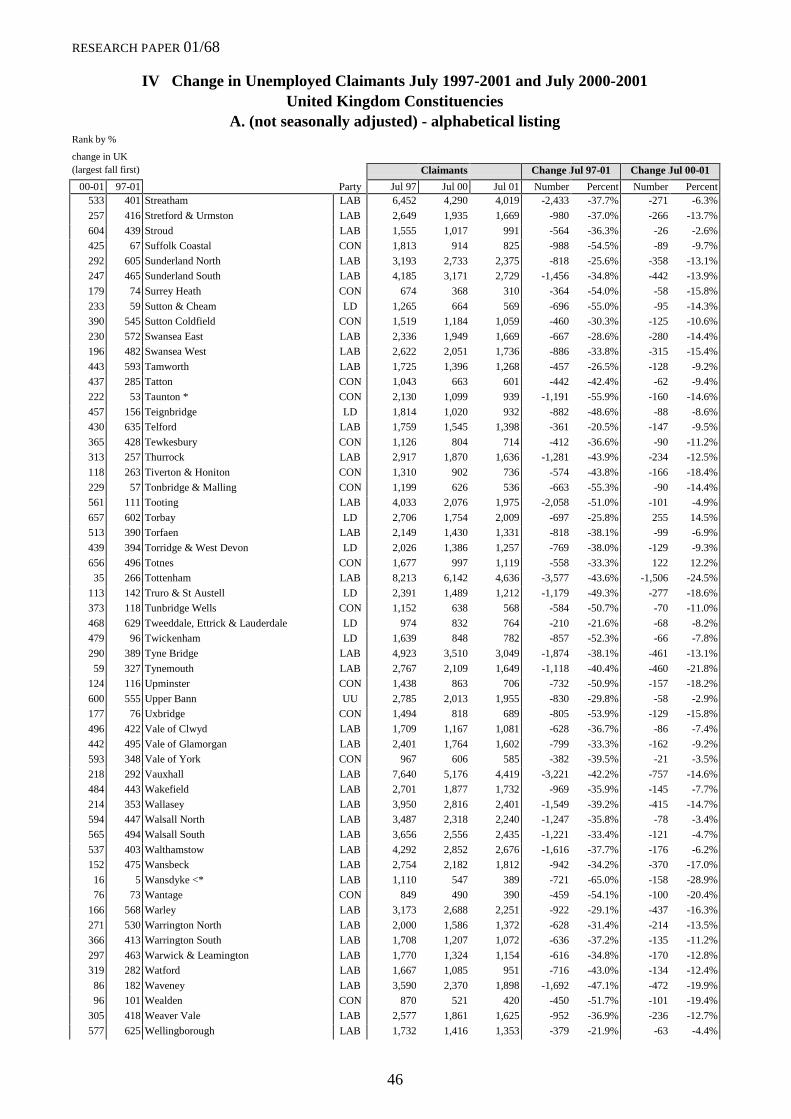
RESEARCH PAPER 01/68
46
IV Change in Unemployed Claimants July 1997-2001 and July 2000-2001United Kingdom Constituencies
A. (not seasonally adjusted) - alphabetical listingRank by %
change in UK(largest fall first) Claimants Change Jul 97-01 Change Jul 00-01
00-01 97-01 Party Jul 97 Jul 00 Jul 01 Number Percent Number Percent533 401 Streatham LAB 6,452 4,290 4,019 -2,433 -37.7% -271 -6.3%
257 416 Stretford & Urmston LAB 2,649 1,935 1,669 -980 -37.0% -266 -13.7%
604 439 Stroud LAB 1,555 1,017 991 -564 -36.3% -26 -2.6%
425 67 Suffolk Coastal CON 1,813 914 825 -988 -54.5% -89 -9.7%
292 605 Sunderland North LAB 3,193 2,733 2,375 -818 -25.6% -358 -13.1%
247 465 Sunderland South LAB 4,185 3,171 2,729 -1,456 -34.8% -442 -13.9%
179 74 Surrey Heath CON 674 368 310 -364 -54.0% -58 -15.8%
233 59 Sutton & Cheam LD 1,265 664 569 -696 -55.0% -95 -14.3%
390 545 Sutton Coldfield CON 1,519 1,184 1,059 -460 -30.3% -125 -10.6%
230 572 Swansea East LAB 2,336 1,949 1,669 -667 -28.6% -280 -14.4%
196 482 Swansea West LAB 2,622 2,051 1,736 -886 -33.8% -315 -15.4%
443 593 Tamworth LAB 1,725 1,396 1,268 -457 -26.5% -128 -9.2%
437 285 Tatton CON 1,043 663 601 -442 -42.4% -62 -9.4%
222 53 Taunton * CON 2,130 1,099 939 -1,191 -55.9% -160 -14.6%
457 156 Teignbridge LD 1,814 1,020 932 -882 -48.6% -88 -8.6%
430 635 Telford LAB 1,759 1,545 1,398 -361 -20.5% -147 -9.5%
365 428 Tewkesbury CON 1,126 804 714 -412 -36.6% -90 -11.2%
313 257 Thurrock LAB 2,917 1,870 1,636 -1,281 -43.9% -234 -12.5%
118 263 Tiverton & Honiton CON 1,310 902 736 -574 -43.8% -166 -18.4%
229 57 Tonbridge & Malling CON 1,199 626 536 -663 -55.3% -90 -14.4%
561 111 Tooting LAB 4,033 2,076 1,975 -2,058 -51.0% -101 -4.9%
657 602 Torbay LD 2,706 1,754 2,009 -697 -25.8% 255 14.5%
513 390 Torfaen LAB 2,149 1,430 1,331 -818 -38.1% -99 -6.9%
439 394 Torridge & West Devon LD 2,026 1,386 1,257 -769 -38.0% -129 -9.3%
656 496 Totnes CON 1,677 997 1,119 -558 -33.3% 122 12.2%
35 266 Tottenham LAB 8,213 6,142 4,636 -3,577 -43.6% -1,506 -24.5%
113 142 Truro & St Austell LD 2,391 1,489 1,212 -1,179 -49.3% -277 -18.6%
373 118 Tunbridge Wells CON 1,152 638 568 -584 -50.7% -70 -11.0%
468 629 Tweeddale, Ettrick & Lauderdale LD 974 832 764 -210 -21.6% -68 -8.2%
479 96 Twickenham LD 1,639 848 782 -857 -52.3% -66 -7.8%
290 389 Tyne Bridge LAB 4,923 3,510 3,049 -1,874 -38.1% -461 -13.1%
59 327 Tynemouth LAB 2,767 2,109 1,649 -1,118 -40.4% -460 -21.8%
124 116 Upminster CON 1,438 863 706 -732 -50.9% -157 -18.2%
600 555 Upper Bann UU 2,785 2,013 1,955 -830 -29.8% -58 -2.9%
177 76 Uxbridge CON 1,494 818 689 -805 -53.9% -129 -15.8%
496 422 Vale of Clwyd LAB 1,709 1,167 1,081 -628 -36.7% -86 -7.4%
442 495 Vale of Glamorgan LAB 2,401 1,764 1,602 -799 -33.3% -162 -9.2%
593 348 Vale of York CON 967 606 585 -382 -39.5% -21 -3.5%
218 292 Vauxhall LAB 7,640 5,176 4,419 -3,221 -42.2% -757 -14.6%
484 443 Wakefield LAB 2,701 1,877 1,732 -969 -35.9% -145 -7.7%
214 353 Wallasey LAB 3,950 2,816 2,401 -1,549 -39.2% -415 -14.7%
594 447 Walsall North LAB 3,487 2,318 2,240 -1,247 -35.8% -78 -3.4%
565 494 Walsall South LAB 3,656 2,556 2,435 -1,221 -33.4% -121 -4.7%
537 403 Walthamstow LAB 4,292 2,852 2,676 -1,616 -37.7% -176 -6.2%
152 475 Wansbeck LAB 2,754 2,182 1,812 -942 -34.2% -370 -17.0%
16 5 Wansdyke <* LAB 1,110 547 389 -721 -65.0% -158 -28.9%
76 73 Wantage CON 849 490 390 -459 -54.1% -100 -20.4%
166 568 Warley LAB 3,173 2,688 2,251 -922 -29.1% -437 -16.3%
271 530 Warrington North LAB 2,000 1,586 1,372 -628 -31.4% -214 -13.5%
366 413 Warrington South LAB 1,708 1,207 1,072 -636 -37.2% -135 -11.2%
297 463 Warwick & Leamington LAB 1,770 1,324 1,154 -616 -34.8% -170 -12.8%
319 282 Watford LAB 1,667 1,085 951 -716 -43.0% -134 -12.4%
86 182 Waveney LAB 3,590 2,370 1,898 -1,692 -47.1% -472 -19.9%
96 101 Wealden CON 870 521 420 -450 -51.7% -101 -19.4%
305 418 Weaver Vale LAB 2,577 1,861 1,625 -952 -36.9% -236 -12.7%
577 625 Wellingborough LAB 1,732 1,416 1,353 -379 -21.9% -63 -4.4%

RESEARCH PAPER 01/68
47
IV Change in Unemployed Claimants July 1997-2001 and July 2000-2001United Kingdom Constituencies
A. (not seasonally adjusted) - alphabetical listingRank by %
change in UK(largest fall first) Claimants Change Jul 97-01 Change Jul 00-01
00-01 97-01 Party Jul 97 Jul 00 Jul 01 Number Percent Number Percent402 240 Wells CON 1,661 1,025 920 -741 -44.6% -105 -10.2%
194 161 Welwyn Hatfield LAB 1,123 683 578 -545 -48.5% -105 -15.4%
70 160 Wentworth LAB 3,111 2,020 1,601 -1,510 -48.5% -419 -20.7%
10 217 West Aberdeenshire & Kincardine LD 939 737 509 -430 -45.8% -228 -30.9%
560 588 West Bromwich East LAB 3,226 2,475 2,350 -876 -27.2% -125 -5.1%
590 628 West Bromwich West LAB 3,447 2,801 2,701 -746 -21.6% -100 -3.6%
25 54 West Chelmsford CON 1,598 952 706 -892 -55.8% -246 -25.8%
318 481 West Derbyshire CON 1,225 923 809 -416 -34.0% -114 -12.4%
13 18 West Dorset CON 1,055 581 407 -648 -61.4% -174 -29.9%
129 298 West Ham LAB 5,495 3,903 3,199 -2,296 -41.8% -704 -18.0%
342 501 West Lancashire LAB 2,573 1,958 1,726 -847 -32.9% -232 -11.8%
636 618 West Renfrewshire LAB 1,478 1,110 1,128 -350 -23.7% 18 1.6%
251 71 West Suffolk CON 1,476 784 675 -801 -54.3% -109 -13.9%
629 512 West Tyrone SF 4,256 2,853 2,876 -1,380 -32.4% 23 0.8%
133 121 West Worcestershire CON 1,118 679 557 -561 -50.2% -122 -18.0%
523 31 Westbury CON 1,766 767 716 -1,050 -59.5% -51 -6.6%
62 279 Western Isles LAB 1,272 920 722 -550 -43.2% -198 -21.5%
102 130 Westmorland & Lonsdale CON 804 499 404 -400 -49.8% -95 -19.0%
122 45 Weston-Super-Mare LD 2,046 1,081 883 -1,163 -56.8% -198 -18.3%
287 191 Wigan LAB 2,555 1,563 1,356 -1,199 -46.9% -207 -13.2%
574 46 Wimbledon LAB 1,705 773 738 -967 -56.7% -35 -4.5%
575 108 Winchester LD 957 487 465 -492 -51.4% -22 -4.5%
543 305 Windsor CON 993 617 581 -412 -41.5% -36 -5.8%
45 132 Wirral South LAB 1,918 1,265 966 -952 -49.6% -299 -23.6%
339 289 Wirral West LAB 2,130 1,397 1,231 -899 -42.2% -166 -11.9%
50 13 Witney CON 783 382 296 -487 -62.2% -86 -22.5%
643 42 Woking CON 746 312 321 -425 -57.0% 9 2.9%
481 409 Wokingham CON 532 361 333 -199 -37.4% -28 -7.8%
627 619 Wolverhampton North East LAB 3,011 2,298 2,304 -707 -23.5% 6 0.3%
464 642 Wolverhampton South East LAB 2,914 2,572 2,359 -555 -19.0% -213 -8.3%
608 636 Wolverhampton South West LAB 2,927 2,381 2,328 -599 -20.5% -53 -2.2%
362 113 Woodspring CON 920 508 451 -469 -51.0% -57 -11.2%
407 271 Worcester LAB 1,891 1,188 1,069 -822 -43.5% -119 -10.0%
514 268 Workington LAB 2,857 1,733 1,614 -1,243 -43.5% -119 -6.9%
394 564 Worsley LAB 1,940 1,533 1,372 -568 -29.3% -161 -10.5%
17 29 Worthing West CON 1,156 655 466 -690 -59.7% -189 -28.9%
378 649 Wrekin, The LAB 1,131 1,047 933 -198 -17.5% -114 -10.9%
323 398 Wrexham LAB 1,596 1,131 992 -604 -37.8% -139 -12.3%
620 534 Wycombe CON 1,578 1,094 1,089 -489 -31.0% -5 -0.5%
644 529 Wyre Forest IND 1,751 1,164 1,201 -550 -31.4% 37 3.2%
470 316 Wythenshawe & Sale East LAB 3,229 2,070 1,902 -1,327 -41.1% -168 -8.1%
613 124 Yeovil * LD 1,511 764 755 -756 -50.0% -9 -1.2%
628 583 Ynys-Mon LAB 2,453 1,771 1,783 -670 -27.3% 12 0.7%
456 236 York, City of LAB 2,964 1,795 1,640 -1,324 -44.7% -155 -8.6%
United Kingdom 1,585,272 1,088,813 961,821 -623,451 -39.3% -126,992 -11.7%

RESEARCH PAPER 01/68
48
IV Change in Unemployed Claimants July 1997-2001 and July 2000-2001United Kingdom Constituencies
B. (not seasonally adjusted) - greatest changesRank by %change in UK
(largest fall first) Claimants Change Jul 97-01 Change Jul 00-01
00-01 97-01 Party Jul 97 Jul 00 Jul 01 Number Percent Number Percent1 301 Banff & Buchan SNP 1,283 1,172 748 -535 -41.7% -424 -36.2%
2 6 Salisbury CON 1,295 701 458 -837 -64.6% -243 -34.7%
3 304 Orkney & Shetland LD 749 663 438 -311 -41.5% -225 -33.9%
4 322 Gordon LD 1,033 923 613 -420 -40.7% -310 -33.6%
5 4 Poole CON 1,539 797 537 -1,002 -65.1% -260 -32.6%
6 227 Aberdeen North LAB 1,158 937 634 -524 -45.3% -303 -32.3%
7 15 Gosport CON 1,646 913 627 -1,019 -61.9% -286 -31.3%
8 92 Cardiff North LAB 1,207 833 573 -634 -52.5% -260 -31.2%
9 50 Mid Norfolk CON 1,674 1,066 735 -939 -56.1% -331 -31.1%
10 217 West Aberdeenshire & Kincardine LD 939 737 509 -430 -45.8% -228 -30.9%
11 20 Bournemouth West CON 2,508 1,421 989 -1,519 -60.6% -432 -30.4%
12 225 Aberdeen Central LAB 2,056 1,606 1,122 -934 -45.4% -484 -30.1%
13 18 West Dorset CON 1,055 581 407 -648 -61.4% -174 -29.9%
14 8 Mid Dorset & North Poole LD 1,163 603 426 -737 -63.4% -177 -29.4%
15 321 Aberdeen South LAB 1,364 1,145 809 -555 -40.7% -336 -29.3%
16 5 Wansdyke <* LAB 1,110 547 389 -721 -65.0% -158 -28.9%
17 29 Worthing West CON 1,156 655 466 -690 -59.7% -189 -28.9%
18 280 Moray SNP 2,065 1,632 1,175 -890 -43.1% -457 -28.0%
19 34 East Worthing & Shoreham CON 1,305 738 532 -773 -59.2% -206 -27.9%
20 77 Brighton, Pavilion LAB 4,688 2,979 2,166 -2,522 -53.8% -813 -27.3%
21 30 Southampton, Test LAB 3,141 1,740 1,271 -1,870 -59.5% -469 -27.0%
22 41 Hitchin & Harpenden CON 1,029 600 440 -589 -57.2% -160 -26.7%
23 120 Huntingdon CON 1,382 935 687 -695 -50.3% -248 -26.5%
24 80 East Devon CON 1,062 674 496 -566 -53.3% -178 -26.4%
25 54 West Chelmsford CON 1,598 952 706 -892 -55.8% -246 -25.8%
: : : : : : : : : : :
635 324 Newry & Armagh SDLP 4,598 2,694 2,733 -1,865 -40.6% 39 1.4%
636 618 West Renfrewshire LAB 1,478 1,110 1,128 -350 -23.7% 18 1.6%
637 445 East Londonderry DU 3,838 2,422 2,462 -1,376 -35.9% 40 1.7%
638 468 Skipton & Ripon CON 1,017 652 665 -352 -34.6% 13 2.0%
639 349 Denton & Reddish LAB 1,977 1,172 1,197 -780 -39.5% 25 2.1%
640 650 Greenock & Inverclyde LAB 1,981 1,618 1,653 -328 -16.6% 35 2.2%
641 264 Finchley & Golders Green LAB 2,744 1,502 1,543 -1,201 -43.8% 41 2.7%
642 199 Cotswold CON 770 400 411 -359 -46.6% 11 2.8%
643 42 Woking CON 746 312 321 -425 -57.0% 9 2.9%
644 529 Wyre Forest IND 1,751 1,164 1,201 -550 -31.4% 37 3.2%
645 646 Central Fife LAB 2,941 2,334 2,413 -528 -18.0% 79 3.4%
646 514 Northampton North LAB 2,515 1,638 1,700 -815 -32.4% 62 3.8%
647 561 Eddisbury CON 1,365 926 964 -401 -29.4% 38 4.1%
648 497 Ryedale CON 1,025 656 684 -341 -33.3% 28 4.3%
649 539 Newport West LAB 2,567 1,703 1,778 -789 -30.7% 75 4.4%
650 500 Scunthorpe LAB 2,470 1,568 1,653 -817 -33.1% 85 5.4%
651 208 Hayes & Harlington LAB 2,047 1,044 1,102 -945 -46.2% 58 5.6%
652 502 Blackpool South LAB 2,956 1,869 1,983 -973 -32.9% 114 6.1%
653 553 Bedford LAB 2,643 1,728 1,853 -790 -29.9% 125 7.2%
654 492 Staffordshire Moorlands LAB 1,334 826 887 -447 -33.5% 61 7.4%
655 630 Dunfermline West LAB 1,963 1,428 1,540 -423 -21.5% 112 7.8%
656 496 Totnes CON 1,677 997 1,119 -558 -33.3% 122 12.2%
657 602 Torbay LD 2,706 1,754 2,009 -697 -25.8% 255 14.5%
658 599 Dunfermline East LAB 2,507 1,564 1,858 -649 -25.9% 294 18.8%
659 562 Daventry CON 1,192 694 842 -350 -29.4% 148 21.3%
United Kingdom 1,585,272 1,088,813 961,821 -623,451 -39.3% -126,992 -11.7%