underwater methods for study of salmonids in the … · 2008-05-09 · report int-gtr-307 july 1994...
TRANSCRIPT

United StatesDepartmentof Agriculture
Forest Service
IntermountainResearch Station
General TechnicalReport INT-GTR-307
July 1994
Underwater Methods forStudy of Salmonids inthe Intermountain WestRussell F. Thurow

Intermountain Research Station324 25th Street
Ogden, UT 84401
THE AUTHOR
RUSSELL F. THUROW is a Fisheries Research Biolo-gist with the Intermountain Research Station, ForestrySciences Laboratory, Boise, ID. He received an un-dergraduate degree in fisheries from the University ofWisconsin-Stevens Point and a master’s degree infisheries resources from the University of Idaho. Hehas been using underwater techniques to study resi-dent and anadromous fish populations since 1973.After 15 years of research with the Idaho Departmentof Fish and Game, he joined the Intermountain Station’sFisheries Research Work Unit in 1990. His current re-search focuses on the biology of salmonid populationsand the interaction between various salmonid lifestages and their habitats.
RESEARCH SUMMARY
Underwater observation using snorkeling gear is anaccepted technique for censusing fish populations inflowing waters. Several factors, including the behaviorof the target fish species and attributes of the physicalhabitat, can bias underwater counts. This paper de-scribes the use of underwater observation and outlinesprocedures for estimating fish abundance, the sizestructure of populations, and habitat use. It also pro-vides criteria for identifying fish underwater.
ACKNOWLEDGMENTS
Earlier versions of this manuscript were reviewed byJ. Griffith, T. Hillman, J. McIntyre, K. Overton, D. Schill,and B. Rieman. Cover photo by Susan Adams. Figure15 by Ray Beamesderfer, Oregon Department of Fishand Wildlife. Figures 13 and 14 by Ken Bouc, reprintedwith permission of NEBRASKAland Magazine and theNebraska Game and Parks Commission. Figures 9, 12,and 17 by Paul Valcarce, Limnophoto. Figures 6, 8, 10,and 16 by John Woodling, reprinted with permission of
the Colorado Division of Wildlife. All other photos by theauthor. Rodger Nelson built the cutthroat trout distribu-tion map. The illustration in appendix C was adaptedfrom Simpson and Wallace (1978). The illustrations inappendix D were drawn by Eric Stansbury of the IdahoDepartment of Fish and Game.
CONTENTSPage
Introduction ............................................................... 1Considerations Before the Survey ............................ 1
Objectives .............................................................. 1Safety .................................................................... 2Equipment ............................................................. 2Training.................................................................. 2Ethics ..................................................................... 3
Recommended Snorkeling Protocols ........................ 4Timing .................................................................... 4Minimum Criteria ................................................... 4Selecting Appropriate Sampling Units ................... 5Snorkeling Procedures .......................................... 6Precision and Accuracy ......................................... 9
Species Identification and Habitats ......................... 11Anadromous Salmonids ...................................... 12Resident Salmonids............................................. 14Species Other Than Salmonids ........................... 18
Research Needs ..................................................... 18References .............................................................. 19Appendixes:
A: Example of a Sampling Unit Map .................... 23B: Example of a Snorkel Data Sheet ................... 24C: External Characteristics of a
Typical Salmonid ............................................. 25D: Diagnostic External Features of Juvenile
Salmonids Found in the Intermountain West .... 26E: Distribution of Interior Races of Cutthroat
Trout in the Western United States ................. 28
The use of trade or firm names in this publication is for reader information and does notimply endorsement by the U.S. Department of Agriculture of any product or service.
1
INTRODUCTION
Underwater observation with snorkeling gear isa valuable tool for studying fish populations and as-sessing how fish use habitat in flowing waters. Pre-cise estimates of fish abundance can be obtainedusing underwater counts (Griffith 1981; Northcoteand Wilkie 1963; Schill and Griffith 1984; Zubik andFraley 1988). However, several factors, including thebehavior of the target fish species and attributes of thephysical habitat (stream size, water clarity, tempera-ture, and cover), can bias results.
This guide was developed to assist biologists inidentifying and accounting for potential biases andto encourage a standardized procedure for the useof underwater techniques to survey salmonids instreams. The guide addresses the principal residentand anadromous salmonids found in the Intermoun-tain West (Idaho, Montana, Nevada, Utah, and west-ern Wyoming).
CONSIDERATIONS BEFORE THESURVEY
Before using underwater techniques several factorsneed to be considered, including study objectives,safety, equipment, training, and ethics.
Objectives
Biologists should carefully consider the objectivesof the study before deciding whether underwaterobservation is the appropriate sampling technique.Underwater observation can provide quantitativeinformation on the abundance (Schill and Griffith1984), distribution (Hankin and Reeves 1988), sizestructure (Griffith 1981), and habitat use (Fauschand White 1981) of salmonids. Underwater tech-niques may also be useful for capturing salmonidsin small streams (Bonneau and others, in prepara-tion). Biases can result, however, unless certain con-ditions of depth, water clarity, and temperature aremet (see Recommended Snorkeling Protocols, Mini-mum Criteria).
Underwater Methods for Study ofSalmonids in the IntermountainWestRussell F. Thurow
If minimum criteria are met, underwater observa-tion has advantages for sampling fish populations.Snorkeling is feasible where environmental condi-tions such as deep, clear water of low conductivitymay limit the effectiveness of electrofishing (Schilland Griffith 1984). Because of the small amountof equipment required for snorkeling, the techniquecan be used in remote locations where it may be dif-ficult to use other sampling apparatus such as traps,nets, and electrofishing gear. Snorkeling is especiallyapplicable for censusing fish populations in roadlessareas (Thurow 1985). Because fish are not handledand disturbance is minimized, snorkeling is usefulfor sampling stocks of fish that are protected or rare.Less time is required to complete snorkel surveys,and the technique is more cost effective than mark-recapture or removal methods typically used to esti-mate abundance (Hankin and Reeves 1988; Schilland Griffith 1984).
Snorkeling is a relatively unbiased method for ob-serving fish in their natural environments (Heggenesand others 1990). Snorkelers can observe spawning,feeding, movements, and other behaviors withoutdisturbing the fish (Helfman 1983). Snorkelers canalso measure environmental variables such as tem-perature, velocity, and depth in precise locations.
Underwater observation also has disadvantages.Fish are not handled, so snorkelers must estimatefish size (Grunder and Corsi 1988). Snorkelers mayfail to detect fish, count fish more than once, incor-rectly estimate fish size, and misidentify fish (Griffithand others 1984). Counting fish accurately in a densepopulation is difficult (Heggenes and others 1990).Some species and sizes of fish are more easily seenthan others (Hillman and others 1992). Small fishand species that remain near the substrate may bemore difficult to see than larger, more mobile species(Helfman 1983). Differences in fish behavior duringdifferent times of the day or year also may bias obser-vations (Rodgers and others 1992). Instream cover canlimit the accuracy of underwater counts if fish areconcealed. Counts completed in habitat lacking covermay be more accurate than those completed in com-plex habitat with abundant cover (Rodgers and others1992).

2
Safety
Although underwater observation avoids the haz-ards of electrofishing, safety should be emphasized(Griffith and others 1984). Snorkelers should alwayshave a partner, either on shore or in the water. Neverattach ropes or survey tapes to a snorkeler. Assessthe hazards of the site before entering the water.Avoid areas of extreme water velocity and turbulence,especially those immediately upstream from debrisjams or bedrock outcrops. If it becomes necessaryto survey turbulent stream reaches, attempt to com-plete surveys from the channel margins and avoidentering the most turbulent locations. Use extremecaution when snorkeling under and within debris jamsto avoid entrapment. Stay alert for rattlesnakes,since they often live in riparian zones. Recognize thesymptoms of hypothermia and know how to treat it.Exercise extreme caution when conducting surveysat night and during the winter when snorkelers maybe exposed to additional hazards. Require all crewmembers to complete cardiopulmonary resuscitation(CPR) and first aid training. Carry a first aid kitthat includes a cardiopulmonary resuscitation maskand a device for extracting poison.
Equipment
Daytime snorkeling in water warmer than 8 °C re-quires only a minimum of equipment: full neoprenewetsuit (6.4 mm thick), hood, gloves, mask, snorkel,and data recorders. Suits should be of black or darkblue, rather than of bright colors that may startlefish. In turbulent streams, knee and elbow pads pro-vide added protection. Pads can be ordered on thesuit, purchased separately, or cut from surplus suitsand glued on. Masks may be worn directly over con-tact lenses, or prescription masks can be purchasedfor snorkelers who wear glasses. Masks with frontand side lenses increase the observer’s field of view.It is advisable to carry an extra mask and snorkel foreach team on backcountry trips. Neoprene socks worninside canvas tennis shoes or wading shoes are moredurable than neoprene booties and protect the feetbetter. Fins are useful in large rivers where countsmust be conducted while floating downstream. A canof black neoprene wetsuit cement should be carried forpatching holes; the cement dries in 10 minutes, form-ing a durable bond. Wetsuit zippers should be welllubricated with wax or graphite.
Data can be recorded on a slate or cuff carried bythe snorkeler. I prefer a cuff cut from a piece of PVCplastic pipe 10 cm in diameter and 20 cm long, modi-fied from the design described by Helfman (1983). Thepipe is cut in half, producing two halves each 20 cmlong. Four holes are drilled at the corners of eachcuff, and a loop of surgical tubing is threaded through
each pair of holes. The cuff slides over the snorkeler’sarm and is secured by tightening the surgical tubing.Pencils may be stored inside the lengths of surgicaltubing. The cuff fits comfortably on the snorkeler’sforearm; both hands remain free. Hand tally countersare useful if large concentrations of fish of severalsizes or species are encountered.
Underwater observation in cold water or at nightmay require specialized equipment. If water tempera-tures are consistently below 8 °C, a drysuit shouldbe worn. It allows snorkelers to complete countscomfortably, even in water near 0 °C. Two types ofdrysuits are widely available, neoprene and nylon.Both types are durable, but the nylon suit is morelightweight and compact. Various layers of under-garments can be worn inside, enabling a snorkelerto work comfortably in a broad range of water tem-peratures. Unless the suit will be used for scubadiving, it should be purchased without valves andwith attached latex socks. Layers of wool or pileshould be worn inside and over the latex socks. Kneeand elbow pads protect the snorkeler and the suit.
Several excellent hand-held halogen lights areavailable for night snorkeling. When a beam of lightis focused on fish, they typically maintain their posi-tion for 2 to 3 seconds before swimming away. Mostspecies will hold their position longer if underwaterlights with red filters are used (Hillman 1993). A filtercan be made from red Plexiglass. No other specializedequipment is needed for night snorkeling.
Training
Although snorkeling is easy to learn, training andpractice are required to correctly identify species offish underwater, estimate fish sizes accurately, andcomplete precise counts. All snorkelers, whether nov-ice or experienced, will improve their abilities withannual training. Snorkelers should review availableliterature describing snorkeling techniques beforebeginning practice sessions (see References). Experi-enced snorkelers should conduct training sessions,administer tests, and review the results with indi-vidual snorkelers. The objectives of the study shouldbe clearly stated at the start of the training.
Training should be structured to address equipment,safety, ethics, techniques, and data collection. Selectlocations for training where snorkelers can practicethe selected technique under field conditions simulat-ing those of actual surveys. Have snorkelers practiceidentifying, counting, and estimating the size of tar-get species.
Identifying Species—Snorkelers may familiarizethemselves with the species to be surveyed by reviewingdrawings, color plates, and photos; viewing videotapes;visiting aquaria; and snorkeling with experienced

3
snorkelers. See Sigler and Miller (1963), Scott andCrossman (1973), Simpson and Wallace (1978), orBehnke (1992) for detailed species descriptions, draw-ings, and color plates. Carl and others (1959) andMcConnell and Snyder (1972) presented keys andillustrations to identify juvenile resident and anadro-mous salmonids. Martinez (1984) provided detailedcomparative descriptions of trout larvae. The speciesincluded in this guide (see Species Identification andHabitats) represent the principal salmonids in theIntermountain West. If available, underwater video-tapes are excellent tools to assist snorkelers in iden-tifying species under field conditions. Aquaria, orother fish facilities with observation windows, offeran opportunity to observe salmonids underwater.
There are several ways to test snorkelers’ abilitiesto identify species underwater. One method is to cap-ture several species of fish and place them in tempo-rary live cages. Snorkelers independently view eachfish and report their results to an instructor. Or, aninstructor in the water points out fish for a snorkelerto identify and record. In both cases, results are re-viewed with the snorkeler; training continues untilall snorkelers identify target species accurately. Thestream reach to be surveyed on a given sampling tripoffers the best location to practice species identifica-tion. Snorkelers should practice throughout the fieldseason.
Estimating Fish Size—Accurately estimatingthe size of fish underwater requires practice. Objectsviewed underwater are magnified about 1.3 times.One way to estimate a fish’s size is to approach itunderwater, align its snout and tail with adjacent ob-jects, and measure that distance with a ruler (Cunjakand Power 1986). Snorkelers can carry a ruler, markone on their counting sleeve, or use a known distance(index finger to thumb, for example). Swenson andothers (1988) described a method for estimating fishsize underwater by using a dive mask with a cali-brated bar attached to it.
Snorkelers can practice estimating fish sizes byviewing objects and fish of known sizes underwater.Calibrated wooden dowels or floating cutouts of fishof various sizes can be attached to weights and dis-tributed throughout a stream channel. Snorkelersapproach each object and estimate its size. Live fishof known size can also be used. One method is to in-dividually mark fish of known sizes in a stream reach.Snorkelers approach each marked fish and estimateits size. Another method is to capture fish of severalsize classes and place them in temporary live cages(Rich 1993). Snorkelers independently view each fishand report their results to an instructor.
Training improves snorkelers’ abilities to estimatefish sizes accurately. Griffith (1981) reported thatfive observers were tested on their ability to estimate
lengths of 15 fish underwater. Before training, from52 to 72 percent of the estimates were within 25 mmof the true length. After 1 hour of practice, the mostexperienced observers estimated fish size within25 mm of the true length in 90 percent of the trials.Rich (1993) trained snorkelers with no previous ex-perience, using live cages in a hatchery raceway. After1 day of training, the novice group was able to esti-mate fish size within 25 mm of the true length in morethan 90 percent of the tests. Snorkelers should con-tinually check their size estimates throughout the fieldseason.
Estimating Fish Abundance—Snorkelers shouldbe familiar with the size of sampling units they willsurvey and the method they will use to estimate fishabundance. The selection of sampling units dependson the objectives of the study and the physical char-acteristics of the stream (see Selecting AppropriateSampling Units). Select a stream reach with physi-cal characteristics similar to those that crews willactually survey, and train snorkelers to duplicate theproposed snorkeling method. For example, if the sur-vey will be in small streams and a lone snorkeler willproceed upstream while counting all fish in individualhabitat units, duplicate those conditions in training.Provide snorkelers with an opportunity to count thetotal number of target salmonids, recording them byspecies and size class in several sampling units. Testsnorkelers’ ability to make precise counts of fish bycomparing the counts of several observers in a streamreach. If feasible, establish sampling units that con-tain a known number of fish of known sizes for test-ing snorkelers’ abilities to complete precise and accu-rate counts.
Ethics
Biologists have an incomplete understanding of thedistribution and abundance of many native salmonids.Snorkelers surveying streams in the Intermountainarea may encounter several protected native fish spe-cies that warrant special consideration. Snake Riverspring/summer and fall chinook salmon (Oncorhynchustshawytscha) are protected as threatened species andsockeye salmon (O. nerka) are protected as an endan-gered species under Section 7 of the Endangered Spe-cies Act. At the request of the National Marine Fish-eries Service, the Forest Service and other agenciesare establishing protocols to minimize any potentialeffects snorkel counts may have on these species.Snorkelers and survey crews should avoid areas whereadult salmon spawn.
Lahontan cutthroat (O. clarki henshawi) and Paiutecutthroat trout (O.c. seleniris) are federally protectedas threatened species. Bull trout (Salvelinus confluen-tus), Bonneville cutthroat (O.c. utah), Colorado River

4
cutthroat (O.c. pleuriticus), finespotted cutthroat(undescribed), redband trout (O. mykiss ssp.), andMontana grayling (Thymallus arcticus montanus)are listed as Category 2 candidates under the Endan-gered Species Act and are undergoing a status review.Westslope cutthroat (O.c. lewisi) and Yellowstone cut-throat trout (O.c. bouvieri) are listed as sensitive spe-cies by the Forest Service, U.S. Department of Agricul-ture, and the States of Idaho and Montana. Steelhead(O. mykiss) are listed as a sensitive species by the For-est Service and the State of Idaho. Some States havelegislation making it illegal to harass any fish. UnderTitle 36 Idaho Code, it is illegal to “harass any fish bystriking it…or chasing it up or downstream in anymanner.” Crew members should not touch or in anyway disturb protected fish while conducting snorkelsurveys. If the study objectives require capturingfederally protected species, a National Marine Fish-eries Service or U.S. Fish and Wildlife Service permitwill be required in addition to a State collecting permit.
Fish population surveys provide information thatis used to sustain and enhance fisheries resources.Snorkelers may encounter concentrations of fish andlarge individuals of some species. These fish may behighly vulnerable to angling. Considering the sensi-tive status of many native fish in the IntermountainWest, crew members should not harvest fish fromstreams they survey or pass survey results to otheranglers.
RECOMMENDED SNORKELINGPROTOCOLS
In this section I recommend procedures for measur-ing fish distribution, abundance, habitat use, andsize structure. The protocols outline sampling designsand procedures, illustrate the principal sources oferror, and suggest approaches for reducing the errorof estimates.
Timing
Seasonal timing of snorkel surveys depends on theobjectives of the study and the behavior of the targetspecies. If the objective is to estimate the abundanceof fish or the habitat use by a certain life stage of aspecies, the investigator must have some knowledgeof fish behavior. For example, if the objective is toestimate the abundance of juvenile steelhead, the sur-vey might be conducted in summer rearing areas. Ifthe objective is to characterize habitat used by adultbull trout before spawning, the survey might be con-ducted before August. Underwater counts of fish aremost reliable if conducted when emigration and immi-gration are minimal. Resident and anadromous sal-monids migrate, and their behavior and habitat use
vary by season. Most species maintain relatively staticsummer ranges between the stabilization of stream-flows in late June or July and the onset of coolerwater temperatures in early September (Bjornn 1971;Edmundson and others 1968). Streams are generallysuitable for summer estimates of population densitybetween early July and late August.
Daytime underwater visibility is generally bestbetween late morning and early afternoon when thesun is directly overhead. Cloudy or overcast daysmay be most suitable for sampling sites with abun-dant overhead cover. On clear days, dark shadowsmay form beneath cover, and the snorkeler mustswim into the shadows to observe fish. A small halo-gen light may be used to search for fish in shaded loca-tions. On overcast days, the contrast between lightand shadow is reduced; fish beneath cover, such asundercut banks, can be observed farther away. Ifminimum depth, velocity, and temperature criteriaare met, the presence of direct sunlight or the time ofday may not be critical. Hillman and others (1992)found no significant relationship between the time ofday and the accuracy of counts. Time of day will in-fluence water temperature, however, and snorkelersmay need to schedule surveys carefully to meet tem-perature criteria.
Nighttime surveys may be more effective for study-ing salmonids than daytime surveys under someconditions. Fish that remain concealed during day-light often move out of cover and are visible at night(Campbell and Neuner 1985; Goetz 1990; Griffithand Smith 1993).
Ambient light levels influence the behavior and dis-tribution of fish at night. Robinson and Barraclough(1978) observed differences in the behavior of sock-eye salmon during dark moon phases compared tofull moon phases. If underwater surveys are doneat night, they should be completed during the samemoon phase to avoid additional bias.
Minimum Criteria
Before developing the study design and selectingthe appropriate sampling units, certain minimumcriteria for water depth, temperature, and visibilitymust be met in the proposed study stream.
Depth—The area to be surveyed must be deepenough to enable observers to submerge a mask. Shal-lower water limits the snorkelers’ ability to view fishhiding beneath and behind obstructions. Snorkelerscan count fish in water that is deep enough to sub-merge a mask, but too shallow to float the snorkeler,provided the observer can crawl through the unit.Shallow water along stream margins makes it diffi-cult for a team of divers to maintain an organized linewhile floating downstream (Schill and Griffith 1984).

5
Temperature—Water temperature influences fishbehavior and may bias underwater counts. As tem-peratures decline, stream-dwelling salmonids in theIntermountain West typically migrate or seek con-cealment cover. Salmonids may migrate from sum-mer habitat into other portions of the watershed astemperatures decline below 10 °C (Bjornn 1971).Movement into concealment cover at reduced watertemperatures is well documented for a variety of resi-dent and anadromous salmonids, including juvenilechinook salmon (Edmundson and others 1968; Hillmanand others 1987), juvenile steelhead (Bustard andNarver 1975; Edmundson and others 1968; Everestand Chapman 1972), cutthroat trout (Bustard andNarver 1975; Griffith and Smith 1993), and rainbowtrout (Campbell and Neuner 1985). The accuracy ofunderwater counts of juvenile salmonids declineswith decreased water temperatures (Angradi andContor 1989; Hillman and others 1992; Riehle 1990;Shepard and others 1982). At water temperaturesbelow 9 °C, most juvenile salmonids hide during thedaytime, and counts underestimate the true popula-tion. Accuracy of counts improves as temperaturesincrease above 9 °C (Hillman and others 1992).
The effects of temperature may be both species andstream specific. Bull trout are uncommon where watertemperatures exceed 15 °C (Fraley and Shepard 1989;Goetz 1990). Lahontan cutthroat trout frequentlyoccur in waters with temperatures up to 26 °C (Nelsonand others 1992). In streams that rarely exceed 10 °C,it may be possible to accurately count fish, even attemperatures lower than 9 °C. In streams that com-monly exceed 20 °C, salmonids may migrate or seekcover at temperatures warmer than 9 °C.
In general, daytime surveys of fish in summer rear-ing habitat should be conducted when stream temper-atures exceed 9 °C. Observers should carry an accu-rate thermometer to measure water temperatures ineach sampling unit. However, because the effects oftemperature may be species and stream specific, in-vestigators may need to adapt their survey to localtemperature regimes.
Visibility—Water clarity can severely limit anobserver’s ability to count fish reliably. Palmer andGraybill (1986) observed a significant positive corre-lation between visibility and numbers of fish observedas visibility increased above 2 m. Researchers work-ing in a variety of streams have recommended mini-mum visibilities ranging from 1.5 to 4 m for under-water counts (Gardiner 1984; Griffith and others 1984;Hillman and others 1992; Zubik and Fraley 1988).Researchers agree that the minimum acceptable vis-ibility depends on the target species, the nature of thephysical habitat, and the experience of the snorkeler.The water must be clear enough to allow snorkelersto see the stream bottom in the deepest sampling
unit, identify fish by species, and detect fish tryingto avoid the snorkeler. Within most small streamsof the Intermountain West, visibility of 3 to 4 m willmeet the listed criteria. Larger, deeper streams willrequire greater water clarity. In most cases, abun-dance estimates should not be made in units wherewater clarity does not exceed maximum water depth.As visibility increases, fewer snorkelers are neededto survey an entire unit.
The parent geology of a watershed can provide cluesabout the potential clarity of its waters and the suit-ability of snorkeling for sampling salmonid popula-tions. Most streams draining granitic rock have lowsuspended sediments, are unproductive (have low dis-solved solids), and have high visibility. In contrast,streams draining sedimentary or volcanic rock oftenhave high levels of suspended sediment, are very pro-ductive, and have low visibility.
Observers should periodically measure the visibilityof a known object in stream reaches to be surveyed.Do not assume underwater visibility is adequate with-out measuring it. A suitable object for measuringvisibility is a silhouette of a salmonid drawn withparr marks and spots. Estimate visibility by averag-ing measurements of the minimum distance at whichthe marks on a silhouette are visible to the snorkeler.To locate the minimum distance, the snorkeler movesaway from the object and notes the distance at whichit disappears, then moves toward the object and notesthe minimum distance at which it reappears clearly.Storms and other events can periodically reduce vis-ibility in streams that are otherwise suitable for snor-keling. If this occurs, stop snorkeling and resume afterconditions improve.
In some portions of some sampling units, turbu-lence will reduce local visibility, even though waterclarity in the unit is adequate. Snorkelers shouldsurvey areas surrounding the turbulence first andthen attempt to survey the turbulent areas. Salmo-nids typically maintain territories outside areas ofextreme turbulence although they may seek coverin turbulent areas if disturbed.
Selecting Appropriate Sampling Units
The selection of sampling units is controlled by theobjectives and design of the study, physical characteris-tics of the stream environment, and the investigator’sbudget. Good experimental design is crucial to dis-tinguish among different hypotheses (Hurlbert 1984).Design of experiments is beyond the scope of thisguide. The reader is urged to review texts on the sub-ject and papers by Hurlbert (1984), McAllister andPeterman (1992), and Romesburg (1981).
Underwater survey techniques are flexible; samplingunits can be adapted to the investigators’ needs. Avariety of sampling units may be selected.

6
salmonids face the current, a snorkeler moving up-stream is less likely to startle fish. As Heggenes andothers (1990) reported, a snorkeler who moves slowlycan nearly touch fish before they are frightened.Fish are counted as the snorkeler passes them soduplicate counts are avoided. Any fish that reenterthe observer’s view can be seen moving upstream.When it is impractical to move upstream, snorkelersmay enter the water upstream from the samplingunit and float downstream with the current, remain-ing as motionless as possible. Fish are counted byspecies and size class. Sizes can be estimated by ap-proaching fish, aligning their snout and tail with ad-jacent objects, and measuring that distance with arule or marked glove (see Training, Estimating FishSize).
Water clarity, physical obstructions, and the typeof estimate will determine the number of observersneeded to complete the survey. As a general rule,enough snorkelers are needed to complete the surveyin a single pass. The following section describes vari-ous types of estimates and considerations for thenumber of observers required.
Direct Enumeration—Direct enumeration proce-dures can be used to count the total number of fishwithin a given sampling unit. Typically, either oneobserver or multiple observers count all fish in a sin-gle pass. This method assumes the counts of fish areaccurate.
In small streams with excellent visibility, one snor-keler may be able to see from bank to bank. The ob-server counts all fish in the entire sampling unit usingone of three approaches. Depending on the character-istics of the unit, the snorkeler can proceed up the cen-ter of the unit and count fish by zigzagging outward
One investigator may select sample units thatinclude several habitat types (pools, runs, riffles,glides) and that represent large segments of thestream. Schill and Griffith (1984) estimated the sea-sonal abundance of Yellowstone cutthroat trout inthe Yellowstone River. They selected four samplingunits ranging from 350 to 1,316 m long, composed ofseveral habitat types.
Another investigator may stratify a large water-shed into sections and sample units within each sec-tion. Thurow (1985) monitored the abundance ofjuvenile steelhead in a 160-km section of the MiddleFork Salmon River. He systematically selected 20sampling units spaced about 8 km apart. To maxi-mize the number of fish counted, he selected units inoptimal steelhead rearing areas consisting of pocket-water habitat.
Other investigators may stratify small streams intohabitat units, count fish in a random or systematicsample of the units, and extrapolate abundance esti-mates from the sampled units to a total estimate foreach stream. Hankin and Reeves (1988) estimatedthe total abundance of fish in small coastal streams.The authors estimated the total area of each habitattype. After the starting point was randomly selected,sampling units consisted of systematically selectedhabitats of each type. Total numbers of fish were es-timated in each unit and averaged. A total estimateof fish abundance in each habitat type was derivedby multiplying the mean abundance per habitat typeby the area of the respective habitat type and sum-ming across all habitat types. Sampling by habitattype reduces the variance of the expanded estimateby accounting for the influence of habitat type on fishabundance.
If sampling units will be resurveyed in the future,they should be recorded permanently so other investi-gators can relocate them. Some useful techniques areto mark the units on a topographic map; photographthem, taking care to include permanent landmarksin the photo; and sketch a detailed map of the unitillustrating access, physical features, starting andending points of the survey, and the point from whichthe photo was taken (see appendix A).
Snorkeling Procedures
When selecting an appropriate snorkeling procedure,the investigator must consider the direction of thesurvey, the number of snorkelers required, and thetype of estimate desired.
Where feasible, moving upstream against the cur-rent is the most effective snorkeling technique. Snor-kelers should enter the water downstream from theunit to be surveyed and proceed upstream slowly whileavoiding sudden movements (fig. 1). Because most
Figure 1—In small streams, one snor-keler enters the water downstream fromthe sampling unit and proceeds slowlyupstream.

7
to both banks (fig. 2). Care should be taken to searchfor fish throughout the unit, including the margins,and to inspect all cover components (such as under-cut banks, substrate, organic debris). If the wateris too deep or turbulent to zigzag and visibility is ad-equate, the observer moves up one bank of the unitand counts all fish to the other bank. In water toodeep to count upstream, the observer floats down thecenter of the unit and counts all fish from bank tobank, remaining as motionless as possible.
Although water clarity may allow one observer tosee across the width of the channel, another snorkelermay be needed to count fish concealed by visual ob-structions such as boulders, ledges, and organic debrisif all fish are to be counted in a single pass. Shallowhabitats (pocket water, riffles) typically require moreobservers than deep-water habitats. To avoid re-counting fish, observers should stay adjacent to eachother, move at the same speed, and only count fishthat pass them.
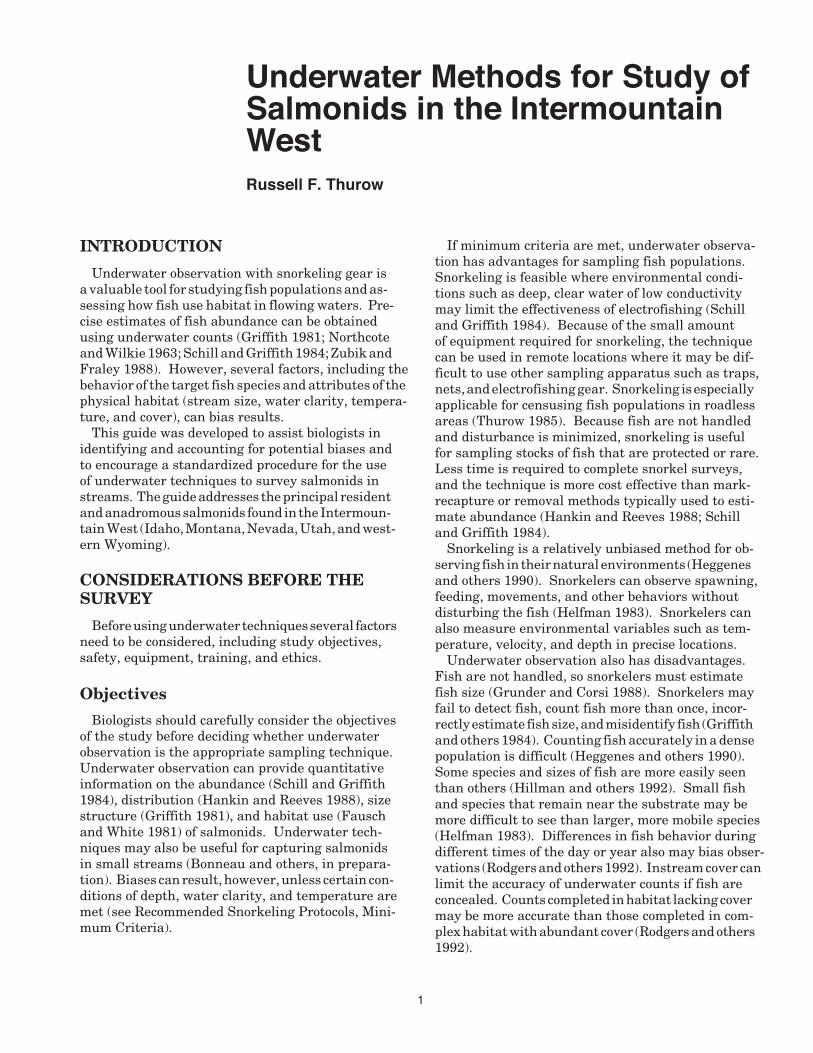
If two snorkelers are used, the unit is divided, andsnorkelers use one of three techniques. Where feasible,the unit is divided in half. Snorkelers begin in thecenter of the unit, move upstream shoulder to shoul-der, and count all fish between themselves and thebank (fig. 3). If the unit is too deep or turbulent toallow that approach, snorkelers can use natural breaksand features such as boulders to divide the unit. Snor-kelers count all fish in their portion of the unit. Inwater too deep to move upstream, two snorkelers lockhands and float down the center of the unit, countingall fish from their shoulders to the bank.
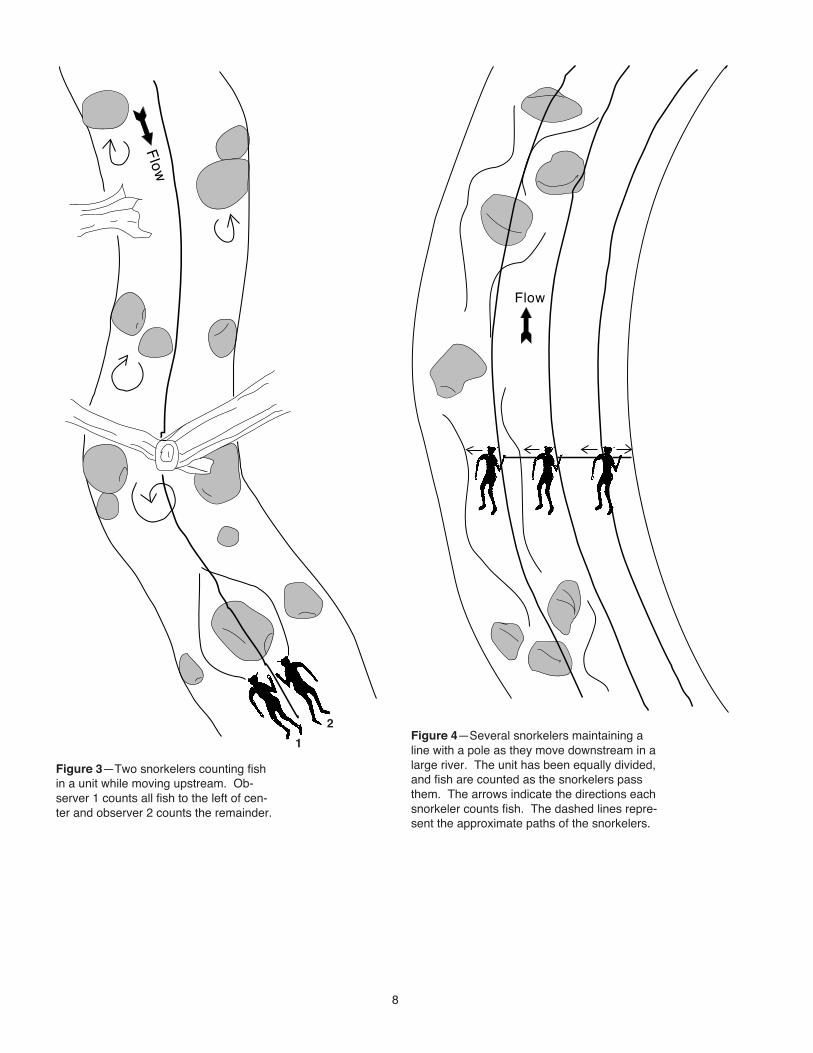
With three or more snorkelers, the unit is dividedinto equal corridors. Snorkelers proceed upstreamand count all fish in one direction between themselvesand the adjacent snorkeler. Snorkelers nearest theshore also count all fish between themselves and thenearest bank. Fish are not counted until they passsnorkelers. In water too deep to proceed upstream,snorkelers hold onto lengths of PVC pipe to maintain astraight counting line (Schill and Griffith 1984) (fig. 4).The distance between observers should always be lessthan the maximum underwater visibility. For exam-ple, if the visibility is 6 m, snorkelers should be sta-tioned less than 6 m apart during the survey.
When it is not feasible to count all fish from bank tobank, snorkelers may count fish within a subunit ofthe stream channel. Snorkelers measure the under-water visibility and count all fish within their rangeof vision. The area surveyed is estimated by multiply-ing the length snorkeled by the visible corridor.
With either one or several observers, fish are countedby species and size class. Counts are recorded on aPVC cuff or slate and later transferred to a data sheet(appendix B). After completing counts, observers orother crew members measure the surface area of thesnorkeled unit. Record the total length of the unit
and measure the width at three or more equallyspaced intervals. The surface area can be estimatedeither by multiplying the length times a mean widthor by calculating the area of individual segments andpooling them for a total area estimate. The densityof fish is typically expressed as the number of fish
Figure 2—A snorkeler counting fish in asingle pass zigzags through an entire unitwhile moving upstream. The dashed linerepresents the approximate path of thesnorkeler who counts fish left and right.
Flow
8
Flow
Figure 3—Two snorkelers counting fishin a unit while moving upstream. Ob-server 1 counts all fish to the left of cen-ter and observer 2 counts the remainder.
Flow
Figure 4—Several snorkelers maintaining aline with a pole as they move downstream in alarge river. The unit has been equally divided,and fish are counted as the snorkelers passthem. The arrows indicate the directions eachsnorkeler counts fish. The dashed lines repre-sent the approximate paths of the snorkelers.
1
2
9
marked and unmarked fish are randomly mixed andhave equal chances of being seen. When sample sizesare sufficient, population estimates are calculated foreach size class using Chapman’s modification of thePeterson mark-recapture technique (Ricker 1975):
(M + 1) (C + 1) (R + 1)
where
M = number markedC = number captured (observed)R = number of marked fish recaptured (observed)N = population estimate.
A total population estimate is derived by pooling theestimates for each size class. Ricker (1975) lists for-mulas for calculating confidence intervals around theestimate.
Habitat-Use Estimates—Direct underwater obser-vation has become increasingly popular for observingfish in their natural environments (Heggenes andothers 1990). Underwater observation is generallyconsidered unbiased for studying fish habitat use,particularly because fish can be observed withoutdisturbing them. Researchers have used snorkelingtechniques to study habitat use of different salmonidlife stages (Cunjak 1988; Cunjak and Power 1986;Fausch and White 1981; Rimmer and others 1984).Snorkelers typically move upstream through the sam-pling unit, searching for fish. Upon encountering afish, the observer carefully notes the species and itsfocal point (the location of the fish’s snout). The fishis approached and its size estimated. If more accurateestimates of fish size, weight, or food habits are re-quired, fish can be collected underwater using severaltechniques. Lethal methods of capture include explo-sive charges (Everest 1978) and spear guns (Helfman1983). Nonlethal capture methods include slurp guns(Morantz and others 1987), nets (Bonneau and others,in preparation), and electrofishing (James and others1987). A weight and float can be used to mark thefish’s focal point or a measurement can be taken atthe focal point immediately after the fish is observed.A series of macrohabitat and microhabitat measure-ments can be made to describe the habitat used bythe fish. This method assumes that fish are undis-turbed when first sighted, so their position reflectsconditions selected by the fish.
Precision and Accuracy
Precision is a measure of the repeatability of meas-urements. Precise estimates tend to have small vari-ance. The statistical precision of underwater estimatesof fish abundance is derived by replicating counts.Counts may be replicated temporally within the same
per 100 m2 or the number of fish per hectare. Byconverting fish counts to densities, the investigatorstandardizes the data, making it possible to comparecounts spatially and temporally, both within a water-shed and among watersheds.
If counts within individual units are replicated, av-erage density and variance can be calculated, and con-fidence limits can be placed around the mean (Schilland Griffith 1984). Hankin and Reeves (1988) list for-mulas for estimating total fish abundance and calcu-lating confidence limits around the estimates.
Expansion Estimates—The expansion methodmay be used to estimate the total population of fishin sampling units where total enumeration is not fea-sible. Expansion methods may be needed in largerivers where too few observers are available to surveythe entire channel width in a single pass. This methodassumes counts are accurate and the density of fishin each snorkeler’s lane represents the unsampledarea. The investigator typically stratifies the sam-pling unit into relatively homogeneous sections (suchas bank and midchannel) (Grunder and Corsi 1988).Within each stratified area, counting lanes are se-lected randomly with widths less than or equal tothe underwater visibility. One snorkeler counts thenumber of fish within each counting lane. Severalsnorkelers can count adjacent lanes simultaneously(see Snorkeling Procedures, Direct Enumeration).Observers are randomly assigned counting lanes, andcounts are replicated (Zubik and Fraley 1988). Thetotal population within the unit is estimated by divid-ing the total number of fish counted in each homoge-neous section by the percent of the section that wassurveyed. For example, a total of 500 cutthroat troutare counted in lanes representing 60 percent of thesampling unit. Five hundred is divided by 0.6 to de-rive a total population estimate of 833 cutthroat trout.If the unit encompassed 1.5 ha, the population den-sity equals 556 fish per hectare. If counts within in-dividual lanes are replicated, the mean density, vari-ance, and confidence limits can be calculated (Slaneyand Martin 1987).
Mark-Recapture Estimates—Underwater obser-vation can also be used in concert with other tech-niques to derive mark-recapture population estimates.Researchers have captured fish with angling gear andmarked them with brightly colored tags that are vis-ible underwater (Slaney and Martin 1987; Vore 1993;Zubik and Fraley 1988). Colored tags can be usedto differentially mark each size class of fish. Afterthe marked fish redistribute in the sampling unit,a snorkeler or team of snorkelers record the numberof marked and unmarked fish by species and size class.This method assumes no immigration or emigrationoccurs from the time of marking until the recoverysurvey, marking does not affect mortality, and both
= N
10
unit (Slaney and Martin 1987) or spatially by repli-cating multiple units in the same strata (Hankin andReeves 1988). For example, observers make threecounts in the same unit, calculate the mean and vari-ance, and place confidence limits around the meanvalue. As another example, observers count fish inseveral systematically selected units of the samestrata. Fish are counted in every 10th pool in a 30-kmreach of stream. Two counts are completed in each of20 pools. The means and variances of the 20 counts arecalculated and used to place confidence limits aroundthe mean value. Replicate counts require indepen-dence and may be completed by individual snorkelersor teams of snorkelers. Bias between snorkelers canbe reduced by using trained observers.
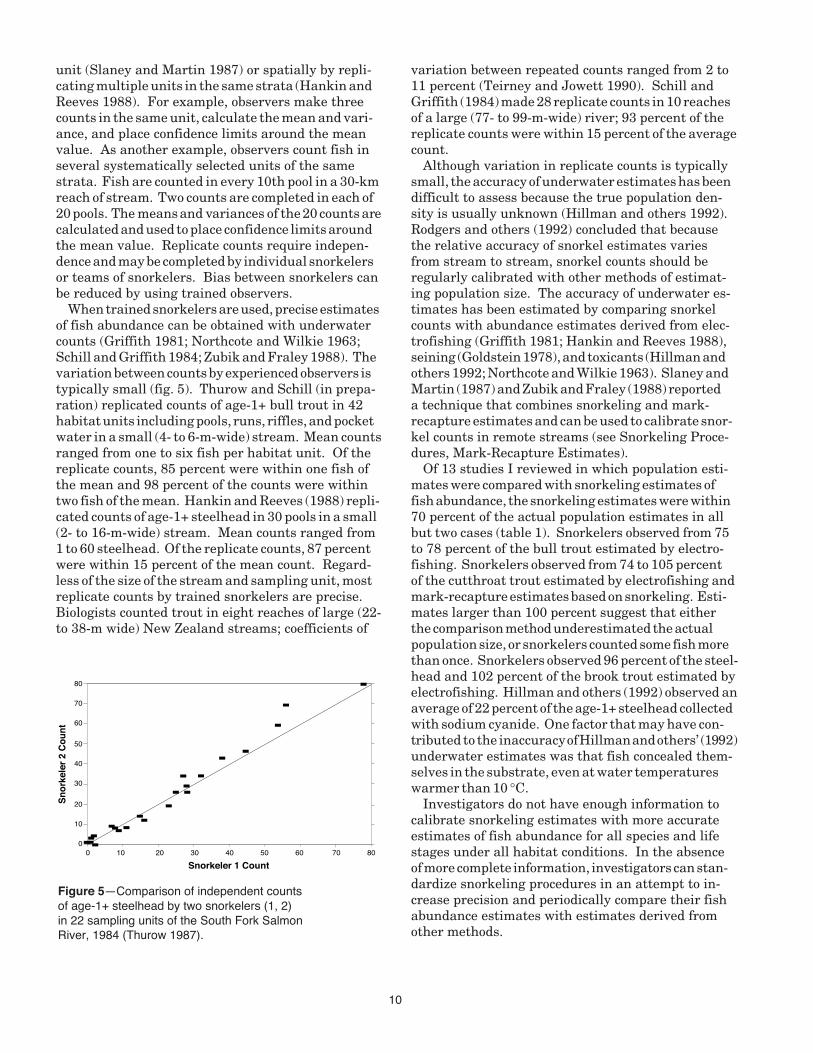
When trained snorkelers are used, precise estimatesof fish abundance can be obtained with underwatercounts (Griffith 1981; Northcote and Wilkie 1963;Schill and Griffith 1984; Zubik and Fraley 1988). Thevariation between counts by experienced observers istypically small (fig. 5). Thurow and Schill (in prepa-ration) replicated counts of age-1+ bull trout in 42habitat units including pools, runs, riffles, and pocketwater in a small (4- to 6-m-wide) stream. Mean countsranged from one to six fish per habitat unit. Of thereplicate counts, 85 percent were within one fish ofthe mean and 98 percent of the counts were withintwo fish of the mean. Hankin and Reeves (1988) repli-cated counts of age-1+ steelhead in 30 pools in a small(2- to 16-m-wide) stream. Mean counts ranged from1 to 60 steelhead. Of the replicate counts, 87 percentwere within 15 percent of the mean count. Regard-less of the size of the stream and sampling unit, mostreplicate counts by trained snorkelers are precise.Biologists counted trout in eight reaches of large (22-to 38-m wide) New Zealand streams; coefficients of
variation between repeated counts ranged from 2 to11 percent (Teirney and Jowett 1990). Schill andGriffith (1984) made 28 replicate counts in 10 reachesof a large (77- to 99-m-wide) river; 93 percent of thereplicate counts were within 15 percent of the averagecount.
Although variation in replicate counts is typicallysmall, the accuracy of underwater estimates has beendifficult to assess because the true population den-sity is usually unknown (Hillman and others 1992).Rodgers and others (1992) concluded that becausethe relative accuracy of snorkel estimates variesfrom stream to stream, snorkel counts should beregularly calibrated with other methods of estimat-ing population size. The accuracy of underwater es-timates has been estimated by comparing snorkelcounts with abundance estimates derived from elec-trofishing (Griffith 1981; Hankin and Reeves 1988),seining (Goldstein 1978), and toxicants (Hillman andothers 1992; Northcote and Wilkie 1963). Slaney andMartin (1987) and Zubik and Fraley (1988) reporteda technique that combines snorkeling and mark-recapture estimates and can be used to calibrate snor-kel counts in remote streams (see Snorkeling Proce-dures, Mark-Recapture Estimates).
Of 13 studies I reviewed in which population esti-mates were compared with snorkeling estimates offish abundance, the snorkeling estimates were within70 percent of the actual population estimates in allbut two cases (table 1). Snorkelers observed from 75to 78 percent of the bull trout estimated by electro-fishing. Snorkelers observed from 74 to 105 percentof the cutthroat trout estimated by electrofishing andmark-recapture estimates based on snorkeling. Esti-mates larger than 100 percent suggest that eitherthe comparison method underestimated the actualpopulation size, or snorkelers counted some fish morethan once. Snorkelers observed 96 percent of the steel-head and 102 percent of the brook trout estimated byelectrofishing. Hillman and others (1992) observed anaverage of 22 percent of the age-1+ steelhead collectedwith sodium cyanide. One factor that may have con-tributed to the inaccuracy of Hillman and others’ (1992)underwater estimates was that fish concealed them-selves in the substrate, even at water temperatureswarmer than 10 °C.
Investigators do not have enough information tocalibrate snorkeling estimates with more accurateestimates of fish abundance for all species and lifestages under all habitat conditions. In the absenceof more complete information, investigators can stan-dardize snorkeling procedures in an attempt to in-crease precision and periodically compare their fishabundance estimates with estimates derived fromother methods.
Figure 5—Comparison of independent countsof age-1+ steelhead by two snorkelers (1, 2)in 22 sampling units of the South Fork SalmonRiver, 1984 (Thurow 1987).
Snorkeler 1 Count
Sn
ork
eler
2 C
ou
nt
80
70
60
50
40
30
20
10
00 10 20 30 40 50 60 70 80

11
Table 1—Comparisons of salmonid population estimates made by daytime snorkeling and other techniques at water temperatures warmerthan 10 °C
Percent of actual populationStream observed by snorkeling Means of
Size size, width, Standard estimatingSpecies class flow Mean deviation (Range) N actual population Source
mm - - - - - - - - Percent - - - - - - - - -
Brook trout >100 Small, 4-6 m wide, 101.7 0.8 (101 - 103) 3 Electrofishing Griffith 1981 0.06-0.10 m3/s
>75 Small, 5 m wide 110.0 — — 1 Electrofishing Hillman and Chapman 1993
Brown trout >75 Small-medium, 105.8 12.9 (94 - 126) 5 Electrofishing Hillman and Chapman 1993 9-18 m wide
Bull trout >75 Small, 3-10 m wide 78.3 35.6 (47 - 117) 3 Electrofishing Shepard and Graham 1983>100 Small, 4-6 m wide 74.9 15.3 (48 - 86) 14 Electrofishing Thurow and Schill,
0.71 m3/s in preparation
Cutthroat trout >75 Small, 3-10 m wide 94.8 17.1 (71 - 117) 5 Electrofishing Shepard and Graham 1983>200 Large, 40+ m wide 74.1 17.3 (51 - 92) 4 Mark-recapture Slaney and Martin 1987
19-22 m3/s by angling and snorkeling
110-430 Large, 30-45 m wide 105.4 3.8 (102 - 110) 3 Mark-recapture Zubik and Fraley 1988 12-14 m3/s by angling and
snorkeling>75 Small, 4-6 m wide 102.4 2.8 (100 - 104) 4 Electrofishing Griffith 1981
0.06-0.10 m3/s
Rainbow trout >100 Large, 14 m3/s 59.0 — (36 - 86) 12 Rotenone Northcote and Wilkie 1963>75 Small, 5-9 m wide 90.8 19.7 (77 - 105) 2 Electrofishing Hillman and Chapman 1993
Steelhead >100 Small, 2-16 m wide 96.3 44.8 (50 - 209) 14 Electrofishing Hankin and Reeves 1988 0.8 m3/s
>100 Small-medium 21.8 25.4 (0 - 42) 15 Mark-recapture with Hillman and others 1992 sodium cyanide
SPECIES IDENTIFICATION ANDHABITATS
As discussed earlier (see Training), snorkelers mustpractice before conducting surveys if they are to iden-tify species accurately. The following descriptions areintended to help snorkelers identify species by observ-ing size, coloration, morphology, and behavior. Appen-dix C illustrates the external characteristics of a typi-cal salmonid. Appendix D illustrates the diagnosticexternal features of eight species of juvenile salmonids.
The sizes of salmonids surveyed will depend onthe objectives of the study and the reliability withwhich different size and age groups can be identified.Summer estimates of salmonid abundance should belimited to age-1+ fish for all species except chinooksalmon. Young-of-the-year (YOY) chinook salmontypically emerge in April or May. By early summer,YOY chinook salmon are large enough for snorkelersto identify accurately. In contrast, summer countsof YOY brook (Salvelinus fontinalis), bull, and cut-throat trout and steelhead are typically unreliable.Young-of-the-year fish of these four species are simi-lar in size and color in summer; they may be indistin-guishable to all but the most experienced snorkelers.
Most will be smaller than 80 mm during surveys inJuly and perhaps as late as August. Small fish typi-cally occupy the shallow stream margins where snor-keling is less effective. Griffith (1981) counted only20 percent of the YOY brook trout estimated by elec-trofishing, compared to 102 percent of the age-1+ brooktrout. Timing of emergence varies depending on watertemperatures, and YOY fish may be present duringsurveys one year and not the next. In 1984, YOY steel-head in a reach of the South Fork Salmon River beganemerging on July 14; 98 percent of the fry emergedby August 10 from redds that were capped with a net(Thurow 1987). In 1985, lower stream discharge andwarmer water temperatures accelerated emergence;steelhead fry began emerging from redds on July 3;98 percent of the fry had emerged by July 17 fromcapped redds. Although abundance estimates of YOYfish may be unreliable, observers should record thepresence of YOY salmonids to indicate that adultsmay have spawned in the vicinity of the sampled unit.
In order to assess size and age groups of fish accu-rately, the observer must understand the structureof the population (Griffith 1981). When informationis lacking, the observer should collect a representa-tive sample of the different size groups in the survey

12
area. The size groups suggested in this document areintended as a guide. The timing of emergence andgrowth rates vary among watersheds, and observersneed to adjust their size classes accordingly. This isparticularly true for estimating age classes of steel-head and other trout.
Anadromous Salmonids
Historically, anadromous salmonids in the Inter-mountain West were widely distributed in tributariesto the Snake River in Idaho. Current populations areconfined to the Snake River basin downstream fromHells Canyon Dam, including the Clearwater andSalmon River drainages. Species include steelhead,three races of chinook salmon (spring, summer, andfall), and sockeye salmon. Snake River coho salmon(O. kisutch) are extinct.
The abundance of wild anadromous stocks has de-clined severely and, as described earlier (see Consid-erations Before the Survey, Ethics), all stocks of salm-on are protected under Section 7 of the EndangeredSpecies Act. Wild steelhead are listed as a sensitivespecies, and adults are protected from angler harvest.Hatchery-reared anadromous fish have been widelyintroduced in attempts to supplement declining wildstocks.
Investigators should evaluate the stocking historyof the drainage to be surveyed. If hatchery-rearedfish have been introduced, it may be desirable to dis-tinguish wild from hatchery fish during the survey.The adipose fin has been removed from all hatchery-reared steelhead and some chinook salmon parr orsmolts, and a ventral fin has been removed from allchinook salmon parr or smolts stocked in Idaho wa-ters (Kiefer 1993). Hatchery-reared parr or smoltsmay also be larger than wild fish of similar age. Fishstocked as fry may not be distinguishable from wildfish.
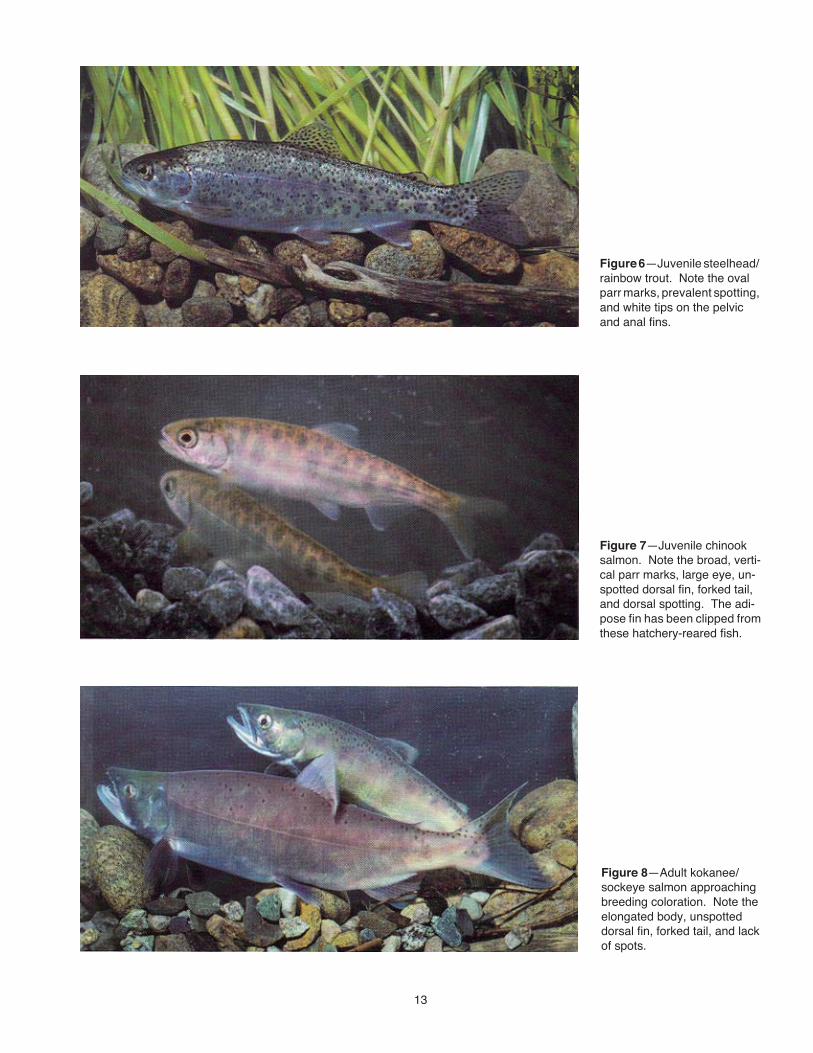
Steelhead—Juvenile steelhead use most areas ofa watershed; they typically represent the most abun-dant salmonid in Intermountain streams that areaccessible to anadromous fish. Three distinct sizeclasses are usually present: age 1 (70 to 130 mm),age 2 (130 to 200 mm), and age 3 (200 to 250 mm)(Everest 1969; Thurow 1985). Age classes may varyamong drainages. Steelhead color varies; fish aretypically bluish to olive green on the back. Their sidesare a lighter color, silver with a faint horizontal red-dish band and oval parr marks (fig. 6). The ventralsurface is white or silver. Steelhead have irregularblack spots on the back, sides, head, and dorsal andcaudal fins. Pelvic and anal fins have a distinct whitetip. The anal fin is taller than it is long. The maxillary
of juvenile fish is short and does not usually extendpast the posterior margin of the eye.
Steelhead usually maintain daytime stations closelyassociated with submerged cover. They tend to preferrubble-boulder substrates and fast water. Steelheadare territorial; they maintain some space betweenthemselves and other fish.
Chinook Salmon—Formerly abundant, chinooksalmon populations have declined rapidly since the1960’s; wild stocks in several tributaries are approach-ing extinction. Juvenile chinook will be of two discretesize classes: age 0 (50 to 80 mm) and age 1 (longer than100 mm).
Young salmon are typically greenish blue to blackon the back. Their lower sides are silver, and the ven-tral surface is white (fig. 7). The back, top of head,and upper sides are spotted. The dorsal fin is notspotted, and the adipose fin is partially pigmented.The caudal fin is distinctly forked, and the eyes arelarge, relative to the head, compared to other speciesdescribed here. Parr marks are large, broad, verticalbars centered on the lateral line. The anal fin is longerthan it is tall.
While juvenile chinook salmon tend to occupy C-typechannels (low-gradient, low-velocity, meadow reaches)(Rosgen 1985), they may use a variety of habitats.They usually associate with organic debris and over-head cover. Juvenile fish generally feed in groups inthe water column, in side channels, or along streammargins. Adult chinook typically stage in large pools(deeper than 1 m) when returning to natal spawningareas.
Sockeye Salmon/Kokanee—Within the Inter-mountain West, sockeye salmon and their residentform, kokanee, were indigenous to tributaries of theSalmon and Payette River drainages in Idaho. Rem-nant populations of sockeye salmon remain in watersof the Salmon River drainage. Kokanee remain intheir historic range and have been introduced widelythroughout the Intermountain West.
Kokanee and sockeye salmon differ little in colora-tion. The dorsal surface of the head and back is steelblue to green blue with few spots. Sides are silver withthe ventral surface white to silver. Breeding maleshave red-gray to bright red sides and olive-to-greenheads (fig. 8). Breeding females have red-gray sidesand olive heads. The body is elongated, streamlined,and compressed laterally. The head is conical, andthe snout and mouth are large. The dorsal fin is notspotted, and the adipose fin is not pigmented. Thecaudal fin is distinctly forked. Parr marks on juve-nile fish are narrow, vertical bars that do not extendbelow the lateral line. Sockeye salmon/kokanee rearin lakes and typically school.
13
Figure 6—Juvenile steelhead/rainbow trout. Note the ovalparr marks, prevalent spotting,and white tips on the pelvicand anal fins.
Figure 8—Adult kokanee/sockeye salmon approachingbreeding coloration. Note theelongated body, unspotteddorsal fin, forked tail, and lackof spots.
Figure 7—Juvenile chinooksalmon. Note the broad, verti-cal parr marks, large eye, un-spotted dorsal fin, forked tail,and dorsal spotting. The adi-pose fin has been clipped fromthese hatchery-reared fish.

14
Resident Salmonids
The Intermountain West historically supported adiverse population of indigenous resident salmonids.Stream-dwelling species included rainbow or redbandtrout, bull trout, mountain whitefish (Prosopium wil-liamsoni), grayling, and nine subspecies of cutthroattrout. A combination of factors including habitatdegradation, genetic introgression, and exploitationhave contributed to the decline of native salmonidpopulations (Rieman and McIntyre 1993; Thurowand others 1988).
Several species of resident salmonids have beenpropagated in hatcheries and introduced in the Inter-mountain West. Since the 1870’s, stocks of rainbowtrout have been mixed and reared in hatcheries withlittle regard to their ancestry (Behnke 1992). Thesehatchery rainbow trout stocks have been widely in-troduced to waters containing native salmonid popu-lations. Similarly, cutthroat trout, especially theYellowstone subspecies, have been introduced intoIntermountain streams outside their original range(Varley and Gresswell 1988). Exotic species includingbrook (Salvelinus fontinalis) and brown trout (Salmotrutta) have been widely introduced.
Before conducting underwater surveys, investigatorsshould evaluate the stocking history of target drain-ages to determine the species that may be present. Ifhatchery-reared fish have recently been introduced,it may be desirable to distinguish them from wild fish.The dorsal or pectoral fin rays will be bent or appearclipped on most fish that have been reared in hatch-eries for more than 3 months.
Rainbow Trout—In drainages where steelhead arepresent, nonanadromous rainbow trout may be distin-guished from steelhead by their size. It is unlikelythat steelhead parr larger than 250 mm will migrate(Thurow 1985). It is reasonable to assume that allsteelhead/rainbow larger than 250 mm are nonsmolt-ing steelhead or resident rainbow trout. Below migra-tion barriers, steelhead/rainbow less than 250 mmshould be considered steelhead because they are in-distinguishable from resident rainbow trout. Rainbowtrout larger than 250 mm are usually seen in deep-water habitats. They seldom use habitats preferredby juvenile steelhead.
In drainages where steelhead are not present, resi-dent rainbow or redband trout may be distinguishedfrom other resident species by their coloration and parrmarks. Although rainbow trout may vary in appear-ance among drainages, they will retain characteristicssimilar to steelhead (see Anadromous Salmonids,Steelhead).
Cutthroat Trout Subspecies—Cutthroat trouthave the broadest distribution of any species of trout
in North America (Behnke 1992). Within the Inter-mountain West, cutthroat trout were the most wide-ly distributed trout in Idaho, Montana, and Nevada,and were the only native trout in Utah and Wyoming.Nine subspecies of cutthroat trout exist in the Inter-mountain area (appendix E): westslope, Yellowstone,Bonneville, Colorado River, finespotted, Lahontan,Paiute, Alvord (undescribed), and Humboldt(undescribed).
It is beyond the scope of this guide to describe eachform. Each subspecies exhibits different colorationand spotting patterns. Snorkelers should be famil-iar with the distribution of cutthroat trout in theirlocality before conducting surveys. Behnke (1992)cites more detailed taxonomic information that canassist in identifying subspecies.
Cutthroat trout are often the most common residenttrout in streams. Resident and migratory populationsmay be present. Fish of several age classes are usuallypresent. It is not feasible to estimate age classes visu-ally because age and size classes overlap. Cutthroattrout can be recorded to the nearest 100-mm lengthgroup. Most YOY fish are smaller than 70 mm.
Color and spotting pattern vary by subspecies.Most westslope cutthroat trout are greenish blue tosteel gray on the back and upper sides. Their lowersides are yellow green to copper, and their belly issilver. Large fish may be distinctively red orange onthe lower sides. The spotting pattern is distinct andis a good diagnostic feature: spots are irregular inshape with more spots concentrated above the lat-eral line and posterior to the anal fin (fig. 9). Anarch drawn from the pectoral fin to the anal fin hasfew spots below it and several spots above it. Fewspots are found on the head or anal fin.
Finespotted Snake River cutthroat trout also havea unique color and spotting pattern. This subspecieshas the smallest spots of any trout native to the In-termountain West (fig. 10). The spots are profuseand resemble a heavy sprinkling of ground pepper(Behnke 1992). The color of finespotted cutthroattrout resembles that of the Yellowstone cutthroattrout. However, the finespotted subspecies has redventral fins, and its sides may be yellower than theYellowstone subspecies.
Juvenile cutthroat trout of several subspecies haveoval parr marks and white fin margins; they appearsimilar to juvenile steelhead/rainbow trout. Both thespotting pattern and coloration should be used toidentify cutthroat trout. The maxillary is longer thana steelhead’s, extending past the posterior margin ofthe eye. The red/orange slash underneath the jawmay not be visible.
Cutthroat trout subspecies use all habitat types,but tend to be most abundant in pools and habitatswith low water velocity. Larger fish generally use

15
deep pools and maintain stations in the water columnor move through the pool. Juvenile fish associateclosely with overhead and instream cover.
Bull Trout—Bull trout are the only char nativeto the Intermountain West and are perhaps the leastunderstood salmonid. Resident and migratory popu-lations exist. Fish of several age classes may be ob-served; some may be longer than 600 mm. Like cut-throat trout, bull trout can be recorded to the nearest100 mm. Most YOY fish are smaller than 80 mm.
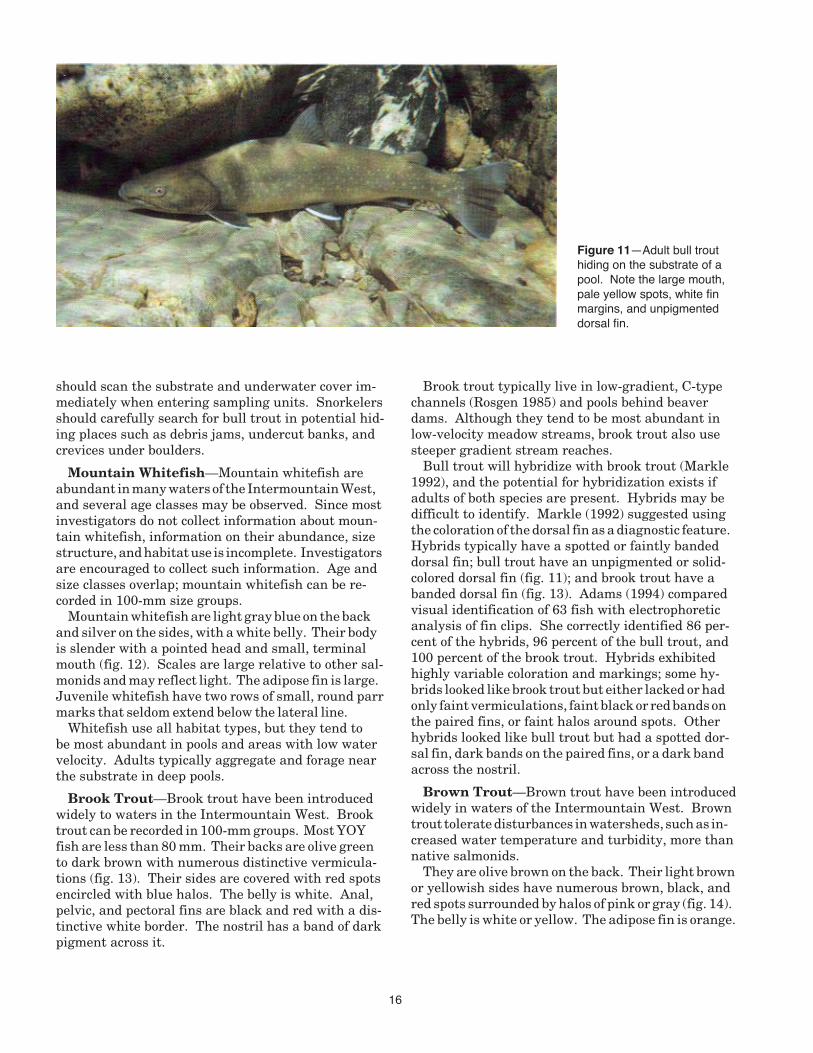
Their backs are normally olive green to brown withwhite or pale yellow spots (fig. 11). Their sides arepale in color with orange or red spots visible on adultsand white or pale yellow spots on juveniles. Fins aretinged with yellow orange; the pectoral, pelvic, andanal fins have white borders. The dorsal fin is typi-cally unpigmented or of a solid color. Bull trout may
have vermiculations (wormlike markings) on theirback, although they are not as distinctive as thoseof brook trout. Small fish have irregular parr marksthat appear as dark blotches. Compared to other spe-cies, the head is long with a large mouth and long,blunt snout. Eyes are sloped toward the top of thehead more prominently than other salmonids.
Their cryptic coloration makes bull trout difficultto see. They typically reside on or just above the sub-strate. Some researchers suggest that daytime countsunderestimate the true abundance of bull trout andare less accurate than nighttime counts (Fraley andShepard 1987; Goetz 1990). Schill (1991) found nosignificant difference in day and night counts. Bulltrout appear to prefer cold water (less than 15 °C),coarse substrate, and organic debris. Because bulltrout may seek cover before other species do, snorkelers
Figure 9—Adult westslope cut-throat trout cruising through apool. Note the distinctive spot-ting pattern, copper-coloredsides, and orange slash under-neath the jaw.
Figure 10—Adult finespottedSnake River cutthroat trout.Note the distinctive, small,pepperlike spots, reddish colorof the ventral fin margins, andorange slash underneath thejaw.
16
should scan the substrate and underwater cover im-mediately when entering sampling units. Snorkelersshould carefully search for bull trout in potential hid-ing places such as debris jams, undercut banks, andcrevices under boulders.
Mountain Whitefish—Mountain whitefish areabundant in many waters of the Intermountain West,and several age classes may be observed. Since mostinvestigators do not collect information about moun-tain whitefish, information on their abundance, sizestructure, and habitat use is incomplete. Investigatorsare encouraged to collect such information. Age andsize classes overlap; mountain whitefish can be re-corded in 100-mm size groups.
Mountain whitefish are light gray blue on the backand silver on the sides, with a white belly. Their bodyis slender with a pointed head and small, terminalmouth (fig. 12). Scales are large relative to other sal-monids and may reflect light. The adipose fin is large.Juvenile whitefish have two rows of small, round parrmarks that seldom extend below the lateral line.
Whitefish use all habitat types, but they tend tobe most abundant in pools and areas with low watervelocity. Adults typically aggregate and forage nearthe substrate in deep pools.
Brook Trout—Brook trout have been introducedwidely to waters in the Intermountain West. Brooktrout can be recorded in 100-mm groups. Most YOYfish are less than 80 mm. Their backs are olive greento dark brown with numerous distinctive vermicula-tions (fig. 13). Their sides are covered with red spotsencircled with blue halos. The belly is white. Anal,pelvic, and pectoral fins are black and red with a dis-tinctive white border. The nostril has a band of darkpigment across it.
Brook trout typically live in low-gradient, C-typechannels (Rosgen 1985) and pools behind beaverdams. Although they tend to be most abundant inlow-velocity meadow streams, brook trout also usesteeper gradient stream reaches.
Bull trout will hybridize with brook trout (Markle1992), and the potential for hybridization exists ifadults of both species are present. Hybrids may bedifficult to identify. Markle (1992) suggested usingthe coloration of the dorsal fin as a diagnostic feature.Hybrids typically have a spotted or faintly bandeddorsal fin; bull trout have an unpigmented or solid-colored dorsal fin (fig. 11); and brook trout have abanded dorsal fin (fig. 13). Adams (1994) comparedvisual identification of 63 fish with electrophoreticanalysis of fin clips. She correctly identified 86 per-cent of the hybrids, 96 percent of the bull trout, and100 percent of the brook trout. Hybrids exhibitedhighly variable coloration and markings; some hy-brids looked like brook trout but either lacked or hadonly faint vermiculations, faint black or red bands onthe paired fins, or faint halos around spots. Otherhybrids looked like bull trout but had a spotted dor-sal fin, dark bands on the paired fins, or a dark bandacross the nostril.
Brown Trout—Brown trout have been introducedwidely in waters of the Intermountain West. Browntrout tolerate disturbances in watersheds, such as in-creased water temperature and turbidity, more thannative salmonids.
They are olive brown on the back. Their light brownor yellowish sides have numerous brown, black, andred spots surrounded by halos of pink or gray (fig. 14).The belly is white or yellow. The adipose fin is orange.
Figure 11—Adult bull trouthiding on the substrate of apool. Note the large mouth,pale yellow spots, white finmargins, and unpigmenteddorsal fin.

17
Figure 12—Adult mountainwhitefish near the bottom ofa pool. Note its slender body,small terminal mouth, silvercolor, large scales reflectinglight, and forked tail.
Figure 14—Adult browntrout. Note the brown andyellow coloration and spotswith gray halos.
Figure 13—Adult brook trout.Note the vermiculations on theback, distinctive red spots en-circled in halos, white borderson the fins, and banded dorsalfin.

18
Species Other Than Salmonids
Several species other than salmonids may be en-countered during snorkel surveys. Three commonspecies can be confused with trout or salmon: north-ern squawfish (Ptychocheilus oregonensis), redsideshiners (Richardsonius balteatus), and suckers(Catostomus spp.). Although the lack of an adiposefin is a diagnostic characteristic, snorkelers shouldbe familiar with the distribution of nonsalmonids toavoid confusion.
Northern squawfish can exceed 500 mm in length.Their body is elongate, with a long, tapered head. Thesnout is long, and the mouth is large. Their back isdark olive green, the sides are gray silver, and thebelly is yellow white (fig. 15). The caudal fin is deeplyforked. Squawfish tend to reside at lower elevationsin slow-moving stream reaches. They are typicallyobserved near the bottom of large pools.
Redside shiners generally cluster together; theyrarely exceed 100 mm in length. The body is deep andcompressed laterally with a long caudal peduncle andforked tail. Their back is steel blue, dark olive, orbrown; the sides and belly are silver (fig. 16). Theireyes are large relative to their head, similar to chinook
salmon. They can be distinguished from chinooksalmon by the lack of an adipose fin and spots, andby the dark lateral stripe extending from the snout tothe base of the tail. In adults, a reddish coloration isoften present from the opercle to the anal fin. Redsideshiners typically use slow-moving reaches of streamswith warmer temperatures.
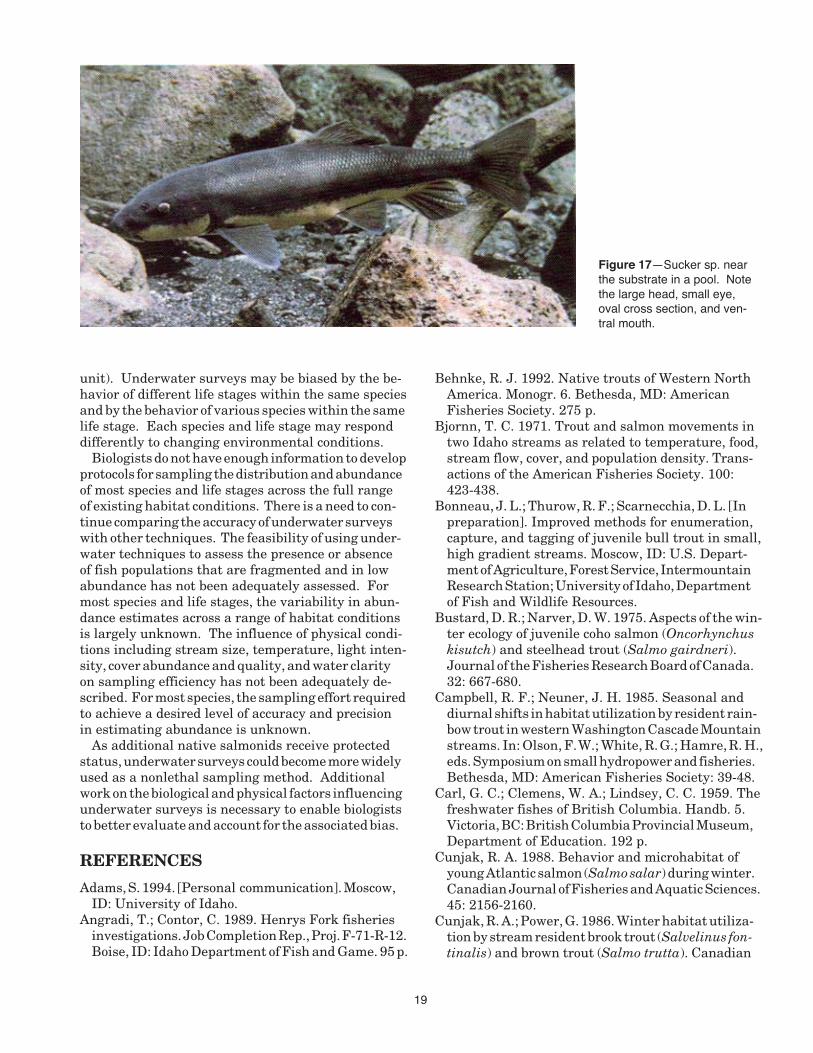
Suckers are usually observed in aggregations; theycan exceed 400 mm in length. Their bodies are long,with an oval cross section. Their head is large withsmall eyes and a long, blunt snout (fig. 17). The mouthis ventral with thick, fleshy lips. Suckers tend to besedentary and reside near the substrate.
Snorkelers may encounter other nonsalmonid spe-cies, including dace (Rhinichthys spp.) and sculpin(Cottus spp.). These species are typically small (lessthan 100 mm) and sedentary; they are not likely tobe confused with age-1+ salmonids.
RESEARCH NEEDS
The accuracy and precision of underwater surveysof salmonids is strongly influenced by biological fac-tors (behavior of the target species) and by physicalconditions (environmental attributes of the sampling
Figure 15—Adult northernsquawfish. Note the largemouth, forked tail, lack ofspots, and absence of anadipose fin.
Figure 16—Juvenile redsideshiner. Note the lack of parrmarks, lack of spots, and ab-sence of an adipose fin.
19
unit). Underwater surveys may be biased by the be-havior of different life stages within the same speciesand by the behavior of various species within the samelife stage. Each species and life stage may responddifferently to changing environmental conditions.
Biologists do not have enough information to developprotocols for sampling the distribution and abundanceof most species and life stages across the full rangeof existing habitat conditions. There is a need to con-tinue comparing the accuracy of underwater surveyswith other techniques. The feasibility of using under-water techniques to assess the presence or absenceof fish populations that are fragmented and in lowabundance has not been adequately assessed. Formost species and life stages, the variability in abun-dance estimates across a range of habitat conditionsis largely unknown. The influence of physical condi-tions including stream size, temperature, light inten-sity, cover abundance and quality, and water clarityon sampling efficiency has not been adequately de-scribed. For most species, the sampling effort requiredto achieve a desired level of accuracy and precisionin estimating abundance is unknown.
As additional native salmonids receive protectedstatus, underwater surveys could become more widelyused as a nonlethal sampling method. Additionalwork on the biological and physical factors influencingunderwater surveys is necessary to enable biologiststo better evaluate and account for the associated bias.
REFERENCES
Adams, S. 1994. [Personal communication]. Moscow,ID: University of Idaho.
Angradi, T.; Contor, C. 1989. Henrys Fork fisheriesinvestigations. Job Completion Rep., Proj. F-71-R-12.Boise, ID: Idaho Department of Fish and Game. 95 p.
Behnke, R. J. 1992. Native trouts of Western NorthAmerica. Monogr. 6. Bethesda, MD: AmericanFisheries Society. 275 p.
Bjornn, T. C. 1971. Trout and salmon movements intwo Idaho streams as related to temperature, food,stream flow, cover, and population density. Trans-actions of the American Fisheries Society. 100:423-438.
Bonneau, J. L.; Thurow, R. F.; Scarnecchia, D. L. [Inpreparation]. Improved methods for enumeration,capture, and tagging of juvenile bull trout in small,high gradient streams. Moscow, ID: U.S. Depart-ment of Agriculture, Forest Service, IntermountainResearch Station; University of Idaho, Departmentof Fish and Wildlife Resources.
Bustard, D. R.; Narver, D. W. 1975. Aspects of the win-ter ecology of juvenile coho salmon (Oncorhynchuskisutch) and steelhead trout (Salmo gairdneri).Journal of the Fisheries Research Board of Canada.32: 667-680.
Campbell, R. F.; Neuner, J. H. 1985. Seasonal anddiurnal shifts in habitat utilization by resident rain-bow trout in western Washington Cascade Mountainstreams. In: Olson, F. W.; White, R. G.; Hamre, R. H.,eds. Symposium on small hydropower and fisheries.Bethesda, MD: American Fisheries Society: 39-48.
Carl, G. C.; Clemens, W. A.; Lindsey, C. C. 1959. Thefreshwater fishes of British Columbia. Handb. 5.Victoria, BC: British Columbia Provincial Museum,Department of Education. 192 p.
Cunjak, R. A. 1988. Behavior and microhabitat ofyoung Atlantic salmon (Salmo salar) during winter.Canadian Journal of Fisheries and Aquatic Sciences.45: 2156-2160.
Cunjak, R. A.; Power, G. 1986. Winter habitat utiliza-tion by stream resident brook trout (Salvelinus fon-tinalis) and brown trout (Salmo trutta). Canadian
Figure 17—Sucker sp. nearthe substrate in a pool. Notethe large head, small eye,oval cross section, and ven-tral mouth.

20
Journal of Fisheries and Aquatic Sciences. 43:1970-1981.
Edmundson, E.; Everest, F. H.; Chapman, D. W. 1968.Permanence of station in juvenile chinook salmonand steelhead trout. Journal of the Fisheries Re-search Board of Canada. 25: 1453-1464.
Everest, F. H. 1969. Habitat selection and spacial [sic]interaction by juvenile chinook and steelhead troutin two Idaho streams. Moscow, ID: University ofIdaho. 77 p. Dissertation.
Everest, F. H. 1978. Diver-operated device for immo-bilizing fish with a small explosive charge. Progres-sive Fish Culturist. 49(3): 121-122.
Everest, F. H.; Chapman, D. W. 1972. Habitat selec-tion and spatial interaction by juvenile chinooksalmon and steelhead trout in two Idaho streams.Journal of the Fisheries Research Board of Canada.29: 91-100.
Fausch, K. D.; White, R. J. 1981. Competition betweenbrook trout (Salvelinus fontinalis) and brown trout(Salmo trutta) for positions in a Michigan stream.Canadian Journal of Fisheries and Aquatic Sciences.38: 1220-1227.
Fraley, J.; Shepard, B. 1989. Life history, ecology andpopulation status of migratory bull trout (Salvelinusconfluentus) in the Flathead Lake river system,Montana. Northwest Science. 63(4): 133-143.
Gardiner, W. R. 1984. Estimating population densitiesof salmonids in deep water in streams. Journal ofFish Biology. 24: 41-49.
Goldstein, R. M. 1978. Quantitative comparison ofseining and underwater observation for stream fish-ery surveys. Progressive Fish Culturist. 40: 108-111.
Goetz, F. 1990. Bull trout life history and habitatstudy. Final Rep. U.S. Department of Agriculture,Forest Service, Contract 43-04GG-9-1371 to theDeschutes National Forest. Corvallis, OR: OregonState University. 48 p.
Griffith, J. S. 1981. Estimation of the age-frequencydistribution of stream-dwelling trout by underwaterobservation. Progressive Fish Culturist. 43: 51-53.
Griffith, J. S.; Schill, D. J.; Gresswell, R. E. 1984. Un-derwater observation as a technique for assessingfish abundance in large western rivers. In: Proceed-ings of the Western Association of Fish and WildlifeAgencies; 1983 July; Jackson Hole, WY. Boise, ID:Western Association of Fish and Wildlife Agencies.63: 143-149.
Griffith, J. S.; Smith, R. W. 1993. Use of winter con-cealment cover by juvenile cutthroat trout andbrown trout in the South Fork of the Snake River,Idaho. North American Journal of Fisheries Man-agement. 13: 823-830.
Grunder, S.; Corsi, C. 1988. Techniques manual for un-derwater observation of fish communities and ben-thological sampling: summary of biological training
session at Harriman State Park. Boise, ID: IdahoDepartment of Fish and Game. 22 p.
Hankin, D. G.; Reeves, G. H. 1988. Estimating totalfish abundance and total habitat area in smallstreams based on visual estimation methods.Canadian Journal of Fisheries and Aquatic Sci-ences. 45: 834-844.
Helfman, G. S. 1983. Underwater methods. In:Nielson, L. A.; Johnson, D. L., eds. Fisheries tech-niques. Bethesda, MD: American Fisheries Society:349-370.
Heggenes, J.; Brabrand, A.; Saltveit, S. J. 1990. Com-parison of three methods for studies of stream habi-tat use by young brown trout and Atlantic salmon.Transactions of the American Fisheries Society.119: 101-111.
Hillman, T. W. 1993. [Personal communication].Boise, ID: Don Chapman Consultants.
Hillman, T. W.; Chapman, D. W. 1993. Assessmentof injury to fish populations: Clark Fork River NPLsites, Montana. Appendix G. In: Lipton, J., ed.Aquatic resource injury assessment report, UpperClark Fork River Basin. Helena, MT: Montana De-partment of Health and Environmental Sciences,Natural Resource Damage Program.
Hillman, T. W.; Griffith, J. S.; Platts, W. S. 1987. Sum-mer and winter habitat selection by juvenile chi-nook salmon in a highly sedimented Idaho stream.Transactions of the American Fisheries Society.116: 185-195.
Hillman, T. W.; Mullan, J. W.; Griffith, J. S. 1992.Accuracy of underwater counts of juvenile chinooksalmon, coho salmon, and steelhead. North Ameri-can Journal of Fisheries Management. 12: 598-603.
Hurlbert, S. H. 1984. Pseudoreplication and the de-sign of ecological field experiments. Ecological Mono-graphs. 54: 187-211.
James, P. W.; Leon, S. C.; Alexander, V. Z.; Maughan,O. E. 1987. Diver-operated electrofishing device.North American Journal of Fisheries Management.7: 597-598.
Keifer, S. 1993. [Personal communication]. Boise, ID:Idaho Department of Fish and Game.
Markle, D. F. 1992. Evidence of bull trout x brook trouthybrids in Oregon. In: Howell, P. J.; Buchanan, D. V.,eds. Proceedings of the Gearhart Mountain bull troutworkshop; 1992 August; Gearhart Mountain, OR.Corvallis, OR: Oregon Chapter of the AmericanFisheries Society: 58-67.
Martinez, A. M. 1984. Identification of brook, brown,rainbow, and cutthroat trout larvae. Transactionsof the American Fisheries Society. 113: 252-259.
McAllister, M. K.; Peterman, R. M. 1992. Experimen-tal design in the management of fisheries: a review.North American Journal of Fisheries Management.12: 1-18.
21
McConnell, R. J.; Snyder, G. R. 1972. Key to fieldidentification of anadromous juvenile salmonidsin the Pacific Northwest. NOAA Tech. Rep. NMFSCIRC-366. Seattle, WA: U.S. Department of Com-merce. 6 p.
Morantz, D. L.; Sweeney, R. K.; Shirvell, C. S.;Longard, D. A. 1987. Selection of microhabitat insummer by juvenile Atlantic salmon. Canadian Jour-nal of Fisheries and Aquatic Sciences. 44: 120-129.
Nelson, R. L.; Platts, W. S.; Larsen, D. P.; Jensen, S. E.1992. Trout distribution and habitat in the NorthFork Humboldt River drainage, northeasternNevada. Transactions of the American FisheriesSociety. 121: 405-426.
Northcote, T. G.; Wilkie, D. W. 1963. Underwatercensus of stream fish populations. Transactionsof the American Fisheries Society. 92: 146-151.
Palmer, K.; Graybill, J. 1986. More observations ondrift diving. Freshwater Catch. Christchurch, NewZealand. 30: 22-23.
Rich, B. A. 1993. Can snorkelers accurately estimatefish lengths? An experiment. In: 1993 Abstractsfor annual meeting of the Idaho Chapter of theAmerican Fisheries Society; 1993 February 25-27;McCall, ID. Boise, ID: Idaho Chapter of the Ameri-can Fisheries Society: 33.
Ricker, W. E. 1975. Computation and interpretationof biological statistics of fish populations. Bull. 191.Ottawa, ON: The Fisheries Research Board ofCanada. 382 p.
Riehle, M. D. 1990. Changes in habitat utilization andfeeding chronology of juvenile rainbow trout at theonset of winter in Silver Creek, Idaho. Pocatello, ID:Idaho State University. 70 p. Thesis.
Rieman, Bruce D.; McIntyre, John D. 1993. Demo-graphic and habitat requirements for conservationof bull trout. Gen. Tech. Rep. INT-302. Ogden, UT:U.S. Department of Agriculture, Forest Service,Intermountain Research Station. 38 p.
Rimmer, D. M.; Paim, U.; Saunders, R. L. 1984.Changes in the selection of microhabitat by juve-nile Atlantic salmon (Salmo salar) at the summer-autumn transition in a small river. Canadian Jour-nal of Fisheries and Aquatic Sciences. 41: 469-475.
Robinson, D. G.; Barraclough, W. E. 1978. Populationestimates of sockeye salmon (Oncorhynchus nerka)in a fertilized oligotrophic lake. Journal of the Fish-eries Research Board of Canada. 35: 851-860.
Rodgers, J. D.; Solazzi, M. F.; Johnson, S. L.; Buckman,M. A. 1992. Comparison of three techniques to esti-mate juvenile coho salmon populations in smallstreams. North American Journal of Fisheries Man-agement. 12: 79-86.
Romesburg, H. C. 1981. Wildlife science: gaining reli-able knowledge. Journal of Wildlife Management.45: 293-313.
Rosgen, D. L. 1985. A stream classification system.In: Johnson, R. R.; Ziebell, C. D.; Platon, D. R.; [andothers], eds. Riparian ecosystems and their man-agement: reconciling conflicting uses: proceedingsof the first North American riparian conference; 1985April 16-18; Tucson, AZ. Gen. Tech. Rep. RM-120.Fort Collins, CO: U.S. Department of Agriculture,Forest Service, Rocky Mountain Forest and RangeExperiment Station: 91-95.
Schill, D. J. 1991. Bull trout aging and enumeration.Idaho Department of Fish and Game, river andstream investigations: wild trout investigations. JobPerform. Rep., Proj. F-73-R-13. Boise, ID: IdahoDepartment of Fish and Game. 109 p.
Schill, D. J.; Griffith, J. S. 1984. Use of underwaterobservations to estimate cutthroat trout abundancein the Yellowstone River. North American Journalof Fisheries Management. 4: 479-487.
Scott, W. B.; Crossman, E. J. 1973. Freshwater fishes ofCanada. Bull. 180. Ottawa, ON: Fisheries ResearchBoard of Canada. 966 p.
Shepard, B. B.; Fraley, J. J.; Weaver, T. M.; Graham, P.1982. Flathead River fisheries study. EnvironmentalProtection Agency Contract R008224-01-3. Kalispell,MT: Montana Department of Fish, Wildlife andParks. 86 p.
Shepard, B. B.; Graham, P. J. 1983. Fish resource mon-itoring program for the upper Flathead basin. Envi-ronmental Protection Agency Contract R008224-01-4.Kalispell, MT: Montana Department of Fish, Wild-life and Parks. 61 p.
Sigler, W. F.; Miller, R. R. 1963. Fishes of Utah. SaltLake City, UT: Utah Game and Fish Department.203 p.
Simpson, J. C.; Wallace, R. L. 1978. Fishes of Idaho.Moscow, ID: University of Idaho Press. 237 p.
Slaney, P. A.; Martin, A. D. 1987. Accuracy of under-water census of trout populations in a large streamin British Columbia. North American Journal ofFisheries Management. 7: 117-122.
Swenson, W. A.; Gobin, W. P.; Simonson, T. D. 1988.Calibrated mask-bar for underwater measurementof fish. North American Journal of Fisheries Man-agement. 8: 382-385.
Teirney, L. D.; Jowett, I. G. 1990. Trout abundance inNew Zealand rivers: an assessment by drift diving.New Zealand Freshwater Fisheries Rep. 118.Christchurch, New Zealand: New Zealand Ministryof Agriculture and Fisheries. 31 p.
Thurow, R. 1985. Middle Fork Salmon River fisheriesinvestigations. Job Completion Rep., Proj. F-73-R-6.Boise, ID: Idaho Department of Fish and Game.100 p.
Thurow, R. 1987. Evaluation of the South Fork SalmonRiver steelhead trout fishery restoration program.Job Completion Rep. Lower Snake River fish and

22
wildlife compensation plan. Contract 14-16-0001-86505. Boise, ID: Idaho Department of Fish andGame. 154 p.
Thurow, R. F.; Corsi, C. E.; Moore, V. K. 1988. Status,ecology, and management of Yellowstone cutthroattrout in the Upper Snake River drainage, Idaho.American Fisheries Society Symposium. 4: 25-36.
Thurow, R. F.; Schill, D. J. [In preparation]. Compari-son of day snorkeling, night snorkeling, and electro-fishing to census juvenile bull trout. Boise, ID: U.S.Department of Agriculture, Forest Service, Inter-mountain Research Station; Idaho Department ofFish and Game.
Varley, J. G.; Gresswell, R. E. 1988. Ecology, status,and management of the Yellowstone cutthroat trout.American Fisheries Society Symposium. 4: 13-24.
Vore, D. W. 1993. Size, abundance, and seasonal habi-tat utilization of an unfished trout population andtheir response to catch and release fishing. Bozeman,MT: Montana State University. 99 p. Thesis.
Zubik, R. J.; Fraley, J. J. 1988. Comparison of snorkeland mark-recapture estimates for trout populationsin large streams. North American Journal of Fish-eries Management. 8: 58-62.
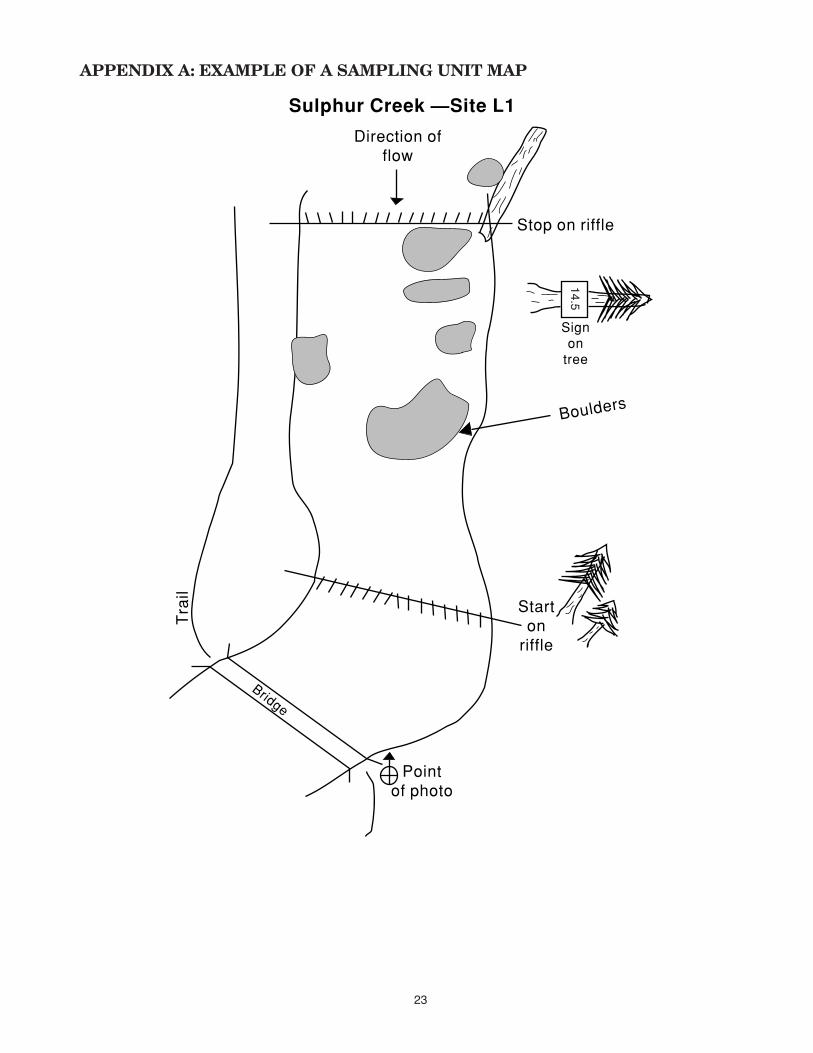
23
APPENDIX A: EXAMPLE OF A SAMPLING UNIT MAP
Direction offlow
Stop on riffle
Boulders
Starton
riffle
Pointof photo
Tra
il
Bridge
Signon
tree
14.5
Sulphur Creek —Site L1
14.5

24
APPENDIX B: EXAMPLE OF A SNORKEL DATA SHEET
Date__________________ page_______ of_______
Diver 1_______________
Location________________________________________
Diver 2_______________
Time__________________ H2O temp________________
Diver 3_______________
Unit No. Diver 1 Diver 2 Diver 3
_____ chin 0 ______ ______ ______ Cover:
chin 1 ______ ______ ______ UC______% (undercut)
ST1+ ______ ______ ______ OC______% (overhead)
ST2+ ______ ______ ______ SC______% (submerged)
ST3+ ______ ______ ______ LS______% (large substrate)
RB>250 ______ ______ ______
CT<100 ______ ______ ______
CT 100-199 ______ ______ ______
CT 200-299 ______ ______ ______
CT>300 ______ ______ ______
BT<100 ______ ______ ______ Max Depth
BT 100-199 ______ ______ ______ (pools only)
BT 200-299 ______ ______ ______ ________M
BT 300-399 ______ ______ ______
BT 400-499 ______ ______ ______
BT>500 ______ ______ ______
YOY ______ ______ ______
chin = chinook salmon
ST = steelhead/rainbow
RB = rainbow trout
CT = cutthroat trout
BT = bull trout
Comments:
underwater visibility
weather conditions

25
APPENDIX C: EXTERNAL CHARACTERISTICS OF A TYPICAL SALMONID
(Adapted from Simpson and Wallace 1978)
Nostril
Anus
Fin rays
Caudalpeduncle
Adiposefin
Lateralline
Dorsalfin
Premaxillary
Maxillary
Branchiostegalrays Pectoral
fin
Accessorypelvic
appendagePelvic
finAnalfin
Eye
Caudalfin
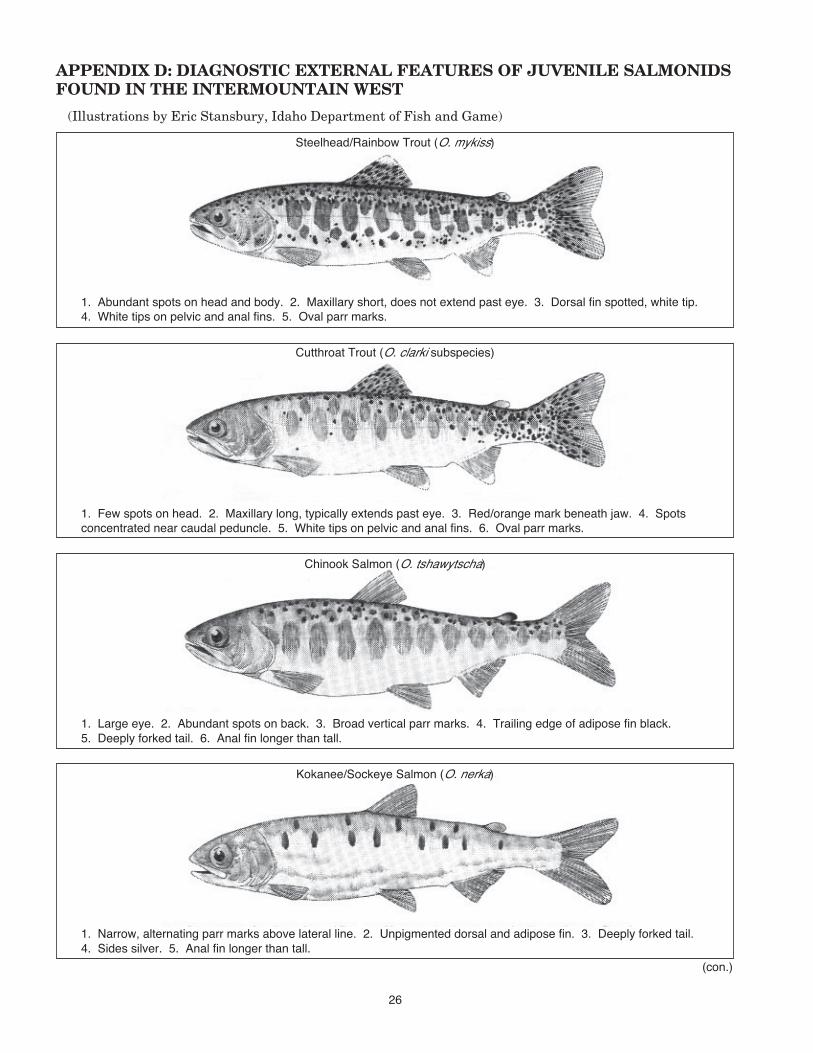
26
APPENDIX D: DIAGNOSTIC EXTERNAL FEATURES OF JUVENILE SALMONIDSFOUND IN THE INTERMOUNTAIN WEST
(Illustrations by Eric Stansbury, Idaho Department of Fish and Game)
Steelhead/Rainbow Trout (O. mykiss)
Cutthroat Trout (O. clarki subspecies)
Chinook Salmon (O. tshawytscha)
Kokanee/Sockeye Salmon (O. nerka)
(con.)
1. Abundant spots on head and body. 2. Maxillary short, does not extend past eye. 3. Dorsal fin spotted, white tip.4. White tips on pelvic and anal fins. 5. Oval parr marks.
1. Few spots on head. 2. Maxillary long, typically extends past eye. 3. Red/orange mark beneath jaw. 4. Spotsconcentrated near caudal peduncle. 5. White tips on pelvic and anal fins. 6. Oval parr marks.
1. Large eye. 2. Abundant spots on back. 3. Broad vertical parr marks. 4. Trailing edge of adipose fin black.5. Deeply forked tail. 6. Anal fin longer than tall.
1. Narrow, alternating parr marks above lateral line. 2. Unpigmented dorsal and adipose fin. 3. Deeply forked tail.4. Sides silver. 5. Anal fin longer than tall.
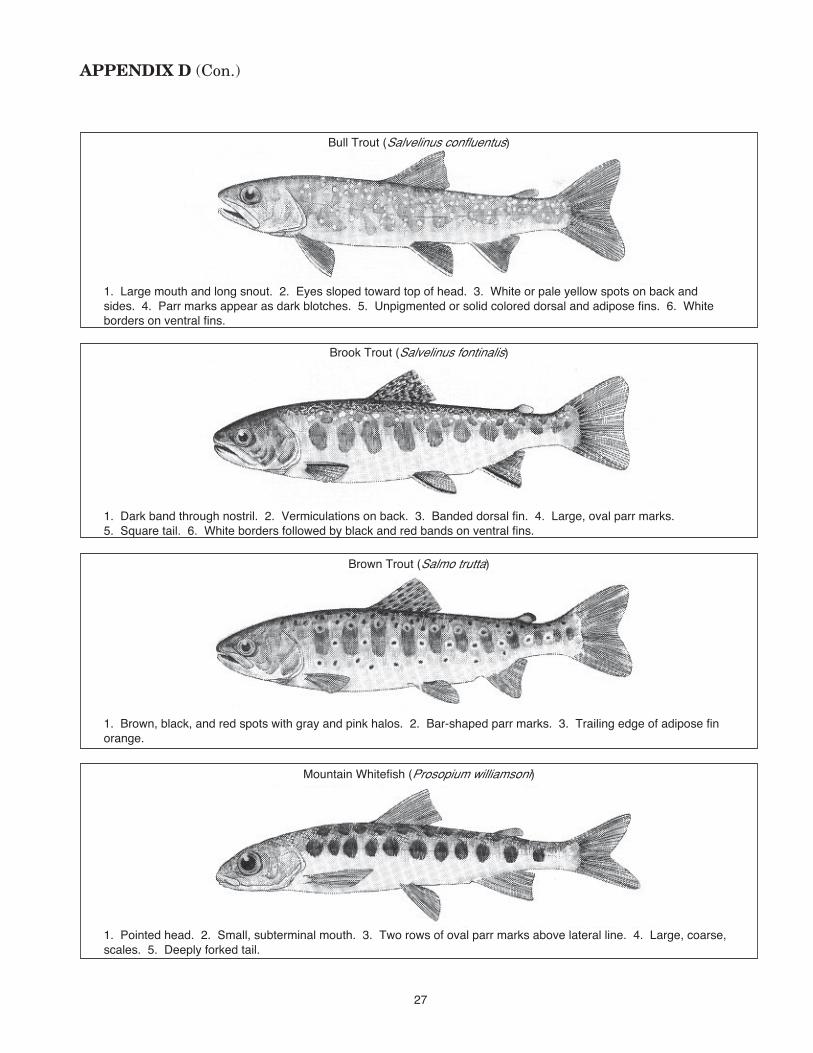
27
APPENDIX D (Con.)
Bull Trout (Salvelinus confluentus)
Brook Trout (Salvelinus fontinalis)
Brown Trout (Salmo trutta)
Mountain Whitefish (Prosopium williamsoni)
1. Large mouth and long snout. 2. Eyes sloped toward top of head. 3. White or pale yellow spots on back andsides. 4. Parr marks appear as dark blotches. 5. Unpigmented or solid colored dorsal and adipose fins. 6. Whiteborders on ventral fins.
1. Dark band through nostril. 2. Vermiculations on back. 3. Banded dorsal fin. 4. Large, oval parr marks.5. Square tail. 6. White borders followed by black and red bands on ventral fins.
1. Brown, black, and red spots with gray and pink halos. 2. Bar-shaped parr marks. 3. Trailing edge of adipose finorange.
1. Pointed head. 2. Small, subterminal mouth. 3. Two rows of oval parr marks above lateral line. 4. Large, coarse,scales. 5. Deeply forked tail.

28
APPENDIX E: DISTRIBUTION OF INTERIOR RACES OF CUTTHROAT TROUTIN THE WESTERN UNITED STATES
(Adapted from Behnke 1992)
ColoradoRiver
Alvord
Paiute
Westslope
Finespotted
Yellowstone
Bonneville
Humboldt
Lahontan

Federal Recycling Program Printed on Recycled Paper
Thurow, Russell F. 1994. Underwater methods for study of salmonids in the IntermountainWest. Gen. Tech. Rep. INT-GTR-307. Ogden, UT: U.S. Department of Agriculture,Forest Service, Intermountain Research Station. 28 p.
This guide describes underwater methods using snorkeling gear to study fish popula-tions in flowing waters of the Intermountain West. It outlines procedures for estimatingsalmonid abundance and habitat use and provides criteria for identifying and estimatingthe size of fish underwater.
KEYWORDS: snorkeling, underwater equipment, population estimates, habitat,Salmonidae, species identification, anadromous fishes

The Intermountain Research Station provides scientific knowledge and technology to im-prove management, protection, and use of the forests and rangelands of the IntermountainWest. Research is designed to meet the needs of National Forest managers, Federal andState agencies, industry, academic institutions, public and private organizations, and individu-als. Results of research are made available through publications, symposia, workshops,training sessions, and personal contacts.
The Intermountain Research Station territory includes Montana, Idaho, Utah, Nevada, andwestern Wyoming. Eighty-five percent of the lands in the Station area, about 231 millionacres, are classified as forest or rangeland. They include grasslands, deserts, shrublands,alpine areas, and forests. They provide fiber for forest industries, minerals and fossil fuels forenergy and industrial development, water for domestic and industrial consumption, forage forlivestock and wildlife, and recreation opportunities for millions of visitors.
Several Station units conduct research in additional western States, or have missions thatare national or international in scope.
Station laboratories are located in:
Boise, Idaho
Bozeman, Montana (in cooperation with Montana State University)
Logan, Utah (in cooperation with Utah State University)
Missoula, Montana (in cooperation with the University of Montana)
Moscow, Idaho (in cooperation with the University of Idaho)
Ogden, Utah
Provo, Utah (in cooperation with Brigham Young University)
Reno, Nevada (in cooperation with the University of Nevada)
The policy of the United States Department of Agriculture Forest Service prohibitsdiscrimination on the basis of race, color, national origin, age, religion, sex, or disability,familial status, or political affiliation. Persons believing they have been discriminatedagainst in any Forest Service related activity should write to: Chief, Forest Service, USDA,P.O. Box 96090, Washington, DC 20090-6090.
INTERMOUNTAINRESEARCH STATION