understanding the status of social license: adoption of bt
TRANSCRIPT
Understanding the Status of Social License: Adoption of
Bt-brinjal in Bangladesh
A Thesis Submitted to the College of
Graduate and Postdoctoral Studies
In Partial Fulfillment of the Requirements
For the Degree of Master of Science
In the Department of Agricultural and Resource Economics
University of Saskatchewan
By
Asha Roy
Copyright Asha Roy, April 2018. All rights reserved.
i
PERMISSION TO USE
In presenting this thesis in partial fulfillment of the requirements for a Postgraduate degree from
the University of Saskatchewan, I agree that the Libraries of this University may make it freely
available for inspection. I further agree that permission for copying of this thesis in any manner,
in whole or in part, for scholarly purposes may be granted by the professor or professors who
supervised my thesis work or, in their absence, by the Head of the Department or the Dean of the
College in which my thesis work was done. It is understood that any copying or publication or use
of this thesis or parts thereof for financial gain shall not be allowed without my written permission.
It is also understood that due recognition shall be given to me and to the University of
Saskatchewan in any scholarly use which may be made of any material in my thesis.
Requests for permission to copy or to make other uses of materials in this thesis in whole
or part should be addressed to:
Head of the Department of Agricultural and Resource Economics
51 Campus Drive, Room 3D34
University of Saskatchewan
Saskatoon, Saskatchewan
Canada, S7N 5A8
Or
Dean
College of Graduate and Postdoctoral Studies
University of Saskatchewan
116 – 110 Science Place
Saskatoon SK S7N 5C9

ii
Abstract
The discovery of agricultural biotechnology provides opportunities to address challenges
in agricultural production and food security, especially for developing countries. However,
technology has encountered controversy around the world. Societal views towards genetically
modified (GM) technologies differ across different contexts. Today’s agriculture operates in a new
information environment. Now the public can more readily access information and thus, some
consumers or interest groups are concerned about new technologies in agriculture. Interest in the
right to know about new technologies brings to the forefront the concept of social license in
agriculture and why earning of social license for a new GM crop is important in its acceptance and
adoption. Much of the previous work on social license has addressed this issue from a developed
country perspective. This thesis examines the concept of social license in a developing country
context.
The purpose of this thesis is to examine factors that drive social license for adopting Bt-
brinjal in Bangladesh. Bt-brinjal is a new GM food crop in Bangladesh and was approved for
commercial cultivation in 2013. The crop is resistant to the fruit and shoot borer (FSB) insect,
which causes significant losses in brinjal production in Bangladesh, and is currently undergoing
phased-in commercialization. One objective of this study was to develop a conceptual model of
social license. Previous studies on public perceptions of and attitudes towards technology adoption
are reviewed to understand the concept of social license and a conceptual model of social license
is developed based on the literature reviewed. The conceptual model of social license represents
the interrelationships among different stakeholders. Developers, government, producers,
consumers, NGOs, civil society groups, and media are the main stakeholders with potential
influence on the technology adoption process. The literature suggests that social license is difficult
to measure directly and thus, the proposed conceptual model of social license uses ‘willingness to
accept’ to examine the level of social license.
To apply the conceptual model of social license in technology adoption in the case of Bt-
brinjal, data were gathered through primary survey data collection of different stakeholders across
Bangladesh in March and April 2017. Two sets of farmers were surveyed: adopters of Bt-brinjal
and non-adopters. The surveys were complemented with interviews with key stakeholders
(Bangladesh Agricultural Research Institute (BARI) representatives and NGOs) and a small

iii
sample of consumers. Analysis of the farmer survey and stakeholder interview data confirms that
most stakeholders have a strong positive inclination about Bt-brinjal with the exception of a few
NGOs and civil society groups in Bangladesh. Both adopter and non-adopter farmers expressed a
strong willingness to adopt Bt-brinjal. A multinomial logit model (MNL) is estimated to examine
the most important reason that influences adopters and non-adopters’ willingness to adopt Bt-
brinjal. Results show that growing vegetables in the winter season is significant for both adopters
and non-adopters and it influences farmers to pick more marketable yield as the main reason for
their willingness to adopt Bt-brinjal in the next cropping season. In addition, the total number of
pesticide applications to control other pests, yield difference between Bt-brinjal and non-Bt brinjal,
adopters’ age and off-farm income have significant effects on adopters’ decision. Insights from
consumer survey and other stakeholders’ interviews suggest that stakeholders are not
knowledgeable about Bt-brinjal. Although consumers perceived the introduction of Bt-brinjal
positively, the small number of NGO representatives interviewed expressed negative perceptions
about the introduction of Bt-brinjal in Bangladesh.
This study used Bangladesh as the study area to understand the concept of social license
from a developing country’s context. Results of this study suggest that at this point in time,
Bangladesh has established a strong social license for accepting Bt-brinjal. Although,
policymakers in Bangladesh need to take steps to provide appropriate information about this
technology to all stakeholders especially farmers (non-adopters) and consumers as they have
limited knowledge about the technology.

iv
Acknowledgements
I would like to take this opportunity to express my deepest appreciation to some people
without whom this thesis might not have been written and to whom I am greatly indebted.
I would like to express my sincere appreciation, gratefulness and deep indebtedness to my
supervisor Dr. Jill E. Hobbs, who is such a supportive and respective supervisor. Throughout my
whole master’s program, she was always patient, guided me to the right direction, encouraged me
to pursue my own research ideas and provided a great amount of valuable suggestions and
guidance. Without her persistent help, this thesis would not have been possible. I appreciate all her
tremendous patience in working with me, as well as her corrections of my thesis’ draft.
I would like to express my appreciation and heartfelt gratitude to my advisory committee
members, Dr. William A. Kerr and Dr. Stuart Smyth for their interest, time and useful comments
and suggestions.
I would also like to express my appreciation to Dr. David Natcher, for providing me fund
during the period of my master’s program. I also greatly appreciate the P2IRC (Plant Phenotyping
and Imaging Research Centre) to offer me financial support during the data collection period in
Bangladesh.
I would also like to thank all the faculty, staff and graduate students in our lovely
department for their friendships and collaboration.
I also want to express my heartfelt gratitude to my beloved parents (Kamala Prosad
Bormon and Mukta Rani Roy) and my two elder brothers (Subrata Roy and Kallyan Roy) for their
unconditional love and moral support. They always inspire me to overcome all the difficulties and
pursue my real goal in life.
The Author
v
TABLE OF CONTENTS
ABSTRACT ................................................................................................................................... ii
ACKNOWLEDGEMENTS ........................................................................................................ iv
TABLE OF CONTENTS ............................................................................................................. v
LIST OF TABLES ..................................................................................................................... viii
LIST OF FIGURES ..................................................................................................................... ix
Chapter 1 Introduction ................................................................................................................ 1
1.1 Background Information ....................................................................................................... 1
1.2 Problem Statement ................................................................................................................ 3
1.3 Research Question and Objectives ........................................................................................ 5
1.4 Organization of the Thesis .................................................................................................... 5
Chapter 2 Literature Review ....................................................................................................... 7
2. 1 Introduction .......................................................................................................................... 7
2.2 Bt-brinjal: A GM Crop in Bangladesh .................................................................................. 7
2.2.1 Overview of the Agricultural Sector in Bangladesh ....................................................... 7
2.2.2 Crop Biotechnology and Institutional Involvement in the Development of
Biotechnology in Bangladesh .................................................................................................. 8
2.2.2.1 Agricultural Biotechnology Support Project-II ....................................................... 9
2.2.2.2 South Asia Biosafety Program (SABP) ................................................................. 10
2.2.2.3 Bangladesh Biotechnology Information Center (BdBIC)...................................... 10
2.2.3 Vegetable Production in Bangladesh ............................................................................ 11
2.2.4 Brinjal Production in Bangladesh ................................................................................. 14
2.2.5 Bt-brinjal in Bangladesh ............................................................................................... 16
2.3 Social License ..................................................................................................................... 23
2.4 Stakeholders Attitudes towards Technology Adoption ....................................................... 27
2.5 A Conceptual Model of Social License............................................................................... 34
2.6 Conclusions ......................................................................................................................... 38
Chapter 3 Survey Design and Descriptive Analysis ................................................................ 40
3.1 Introduction ......................................................................................................................... 40
3.2 Research Methodology ........................................................................................................ 40
3.2.1 Questionnaire Design ................................................................................................... 40
3.2.2 Selection of Study Area ................................................................................................ 42
vi
3.2.3 Data Collection ............................................................................................................. 44
3.3 Descriptive Data Analysis ................................................................................................... 46
3.3.1 Adopter Survey ............................................................................................................. 46
3.3.1.1 Socio-demographic Characteristics of the Adopters.............................................. 46
3.3.1.2 General Farming and Marketing Practices of the Adopters ................................... 47
3.3.1.3 Production Practices of Bt-brinjal: Adopter Survey .............................................. 51
3.3.1.4 Sources of Information about Bt-brinjal (Adopter Survey) ................................... 53
3.3.1.5 Level of Knowledge about Bt-brinjal (Adopter Survey) ....................................... 55
3.3.1.6 Perceptions of Bt-brinjal (Adopter Survey) ........................................................... 56
3.3.1.7 Relationships with BARI and DAE Individuals .................................................... 57
3.3.1.8 Willingness to Adopt Bt-brinjal (Adopter Survey) ................................................ 58
3.3.2 Bt-brinjal Non-adopter Survey ..................................................................................... 60
3.3.2.1 Socio-demographic Characteristics of the Sample: Non-adopter Survey .............. 60
3.3.2.2 General Farming and Marketing Practices of the Non-adopters ........................... 61
3.3.2.3 Brinjal Production by the Non-adopters ................................................................ 66
3.3.2.4 Knowledge and Perceptions of Bt-brinjal (Non-adopter Survey) .......................... 66
3.3.2.5 Willingness to Adopt Bt-brinjal (Non-adopter Survey)......................................... 67
3.3.3 Consumer survey .......................................................................................................... 70
3.3.3.1 Socio-demographic Characteristics of the sample: Consumer Survey .................. 70
3.3.3.2 Knowledge of Bt-brinjal (Consumer Survey) ........................................................ 72
3.3.3.3 Willingness to Buy: Consumer Survey .................................................................. 74
3.4 Conclusions ......................................................................................................................... 76
Chapter 4 Estimation Methods and Results ............................................................................. 78
4.1 Introduction ......................................................................................................................... 78
4.2 Estimation Methods............................................................................................................. 78
4.2.1 Interpretation of Multinomial Logit Model and Marginal Effects ............................... 81
4.2.1.1 Marginal Effects..................................................................................................... 81
4.3 Multinomial Logit Model: Adopter Survey ........................................................................ 82
4.3.1 Description of the Dependent and Explanatory Variables (Adopter Survey) .............. 82
4.3.2 Model Specification (Adopter Survey)......................................................................... 86
4.3.3 Interpretation of Results (Adopter Survey) .................................................................. 90
4.3.4 Marginal Effects (Adopter Survey) .............................................................................. 92

vii
4.3.4.1 The Marginal Effect of Winter Variable (ROBI_bt) ............................................. 92
4.3.4.2 The Marginal Effect of Number of Pesticide Applications in the Bt-Brinjal Fields
to Control Other Insects (PestBtothers_Bt) ....................................................................... 92
4.3.4.3 The Marginal Effect of Difference Between Bt and Non-Bt Brinjal Yields
(Yielddifference_bt) ........................................................................................................... 93
4.3.4.4 The Marginal Effect of Socio-demographic Factors ............................................. 93
4.4 Multinomial Logit Model: Non-adopter Survey ................................................................. 94
4.4.1 Description of the Dependent and Explanatory Variables: Non-adopter Survey ......... 94
4.4.2 Results: Non-adopter Survey ........................................................................................ 96
4.4.3 Marginal Effects (Non-adopter Survey) ....................................................................... 99
4.4.3.1 The marginal Effect of Winter Season (ROBI_nBt).............................................. 99
4.4.3.2 The marginal Effect of Marketing Channel (MRKTCHNNL_nBt) ...................... 99
4.5 Insights from the Consumer Survey and Other Stakeholders Interviews ......................... 100
4.6 Conclusions ....................................................................................................................... 102
Chapter 5 Summary and Conclusions .................................................................................... 104
5.1 Summary of Major Research Findings.............................................................................. 104
5.2 Implications ....................................................................................................................... 105
5.3 Limitations of the Research and Areas of Future Research .............................................. 107
References .................................................................................................................................. 110
Appendix 1 The Exemption Letter from Behavioural Research Ethics Board .................. 117
Appendix 2 The Adopters Survey Questionnaire .................................................................. 118
Appendix 3 The Non-adopters Survey Questionnaire........................................................... 127
Appendix 4 The Consumers Survey Questionnaire............................................................... 133
viii
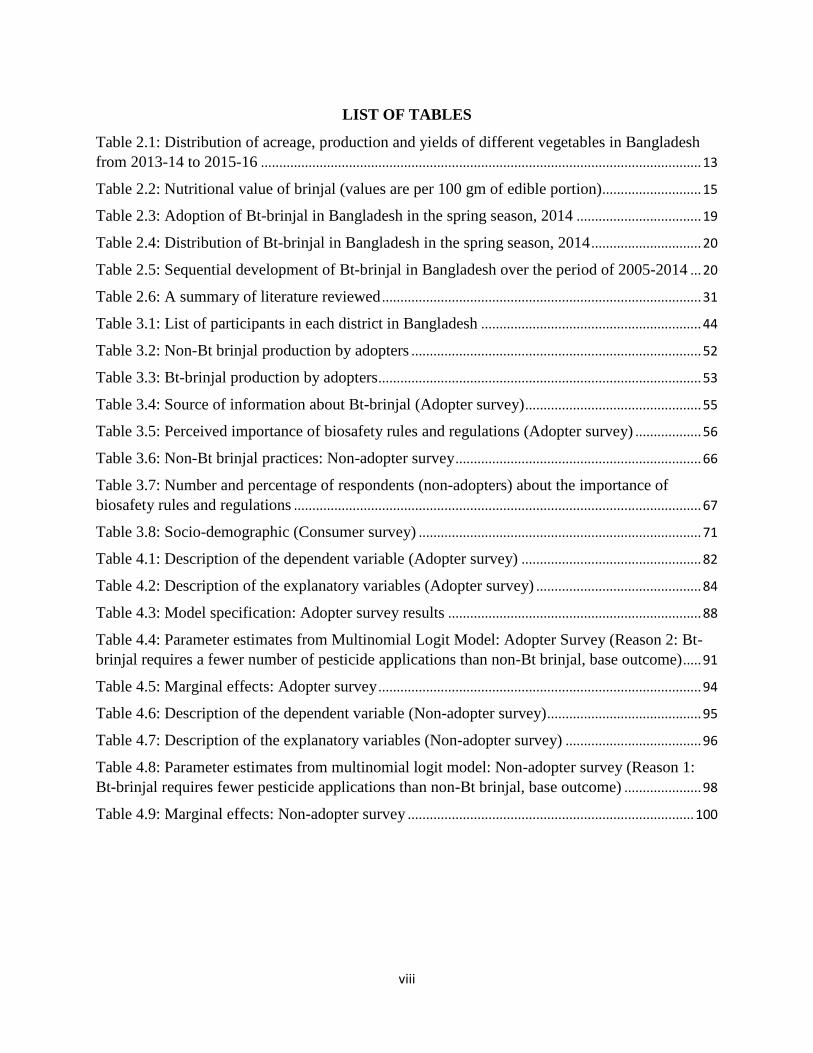
LIST OF TABLES
Table 2.1: Distribution of acreage, production and yields of different vegetables in Bangladesh
from 2013-14 to 2015-16 ........................................................................................................................ 13
Table 2.2: Nutritional value of brinjal (values are per 100 gm of edible portion) ........................... 15
Table 2.3: Adoption of Bt-brinjal in Bangladesh in the spring season, 2014 .................................. 19
Table 2.4: Distribution of Bt-brinjal in Bangladesh in the spring season, 2014 .............................. 20
Table 2.5: Sequential development of Bt-brinjal in Bangladesh over the period of 2005-2014 ... 20
Table 2.6: A summary of literature reviewed ....................................................................................... 31
Table 3.1: List of participants in each district in Bangladesh ............................................................ 44
Table 3.2: Non-Bt brinjal production by adopters ............................................................................... 52
Table 3.3: Bt-brinjal production by adopters ........................................................................................ 53
Table 3.4: Source of information about Bt-brinjal (Adopter survey) ................................................ 55
Table 3.5: Perceived importance of biosafety rules and regulations (Adopter survey) .................. 56
Table 3.6: Non-Bt brinjal practices: Non-adopter survey ................................................................... 66
Table 3.7: Number and percentage of respondents (non-adopters) about the importance of
biosafety rules and regulations ............................................................................................................... 67
Table 3.8: Socio-demographic (Consumer survey) ............................................................................. 71
Table 4.1: Description of the dependent variable (Adopter survey) ................................................. 82
Table 4.2: Description of the explanatory variables (Adopter survey) ............................................. 84
Table 4.3: Model specification: Adopter survey results ..................................................................... 88
Table 4.4: Parameter estimates from Multinomial Logit Model: Adopter Survey (Reason 2: Bt-
brinjal requires a fewer number of pesticide applications than non-Bt brinjal, base outcome) ..... 91
Table 4.5: Marginal effects: Adopter survey ........................................................................................ 94
Table 4.6: Description of the dependent variable (Non-adopter survey) .......................................... 95
Table 4.7: Description of the explanatory variables (Non-adopter survey) ..................................... 96
Table 4.8: Parameter estimates from multinomial logit model: Non-adopter survey (Reason 1:
Bt-brinjal requires fewer pesticide applications than non-Bt brinjal, base outcome) ..................... 98
Table 4.9: Marginal effects: Non-adopter survey .............................................................................. 100
ix
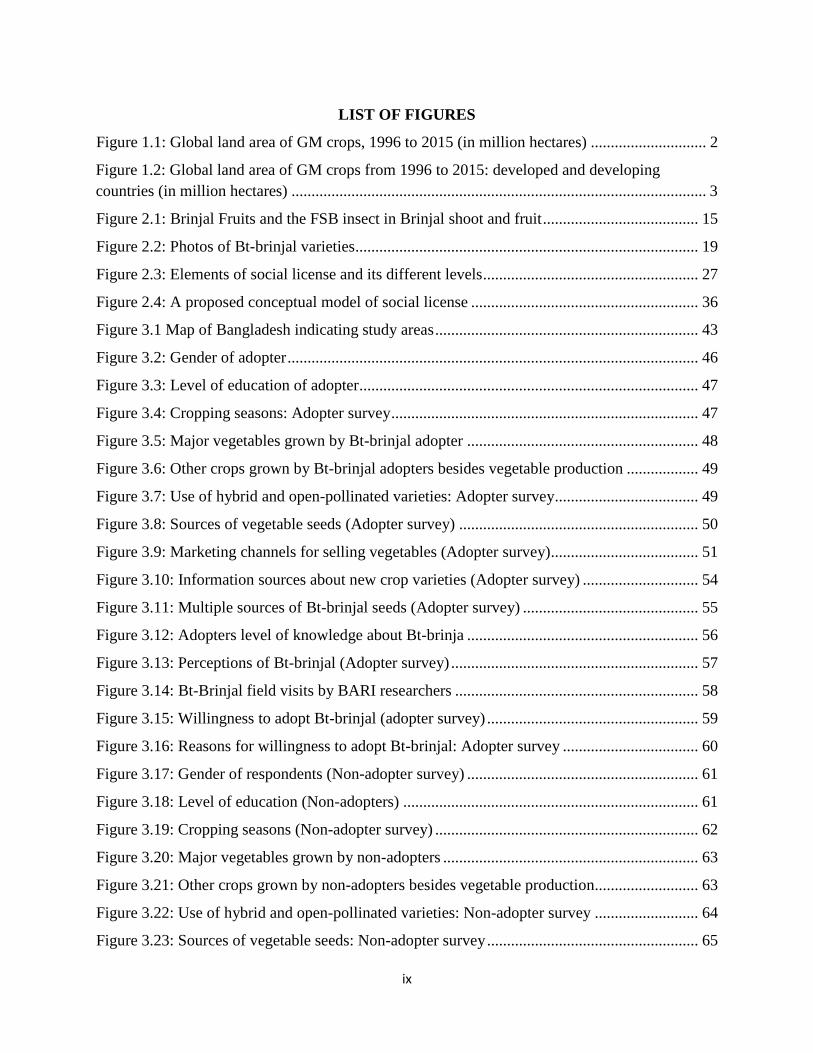
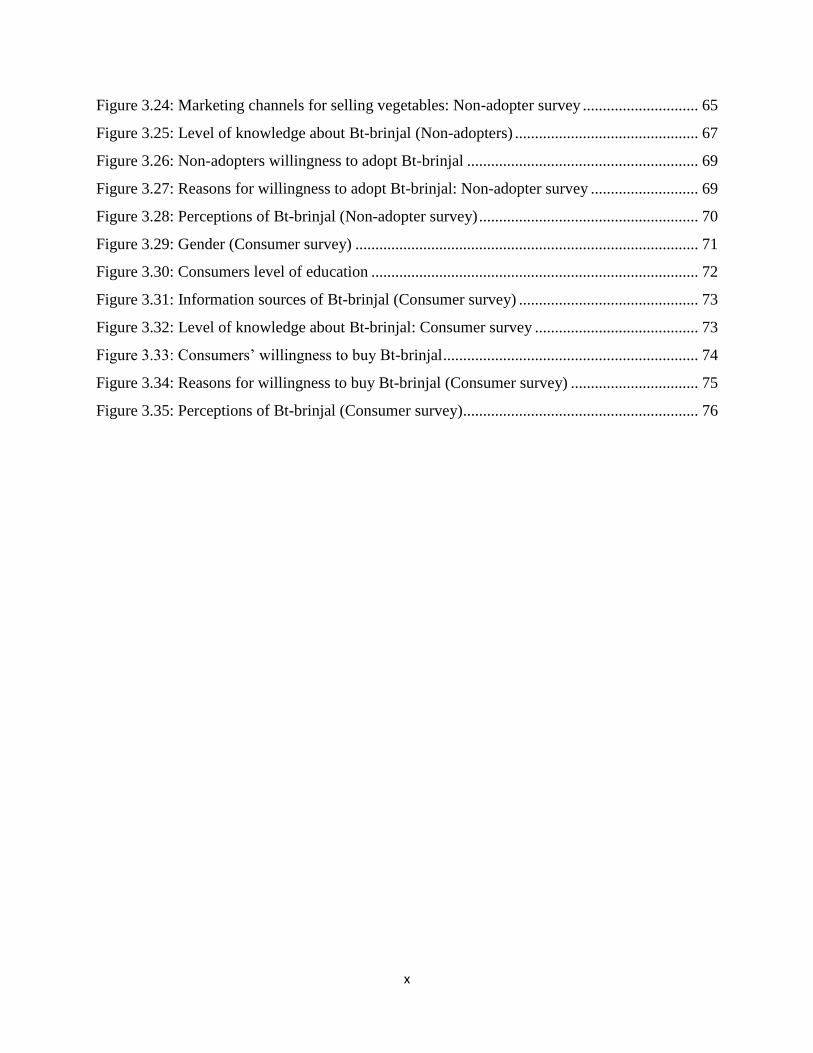
LIST OF FIGURES
Figure 1.1: Global land area of GM crops, 1996 to 2015 (in million hectares) ............................. 2
Figure 1.2: Global land area of GM crops from 1996 to 2015: developed and developing
countries (in million hectares) ........................................................................................................ 3
Figure 2.1: Brinjal Fruits and the FSB insect in Brinjal shoot and fruit ....................................... 15
Figure 2.2: Photos of Bt-brinjal varieties ...................................................................................... 19
Figure 2.3: Elements of social license and its different levels ...................................................... 27
Figure 2.4: A proposed conceptual model of social license ......................................................... 36
Figure 3.1 Map of Bangladesh indicating study areas .................................................................. 43
Figure 3.2: Gender of adopter ....................................................................................................... 46
Figure 3.3: Level of education of adopter ..................................................................................... 47
Figure 3.4: Cropping seasons: Adopter survey ............................................................................. 47
Figure 3.5: Major vegetables grown by Bt-brinjal adopter .......................................................... 48
Figure 3.6: Other crops grown by Bt-brinjal adopters besides vegetable production .................. 49
Figure 3.7: Use of hybrid and open-pollinated varieties: Adopter survey .................................... 49
Figure 3.8: Sources of vegetable seeds (Adopter survey) ............................................................ 50
Figure 3.9: Marketing channels for selling vegetables (Adopter survey) ..................................... 51
Figure 3.10: Information sources about new crop varieties (Adopter survey) ............................. 54
Figure 3.11: Multiple sources of Bt-brinjal seeds (Adopter survey) ............................................ 55
Figure 3.12: Adopters level of knowledge about Bt-brinja .......................................................... 56
Figure 3.13: Perceptions of Bt-brinjal (Adopter survey) .............................................................. 57
Figure 3.14: Bt-Brinjal field visits by BARI researchers ............................................................. 58
Figure 3.15: Willingness to adopt Bt-brinjal (adopter survey) ..................................................... 59
Figure 3.16: Reasons for willingness to adopt Bt-brinjal: Adopter survey .................................. 60
Figure 3.17: Gender of respondents (Non-adopter survey) .......................................................... 61
Figure 3.18: Level of education (Non-adopters) .......................................................................... 61
Figure 3.19: Cropping seasons (Non-adopter survey) .................................................................. 62
Figure 3.20: Major vegetables grown by non-adopters ................................................................ 63
Figure 3.21: Other crops grown by non-adopters besides vegetable production .......................... 63
Figure 3.22: Use of hybrid and open-pollinated varieties: Non-adopter survey .......................... 64
Figure 3.23: Sources of vegetable seeds: Non-adopter survey ..................................................... 65
x
Figure 3.24: Marketing channels for selling vegetables: Non-adopter survey ............................. 65
Figure 3.25: Level of knowledge about Bt-brinjal (Non-adopters) .............................................. 67
Figure 3.26: Non-adopters willingness to adopt Bt-brinjal .......................................................... 69
Figure 3.27: Reasons for willingness to adopt Bt-brinjal: Non-adopter survey ........................... 69
Figure 3.28: Perceptions of Bt-brinjal (Non-adopter survey) ....................................................... 70
Figure 3.29: Gender (Consumer survey) ...................................................................................... 71
Figure 3.30: Consumers level of education .................................................................................. 72
Figure 3.31: Information sources of Bt-brinjal (Consumer survey) ............................................. 73
Figure 3.32: Level of knowledge about Bt-brinjal: Consumer survey ......................................... 73
Figure 3.33: Consumers’ willingness to buy Bt-brinjal ................................................................ 74
Figure 3.34: Reasons for willingness to buy Bt-brinjal (Consumer survey) ................................ 75
Figure 3.35: Perceptions of Bt-brinjal (Consumer survey) ........................................................... 76
1
Chapter 1 Introduction
1.1 Background Information
Biotechnology is defined as “any technological application that uses biological systems,
living organisms, or derivatives thereof, to make or modify products or processes for specific use”
(Secretariat of the Convention on Biological Diversity, 1992 as cited in FAO, 2004, p.8).
Therefore, biotechnology is a technique where living organisms are used to modify a product, and
increasingly, it is becoming an important feature in modern agriculture as well as in the medical
sciences (FAO, 2004). Agricultural biotechnology, especially genetic modification (GM)
technology, has shown significant potential to increase crop productivity, lower the cost of
production and address food security problems in developing countries (Adenle, 2014; Wohlers,
2010). The use of GM technology or transgenic crops started in the mid-1990s and on average, the
global cultivation of GM crops has increased by 4% annually (Pino et al., 2016). As a result, more
than 18 million farmers in 28 countries around the world now grow GM crops on an estimated
total crop area of 181 million hectares (James, 2014; Pino et al., 2016).
Genetically modified crops were initially controversial for a number of reasons, including
uncertainty over unknown long-term effects on health, environmental concerns and ethical
concerns (Hobbs and Plunkett, 1999). On one side of the debate, proponents of GM technology
argue that production of GM crops reduces the use of chemicals in agriculture and can enhance
food security through productivity improvements. Evidence to support this argument is found in
Adenle, 2014; Bennett et al., 2003; Brookes and Barfoot, 2012; Phipps and Park, 2002; Thirtle et
al., 2003; Weisenfield, 2012. On the other side of the debate, opponents worry about the potential
environmental and health risks of GM crops and have argued that scientists are unable to predict
the long-term effects of consuming GM foods and the impact of biotechnology in the environment
from producing GM crops over time. For example, in an analysis of stakeholder attitudes towards
genetically modified food in Kenya, Bett et al. (2010) found that most of the gatekeepers (industrial
managers and retail buyers) in the Kenyan food industry appreciated the benefits of GM
technology but at the same time, they had concerns about human and animal health and the
environment.
Despite the ongoing debate surrounding the adoption of these new technologies in
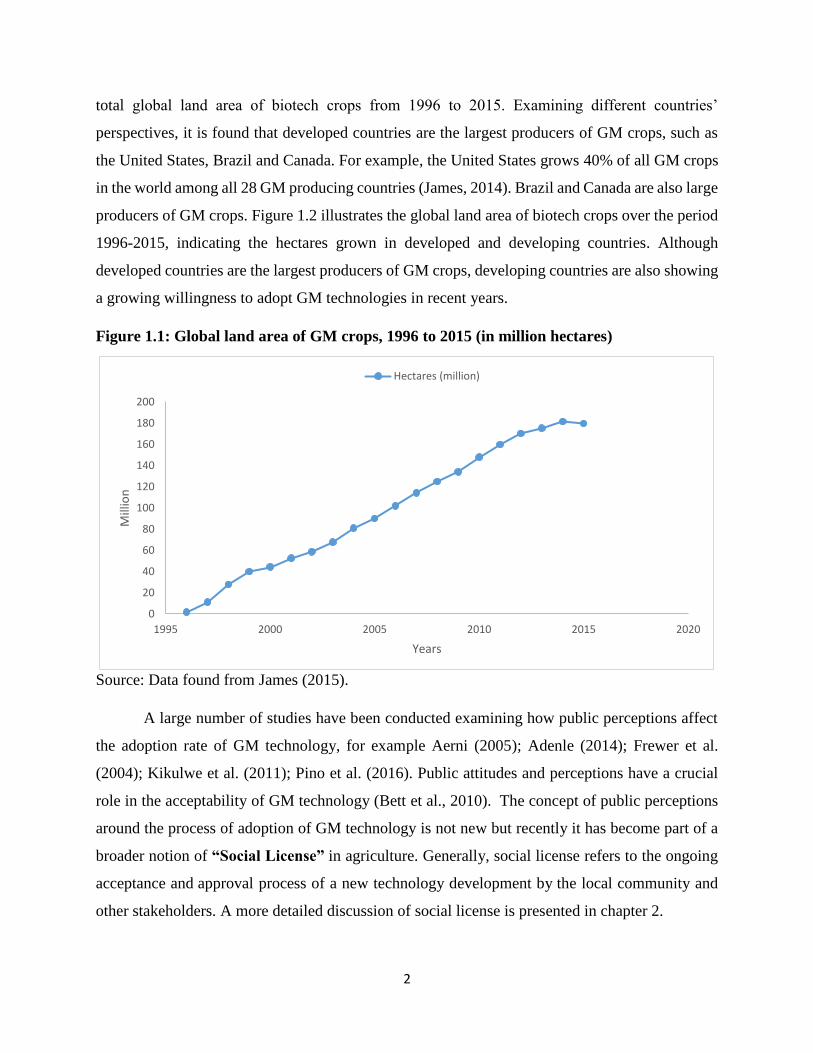
agriculture, the global production of GM crops is increasing (James, 2014). Figure 1.1 presents the
2
total global land area of biotech crops from 1996 to 2015. Examining different countries’
perspectives, it is found that developed countries are the largest producers of GM crops, such as
the United States, Brazil and Canada. For example, the United States grows 40% of all GM crops
in the world among all 28 GM producing countries (James, 2014). Brazil and Canada are also large
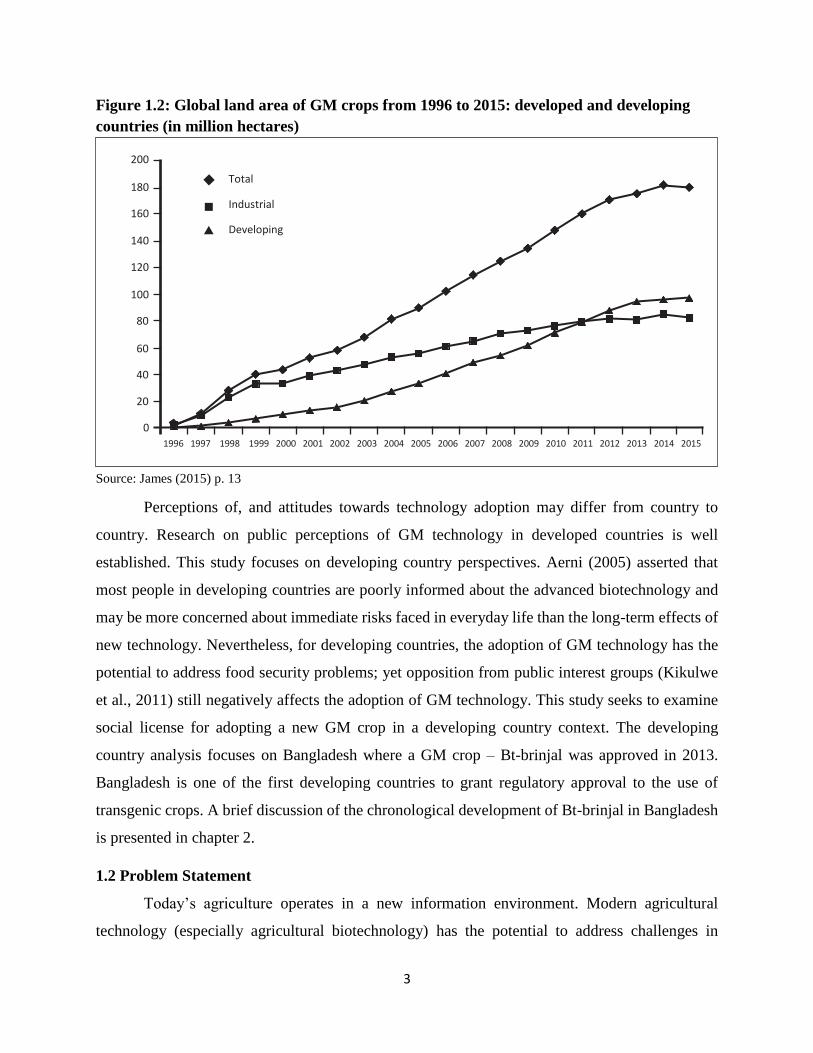
producers of GM crops. Figure 1.2 illustrates the global land area of biotech crops over the period
1996-2015, indicating the hectares grown in developed and developing countries. Although
developed countries are the largest producers of GM crops, developing countries are also showing
a growing willingness to adopt GM technologies in recent years.
Figure 1.1: Global land area of GM crops, 1996 to 2015 (in million hectares)
Source: Data found from James (2015).
A large number of studies have been conducted examining how public perceptions affect
the adoption rate of GM technology, for example Aerni (2005); Adenle (2014); Frewer et al.
(2004); Kikulwe et al. (2011); Pino et al. (2016). Public attitudes and perceptions have a crucial
role in the acceptability of GM technology (Bett et al., 2010). The concept of public perceptions
around the process of adoption of GM technology is not new but recently it has become part of a
broader notion of “Social License” in agriculture. Generally, social license refers to the ongoing
acceptance and approval process of a new technology development by the local community and
other stakeholders. A more detailed discussion of social license is presented in chapter 2.
0
20
40
60
80
100
120
140
160
180
200
1995 2000 2005 2010 2015 2020
Mill
ion
Years
Hectares (million)
3
Figure 1.2: Global land area of GM crops from 1996 to 2015: developed and developing
countries (in million hectares)
Source: James (2015) p. 13
Perceptions of, and attitudes towards technology adoption may differ from country to
country. Research on public perceptions of GM technology in developed countries is well
established. This study focuses on developing country perspectives. Aerni (2005) asserted that
most people in developing countries are poorly informed about the advanced biotechnology and
may be more concerned about immediate risks faced in everyday life than the long-term effects of
new technology. Nevertheless, for developing countries, the adoption of GM technology has the
potential to address food security problems; yet opposition from public interest groups (Kikulwe
et al., 2011) still negatively affects the adoption of GM technology. This study seeks to examine
social license for adopting a new GM crop in a developing country context. The developing
country analysis focuses on Bangladesh where a GM crop – Bt-brinjal was approved in 2013.
Bangladesh is one of the first developing countries to grant regulatory approval to the use of
transgenic crops. A brief discussion of the chronological development of Bt-brinjal in Bangladesh
is presented in chapter 2.
1.2 Problem Statement
Today’s agriculture operates in a new information environment. Modern agricultural
technology (especially agricultural biotechnology) has the potential to address challenges in
200
180
160
140
120
100
80
60
40
20
Total
Industrial
Developing
1996 1997 1998 1999 2000 2001 2002 2003 2004 2005 2006 2007 2008 2009 2010 2011 2012 2013 2014 2015
4
agricultural production, as well as contribute to addressing food security problems in developing
countries. However, modern agricultural biotechnology has encountered controversy in many
countries. Farming practices are changing day by day. A few generations ago, stakeholders
including consumers and other interest groups tended to have a more direct connection to the farm
and better understanding of how farmers produced food, while that connection may be now less
direct, stakeholders can access and share information easily. Therefore, societal views towards
agricultural biotechnology may be affected positively or negatively by the availability of
information and opinions about a technology. The concept of social license in agriculture and for
a new agricultural technology is therefore very important in gaining social acceptance of the
technology. Without social license, a technology is often met with consumer and public resistance
and more challenging regulatory environment.
Stakeholder perceptions towards a new technology influence the process of a new
technology adoption. Stakeholders’ attitudes may differ from one country to another country and
even within a country. Thus, the recent approval of the first GM crop in Bangladesh provides an
opportunity to examine how social license affects the acceptance and adoption of Bt-brinjal in a
developing country context.
Social license is important in the process of GM crop adoption and a great deal of research
has examined the concept of acceptance of agricultural technologies and consumers/producers’
willingness to adopt these technologies. Curtis et al. (2004) evaluated consumers’ attitudes towards
GM foods within developing countries. They explain that the majority of previous studies on
people’s attitudes towards GM foods were conducted in developed countries. They also argue that
the perceived level of risks for GM foods may be smaller in a developing country than from a
developed country’s perspective. While studies on social license or public attitudes toward GM
technology have been conducted in different countries, there is a gap in understanding how social
license is established and how the notion of social license might differ across different contexts,
in particular in a developing country context. Bangladesh is a new GM producing country. Thus,
this study examines social license in adopting Bt-brinjal in Bangladesh.
5
1.3 Research Question and Objectives
This study examines the following research question:
What are the main drivers of social license and who are the key stakeholders involved in
establishing social license for the adoption of Bt-brinjal in Bangladesh?
Specific objectives flowing from the research question include:
❖ To develop a conceptual model of social license;
❖ To apply the conceptual model to a case study of GM technology adoption in a developing
country context, to determine what are the main drivers and who are the key stakeholders
in establishing social license in Bangladesh; and
❖ To derive policy implications for the adoption of GM technologies within developing
countries, such as adoption of Bt-brinjal in Bangladesh.
The proposed conceptual model of social license for the adoption of GM crop is developed
from a review of literature on social license generally, and literature on the adoption of agricultural
biotechnology. To address the second objective (identifying the main drivers of social license for
the adoption of Bt-brinjal in Bangladesh), primary survey data was collected in Bangladesh.
Farmers, who are currently growing Bt-brinjal (adopters) and others who are not growing Bt-
brinjal (non-adopters) participated in the survey. The quantitative farmer surveys are supplemented
with a short consumer survey and stakeholder interviews. The empirical analysis focuses on the
farmers’ survey data, using a multinomial logit model to examine the motivations for a positive
willingness to adopt Bt-brinjal.
1.4 Organization of the Thesis
This thesis is divided into five chapters. Chapter 1 has described the background
information and problem statement of this thesis. This study is undertaken to examine the factors
influencing social license for adopting new technology in a developing country context. Chapter
2 presents the literature review, which includes a brief discussion of Bt-brinjal in Bangladesh and
a discussion of social license. This chapter also reviews literature examining stakeholders’
perceptions of and attitudes towards technology adoption and concludes by developing a
conceptual model of social license. Chapter 3 represents the methodology used in this study,
6
including the design of the survey instrument used to examine stakeholders’ (adopters, non-
adopters and consumers) perceptions of Bt-brinjal. Descriptive analysis of the survey data is also
provided in this chapter. Chapter 4 includes the empirical analysis, including econometric models
of reasons for willingness to adopt Bt-brinjal among adopters and non-adopters, as well as a
discussion of insights from stakeholders’ interviews and a consumer survey. The conclusions to
this thesis are presented in chapter 5 that provides a summary of major research findings, policy
implications for the adoption of a GM crop in a developing country context, and recommendations
for further research.
7
Chapter 2 Literature Review
2. 1 Introduction
The purpose of this chapter is to review previous studies relating to technology adoption,
as well as social license. This chapter reviews the methodology used in previous studies, key
findings and relationships to the present study. A review of relevant literature in any research is
essential because it helps to identify where knowledge gaps lie. This chapter is divided into five
sections. The first section provides a brief overview of Bt-brinjal in Bangladesh (section 2.2). The
second section provides the definition of social license (section 2.3). Literature examining
stakeholders’ attitudes towards technology adoption is discussed in section 2.4, followed by the
development of a conceptual model of social license (section 2.5). Conclusions to the chapter are
provided in section 2.6.
2.2 Bt-brinjal: A GM Crop in Bangladesh
2.2.1 Overview of the Agricultural Sector in Bangladesh
Bangladesh is an Asian country with only 56,977 square miles of land, which is surrounded
by India, Myanmar and the Bay of Bengal. The total population of Bangladesh is 161 million and
is increasing rapidly (The World Bank, 2016). The population density was 1,237 per square
kilometer in 2015 (The World Bank, 2016). More than 66.48% of the population of Bangladesh
lives in the rural areas where agriculture is the main source of livelihood. Bangladesh is an agro-
based country with a total cultivable area of 9 million hectares, which is 70% of the total land area
of Bangladesh (The World Bank, 2016). Thus, the economy of Bangladesh is mostly dependent
on agriculture. The main crop is rice, and other major crops include potatoes, sugarcane, wheat,
jute and corn. Bangladesh is a low middle-income country and has faced many challenges since
its inception, including poor infrastructure, food insecurity, and political instability. Moreover, the
high population density creates other problems including poverty, malnutrition, and food
insecurity. Therefore, there is a need for persistent investment in agricultural research and
extension, rural infrastructure and irrigation systems to strengthen the agriculture sector as well as
the country’s economy (Meherunnahar and Poul, 2009). The Government of Bangladesh is trying
to introduce new agricultural technologies and therefore, the governmental institutions, public
universities and other private institutions have started working on agricultural biotechnology.
8
To feed the growing population, Bangladesh needs more food and it has been argued that
agricultural biotechnology represents an opportunity to meet the food needs of the population as
well as to reduce poverty and heighten environmental sustainability (Nasiruddin, 2012). The
process of development of agricultural biotechnology started in the late 1970s with plant
biotechnology (Choudhury, 1986), with the first ‘genetically modified’ crops emerging in
developed countries in the 1990s. The introduction of genetically modified crops in lower income
countries has been slower; however, more recently developing countries are exhibiting higher
adoption rates. For example, Bangladesh is now seeing the development of GM crops in the
agricultural sector. Researchers suggest that Bangladesh has a considerable potential to adopt GM
crops (Choudhary et al., 2014; Nasiruddin, 2012). Indeed Bt-brinjal was approved in Bangladesh
in 2013 and Golden Rice is on the way to commercialization.
2.2.2 Crop Biotechnology and Institutional Involvement in the Development of
Biotechnology in Bangladesh
Research on agricultural biotechnology was started in Bangladesh in the late 1970s. The
Department of Botany at the University of Dhaka, first started research on plant tissue culture1 and
subsequently various research institutions became also involved with tissue culture research, such
as the Bangladesh Rice Research Institute (BRRI), Bangladesh Agricultural Research Institute
(BARI), Bangladesh Jute Research Institute (BJRI), Bangladesh Council of Scientific and
Industrial Research (BCSIR), Bangladesh Institute of Nuclear Agriculture (BINA) and
Universities like the Chittagong University, Rajshahi University, Khulna University and
Jahangirnagar University (Nasiruddin, 2012). After introducing tissue culture, researchers started
focusing on genetic engineering research, mostly on gene transformation of jute, pulses and rice
for salinity tolerance and fungus resistance (Nasiruddin, 2012). As a developing country,
Bangladesh has limited facilities and research capacity for biotechnology, therefore, Bangladesh
implemented technologies from other developing countries as part of a research partnership
(Nasiruddin, 2012). For example, the BARI obtained the Elite Event-1 (EE-1 expresses insecticidal
protein cry1Ac in brinjal) from an Indian Company, Maharashtra Hybrid Seeds Co. Ltd. (Mahyco)
under a United States Agency for International Development (USAID) program and the name of
the program was The Agricultural Biotechnology Support project-II in 2005 (Choudhary et al.,
1 The term tissue culture refers to the artificial cultivation of plant tissue

9
2014). Thereafter BARI, with the collaboration of Mahyco, developed a brinjal variety which is
resistant to the shoot and fruit borer (FSB) pests. At the same time, the Bangladesh Rice Research
Institute (BRRI), with the collaboration of the International Rice Research Institute (IRRI),
developed a GM rice variety (Vitamin A enriched Golden Rice) by introgressing a gene of pro-
vitamin A in a local variety of rice.
Different research institutes and their sub-sectional stations are working on biotechnology
development activities (Nasiruddin, 2012). Several national and international organizations, with
the collaboration of the Bangladesh government, started programs to increase awareness and
understanding of biotechnology. Examples of these programs include Agricultural Biotechnology
Support Project-II (ABSP-II), South Asia Biosafety Program (SABP) and the Bangladesh
Biotechnology Information Center (BdBIC). These programs mostly focus on providing
information about biotechnology through several activities. A brief description of these programs
is provided below. Various local and international seminars, workshops and training programs are
on-going through these programs to improve awareness about agricultural biotechnology in
Bangladesh.
2.2.2.1 Agricultural Biotechnology Support Project-II
Agricultural Biotechnology Support Project-II is a United States Agency for International
Development (USAID) funded program led by Cornell University. The main aim of this program
is to provide benefits from agricultural biotechnology to selected developing countries in East and
West Africa as well as India, Bangladesh, Indonesia and the Philippines. The ABSP-II program
started in Bangladesh in 2002 and is working to improve awareness about biotechnology through
local and foreign seminars, workshops and training programs (Nasiruddin, 2012). Bt-brinjal and
Rb potato were first introduced in Bangladesh in 2006 through this program (Nasiruddin, 2012).
Rb potato is a GM crop variety, which carries an additional gene - Rb derived from a wild potato
species (S. bulbocastanum) to control late blight potato disease (Song et al., 2003). The ABSP-II
program also assists research and trial activities for GM crops in Bangladesh. The program
generates various biotech activities with the collaboration of International Service for the
Acquisition of Agri-biotech Applications (ISAAA), SABP and works with governmental
organizations, policy planners, non-governmental organizations (NGOs) and the private sector
(Nasiruddin, 2012).
10
2.2.2.2 South Asia Biosafety Program (SABP)
The South Asia Biosafety Program is also a USAID supported program, which is intended
to assist India and Bangladesh in further strengthening institutional governance of agricultural
biotechnology. The SABP program is a collaboration between the Center for Environmental Risk
Assessment (CERA) and the International Food Policy Research Institute (IFPRI) (Nasiruddin,
2012). The program works in Bangladesh to support the Government of Bangladesh to strengthen
the agricultural biotechnology sector through public and private institutions, collaborating with the
ministries of Agriculture, Health, Science and Environment, district governments, national
research and policy institutions, stakeholders in the agricultural sector, NGOs and other
development agencies (Nasiruddin, 2012). Some general objectives of the SABP program include:
▪ Identify and respond to technical training needs for food, feed and environmental safety
assessment;
▪ Develop a sustainable network of trained, authoritative local experts to communicate both
the benefits and concerns associated with new agricultural biotechnologies to farmers and
other stakeholder groups;
▪ Facilitate systems for permitting the safe conduct of experimental field trials of new crops
developed using biotechnology so that scientists and farmers can evaluate them; and
▪ Raise the profile of biotechnology and biosafety on the policy agenda within Bangladesh
and India and to address the policy issues within the overall context of economic and
agricultural development, international trade and environmental sustainability (Nasiruddin,
2012, p. 215).
The SABP program organizes workshops on the safety assessments of GM crop
development and to provide information about the potential benefits of agricultural biotechnology
among the Department of Agricultural Extension (DAE) officers (Nasiruddin, 2012).
2.2.2.3 Bangladesh Biotechnology Information Center (BdBIC)
The Bangladesh Biotechnology Information Center was first initiated in Bangladesh in
2005 and led by the Department of Biotechnology at Bangladesh Agricultural University,
Mymensingh. The BdBIC translated the ISAAA’s different publications related to crop biotech
into the Bangla language to help those stakeholders who have a language barrier (Nasiruddin,

11
2012). Through its e-group, it also disseminates information to various biotech players such as
biotech researchers, scientists, government and the private sector representatives and media
(Nasiruddin, 2012). To raise the awareness and understanding of biotechnology, BdBIC organizes
workshops and seminars. It also organizes writing competitions on agricultural biotechnology in
collaboration with Bangladesh Agricultural University. The BdBIC has an important role in
providing information on the national biosafety policies and guidelines for the country.
2.2.3 Vegetable Production in Bangladesh
Vegetable production is very important to Bangladesh because of the suitable weather
conditions. There are two main seasons for vegetable production in Bangladesh - summer/rainy
season (Kharif season) and winter season (Rabi Season). The Kharif season runs from mid-April
to mid-October and the Rabi season is from mid-October to mid-March. Most of the vegetables
are grown in the Rabi season because of the relatively low temperature, suitable humidity and
rainfall. The Rabi season vegetables include brinjal, cauliflower, water gourd, cabbage, rabi
pumpkin, tomatoes, radish, and spinach, among others. In the Kharif season, the weather remains
very hot and farmers are usually faced with irrigation problems. Vegetables grown in the Kharif
season include kharif brinjal, potol, lady’s finger, karala, arum, and cucumber among others.
Brinjal/eggplant is a vegetable, which is grown throughout the year, so it is also called an
all-season vegetable. Vegetable production during the Rabi season is higher than the Kharif season.
For example, in 2012-13, brinjal production in the Rabi season was 236,000 tonnes where the
kharif brinjal production was only 132,000 tonnes (BBS: Monthly Statistical Bulletin, 2015).
Vegetables are perishable and there is no adequate storage system for these perishable goods. As
a result, the price of vegetables in the winter season or Rabi season is relatively low compared to
the Kharif season. Thus, there is a need for vegetable availability throughout the year to meet
consumer demands as well as to provide a more stable marketing environment for producers.
Previous studies have shown that vegetable production has increased with an annual
growth rate of 2.8 percent between 1980 and 2003 (Meherunnahar and Poul, 2009) but some
studies found that this increased production can be attributed to area expansion which is 2.6 percent
and that vegetable yields increased by only 0.2 percent (Meherunnahar and Poul, 2009). According
to the Asian Development Bank (2001), the acreage devoted to vegetable production has increased
from 1.9 percent to 3.6 percent from 1980 to 2002. However, Meherunnahar and Poul (2009) found
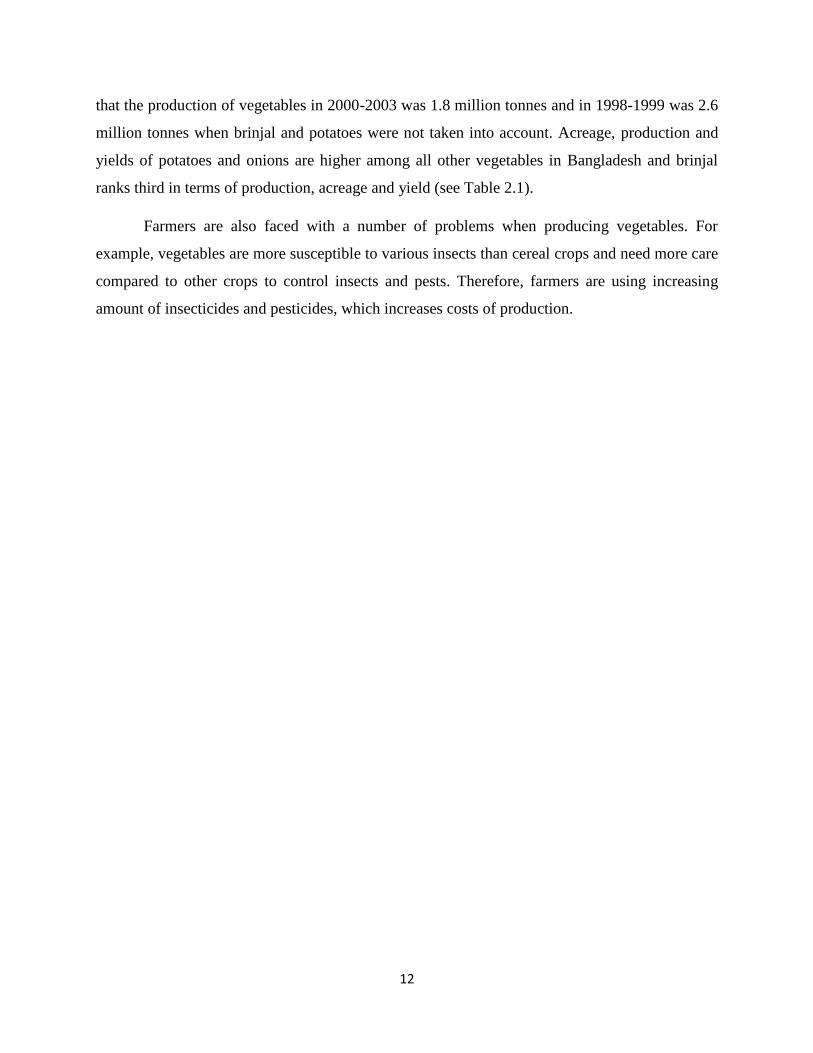
12
that the production of vegetables in 2000-2003 was 1.8 million tonnes and in 1998-1999 was 2.6
million tonnes when brinjal and potatoes were not taken into account. Acreage, production and
yields of potatoes and onions are higher among all other vegetables in Bangladesh and brinjal
ranks third in terms of production, acreage and yield (see Table 2.1).
Farmers are also faced with a number of problems when producing vegetables. For
example, vegetables are more susceptible to various insects than cereal crops and need more care
compared to other crops to control insects and pests. Therefore, farmers are using increasing
amount of insecticides and pesticides, which increases costs of production.
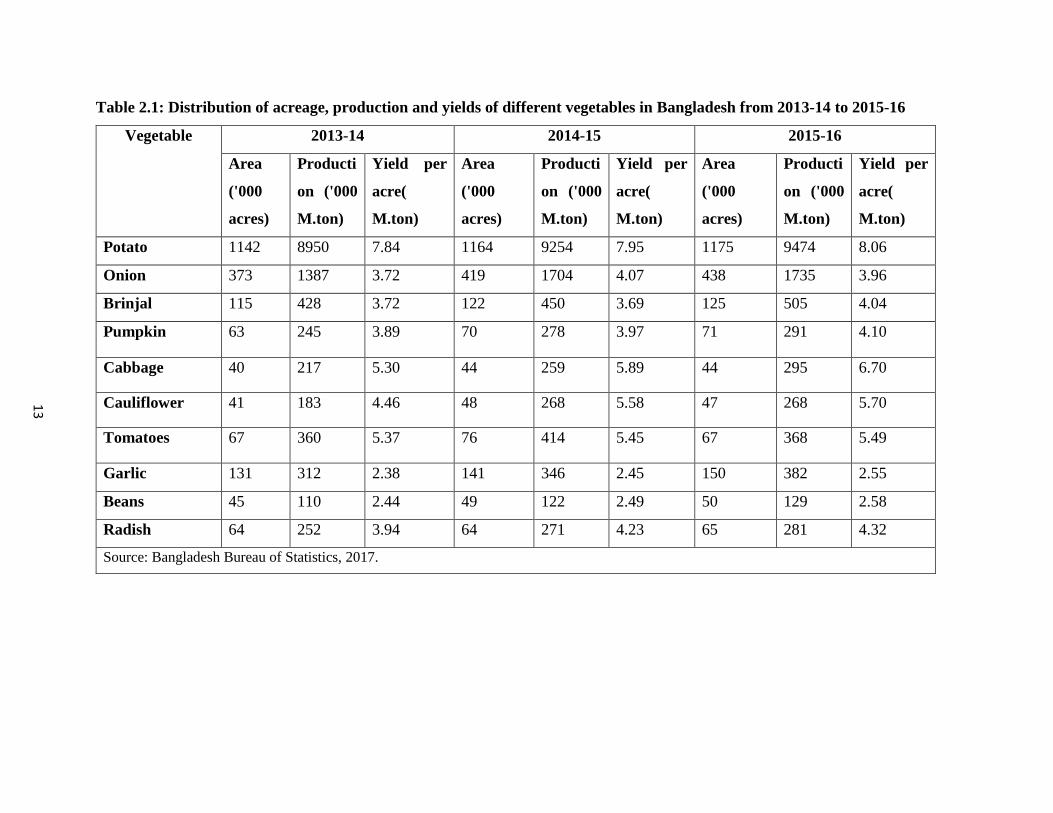
13
Table 2.1: Distribution of acreage, production and yields of different vegetables in Bangladesh from 2013-14 to 2015-16
Vegetable 2013-14 2014-15 2015-16
Area
('000
acres)
Producti
on ('000
M.ton)
Yield per
acre(
M.ton)
Area
('000
acres)
Producti
on ('000
M.ton)
Yield per
acre(
M.ton)
Area
('000
acres)
Producti
on ('000
M.ton)
Yield per
acre(
M.ton)
Potato 1142 8950 7.84 1164 9254 7.95 1175 9474 8.06
Onion 373 1387 3.72 419 1704 4.07 438 1735 3.96
Brinjal 115 428 3.72 122 450 3.69 125 505 4.04
Pumpkin 63 245 3.89 70 278 3.97 71 291 4.10
Cabbage 40 217 5.30 44 259 5.89 44 295 6.70
Cauliflower 41 183 4.46 48 268 5.58 47 268 5.70
Tomatoes 67 360 5.37 76 414 5.45 67 368 5.49
Garlic 131 312 2.38 141 346 2.45 150 382 2.55
Beans 45 110 2.44 49 122 2.49 50 129 2.58
Radish 64 252 3.94 64 271 4.23 65 281 4.32
Source: Bangladesh Bureau of Statistics, 2017.
14
2.2.4 Brinjal Production in Bangladesh
Brinjal is an important vegetable for its commercial and nutritional value in many
countries. In Bangladesh, it is known as “Begun” and is a commonly, consumed and popular
vegetable. It is a staple vegetable in the diet and rich in nutritional value. White brinjal is said to
be good for diabetic patients and an excellent remedy for those who have liver problems
(Chowdhury, 2012). Brinjal consists of 92.7 % moisture and also is high in fibre, folic acid,
manganese; magnesium and potassium (see Table 2.2).
Brinjal (Solanum melongena L.) or eggplant or aubergine is one of the most important
vegetables in Asia. China and India are the world’s largest brinjal producing countries. In 2007,
China and India contributed 56% and 26% of the world’s production of brinjal respectively
(Meherunnahar and Poul, 2009). Brinjal is also an important crop in Bangladesh, ranking third
after potatoes and onions in terms of consumption (Choudhary et al., 2014).
Most of the brinjal producers in Bangladesh are small or marginal farmers. The average
farm size in Bangladesh is 0.24 hectares (FAO, 2016). Brinjal is produced all over the country and
an estimated 150,000 farmers grow it on approximately 50,000 hectares of land (Choudhary et al.,
2014). Farmers like to produce different types of brinjal, which vary in colour, shape and size
because consumers use different varieties of brinjal for different dishes.
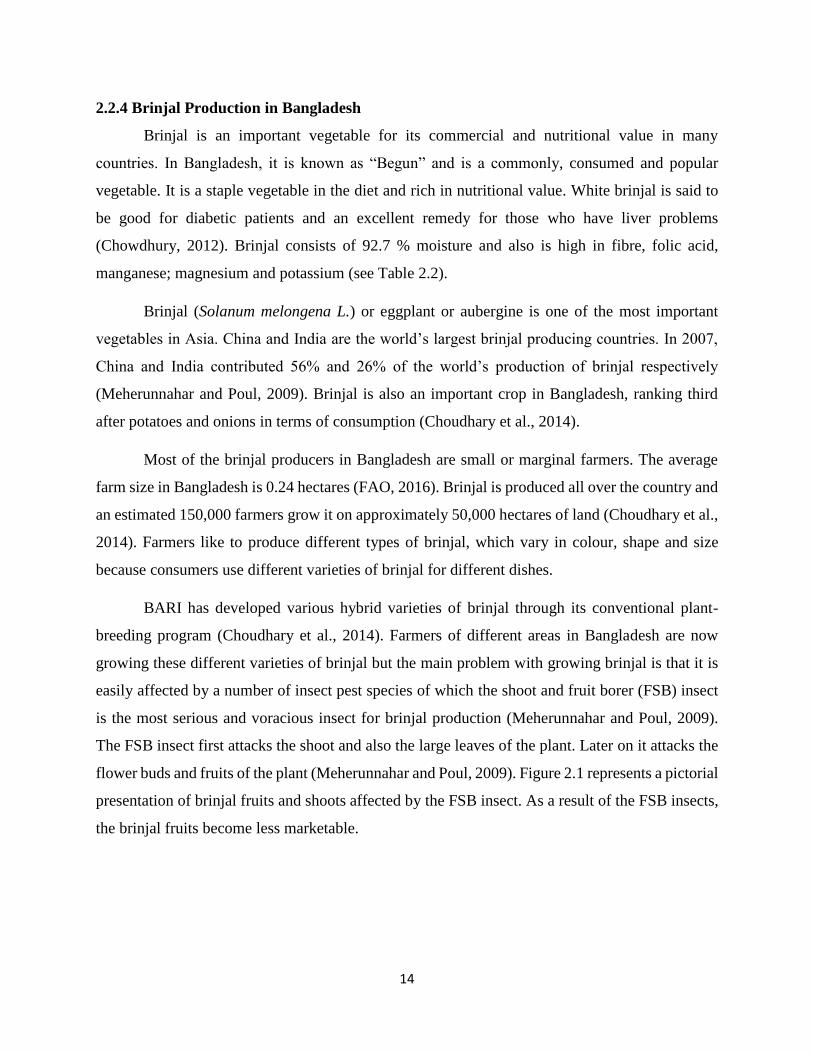
BARI has developed various hybrid varieties of brinjal through its conventional plant-
breeding program (Choudhary et al., 2014). Farmers of different areas in Bangladesh are now
growing these different varieties of brinjal but the main problem with growing brinjal is that it is
easily affected by a number of insect pest species of which the shoot and fruit borer (FSB) insect
is the most serious and voracious insect for brinjal production (Meherunnahar and Poul, 2009).
The FSB insect first attacks the shoot and also the large leaves of the plant. Later on it attacks the
flower buds and fruits of the plant (Meherunnahar and Poul, 2009). Figure 2.1 represents a pictorial
presentation of brinjal fruits and shoots affected by the FSB insect. As a result of the FSB insects,
the brinjal fruits become less marketable.
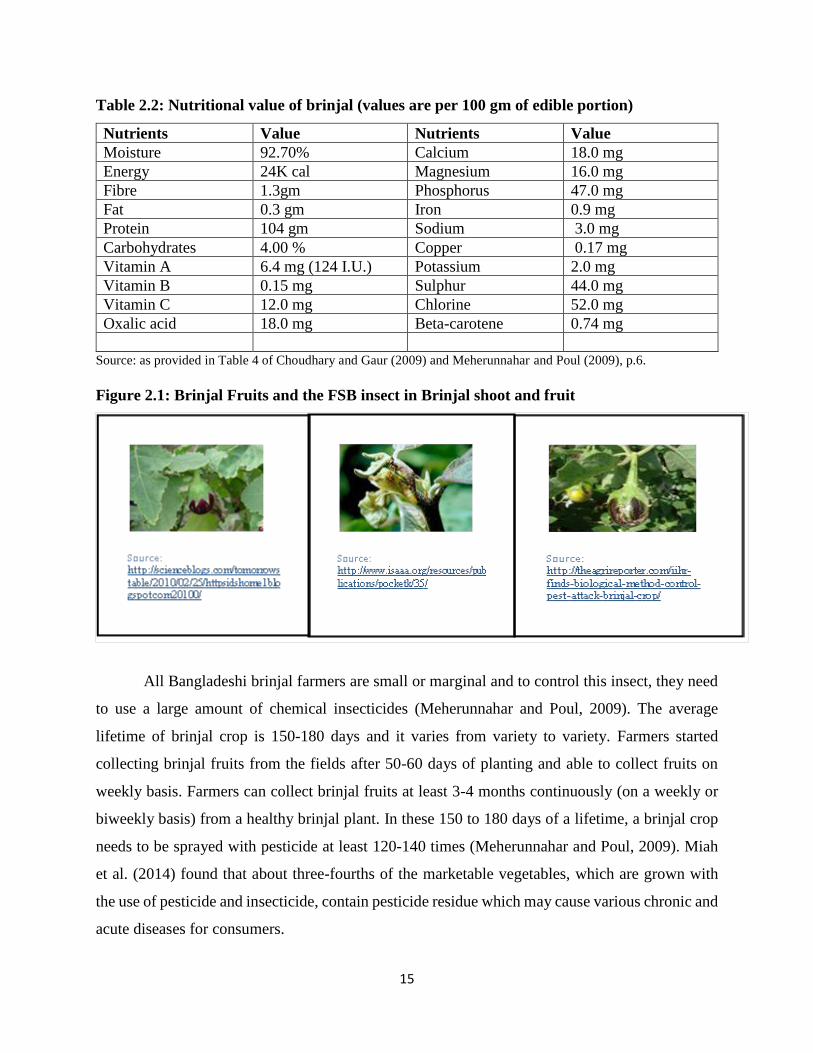
15
Table 2.2: Nutritional value of brinjal (values are per 100 gm of edible portion)
Nutrients Value Nutrients Value
Moisture 92.70% Calcium 18.0 mg
Energy 24K cal Magnesium 16.0 mg
Fibre 1.3gm Phosphorus 47.0 mg
Fat 0.3 gm Iron 0.9 mg
Protein 104 gm Sodium 3.0 mg
Carbohydrates 4.00 % Copper 0.17 mg
Vitamin A 6.4 mg (124 I.U.) Potassium 2.0 mg
Vitamin B 0.15 mg Sulphur 44.0 mg
Vitamin C 12.0 mg Chlorine 52.0 mg
Oxalic acid 18.0 mg Beta-carotene 0.74 mg
Source: as provided in Table 4 of Choudhary and Gaur (2009) and Meherunnahar and Poul (2009), p.6.
Figure 2.1: Brinjal Fruits and the FSB insect in Brinjal shoot and fruit
All Bangladeshi brinjal farmers are small or marginal and to control this insect, they need
to use a large amount of chemical insecticides (Meherunnahar and Poul, 2009). The average
lifetime of brinjal crop is 150-180 days and it varies from variety to variety. Farmers started
collecting brinjal fruits from the fields after 50-60 days of planting and able to collect fruits on
weekly basis. Farmers can collect brinjal fruits at least 3-4 months continuously (on a weekly or
biweekly basis) from a healthy brinjal plant. In these 150 to 180 days of a lifetime, a brinjal crop
needs to be sprayed with pesticide at least 120-140 times (Meherunnahar and Poul, 2009). Miah
et al. (2014) found that about three-fourths of the marketable vegetables, which are grown with
the use of pesticide and insecticide, contain pesticide residue which may cause various chronic and
acute diseases for consumers.

16
The cost of pesticide applications becomes an obstacle for the marginal farmers to produce
brinjal. The application of different pesticide and insecticide increases not only the cost of
production but also hampers the production of brinjal. Moreover, the farmers who are working on
brinjal fields and applying pesticide and insecticide are exposed to health risks from the use of
these chemicals. For example, Miah et al. (2014) found that pesticide users who have been
producing crops for 15-19 years suffer from health problems, such as skin problems, eye irritation,
gastro-intestinal diseases, urine and sex related diseases and other short-term health problems.
To reduce the problem and to control the effects of the FSB insect on the brinjal plant,
Asian countries are trying to introduce a GM crop named Bt-brinjal which is resistant to the FSB
insect. In Bangladesh, GM crops include Bt-brinjal, Golden Rice and Rb potato that are in the trial
process and, to date, only Bt-brinjal has been approved in 2013 for commercialization. Thus, Bt-
brinjal is the very first GM crop in Bangladesh. Several studies have assessed the potential
socioeconomic impact of Bt-brinjal production, for example, Crawford et al. (2003) and
Meherunnahar and Poul (2009) find that Bt-brinjal has a significant potential to improve farmers’
financial conditions as well as the socioeconomic condition of Bangladesh.
2.2.5 Bt-brinjal in Bangladesh
Bt-brinjal is a GM crop, which carries an additional gene to protect the brinjal fruit from
the shoot and fruit borer (FSB) insect. Bt-brinjal carries an additional gene named cry1Ac, which
contains insecticidal protein to confer resistance against FSB. Cry1Ac gene is found from an
environmentally friendly and ubiquitous soil bacterium, which is Bacillus thuringiensis (Bt)
(Choudhary and Gaur, 2009).
Brinjal is an important vegetable in Bangladesh. Thus, to control the FSB insect,
Bangladesh started producing Bt-brinjal but the development process of getting approval to
produce Bt-brinjal was lengthy. An Indian company, Maharashtra Hybrid Seeds Co. Ltd.
(Mahyco), collaborated with the Agricultural Biotechnology Support project-II (ABSP-II)
managed by Cornell University, to first introduce this Bt-technology. Bangladesh also obtained
this technology from Mahyco in 2005 and the Bt-technology was also donated to public sector
institutions in India and the Philippines (Choudhary et al., 2014).
The scientists at BARI, with the collaboration of Mahyco have developed Bt-brinjal by
introgressing EE-1 to 9 local brinjal varieties. These local varieties of brinjal are the very popular

17
varieties of brinjal among the small brinjal producing farmers (Choudhary, et al., 2014). Scientists
at BARI, with the collaboration of USAID and Mahyco, then started testing Bt-brinjal in
Bangladesh in 2005. Bt-brinjal was first tested in a contained and confined environment over the
period 2005 to 2008. After different laboratory trial tests, BARI researchers make the decision to
provide Bt-brinjal seed to farmers for field trials. The first open field trial was held in different
areas in Bangladesh during 2008-2009, using only 6 varieties of Bt-brinjal seed. These 6 varieties
were Uttara, Dohazari, Nayantara, Shingnath, ISD006 and Chaga (Choudhary et al., 2014). The
second set of field trials were carried out in 2010-11 to 2011-12 by including 3 more Bt-brinjal
varieties Kajla, Islampuri and Khatkatia (Choudhary et al., 2014).
During these field trial seasons biosafety studies were also conducted to monitor the
environmental effects of producing Bt-brinjal and also to examine the nutritional value of Bt-
brinjal. These field trials showed that the FSB insect does not affect Bt-brinjal and the productivity
rate of Bt-brinjal is higher than regular brinjal. For example, Kumar et al. (2011) found that a 15
percent adoption rate of Bt-brinjal would increase the production of brinjal by 30 thousand tonnes
more than the regular production of brinjal. According to Meherunnahar and Poul (2009) the
nutritional value of this new variety was examined, however, Bt-brinjal has the same nutritional
value as regular brinjal. The authors also argued that Bt-brinjal is safe for human health and the
environment.
After completing the biosafety studies, BARI submitted an application to the National
Technical Committee for Crop Biotechnology (NTCCB) of the Ministry of Agriculture seeking
approval of Bt-brinjal in Bangladesh (Choudhary et al., 2014). In early 2013, NTCCB constituted
an expert committee to evaluate the biosafety of producing Bt-brinjal in Bangladesh. The expert
committee then evaluated the biosafety data and they found that Bt-brinjal production is
technically sound. The expert committee of NTCCB re-examined all the biosafety data for
producing the GM crop. After evaluating all the biosafety data, the NTCCB expert committee sent
their recommendation to the National Committee of Biosafety (NCB) of the Ministry of
Environment and Forests (MOEF). The National Committee of Biosafety is the most important
regulatory agency for the approval of GM crops in Bangladesh. After reviewing and evaluating all
of the information, the NCB approved the cultivation of Bt-brinjal in Bangladesh (Choudhary et
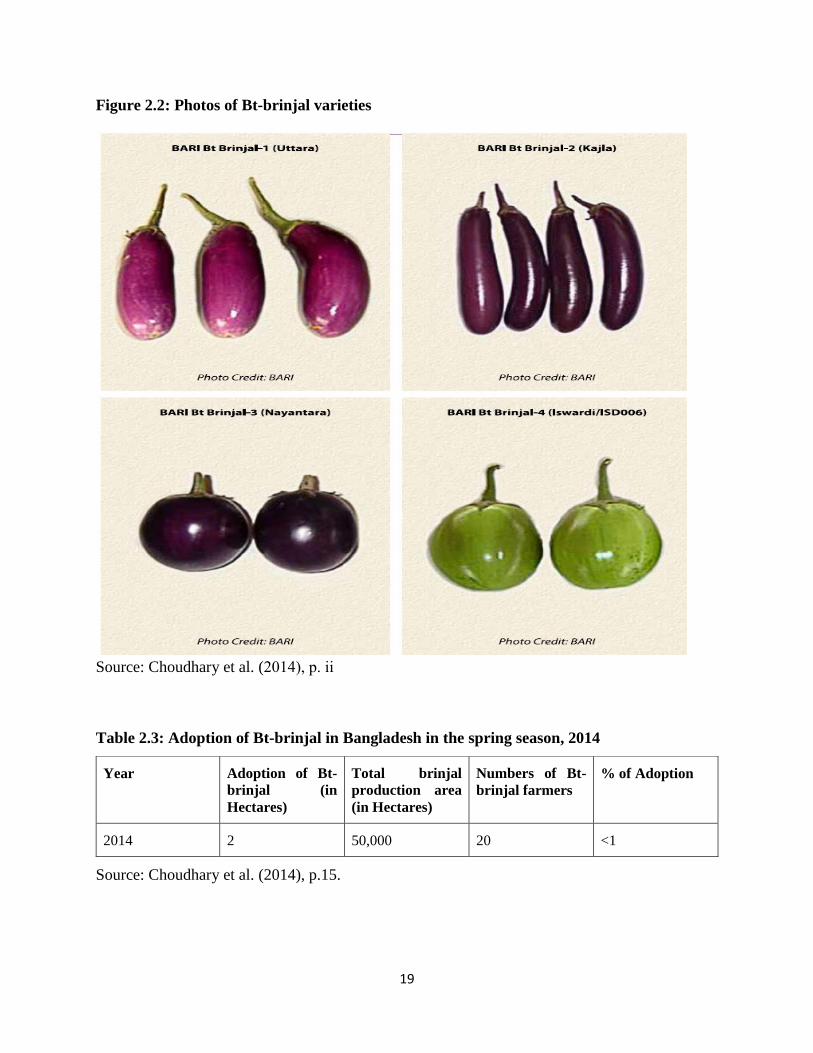
al., 2014). Among the 9 varieties of Bt-brinjal the NCB approved only four varieties of Bt-brinjal

18
for a limited cultivation on 30 October 2013. The local names of these four Bt-brinjal varieties are
Uttara, Kajla, Nayantara and ISD006 (see Figure 2.2).
After receiving the approval, BARI raised 30-35 days old Bt-brinjal seedlings. In January
2014, BARI and USAID along with Bangladesh’s Ministry of Agriculture organized a program to
provide Bt-brinjal seedlings to a group of farmers (Choudhary et al., 2014). In that program they
distributed Bt-brinjal seedlings grown by BARI to 20 selected farmers (see Table 2.3). These 20
farmers were selected from the most important brinjal growing regions of Bangladesh - Gazipur,
Pabna, Jamalpur and Rangpur (Choudhary et al., 2014). In the first year of planting Bt-brinjal in
Bangladesh around 2 hectares of land was used for growing Bt-brinjal where the total area of
brinjal production was 50,000 hectares (Choudhary et al., 2014). Table 2.4 shows the geographic
distribution of Bt-brinjal in 2014.
19
Figure 2.2: Photos of Bt-brinjal varieties
Source: Choudhary et al. (2014), p. іі
Table 2.3: Adoption of Bt-brinjal in Bangladesh in the spring season, 2014
Source: Choudhary et al. (2014), p.15.
Year Adoption of Bt-
brinjal (in
Hectares)
Total brinjal
production area
(in Hectares)
Numbers of Bt-
brinjal farmers
% of Adoption
2014 2 50,000 20 <1
20
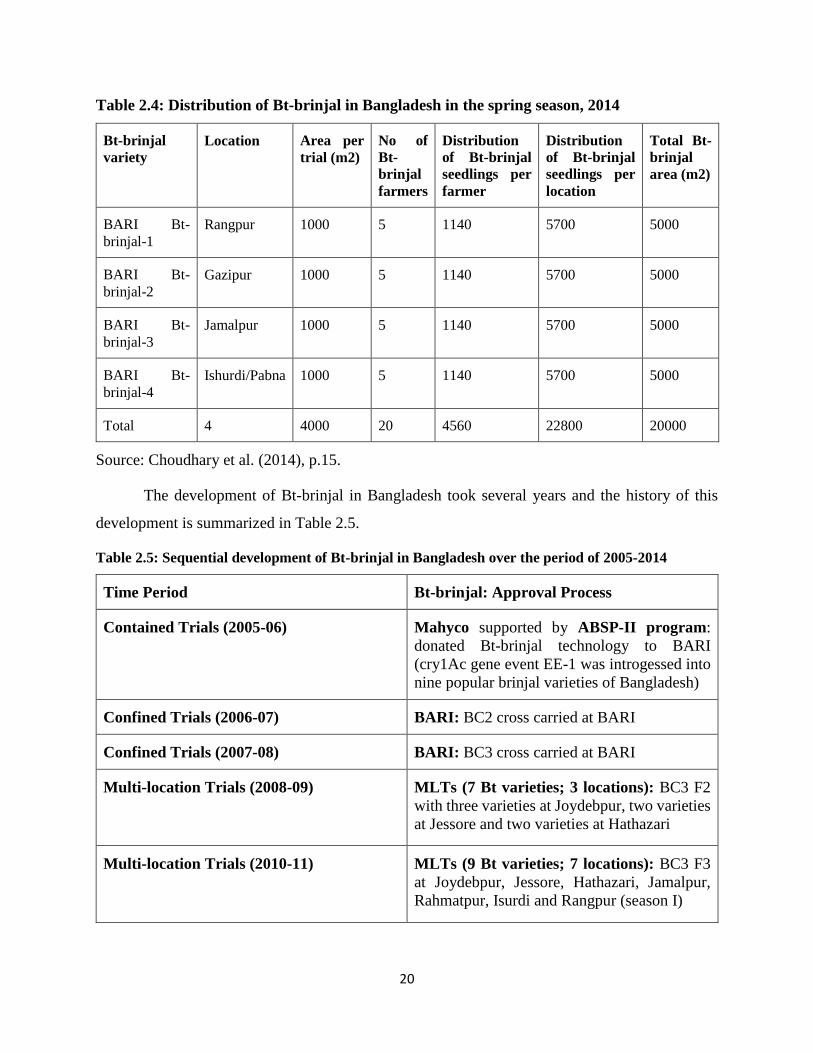
Table 2.4: Distribution of Bt-brinjal in Bangladesh in the spring season, 2014
Bt-brinjal
variety
Location Area per
trial (m2)
No of
Bt-
brinjal
farmers
Distribution
of Bt-brinjal
seedlings per
farmer
Distribution
of Bt-brinjal
seedlings per
location
Total Bt-
brinjal
area (m2)
BARI Bt-
brinjal-1
Rangpur 1000 5 1140 5700 5000
BARI Bt-
brinjal-2
Gazipur 1000 5 1140 5700 5000
BARI Bt-
brinjal-3
Jamalpur 1000 5 1140 5700 5000
BARI Bt-
brinjal-4
Ishurdi/Pabna 1000 5 1140 5700 5000
Total 4 4000 20 4560 22800 20000
Source: Choudhary et al. (2014), p.15.
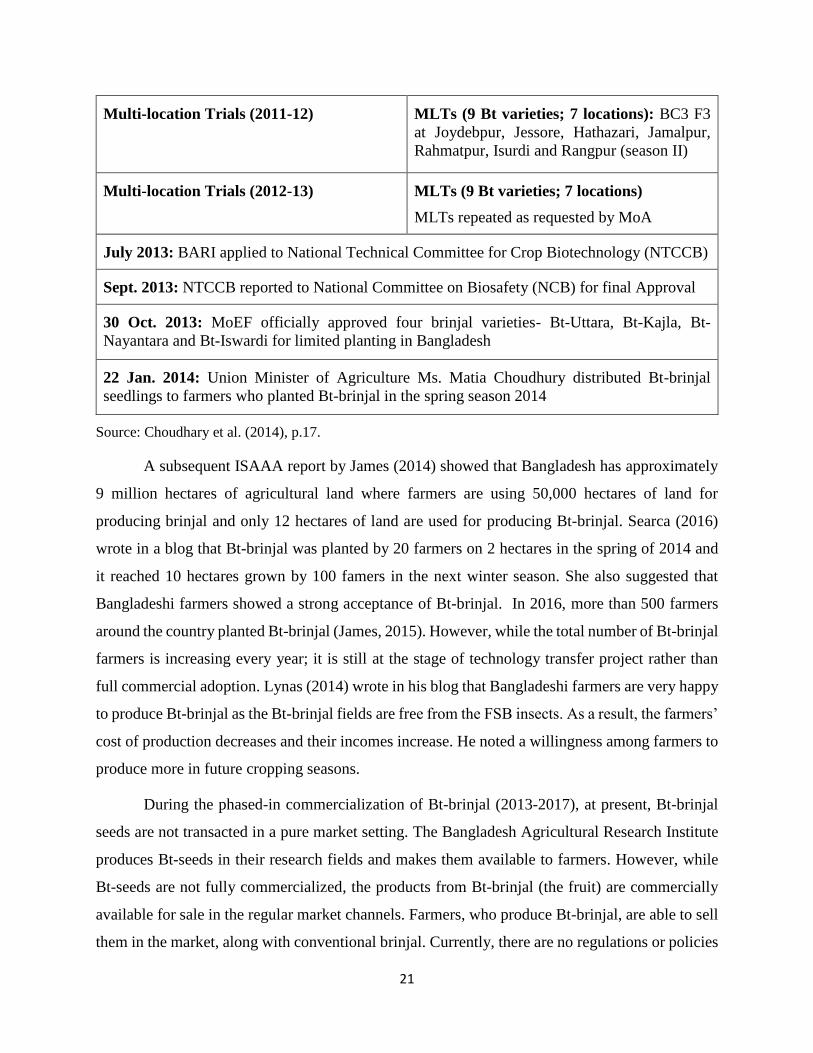
The development of Bt-brinjal in Bangladesh took several years and the history of this
development is summarized in Table 2.5.
Table 2.5: Sequential development of Bt-brinjal in Bangladesh over the period of 2005-2014
Time Period Bt-brinjal: Approval Process
Contained Trials (2005-06) Mahyco supported by ABSP-II program:
donated Bt-brinjal technology to BARI
(cry1Ac gene event EE-1 was introgessed into
nine popular brinjal varieties of Bangladesh)
Confined Trials (2006-07) BARI: BC2 cross carried at BARI
Confined Trials (2007-08) BARI: BC3 cross carried at BARI
Multi-location Trials (2008-09) MLTs (7 Bt varieties; 3 locations): BC3 F2
with three varieties at Joydebpur, two varieties
at Jessore and two varieties at Hathazari
Multi-location Trials (2010-11) MLTs (9 Bt varieties; 7 locations): BC3 F3
at Joydebpur, Jessore, Hathazari, Jamalpur,
Rahmatpur, Isurdi and Rangpur (season I)
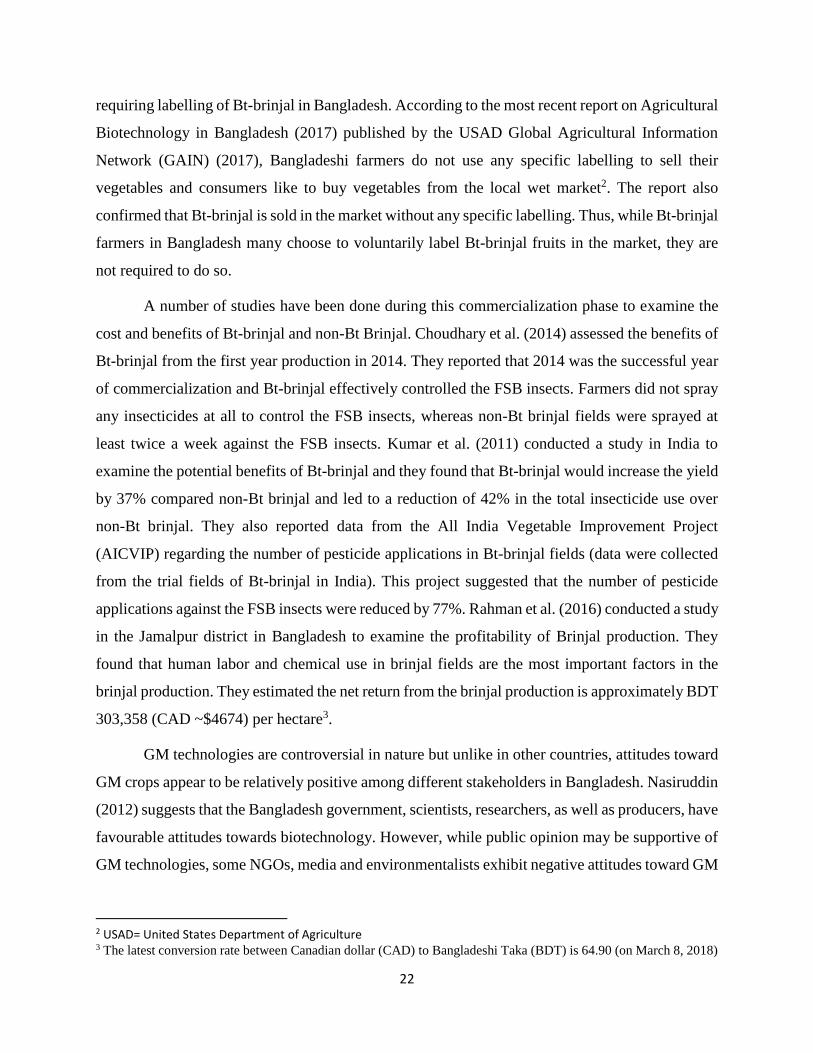
21
Multi-location Trials (2011-12) MLTs (9 Bt varieties; 7 locations): BC3 F3
at Joydebpur, Jessore, Hathazari, Jamalpur,
Rahmatpur, Isurdi and Rangpur (season II)
Multi-location Trials (2012-13) MLTs (9 Bt varieties; 7 locations)
MLTs repeated as requested by MoA
July 2013: BARI applied to National Technical Committee for Crop Biotechnology (NTCCB)
Sept. 2013: NTCCB reported to National Committee on Biosafety (NCB) for final Approval
30 Oct. 2013: MoEF officially approved four brinjal varieties- Bt-Uttara, Bt-Kajla, Bt-
Nayantara and Bt-Iswardi for limited planting in Bangladesh
22 Jan. 2014: Union Minister of Agriculture Ms. Matia Choudhury distributed Bt-brinjal
seedlings to farmers who planted Bt-brinjal in the spring season 2014
Source: Choudhary et al. (2014), p.17.
A subsequent ISAAA report by James (2014) showed that Bangladesh has approximately
9 million hectares of agricultural land where farmers are using 50,000 hectares of land for
producing brinjal and only 12 hectares of land are used for producing Bt-brinjal. Searca (2016)
wrote in a blog that Bt-brinjal was planted by 20 farmers on 2 hectares in the spring of 2014 and
it reached 10 hectares grown by 100 famers in the next winter season. She also suggested that
Bangladeshi farmers showed a strong acceptance of Bt-brinjal. In 2016, more than 500 farmers
around the country planted Bt-brinjal (James, 2015). However, while the total number of Bt-brinjal
farmers is increasing every year; it is still at the stage of technology transfer project rather than
full commercial adoption. Lynas (2014) wrote in his blog that Bangladeshi farmers are very happy
to produce Bt-brinjal as the Bt-brinjal fields are free from the FSB insects. As a result, the farmers’
cost of production decreases and their incomes increase. He noted a willingness among farmers to
produce more in future cropping seasons.
During the phased-in commercialization of Bt-brinjal (2013-2017), at present, Bt-brinjal
seeds are not transacted in a pure market setting. The Bangladesh Agricultural Research Institute
produces Bt-seeds in their research fields and makes them available to farmers. However, while
Bt-seeds are not fully commercialized, the products from Bt-brinjal (the fruit) are commercially
available for sale in the regular market channels. Farmers, who produce Bt-brinjal, are able to sell
them in the market, along with conventional brinjal. Currently, there are no regulations or policies
22
requiring labelling of Bt-brinjal in Bangladesh. According to the most recent report on Agricultural
Biotechnology in Bangladesh (2017) published by the USAD Global Agricultural Information
Network (GAIN) (2017), Bangladeshi farmers do not use any specific labelling to sell their
vegetables and consumers like to buy vegetables from the local wet market2. The report also
confirmed that Bt-brinjal is sold in the market without any specific labelling. Thus, while Bt-brinjal
farmers in Bangladesh many choose to voluntarily label Bt-brinjal fruits in the market, they are
not required to do so.
A number of studies have been done during this commercialization phase to examine the
cost and benefits of Bt-brinjal and non-Bt Brinjal. Choudhary et al. (2014) assessed the benefits of
Bt-brinjal from the first year production in 2014. They reported that 2014 was the successful year
of commercialization and Bt-brinjal effectively controlled the FSB insects. Farmers did not spray
any insecticides at all to control the FSB insects, whereas non-Bt brinjal fields were sprayed at
least twice a week against the FSB insects. Kumar et al. (2011) conducted a study in India to
examine the potential benefits of Bt-brinjal and they found that Bt-brinjal would increase the yield
by 37% compared non-Bt brinjal and led to a reduction of 42% in the total insecticide use over
non-Bt brinjal. They also reported data from the All India Vegetable Improvement Project
(AICVIP) regarding the number of pesticide applications in Bt-brinjal fields (data were collected
from the trial fields of Bt-brinjal in India). This project suggested that the number of pesticide
applications against the FSB insects were reduced by 77%. Rahman et al. (2016) conducted a study
in the Jamalpur district in Bangladesh to examine the profitability of Brinjal production. They
found that human labor and chemical use in brinjal fields are the most important factors in the
brinjal production. They estimated the net return from the brinjal production is approximately BDT
303,358 (CAD ~$4674) per hectare3.
GM technologies are controversial in nature but unlike in other countries, attitudes toward
GM crops appear to be relatively positive among different stakeholders in Bangladesh. Nasiruddin
(2012) suggests that the Bangladesh government, scientists, researchers, as well as producers, have
favourable attitudes towards biotechnology. However, while public opinion may be supportive of
GM technologies, some NGOs, media and environmentalists exhibit negative attitudes toward GM
2 USAD= United States Department of Agriculture 3 The latest conversion rate between Canadian dollar (CAD) to Bangladeshi Taka (BDT) is 64.90 (on March 8, 2018)
23
crops. An example is UBINIG (Unnayan Bikalper Nitinirdharoni Gobeshona), a community-led
NGO in Bangladesh which translates into English as Policy Research for Development
Alternative. UBINIG works as a research and consultancy organization for the socioeconomic
development of rural poor and marginal people in Bangladesh. It does research on different social
development issues. UBINIG organizes several events against Bt-brinjal. Bt-Begun Birodhi
Morcha (Coalition against Bt-brinajl) is one of them and it works as an alliance of various social
groups (environmentalists, journalists, lawyers, women and health workers). As part of this event,
it claims that Bt-brinjal is a threat to human health, biodiversity and the environment.
NAYAKRISHI andolon is another program supported by UBINIG. The main goal of this program
is to inspire farmers to use conventional seeds without using any agricultural chemicals. As part
of this movement, NAYAKRISHI also organizes different events to share their perspectives on
the new GM crop in Bangladesh.
To date, there is a lack of information about the extent to which social license for the
adoption of Bt-brinjal has been established. This study seeks to examine the factors affecting the
development of social license for Bt-brinjal adoption in Bangladesh and who are the main
stakeholders influencing social license.
2.3 Social License
Social license is relatively new in agriculture, but the concept is not new at all. The concept
of social license may differ from one sector to another and even country to country. Therefore, it
is difficult to define social license. In the context of Canadian agriculture, the Canadian Federation
of Agriculture (CFA, 2015) defined social license as “the ongoing level of acceptance, approval
and trust of consumers regarding how food is produced”. The Canadian Centre for Food Integrity
(CCFI, 2016, p.5) defines social license as “the privilege of operating with minimal formalized
restriction, (legislation, litigation, regulation or market mandates) based on maintaining public
trust by doing what’s right” and they also define public trust as “A belief that activities are
consistent with social expectations and the values of the community and other stakeholders”. Crop
Life Canada (2017) also defines social license as “Social license refers to the level of public trust
granted to a corporate entity or industry sector by the community at large and its key consumer
base.” In addition their definition of public trust is “the belief that activities are consistent with
social expectations and the values of stakeholders, and earned through industry engagement,
24
operating practices, and expressed values. Social license is slow to build, but quick to erode.
Industry tacitly garners public trust by doing what is right.”
Social license is a very common concept in the mining sector (resource sector). According
to Nelsen (2006), social license creates relative transparency between the industry and its
stakeholders by sharing information, values and practices about the industry. Therefore, the
negotiation among different stakeholders and the industry itself helps to acquire accountability and
credibility for the industry. Boutilier and Thomson (2011) defined social license as a community’s
perceptions of the acceptability of a company and its local operation, which means that the local
community has the power to grant the social license for developing a project.
Social license is usually informal and intangible because it is imbedded in beliefs,
perceptions and opinions held by the local population and other stakeholders. Social license is also
dynamic in nature because it depends on beliefs, opinions and perceptions and they are subject to
change over time as additional information is developed. The perceptions toward a new technology
may vary from person to person and their attitudes may change over time. Social license is
consistent with social norms and beliefs and differs from regulatory license. Regulatory license
involves complying with specific legislation and regulatory requirements and procedural
conditions (Yates and Horvath, 2013). A regulatory license is normally defined as a formal license
and it provides permission to use. A regulated governmental authority also authorizes regulatory
license; in contrast, social license is informal and is not regulated by a specific governmental
authority.
Social license has several components, all of which are important in the process of
establishing or developing a technology in agriculture. Trust is the main element of social license
and to make a technology trustworthy, it is also necessary to obtain legitimacy and credibility.
Studies from the mining sector such as Moffat and Zhang (2014) and Boutilier and Thomson,
(2011) explain elements of social license and how they are measured. Boutilier and Thomson
(2011) developed a conceptual model of social license where they defined four levels of social
license and three essential elements of social license. The levels of social license are
withheld/withdrawn, acceptance, approval and psychological identification, while the elements
social license are trust, credibility and legitimacy.
25
Social Legitimacy: The word ‘legitimacy’ comes from a Latin word ‘legitimus’ means
“lawful” or “fixed by law, in line with the law” (Melé and Armengou, 2016). Legitimacy is related
to the acceptance or justification of a technology adoption or an industry’s existence. Social
legitimacy is based on established norms, which may be legal, social or cultural. Social legitimacy
may be formal or informal in nature to obtain social license. In any sector, either agriculture or
mining, it is necessary to know and understand the social norm of the local community before
introducing a new technology. Melé and Armengou (2016) conducted a study on the mining sector
to examine how legitimacy is related with social license to operate. They found that legitimacy
helps a company to convince the local people and other stakeholders of the ethical acceptability of
their projects. Durant and Legge (2006) argue that the public’s perceptions and attitudes toward
GM foods are influenced by general political ideology, gender, socioeconomic status and social
beliefs about politics, society and religion. Social legitimacy is the first step to move into the
acceptance level of a technology adoption. Without social legitimacy, social license cannot be
established in a society (see Figure 2.3). A technology remains in the rejection areas (withdrawn
level) if social legitimacy does not exist for this technology.
Credibility: Credibility is the second step of gaining social license. Credibility means the
quality of being trustworthy. In the context of the mining sector, the institutions or organizations
who are trying to introduce a new mine, need to gain credibility from the local community. This
concept is also applicable in the agriculture sector. Boutilier and Thomson (2011) state that
negotiation between the industry and its other stakeholders facilitates knowledge exchange and
allows the parties to learn about each other. The more clear and precise information that is
provided, the more credibility the technology developer will gain. Credibility is also related to the
commitments that a technology developer company makes to the community. If a company fails
to fulfill their commitments to the community, the level of credibility will reduce. As the second
element of social license, credibility allows the technology adoption to progress into the approval
level of social license.
Trust: Trust is the key element for gaining social license. The more trust there is in
government institutions and other regulatory organizations, the stronger is social license for
technological development. Trust in government, positive views on science and technology and
also positive media influences may reduce the level of risk perception for GM foods (Curtis et al.,
26
2004). Kikulwe et al. (2011) conducted a consumer survey in Uganda to examine consumers’
attitudes and institutional awareness and trust towards GM regulations. They find that trust in
institutions varies significantly among different consumers. For example, in Uganda,
governmental organizations are the most known and trustworthy whereas the research and
education sector is considered as the least known and trusted among consumers. Thus, trust is a
very important element for establishing social license. The existence of social legitimacy,
credibility and trust can build strong social license for a adoption of a technology.
Figure 2.3 depicts the elements and the various levels of social license and is adapted from
Boutilier and Thomson (2011), where they divided the whole adoption process into four levels and
three elements. Elements are the drivers to reach from one level to another. In the process of
technology adoption, the first level is ‘withdrawn’, where social license does not exist in the
society. The presence of legitimacy leads to the level defined as ‘acceptance’. In the acceptance
level, technology developers try to acquire credibility by communicating and sharing their
knowledge with other local stakeholders. As a result, legitimacy and credibility help to build trust.
Thus, the presence of legitimacy, credibility and trust lead to the ‘approval’ level where local
community ‘grants’ the social license.
The conceptual model of social license in the mining sector (Figure 2.3) may help to
identify the factors that influence social license in the agriculture sector. For example, Boutilier
and Thomson (2011) stated that trust, credibility and legitimacy are important factors for gaining
social license in the mining sector. Ideas from Boutilier and Thomson’s (2011) conceptual model
inform the development of a new conceptual model in this thesis where it is expected that trust and
credibility will also be important factors influencing social license in the agriculture sector. The
new conceptual model of social license aims to identify the factors that influence social license
and who are the most important stakeholders in the process of technology adoption in the
agriculture sector. Before presenting the new conceptual model of social license in the context of
the development and adoption of Bt-brinjal in Bangladesh, a review of literature examining the
factors affecting biotechnology adoption and acceptance is first presented.
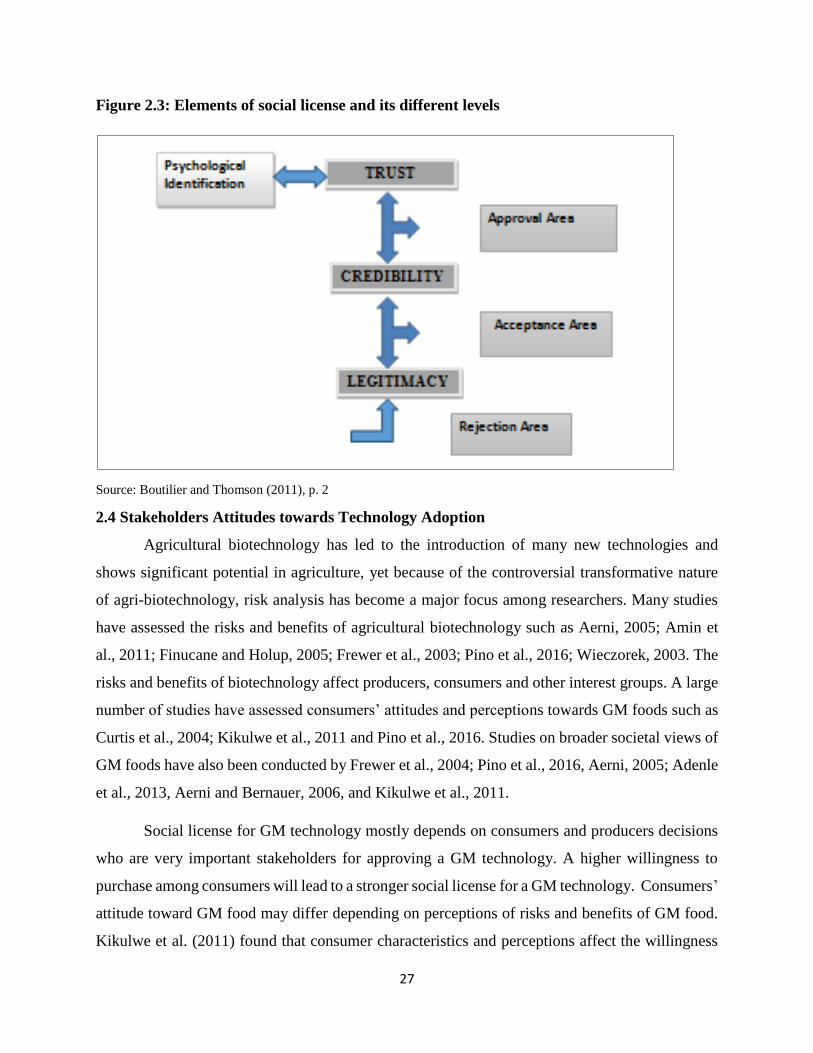
27
Figure 2.3: Elements of social license and its different levels
Source: Boutilier and Thomson (2011), p. 2
2.4 Stakeholders Attitudes towards Technology Adoption
Agricultural biotechnology has led to the introduction of many new technologies and
shows significant potential in agriculture, yet because of the controversial transformative nature
of agri-biotechnology, risk analysis has become a major focus among researchers. Many studies
have assessed the risks and benefits of agricultural biotechnology such as Aerni, 2005; Amin et
al., 2011; Finucane and Holup, 2005; Frewer et al., 2003; Pino et al., 2016; Wieczorek, 2003. The
risks and benefits of biotechnology affect producers, consumers and other interest groups. A large
number of studies have assessed consumers’ attitudes and perceptions towards GM foods such as
Curtis et al., 2004; Kikulwe et al., 2011 and Pino et al., 2016. Studies on broader societal views of
GM foods have also been conducted by Frewer et al., 2004; Pino et al., 2016, Aerni, 2005; Adenle
et al., 2013, Aerni and Bernauer, 2006, and Kikulwe et al., 2011.
Social license for GM technology mostly depends on consumers and producers decisions
who are very important stakeholders for approving a GM technology. A higher willingness to
purchase among consumers will lead to a stronger social license for a GM technology. Consumers’
attitude toward GM food may differ depending on perceptions of risks and benefits of GM food.
Kikulwe et al. (2011) found that consumer characteristics and perceptions affect the willingness
28
to buy GM products. They identified three types of factors in terms of consumers’ attitudes towards
GM technology, including: benefit factors, health factors, food and environmental factors. Benefit
factors encompass the potential benefits of GM food to consumers, while health and environmental
factors encompass perceptions of unknown long-term risks. In a developing country context,
consumers, including so-called sole consumers and adopter consumers, may exhibit different
perceptions of GM products. Adopters are those who produce GM crops for consumption as well
as for selling, while sole consumers are those who only consume and do not produce the product.
Kikulwe et al. (2011) find that sole consumers consider product quality more important, while the
adopter consumers are more inclined to consider the environmental factors.
Pino et al. (2016) conducted a study to examine how a producer’s corporate social
responsibility (CSR) affects consumers’ willingness to purchase GM foods. Producer’s corporate
social responsibility refers to those practices, which demonstrate the social wellbeing. According
to Carroll (1979), CSR encompasses four kinds of responsibilities, including - economic, legal,
ethical and philanthropic responsibilities. Economic responsibility means producers can expect
profit from their business by producing and selling their product. Legal responsibilities means the
companies are expected to follow the requirements executed by legal authorities and ethical
responsibilities are those practices, whereby companies are expected to provide the right
information about their business to society (Pino et al., 2016). A philanthropic responsibility
includes those actions which help producers to share information about their product to local
people. Thus, a producer’s CSR means that producers contribute to solve social problems beyond
their own business profit. Pino et al. (2016) found that a producer’s philanthropic responsibility
has significant effects on consumers’ perceptions towards GM food.
Producers’ perceptions towards a GM product is also a key factor affecting social license
and producers’ willingness to adopt depends on their perceptions of risks and benefits. It is found
that adoption of GM crops is relatively high among commercial and small-scale farmers because
of lower costs of production and higher yielding varieties. Adenle et al. (2013) stated that in South
Africa farmers are willing to pay more to buy GM seed because it provides more yield compared
with conventional varieties. Krishna and Qaim (2007) conducted a study in India using ex ante
analysis of the adoption of Bt-eggplant. They used the contingent valuation method to examine
farmers’ willingness to pay. The most interesting finding of this study was that the average
29
willingness to pay for Bt-brinjal is more than four times the price of conventional brinjal. Kolady
and Lesser (2006) conducted a study in India to examine producers’ willingness to adopt Bt-brinjal
when hybrid brinjal is available in the market. They used a probit model to analyze how hybrid
brinjal growers act differently when Bt-brinjal is introduced in the country.
Stakeholder attitudes toward GM technologies may differ from country to country. Some
stakeholders may have faith in GM technology due to its significant potential problem-solving
features, whereas some may not. Although, stakeholder attitudes may differ from one to another,
there is an interrelationship among all the stakeholders. Biosafety regulation is the first
requirement to start any biotechnology research and development (R&D) in any country and
government is responsible to establish a set of biosafety regulations. Researchers, academia and
private industries (technology developers) who are responsible for the technological development,
play significant roles in the technology adoption process. Therefore, public trust in biosafety
regulation is one of the main dimensions that affects stakeholders’ perceptions towards GM
technologies. For example, Adenle et al. (2013), stated that South Africa is now producing GM
crops successfully with a strong biosafety regulatory framework; whereas Egypt and Tunisia lack
adequate biosafety regulatory frameworks to conduct GM crop field trials.
Stakeholders also worry about the potential risks and benefits of GM foods. Thus, risks
and benefits factors also affect the social license for a technology adoption. Adenle et al. (2013)
stated that the benefit factors have a significant role in the adoption of GM crops. It is found that
commercial and small-scale farmers are more likely to adopt GM crops due to the benefits of
higher yields, insect resistance and herbicide tolerance. Wohlers (2010) conducted a study to
examine how national differences in political culture provide a new dimension in the formation of
policies regarding GM foods in the United States, Canada and EU. He used the Uncertainty
Avoidance Index (developed by Hofstede) to trace differences among national regulatory policies
around GM food. An Uncertainty Avoidance Index shows how risk avoidance attitudes vary across
different countries and regions. This index indicates the ranks and scores by country and regions.
Wohlers (2010) found that the United States and Canada are willing to take risks associated with
GM foods in terms of potential high benefits from GM crops, whereas European countries show a
low uncertainty tolerance attitude.
30
Zilberman et al. (2013) explained the causes of difference between GM policies in the US
and EU. They claimed not only consumers’ perceptions, but other stakeholders’ perceptions are
important in the development process for GM crops. They also identified four reasons for the
difference between GM policies in the US and Europe. First, the leading companies of GM
technology have more influential power in the United States’ political system than the European
political system. Second, GM technology has less direct consumer benefits in Europe because in
the US the major GM crops are corn, soybean and cotton. Global demand for these crops is rising.
Thus, the US farmers showed a significant willingness to produce GM crops. Third, some
environmentalist groups in Europe such as Green parties and Green politicians, have a greater
influence over policy making which helps to block the approval of GM technologies. Fourth, the
trust in government over establishing food safety rules and regulations is higher in the US than in
Europe because some European consumers have relatively more trust in NGOs. All these reasons
make a difference between GM policies in the US and Europe. Thus, it is also necessary to see
how GM policies or adoption of GM crops differs between a developed country and developing
country context.
A few studies also have assessed the position of other stakeholders towards genetically
modified crops. Aerni (2005) and González et al. (2009) found academia, government, producers
and private industries are often the proponents of genetically modified crops, where the non-
governmental organizations (NGOs) and churches are often the opponents.
This literature review reveals that social license for a new technology depends on different
stakeholders’ attitudes and preferences. Consumers, producers, governmental agencies, NGOs and
technology developers including– researchers, academics and private industries are the main
stakeholders in the development of new technology. Stakeholder groups may differ in their
perceptions towards GM technology. Factors that drive social license were also identified from the
literature. A summary of the literature review is presented in Table 2.6 and helps to inform a
conceptual model of social license. A proposed conceptual model of social license is depicted in
Figure 2.4 based on the reviewed literature on social license and on technology adoption in
agriculture.
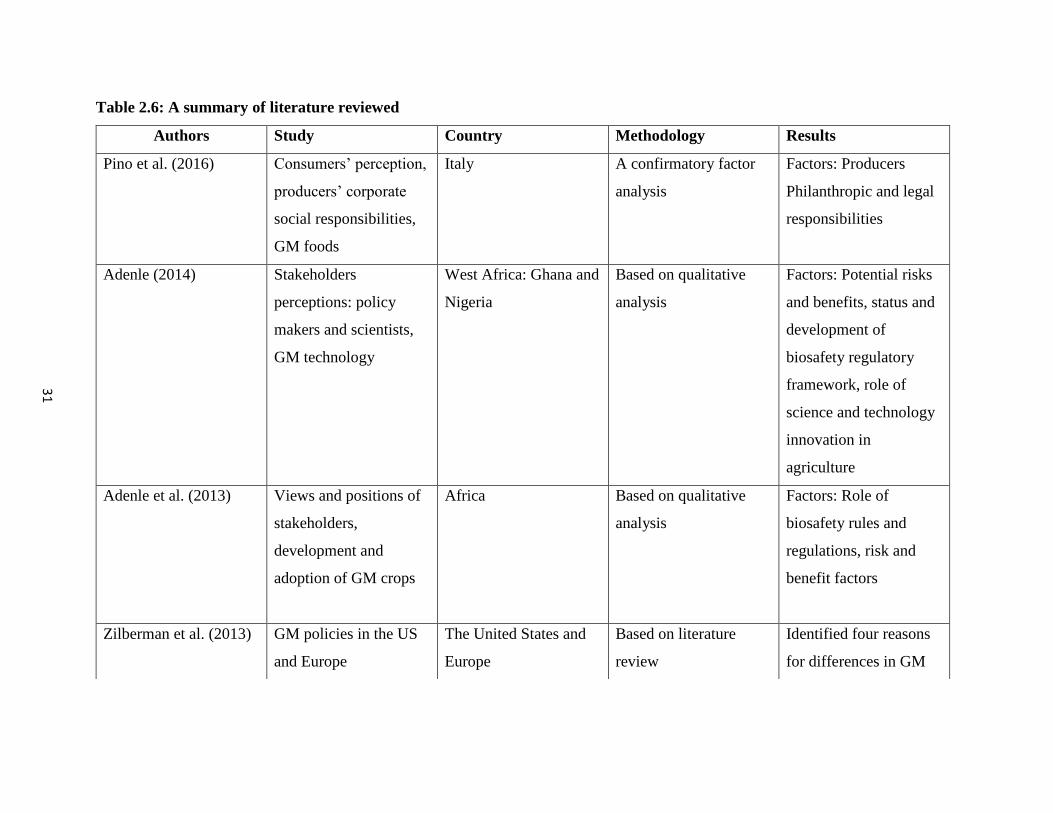
31
Table 2.6: A summary of literature reviewed
Authors Study Country Methodology Results
Pino et al. (2016) Consumers’ perception,
producers’ corporate
social responsibilities,
GM foods
Italy A confirmatory factor
analysis
Factors: Producers
Philanthropic and legal
responsibilities
Adenle (2014) Stakeholders
perceptions: policy
makers and scientists,
GM technology
West Africa: Ghana and
Nigeria
Based on qualitative
analysis
Factors: Potential risks
and benefits, status and
development of
biosafety regulatory
framework, role of
science and technology
innovation in
agriculture
Adenle et al. (2013) Views and positions of
stakeholders,
development and
adoption of GM crops
Africa Based on qualitative
analysis
Factors: Role of
biosafety rules and
regulations, risk and
benefit factors
Zilberman et al. (2013) GM policies in the US
and Europe
The United States and
Europe
Based on literature
review
Identified four reasons
for differences in GM
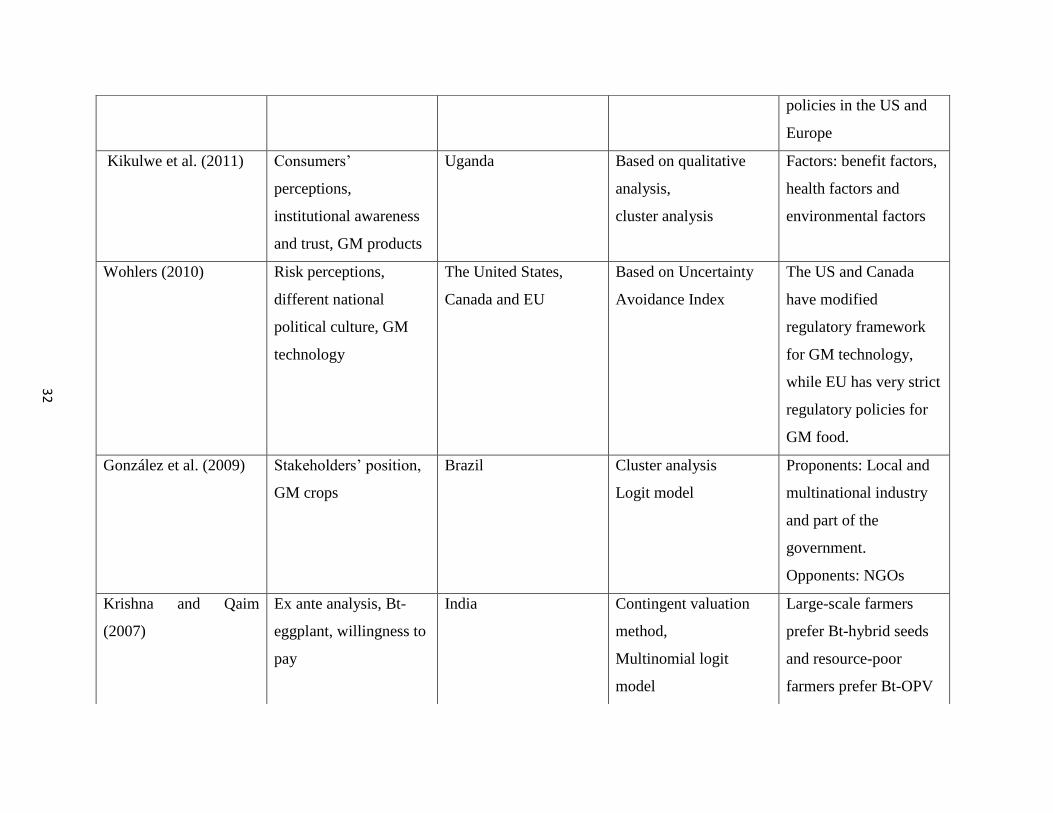
32
policies in the US and
Europe
Kikulwe et al. (2011) Consumers’
perceptions,
institutional awareness
and trust, GM products
Uganda Based on qualitative
analysis,
cluster analysis
Factors: benefit factors,
health factors and
environmental factors
Wohlers (2010) Risk perceptions,
different national
political culture, GM
technology
The United States,
Canada and EU
Based on Uncertainty
Avoidance Index
The US and Canada
have modified
regulatory framework
for GM technology,
while EU has very strict
regulatory policies for
GM food.
González et al. (2009) Stakeholders’ position,
GM crops
Brazil Cluster analysis
Logit model
Proponents: Local and
multinational industry
and part of the
government.
Opponents: NGOs
Krishna and Qaim
(2007)
Ex ante analysis, Bt-
eggplant, willingness to
pay
India Contingent valuation
method,
Multinomial logit
model
Large-scale farmers
prefer Bt-hybrid seeds
and resource-poor
farmers prefer Bt-OPV
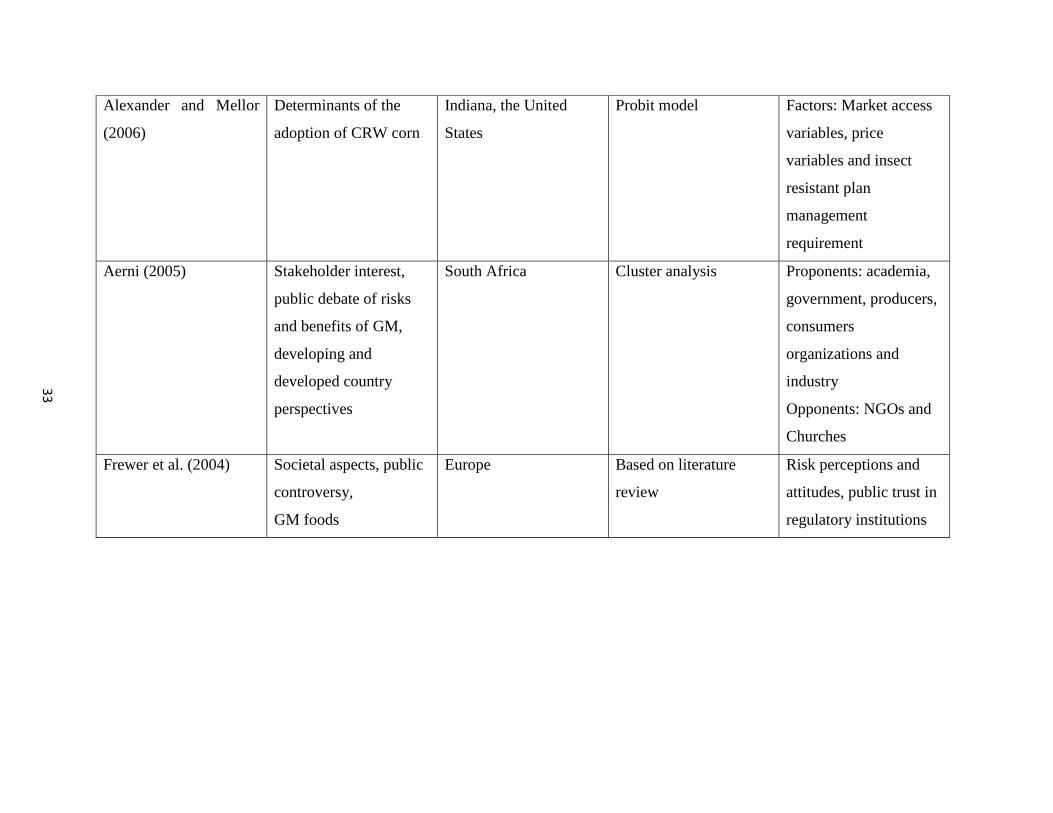
33
Alexander and Mellor
(2006)
Determinants of the
adoption of CRW corn
Indiana, the United
States
Probit model Factors: Market access
variables, price
variables and insect
resistant plan
management
requirement
Aerni (2005) Stakeholder interest,
public debate of risks
and benefits of GM,
developing and
developed country
perspectives
South Africa Cluster analysis Proponents: academia,
government, producers,
consumers
organizations and
industry
Opponents: NGOs and
Churches
Frewer et al. (2004) Societal aspects, public
controversy,
GM foods
Europe Based on literature
review
Risk perceptions and
attitudes, public trust in
regulatory institutions
34
Literature shows that societal views towards genetically modified technology may differ
across different contexts, particularly between developed and developing countries. For example,
Table 2.6 shows that the United States and Canada have the modified regulatory framework for
GM technology adoption, while other countries (developing countries) are more concerned about
the risks and benefits of GM technology. Consumers’ perspectives have more influence in
establishing social license for adopting a technology in a developed country context than a
developing country context. Producers’ attitudes may also differ in different contexts. Also, in a
developed country there tends to be a sharper distinction between producers and consumers, while
in a developing country context the two groups are much closer, or an adopter may be both a
producer and a consumer.
2.5 A Conceptual Model of Social License
A conceptual model is a representation of a system that encompasses all the concepts
together and helps people to understand the system. This study proposes a conceptual model of
social license based on the literature reviewed. The hypothetical conceptual model of social license
is presented in Figure 2.4. The figure proposes that different groups of stakeholders are interrelated
to each other and have a direct or indirect influence on the technology adoption process (social
license). However, it is known that, while developer groups may be the most important
stakeholders for developing a new technology, other stakeholders including consumers, producers,
government and NGOs also have an important influence on social license for a new technology.
In Figure 2.4, straight lines and dotted lines indicate the direct and indirect relationship between
two groups respectively. Factors that are hypothesized to influence social license directly or
indirectly for different stakeholders are shown beneath the relevant stakeholder.
Social license means a local community’s level of acceptance of a new technology. Local
community mostly refers to the consumers and producers who have the major influence to grant
social license, since if producers do not adopt the technology and/or consumers do not purchase
products produced with the technology, there can be no social license. There is no specific
measurement for social license. Therefore, willingness to accept is used to measure the level of
social license. It is assumed that: a) the higher willingness to accept a technology by local
stakeholders, the higher the probability of social license being granted for that technology and b)
35
the lower the willingness to accept a technology by local stakeholders, the lower the probability of
granting social license.
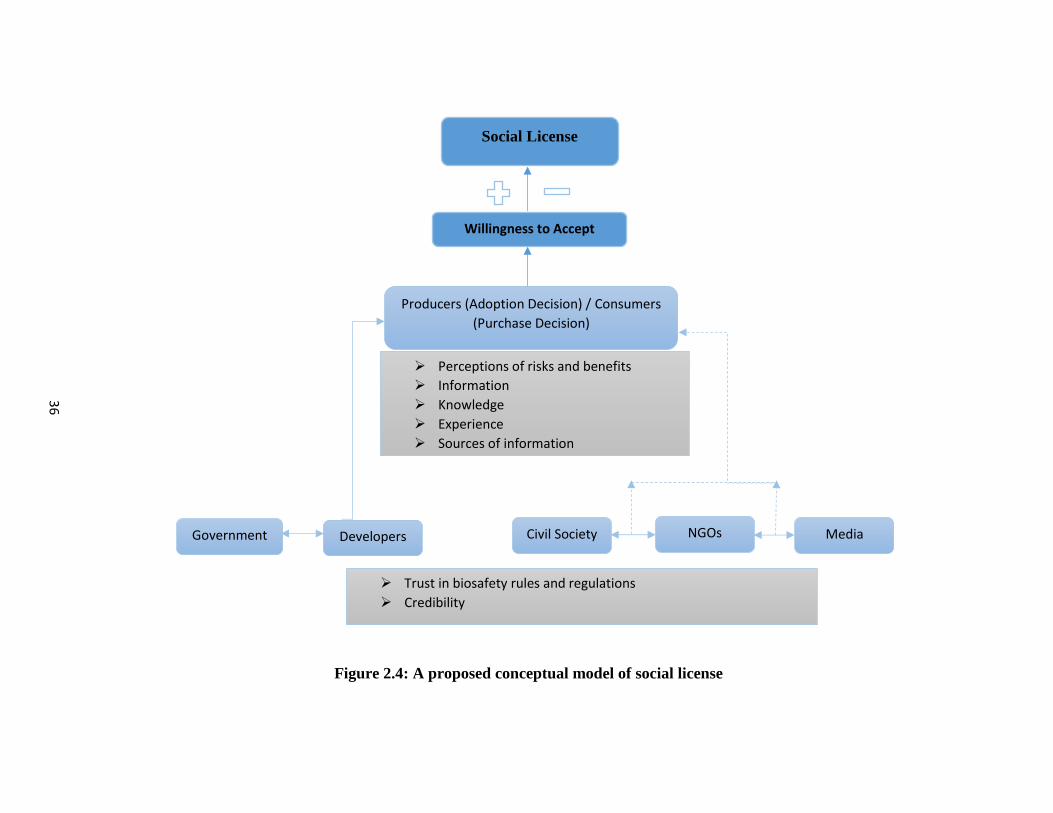
36
Figure 2.4: A proposed conceptual model of social license
➢ Trust in biosafety rules and regulations
➢ Credibility
Social License
Producers (Adoption Decision) / Consumers
(Purchase Decision)
➢ Perceptions of risks and benefits
➢ Information
➢ Knowledge
➢ Experience
➢ Sources of information
Willingness to Accept
Government NGOs Media Civil Society Developers
37
Government is responsible to build biosafety rules and regulations before introducing any
GM products, while technology developers are responsible for developing those technologies.
Communication with other stakeholders by sharing information about biotechnology and its rules
and regulation may help to acquire credibility and trust. The literature review also reveals that trust
and credibility are very important factors that influence social license. Thus, it is assumed that
there is a direct relationship between technology developers and government. Developers also have
a direct connection to producers and consumers (see Figure 2.4). The producers and consumers
are important stakeholders to establish social license for a technology. However, a strong
regulatory framework developed by government may also influence the establishment of social
license. Although not depicted in Figure 2.4, it is also recognized that the regulatory framework
that evolves may itself be influenced by the social license processes.
NGOs, civil society groups and media also may influence social license. These groups are
interrelated to each other and have a direct or indirect connection to each other. In this conceptual
model, it is assumed that these groups may have an indirect connection with consumers and
producers as well. However, these groups typically provide information to consumers as well as
producers. Trust in biosafety rules and regulation and credibility are two main factors that may
influence their perceptions towards a new technology. Consumers and producers preferences may
change over time depending on information availability. Newspapers, TV shows, online
newspapers and the Internet are popular sources of information. Therefore, people are now getting
new information very quickly. As a result when new information is developed, people’s attitudes
and perceptions towards GM technology may change and these groups may influence them.
Figure 2.4 shows that consumers and producers have a direct relationship with social
license, as they are the final users of that technology. The willingness to accept GM products may
also increase the adoption rate of this technology. Thus, the direct line from consumers/producers
groups to a willingness to accept measures the extent of social license (see Figure 2.4). Consumers
and producers’ willingness to accept a GM product depends on their own perceptions of risks and
benefits. Consumers and producers are depicted within one box in Figure 2.4, reflecting the close
relationship between these groups that is often found in a developing country context, particularly
for the consumers who are located in rural areas. However, it is noted their attitudes toward GM
products may differ from each other, particularly in different contexts. Consumers from developed
38
countries may perceive the GM technology differently than those in developing countries.
Developed countries consumers can access information about the GM technology relatively easily,
while this may be the case for urban consumers in developing countries. Thus, accessibility of
information may influence consumers’ attitudes towards GM technology. Therefore, knowledge
of biotechnology, information availability, experience and important sources of information may
influence their willingness to accept GM products.
The proposed conceptual model of social license in the agriculture sector (Figure 2.4)
reveals that consumers and producers are the most important direct stakeholders who initially grant
social license for a new GM commodity. The government, technology developers, NGOs, civil
society groups and media are also significant stakeholders in the process of GM approval. Thus,
these stakeholders are interrelated to each other. Trust in biosafety regulation, credibility,
perceptions of risks and benefits, knowledge of biotechnology are key factors influencing social
license for a new technology.
2.6 Conclusions
The first section of this chapter provides a brief overview of Bt-brinjal in Bangladesh.
Brinjal is the third most important crop in Bangladesh and the FSB insect is the most perilous
insect for brinjal plants. Therefore, farmers in Bangladesh need to use large amounts of chemicals
(pesticides) in their fields. BARI obtained a GM technology from an Indian company (Mahyco)
and developed several new brinjal varieties (Bt-brinjal), which are resistant to the FSB insects.
India, the Philippines and Bangladesh started working on the development of Bt-brinjal in the early
2000s and only Bangladesh got approval for the commercial production of Bt-brinjal in 2013.
Bangladesh is one of the first developing countries to grant regulatory approval of a GM crop. The
first section of this chapter helps to understand the development process of Bt-brinjal in
Bangladesh.
The second section provides a brief discussion of social license. The definition of social
license may differ from a developed and developing country perceptive. Several definitions of
social license are provided in this section in a Canadian agricultural context. In a developed country
context, social license is more about public trust, and often revolves around discussion about
consumers/public “right to know” how food is produced. There is no exact definition of social

39
license found in a developing country context. Thus, this study seeks to determine how social
license can be evaluated in a developing country context.
The third section provides an overview of a selection of literature examining stakeholders’
interest, views and perceptions towards technology adoption (especially genetically modified
crops). Stakeholders are different in nature to each other. Government is responsible to build
biosafety rules and regulations before introducing any biotechnological application. Thus,
developer groups have a direct connection to government. Other stakeholders including
consumers, producers, NGOs, civil society and media also have an influence in the adoption
process of a new technology. This section helps to determine what factors are expected to have an
influence in establishing social license and inform the development of a conceptual model of social
license.
The last section presents a proposed conceptual model of social license. There is no exact
measurement for social license. Thus, willingness to accept is used to indicate how social license
can be evaluated. This conceptual model informs the empirical analysis of social license conducted
in this study.
40
Chapter 3 Survey Design and Descriptive Analysis
3.1 Introduction
The objective of this study is to identify the factors that affect social license in adopting
Bt-brinjal in Bangladesh and who are the key stakeholders in establishing social license for Bt-
brinjal. In chapter 1, a research question was posed: what are the main drivers of social license and
who are the key stakeholders involved in establishing social license for the adoption of Bt-brinjal
in Bangladesh. The research results of a study largely depend on its methodology. This chapter
explains how the surveys conducted for this study were designed with respect to fulfilling the
research objective and presents descriptive statistics for the survey data. This chapter is organized
as follows: a brief discussion of survey design for data collection is provided in section 3.2,
followed by the descriptive analysis of the survey data (section 3.3). Conclusions to the chapter
are provided in section 3.4.
A behavioural ethics application was submitted to the University of Saskatchewan
Behavioural Research Ethics Board (BEH 17-47) on February 7, 2017. An exemption letter was
received from Behavioural Research Ethics Board on February 14, 2017 and is available in
Appendix 1. The behavioural ethics application was exempted because it meets the exemption
status as per Article 2.5 of the Tri-Council Policy Statement (TCPS): Ethical Conduct for Research
Involving Humans, December 2014.4
3.2 Research Methodology
This section explains the survey design, selection of study area and how the data were
collected from the selected areas. It also explains how the data sets were prepared for the final
analysis.
3.2.1 Questionnaire Design
Before designing the surveys for this study, literature on people’s perceptions of and
attitudes towards new agricultural technologies was reviewed. A simple questionnaire was
designed separately for various stakeholders. The literature shows that producers, non-producers,
4 The behavioural ethics application was exempted because it is stated on article 2.5 of the TCPS that “quality
assurance and quality improvement studies, program evaluation activities, and performance reviews, or testing within
normal educational requirements when used exclusively for assessment, management or improvement purposes, do
not constitute research for the purposes of this policy, and do not fall within the scope of REB review.”

41
consumers, developers, other NGOs and civil society groups play a significant role in the
development process of GM crops in agriculture. Thus, three separate questionnaires were
designed to collect data from Bt-brinjal farmers (adopters), non-Bt brinjal farmers (non-adopters)
and consumers. Since other stakeholders also play a key role in the adoption process of Bt-brinjal,
key questions were outlined for interviewing the representatives of relevant institutions
(government, research) and individuals from NGOs or civil society groups. Attention was given
to the general form of the questionnaires to see that all the questions followed a logical and
appropriate sequence.
Bt-brinjal farmers are one of the most important stakeholders in the adoption process. Thus,
this study places more emphasis upon the adopter survey than the other surveys. The adopter
survey questionnaire consists of eight sections. Section A includes a set of questions related to
general farming information about Bt-brinjal. Section B includes a set of questions about farming
and marketing information. Section C includes a set of questions related to Bt-brinjal and non-Bt
brinjal production practices. Section D includes a set of questions related to knowledge of Bt-
brinjal. Section E includes a set of statements about perceptions of and attitudes toward Bt-brinjal.
Section F includes a set of questions related to the relationship with developer groups and
Department of Agricultural Extension (DAE) officials. Section G includes a set of questions
related to willingness to adopt Bt-brinjal and the concluding section H consists of socio-
demographic questions. A copy of the adopter survey is available in Appendix 2. The non-adopter
survey is relatively similar to the adopters’ survey questionnaire, except for questions regarding
Bt-brinjal production, which are excluded from the survey questionnaire since the non-adopters
do not have experience of Bt-brinjal production. The non-adopter survey questionnaire provides a
brief explanation of Bt-brinjal to the respondents to examine the willingness to adopt Bt-brinjal if
Bt-brinjal seeds are available to them. A copy of the non-adopter survey is available in Appendix
3.
The consumer survey questionnaire consists of five sections, where section A includes a
set of questions related to general information about their food shopping, especially brinjal
purchase information. Section B includes a set of questions related to knowledge of Bt-brinjal.
Before approaching section C, a brief explanation of it is also provided to the consumers to
evaluate their willingness to buy Bt-brinjal if Bt-brinjal is available in the local market. Section D
42
includes a set of statements regarding perceptions of and attitudes toward Bt-brinjal and lastly,
section E consists of socio-demographic questions. The consumer survey is available in Appendix
4. All questionnaires have a common section, which includes a set of statements regarding the
perception of and attitudes towards Bt-brinjal on a five-point Likert scale, where 1 represents
strongly disagree and 5 represents strongly agree.
3.2.2 Selection of Study Area
The justification for focusing on Bt-brinjal in Bangladesh is provided in chapter 1. While
Bangladesh has been selected as the study area, it was impractical to cover the whole country.
Therefore, a formal meeting with a principal scientific officer in the department of On-farm
Research Division, Bangladesh Agricultural Research Institute (BARI) was held in March 2017 to
select specific locations for collecting data. As a very new GM crop, there is a lack of technical
know-how about Bt-brinjal in Bangladesh. Research on this crop is still ongoing. Public awareness
is mostly absent or only present to a limited extent. Everyday new knowledge emerges in the field
of biotechnology, but the process of dissemination is very slow in Bangladesh. Thus, people have
limited knowledge about Bt-brinjal. Therefore, the selection of study areas was made considering
specific criteria of those locations. The time available for data collection was finite and was a
factor in the selection of these areas. The selection of study areas was made based on a number of
considerations, including:
i. Bt-brinjal producing areas in Bangladesh.
ii. Availability of information about Bt-brinjal production
iii. The possibility of getting reliable data from the respondents.
iv. Easy accessibility and transportation system
Considering all the above points, 7 districts in Bangladesh were selected to collect data for
this study. The districts are: Mymensingh, Tangail, Sherpur, Bogra, Rangpur, Dinajpur and
Thakurgaon. Figure 3.1 shows a map of Bangladesh indicating the study areas. Table 3.1 shows
the list of participants who were interviewed from each district. The consumer survey was not
limited to a specific location. A consumer survey was done in several marketplaces during the
period of data collection for the adopters and non-adopter surveys. Dhaka is the capital city of
Bangladesh and 4 consumers were interviewed from Dhaka city (see Table 3.1).
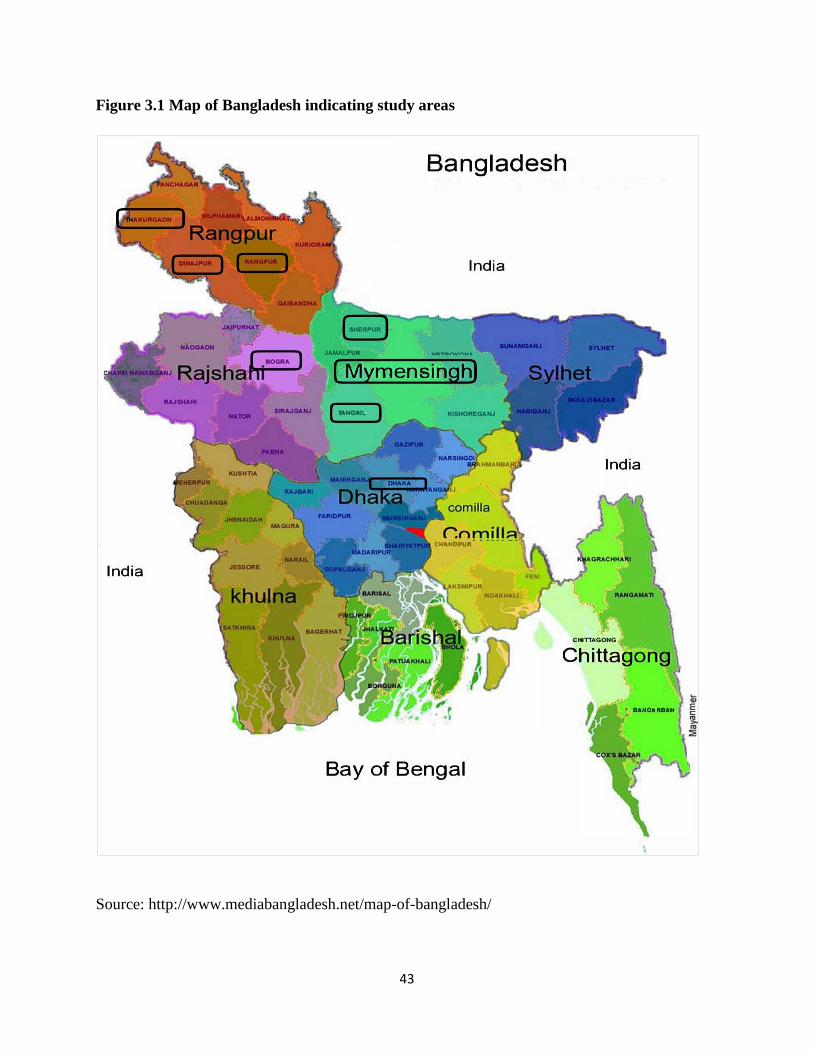
43
Figure 3.1 Map of Bangladesh indicating study areas
Source: http://www.mediabangladesh.net/map-of-bangladesh/
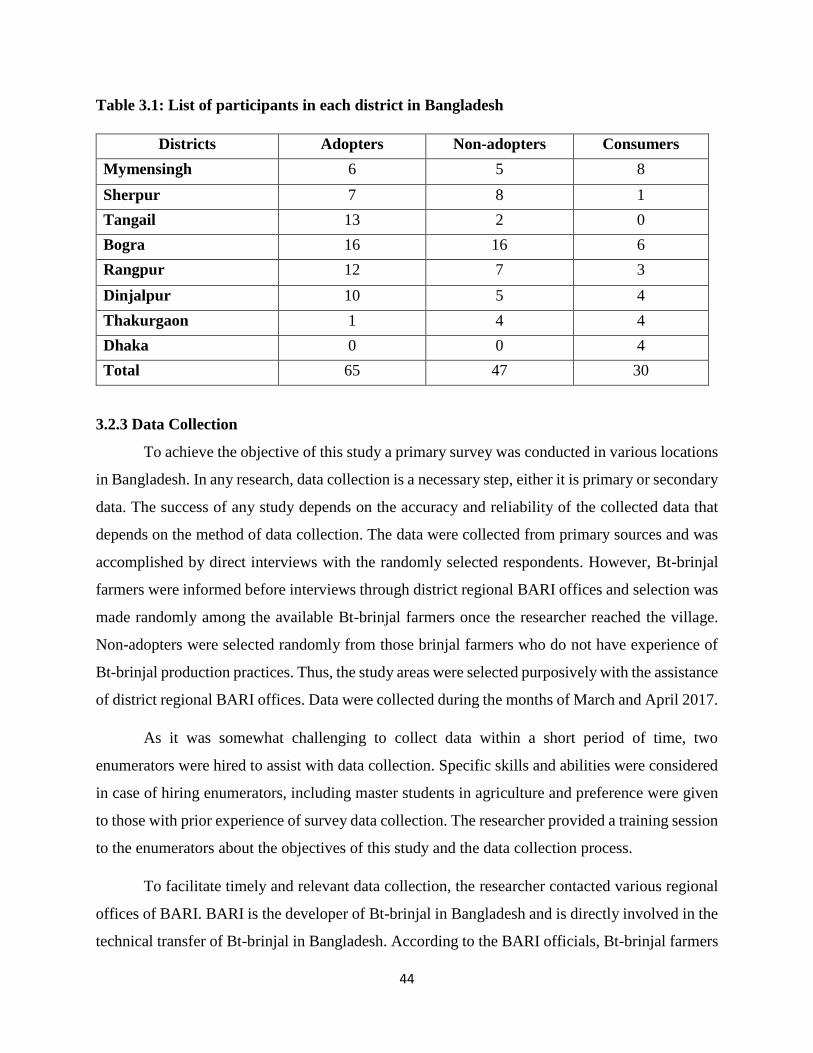
44
Table 3.1: List of participants in each district in Bangladesh
Districts Adopters Non-adopters Consumers
Mymensingh 6 5 8
Sherpur 7 8 1
Tangail 13 2 0
Bogra 16 16 6
Rangpur 12 7 3
Dinjalpur 10 5 4
Thakurgaon 1 4 4
Dhaka 0 0 4
Total 65 47 30
3.2.3 Data Collection
To achieve the objective of this study a primary survey was conducted in various locations
in Bangladesh. In any research, data collection is a necessary step, either it is primary or secondary
data. The success of any study depends on the accuracy and reliability of the collected data that
depends on the method of data collection. The data were collected from primary sources and was
accomplished by direct interviews with the randomly selected respondents. However, Bt-brinjal
farmers were informed before interviews through district regional BARI offices and selection was
made randomly among the available Bt-brinjal farmers once the researcher reached the village.
Non-adopters were selected randomly from those brinjal farmers who do not have experience of
Bt-brinjal production practices. Thus, the study areas were selected purposively with the assistance
of district regional BARI offices. Data were collected during the months of March and April 2017.
As it was somewhat challenging to collect data within a short period of time, two
enumerators were hired to assist with data collection. Specific skills and abilities were considered
in case of hiring enumerators, including master students in agriculture and preference were given
to those with prior experience of survey data collection. The researcher provided a training session
to the enumerators about the objectives of this study and the data collection process.
To facilitate timely and relevant data collection, the researcher contacted various regional
offices of BARI. BARI is the developer of Bt-brinjal in Bangladesh and is directly involved in the
technical transfer of Bt-brinjal in Bangladesh. According to the BARI officials, Bt-brinjal farmers
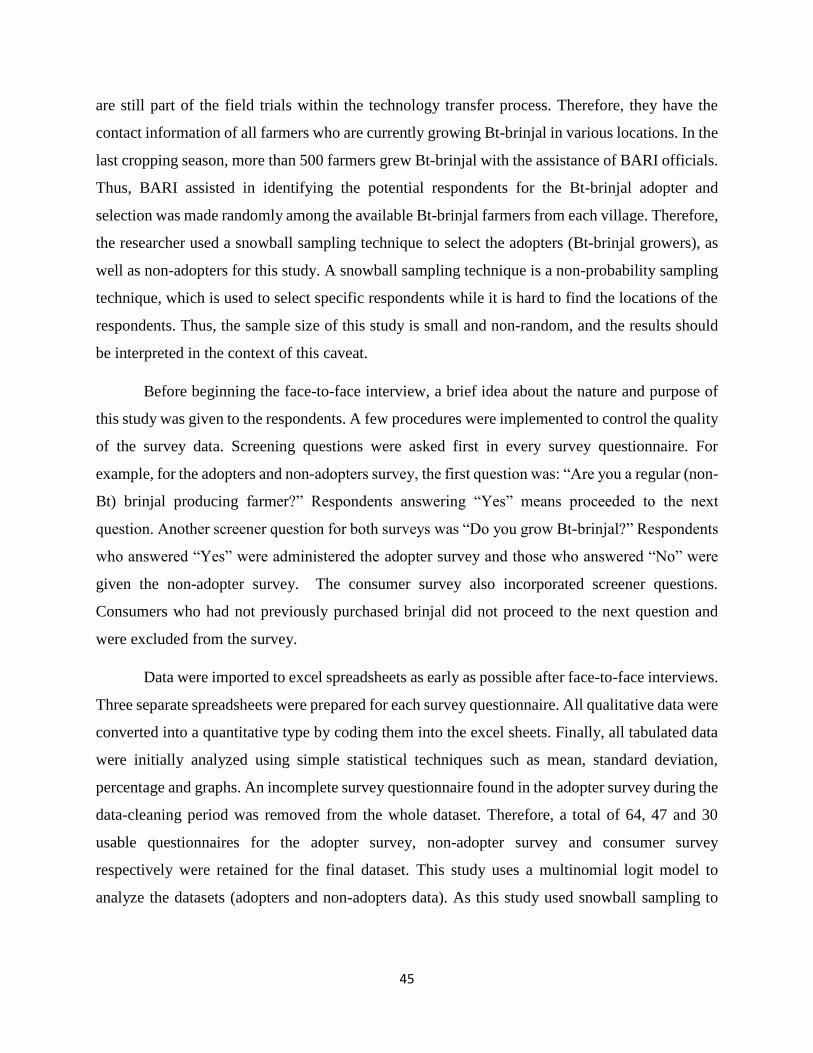
45
are still part of the field trials within the technology transfer process. Therefore, they have the
contact information of all farmers who are currently growing Bt-brinjal in various locations. In the
last cropping season, more than 500 farmers grew Bt-brinjal with the assistance of BARI officials.
Thus, BARI assisted in identifying the potential respondents for the Bt-brinjal adopter and
selection was made randomly among the available Bt-brinjal farmers from each village. Therefore,
the researcher used a snowball sampling technique to select the adopters (Bt-brinjal growers), as
well as non-adopters for this study. A snowball sampling technique is a non-probability sampling
technique, which is used to select specific respondents while it is hard to find the locations of the
respondents. Thus, the sample size of this study is small and non-random, and the results should
be interpreted in the context of this caveat.
Before beginning the face-to-face interview, a brief idea about the nature and purpose of
this study was given to the respondents. A few procedures were implemented to control the quality
of the survey data. Screening questions were asked first in every survey questionnaire. For
example, for the adopters and non-adopters survey, the first question was: “Are you a regular (non-
Bt) brinjal producing farmer?” Respondents answering “Yes” means proceeded to the next
question. Another screener question for both surveys was “Do you grow Bt-brinjal?” Respondents
who answered “Yes” were administered the adopter survey and those who answered “No” were
given the non-adopter survey. The consumer survey also incorporated screener questions.
Consumers who had not previously purchased brinjal did not proceed to the next question and
were excluded from the survey.
Data were imported to excel spreadsheets as early as possible after face-to-face interviews.
Three separate spreadsheets were prepared for each survey questionnaire. All qualitative data were
converted into a quantitative type by coding them into the excel sheets. Finally, all tabulated data
were initially analyzed using simple statistical techniques such as mean, standard deviation,
percentage and graphs. An incomplete survey questionnaire found in the adopter survey during the
data-cleaning period was removed from the whole dataset. Therefore, a total of 64, 47 and 30
usable questionnaires for the adopter survey, non-adopter survey and consumer survey
respectively were retained for the final dataset. This study uses a multinomial logit model to
analyze the datasets (adopters and non-adopters data). As this study used snowball sampling to
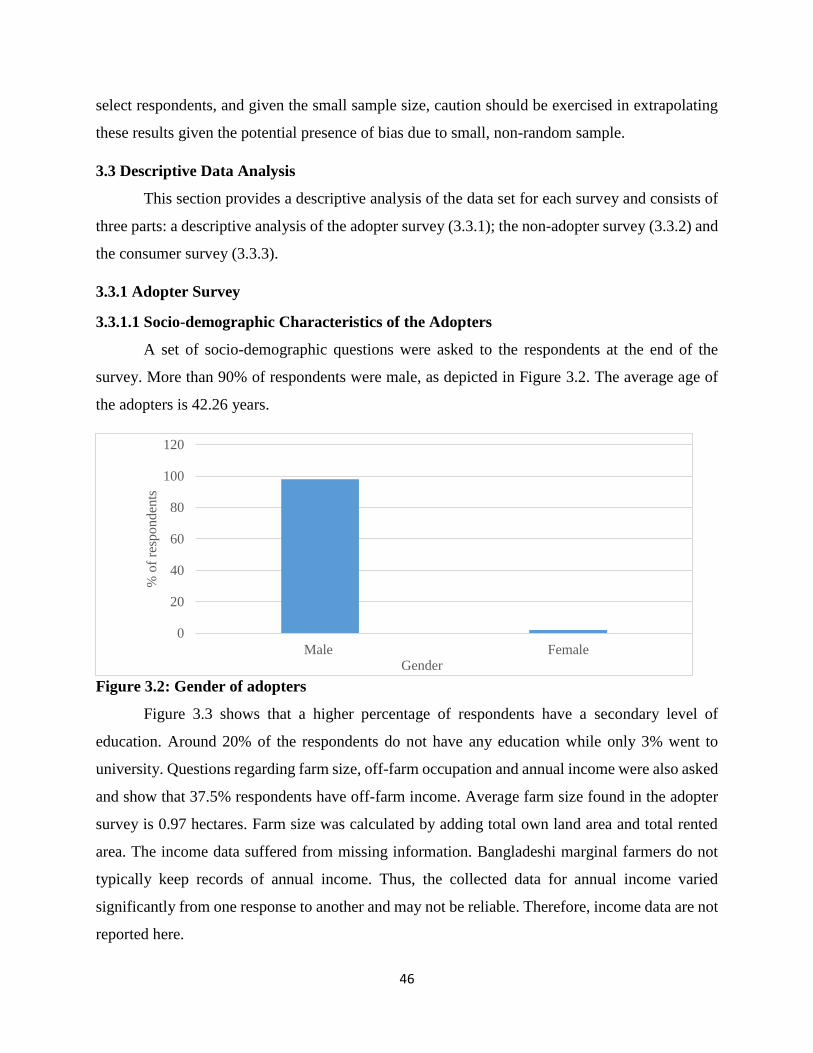
46
select respondents, and given the small sample size, caution should be exercised in extrapolating
these results given the potential presence of bias due to small, non-random sample.
3.3 Descriptive Data Analysis
This section provides a descriptive analysis of the data set for each survey and consists of
three parts: a descriptive analysis of the adopter survey (3.3.1); the non-adopter survey (3.3.2) and
the consumer survey (3.3.3).
3.3.1 Adopter Survey
3.3.1.1 Socio-demographic Characteristics of the Adopters
A set of socio-demographic questions were asked to the respondents at the end of the
survey. More than 90% of respondents were male, as depicted in Figure 3.2. The average age of
the adopters is 42.26 years.
Figure 3.2: Gender of adopters
Figure 3.3 shows that a higher percentage of respondents have a secondary level of
education. Around 20% of the respondents do not have any education while only 3% went to
university. Questions regarding farm size, off-farm occupation and annual income were also asked
and show that 37.5% respondents have off-farm income. Average farm size found in the adopter
survey is 0.97 hectares. Farm size was calculated by adding total own land area and total rented
area. The income data suffered from missing information. Bangladeshi marginal farmers do not
typically keep records of annual income. Thus, the collected data for annual income varied
significantly from one response to another and may not be reliable. Therefore, income data are not
reported here.
0
20
40
60
80
100
120
Male Female
% o
f re
sponden
ts
Gender
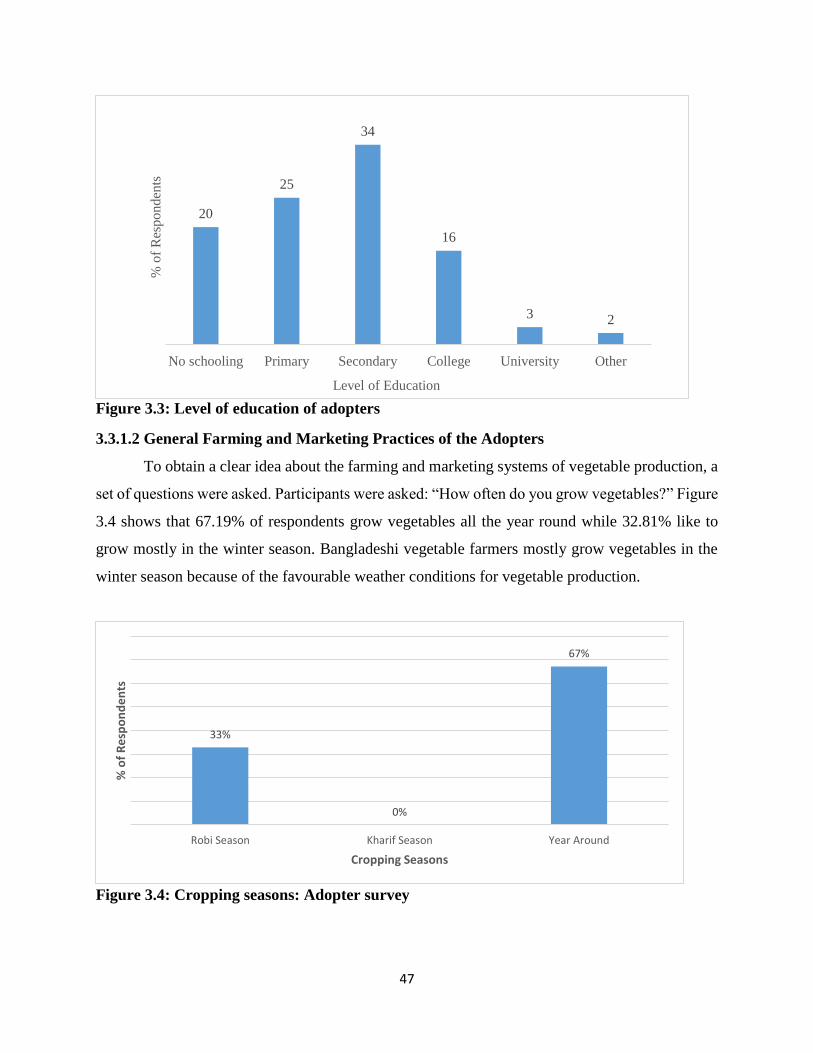
47
Figure 3.3: Level of education of adopters
3.3.1.2 General Farming and Marketing Practices of the Adopters
To obtain a clear idea about the farming and marketing systems of vegetable production, a
set of questions were asked. Participants were asked: “How often do you grow vegetables?” Figure
3.4 shows that 67.19% of respondents grow vegetables all the year round while 32.81% like to
grow mostly in the winter season. Bangladeshi vegetable farmers mostly grow vegetables in the
winter season because of the favourable weather conditions for vegetable production.
Figure 3.4: Cropping seasons: Adopter survey
20
25
34
16
3 2
No schooling Primary Secondary College University Other
% o
f R
esp
on
den
ts
Level of Education
33%
0%
67%
Robi Season Kharif Season Year Around
% o
f R
esp
on
de
nts
Cropping Seasons
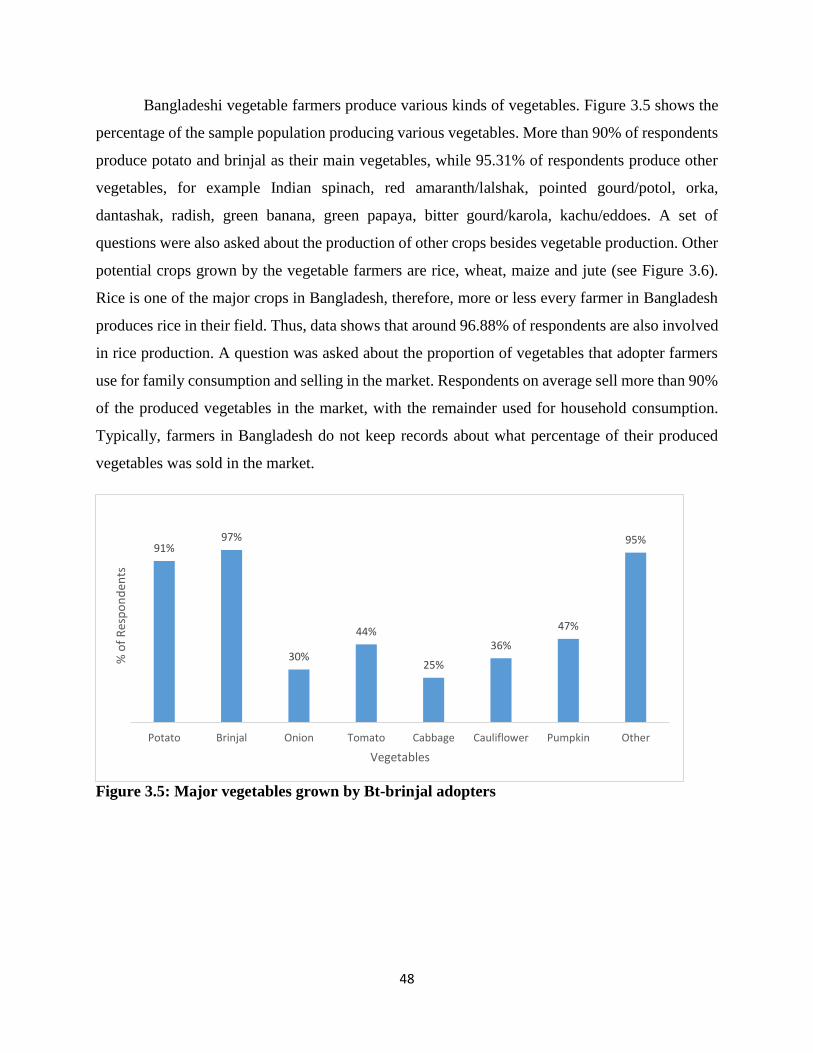
48
Bangladeshi vegetable farmers produce various kinds of vegetables. Figure 3.5 shows the
percentage of the sample population producing various vegetables. More than 90% of respondents
produce potato and brinjal as their main vegetables, while 95.31% of respondents produce other
vegetables, for example Indian spinach, red amaranth/lalshak, pointed gourd/potol, orka,
dantashak, radish, green banana, green papaya, bitter gourd/karola, kachu/eddoes. A set of
questions were also asked about the production of other crops besides vegetable production. Other
potential crops grown by the vegetable farmers are rice, wheat, maize and jute (see Figure 3.6).
Rice is one of the major crops in Bangladesh, therefore, more or less every farmer in Bangladesh
produces rice in their field. Thus, data shows that around 96.88% of respondents are also involved
in rice production. A question was asked about the proportion of vegetables that adopter farmers
use for family consumption and selling in the market. Respondents on average sell more than 90%
of the produced vegetables in the market, with the remainder used for household consumption.
Typically, farmers in Bangladesh do not keep records about what percentage of their produced
vegetables was sold in the market.
Figure 3.5: Major vegetables grown by Bt-brinjal adopters
91%97%
30%
44%
25%
36%
47%
95%
Potato Brinjal Onion Tomato Cabbage Cauliflower Pumpkin Other
% o
f R
esp
on
den
ts
Vegetables

49
Figure 3.6: Other crops grown by Bt-brinjal adopters besides vegetable production
Bangladeshi farmers use various varieties of seeds for vegetable production. Figure 3.7
shows that 15.63% of respondents are solely dependent on hybrid varieties while 81.25% of
respondents rely on both hybrid and open pollinated varieties of seeds. However, more than 80%
of farmers mentioned that they use both varieties of vegetable seeds. The farmers who use both
varieties of vegetable seeds also indicated that the percentage of using hybrid seeds is higher than
OPV seeds.
Figure 3.7: Use of hybrid and open-pollinated varieties: Adopter survey
Questions on sources of vegetable seeds were also asked to the respondents. The answer
was categorized into various sources. Figure 3.8 shows that a higher percentage of the sample
15.63%
3.13%
81.25%
Hybrids OPV Both
% o
f R
esp
on
den
ts
Seed Varieties
97%
28% 25%
45%
0%
20%
40%
60%
80%
100%
120%
Rice Wheat Maize Jute
% o
f R
esp
on
den
ts
Other crops
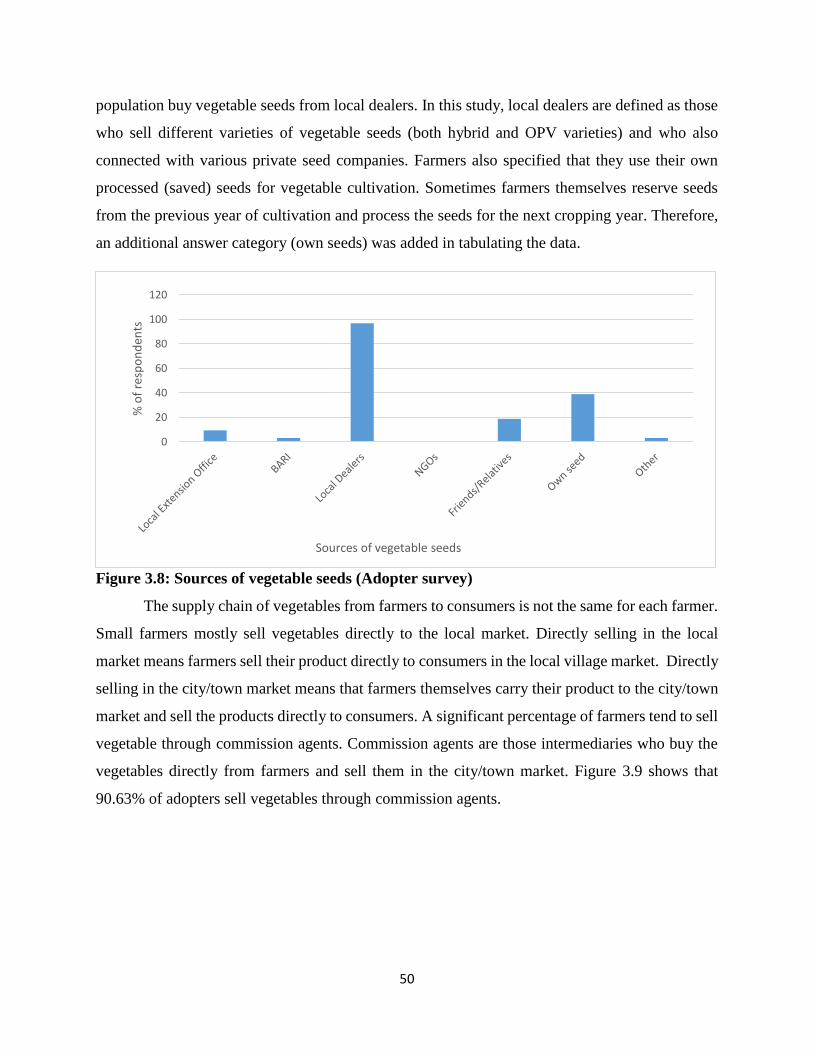
50
population buy vegetable seeds from local dealers. In this study, local dealers are defined as those
who sell different varieties of vegetable seeds (both hybrid and OPV varieties) and who also
connected with various private seed companies. Farmers also specified that they use their own
processed (saved) seeds for vegetable cultivation. Sometimes farmers themselves reserve seeds
from the previous year of cultivation and process the seeds for the next cropping year. Therefore,
an additional answer category (own seeds) was added in tabulating the data.
Figure 3.8: Sources of vegetable seeds (Adopter survey)
The supply chain of vegetables from farmers to consumers is not the same for each farmer.
Small farmers mostly sell vegetables directly to the local market. Directly selling in the local
market means farmers sell their product directly to consumers in the local village market. Directly
selling in the city/town market means that farmers themselves carry their product to the city/town
market and sell the products directly to consumers. A significant percentage of farmers tend to sell
vegetable through commission agents. Commission agents are those intermediaries who buy the
vegetables directly from farmers and sell them in the city/town market. Figure 3.9 shows that
90.63% of adopters sell vegetables through commission agents.
0
20
40
60
80
100
120
% o
f re
spo
nd
ents
Sources of vegetable seeds
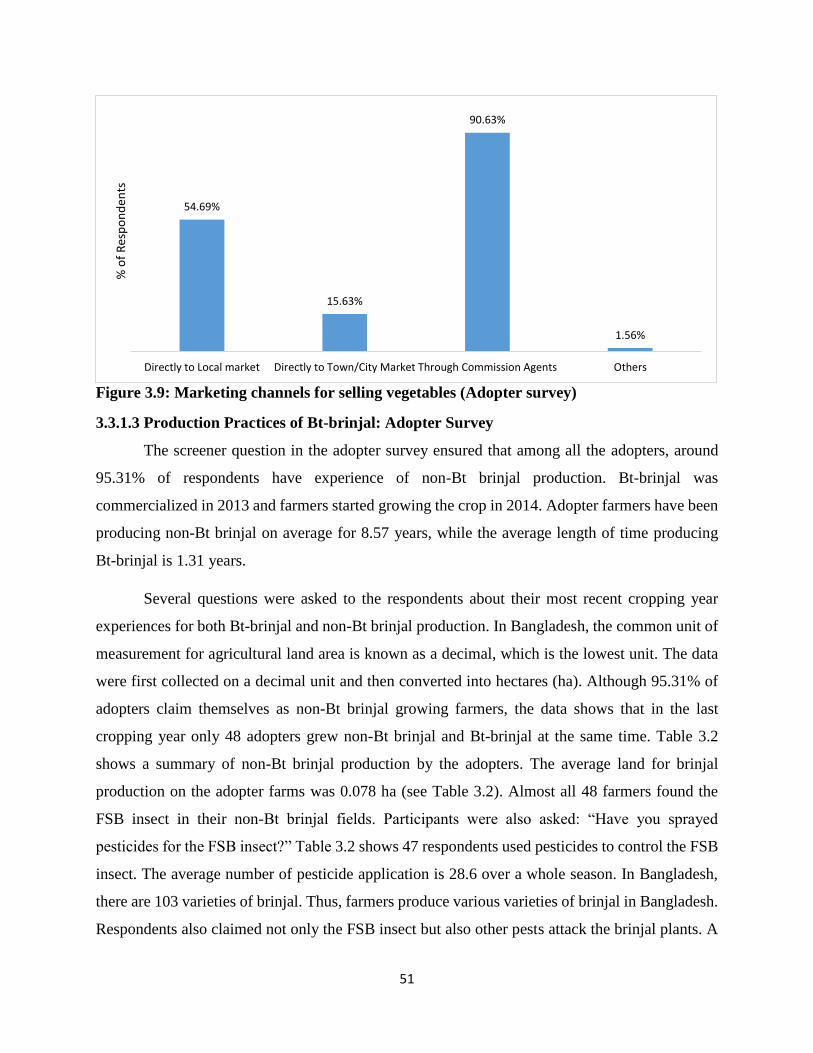
51
Figure 3.9: Marketing channels for selling vegetables (Adopter survey)
3.3.1.3 Production Practices of Bt-brinjal: Adopter Survey
The screener question in the adopter survey ensured that among all the adopters, around
95.31% of respondents have experience of non-Bt brinjal production. Bt-brinjal was
commercialized in 2013 and farmers started growing the crop in 2014. Adopter farmers have been
producing non-Bt brinjal on average for 8.57 years, while the average length of time producing
Bt-brinjal is 1.31 years.
Several questions were asked to the respondents about their most recent cropping year
experiences for both Bt-brinjal and non-Bt brinjal production. In Bangladesh, the common unit of
measurement for agricultural land area is known as a decimal, which is the lowest unit. The data
were first collected on a decimal unit and then converted into hectares (ha). Although 95.31% of
adopters claim themselves as non-Bt brinjal growing farmers, the data shows that in the last
cropping year only 48 adopters grew non-Bt brinjal and Bt-brinjal at the same time. Table 3.2
shows a summary of non-Bt brinjal production by the adopters. The average land for brinjal
production on the adopter farms was 0.078 ha (see Table 3.2). Almost all 48 farmers found the
FSB insect in their non-Bt brinjal fields. Participants were also asked: “Have you sprayed
pesticides for the FSB insect?” Table 3.2 shows 47 respondents used pesticides to control the FSB
insect. The average number of pesticide application is 28.6 over a whole season. In Bangladesh,
there are 103 varieties of brinjal. Thus, farmers produce various varieties of brinjal in Bangladesh.
Respondents also claimed not only the FSB insect but also other pests attack the brinjal plants. A
54.69%
15.63%
90.63%
1.56%
Directly to Local market Directly to Town/City Market Through Commission Agents Others
% o
f R
esp
on
den
ts
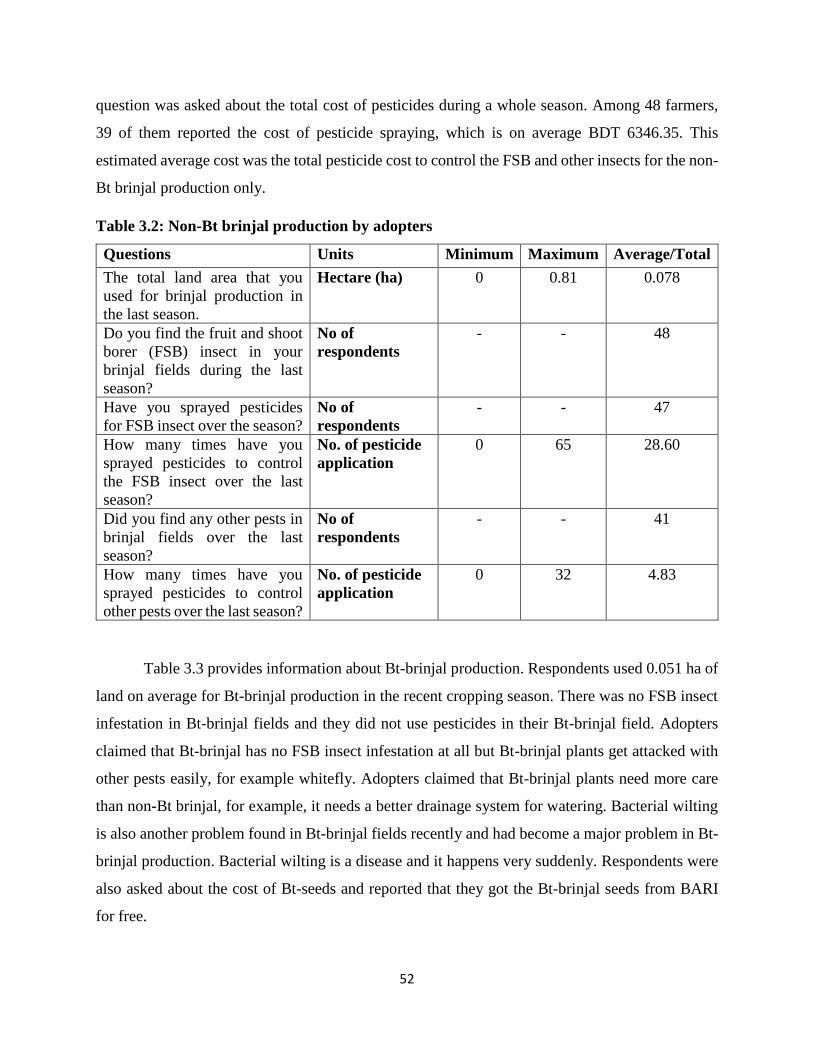
52
question was asked about the total cost of pesticides during a whole season. Among 48 farmers,
39 of them reported the cost of pesticide spraying, which is on average BDT 6346.35. This
estimated average cost was the total pesticide cost to control the FSB and other insects for the non-
Bt brinjal production only.
Table 3.2: Non-Bt brinjal production by adopters
Questions Units Minimum Maximum Average/Total
The total land area that you
used for brinjal production in
the last season.
Hectare (ha) 0 0.81 0.078
Do you find the fruit and shoot
borer (FSB) insect in your
brinjal fields during the last
season?
No of
respondents
- - 48
Have you sprayed pesticides
for FSB insect over the season?
No of
respondents
- - 47
How many times have you
sprayed pesticides to control
the FSB insect over the last
season?
No. of pesticide
application
0 65 28.60
Did you find any other pests in
brinjal fields over the last
season?
No of
respondents
- - 41
How many times have you
sprayed pesticides to control
other pests over the last season?
No. of pesticide
application
0 32 4.83
Table 3.3 provides information about Bt-brinjal production. Respondents used 0.051 ha of
land on average for Bt-brinjal production in the recent cropping season. There was no FSB insect
infestation in Bt-brinjal fields and they did not use pesticides in their Bt-brinjal field. Adopters
claimed that Bt-brinjal has no FSB insect infestation at all but Bt-brinjal plants get attacked with
other pests easily, for example whitefly. Adopters claimed that Bt-brinjal plants need more care
than non-Bt brinjal, for example, it needs a better drainage system for watering. Bacterial wilting
is also another problem found in Bt-brinjal fields recently and had become a major problem in Bt-
brinjal production. Bacterial wilting is a disease and it happens very suddenly. Respondents were
also asked about the cost of Bt-seeds and reported that they got the Bt-brinjal seeds from BARI
for free.
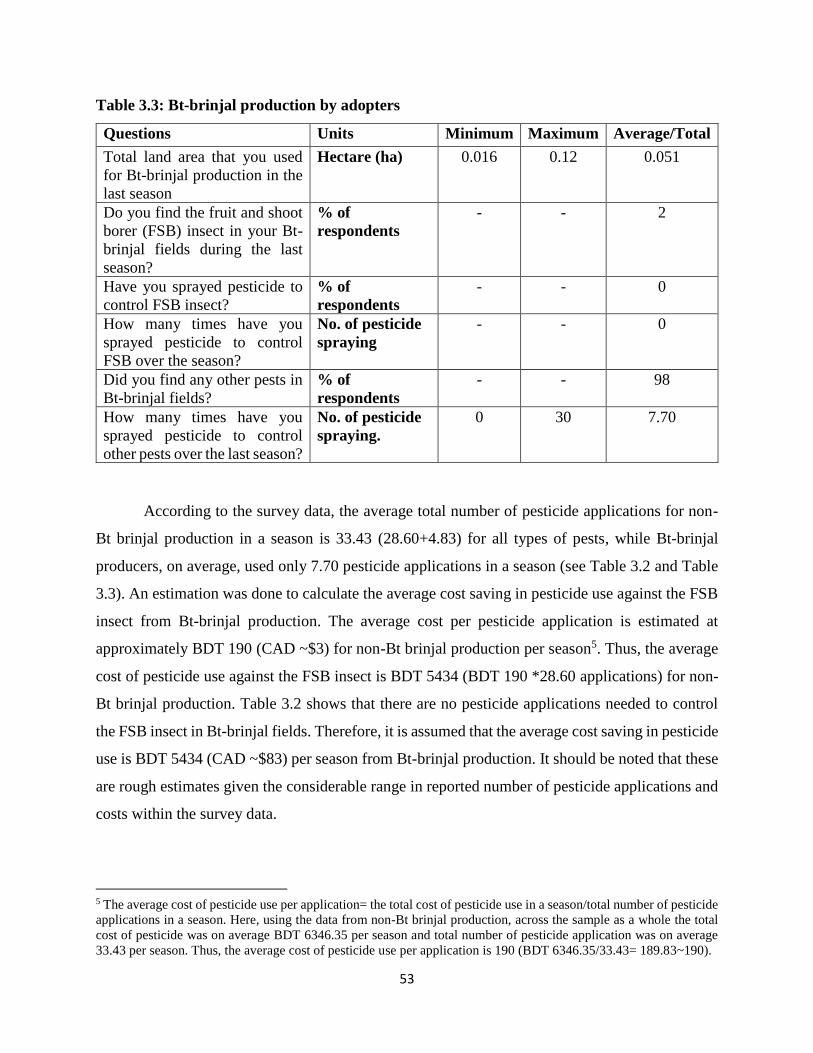
53
Table 3.3: Bt-brinjal production by adopters
According to the survey data, the average total number of pesticide applications for non-
Bt brinjal production in a season is 33.43 (28.60+4.83) for all types of pests, while Bt-brinjal
producers, on average, used only 7.70 pesticide applications in a season (see Table 3.2 and Table
3.3). An estimation was done to calculate the average cost saving in pesticide use against the FSB
insect from Bt-brinjal production. The average cost per pesticide application is estimated at
approximately BDT 190 (CAD ~$3) for non-Bt brinjal production per season5. Thus, the average
cost of pesticide use against the FSB insect is BDT 5434 (BDT 190 *28.60 applications) for non-
Bt brinjal production. Table 3.2 shows that there are no pesticide applications needed to control
the FSB insect in Bt-brinjal fields. Therefore, it is assumed that the average cost saving in pesticide
use is BDT 5434 (CAD ~$83) per season from Bt-brinjal production. It should be noted that these
are rough estimates given the considerable range in reported number of pesticide applications and
costs within the survey data.
5 The average cost of pesticide use per application= the total cost of pesticide use in a season/total number of pesticide
applications in a season. Here, using the data from non-Bt brinjal production, across the sample as a whole the total
cost of pesticide was on average BDT 6346.35 per season and total number of pesticide application was on average
33.43 per season. Thus, the average cost of pesticide use per application is 190 (BDT 6346.35/33.43= 189.83~190).
Questions Units Minimum Maximum Average/Total
Total land area that you used
for Bt-brinjal production in the
last season
Hectare (ha) 0.016 0.12 0.051
Do you find the fruit and shoot
borer (FSB) insect in your Bt-
brinjal fields during the last
season?
% of
respondents
- - 2
Have you sprayed pesticide to
control FSB insect?
% of
respondents
- - 0
How many times have you
sprayed pesticide to control
FSB over the season?
No. of pesticide
spraying
- - 0
Did you find any other pests in
Bt-brinjal fields?
% of
respondents
- - 98
How many times have you
sprayed pesticide to control
other pests over the last season?
No. of pesticide
spraying.
0 30 7.70

54
3.3.1.4 Sources of Information about Bt-brinjal (Adopter Survey)
A question was first asked to the respondents about the sources of information for new crop
varieties in general. Figure 3.10 shows that 73.44% of respondents get information from BARI
about new crop varieties. A high percentage of respondents get knowledge about new crop
varieties from BARI because they have regular contact with BARI as Bt-brinjal growers.
Therefore, they are more likely to get information about new technology from BARI than other
sources. Other sources also have importance to provide information about new crops, particularly
local dealers and extension services.
Figure 3.10: Information sources about new crop varieties (Adopter survey)
A question was also asked to respondents about their sources of information for Bt-brinjal.
The data shows that the primary source of information about Bt-brinjal is BARI, where very few
respondents first heard about Bt-brinjal from their neighbour farmers/relatives (see Table 3.4).
Respondents were also asked: “From where you normally get Bt-brinjal seeds?” Potential
responses were Local Extension office, Bangladesh Agricultural Research Institute (BARI), local
dealers, NGOs, friends/relatives and others. BARI is the developer of Bt-brinjal in Bangladesh and
they are providing all of the necessary inputs to the adopters for its production. Therefore, adopters
primarily get Bt-brinjal seeds from BARI offices while very few of them also get Bt-brinjal seeds
from local extension offices (3%) and their friends/relatives (9%) (See Figure 3.11). Figure 3.11
excludes local dealers and NGOs because the percentage of respondents was zero for these
categories.
47%
73%
56%
38%
Local Extension Office BARI Local Dealers Friends/Relatives
% o
f R
esp
on
den
ts
Information Sources for new Crop Varieties
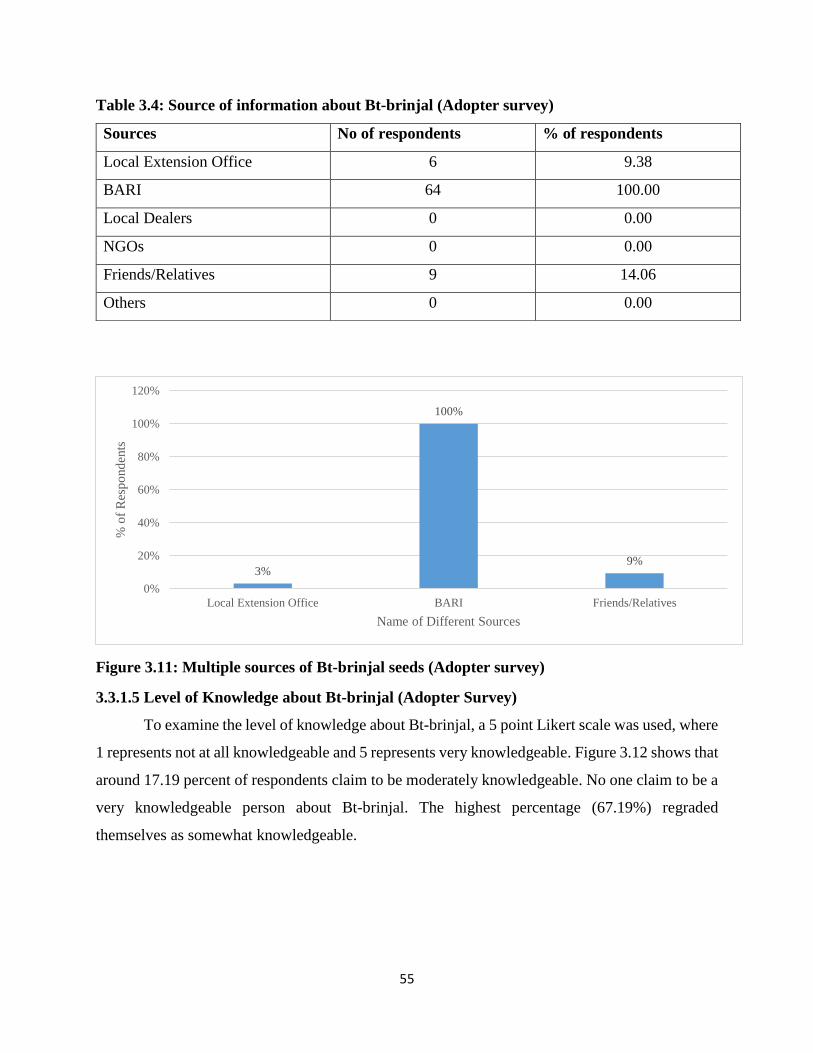
55
Table 3.4: Source of information about Bt-brinjal (Adopter survey)
Figure 3.11: Multiple sources of Bt-brinjal seeds (Adopter survey)
3.3.1.5 Level of Knowledge about Bt-brinjal (Adopter Survey)
To examine the level of knowledge about Bt-brinjal, a 5 point Likert scale was used, where
1 represents not at all knowledgeable and 5 represents very knowledgeable. Figure 3.12 shows that
around 17.19 percent of respondents claim to be moderately knowledgeable. No one claim to be a
very knowledgeable person about Bt-brinjal. The highest percentage (67.19%) regraded
themselves as somewhat knowledgeable.
3%
100%
9%
0%
20%
40%
60%
80%
100%
120%
Local Extension Office BARI Friends/Relatives
% o
f R
esp
ond
ents
Name of Different Sources
Sources No of respondents % of respondents
Local Extension Office 6 9.38
BARI 64 100.00
Local Dealers 0 0.00
NGOs 0 0.00
Friends/Relatives 9 14.06
Others 0 0.00
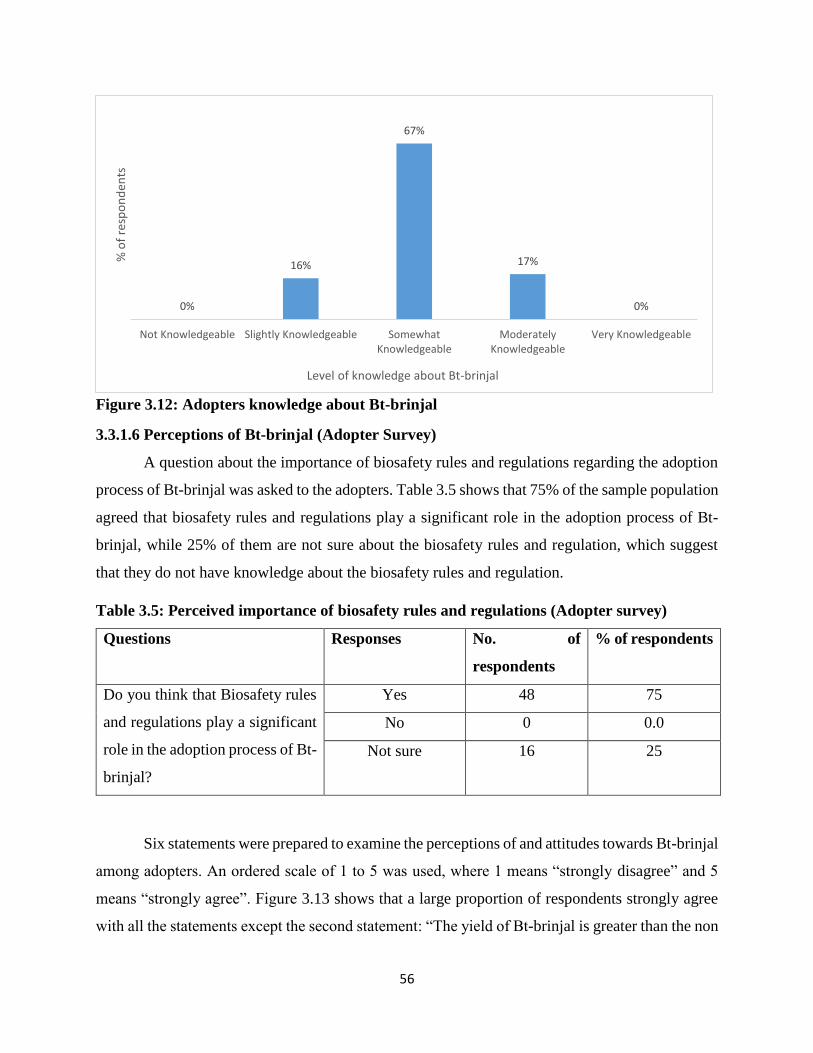
56
Figure 3.12: Adopters knowledge about Bt-brinjal
3.3.1.6 Perceptions of Bt-brinjal (Adopter Survey)
A question about the importance of biosafety rules and regulations regarding the adoption
process of Bt-brinjal was asked to the adopters. Table 3.5 shows that 75% of the sample population
agreed that biosafety rules and regulations play a significant role in the adoption process of Bt-
brinjal, while 25% of them are not sure about the biosafety rules and regulation, which suggest
that they do not have knowledge about the biosafety rules and regulation.
Table 3.5: Perceived importance of biosafety rules and regulations (Adopter survey)
Questions Responses No. of
respondents
% of respondents
Do you think that Biosafety rules
and regulations play a significant
role in the adoption process of Bt-
brinjal?
Yes 48 75
No 0 0.0
Not sure 16 25
Six statements were prepared to examine the perceptions of and attitudes towards Bt-brinjal
among adopters. An ordered scale of 1 to 5 was used, where 1 means “strongly disagree” and 5
means “strongly agree”. Figure 3.13 shows that a large proportion of respondents strongly agree
with all the statements except the second statement: “The yield of Bt-brinjal is greater than the non
0%
16%
67%
17%
0%
Not Knowledgeable Slightly Knowledgeable SomewhatKnowledgeable
ModeratelyKnowledgeable
Very Knowledgeable
% o
f re
spo
nd
ents
Level of knowledge about Bt-brinjal
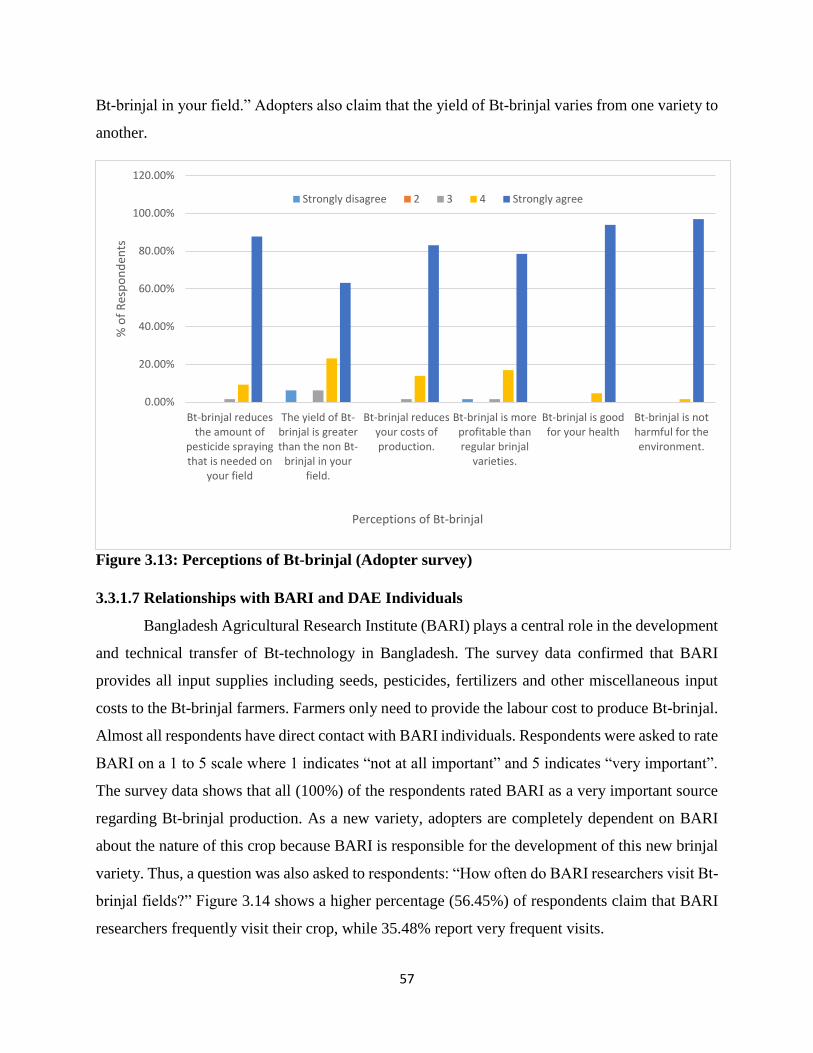
57
Bt-brinjal in your field.” Adopters also claim that the yield of Bt-brinjal varies from one variety to
another.
Figure 3.13: Perceptions of Bt-brinjal (Adopter survey)
3.3.1.7 Relationships with BARI and DAE Individuals
Bangladesh Agricultural Research Institute (BARI) plays a central role in the development
and technical transfer of Bt-technology in Bangladesh. The survey data confirmed that BARI
provides all input supplies including seeds, pesticides, fertilizers and other miscellaneous input
costs to the Bt-brinjal farmers. Farmers only need to provide the labour cost to produce Bt-brinjal.
Almost all respondents have direct contact with BARI individuals. Respondents were asked to rate
BARI on a 1 to 5 scale where 1 indicates “not at all important” and 5 indicates “very important”.
The survey data shows that all (100%) of the respondents rated BARI as a very important source
regarding Bt-brinjal production. As a new variety, adopters are completely dependent on BARI
about the nature of this crop because BARI is responsible for the development of this new brinjal
variety. Thus, a question was also asked to respondents: “How often do BARI researchers visit Bt-
brinjal fields?” Figure 3.14 shows a higher percentage (56.45%) of respondents claim that BARI
researchers frequently visit their crop, while 35.48% report very frequent visits.
0.00%
20.00%
40.00%
60.00%
80.00%
100.00%
120.00%
Bt-brinjal reducesthe amount of
pesticide sprayingthat is needed on
your field
The yield of Bt-brinjal is greaterthan the non Bt-
brinjal in yourfield.
Bt-brinjal reducesyour costs ofproduction.
Bt-brinjal is moreprofitable thanregular brinjal
varieties.
Bt-brinjal is goodfor your health
Bt-brinjal is notharmful for theenvironment.
% o
f R
esp
on
den
ts
Perceptions of Bt-brinjal
Strongly disagree 2 3 4 Strongly agree
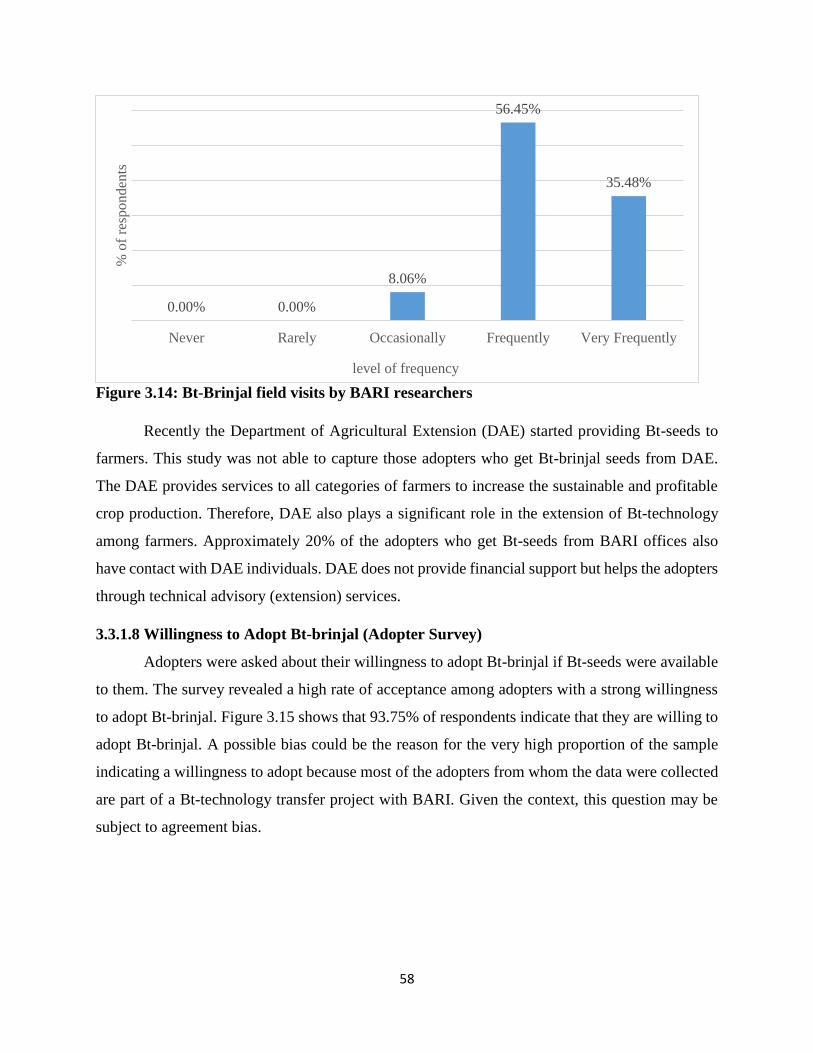
58
Figure 3.14: Bt-Brinjal field visits by BARI researchers
Recently the Department of Agricultural Extension (DAE) started providing Bt-seeds to
farmers. This study was not able to capture those adopters who get Bt-brinjal seeds from DAE.
The DAE provides services to all categories of farmers to increase the sustainable and profitable
crop production. Therefore, DAE also plays a significant role in the extension of Bt-technology
among farmers. Approximately 20% of the adopters who get Bt-seeds from BARI offices also
have contact with DAE individuals. DAE does not provide financial support but helps the adopters
through technical advisory (extension) services.
3.3.1.8 Willingness to Adopt Bt-brinjal (Adopter Survey)
Adopters were asked about their willingness to adopt Bt-brinjal if Bt-seeds were available
to them. The survey revealed a high rate of acceptance among adopters with a strong willingness
to adopt Bt-brinjal. Figure 3.15 shows that 93.75% of respondents indicate that they are willing to
adopt Bt-brinjal. A possible bias could be the reason for the very high proportion of the sample
indicating a willingness to adopt because most of the adopters from whom the data were collected
are part of a Bt-technology transfer project with BARI. Given the context, this question may be
subject to agreement bias.
0.00% 0.00%
8.06%
56.45%
35.48%
Never Rarely Occasionally Frequently Very Frequently
% o
f re
spo
nd
ents
level of frequency
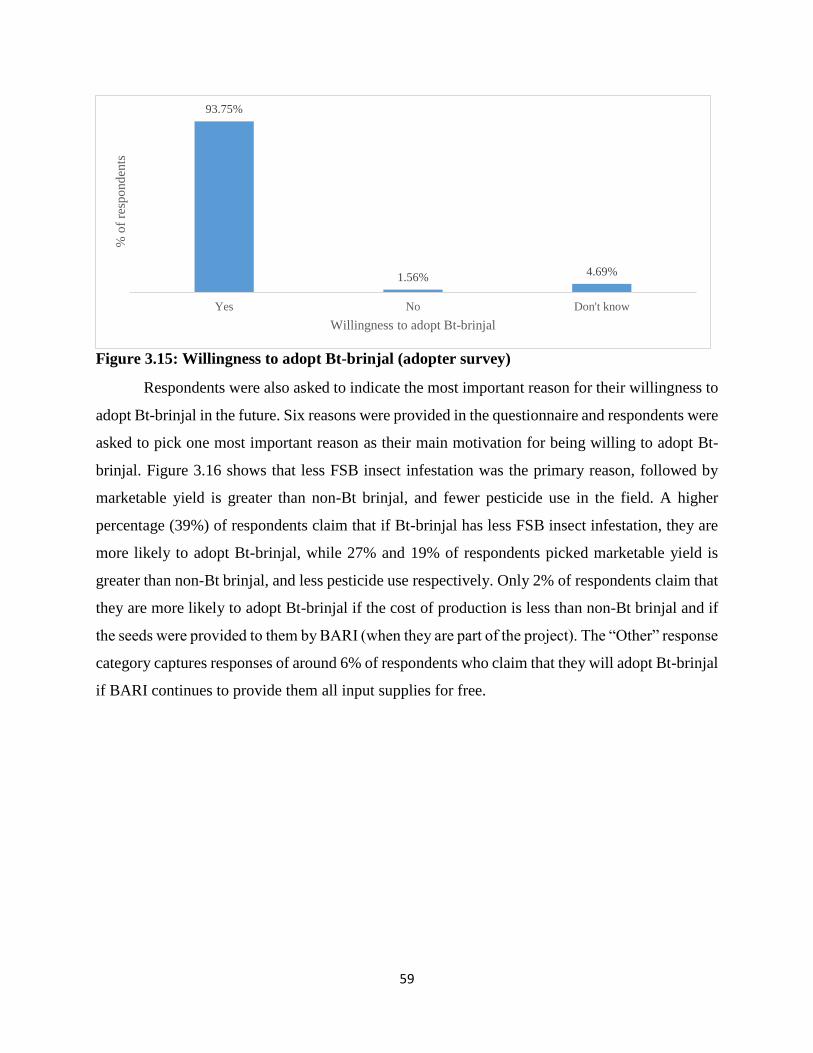
59
Figure 3.15: Willingness to adopt Bt-brinjal (adopter survey)
Respondents were also asked to indicate the most important reason for their willingness to
adopt Bt-brinjal in the future. Six reasons were provided in the questionnaire and respondents were
asked to pick one most important reason as their main motivation for being willing to adopt Bt-
brinjal. Figure 3.16 shows that less FSB insect infestation was the primary reason, followed by
marketable yield is greater than non-Bt brinjal, and fewer pesticide use in the field. A higher
percentage (39%) of respondents claim that if Bt-brinjal has less FSB insect infestation, they are
more likely to adopt Bt-brinjal, while 27% and 19% of respondents picked marketable yield is
greater than non-Bt brinjal, and less pesticide use respectively. Only 2% of respondents claim that
they are more likely to adopt Bt-brinjal if the cost of production is less than non-Bt brinjal and if
the seeds were provided to them by BARI (when they are part of the project). The “Other” response
category captures responses of around 6% of respondents who claim that they will adopt Bt-brinjal
if BARI continues to provide them all input supplies for free.
93.75%
1.56%4.69%
Yes No Don't know
% o
f re
spo
nd
ents
Willingness to adopt Bt-brinjal
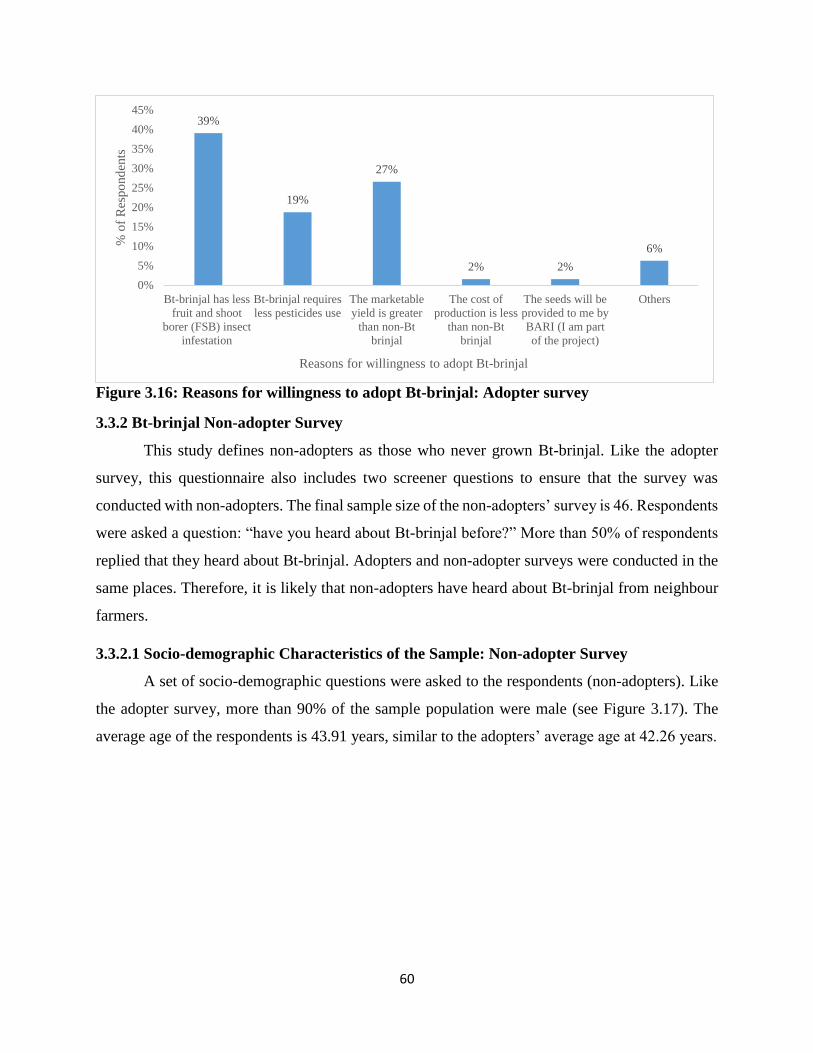
60
Figure 3.16: Reasons for willingness to adopt Bt-brinjal: Adopter survey
3.3.2 Bt-brinjal Non-adopter Survey
This study defines non-adopters as those who never grown Bt-brinjal. Like the adopter
survey, this questionnaire also includes two screener questions to ensure that the survey was
conducted with non-adopters. The final sample size of the non-adopters’ survey is 46. Respondents
were asked a question: “have you heard about Bt-brinjal before?” More than 50% of respondents
replied that they heard about Bt-brinjal. Adopters and non-adopter surveys were conducted in the
same places. Therefore, it is likely that non-adopters have heard about Bt-brinjal from neighbour
farmers.
3.3.2.1 Socio-demographic Characteristics of the Sample: Non-adopter Survey
A set of socio-demographic questions were asked to the respondents (non-adopters). Like
the adopter survey, more than 90% of the sample population were male (see Figure 3.17). The
average age of the respondents is 43.91 years, similar to the adopters’ average age at 42.26 years.
39%
19%
27%
2% 2%
6%
0%
5%
10%
15%
20%
25%
30%
35%
40%
45%
Bt-brinjal has less
fruit and shoot
borer (FSB) insect
infestation
Bt-brinjal requires
less pesticides use
The marketable
yield is greater
than non-Bt
brinjal
The cost of
production is less
than non-Bt
brinjal
The seeds will be
provided to me by
BARI (I am part
of the project)
Others
% o
f R
esp
ond
ents
Reasons for willingness to adopt Bt-brinjal
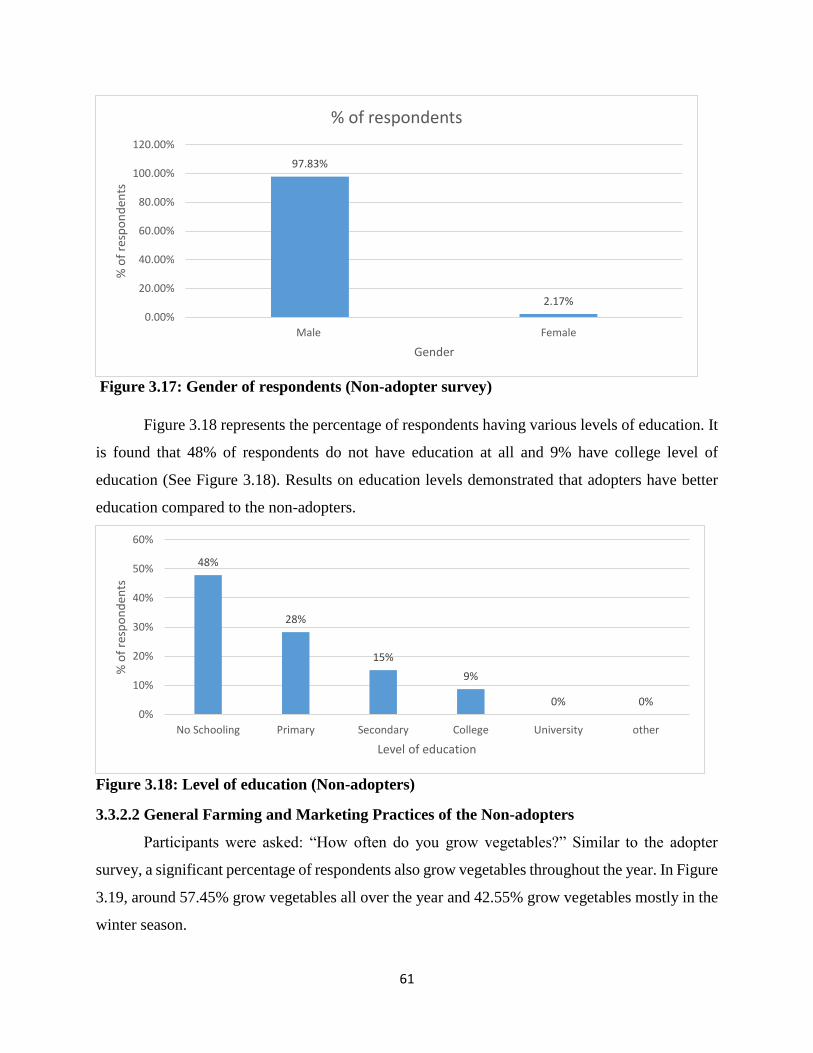
61
Figure 3.17: Gender of respondents (Non-adopter survey)
Figure 3.18 represents the percentage of respondents having various levels of education. It
is found that 48% of respondents do not have education at all and 9% have college level of
education (See Figure 3.18). Results on education levels demonstrated that adopters have better
education compared to the non-adopters.
Figure 3.18: Level of education (Non-adopters)
3.3.2.2 General Farming and Marketing Practices of the Non-adopters
Participants were asked: “How often do you grow vegetables?” Similar to the adopter
survey, a significant percentage of respondents also grow vegetables throughout the year. In Figure
3.19, around 57.45% grow vegetables all over the year and 42.55% grow vegetables mostly in the
winter season.
97.83%
2.17%
0.00%
20.00%
40.00%
60.00%
80.00%
100.00%
120.00%
Male Female
% o
f re
spo
nd
ents
Gender
% of respondents
48%
28%
15%
9%
0% 0%0%
10%
20%
30%
40%
50%
60%
No Schooling Primary Secondary College University other
% o
f re
spo
nd
ents
Level of education
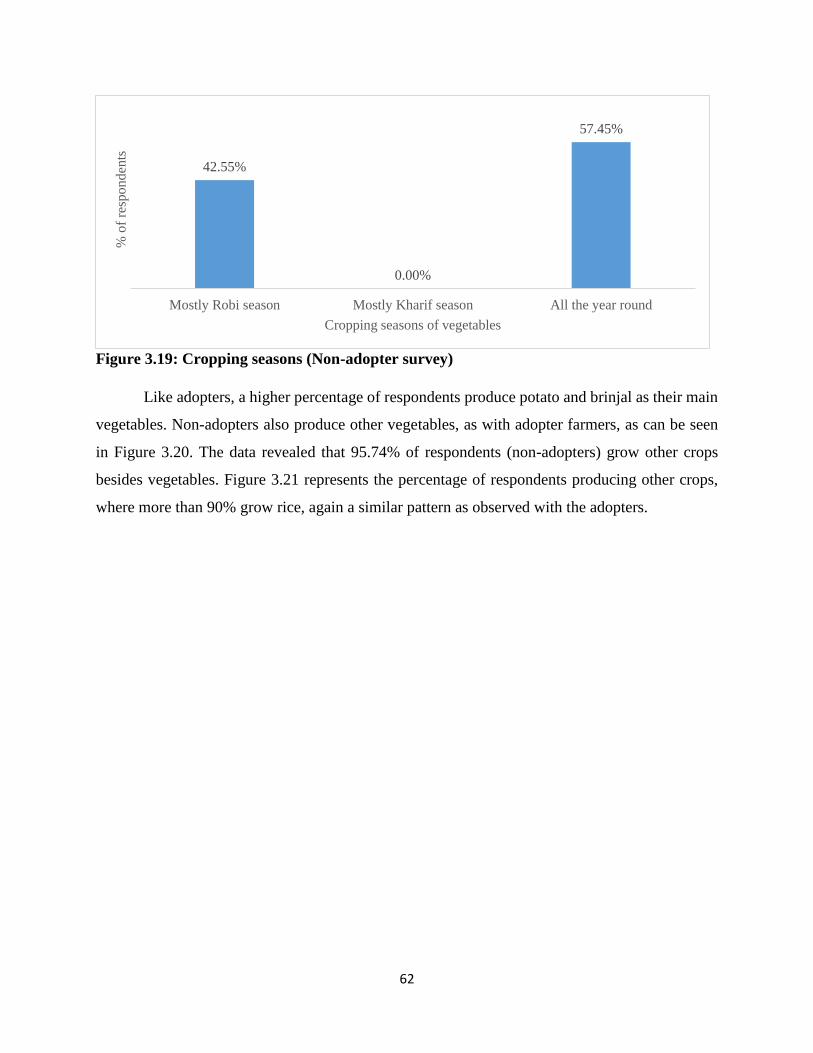
62
Figure 3.19: Cropping seasons (Non-adopter survey)
Like adopters, a higher percentage of respondents produce potato and brinjal as their main
vegetables. Non-adopters also produce other vegetables, as with adopter farmers, as can be seen
in Figure 3.20. The data revealed that 95.74% of respondents (non-adopters) grow other crops
besides vegetables. Figure 3.21 represents the percentage of respondents producing other crops,
where more than 90% grow rice, again a similar pattern as observed with the adopters.
42.55%
0.00%
57.45%
Mostly Robi season Mostly Kharif season All the year round
% o
f re
spo
nd
ents
Cropping seasons of vegetables
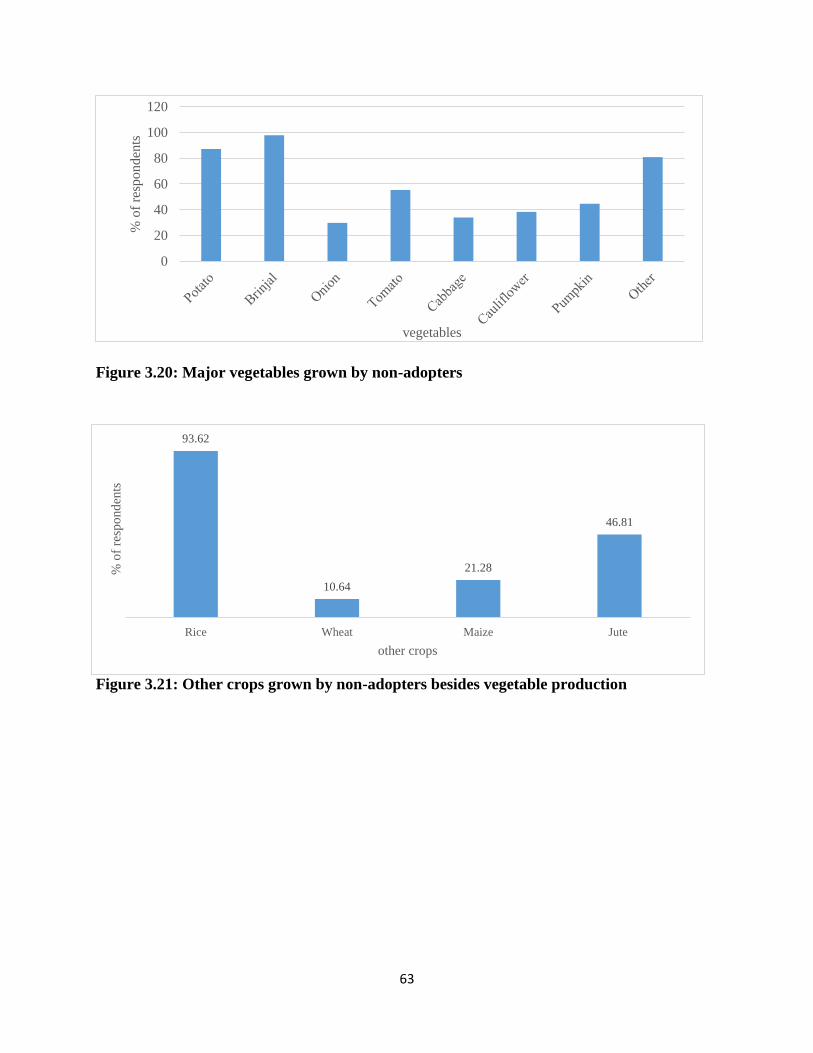
63
Figure 3.20: Major vegetables grown by non-adopters
Figure 3.21: Other crops grown by non-adopters besides vegetable production
0
20
40
60
80
100
120
% o
f re
spo
nd
ents
vegetables
93.62
10.64
21.28
46.81
Rice Wheat Maize Jute
% o
f re
spo
nd
ents
other crops
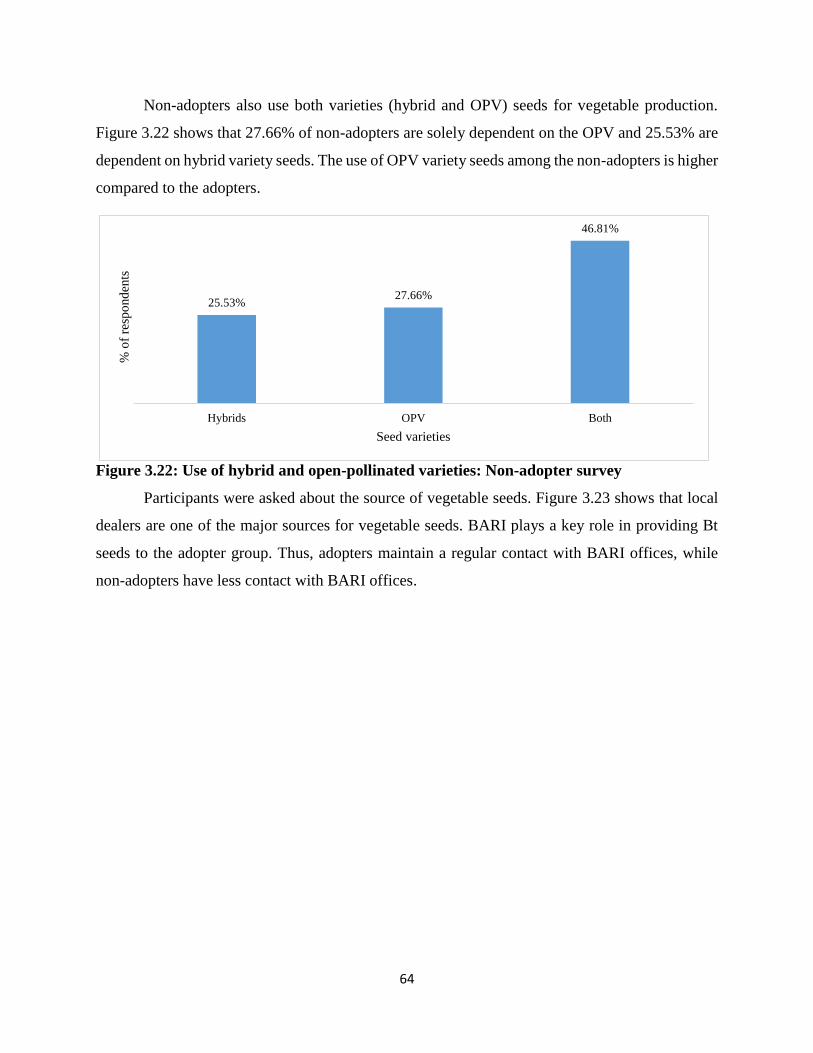
64
Non-adopters also use both varieties (hybrid and OPV) seeds for vegetable production.
Figure 3.22 shows that 27.66% of non-adopters are solely dependent on the OPV and 25.53% are
dependent on hybrid variety seeds. The use of OPV variety seeds among the non-adopters is higher
compared to the adopters.
Figure 3.22: Use of hybrid and open-pollinated varieties: Non-adopter survey
Participants were asked about the source of vegetable seeds. Figure 3.23 shows that local
dealers are one of the major sources for vegetable seeds. BARI plays a key role in providing Bt
seeds to the adopter group. Thus, adopters maintain a regular contact with BARI offices, while
non-adopters have less contact with BARI offices.
25.53%27.66%
46.81%
Hybrids OPV Both
% o
f re
spo
nd
ents
Seed varieties
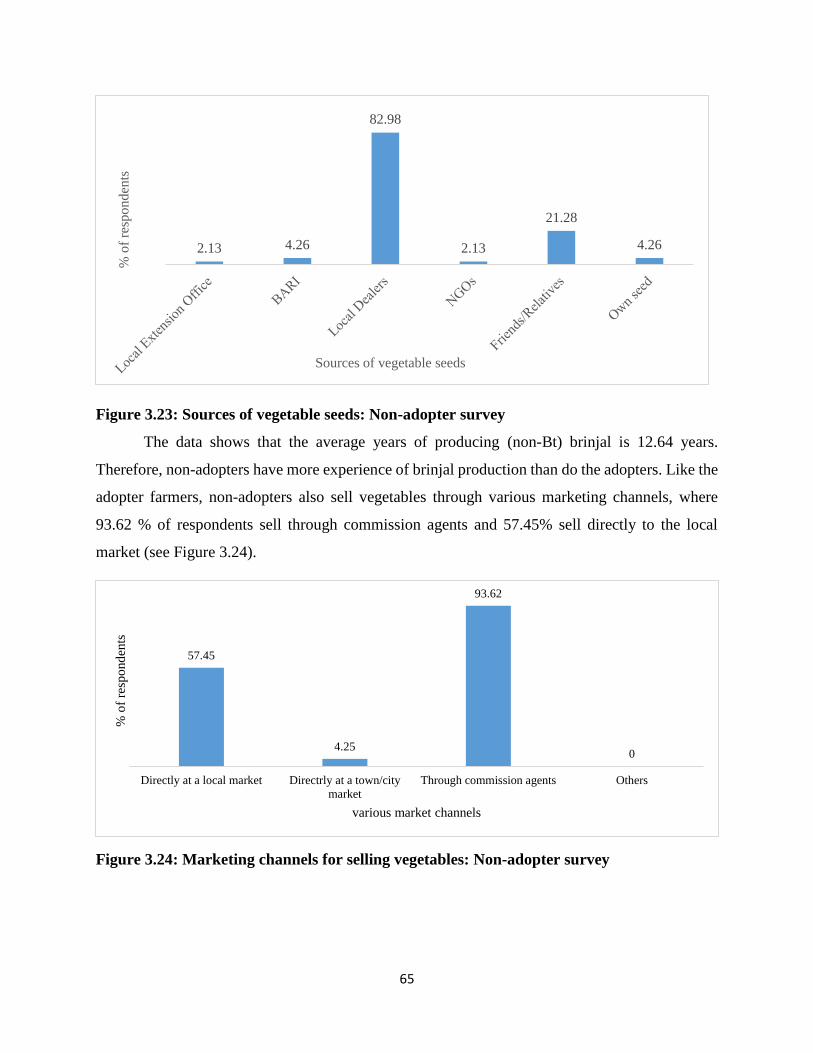
65
Figure 3.23: Sources of vegetable seeds: Non-adopter survey
The data shows that the average years of producing (non-Bt) brinjal is 12.64 years.
Therefore, non-adopters have more experience of brinjal production than do the adopters. Like the
adopter farmers, non-adopters also sell vegetables through various marketing channels, where
93.62 % of respondents sell through commission agents and 57.45% sell directly to the local
market (see Figure 3.24).
Figure 3.24: Marketing channels for selling vegetables: Non-adopter survey
2.13 4.26
82.98
2.13
21.28
4.26
% o
f re
spo
nd
ents
Sources of vegetable seeds
57.45
4.25
93.62
0
Directly at a local market Directrly at a town/city
market
Through commission agents Others
% o
f re
spo
nd
ents
various market channels
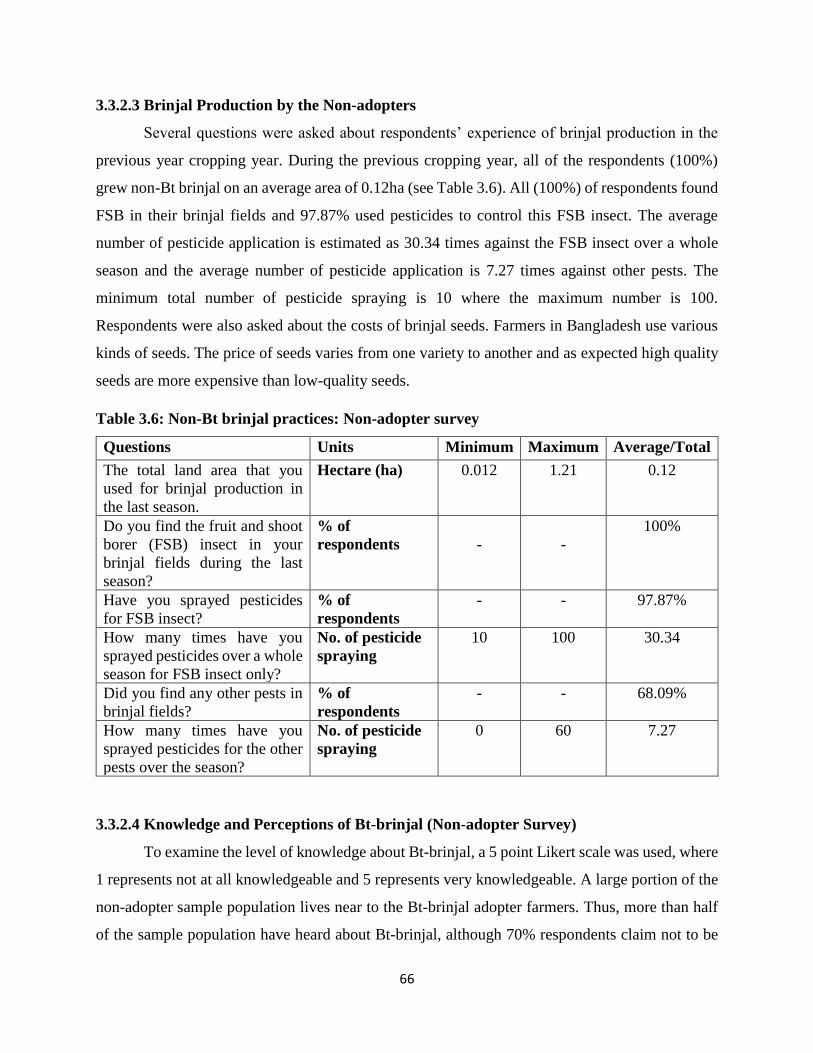
66
3.3.2.3 Brinjal Production by the Non-adopters
Several questions were asked about respondents’ experience of brinjal production in the
previous year cropping year. During the previous cropping year, all of the respondents (100%)
grew non-Bt brinjal on an average area of 0.12ha (see Table 3.6). All (100%) of respondents found
FSB in their brinjal fields and 97.87% used pesticides to control this FSB insect. The average
number of pesticide application is estimated as 30.34 times against the FSB insect over a whole
season and the average number of pesticide application is 7.27 times against other pests. The
minimum total number of pesticide spraying is 10 where the maximum number is 100.
Respondents were also asked about the costs of brinjal seeds. Farmers in Bangladesh use various
kinds of seeds. The price of seeds varies from one variety to another and as expected high quality
seeds are more expensive than low-quality seeds.
Table 3.6: Non-Bt brinjal practices: Non-adopter survey
Questions Units Minimum Maximum Average/Total
The total land area that you
used for brinjal production in
the last season.
Hectare (ha) 0.012 1.21 0.12
Do you find the fruit and shoot
borer (FSB) insect in your
brinjal fields during the last
season?
% of
respondents
-
-
100%
Have you sprayed pesticides
for FSB insect?
% of
respondents
- - 97.87%
How many times have you
sprayed pesticides over a whole
season for FSB insect only?
No. of pesticide
spraying
10 100 30.34
Did you find any other pests in
brinjal fields?
% of
respondents
- - 68.09%
How many times have you
sprayed pesticides for the other
pests over the season?
No. of pesticide
spraying
0 60 7.27
3.3.2.4 Knowledge and Perceptions of Bt-brinjal (Non-adopter Survey)
To examine the level of knowledge about Bt-brinjal, a 5 point Likert scale was used, where
1 represents not at all knowledgeable and 5 represents very knowledgeable. A large portion of the
non-adopter sample population lives near to the Bt-brinjal adopter farmers. Thus, more than half
of the sample population have heard about Bt-brinjal, although 70% respondents claim not to be

67
knowledgeable and only 26% claim to be slightly knowledgeable about Bt-brinjal (see Figure
3.25).
Figure 3.25: Level of knowledge about Bt-brinjal (Non-adopters)
Like the adopter survey, a question was also asked to the non-adopters: “Do you think that
biosafety rules and regulations play a key role in the adoption process of Bt-brinjal?” Similar
results are found to the adopters’ survey as Table 3.7 shows that around 72% respondents agreed
that biosafety rules and regulations play a significant role in the adoption process of Bt-brinjal and
28% respondents are not sure about the role of biosafety rules and regulations.
Table 3.7: Number and percentage of respondents (non-adopters) about the importance of
biosafety rules and regulations
Questions Responses No. of
respondents
% of respondents
Do you think that Biosafety rules
and regulations play a significant
role in the adoption process of Bt-
brinjal?
Yes 33 72
No 0 0.0
Not sure 13 28
3.3.2.5 Willingness to Adopt Bt-brinjal (Non-adopter Survey)
A brief note about Bt-brinjal was first provided to the respondents before asking about the
willingness to adopt Bt-brinjal. Like the Adopter Survey, Figure 3.26 shows that 91.30% of
respondents (non-adopters) are willing to adopt Bt-brinjal if it is available to them. Similar to the
70%
26%
2% 2% 0%
Not Knowledgeable Slightly
Knowledgeable
Somewhat
Knowledgeable
Moderately
Knowledgeable
Very Knowledgeable
% o
f re
spo
nd
ents
Level of knowledge about Bt-brinjal
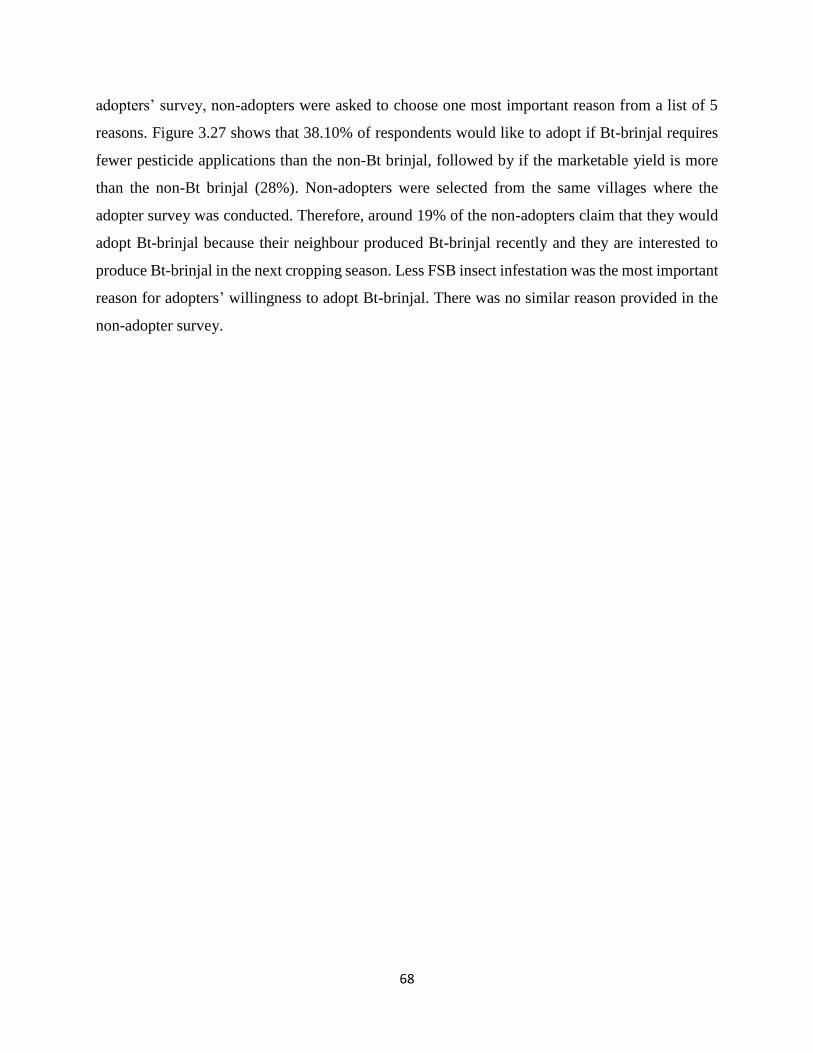
68
adopters’ survey, non-adopters were asked to choose one most important reason from a list of 5
reasons. Figure 3.27 shows that 38.10% of respondents would like to adopt if Bt-brinjal requires
fewer pesticide applications than the non-Bt brinjal, followed by if the marketable yield is more
than the non-Bt brinjal (28%). Non-adopters were selected from the same villages where the
adopter survey was conducted. Therefore, around 19% of the non-adopters claim that they would
adopt Bt-brinjal because their neighbour produced Bt-brinjal recently and they are interested to
produce Bt-brinjal in the next cropping season. Less FSB insect infestation was the most important
reason for adopters’ willingness to adopt Bt-brinjal. There was no similar reason provided in the
non-adopter survey.
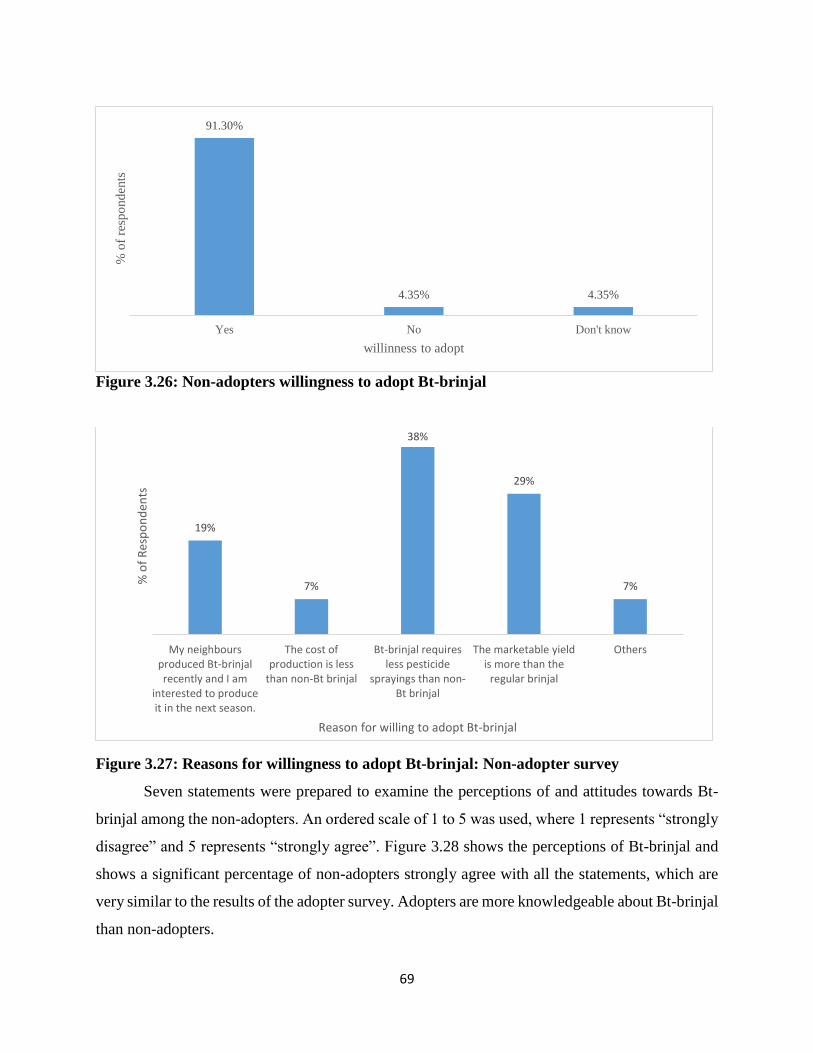
69
Figure 3.26: Non-adopters willingness to adopt Bt-brinjal
Figure 3.27: Reasons for willingness to adopt Bt-brinjal: Non-adopter survey
Seven statements were prepared to examine the perceptions of and attitudes towards Bt-
brinjal among the non-adopters. An ordered scale of 1 to 5 was used, where 1 represents “strongly
disagree” and 5 represents “strongly agree”. Figure 3.28 shows the perceptions of Bt-brinjal and
shows a significant percentage of non-adopters strongly agree with all the statements, which are
very similar to the results of the adopter survey. Adopters are more knowledgeable about Bt-brinjal
than non-adopters.
19%
7%
38%
29%
7%
My neighboursproduced Bt-brinjalrecently and I am
interested to produceit in the next season.
The cost ofproduction is less
than non-Bt brinjal
Bt-brinjal requiresless pesticide
sprayings than non-Bt brinjal
The marketable yieldis more than the
regular brinjal
Others
% o
f R
esp
on
den
ts
Reason for willing to adopt Bt-brinjal
91.30%
4.35% 4.35%
Yes No Don't know
% o
f re
spo
nd
ents
willinness to adopt
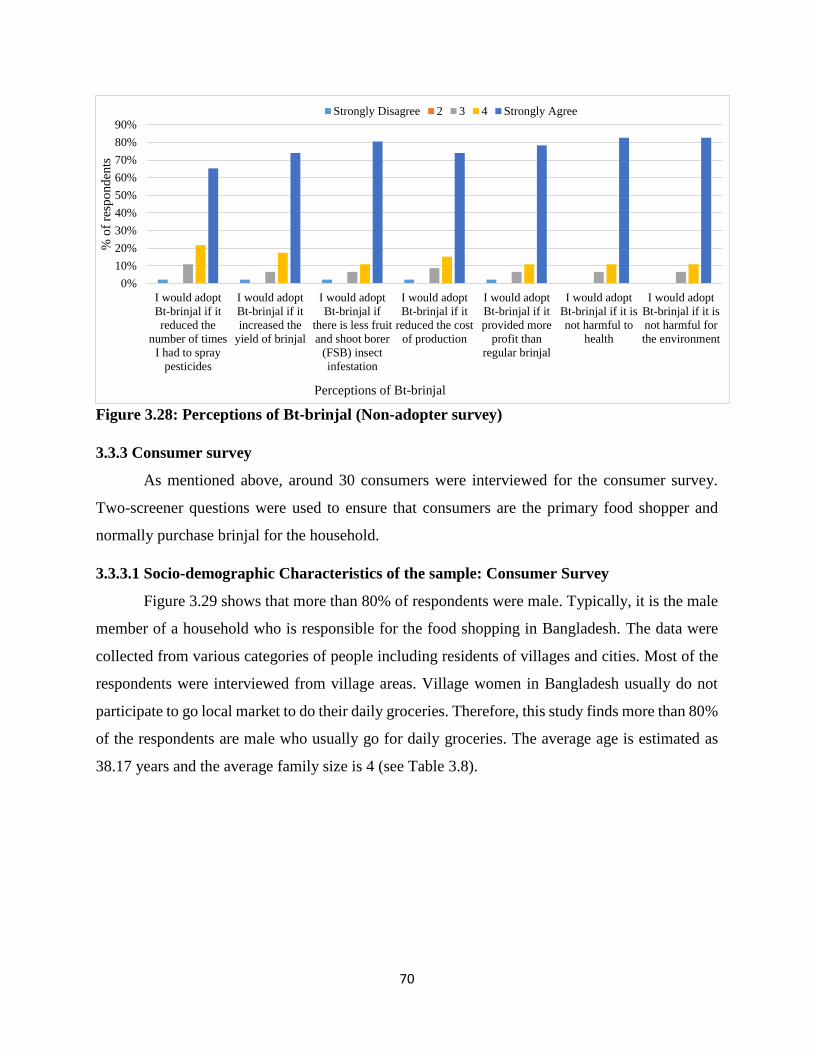
70
Figure 3.28: Perceptions of Bt-brinjal (Non-adopter survey)
3.3.3 Consumer survey
As mentioned above, around 30 consumers were interviewed for the consumer survey.
Two-screener questions were used to ensure that consumers are the primary food shopper and
normally purchase brinjal for the household.
3.3.3.1 Socio-demographic Characteristics of the sample: Consumer Survey
Figure 3.29 shows that more than 80% of respondents were male. Typically, it is the male
member of a household who is responsible for the food shopping in Bangladesh. The data were
collected from various categories of people including residents of villages and cities. Most of the
respondents were interviewed from village areas. Village women in Bangladesh usually do not
participate to go local market to do their daily groceries. Therefore, this study finds more than 80%
of the respondents are male who usually go for daily groceries. The average age is estimated as
38.17 years and the average family size is 4 (see Table 3.8).
0%
10%
20%
30%
40%
50%
60%
70%
80%
90%
I would adopt
Bt-brinjal if it
reduced the
number of times
I had to spray
pesticides
I would adopt
Bt-brinjal if it
increased the
yield of brinjal
I would adopt
Bt-brinjal if
there is less fruit
and shoot borer
(FSB) insect
infestation
I would adopt
Bt-brinjal if it
reduced the cost
of production
I would adopt
Bt-brinjal if it
provided more
profit than
regular brinjal
I would adopt
Bt-brinjal if it is
not harmful to
health
I would adopt
Bt-brinjal if it is
not harmful for
the environment
% o
f re
spo
nd
ents
Perceptions of Bt-brinjal
Strongly Disagree 2 3 4 Strongly Agree
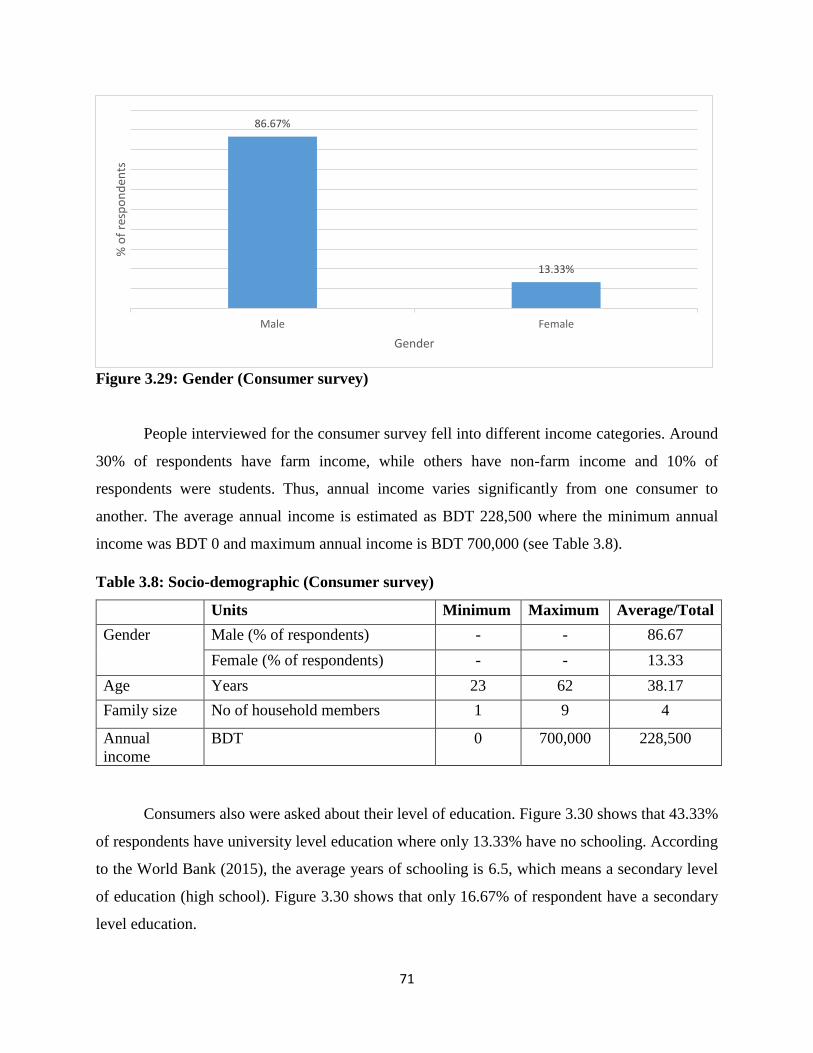
71
Figure 3.29: Gender (Consumer survey)
People interviewed for the consumer survey fell into different income categories. Around
30% of respondents have farm income, while others have non-farm income and 10% of
respondents were students. Thus, annual income varies significantly from one consumer to
another. The average annual income is estimated as BDT 228,500 where the minimum annual
income was BDT 0 and maximum annual income is BDT 700,000 (see Table 3.8).
Table 3.8: Socio-demographic (Consumer survey)
Units Minimum Maximum Average/Total
Gender Male (% of respondents) - - 86.67
Female (% of respondents) - - 13.33
Age Years 23 62 38.17
Family size No of household members 1 9 4
Annual
income
BDT 0 700,000 228,500
Consumers also were asked about their level of education. Figure 3.30 shows that 43.33%
of respondents have university level education where only 13.33% have no schooling. According
to the World Bank (2015), the average years of schooling is 6.5, which means a secondary level
of education (high school). Figure 3.30 shows that only 16.67% of respondent have a secondary
level education.
86.67%
13.33%
Male Female
% o
f re
spo
nd
ents
Gender
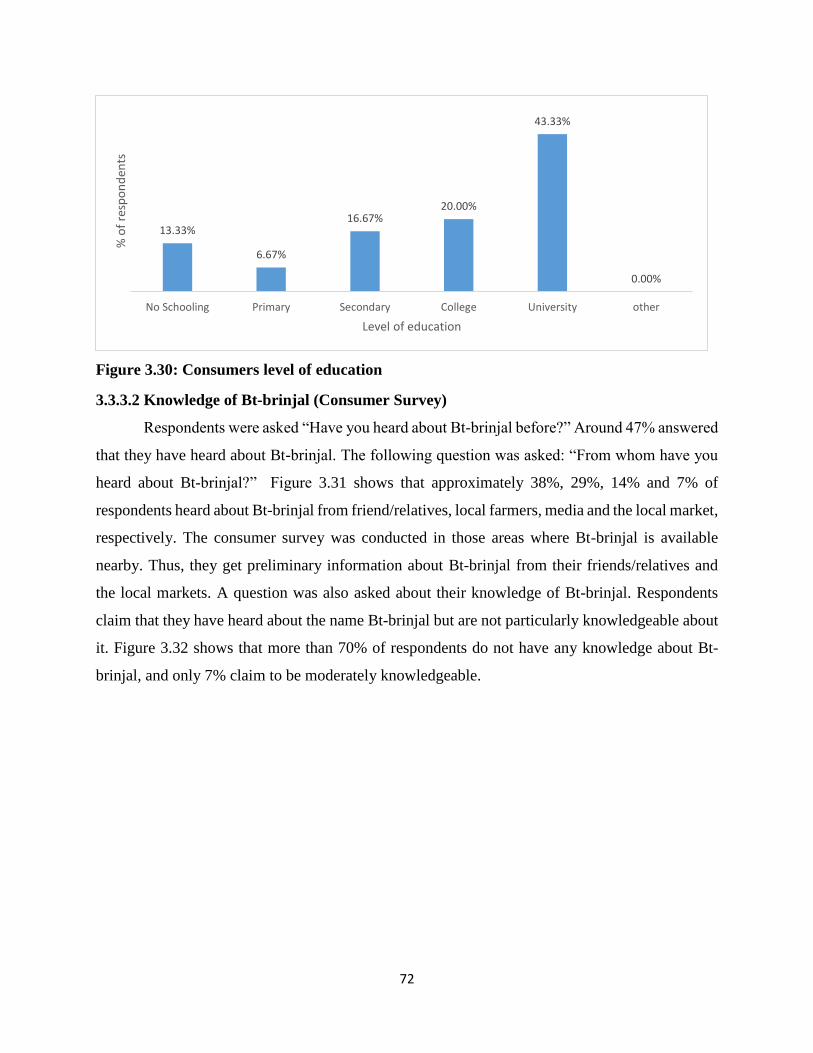
72
Figure 3.30: Consumers level of education
3.3.3.2 Knowledge of Bt-brinjal (Consumer Survey)
Respondents were asked “Have you heard about Bt-brinjal before?” Around 47% answered
that they have heard about Bt-brinjal. The following question was asked: “From whom have you
heard about Bt-brinjal?” Figure 3.31 shows that approximately 38%, 29%, 14% and 7% of
respondents heard about Bt-brinjal from friend/relatives, local farmers, media and the local market,
respectively. The consumer survey was conducted in those areas where Bt-brinjal is available
nearby. Thus, they get preliminary information about Bt-brinjal from their friends/relatives and
the local markets. A question was also asked about their knowledge of Bt-brinjal. Respondents
claim that they have heard about the name Bt-brinjal but are not particularly knowledgeable about
it. Figure 3.32 shows that more than 70% of respondents do not have any knowledge about Bt-
brinjal, and only 7% claim to be moderately knowledgeable.
13.33%
6.67%
16.67%20.00%
43.33%
0.00%
No Schooling Primary Secondary College University other
% o
f re
spo
nd
ents
Level of education
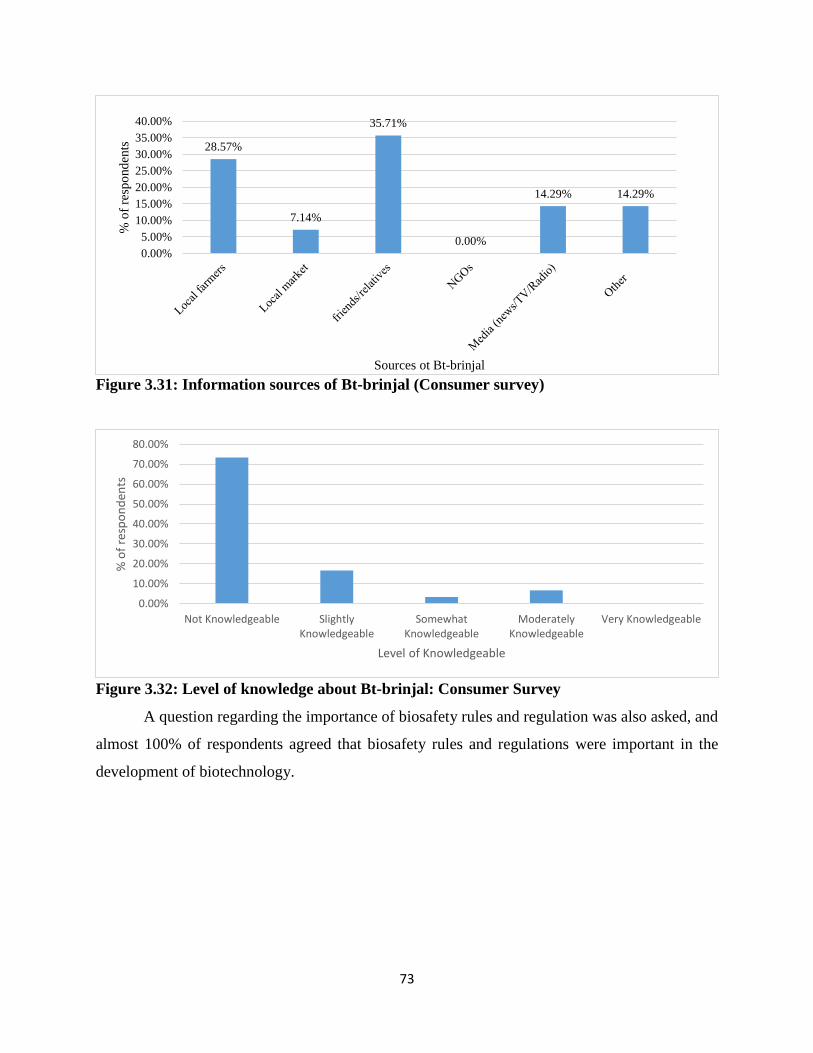
73
Figure 3.31: Information sources of Bt-brinjal (Consumer survey)
Figure 3.32: Level of knowledge about Bt-brinjal: Consumer Survey
A question regarding the importance of biosafety rules and regulation was also asked, and
almost 100% of respondents agreed that biosafety rules and regulations were important in the
development of biotechnology.
28.57%
7.14%
35.71%
0.00%
14.29% 14.29%
0.00%
5.00%
10.00%
15.00%
20.00%
25.00%
30.00%
35.00%
40.00%%
of
resp
ond
ents
Sources ot Bt-brinjal
0.00%
10.00%
20.00%
30.00%
40.00%
50.00%
60.00%
70.00%
80.00%
Not Knowledgeable SlightlyKnowledgeable
SomewhatKnowledgeable
ModeratelyKnowledgeable
Very Knowledgeable
% o
f re
spo
nd
ents
Level of Knowledgeable
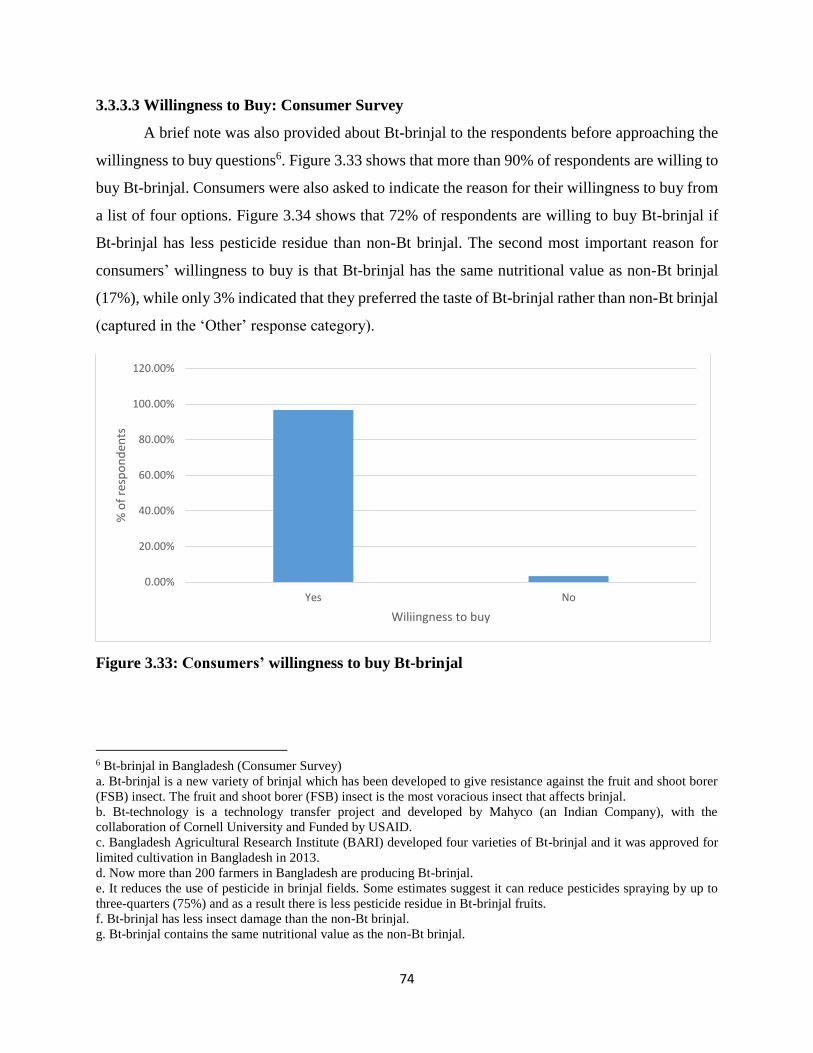
74
3.3.3.3 Willingness to Buy: Consumer Survey
A brief note was also provided about Bt-brinjal to the respondents before approaching the
willingness to buy questions6. Figure 3.33 shows that more than 90% of respondents are willing to
buy Bt-brinjal. Consumers were also asked to indicate the reason for their willingness to buy from
a list of four options. Figure 3.34 shows that 72% of respondents are willing to buy Bt-brinjal if
Bt-brinjal has less pesticide residue than non-Bt brinjal. The second most important reason for
consumers’ willingness to buy is that Bt-brinjal has the same nutritional value as non-Bt brinjal
(17%), while only 3% indicated that they preferred the taste of Bt-brinjal rather than non-Bt brinjal
(captured in the ‘Other’ response category).
Figure 3.33: Consumers’ willingness to buy Bt-brinjal
6 Bt-brinjal in Bangladesh (Consumer Survey)
a. Bt-brinjal is a new variety of brinjal which has been developed to give resistance against the fruit and shoot borer
(FSB) insect. The fruit and shoot borer (FSB) insect is the most voracious insect that affects brinjal.
b. Bt-technology is a technology transfer project and developed by Mahyco (an Indian Company), with the
collaboration of Cornell University and Funded by USAID.
c. Bangladesh Agricultural Research Institute (BARI) developed four varieties of Bt-brinjal and it was approved for
limited cultivation in Bangladesh in 2013.
d. Now more than 200 farmers in Bangladesh are producing Bt-brinjal.
e. It reduces the use of pesticide in brinjal fields. Some estimates suggest it can reduce pesticides spraying by up to
three-quarters (75%) and as a result there is less pesticide residue in Bt-brinjal fruits.
f. Bt-brinjal has less insect damage than the non-Bt brinjal.
g. Bt-brinjal contains the same nutritional value as the non-Bt brinjal.
0.00%
20.00%
40.00%
60.00%
80.00%
100.00%
120.00%
Yes No
% o
f re
spo
nd
ents
Wiliingness to buy
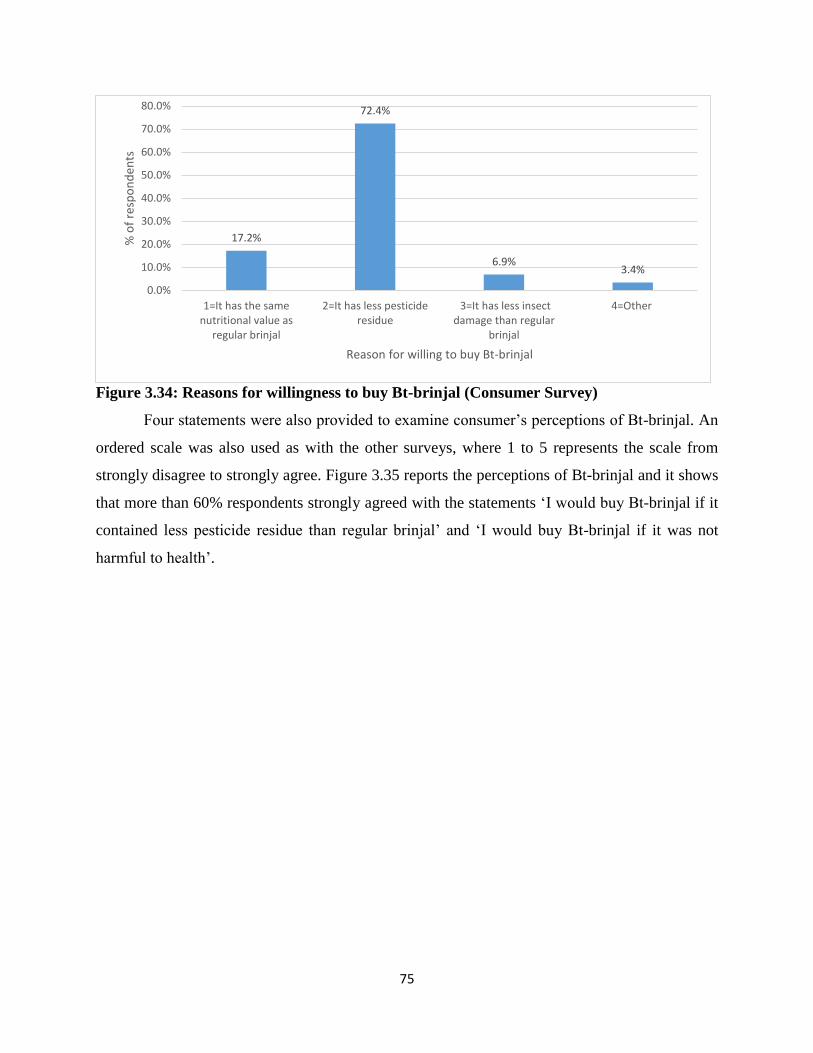
75
Figure 3.34: Reasons for willingness to buy Bt-brinjal (Consumer Survey)
Four statements were also provided to examine consumer’s perceptions of Bt-brinjal. An
ordered scale was also used as with the other surveys, where 1 to 5 represents the scale from
strongly disagree to strongly agree. Figure 3.35 reports the perceptions of Bt-brinjal and it shows
that more than 60% respondents strongly agreed with the statements ‘I would buy Bt-brinjal if it
contained less pesticide residue than regular brinjal’ and ‘I would buy Bt-brinjal if it was not
harmful to health’.
17.2%
72.4%
6.9%3.4%
0.0%
10.0%
20.0%
30.0%
40.0%
50.0%
60.0%
70.0%
80.0%
1=It has the samenutritional value as
regular brinjal
2=It has less pesticideresidue
3=It has less insectdamage than regular
brinjal
4=Other
% o
f re
spo
nd
ents
Reason for willing to buy Bt-brinjal
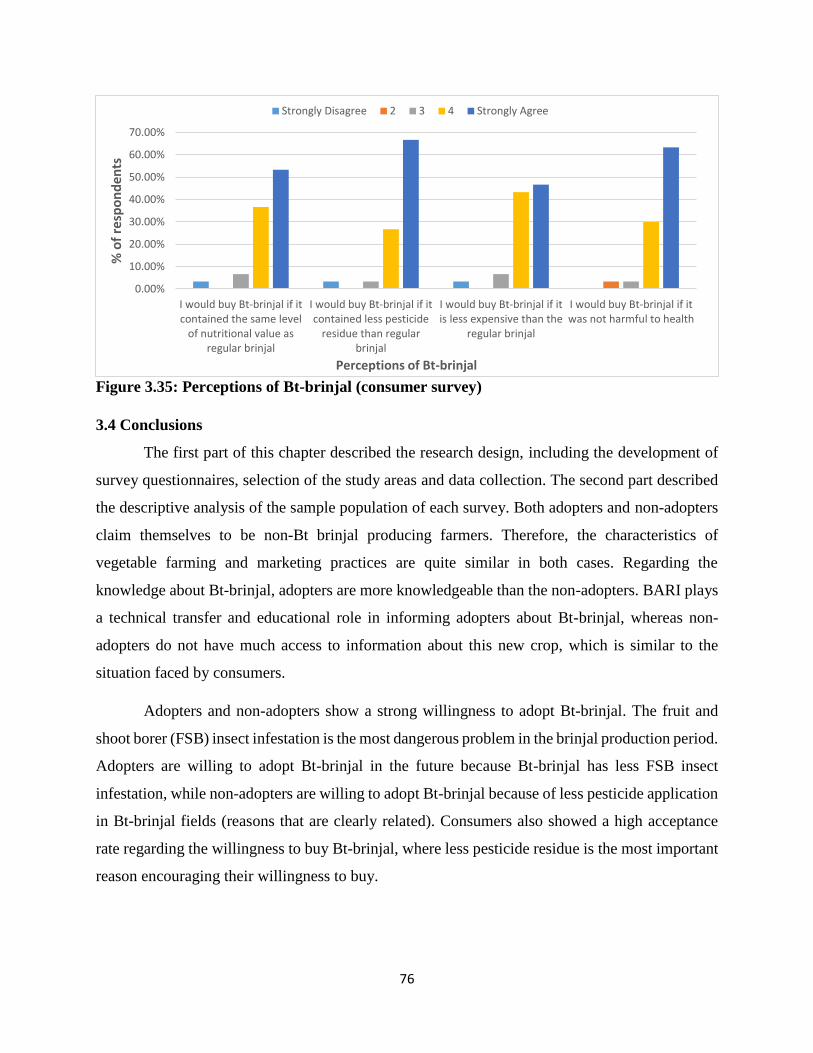
76
Figure 3.35: Perceptions of Bt-brinjal (consumer survey)
3.4 Conclusions
The first part of this chapter described the research design, including the development of
survey questionnaires, selection of the study areas and data collection. The second part described
the descriptive analysis of the sample population of each survey. Both adopters and non-adopters
claim themselves to be non-Bt brinjal producing farmers. Therefore, the characteristics of
vegetable farming and marketing practices are quite similar in both cases. Regarding the
knowledge about Bt-brinjal, adopters are more knowledgeable than the non-adopters. BARI plays
a technical transfer and educational role in informing adopters about Bt-brinjal, whereas non-
adopters do not have much access to information about this new crop, which is similar to the
situation faced by consumers.
Adopters and non-adopters show a strong willingness to adopt Bt-brinjal. The fruit and
shoot borer (FSB) insect infestation is the most dangerous problem in the brinjal production period.
Adopters are willing to adopt Bt-brinjal in the future because Bt-brinjal has less FSB insect
infestation, while non-adopters are willing to adopt Bt-brinjal because of less pesticide application
in Bt-brinjal fields (reasons that are clearly related). Consumers also showed a high acceptance
rate regarding the willingness to buy Bt-brinjal, where less pesticide residue is the most important
reason encouraging their willingness to buy.
0.00%
10.00%
20.00%
30.00%
40.00%
50.00%
60.00%
70.00%
I would buy Bt-brinjal if itcontained the same level
of nutritional value asregular brinjal
I would buy Bt-brinjal if itcontained less pesticide
residue than regularbrinjal
I would buy Bt-brinjal if itis less expensive than the
regular brinjal
I would buy Bt-brinjal if itwas not harmful to health
% o
f re
spo
nd
ents
Perceptions of Bt-brinjal
Strongly Disagree 2 3 4 Strongly Agree
77
Adopters’ and non-adopters’ willingness to adopt Bt-brinjal are examined in the next
chapter through an econometric model using Stata 15. The descriptive analysis presented in this
chapter helps to identify the dependent and independent variables for the econometric model.
78
Chapter 4 Estimation Methods and Results
4.1 Introduction
This chapter outlines the estimation methods used in the analysis of the adopters and non-
adopter surveys. This study examines social license for the adoption of Bt-brinjal in Bangladesh.
However, there is no exact measurement of social license for the adoption of a new technology.
Typically, technology adoption studies employ a dichotomous choice method to evaluate the
adoption decision or willingness to adopt, however, given the very high stated willingness to adopt
among current adopters and non-adopters, this analysis was not feasible. A variation on a
willingness to adopt measure is used instead, in the form of a multinomial logit model which
identifies the major reasons behind willingness to adopt for both the adopters as well as the non-
adopters.
This chapter is organized as followed: a brief discussion of the estimation methods is
provided in section 4.2. A discussion of the multinomial logit model applied to the adopter survey
data is provided in section 4.3. Section 4.4 discusses the multinomial logit model used in the non-
adopter survey analysis. Section 4.5 discusses the insights from the consumer survey and other
stakeholder interviews. Conclusions to the chapter are provided in section 4.6.
4.2 Estimation Methods
Social license measures stakeholders’ level of acceptance and approval of new technology
adoption. Social license for adopting a new GM technology depends mostly on stakeholders’
willingness to adopt the technology and their technology adoption decisions. Therefore,
willingness to accept may influence the adoption of that technology as well as its level of social
license. The greater the willingness to adopt or accept a new technology among several
stakeholders the more likely to lead it is the establishment of social license for that technology.
In the case of brinjal farmers in Bangladesh, it is challenging to measure their willingness
to adopt Bt-brinjal. Bt-technology is still in the phase of commercialization because the Bt-seeds
are not available commercially on the market. Instead, the Bangladesh Agricultural Research
Institute (BARI) provides all necessary input supports to the Bt-brinjal adopters. This means that
the adopters maintain a direct connection with the BARI officials. This may bias simple measures
of willingness to adopt at this point in time, possibly explaining the very high proportion of
respondents who indicated a positive willingness to adopt. BARI also confirmed that the DAE has

79
also been working with local farmers since 2015. The data were collected only from those adopter
farmers who were identified by BARI. Adopter farmers working with DAE were not included in
the study because of time limitations.
In addition to Bangladesh, a few other countries, are also trying to approve Bt-brinjal, for
example, India and the Philippines. A number of studies have been done on an ex-ante basis in
those countries. Kolady and Lesser (2006) conducted an ex-ante study in India to examine the
factors that would influence farmers’ decisions to adopt Bt-brinjal while hybrid brinjal is available
in the market. The study used a bivariate probit model to analyze whether hybrid brinjal growers
would behave differently if Bt-brinjal were available in the market. They used a random utility
framework to model farmers’ willingness to adopt a new technology. According to utility
measurement theory, an adopter is more willing to adopt a technology when the cost of new
technology is less than the old technology and provides benefits at least as great as the old
technology (Kolady and Lesser, 2006).
Like Kolady and Lesser (2006), this study also investigates willingness to adopt Bt-brinjal
in Bangladesh but is an ex post analysis where it is possible to identify the farmers currently
growing (adopters) and not growing (non-adopters) Bt-brinjal. A binary probit model was first
considered as a method to examine willingness to adopt/accept Bt-brinjal in Bangladesh. A binary
probit model is not well suited to the data, however, because of the high level of acceptance and
willingness to adopt Bt-brinjal among both the surveyed adopters and non-adopters. The
descriptive analysis shows that more than 90% of the adopters have the positive willing to adopt
Bt-brinjal in the near future, which is similar to the non-adopter survey data (see chapter 3). Thus,
the probability of willingness to accept (Y) responses, which is Yi=1 is much higher than the
probability of Yi=0 in the probit model for both surveys. Instead, an alternative model, a
multinomial logit model (MNL) was used for the analysis of the adopter and non-adopter survey
data which focuses on the reasons for willingness to adopt.
Respondents were asked to specify a primary reason among several reasons for their
willingness to adopt Bt-brinjal. A number of reasons were provided in the survey as discussed in
the descriptive analysis in chapter 3. In the adopters and non-adopter survey, 6 reasons and 5
80
reasons were provided to the respondents respectively in the survey.7 Therefore, a categorical
dependent variable is used in the analysis. The dependent variable is defined as: what is the most
important reason that motivates the adopters/non-adopters willingness to grow Bt-brinjal.
Logistic regression analysis is used to analyze a binary dependent variable (such as
adopt/non-adopt), while, a multinomial logit model (MNL) is used to analyze a categorical
dependent variable, as discussed for example by Wang et al. (2017) and Guris et al. (2007). A
binary logit model provides only one equation for the outcome variable while in case of the
multinomial logit model, there are K-1 equations. For example, if the dependent variable has K
categories of responses then a multinomial logit model provides K-1 equations.
A multinomial logit model (MNL) simultaneously uses all of the response categories by
specifying the odds of an outcome in one category instead of another category (Agresti, 2007). A
MNL model can be used for nominal or ordinal response categories. A nominal response means
where categories do not follow a scale of order (unordered categories) and an ordinal response
means when response categories follow a scale of order, for example, a scale of 1 to 5, strongly
disagree to strongly agree.
This study uses nominal response categories for the dependent variable. A multinomial
logit model for nominal response categories uses a baseline category to compare each response
category with the baseline category. Assume, J is the number of response categories in the
dependent variable Y and P1, P2 …… Pj are the response probabilities. The probabilities are
calculated to estimate the odds ratio of a j response among J alternatives. The probability of a j
response among J alternatives in the dependent variable is P (Y= j | X), where Xi is the case specific
repressors to explain every alternative in the dependent variable. Following Guris et al. (2007), a
multinomial logit model is obtained as:
P (Yi= j | Xi) = 𝑒𝛼𝑗+𝛽𝑗𝑋𝑖
∑ 𝑒𝛼𝑗+𝛽𝑗𝑋𝑖𝑀𝑗=1
……………………………. 1
where, αj and βj are the intercepts and coefficients for Xi repressors. Thus, there is one set of
coefficients for each alternative. The probabilities are positive in value and the total of probabilities
7 See Figure 3.16 and Figure 3.27 in chapter 3. These figures portray the major reasons for willingness to adopt Bt-
brinjal.
81
P (Yi=j) is equal to one. Therefore, the model in equation 1 has J numbers of equations of which
only (J-1) can be estimated and the coefficients for each category can be interpreted with respect
to the base outcome category.
4.2.1 Interpretation of Multinomial Logit Model and Marginal Effects
According to Wulff (2015), there are two issues that complicate the interpretation of the
coefficients in a multinomial logit model. The base outcome category, which is used in the model
as the dependent variable’s response category, represents contrasts among other categories and
makes it difficult to see the implications for each category purely from the coefficients (Wulff,
2015). Furthermore, according to Long (1997) and Long and Freese, (2006), the coefficients in a
MNL model do not necessarily mean that an increase in the independent variable corresponds to
an increase in the probability of choosing a particular outcome category. The relationship between
independent variables and base outcome category in a MNL model is not linear and may even
change the sign across the distribution of a single predictor (Wulff, 2015). Thus, researchers use
predicted probabilities and marginal effects to interpret the direction, magnitude and significance
in a MNL model. While predicted probabilities provide the information about the direction and
magnitude of the relationship, marginal effects are a very powerful interpretative device to explain
the results from a MNL model. According to Wulff (2015), the marginal effects can be defined as
the slope of the predicted function at a given value of the explanatory variable and thus explain
the change in predicted probabilities due to a change in a particular predictor. This study calculates
marginal effects from the regression parameter estimates to explain the results from the
multinomial logit model.
4.2.1.1 Marginal Effects
Both discrete and continuous choice models use marginal effects to interpret the variables.
Marginal effects for continuous variables measure the instantaneous rate of change, meaning that
it provides a good approximation to the amount of change in the dependent variable which will be
estimated by a one unit change in the explanatory variables. Marginal effects for categorical
variables measure the discrete change on the predicted probabilities as the binary independent
variable changes from 0 to 1. Marginal effects are calculated differenctly for both categorical and
continuous variables. Wulff (2015) uses a simple equation for estimating the marginal effects for
a multinomial logit model. Thus, following Wulff (2015), the equation for marginal effects is:
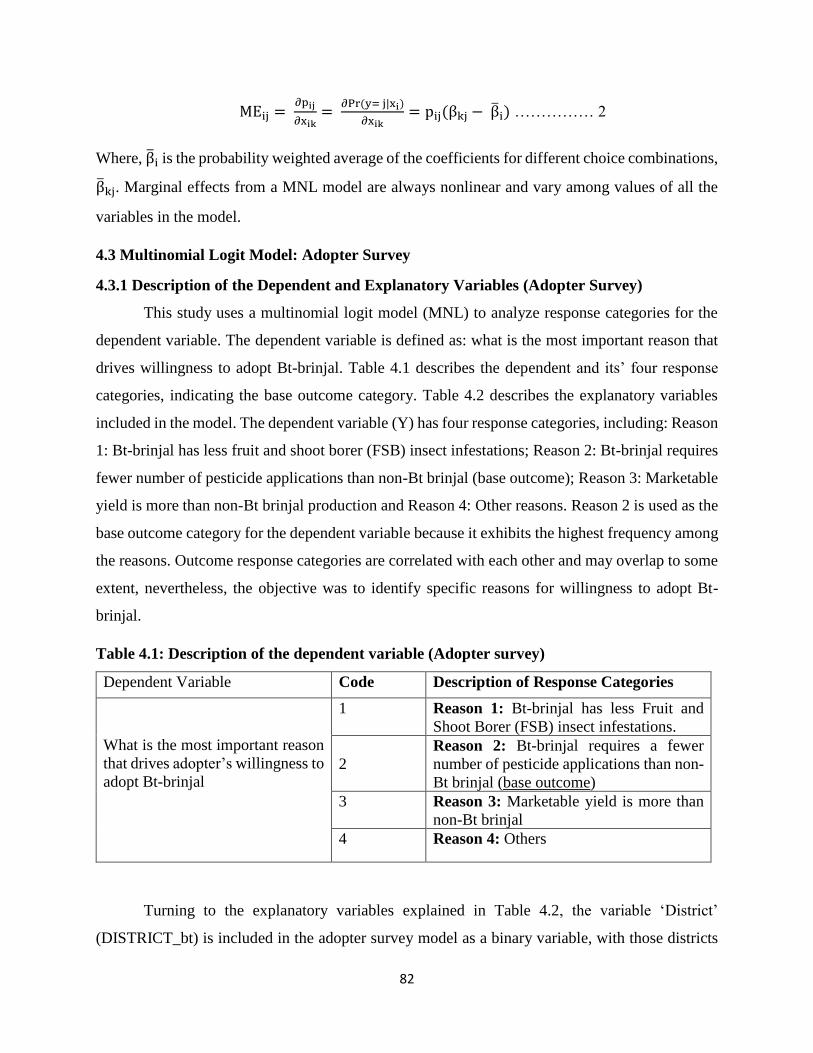
82
MEij = ∂pij
∂xik=
∂Pr (y= j|xi)
∂xik= pij(βkj − β̅i) …………… 2
Where, β̅i is the probability weighted average of the coefficients for different choice combinations,
β̅kj. Marginal effects from a MNL model are always nonlinear and vary among values of all the
variables in the model.
4.3 Multinomial Logit Model: Adopter Survey
4.3.1 Description of the Dependent and Explanatory Variables (Adopter Survey)
This study uses a multinomial logit model (MNL) to analyze response categories for the
dependent variable. The dependent variable is defined as: what is the most important reason that
drives willingness to adopt Bt-brinjal. Table 4.1 describes the dependent and its’ four response
categories, indicating the base outcome category. Table 4.2 describes the explanatory variables
included in the model. The dependent variable (Y) has four response categories, including: Reason
1: Bt-brinjal has less fruit and shoot borer (FSB) insect infestations; Reason 2: Bt-brinjal requires
fewer number of pesticide applications than non-Bt brinjal (base outcome); Reason 3: Marketable
yield is more than non-Bt brinjal production and Reason 4: Other reasons. Reason 2 is used as the
base outcome category for the dependent variable because it exhibits the highest frequency among
the reasons. Outcome response categories are correlated with each other and may overlap to some
extent, nevertheless, the objective was to identify specific reasons for willingness to adopt Bt-
brinjal.
Table 4.1: Description of the dependent variable (Adopter survey)
Dependent Variable Code Description of Response Categories
What is the most important reason
that drives adopter’s willingness to
adopt Bt-brinjal
1 Reason 1: Bt-brinjal has less Fruit and
Shoot Borer (FSB) insect infestations.
2
Reason 2: Bt-brinjal requires a fewer
number of pesticide applications than non-
Bt brinjal (base outcome)
3 Reason 3: Marketable yield is more than
non-Bt brinjal
4 Reason 4: Others
Turning to the explanatory variables explained in Table 4.2, the variable ‘District’
(DISTRICT_bt) is included in the adopter survey model as a binary variable, with those districts
83
where farmers have produced Bt-brinjal more than once coded as 1 and 0 otherwise. Kolady and
Lesser (2006) stated that contextual characteristics such as the ‘District’ variable may capture agro-
climatic differences, infrastructure variations and regional preferences and they may influence the
farmers’ adoption decision. Brinjal is an important crop in Bangladesh and there are 103 varieties
of brinjal in Bangladesh. Different varieties of brinjal are produced in different regions of
Bangladesh. Therefore, the district variable captures regional preferences and patterns in the
adoption of Bt-brinjal. ‘Winter season’ (ROBI_bt) is also used as a dummy variable, where 1
indicates the respondent’s main vegetable growing season is winter and 0 otherwise. The winter
season is the major vegetable growing season in Bangladesh. There are fewer insect infestations
in the vegetable crops in the winter season than in the other seasons. ‘Experience of Bt and non-
Bt’ is also used as a dummy variable (BRNJLPRDCTN_bt), where 1 means adopters have
experience of producing both Bt-brinjal and non-Bt brinjal at the same time and 0 otherwise.
Experience in producing both Bt-brinjal and non-Bt brinjal may help the adopters to understand
the difference between producing Bt-brinjal and regular (non-Bt brinjal) and the benefits of
producing a new crop (Bt-brinjal). Thus, it is hypothesized that the experience of producing both
Bt-brinjal and non-Bt brinjal may influence the adoption of Bt-brinjal.
A variable capturing the marketing channel used by the farmers was defined as ‘Vegetables
sold in the local market’ which also is used as a dummy variable (MRKTCHNNL_bt), coded as 1
if farmers sell vegetables directly to the local market and 0 otherwise. In Bangladesh, a substantial
portion of farmers are marginal farmers and they market their vegetables directly to the local
market. Vegetables are perishable in nature and there is a lack of storage facilities in Bangladesh.
Thus, the small farmers are prefer to sell their vegetable in the local market where they have direct
contact with buyers. ‘Seed variety’ is defined as VARIETY_bt (dummy), where 1 means
respondents use hybrid seeds for vegetable production and 0 otherwise. Bangladeshi farmers are
now using both varieties (hybrid and open-pollinated varieties) for vegetable production. Hybrid
seeds provide more benefits than conventional seed varieties. As marginal farmers, they do not
have a large amount of farming land. Thus, farmers are now using hybrid seeds more than the
conventional seeds. Therefore, the farmers who like to use hybrid varieties more than open-
pollinated varieties may approach technology adoption decisions differently.
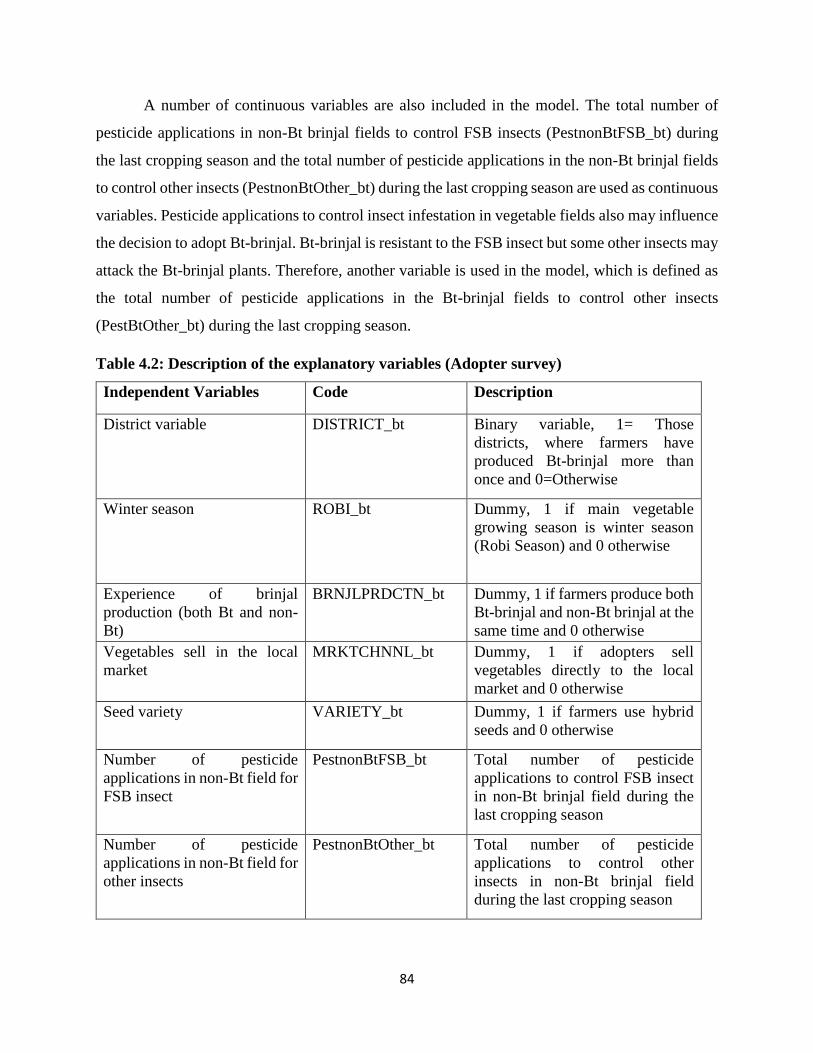
84
A number of continuous variables are also included in the model. The total number of
pesticide applications in non-Bt brinjal fields to control FSB insects (PestnonBtFSB_bt) during
the last cropping season and the total number of pesticide applications in the non-Bt brinjal fields
to control other insects (PestnonBtOther_bt) during the last cropping season are used as continuous
variables. Pesticide applications to control insect infestation in vegetable fields also may influence
the decision to adopt Bt-brinjal. Bt-brinjal is resistant to the FSB insect but some other insects may
attack the Bt-brinjal plants. Therefore, another variable is used in the model, which is defined as
the total number of pesticide applications in the Bt-brinjal fields to control other insects
(PestBtOther_bt) during the last cropping season.
Table 4.2: Description of the explanatory variables (Adopter survey)
Independent Variables Code Description
District variable DISTRICT_bt Binary variable, 1= Those
districts, where farmers have
produced Bt-brinjal more than
once and 0=Otherwise
Winter season ROBI_bt Dummy, 1 if main vegetable
growing season is winter season
(Robi Season) and 0 otherwise
Experience of brinjal
production (both Bt and non-
Bt)
BRNJLPRDCTN_bt Dummy, 1 if farmers produce both
Bt-brinjal and non-Bt brinjal at the
same time and 0 otherwise
Vegetables sell in the local
market
MRKTCHNNL_bt Dummy, 1 if adopters sell
vegetables directly to the local
market and 0 otherwise
Seed variety VARIETY_bt Dummy, 1 if farmers use hybrid
seeds and 0 otherwise
Number of pesticide
applications in non-Bt field for
FSB insect
PestnonBtFSB_bt Total number of pesticide
applications to control FSB insect
in non-Bt brinjal field during the
last cropping season
Number of pesticide
applications in non-Bt field for
other insects
PestnonBtOther_bt Total number of pesticide
applications to control other
insects in non-Bt brinjal field
during the last cropping season

85
Number of pesticide
applications in Bt-brinjal field
for other insects
PestBtOther_bt Total number of pesticide
applications to control other
insects in Bt-brinjal field during
the last cropping season
The yield of non-Bt brinjal YieldnonBt_bt Marketable yield of non-Bt brinjal
during the last cropping season
(Kg/Decimal)
The yield of Bt-brinjal YieldBt_bt Marketable yield of Bt-brinjal
during the last cropping season
(Kg/Decimal)
Yield difference Yielddifference_bt Yield difference from yield of Bt-
brinjal to yield of non-Bt brinjal
Knowledge of Bt-brinjal Knowledge_bt Categorical variable (1= not at all
knowledgeable about Bt-brinjal +
slightly knowledgeable, 2=
somewhat knowledgeable, 3=
moderately knowledgeable +
highly knowledgeable)
Respondent’s age AGE_bt Respondent’s age in years
Total farm land area Farmsize_bt Total amount of land (owned farm
land and rented land)
Education Education_bt Categorical variable (1=no
schooling, 2=Primary,
3=secondary, 4=college,
5=university and 6=other)
Offfarm income Offfarm_bt Dummy, 1 if farmers have off-
farm income and 0 otherwise
Yield is an important factor to analyze the willingness to adopt a new crop variety. Thus,
the yield of non-Bt brinjal (YieldnonBt_bt), the yield of Bt-brinjal (YieldBt_bt), the yield
difference between the yield of Bt-brinjal and yield of non-Bt brinjal (Yielddifference_bt) are also
used as continuous variables in the model for the adopter survey. Yield difference was calculated
as the marketable yield of Bt-brinjal minus marketable yield of non-Bt brinjal for each respondent.
Descriptive analysis from chapter 3 shows that only 48 respondents from the total 64 adopters
produced both Bt-brinjal and non-Bt brinjal in the last cropping season. The respondents who
produced Bt-brinjal only in the last season, reported the data for regular brinjal production from
their previous cultivation of non-Bt brinjal.
86
Kolady and Lesser (2006) stated that prior knowledge of Bt-technology has significant
impact on the adoption of Bt-technology. This study used a knowledge variable to see the effects
of knowledge about Bt-brinjal on the adoption of Bt-brinjal in Bangladesh. A categorical
independent variable, knowledge about Bt-brinjal (KNOWLEDGE_bt) is also used in the model.
The farming practice, demographic and other contextual characteristics of farmers may differ
significantly from each other (Kolady and Lesser, 2006). The variables included in the model were
selected based on the technology adoption theories. A number of socio-demographic control
variables are also included in the model including, the age of the adopters (AGE_bt), education
level (Education_bt), total land area including own farm land and rented land (Farmsize_bt) and
whether the respondent had off-farm income (OFFFarm_bt).
4.3.2 Model Specification (Adopter Survey)
A model specification check is used to choose the best model among 3 models for the
adopter survey data. The three models (A, B, C) were run using several explanatory variables (see
Table 4.3).
Let us consider, model A and model B, where the yield of Bt-brinjal (YieldBt_bt) and the
yield of non-Bt Brinjal (YieldnonBt_bt) are included in model A as two separate variables, while
the difference between these two variables (Yielddifference_bt) is included in model B. Results
are very similar in both models. However, model A (Pseudo R2=0.43) has a better goodness of fit
than model B (Pseudo R2=0.38). In model A, the coefficient for YieldBt_bt has a negative value
but is significant for reason 4 (Others), which means if the yield of Bt-brinjal increases, adopters
are less likely to pick reason 4 (Others) than the reference outcome (Reason 2: Bt-brinjal requires
a fewer number of pesticide applications than non-Bt brinjal) as their primary reason for being
willing to adopt Bt-brinjal. These adopters are willing to adopt Bt-brinjal because it needs fewer
pesticide applications than non-Bt brinjal. A new variable Yielddifference is used in model B but
it is not significant. Thus, model A is the preferred model compared to model B.
Moving from model A to model C, the variable, BRNJLPRDCTN_bt was dropped in
model C because it was not significant in model A and instead three other variables
(Yielddifference_bt, MRKTCHNNL_bt, VARIETY_bt) were included in model C. Explanatory
variables included in model C can explain 40% of the variation in the dependent variable.
VARIETY_bt is not significant at all in model C but Yielddifference_bt and MRKTCHNNL_bt
87
are significant for reason 3 (higher marketable yields) in model C. All three models use the same
number of observations. This study first avoids model B because it only can explain 38% of the
variations of the dependent variable while the other two models have a better goodness of fit.8
Now, comparing model A and model C, both models have a better goodness of fit and use the
same number of independent variables. Finally taking into account the expectation from this study,
model C is selected to interpret the results of the adopter survey since it offers more useful insights
into the factors inspiring adopter’s willingness to adopt Bt-brinjal. Interpretations are provided in
the next section where marginal effects are calculated.
8 McFadden’s R2 were also calculated to compare the models and it provides comparable goodness of fit for every model.

88
Table 4.3: Model specification: Adopter survey results9
Variable Reason 1: Bt-brinjal has less
Fruit and Shoot Borer (FSB)
insect infestations.
Reason 3: Marketable yield is
more than non-Bt brinjal
Reason 4: Others
Model
A
Model
B
Model C Model A Model B Model C Model A Model
B
Model C
DISTRICT_bt 0.947
(1.08)
.867
(1.00)
0.342
(1.01)
2.624
(1.33)
**
2.501
(1.32)
*
1.754
(1.32)
7.530
(4.29)
*
5.432
(3.00)
*
5.776
(3.75)
ROBI_bt 0.697
(1.24)
0.973
(1.15)
1.238
(1.24)
2.854
(1.47)
*
2.999
(1.43)
**
3.330
(1.61)
**
0.227
(2.83)
0.230
(2.24)
0.332
(2.56)
BRNJLPRDCTN_bt -2.313
(2.70)
-2.159
(1.85)
NA 0.916
(3.05)
1.344
(2.30)
NA -3.399
(5.65)
-4.073
(4.10)
NA
MRKTCHNNL_bt NA NA -1.436
(1.15)
NA NA -2.828
(1.42)
**
NA NA -1.538
(1.74)
VARIETY_bt NA NA -0.522
(1.25)
NA NA 1.770
(1.97)
NA NA 3.471
(3.27)
PestnonBtFSB_bt -0.034
(0.03)
-0.025
(0.02)
-0.050
(0.02)
**
-0.085
(0.04)
**
-0.078
(0.03)
**
-0.071
(0.03)
**
-0.176
(0.13)
-0.131
(0.10)
-0.162
(0.10)
PestnonBtOther_bt 0.178
(0.09)
*
0.155
(0.09)
0.156
()0.10
0.070
(0.12)
0.051
(0.12)
0.102
(0.12)
0.354
(0.29)
0.239
(0.22)
0.048
(0.19)
PestBtOther_bt 0.042
(0.11)
-0.021
(0.09)
-0.004
(0.08)
0.282
(0.13)
**
0.241
(0.11)
**
0.252
(0.11)
**
0.575
(0.28)
**
0.385
(0.19)
**
0.515
(0.28)
*
9 The base outcome category is reason 2: Bt-brinjal requires fewer pesticide applications than non-Bt brinjal.

89
YieldnonBt_bt -0.015
(0.01)
NA NA -0.001
(0.01)
NA NA 0.008
(0.03)
NA NA
YieldBt_bt -0.019
(0.01)
NA NA -0.021
(0.01)
NA NA -0.132
(0.07)
*
NA NA
Yielddifference_bt NA -0.004
(0.006)
-0.002
(0.006)
NA -0.009
(0.008)
-0.015
(0.009)
*
NA -0.033
(0.02)
-0.016
(0.01)
Knowledge_bt -1.37
(1.05)
-1.156
(0.92)
-1.194
(0.89)
-1.515
(1.20)
-1.341
(1.06)
-1.429
(1.15)
-5.170
(3.00)
*
-4.515
(2.12)
**
-4.853
(2.33)
**
AGE_bt 0.036
(0.04)
0.018
(0.04)
0.048
(0.042)
0.114
(0.06)
*
0.102
(0.05
)*
0.150
(0.06)
**
0.086
(0.08)
0.020
(0.07)
0.078
(0.07)
Farmsize_bt 0.001
(0.002)
0.001
(0.002)
0.001
(0.002)
0.0001
(0.003)
0.0002
(0.002)
-0.001
(0.003)
-0.009
(0.01)
-0.005
(0.008)
-0.004
(0.009)
Offfarm_bt 0.928
(1.27)
0.248
(1.13)
0.440
(1.07)
3.846
(1.61)
**
3.432
(1.52)
**
3.776
(1.60)
**
7.281
(4.37)
*
3.222
(2.46)
5.160
(2.45)
**
Intercepts 5.178
(5.12)
3.569
(3.80)
2.635
(3.97)
-3.809
(6.18)
-5.351
(5.15)
-6.309
(5.37)
4.707
(7.71)
4.817
(6.68)
-3.092
(8.09)
Log likelihood -43.05 -47.53 -45.86
Pseudo R2 0.43 0.38 0.40
McFadden’s R2 0.43 0.38 0.400
Maximum Likelihood R2 0.671 0.619 0.639
Count R2 0.483 0.467 0.450
AIC 3.169 3.184 3.262
BIC 53.362 45.936 58.957
Note: * indicates significance at 10%, ** indicates significance at 5% and standard errors are in the parentheses

90
4.3.3 Interpretation of Results (Adopter Survey)
Table 4.4 presents the estimated results from the multinomial logit model based model C
(see Table 4.3). These results provide insights into the direction of the relationship between the
choice category and the explanatory variables. Farming practices are found to be correlated with
the adoption of a new technology. Krishna and Qaim (2007) stated that the more the expenditures
on chemical pesticide are saved due to Bt-technology, the higher the probability of willingness to
adopt Bt-technology. The coefficient for PestnonBtFSB_bt, which is the total number of pesticide
applications in the non-Bt brinjal fields to control FSB insects, is significant and negative, when
respondents indicated less FSB insect infestation (reason 1) as their primary motivation for
willingness to adopt, as well as higher marketable yields (Reason 3) and it is not significant for
other adoption motivations. This means that for a one unit increase in the number of pesticide
applications to control FSB insects in the non-Bt brinjal fields, adopters are less likely to pick
reason 1 (less FSB insect infestation) and reason 3 (higher marketable yields) as their main reason
for being willing to adopt Bt-brinjal in the next cropping season relative to the base outcome ‘fewer
pesticide applications’.10 Bt-brinjal is resistant to the FSB insect and substitutes for pesticide
applications. Therefore, the farmers who spray more pesticides to control FSB insects, are more
likely to adopt Bt-brinjal. The total number of pesticide applications to control insects other than
the FSB insects in Bt-brinjal fields, (PestBtOther_bt) has a positive and significant effect, meaning
that for a single time increase in the number of pesticide applications to control other pests adopters
are more likely to pick reason 3: higher marketable yields and reason 4 (Others) to support their
willingness to adopt Bt-brinjal. Bt-brinjal needs more care than non-Bt brinjal because it gets
infested with other insects (not FSB) very easily and weather sensitive. During data collection,
many adopters claimed that a disease, called wilting has been becoming a major problem in Bt-
brinjal fields.
10 The size of the coefficients is discussed in the next section using marginal effects.
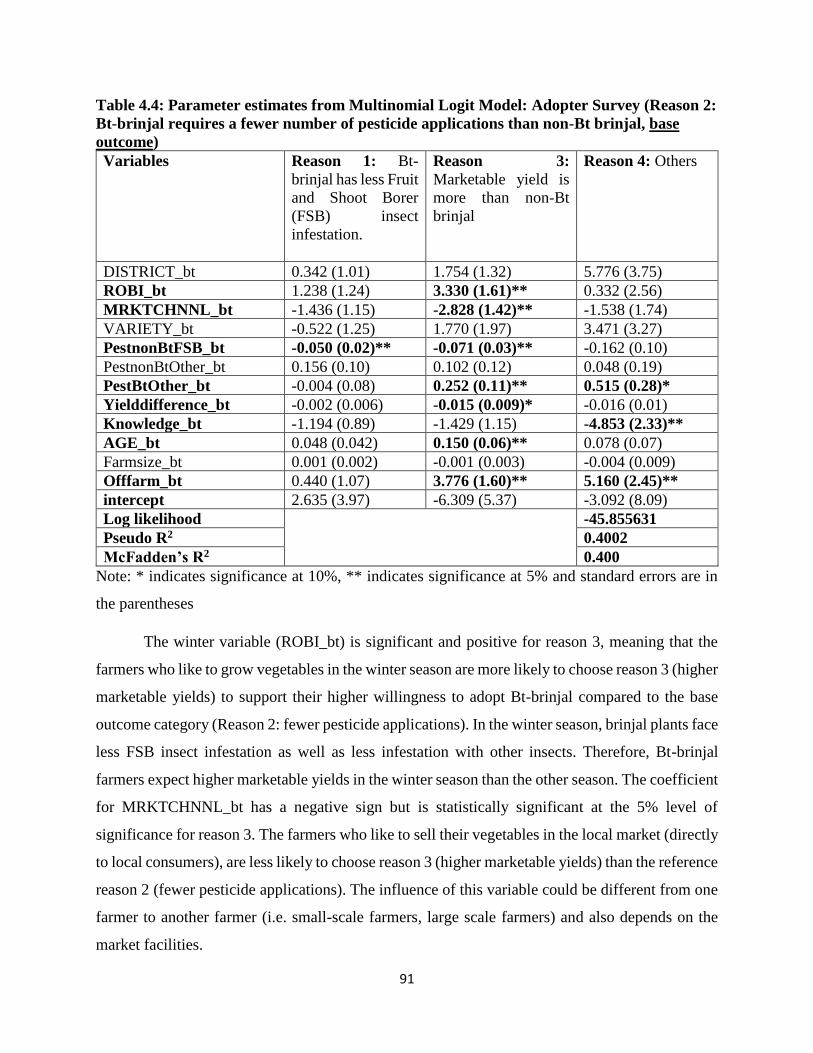
91
Table 4.4: Parameter estimates from Multinomial Logit Model: Adopter Survey (Reason 2:
Bt-brinjal requires a fewer number of pesticide applications than non-Bt brinjal, base
outcome)
Variables Reason 1: Bt-
brinjal has less Fruit
and Shoot Borer
(FSB) insect
infestation.
Reason 3:
Marketable yield is
more than non-Bt
brinjal
Reason 4: Others
DISTRICT_bt 0.342 (1.01) 1.754 (1.32) 5.776 (3.75)
ROBI_bt 1.238 (1.24) 3.330 (1.61)** 0.332 (2.56)
MRKTCHNNL_bt -1.436 (1.15) -2.828 (1.42)** -1.538 (1.74)
VARIETY_bt -0.522 (1.25) 1.770 (1.97) 3.471 (3.27)
PestnonBtFSB_bt -0.050 (0.02)** -0.071 (0.03)** -0.162 (0.10)
PestnonBtOther_bt 0.156 (0.10) 0.102 (0.12) 0.048 (0.19)
PestBtOther_bt -0.004 (0.08) 0.252 (0.11)** 0.515 (0.28)*
Yielddifference_bt -0.002 (0.006) -0.015 (0.009)* -0.016 (0.01)
Knowledge_bt -1.194 (0.89) -1.429 (1.15) -4.853 (2.33)**
AGE_bt 0.048 (0.042) 0.150 (0.06)** 0.078 (0.07)
Farmsize_bt 0.001 (0.002) -0.001 (0.003) -0.004 (0.009)
Offfarm_bt 0.440 (1.07) 3.776 (1.60)** 5.160 (2.45)**
intercept 2.635 (3.97) -6.309 (5.37) -3.092 (8.09)
Log likelihood -45.855631
Pseudo R2 0.4002
McFadden’s R2 0.400
Note: * indicates significance at 10%, ** indicates significance at 5% and standard errors are in
the parentheses
The winter variable (ROBI_bt) is significant and positive for reason 3, meaning that the
farmers who like to grow vegetables in the winter season are more likely to choose reason 3 (higher
marketable yields) to support their higher willingness to adopt Bt-brinjal compared to the base
outcome category (Reason 2: fewer pesticide applications). In the winter season, brinjal plants face
less FSB insect infestation as well as less infestation with other insects. Therefore, Bt-brinjal
farmers expect higher marketable yields in the winter season than the other season. The coefficient
for MRKTCHNNL_bt has a negative sign but is statistically significant at the 5% level of
significance for reason 3. The farmers who like to sell their vegetables in the local market (directly
to local consumers), are less likely to choose reason 3 (higher marketable yields) than the reference
reason 2 (fewer pesticide applications). The influence of this variable could be different from one
farmer to another farmer (i.e. small-scale farmers, large scale farmers) and also depends on the
market facilities.

92
Along with the other variables, a number of sociodemographic factors such as
Knowledge_bt, AGE_bt, Farmsize_bt and Offfarm_bt were also included in the model. Bt-brinjal
has been produced in Bangladesh since 2014. Therefore, the knowledge variable could positively
or negatively influence the adopters’ willingness to adopt Bt-brinjal. Most of the adopters claim
themselves as somewhat knowledgeable about Bt-brinjal. Knowledge_bt is significant and
negative for reason 4, meaning that as the level of knowledge about Bt brinjal increases, adopters
are less likely to pick reason 4 (Others) rather than reason 2 (fewer pesticide applications). Thus,
the knowledgeable adopters recognize that an important advantage of Bt-brinjal is fewer pesticide
applications. The age of the farmer (AGE_bt) has a positive and significant effect for reason 3
(higher marketable yields) relative to reason 2 (fewer pesticide applications), suggesting that older
farmers place more emphasis on the ability to receive higher marketable yields from Bt-brinjal
relative to younger farmers. Adopters who have off-farm income, are more likely to pick reason 3
(higher marketable yields) and 4 (Other) compared to reason 2 (fewer pesticide applications).
4.3.4 Marginal Effects (Adopter Survey)
4.3.4.1 The Marginal Effect of Winter Variable (ROBI_bt)
Marginal effects are calculated and presented in Table 4.5. The marginal effect of the
winter season (ROBI_bt) is significant for reason 3 (higher marketable yields) (see Table 4.5). The
interpretation of the marginal effect of the winter season variable is that for adopters who tend to
grow vegetables in the winter season, their probability of choosing reason 3 (higher marketable
yields) will increase by 39.90% compared to the base outcome category (fewer pesticide
applications). A discussed previously the winter season is one of the major seasons for vegetable
production in Bangladesh and there is less insect infestation in the vegetable crops during the
winter season. However, Kolady and Lesser (2006) found that the kharif season (summer season)
is significant for the early adoption of Bt-brinjal.
4.3.4.2 The Marginal Effect of Number of Pesticide Applications in the Bt-Brinjal Fields to
Control Other Insects (PestBtOthers_bt)
Bt-brinjal is resistant to the fruit and shoot borer insect but the FSB insect is not the only
insect that damages the brinjal fruits. Other insects that affect the brinjal fruits include beetles,
leaf-rollers and brinjal lacewings. The fruit and shoot borer insect is one of the dangerous insects
because it infests the brinjal fruit from the inside and thus it damages 80% of the edible portion of
93
a brinjal fruits. However, Bt-brinjal only provides resistance to the FSB insects and farmers may
still need to use pesticides to control other pests. This study finds that the marginal effect of
PestBtOther_bt is significant for reason 1 (fewer FSB insect infestations) and reason 3 (higher
marketable yields) (see Table 4.5). The marginal effects suggest that for every additional
application of pesticides to control other insects, adopters are 4.39% more likely to pick reason 3
(higher marketable yields) and 3.76% less likely to pick reason 1 (less FSB insect infestations) as
their main reason to adopt Bt-brinjal in the following season.
4.3.4.3 The Marginal Effect of Difference between Bt-brinjal and Non-Bt Brinjal Yields
(Yielddifference_bt)
As stated earlier, improved yield is an important factor in the adoption of a GM crop.
Adopter farmers are producing both Bt-brinjal and non-Bt brinjal at the same time in their fields.
Yield differences between Bt-brinjal and non-Bt brinjal may influence the decision to adopt Bt-
brinjal. Results showed that the marginal effect of the yield difference is negative and significant
for reason 3 (higher marketable yields). The size of the effect, however, is fairly small. If the yield
difference between the yield of Bt-brinjal and yield of non-Bt brinjal for a farmer increases by one
unit, the adopter farmers are 0.23% less likely to pick higher marketable yields as the main reason
for being willing to adopt Bt-brinjal relative to fewer pesticide applications as the main reason.
4.3.4.4 The Marginal Effect of Socio-demographic Factors
Kolady and Lesser (2006) found that there is a significant difference in the
sociodemographic characteristics of the early adopters and late adopters of Bt-brinjal. Marginal
effects show that age of adopters has a positive and significant influence on reason 3 (higher
marketable yields) as the motivation to adopt Bt-brinjal. As the respondent’s age increases by one
year they are 1.91% more likely to pick reason 3 (higher marketable yields) as their main reason
for their willingness to adopt Bt-brinjal. Off-farm income also has a positive and significant effect
on reason 3 (higher marketable yields) as the primary motivations for Bt-brinjal adoption. The
effect is relatively large: if adopter farmers have the off-farm income they are 58.73% more likely
to pick reason 3 (higher marketable yields) as their main reason for being willing to adopt Bt-
brinjal in the next cropping season.

94
Table 4.5: Marginal effects: Adopter survey
Variables Reason 1: Bt-brinjal
has less Fruit and
Shoot Borer (FSB)
insect infestation.
Reason 3:
Marketable yield is
more than non-Bt
brinjal
Reason 4: Others
DISTRICT_bt -0.179 (0.178) 0.2515 (0.169) 0.0112 (0.028)
ROBI_bt -0.189(0.239) 0.3990 (0.233)* -0.0026 (0.006)
MRKTCHNNL_bt 0.068 (0.206) -0.2795 (0.179) 0.00007 (0.003)
VARIETY_bt -0.377 (0.270) 0.3786 (0.273) 0.0076 (0.018)
PestnonBtFSB_bt -0.0013 (0.005) -0.0049 (0.005) -0.00025 (0.000)
PestnonBtOther_bt 0.0213 (0.015) -0.0046 (0.012) -0.00016 (0.000)
PestBtOther_bt -0.0376 (0.017)** 0.0439 (0.016)** 0.00103 (0.002)
Yielddifference_bt 0.0016 (0.001) -0.0023 (0.001)* -0.000025 (0.000)
Knowledge_bt -0.0643 (0.159) -0.0744 (0.149) -0.0084 (0.021)
AGE_bt -0.01049 (0.008) 0.01914 (0.007)** 0.00031 (0.000)
Farmsize_bt 0.00053 (0.0003) -0.00042 (0.0003) -0.000011 (0.000)
Offfarm_bt -0.4439 (0.229) 0.5873 (0.226)** 0.00902 (0.024)
Note: * indicates significance at 10%, ** indicates significance at 5% and standard errors are in
the parentheses
4.4 Multinomial Logit Model: Non-adopter Survey
4.4.1 Description of the Dependent and Explanatory Variables: Non-adopter Survey
For the non-adopter survey data, a MNL model was also used with Y as the dependent
variable where, Y= choice by non-adopters of the most important reason for willingness to adopt
Bt-brinjal. The non-adopters are those farmers who produce brinjal in their fields but do not have
experience of producing Bt-brinjal. Table 4.6 represents the description of the dependent variable
and the response categories for the dependent variable, while Table 4.7 represents the description
of the explanatory variables included in the non-adopters model. Four important response
categories were used for the dependent variable, including: Reason 1: Bt-brinjal requires fewer
pesticide applications than non-Bt brinjal (base outcome response category); Reason 2: Marketable
yield is more than non-Bt brinjal; Reason 3: Neighbour farmers produced Bt-brinjal recently and
so, the non-adopters are interested to produce Bt-brinjal in the next cropping season and Reason
4: Other reasons. This model used the same base outcome response category to compare the results
of the adopters and non-adopters survey, although reason 3 differs between the two models given
the different adoption context. Several explanatory variables were also included in the model.
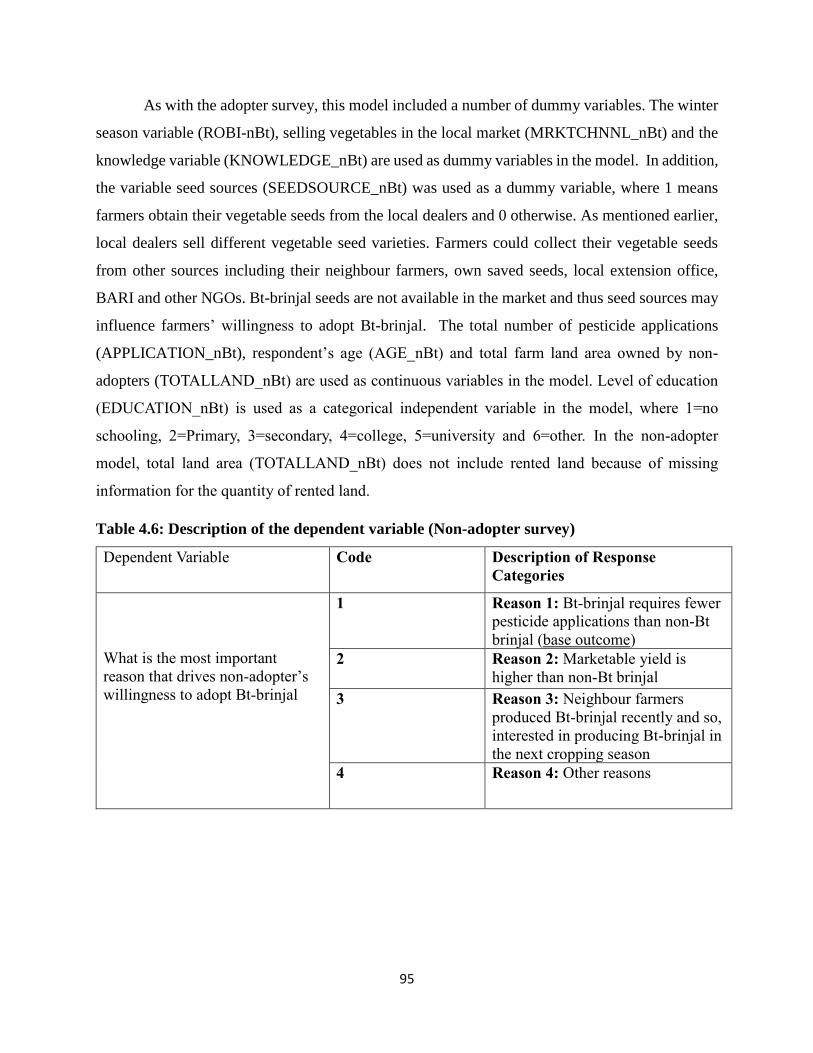
95
As with the adopter survey, this model included a number of dummy variables. The winter
season variable (ROBI-nBt), selling vegetables in the local market (MRKTCHNNL_nBt) and the
knowledge variable (KNOWLEDGE_nBt) are used as dummy variables in the model. In addition,
the variable seed sources (SEEDSOURCE_nBt) was used as a dummy variable, where 1 means
farmers obtain their vegetable seeds from the local dealers and 0 otherwise. As mentioned earlier,
local dealers sell different vegetable seed varieties. Farmers could collect their vegetable seeds
from other sources including their neighbour farmers, own saved seeds, local extension office,
BARI and other NGOs. Bt-brinjal seeds are not available in the market and thus seed sources may
influence farmers’ willingness to adopt Bt-brinjal. The total number of pesticide applications
(APPLICATION_nBt), respondent’s age (AGE_nBt) and total farm land area owned by non-
adopters (TOTALLAND_nBt) are used as continuous variables in the model. Level of education
(EDUCATION_nBt) is used as a categorical independent variable in the model, where 1=no
schooling, 2=Primary, 3=secondary, 4=college, 5=university and 6=other. In the non-adopter
model, total land area (TOTALLAND_nBt) does not include rented land because of missing
information for the quantity of rented land.
Table 4.6: Description of the dependent variable (Non-adopter survey)
Dependent Variable Code Description of Response
Categories
What is the most important
reason that drives non-adopter’s
willingness to adopt Bt-brinjal
1 Reason 1: Bt-brinjal requires fewer
pesticide applications than non-Bt
brinjal (base outcome)
2 Reason 2: Marketable yield is
higher than non-Bt brinjal
3 Reason 3: Neighbour farmers
produced Bt-brinjal recently and so,
interested in producing Bt-brinjal in
the next cropping season
4 Reason 4: Other reasons
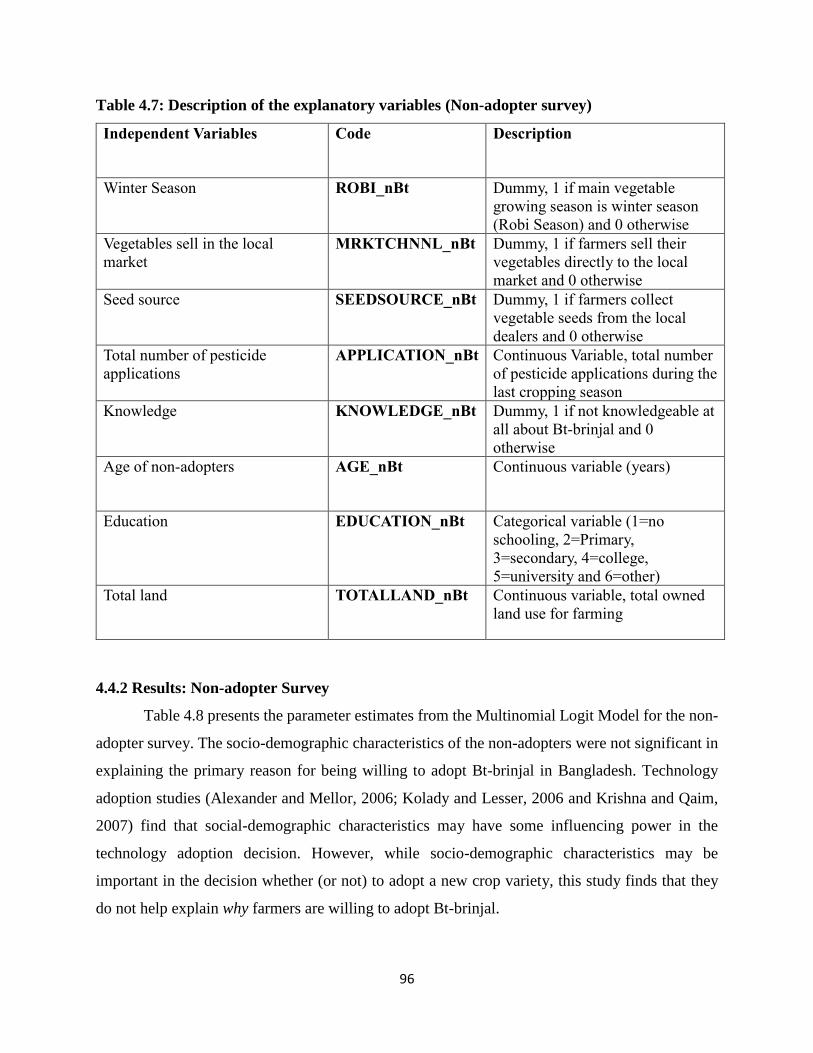
96
Table 4.7: Description of the explanatory variables (Non-adopter survey)
Independent Variables Code Description
Winter Season ROBI_nBt Dummy, 1 if main vegetable
growing season is winter season
(Robi Season) and 0 otherwise
Vegetables sell in the local
market
MRKTCHNNL_nBt Dummy, 1 if farmers sell their
vegetables directly to the local
market and 0 otherwise
Seed source SEEDSOURCE_nBt Dummy, 1 if farmers collect
vegetable seeds from the local
dealers and 0 otherwise
Total number of pesticide
applications
APPLICATION_nBt Continuous Variable, total number
of pesticide applications during the
last cropping season
Knowledge KNOWLEDGE_nBt Dummy, 1 if not knowledgeable at
all about Bt-brinjal and 0
otherwise
Age of non-adopters AGE_nBt Continuous variable (years)
Education EDUCATION_nBt Categorical variable (1=no
schooling, 2=Primary,
3=secondary, 4=college,
5=university and 6=other)
Total land TOTALLAND_nBt Continuous variable, total owned
land use for farming
4.4.2 Results: Non-adopter Survey
Table 4.8 presents the parameter estimates from the Multinomial Logit Model for the non-
adopter survey. The socio-demographic characteristics of the non-adopters were not significant in
explaining the primary reason for being willing to adopt Bt-brinjal in Bangladesh. Technology
adoption studies (Alexander and Mellor, 2006; Kolady and Lesser, 2006 and Krishna and Qaim,
2007) find that social-demographic characteristics may have some influencing power in the
technology adoption decision. However, while socio-demographic characteristics may be
important in the decision whether (or not) to adopt a new crop variety, this study finds that they
do not help explain why farmers are willing to adopt Bt-brinjal.
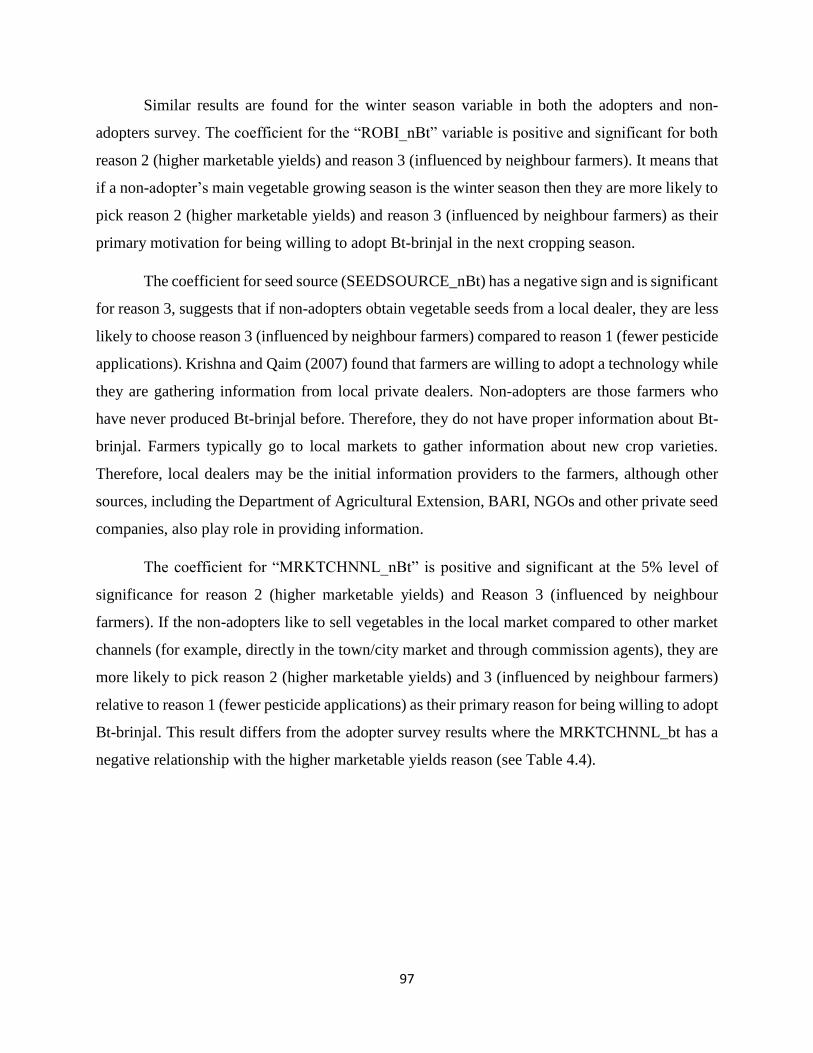
97
Similar results are found for the winter season variable in both the adopters and non-
adopters survey. The coefficient for the “ROBI_nBt” variable is positive and significant for both
reason 2 (higher marketable yields) and reason 3 (influenced by neighbour farmers). It means that
if a non-adopter’s main vegetable growing season is the winter season then they are more likely to
pick reason 2 (higher marketable yields) and reason 3 (influenced by neighbour farmers) as their
primary motivation for being willing to adopt Bt-brinjal in the next cropping season.
The coefficient for seed source (SEEDSOURCE_nBt) has a negative sign and is significant
for reason 3, suggests that if non-adopters obtain vegetable seeds from a local dealer, they are less
likely to choose reason 3 (influenced by neighbour farmers) compared to reason 1 (fewer pesticide
applications). Krishna and Qaim (2007) found that farmers are willing to adopt a technology while
they are gathering information from local private dealers. Non-adopters are those farmers who
have never produced Bt-brinjal before. Therefore, they do not have proper information about Bt-
brinjal. Farmers typically go to local markets to gather information about new crop varieties.
Therefore, local dealers may be the initial information providers to the farmers, although other
sources, including the Department of Agricultural Extension, BARI, NGOs and other private seed
companies, also play role in providing information.
The coefficient for “MRKTCHNNL_nBt” is positive and significant at the 5% level of
significance for reason 2 (higher marketable yields) and Reason 3 (influenced by neighbour
farmers). If the non-adopters like to sell vegetables in the local market compared to other market
channels (for example, directly in the town/city market and through commission agents), they are
more likely to pick reason 2 (higher marketable yields) and 3 (influenced by neighbour farmers)
relative to reason 1 (fewer pesticide applications) as their primary reason for being willing to adopt
Bt-brinjal. This result differs from the adopter survey results where the MRKTCHNNL_bt has a
negative relationship with the higher marketable yields reason (see Table 4.4).
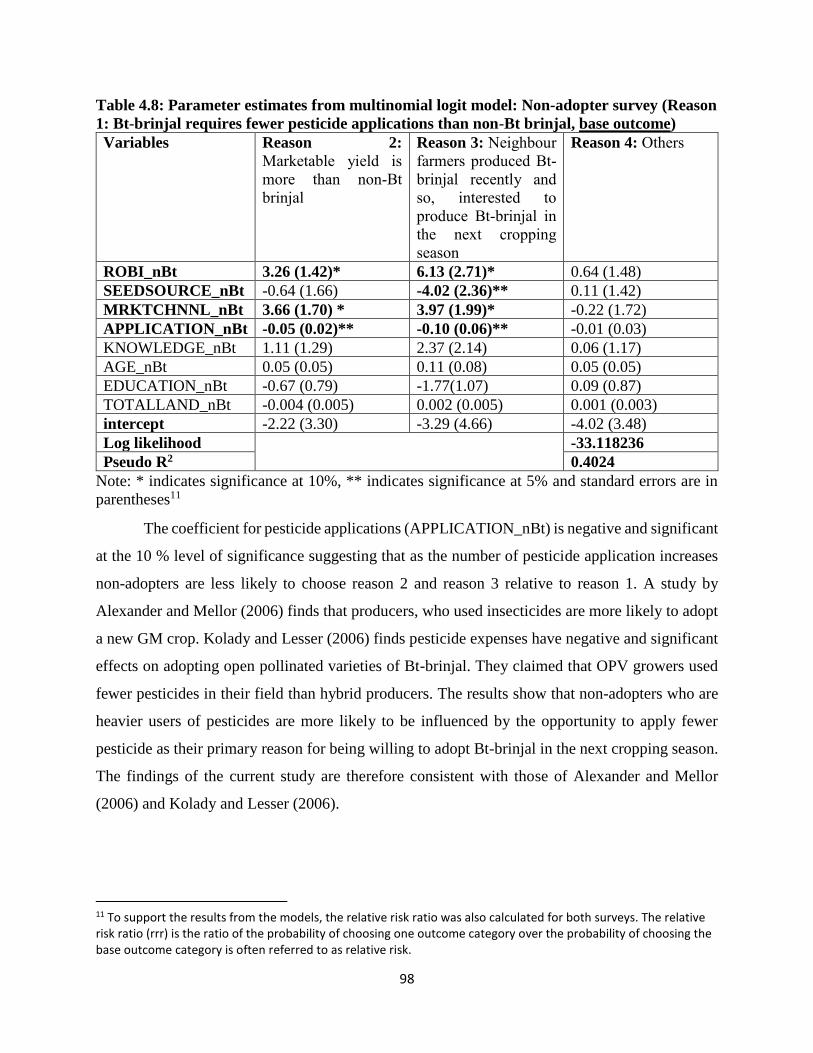
98
Table 4.8: Parameter estimates from multinomial logit model: Non-adopter survey (Reason
1: Bt-brinjal requires fewer pesticide applications than non-Bt brinjal, base outcome)
Variables Reason 2:
Marketable yield is
more than non-Bt
brinjal
Reason 3: Neighbour
farmers produced Bt-
brinjal recently and
so, interested to
produce Bt-brinjal in
the next cropping
season
Reason 4: Others
ROBI_nBt 3.26 (1.42)* 6.13 (2.71)* 0.64 (1.48)
SEEDSOURCE_nBt -0.64 (1.66) -4.02 (2.36)** 0.11 (1.42)
MRKTCHNNL_nBt 3.66 (1.70) * 3.97 (1.99)* -0.22 (1.72)
APPLICATION_nBt -0.05 (0.02)** -0.10 (0.06)** -0.01 (0.03)
KNOWLEDGE_nBt 1.11 (1.29) 2.37 (2.14) 0.06 (1.17)
AGE_nBt 0.05 (0.05) 0.11 (0.08) 0.05 (0.05)
EDUCATION_nBt -0.67 (0.79) -1.77(1.07) 0.09 (0.87)
TOTALLAND_nBt -0.004 (0.005) 0.002 (0.005) 0.001 (0.003)
intercept -2.22 (3.30) -3.29 (4.66) -4.02 (3.48)
Log likelihood -33.118236
Pseudo R2 0.4024
Note: * indicates significance at 10%, ** indicates significance at 5% and standard errors are in
parentheses11
The coefficient for pesticide applications (APPLICATION_nBt) is negative and significant
at the 10 % level of significance suggesting that as the number of pesticide application increases
non-adopters are less likely to choose reason 2 and reason 3 relative to reason 1. A study by
Alexander and Mellor (2006) finds that producers, who used insecticides are more likely to adopt
a new GM crop. Kolady and Lesser (2006) finds pesticide expenses have negative and significant
effects on adopting open pollinated varieties of Bt-brinjal. They claimed that OPV growers used
fewer pesticides in their field than hybrid producers. The results show that non-adopters who are
heavier users of pesticides are more likely to be influenced by the opportunity to apply fewer
pesticide as their primary reason for being willing to adopt Bt-brinjal in the next cropping season.
The findings of the current study are therefore consistent with those of Alexander and Mellor
(2006) and Kolady and Lesser (2006).
11 To support the results from the models, the relative risk ratio was also calculated for both surveys. The relative risk ratio (rrr) is the ratio of the probability of choosing one outcome category over the probability of choosing the base outcome category is often referred to as relative risk.
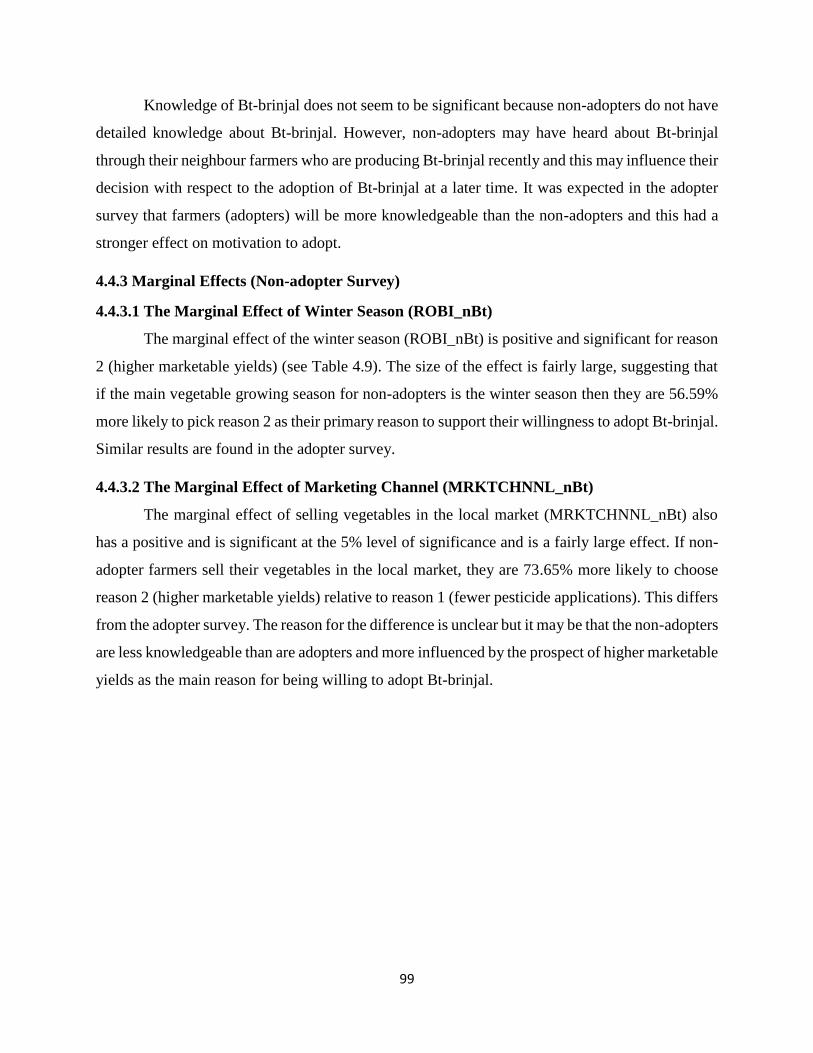
99
Knowledge of Bt-brinjal does not seem to be significant because non-adopters do not have
detailed knowledge about Bt-brinjal. However, non-adopters may have heard about Bt-brinjal
through their neighbour farmers who are producing Bt-brinjal recently and this may influence their
decision with respect to the adoption of Bt-brinjal at a later time. It was expected in the adopter
survey that farmers (adopters) will be more knowledgeable than the non-adopters and this had a
stronger effect on motivation to adopt.
4.4.3 Marginal Effects (Non-adopter Survey)
4.4.3.1 The Marginal Effect of Winter Season (ROBI_nBt)
The marginal effect of the winter season (ROBI_nBt) is positive and significant for reason
2 (higher marketable yields) (see Table 4.9). The size of the effect is fairly large, suggesting that
if the main vegetable growing season for non-adopters is the winter season then they are 56.59%
more likely to pick reason 2 as their primary reason to support their willingness to adopt Bt-brinjal.
Similar results are found in the adopter survey.
4.4.3.2 The Marginal Effect of Marketing Channel (MRKTCHNNL_nBt)
The marginal effect of selling vegetables in the local market (MRKTCHNNL_nBt) also
has a positive and is significant at the 5% level of significance and is a fairly large effect. If non-
adopter farmers sell their vegetables in the local market, they are 73.65% more likely to choose
reason 2 (higher marketable yields) relative to reason 1 (fewer pesticide applications). This differs
from the adopter survey. The reason for the difference is unclear but it may be that the non-adopters
are less knowledgeable than are adopters and more influenced by the prospect of higher marketable
yields as the main reason for being willing to adopt Bt-brinjal.
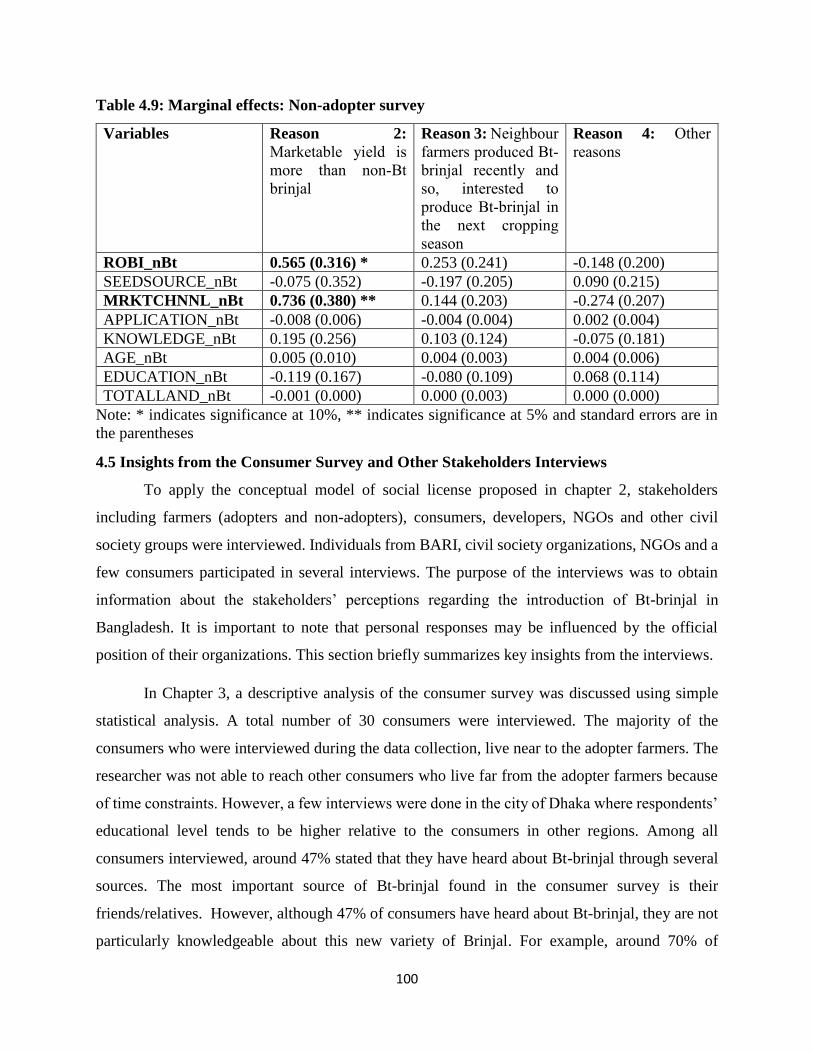
100
Table 4.9: Marginal effects: Non-adopter survey
Note: * indicates significance at 10%, ** indicates significance at 5% and standard errors are in
the parentheses
4.5 Insights from the Consumer Survey and Other Stakeholders Interviews
To apply the conceptual model of social license proposed in chapter 2, stakeholders
including farmers (adopters and non-adopters), consumers, developers, NGOs and other civil
society groups were interviewed. Individuals from BARI, civil society organizations, NGOs and a
few consumers participated in several interviews. The purpose of the interviews was to obtain
information about the stakeholders’ perceptions regarding the introduction of Bt-brinjal in
Bangladesh. It is important to note that personal responses may be influenced by the official
position of their organizations. This section briefly summarizes key insights from the interviews.
In Chapter 3, a descriptive analysis of the consumer survey was discussed using simple
statistical analysis. A total number of 30 consumers were interviewed. The majority of the
consumers who were interviewed during the data collection, live near to the adopter farmers. The
researcher was not able to reach other consumers who live far from the adopter farmers because
of time constraints. However, a few interviews were done in the city of Dhaka where respondents’
educational level tends to be higher relative to the consumers in other regions. Among all
consumers interviewed, around 47% stated that they have heard about Bt-brinjal through several
sources. The most important source of Bt-brinjal found in the consumer survey is their
friends/relatives. However, although 47% of consumers have heard about Bt-brinjal, they are not
particularly knowledgeable about this new variety of Brinjal. For example, around 70% of
Variables Reason 2:
Marketable yield is
more than non-Bt
brinjal
Reason 3: Neighbour
farmers produced Bt-
brinjal recently and
so, interested to
produce Bt-brinjal in
the next cropping
season
Reason 4: Other
reasons
ROBI_nBt 0.565 (0.316) * 0.253 (0.241) -0.148 (0.200)
SEEDSOURCE_nBt -0.075 (0.352) -0.197 (0.205) 0.090 (0.215)
MRKTCHNNL_nBt 0.736 (0.380) ** 0.144 (0.203) -0.274 (0.207)
APPLICATION_nBt -0.008 (0.006) -0.004 (0.004) 0.002 (0.004)
KNOWLEDGE_nBt 0.195 (0.256) 0.103 (0.124) -0.075 (0.181)
AGE_nBt 0.005 (0.010) 0.004 (0.003) 0.004 (0.006)
EDUCATION_nBt -0.119 (0.167) -0.080 (0.109) 0.068 (0.114)
TOTALLAND_nBt -0.001 (0.000) 0.000 (0.003) 0.000 (0.000)

101
consumers claimed that they are not knowledgeable about Bt-brinjal at all, while only 7% claim
themselves as moderately knowledgeable (see Chapter 3, Figure 3.32). While the consumers are
not knowledgeable about Bt-brinjal, a brief explanatory note was provided to them before asking
technology perceptions question (as explained in Chapter 3). Given the small sample size and
geographically limited scope of the consumer survey, it is not considered very representative in
terms of fully explaining consumer perceptions of Bt-brinjal in Bangladesh.
A few key points were covered in interviews with the representatives of relevant
institutions and individuals from NGOs and civil society groups. A question was asked to the
BARI representatives regarding how Bt-brinjal seed will be distributed to other farmers, who are
interested to produce Bt-brinjal in the near future? BARI representatives describe that they are still
producing Bt-seeds in their own research fields and in 2017 they shared Bt-seeds with the
Department of Agricultural Extension. The Department of Agricultural Extension has worked with
5000 farmers all over in Bangladesh in 2017. The DAE farmers produced Bt-brinjal for the first
time in 2017. They were not properly trained about the production process of Bt-brinjal and as a
result, they did not find sufficient results from the Bt-brinjal production. The BARI representatives
said that the DAE farmers need more training to Bt-brinjal to produce Bt-brinjal in their fields.
The Bangladesh Agricultural Development Corporation (BADC) is one of the largest seed
distributors in Bangladesh and BARI is going to share the Bt-seeds with the BADC in the near
future. Indeed, the BARI representatives are hoping that Bt-brinjal seeds will be fully available in
the market very soon.
As expected, stakeholders who have relationships with NGOs are more likely to be
negative about the GM technologies. González, et al. (2009) stated that most NGOs (at both
national and international levels) are the main opponents of the GM technology. In Bangladesh,
UBINIG is the one of the strongest opponents of Bt-brinjal. A phone interview with an individual
from UBINIG was held during the data collection period in Bangladesh. Another interview was
done with an individual, who works for a civil society organization. The information recorded
from these interviews is very similar. They both claim that Bt-brinjal is not good for human health
or the environment. The BARI and government of Bangladesh are the main supporters for the
adoption of Bt-brinjal in Bangladesh. The NGO representatives also claim that BARI is not
providing all necessary information to the farmers or to consumers.
102
The results from this study confirm that the perceptions of stakeholders about the
introduction of Bt-brinjal in Bangladesh are positive in general (with the exception of the NGOs
interviewed). The stakeholders (mostly farmers) are willing to accept Bt-brinjal because it provides
direct and tangible benefits to producers by controlling the FSB insect. Thus, non-adopter farmers
are also interested in producing Bt-brinjal for the first time. To apply the proposed conceptual
model of social license developed in chapter 2, the results suggest that Bt-brinjal currently has a
high level of social license in Bangladesh. The relatively high willingness to accept Bt-brinjal
among key stakeholders is influenced by tangible benefits from the crop experienced by adopters
and observed by non-adopters, creates a high level of social license for the adoption of Bt-brinjal
in Bangladesh.
4.6 Conclusions
This chapter presents the estimation methods and results for the adopter and non-adopter
surveys. First, it was explained that a probit model does not fit the data well since it requires the
use of a dichotomous dependent variable to analyze the willingness to adopt Bt-brinjal in
Bangladesh. According to the descriptive analysis, the data shows a very high stated willingness
to adopt Bt-brinjal among adopters and non-adopters (>90%), plus the “adopters” are part of a
technology transfer project rather than having adopted the technology within a pure market setting
(Bt-seeds are not available in the market). Thus, an alternative approach was needed and a
multinomial logit model (MNL) was used, where the dependent variable was used as a categorical
variable capturing the most important reason motivating an adopter, as well as a non-adopter, to
be willing to adopt Bt-brinjal in the next cropping season.
The base outcome category in the dependent variable was: Bt-brinjal requires fewer
pesticide applications than non-Bt brinjal. Both the adopter and non-adopter survey analysis used
the same base category response. Results from the adopter survey show that winter season
(ROBI_bt), number of pesticide application for other insects in Bt-brinjal fields (PestBtOther_bt),
adopters’ age (AGE_bt) and off-farm income (Offfarm_bt) are statistically significant and
positively related to reason 3 (higher marketable yields) compared to reference group (reason 2:
fewer pesticide applications) while, the non-adopter survey finds the equivalent results for winter
season (ROBI_nBt). Age of the non-adopters is not significant at all. The yield difference between
103
the yield of Bt-brinjal and yield of non-Bt brinjal (Yielddifference_bt) is also significant in the
adopter survey results.
Selling vegetables directly to the local market shows different results for the adopters and
non-adopter analysis. Adopters who sell vegetables directly to the local market are willing to adopt
Bt-brinjal primarily because it needs fewer pesticide applications than non-Bt brinjal, while, non-
adopters are willing to adopt Bt-brinjal primarily because it provides higher marketable yields than
non-Bt brinjal and neighbour farmers grew Bt-brinjal recently and so, non-adopters are interested
to grow the crop in the next season.
The last section of this chapter draws general conclusions for the role of various
stakeholder groups in establishing social license for the adoption of Bt-brinjal in Bangladesh. The
results from all surveys/interviews confirm that the stakeholders (most directly affected by Bt-
brinjal, especially farmers and consumers) have positive perceptions towards the introduction of
Bt-brinjal in Bangladesh while opponents remain within the NGO community. Therefore, the
positive perceptions towards Bt-brinjal among several stakeholders indicate that the adoption of
Bt-brinjal in Bangladesh has granted a strong social license.
104
Chapter 5 Summary and Conclusions
This fifth and final chapter summarizes the main research objectives and the major findings
from the previous chapters. Returning to the research question posed at the beginning of this study,
it is stated as: what are the main drivers of social license and who are the key stakeholders involved
in establishing social license for the adoption of Bt-brinjal in Bangladesh? A multinomial logit
model was estimated to examine the most important influence on, or reason for, willingness to
adopt Bt-brinjal (for both adopters and non-adopters). The consumer survey and other
stakeholders’ interviews were also discussed in chapter 4 and provide brief insights into
perceptions of Bt-brinjal by these other groups. Section 5.1 presents a summary of major research
findings with respect to the stakeholders’ attitudes towards and perceptions of Bt-brinjal and the
primary reason for a positive attitude towards the adoption of Bt-brinjal. Policy and research
implications derived from the major findings of this research are explored in section 5.2. Lastly,
limitations of this study pertaining to the research methodology are discussed and suggestions for
future research arising from this study are also made in section 5.3.
5.1 Summary of Major Research Findings
Based upon a comprehensive summary of literature on social license, technology adoption
and attitudes towards agricultural biotechnology, chapter 2 presented a conceptual model of social
license. To apply this conceptual model of social license in a developing country context, primary
data collection was carried out in Bangladesh. Bt-brinjal was approved in Bangladesh in 2013 and
currently more than 5000 Bangladeshi farmers are producing Bt-brinjal under the supervision of
BARI and the Department of Agricultural Extension. However, Bt-seeds are not available in the
market, Bt-brinjal fruits are sold in the market. Thus, Bt-brinjal is still in the phased–in
commercialization period because full commercialization of this new crop variety will occur once
Bt-brinjal seeds and fruits are available to farmers and consumers in a pure market setting.
One of the objectives of this study was to determine the major reason influencing
willingness to adopt and acceptance of Bt-brinjal in Bangladesh. The descriptive analysis of the
survey data was presented in chapters 3. The most obvious findings to emerge from the descriptive
analysis is that stakeholders especially farmers (adopters and non-adopters) and consumers are
willing to adopt Bt-brinjal in the near future. Several reasons were identified for the apparent strong
willingness to adopt Bt-brinjal. A multinomial logit model finds that the primary reason for a
105
positive willingness to adopt Bt-brinjal is that it needs fewer applications of chemical pesticides.
The potential factors that influence farmers to pick this reason vary from the adopter survey results
to the non-adopter survey results. The adopter analysis revealed that winter season (ROBI_bt)
variable predisposes farmers to choose improved marketable yield as the main reason for adoption.
Other factors influencing the adoption decision include the number of pesticide applications used
to control other pests in the Bt-brinjal field (PestBtOther_bt) and age of the adopters. The yield
difference between Bt-brinjal and non-Bt brinjal also affects the motivations for adoption Bt-
brinjal. Results of the non-adopter survey suggest that the winter season variable (ROBI_nBt) and
market channel variable (MRKTCHNNL_nBt) have significant effects on adoption aspirations.
Taking together, these results suggest that providing full information on the various potential
benefits from Bt-brinjal will be important in achieving social license, as different motivating
factors are likely to appeal to different farmers.
The findings from the consumer survey and other stakeholder interviews suggest that most
stakeholders perceived the introduction of Bt-brinjal positively. Only the interviews from the
NGOs and civil society groups suggests that a very small portion of the stakeholders perceived the
introduction of Bt-brinjal negatively. This research has revealed that different stakeholders may
appear to have different perceptions toward a new technology, again suggesting the need for a
multifaceted approach to information dissemination about this type of technology.
Like other developing country research, this study finds similar results in terms of a
willingness to adopt a new GM technology. James (2015) stated that in recent years, developing
countries are showing more interest to approve GM technologies because of its potential benefits
to farmers within those countries. The relative strong willingness to adopt/accept Bt-brinjal among
several stakeholder groups in Bangladesh suggests that there is a strong social license for the
adoption of Bt-brinjal.
5.2 Implications
The finding and conclusions to this chapter may assist stakeholders including farmers
(adopter/non-adopter farmers), consumers, developers and governmental regulators in
understanding the drivers for the acceptability of a GM crop in a developing country context. The
results of this study have a number of important policy implications for future practice.

106
This study finds that farmers are the one of the most important stakeholders in establishing
the social license for the adoption of a crop such as Bt-brinjal. The study finds that farmers are not
well trained or well informed about the technology outside of technology transfer projects. There
is, therefore, a definite need for proper training programs for the farmers to introduce them to this
new technology and to support the technology transfer process. The Bangladesh Agricultural
Research Institute (BARI) plays a central role in providing information to the adopters. Other
findings of this study are that non-adopters and consumers also do not have proper knowledge
about the Bt-brinjal. Therefore, the government and developer groups will need to play a central
role in providing accurate information about this technology to these groups.
Bt-brinjal is the first GM food crop in Bangladesh and it was commercialized in 2013.
There is a considerable research gap in terms of evaluating the socio-economic aspects of this
technology. The descriptive analysis of the survey data finds that biosafety rules and regulations
are an important component in establishing social license for a new crop such as Bt-brinjal.
Perceived importance of biosafety rules and regulations, and confidence in those rules and
regulations, may influence the adoption process. Therefore, there is a need to understand the extent
to which an adequate rules and regulations exist to facilitate the introduction of a new GM
technology.
Bt-brinjal is resistant to the FSB insect and provides more marketable yields than the non-
Bt brinjal. To realize the benefits of Bt-brinjal fully, Bangladesh government and other developers
of Bt-brinjal need to pay attention in terms of technology dissemination and product development.
Bt-brinjal is still undergoing a commercialization phase in Bangladesh. Therefore, an effective
support system is required to distribute the Bt-brinjal seeds in local markets and to provide farmers
with information about Bt-brinjal. BARI is the developer and plays a vital role in the technology
dissemination in Bangladesh, while BADC is one of the popular seed distributors in Bangladesh.
Therefore, BARI and BADC should take steps to make the Bt-brinjal seeds available in the market
and to accompany this distribution with training and education for farmers.
Findings suggest that most of the stakeholders (consumers and producers of Bt-brinjal)
perceived the introduction of Bt-brinjal in Bangladesh positively. However, the small sample size
of the consumer survey for this study is not very representative and coution should be exercised in
extrapolationg results of the consumers analysis beyond this small sample. Therefore, policy
107
makers need to pay particular attention to how consumers view about this technology and how
they learn about the technology. The opponents of the GM technologies in Bangladesh claimed
that the developer groups do not provide proper information to the farmers and/or consumers. A
communication gap was noticed between these stakeholders. Media may have a role to play in
acting as the information provider by disseminating credible and accurate information about a new
technology among stakeholder groups. Credible information dissemination by trusted public sector
agencies also has an important role to play.
This study provides an example to facilitate understanding the status of social license for
adopting a new GM crop in a developing country. This study suggests that technology developers
in developing country play a vital role in the technology adoption process, while they need to
create a good connection with producers. In developing countries, producers and consumers often
do not have much access to information about new technologies and may have low levels of pre-
existing knowledge about the technology. Their perceptions towards GM technology adoption
likely to be significantly influenced by the technology developers, particularly if they rely on these
agencies for provision of seed during the technology transfer phase of commercialization.
Therefore, this study suggests that there is more attention needed to the specific economic,
sociological and informational context when conducting research on technology adoption in a
developing country context. Consumers from developed countries tend to be more conscious
about new technologies, while developing country consumers are considerably less aware about
new technologies. Information accessibility differs markedly across these two contexts. Thus,
developing countries will need to invest in programs to provide information about new
technologies to stakeholders to bridge the information gap. The developers and other institutions,
for example the department of Agricultural Extension and BADC in Bangladesh, can contribute
to facilitating information flows to consumers as well as other stakeholders. Bangladesh remains
a relevant case for other developing countries for the successful adoption of a GM food crop.
5.3 Limitations of the Research and Areas of Future Research
Finally, a number of important limitations need to be considered. First, the scope of this
study was limited in terms of availability of information. Social license is a broad concept and to
understand the concept of social license for the adoption of a new technology, it is essential to
examine stakeholders’ perceptions. This study was focused on the perceptions of Bt-technology
108
among farmers who are current adopters and who are not yet adopters of this technology. Since
Bt-brinjal is still in the phase-in commercialization period, it was not possible to assess willingness
to adopt within a pure market setting. Future research could explore whether willingness to adopt
and the factors influencing willingness to adopt change once the current Bt-varieties are fully
commercialized. This study is also limited by the lack of information on other stakeholders’
perceptions about Bt-brinjal. Due to time and resource constraints, a very limited number of
consumers were surveyed and a small number of NGO representatives were interviewed to obtain
a general understanding of their knowledge of and attitudes towards Bt-brinjal. The results from
the consumer survey and other stakeholders’ interviews cannot therefore be considered
representative in determining the extent to which social license exists among stakeholders and
what determines social license for these stakeholder groups. Therefore, more research is needed to
examine social license for the adoption of Bt-brinjal capturing all stakeholders’ perceptions. The
farmer sample (both adopters and non-adopters) was also relatively small and non-random. As
adoption of Bt-brinjal increases in Bangladesh in the future it would be interesting to examine
adoption patterns on a larger scale once the crop is more widely established in the country.
Second, this study was done to examine the concept of social license in a developing
country context. Bangladesh was selected as the country of interest but due to time constraints and
the practicality of data collections, the focus was on the northeast areas of Bangladesh and might
be representative only for those areas. Further research could expand the analysis to other major
brinjal producing regions in Bangladesh. Furthermore, the surveys of the non-adopters and
consumers were conducted in regions close to the adopter farmers. It would be interesting to
examine the attitudes of consumers and farmers who have not grown Bt-brinjal yet in other regions
further from the adopter farmers.
Third, the current study focuses primarily on the concept of social license in a developing
country context. It would be interesting to compare the concept of social license in a developed
and developing country context, and there may be scope to compare the current research findings
with future research in a developed country context. The controversial nature of GM technologies
influences the GM policies in different countries, for example, Zilberman et al., (2013) identified
four reasons for differences in GM policies in the US and Europe. This study did not evaluate GM

109
policies in Bangladesh. Thus further research needs to be done to examine GM policies in a
developing country context and how it differs in a developed and developing country context.
110
References
Adenle, A. A. (2014). Stakeholders’ perceptions of GM technology in West Africa: Assessing the
responses of policymakers and scientists in Ghana and Nigeria. Journal of agricultural and
environmental ethics, 27(2), 241-263.
Adenle, A. A., Morris, E. J., and Parayil, G. (2013). Status of development, regulation and adoption
of GM agriculture in Africa: Views and positions of stakeholder groups. Food Policy, 43,
159-166.
Aerni, P. (2005). Stakeholder attitudes towards the risks and benefits of genetically modified crops
in South Africa. Environmental Science and Policy, 8(5), 464-476.
Aerni, P., and Bernauer, T. (2006). Stakeholder attitudes toward GMOs in the Philippines, Mexico,
and South Africa: The issue of public trust. World development, 34(3), 557-575.
Agresti, A. (2007). An introduction to categorical data analysis. John wiley. New Jersey, United
States.
Alexander, C. E., and Van Mellor, T. (2006). Determinants of corn rootworm resistant corn
adoption in Indiana. AgBioForum, 8(4), 197-204.
Amin, L., Hamdan, F., Hashim, R., Samani, M. C., Anuar, N., Zainol, Z. A., and Jusoff, K. (2011).
Risks and benefits of genetically modified foods. African Journal of
Biotechnology, 10(58), 12481-12485.
Asian Development Bank (ADB) (2001). Rural Development Priorities for poverty reduction in
Bangladesh (Dhaka, Bangladesh: Asian Development Bank (ADB).
Bangladesh Bureau of Statistics (2017). Yearbook of Agricultural Statistics, 2016. Dhaka
Bangladesh (Retrieved from
http://bbs.portal.gov.bd/sites/default/files/files/bbs.portal.gov.bd/page/1b1eb817_9325_4
354_a756_3d18412203e2/Yearbook-2016-Final-19-06-2017.pdf; accessed March, 2018)
111
Bangladesh Bureau of Statistics: Monthly Statistical Bulletin of Bangladesh (2015). (Retrieved
from http://www.bbs.gov.bd/PageWebMenuContent.aspx?MenuKey=365; accessed
October, 2016)
Bennett, R., Buthelezi, T. J., Ismael, Y., and Morse, S. (2003). Bt cotton, pesticides, labour and
health: A case study of smallholder farmers in the Makhathini Flats, Republic of South
Africa. Outlook on agriculture, 32(2), 123-128.
Bett, C., Ouma, J. O., and De Groote, H. (2010). Perspectives of gatekeepers in the Kenyan food
industry towards genetically modified food. Food policy, 35(4), 332-340.
Boutilier, R., and Thomson, I. (2011). Modelling and measuring the social license to operate: fruits
of a dialogue between theory and practice. International mine management, Queensland,
Australia. (Retrieved from
http://socialicense.com/publications/Modelling%20and%20Measuring%20the%20SLO.p
df; accessed October, 2016)
Brookes, G., and Barfoot, P. (2012). GM crops: global socio-economic and environmental impacts
1996-2010. PG Economics Ltd. (Retrieved from http://www. pgeconomics. co.
uk/page/33/global-impact-2012; accessed February, 2017 ).
Canadian Centre for Food Integrity (CCFI) (2016). Public Trust Research-2016. (Retrived from
http://www.foodintegrity.ca/research/consumer-trust-research; accessed October 2017).
Carroll, A. B. (1979). A three-dimensional conceptual model of corporate performance. Academy
of management review, 4(4), 497-505.
CFA (2015): Building Trust and Transparency–A discussion paper. Canadian Federation of
Agriculture. (Retrieved from. http://www.cfa-fca.ca/node/2262; accessed October, 2016).
Choudhary, B. and Gaur, K. (2009). The Development and Regulation of Bt Brinjal in India
(Eggplant/ Aubergine). ISAAA Brief No.38. Ithaca, NY: ISAAA.
Choudhary, B., Nasiruddin, K. M., and Gaur, K., (2014). The status of commercialized Bt brinjal
in Bangladesh. ISAAA Brief, (47). Ithaca, NY: ISAAA,

112
Choudhury, N. (1986). Policy and Development of Biotechnology : Bangladesh Perspective, 43
73. (Retrieved from http://ris.org.in/images/RIS_images/pdf/abdr_July045.pdf ; Accessed
October, 2016)
Chowdhury, A. (2012). Marketing System and Seasonal Price Variation of Brinjal in Selected
Area of Bogra District (master’s thesis). Department of Agribusiness and Marketing,
Bangladesh Agricultural University, Mymensingh, Bangladesh.
Crawford, E., Kelly, V., Jayne, T. S., and Howard, J. (2003). Input use and market development
in Sub-Saharan Africa: an overview. Food policy, 28(4), 277-292.
Crop Life Canada (2017). What does ‘Social License’ mean for agriculture? (Retrived from
http://croplife.ca/what-does-social-license-mean-for-agriculture/; accessed October, 2017)
Curtis, K. R., McCluskey, J. J., and Wahl, T. I. (2004). Consumer acceptance of genetically
modified food products in the developing world. 47th Annual Conference of the Australian
Agricultural and Resource Economics Society, Fremantle, Australia. (Retrieved from
http://ageconsearch.umn.edu/bitstream/57858/2/2003_curtis.pdf; accessed October,
2016).
Durant, R. F., and Legge, J. S. (2006). “Wicked Problems,” Public Policy, and Administrative
Theory Lessons from the GM Food Regulatory Arena. Administration and society, 38(3),
309-334.
FAO (2004): The State of Food and Agriculture (2003-04). FAO Agriculture Series 35. Rome:
Food and Agriculture Organization (FAO).
FAO (2016). Agricultural Development Economics, Rome: Food and Agriculture Organization of
United Nations. (Retrieved from http://www.fao.org/economic/esa/esa-activities/esa-
smallholders/dataportrait/farm-size/en/; accessed October, 2016)
Finucane, M. L., and Holup, J. L. (2005). Psychosocial and cultural factors affecting the perceived
risk of genetically modified food: an overview of the literature. Social science and
medicine, 60(7), 1603-1612.
Frewer, L. J., Scholderer, J., and Bredahl, L. (2003). Communicating about the risks and benefits
of genetically modified foods: The mediating role of trust. Risk analysis, 23(6), 1117-1133.
113
Frewer, L., Lassen, J., Kettlitz, B., Scholderer, J., Beekman, V., and Berdal, K. G. (2004). Societal
aspects of genetically modified foods. Food and chemical toxicology, 42(7), 1181-1193.
Global Agricultural Information Network (GAIN), (2017). Agricultural Biotechnology Annual
Report, 2017: Bangladesh. United States Department of Agriculture (USDA). Retrieved
from
https://gain.fas.usda.gov/Recent%20GAIN%20Publications/Agricultural%20Biotechnolo
gy%20Annual_Dhaka_Bangladesh_1-29-2018.pdf; accessed March, 2018).
González, C., García, J. and Johnson, N. (2009). Stakeholders Positions Toward GM Food: the
case of Vitamin A Biofortified Cassava in Brazil. AgBioForum, 12(3 and 4): 382-393.
Guris, S., Metin, N., and Caglayan, E. (2007). The brand choice model of wine consumers: a
multinomial logit model. Quality and quantity, 41(3), 447-460.
Hobbs, J. E., and Plunkett, M. D. (1999) "Genetically modified foods: Consumer issues and the
role of information asymmetry." Canadian journal of agricultural economics 47(4), 445-
455.
James, C. (2014). Global Status of commercialized biotech/GM crops: 2014. ISAAA Brief No. 49.
Ithaca, NY: ISAAA.
James, C. (2015). Global Status of Commercialized Biotech/GM Crops: 2015. ISAAA Brief No.
51. Ithaca, NY: ISAAA
Kikulwe, E. M., Wesseler, J., and Falck-Zepeda, J. (2011). Attitudes, perceptions, and trust.
Insights from a consumer survey regarding genetically modified banana in
Uganda. Appetite, 57(2), 401-413.
Kolady, D. E., and Lesser, W. (2006). Who adopts what kind of technologies? The case of Bt
eggplant in India. AgBioForum, 9(2), 94-103.
Krishna, V. V., and Qaim, M. (2007). Estimating the adoption of Bt eggplant in India: who benefits
from public–private partnership? Food policy, 32(5), 523-543.
Kumar S., Prasanna P.A.L. and Wankhade S. (2011). Potential Benefits of Bt-brinjal in India-an
Economic Assessment. Agricultural economics research review, 24, 83-90.
114
Long, J. S. (1997). Regression models for categorical and limited dependent variables. (Advanced
quantitative techniques in the social sciences, 41(9), 1550-1571.
Long, J. S., & Freese, J. (2006). Regression models for categorical dependent variables using Stata
(2nd edition). College Station TX: Stata press.
Lynas M. (2014). Bt-brinjal in Bangladesh- the true Story. (Retrieved from
http://www.marklynas.org/2014/05/bt-brinjal-in-bangladesh-the-true-story/; accessed
October, 2017)
Meherunnahar, M. and Poul, D.N.R. (2009). Bt Brinjal : Introducing Genetically Modified Brinjal
( Eggplant / Aubergine ) in Bangladesh. Bangladesh development research paper series,
BDRWPS No . 9, 1-13.
Melé, D., & Armengou, J. (2016). Moral legitimacy in controversial projects and its relationship
with social license to operate: A case study. Journal of business ethics, 136(4), 729-742.
Miah, S. J., Hoque, A., Paul, A., and Rahman, A. (2014). Unsafe use of pesticide and its impact
on health of farmers: A case study in Burichong Upazila, Bangladesh. Journal of
environmental science, toxicology and food technology, 8(1), 57-67.
Moffat, K., and Zhang, A. (2014). The paths to social license to operate: An integrative model
explaining community acceptance of mining. Resources policy, 39, 61-70.
Nasiruddin, K. M. (2012). Strategizing Communication in Commercialization of Biotech Crops.
Navarro M. J. and Hautea R.A., (Ed.). Communication Challenges and Convergence in
Crop Biotechnology. Ithaca, NY: International Service for the Acquisition of Agri-biotech
pplications. (203–223).
Nelsen J.C. (2006). Social license to operate. International journal of mining, reclamation and
environment, 20(3), 161-162.
Phipps, R. H., and Park, J. R. (2002). Environmental benefits of genetically modified crops: global
and European perspectives on their ability to reduce pesticide use. Journal of animal and
feed sciences, 11(1), 1-18.
115
Pino, G., Amatulli, C., De Angelis, M., and Peluso, A. M. (2016). The influence of corporate social
responsibility on consumers' attitudes and intentions toward genetically modified foods:
evidence from Italy. Journal of cleaner production, 112, 2861-2869.
Rahman, M. Z., Kabir, H., & Khan, M. (2016). A study on brinjal production in Jamalpur district
through profitability analysis and factors affecting the production. Journal of the
Bangladesh agricultural university, 14(1), 113-118.
Searca (2016). Filipino farmer leaders learn from bt-brinjal farmers in Bangladesh. (Retrieved
from http://bteggplant.cornell.edu/content/news/blog/filipino-farmer-leaders-learn-bt-
brinjal-farmers-bangladesh; accessed November, 2016)
Secretariat of the Convention on Biological Diversity. 1992. Convention on Biological Diversity
(available at https://www.cbd.int/doc/legal/cbd-en.pdf; accessed October 22, 2016).
Song, J., Bradeen, J. M., Naess, S. K., Raasch, J. A., Wielgus, S. M., Haberlach, G. T., Lui, J.,
Kuang, H., Austin, S., Buell, C. R., Jiang, J. and Helgeson, J. P. (2003). Gene RB cloned
from Solanum bulbocastanum confers broad spectrum resistance to potato late
blight. Proceedings of the national academy of sciences, 100(16), 9128-9133.
The World Bank. (2015). Data:Bangladesh. (Retrieved from
https://data.worldbank.org/country/bangladesh; accessed October 22, 2016)
The World Bank. (2016). Data:Bangladesh. Retrieved from
(http://data.worldbank.org/indicator/SP.POP.TOTL?locations=BD; accessed October 22,
2016)
Thirtle, C., Beyers, L., Ismael, Y., and Piesse, J. (2003). Can GM-technologies help the poor? The
impact of Bt cotton in Makhathini Flats, KwaZulu-Natal. World development, 31(4), 717-
732.
Wang, Y., Vitale, J., Park, P., Adams, B., Agesa, B. and Korir, M. (2017). Socioeconomic
Determinants of Hybrid Maize Adoption in Kenya. African journal of agricultural research,
12(8), 617-631.

116
Weisenfield, U. (2012). Corporate social responsibility in innovation: Insights from two cases of
Syngenta's activities in Genetically Modified Organisms. Creativity and innovation
management, 21(2), 199-211.
Wieczorek A. (2003). Use of Biotechnology in Agriculture: Benefits and Risks. Governance for
industrial transformation. Proceedings of the 2003 Berlin conference on the human health
resources. Honolulu: University of Hawaii Press, USA, 1-6.
Wohlers, A. E. (2010). Regulating genetically modified food: Policy trajectories, political culture,
and risk perceptions in the US, Canada, and EU. Politics and the life sciences, 29(2), 17-
39.
Wulff, J. N. (2015). Interpreting results from the multinomial logit model: Demonstrated by
foreign market entry. Organizational research methods, 18(2), 300-325.
Yates, B., and Horvath, C. (2013). Social license to operate: How to get it, and how to keep it.
Paper presenter at 2013 Pacific Energy Summit. (Retrieved from
http://www.nbr.org/downloads/pdfs/eta/PES_2013_summitpaper_Yates_Horvath.pdf,
accessed October, 2016)
Zilberman, D., Kaplan, S., Kim, E., Hochman, G., and Graff, G. (2013). Continents divided:
Understanding differences between Europe and North America in acceptance of GM
crops. GM crops and food, 4(3), 202-208.
117
Appendix 1 The Exemption Letter from Behavioural Research Ethics Board

118
Appendix 2 The Adopters Survey Questionnaire
Survey Questionnaire: Bt-brinjal farmer (Adopter)
Understanding the Status of Social License: Adoption of Bt-brinjal in
Bangladesh
Respondent Number
District
Village
Date
Section A: General farming information about Bt-brinjal
1. Are you a regular brinjal
producing farmer?
Yes No
If Yes, please proceed to the next question otherwise thank them and end survey
2. Have you heard about Bt-
brinjal before?
Yes No
3. If yes, do you grow Bt-
brinjal?
Yes No
If Yes, Please proceed to the next question
If No, Please use the non Bt-brinjal farmers’ survey questionnaire
4. How long have you been
growing Bt-brinjal?
…………………………………….(Years)
5. From where do you normally
get Bt-brinjal seeds?
Codes: 1=Local Extension Office,
2= BARI, 3= Local Dealers, 4=
NGOs, 5=Friends/Relatives,
6=Other (please specify)
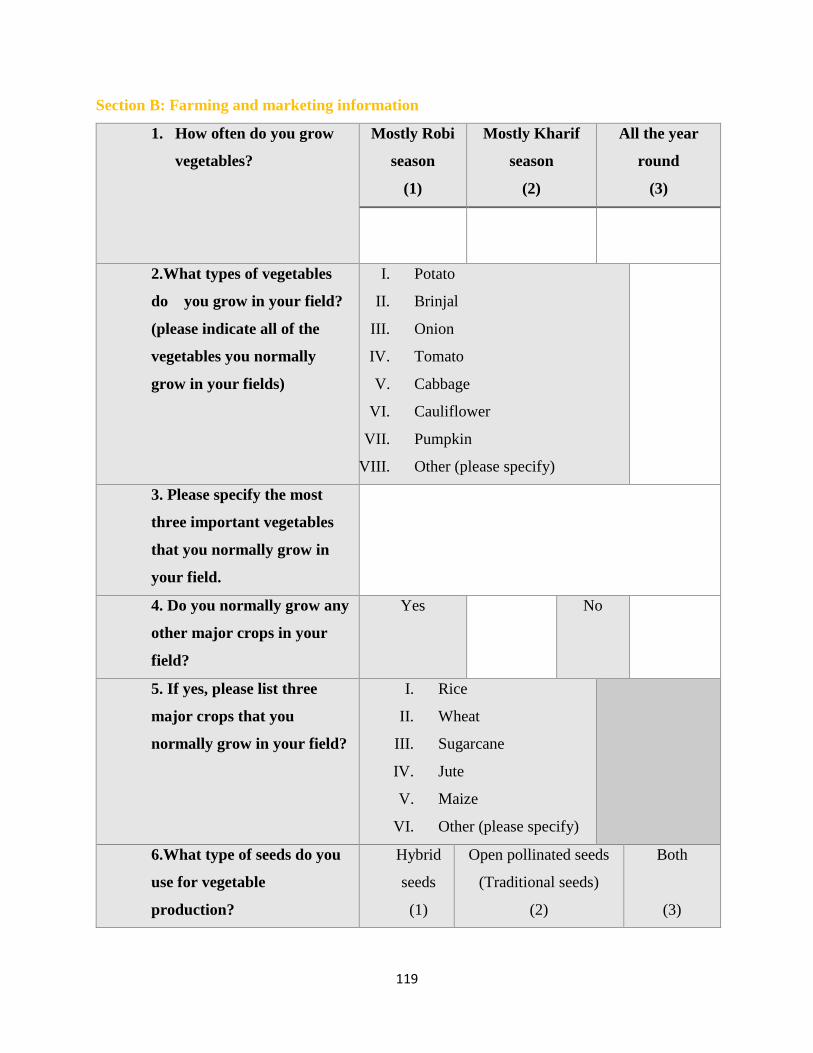
119
Section B: Farming and marketing information
1. How often do you grow
vegetables?
Mostly Robi
season
(1)
Mostly Kharif
season
(2)
All the year
round
(3)
2.What types of vegetables
do you grow in your field?
(please indicate all of the
vegetables you normally
grow in your fields)
I. Potato
II. Brinjal
III. Onion
IV. Tomato
V. Cabbage
VI. Cauliflower
VII. Pumpkin
VIII. Other (please specify)
3. Please specify the most
three important vegetables
that you normally grow in
your field.
4. Do you normally grow any
other major crops in your
field?
Yes No
5. If yes, please list three
major crops that you
normally grow in your field?
I. Rice
II. Wheat
III. Sugarcane
IV. Jute
V. Maize
VI. Other (please specify)
6.What type of seeds do you
use for vegetable
production?
Hybrid
seeds
(1)
Open pollinated seeds
(Traditional seeds)
(2)
Both
(3)
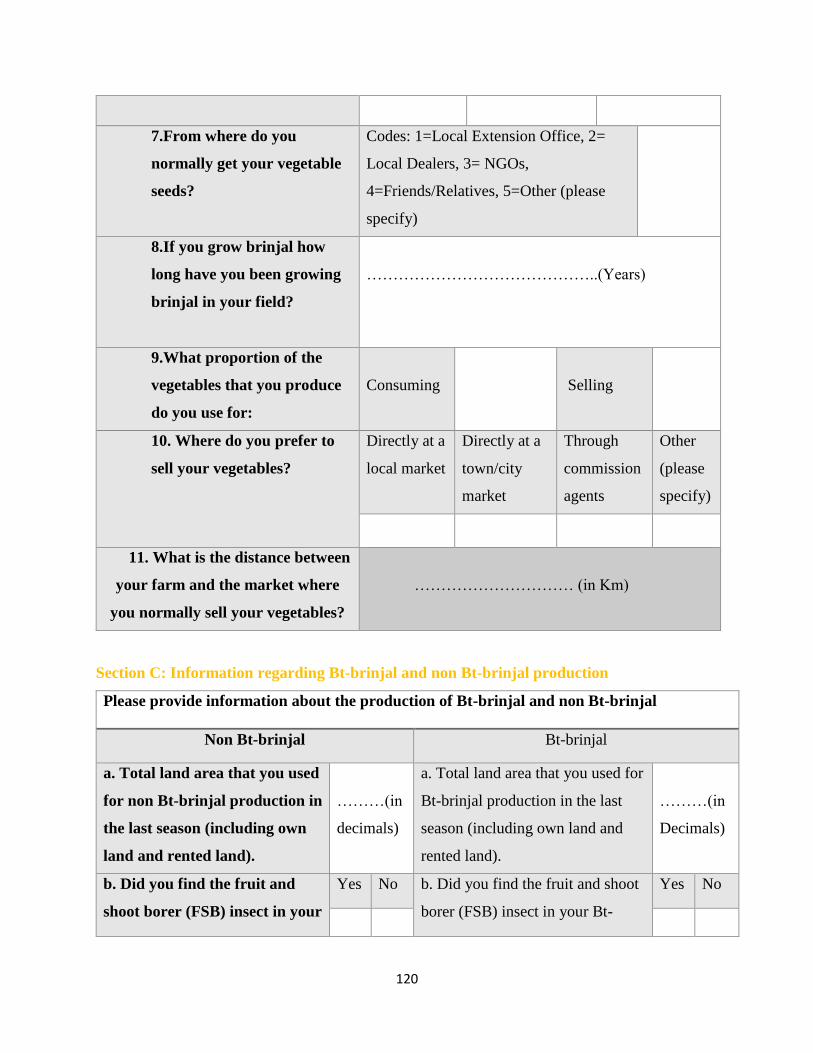
120
7.From where do you
normally get your vegetable
seeds?
Codes: 1=Local Extension Office, 2=
Local Dealers, 3= NGOs,
4=Friends/Relatives, 5=Other (please
specify)
8.If you grow brinjal how
long have you been growing
brinjal in your field?
……………………………………..(Years)
9.What proportion of the
vegetables that you produce
do you use for:
Consuming
Selling
10. Where do you prefer to
sell your vegetables?
Directly at a
local market
Directly at a
town/city
market
Through
commission
agents
Other
(please
specify)
11. What is the distance between
your farm and the market where
you normally sell your vegetables?
………………………… (in Km)
Section C: Information regarding Bt-brinjal and non Bt-brinjal production
Please provide information about the production of Bt-brinjal and non Bt-brinjal
Non Bt-brinjal Bt-brinjal
a. Total land area that you used
for non Bt-brinjal production in
the last season (including own
land and rented land).
………(in
decimals)
a. Total land area that you used for
Bt-brinjal production in the last
season (including own land and
rented land).
………(in
Decimals)
b. Did you find the fruit and
shoot borer (FSB) insect in your
Yes No b. Did you find the fruit and shoot
borer (FSB) insect in your Bt-
Yes No
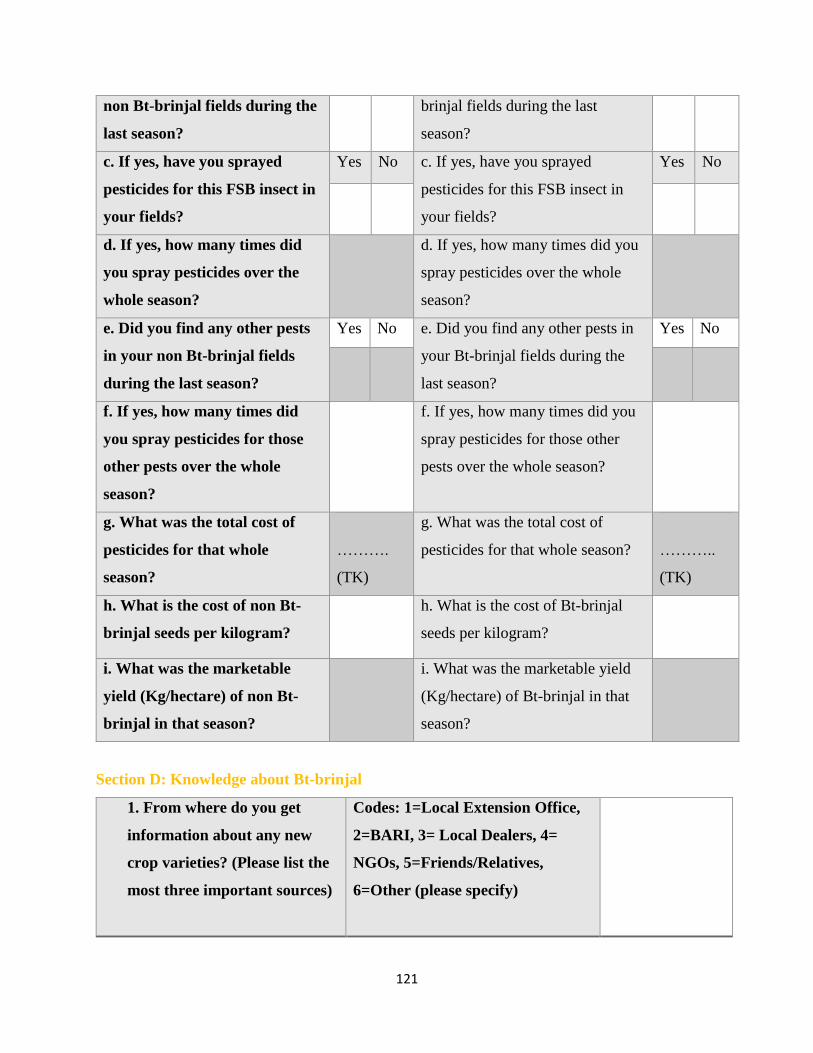
121
non Bt-brinjal fields during the
last season?
brinjal fields during the last
season?
c. If yes, have you sprayed
pesticides for this FSB insect in
your fields?
Yes No c. If yes, have you sprayed
pesticides for this FSB insect in
your fields?
Yes No
d. If yes, how many times did
you spray pesticides over the
whole season?
d. If yes, how many times did you
spray pesticides over the whole
season?
e. Did you find any other pests
in your non Bt-brinjal fields
during the last season?
Yes No e. Did you find any other pests in
your Bt-brinjal fields during the
last season?
Yes No
f. If yes, how many times did
you spray pesticides for those
other pests over the whole
season?
f. If yes, how many times did you
spray pesticides for those other
pests over the whole season?
g. What was the total cost of
pesticides for that whole
season?
……….
(TK)
g. What was the total cost of
pesticides for that whole season?
………..
(TK)
h. What is the cost of non Bt-
brinjal seeds per kilogram?
h. What is the cost of Bt-brinjal
seeds per kilogram?
i. What was the marketable
yield (Kg/hectare) of non Bt-
brinjal in that season?
i. What was the marketable yield
(Kg/hectare) of Bt-brinjal in that
season?
Section D: Knowledge about Bt-brinjal
1. From where do you get
information about any new
crop varieties? (Please list the
most three important sources)
Codes: 1=Local Extension Office,
2=BARI, 3= Local Dealers, 4=
NGOs, 5=Friends/Relatives,
6=Other (please specify)
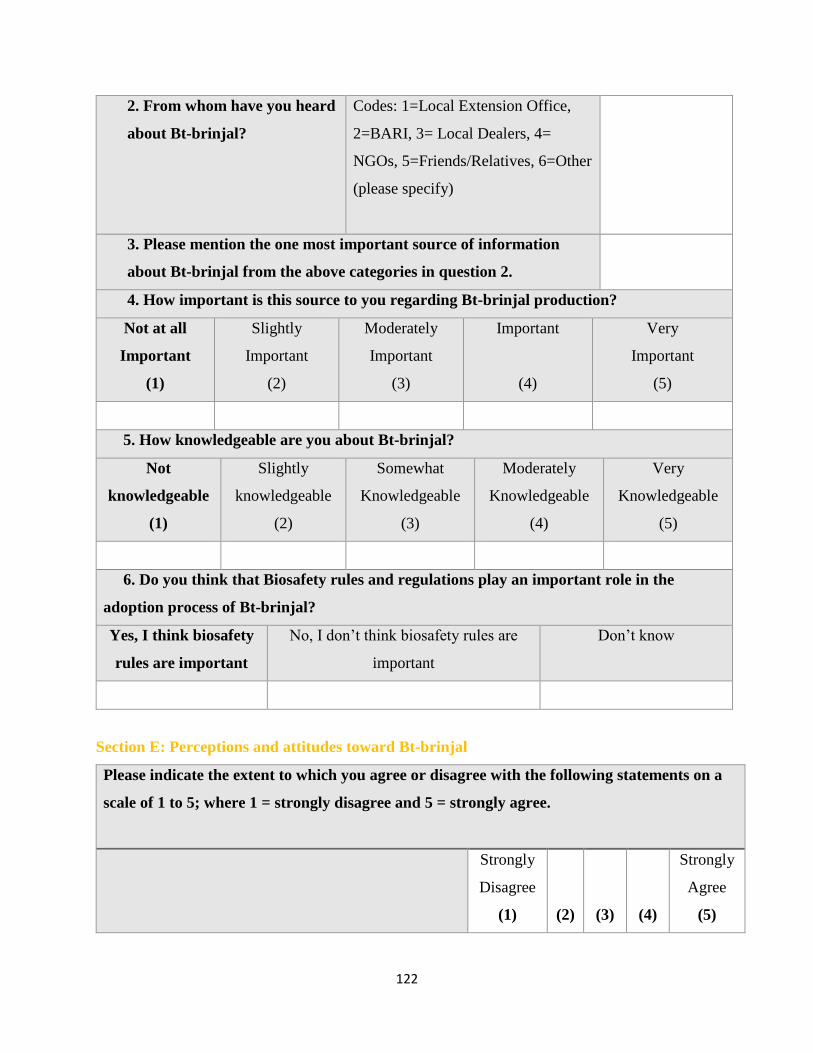
122
2. From whom have you heard
about Bt-brinjal?
Codes: 1=Local Extension Office,
2=BARI, 3= Local Dealers, 4=
NGOs, 5=Friends/Relatives, 6=Other
(please specify)
3. Please mention the one most important source of information
about Bt-brinjal from the above categories in question 2.
4. How important is this source to you regarding Bt-brinjal production?
Not at all
Important
(1)
Slightly
Important
(2)
Moderately
Important
(3)
Important
(4)
Very
Important
(5)
5. How knowledgeable are you about Bt-brinjal?
Not
knowledgeable
(1)
Slightly
knowledgeable
(2)
Somewhat
Knowledgeable
(3)
Moderately
Knowledgeable
(4)
Very
Knowledgeable
(5)
6. Do you think that Biosafety rules and regulations play an important role in the
adoption process of Bt-brinjal?
Yes, I think biosafety
rules are important
No, I don’t think biosafety rules are
important
Don’t know
Section E: Perceptions and attitudes toward Bt-brinjal
Please indicate the extent to which you agree or disagree with the following statements on a
scale of 1 to 5; where 1 = strongly disagree and 5 = strongly agree.
Strongly
Disagree
(1)
(2)
(3)
(4)
Strongly
Agree
(5)
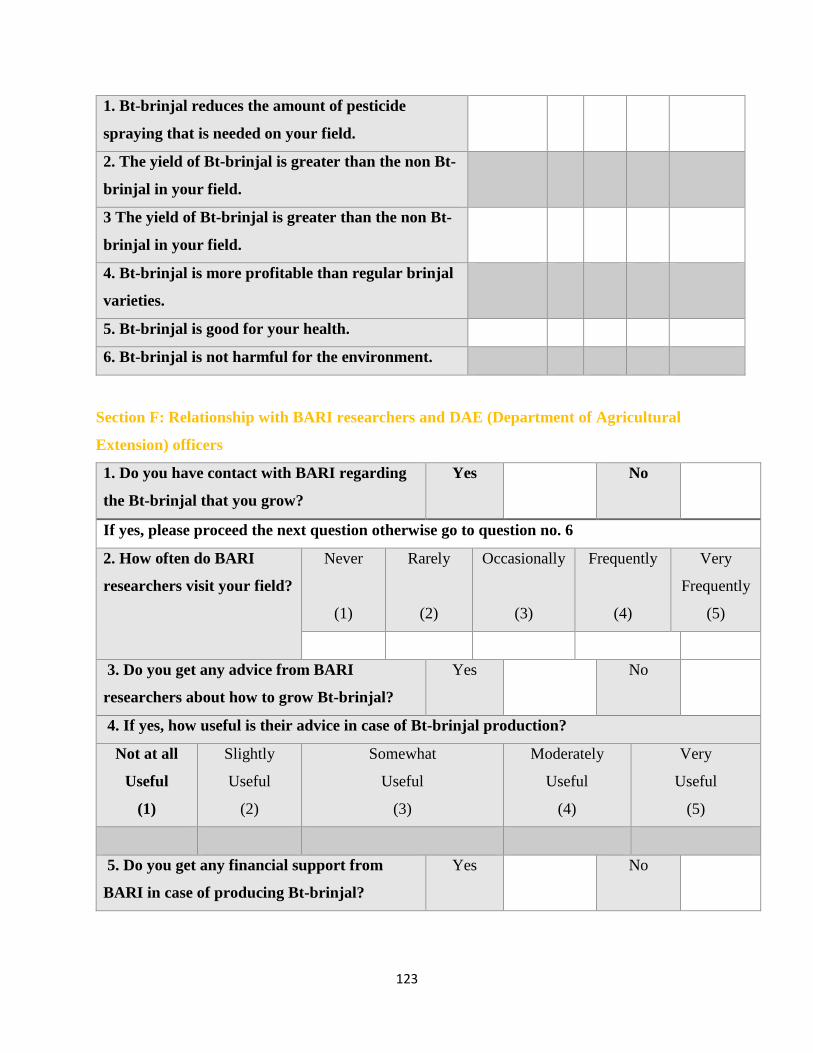
123
1. Bt-brinjal reduces the amount of pesticide
spraying that is needed on your field.
2. The yield of Bt-brinjal is greater than the non Bt-
brinjal in your field.
3 The yield of Bt-brinjal is greater than the non Bt-
brinjal in your field.
4. Bt-brinjal is more profitable than regular brinjal
varieties.
5. Bt-brinjal is good for your health.
6. Bt-brinjal is not harmful for the environment.
Section F: Relationship with BARI researchers and DAE (Department of Agricultural
Extension) officers
1. Do you have contact with BARI regarding
the Bt-brinjal that you grow?
Yes No
If yes, please proceed the next question otherwise go to question no. 6
2. How often do BARI
researchers visit your field?
Never
(1)
Rarely
(2)
Occasionally
(3)
Frequently
(4)
Very
Frequently
(5)
3. Do you get any advice from BARI
researchers about how to grow Bt-brinjal?
Yes No
4. If yes, how useful is their advice in case of Bt-brinjal production?
Not at all
Useful
(1)
Slightly
Useful
(2)
Somewhat
Useful
(3)
Moderately
Useful
(4)
Very
Useful
(5)
5. Do you get any financial support from
BARI in case of producing Bt-brinjal?
Yes No
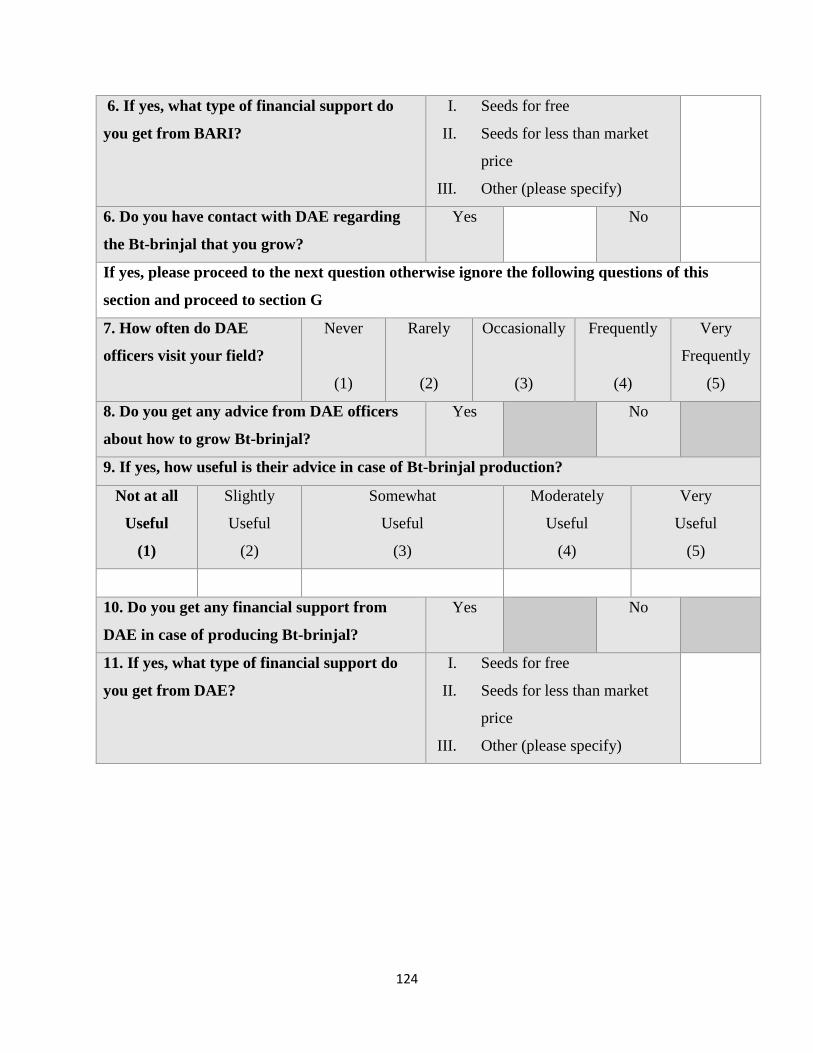
124
6. If yes, what type of financial support do
you get from BARI?
I. Seeds for free
II. Seeds for less than market
price
III. Other (please specify)
6. Do you have contact with DAE regarding
the Bt-brinjal that you grow?
Yes No
If yes, please proceed to the next question otherwise ignore the following questions of this
section and proceed to section G
7. How often do DAE
officers visit your field?
Never
(1)
Rarely
(2)
Occasionally
(3)
Frequently
(4)
Very
Frequently
(5)
8. Do you get any advice from DAE officers
about how to grow Bt-brinjal?
Yes No
9. If yes, how useful is their advice in case of Bt-brinjal production?
Not at all
Useful
(1)
Slightly
Useful
(2)
Somewhat
Useful
(3)
Moderately
Useful
(4)
Very
Useful
(5)
10. Do you get any financial support from
DAE in case of producing Bt-brinjal?
Yes No
11. If yes, what type of financial support do
you get from DAE?
I. Seeds for free
II. Seeds for less than market
price
III. Other (please specify)
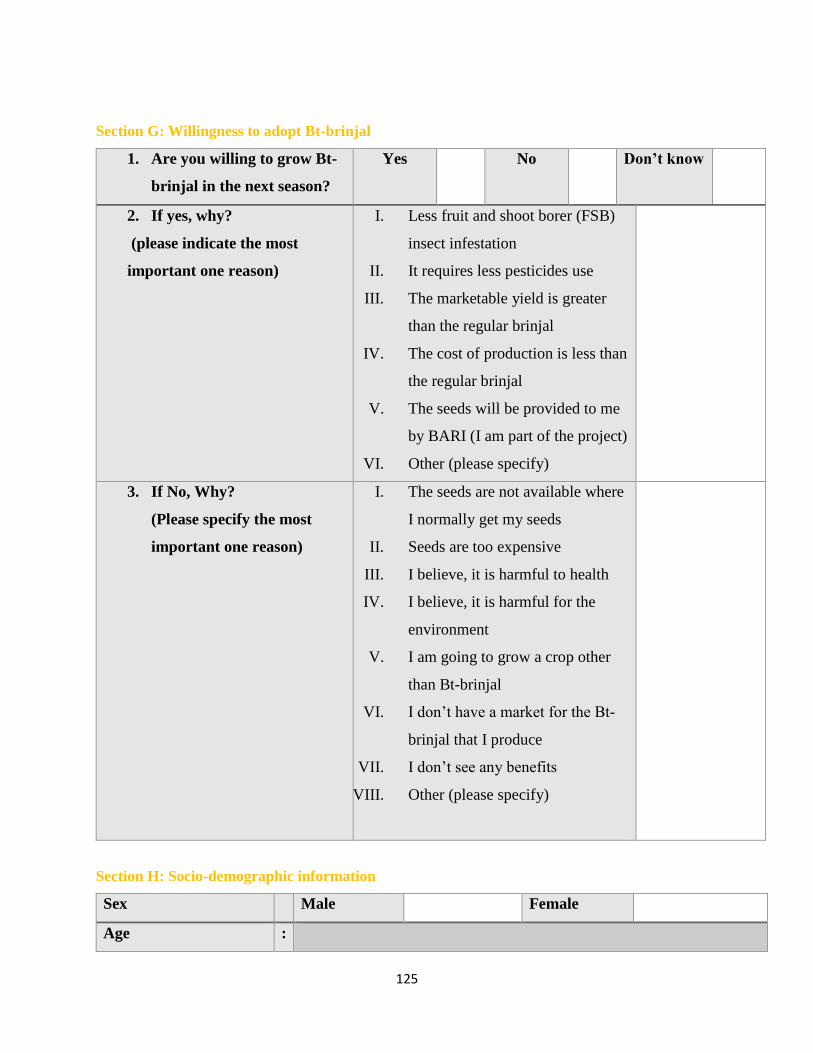
125
Section G: Willingness to adopt Bt-brinjal
1. Are you willing to grow Bt-
brinjal in the next season?
Yes No Don’t know
2. If yes, why?
(please indicate the most
important one reason)
I. Less fruit and shoot borer (FSB)
insect infestation
II. It requires less pesticides use
III. The marketable yield is greater
than the regular brinjal
IV. The cost of production is less than
the regular brinjal
V. The seeds will be provided to me
by BARI (I am part of the project)
VI. Other (please specify)
3. If No, Why?
(Please specify the most
important one reason)
I. The seeds are not available where
I normally get my seeds
II. Seeds are too expensive
III. I believe, it is harmful to health
IV. I believe, it is harmful for the
environment
V. I am going to grow a crop other
than Bt-brinjal
VI. I don’t have a market for the Bt-
brinjal that I produce
VII. I don’t see any benefits
VIII. Other (please specify)
Section H: Socio-demographic information
Sex Male Female
Age :
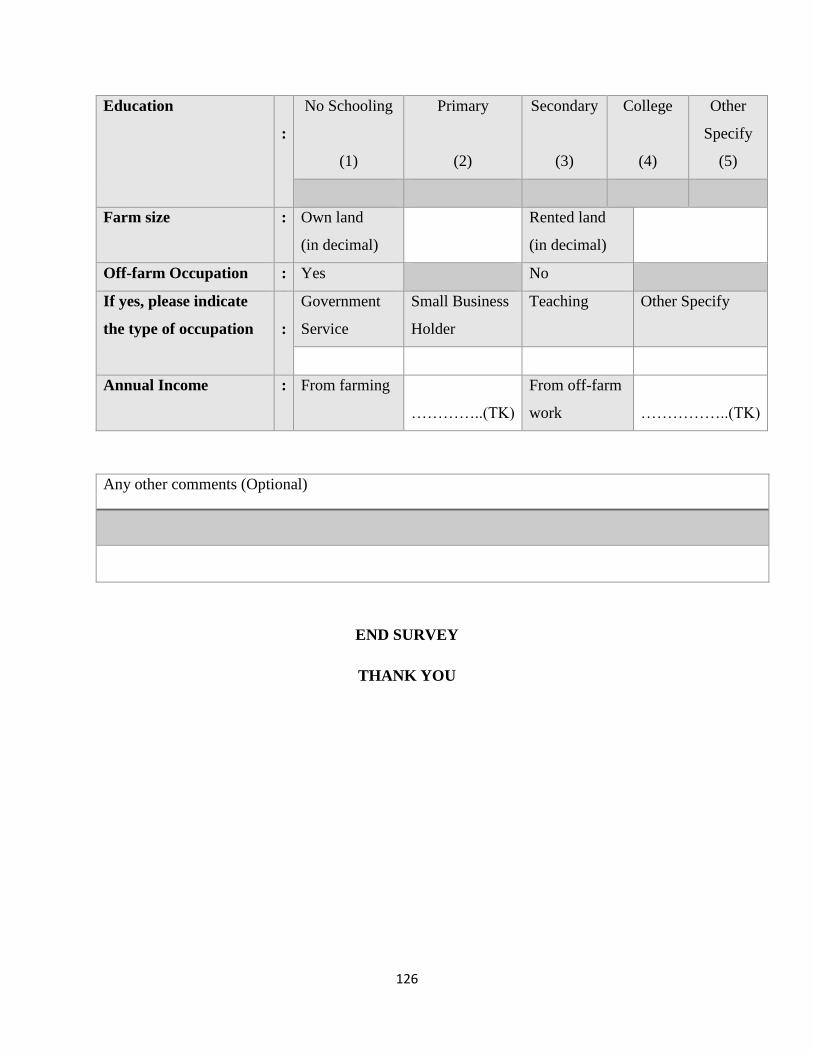
126
Education
:
No Schooling
(1)
Primary
(2)
Secondary
(3)
College
(4)
Other
Specify
(5)
Farm size : Own land
(in decimal)
Rented land
(in decimal)
Off-farm Occupation : Yes No
If yes, please indicate
the type of occupation
:
Government
Service
Small Business
Holder
Teaching Other Specify
Annual Income : From farming
…………..(TK)
From off-farm
work
……………..(TK)
Any other comments (Optional)
END SURVEY
THANK YOU
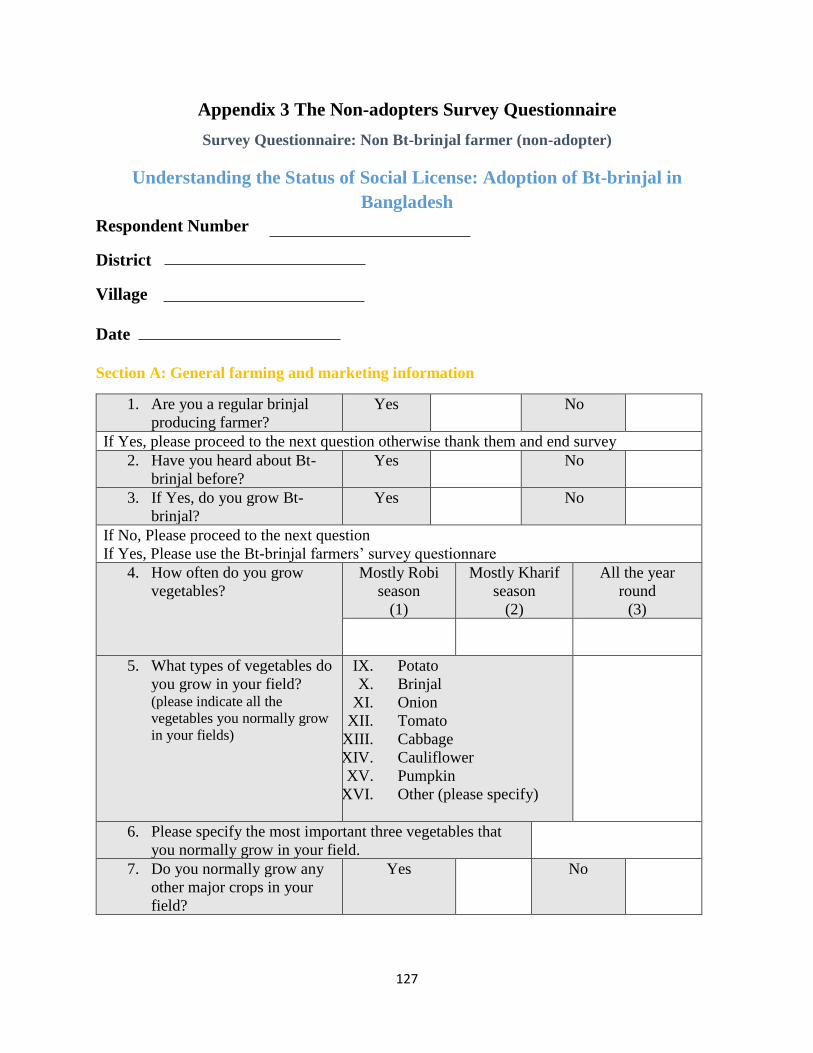
127
Appendix 3 The Non-adopters Survey Questionnaire
Survey Questionnaire: Non Bt-brinjal farmer (non-adopter)
Understanding the Status of Social License: Adoption of Bt-brinjal in
Bangladesh
Respondent Number
District
Village
Date
Section A: General farming and marketing information
1. Are you a regular brinjal
producing farmer?
Yes No
If Yes, please proceed to the next question otherwise thank them and end survey
2. Have you heard about Bt-
brinjal before?
Yes No
3. If Yes, do you grow Bt-
brinjal?
Yes No
If No, Please proceed to the next question
If Yes, Please use the Bt-brinjal farmers’ survey questionnare
4. How often do you grow
vegetables?
Mostly Robi
season
(1)
Mostly Kharif
season
(2)
All the year
round
(3)
5. What types of vegetables do
you grow in your field? (please indicate all the
vegetables you normally grow
in your fields)
IX. Potato
X. Brinjal
XI. Onion
XII. Tomato
XIII. Cabbage
XIV. Cauliflower
XV. Pumpkin
XVI. Other (please specify)
6. Please specify the most important three vegetables that
you normally grow in your field.
7. Do you normally grow any
other major crops in your
field?
Yes No
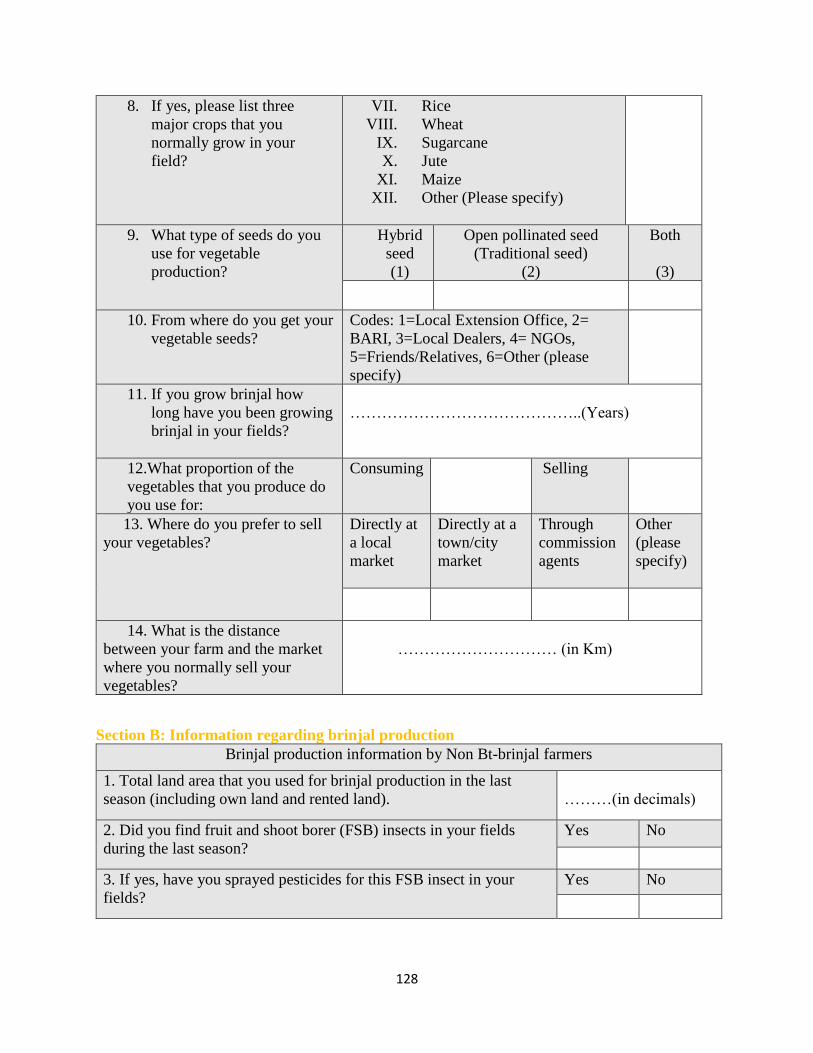
128
8. If yes, please list three
major crops that you
normally grow in your
field?
VII. Rice
VIII. Wheat
IX. Sugarcane
X. Jute
XI. Maize
XII. Other (Please specify)
9. What type of seeds do you
use for vegetable
production?
Hybrid
seed
(1)
Open pollinated seed
(Traditional seed)
(2)
Both
(3)
10. From where do you get your
vegetable seeds?
Codes: 1=Local Extension Office, 2=
BARI, 3=Local Dealers, 4= NGOs,
5=Friends/Relatives, 6=Other (please
specify)
11. If you grow brinjal how
long have you been growing
brinjal in your fields?
……………………………………..(Years)
12.What proportion of the
vegetables that you produce do
you use for:
Consuming
Selling
13. Where do you prefer to sell
your vegetables?
Directly at
a local
market
Directly at a
town/city
market
Through
commission
agents
Other
(please
specify)
14. What is the distance
between your farm and the market
where you normally sell your
vegetables?
………………………… (in Km)
Section B: Information regarding brinjal production
Brinjal production information by Non Bt-brinjal farmers
1. Total land area that you used for brinjal production in the last
season (including own land and rented land).
………(in decimals)
2. Did you find fruit and shoot borer (FSB) insects in your fields
during the last season?
Yes No
3. If yes, have you sprayed pesticides for this FSB insect in your
fields?
Yes No
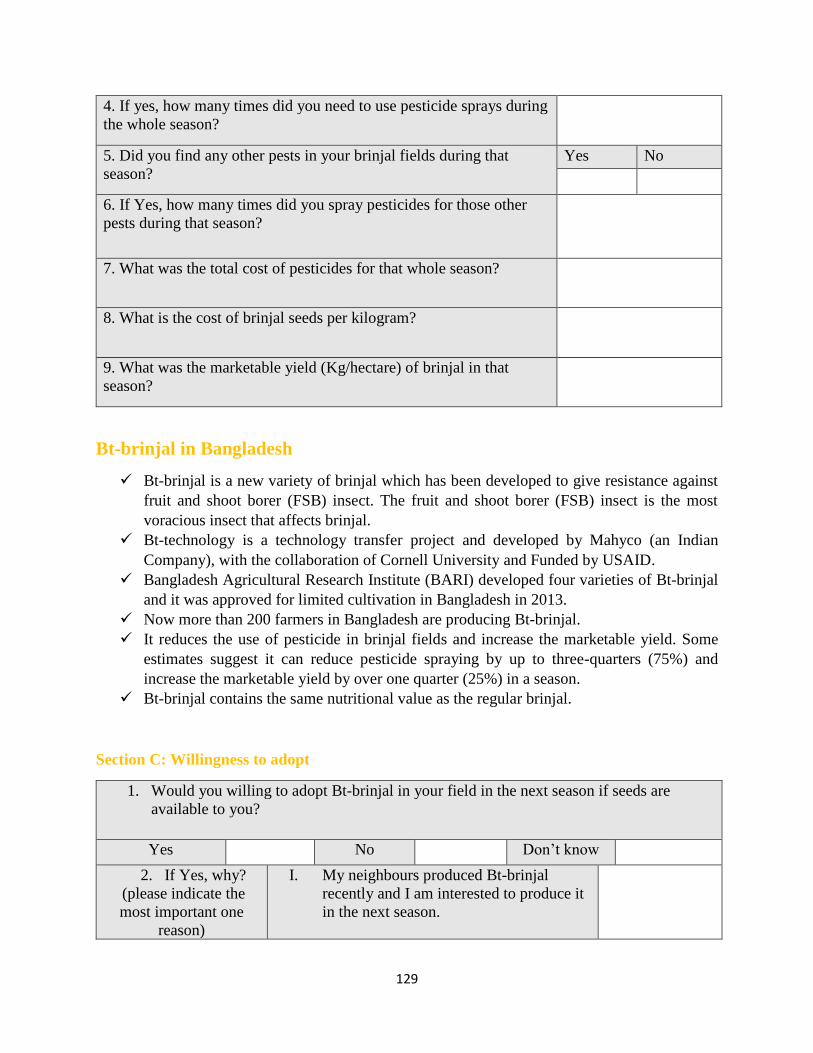
129
4. If yes, how many times did you need to use pesticide sprays during
the whole season?
5. Did you find any other pests in your brinjal fields during that
season?
Yes No
6. If Yes, how many times did you spray pesticides for those other
pests during that season?
7. What was the total cost of pesticides for that whole season?
8. What is the cost of brinjal seeds per kilogram?
9. What was the marketable yield (Kg/hectare) of brinjal in that
season?
Bt-brinjal in Bangladesh
✓ Bt-brinjal is a new variety of brinjal which has been developed to give resistance against
fruit and shoot borer (FSB) insect. The fruit and shoot borer (FSB) insect is the most
voracious insect that affects brinjal.
✓ Bt-technology is a technology transfer project and developed by Mahyco (an Indian
Company), with the collaboration of Cornell University and Funded by USAID.
✓ Bangladesh Agricultural Research Institute (BARI) developed four varieties of Bt-brinjal
and it was approved for limited cultivation in Bangladesh in 2013.
✓ Now more than 200 farmers in Bangladesh are producing Bt-brinjal.
✓ It reduces the use of pesticide in brinjal fields and increase the marketable yield. Some
estimates suggest it can reduce pesticide spraying by up to three-quarters (75%) and
increase the marketable yield by over one quarter (25%) in a season.
✓ Bt-brinjal contains the same nutritional value as the regular brinjal.
Section C: Willingness to adopt
1. Would you willing to adopt Bt-brinjal in your field in the next season if seeds are
available to you?
Yes No Don’t know
2. If Yes, why?
(please indicate the
most important one
reason)
I. My neighbours produced Bt-brinjal
recently and I am interested to produce it
in the next season.
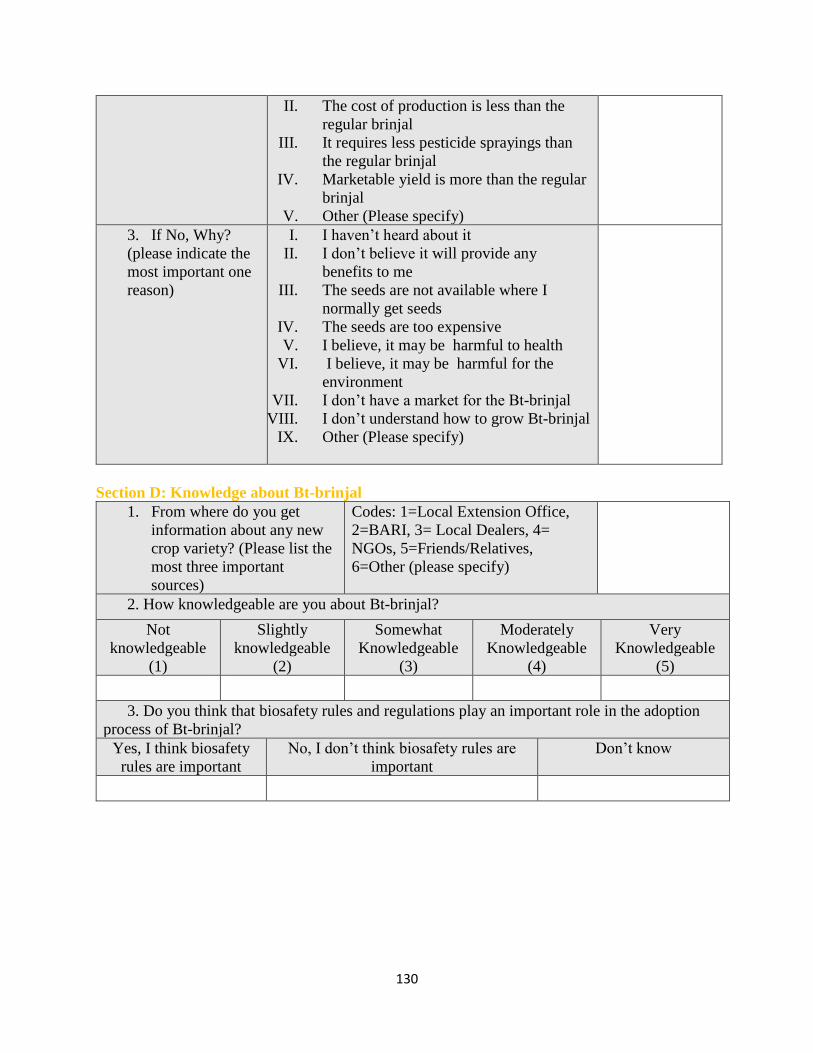
130
II. The cost of production is less than the
regular brinjal
III. It requires less pesticide sprayings than
the regular brinjal
IV. Marketable yield is more than the regular
brinjal
V. Other (Please specify)
3. If No, Why?
(please indicate the
most important one
reason)
I. I haven’t heard about it
II. I don’t believe it will provide any
benefits to me
III. The seeds are not available where I
normally get seeds
IV. The seeds are too expensive
V. I believe, it may be harmful to health
VI. I believe, it may be harmful for the
environment
VII. I don’t have a market for the Bt-brinjal
VIII. I don’t understand how to grow Bt-brinjal
IX. Other (Please specify)
Section D: Knowledge about Bt-brinjal
1. From where do you get
information about any new
crop variety? (Please list the
most three important
sources)
Codes: 1=Local Extension Office,
2=BARI, 3= Local Dealers, 4=
NGOs, 5=Friends/Relatives,
6=Other (please specify)
2. How knowledgeable are you about Bt-brinjal?
Not
knowledgeable
(1)
Slightly
knowledgeable
(2)
Somewhat
Knowledgeable
(3)
Moderately
Knowledgeable
(4)
Very
Knowledgeable
(5)
3. Do you think that biosafety rules and regulations play an important role in the adoption
process of Bt-brinjal?
Yes, I think biosafety
rules are important
No, I don’t think biosafety rules are
important
Don’t know
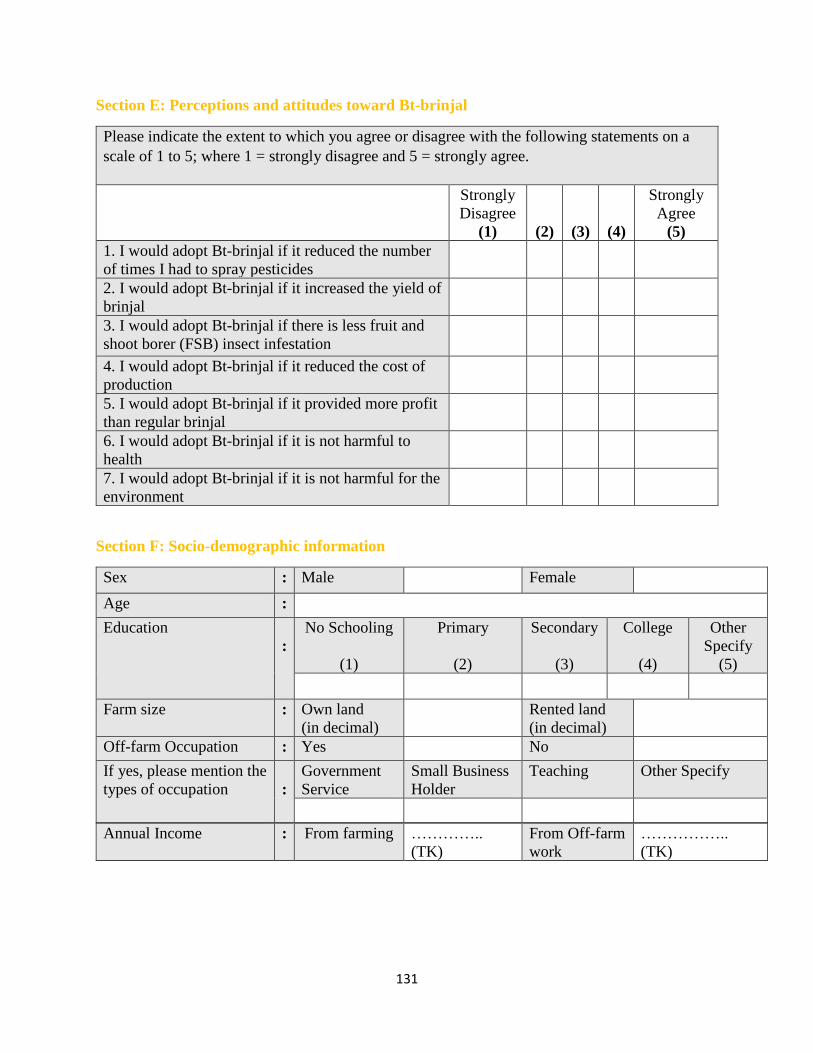
131
Section E: Perceptions and attitudes toward Bt-brinjal
Please indicate the extent to which you agree or disagree with the following statements on a
scale of 1 to 5; where 1 = strongly disagree and 5 = strongly agree.
Strongly
Disagree
(1)
(2)
(3)
(4)
Strongly
Agree
(5)
1. I would adopt Bt-brinjal if it reduced the number
of times I had to spray pesticides
2. I would adopt Bt-brinjal if it increased the yield of
brinjal
3. I would adopt Bt-brinjal if there is less fruit and
shoot borer (FSB) insect infestation
4. I would adopt Bt-brinjal if it reduced the cost of
production
5. I would adopt Bt-brinjal if it provided more profit
than regular brinjal
6. I would adopt Bt-brinjal if it is not harmful to
health
7. I would adopt Bt-brinjal if it is not harmful for the
environment
Section F: Socio-demographic information
Sex : Male Female
Age :
Education
:
No Schooling
(1)
Primary
(2)
Secondary
(3)
College
(4)
Other
Specify
(5)
Farm size : Own land
(in decimal)
Rented land
(in decimal)
Off-farm Occupation : Yes No
If yes, please mention the
types of occupation
:
Government
Service
Small Business
Holder
Teaching Other Specify
Annual Income : From farming …………..
(TK)
From Off-farm
work
……………..
(TK)

132
Any other comments (Optional)
END SURVEY
THANK YOU
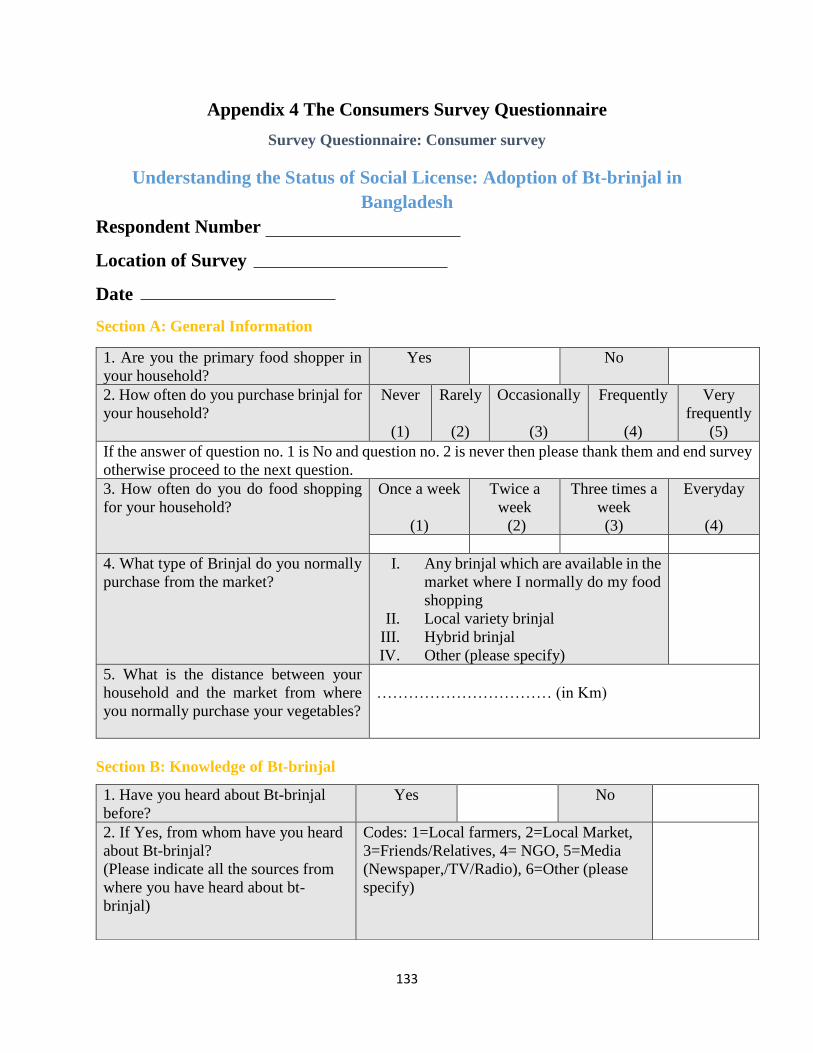
133
Appendix 4 The Consumers Survey Questionnaire
Survey Questionnaire: Consumer survey
Understanding the Status of Social License: Adoption of Bt-brinjal in
Bangladesh
Respondent Number
Location of Survey
Date
Section A: General Information
1. Are you the primary food shopper in
your household?
Yes No
2. How often do you purchase brinjal for
your household?
Never
(1)
Rarely
(2)
Occasionally
(3)
Frequently
(4)
Very
frequently
(5)
If the answer of question no. 1 is No and question no. 2 is never then please thank them and end survey
otherwise proceed to the next question.
3. How often do you do food shopping
for your household?
Once a week
(1)
Twice a
week
(2)
Three times a
week
(3)
Everyday
(4)
4. What type of Brinjal do you normally
purchase from the market?
I. Any brinjal which are available in the
market where I normally do my food
shopping
II. Local variety brinjal
III. Hybrid brinjal
IV. Other (please specify)
5. What is the distance between your
household and the market from where
you normally purchase your vegetables?
…………………………… (in Km)
Section B: Knowledge of Bt-brinjal
1. Have you heard about Bt-brinjal
before?
Yes No
2. If Yes, from whom have you heard
about Bt-brinjal?
(Please indicate all the sources from
where you have heard about bt-
brinjal)
Codes: 1=Local farmers, 2=Local Market,
3=Friends/Relatives, 4= NGO, 5=Media
(Newspaper,/TV/Radio), 6=Other (please
specify)

134
Bt-brinjal in Bangladesh
✓ Bt-brinjal is a new variety of brinjal which has been developed to give resistance against
the fruit and shoot borer (FSB) insect. The fruit and shoot borer (FSB) insect is the most
voracious insect that affects brinjal.
✓ Bt-technology is a technology transfer project and developed by Mahyco (an Indian
Company), with the collaboration of Cornell University and Funded by USAID.
✓ Bangladesh Agricultural Research Institute (BARI) developed four varieties of Bt-brinjal
and it was approved for limited cultivation in Bangladesh in 2013.
✓ Now more than 200 farmers in Bangladesh are producing Bt-brinjal.
✓ It reduces the use of pesticide in brinjal fields. Some estimates suggest it can reduce
pesticides spraying by up to three-quarters (75%) and as a result there is less pesticide
residue in Bt-brinjal fruits.
✓ Bt-brinjal has less insect damage than the regular brinjal.
✓ Bt-brinjal contains the same nutritional value as the regular brinjal.
Section C: Willingness to buy
1. Would you willing to buy Bt-brinjal if it is available in the local market?
Yes No Don’t know
3. Please indicate the one most useful source of information about Bt-brinjal from
the above categories in question 2.
4. Did you find Bt-brinjal in the
market from where you normally do
your food shopping?
Yes
No
5. Have you bought Bt-brinjal for
your household before?
I. Yes, I bought Bt-brinjal before.
II. No, I never bought Bt-brinjal
before.
III. I am not sure
6. How did you recognize Bt-brinjal
in the market?
I. Bt-brinjal was labelled in the market
II. The retailer told me what it was
III. Other (please specify)
7. How knowledgeable are you about Bt-brinjal?
Not
knowledgeable
(1)
Slightly
knowledgeable
(2)
Somewhat
Knowledgeable
(3)
Moderately
Knowledgeable
(4)
Very
Knowledgeable
(5)

135
2. If Yes, why?
(please pick the one most
important reason)
I. It has the same nutritional value as
regular brinjal
II. It has less pesticide residue
III. It has less insect damage than regular
brinjal
IV. Other (please specify)
3. If No, Why?
(please pick the one most
important reason)
I. I haven’t heard about it
II. I believe it would be more expensive
than regular brinjal
III. I believe it may be harmful to health
IV. I believe it may be harmful for
environment
V. I don’t know enough about it
VI. Other (please specify)
Section D: Perceptions and attitudes toward Bt-brinjal
Please indicate the extent to which you agree or disagree with the following statements on a scale of 1
to 5; where 1 = strongly disagree and 5 = strongly agree.
Strongly
Disagree
(1)
(2)
(3)
(4)
Strongly
Agree
(5)
2. I would buy Bt-brinjal if it contained the same level
of nutritional value as regular brinjal
3. I would buy Bt-brinjal if it contained less pesticide
residue than regular brinjal
4. I would buy Bt-brinjal if it is less expensive than the
regular brinjal
5. I would buy Bt-brinjal if it was not harmful to health
Section E: Socio-demographic information
Sex Male Female
Age :
Family size (household
members)
:
1. Do you think that biosafety rules and regulations play an important role in the adoption process of
Bt-brinjal?
Yes, I think biosafety
rules are important
No, I don’t think biosafety rules are
important
Don’t know
136
Education
:
No Schooling
(1)
Primary
(2)
Secondary
(3)
College
(4)
Other
Specify
(5)
Main Occupation : Farming Not Farming
If not farming, please
mention the type of
occupation
:
Government
Service
Business Teaching Other Specify
Annual Income : Farming ………….(TK) Not-farming ……………(TK)
Any other comments (optional)
END SURVEY
THANK YOU