understanding the relationship between performance
TRANSCRIPT
Clemson UniversityTigerPrints
All Dissertations Dissertations
8-2017
Understanding the Relationship betweenPerformance Characteristics, Shot Selection andDecision-Making in the Game of TennisDotan Israel ShvorinClemson University, [email protected]
Follow this and additional works at: https://tigerprints.clemson.edu/all_dissertations
This Dissertation is brought to you for free and open access by the Dissertations at TigerPrints. It has been accepted for inclusion in All Dissertations byan authorized administrator of TigerPrints. For more information, please contact [email protected].
Recommended CitationShvorin, Dotan Israel, "Understanding the Relationship between Performance Characteristics, Shot Selection and Decision-Making inthe Game of Tennis" (2017). All Dissertations. 2026.https://tigerprints.clemson.edu/all_dissertations/2026

Understanding the relationship between performancecharacteristics, shot selection and decision-making in the
game of tennis
A Dissertation
Presented to
the Graduate School of
Clemson University
In Partial Fulfillment
of the Requirements for the Degree
Doctor of Philosophy
Industrial Engineering
by
Dotan Israel Shvorin
August 2017
Accepted by:
Dr. Kevin Taaffe, Committee Chair
Dr. Rae Cho
Dr. Joel Greenstein
Dr. Sandra Eksioglu

Abstract
In order to improve tennis player performance, we first need to investigate the features of performance
that define a tennis player. This research begins with a focus on understanding how performance errors occur
in the game. Over a span of two years, data were collected and analyzed in order to demonstrate the impact
of various performance characteristics on the player’s capability. The outcome of this work was twofold. The
research has been employed by the Clemson University tennis program to design improved training drills.
The research has also been used to form a baseline for making decisions at the management level.
When managing a tennis program for a Division 1 school such as Clemson, recruiting is achieving
higher levels of success. Since recruiting depends heavily on a player’s performance characteristics evaluation,
expanding the gained knowledge in this area seems a natural development. Concluding a preliminary review
of recruiting processes beyond the sport of tennis, it became clear that a gap exists in evaluating the decision-
making nature of the player. While some players may present a more strategic style, others may lean toward
a tactical mind set, and some will be able to adapt to both when required. In order to fulfill this gap,
a theoretical framework is presented in this work, that bridges between performance characteristics and
decision making. Utilizing certain situations that the player will face in in the game, the player’s decision-
making style can be evaluated when all the alternatives have been considered and compared. The best
response to a scenario will vary between recruiters depending on the decision making profile they desire in
a potential recruit. The suggested framework has been tested in a small scale case study with the Clemson
Club Tennis team. The results demonstrate certain differences between the players’ decision-making styles
and was used as an exploratory tool to understand a player’s metal or analytical reaction (as opposed to
physical reaction) to the game situation.
With knowledge gained from exploring both performance characteristics and decision-making abil-
ities, a logical progression was to assess how these components of a player’s game would work in practice.
This knowledge was put to the test in the final research chapter - identifying the impact of fatigue in a target
ii

selection game and improving player performance (i.e., scoring on the targets) via informed decision making
based on a player’s physical state. In this section, a tennis game and a computer simulation model were
used in order to illustrate to tennis players how to make better decisions when considering their performance
under fatigue. While the players are making decisions based on their perceived ability to hit the target, their
biodata is captured to identify trends of heart rate, stress levels, shot acceleration, and skin temperature over
time. In addition, each player’s shot selection and success rate were recorded to identify patterns in their
reasoning. As heart rate was the main biodata identified as significant, a simulation model embedding a
player’s heart rate data, as well as his or her success rate in hitting each target and target selection decisions,
in order to test better shot selection or decision making to improve overall score.
The contribution of this research could support competitive college tennis programs with specific
applications to practice, training and recruiting.
iii

Dedication
I dedicate this research to the people who made it possible for me to develop this area of interest. To
my family, who have provided love and support when faced with life challenges. To my friends, who provided
valuable insights and great times together. To my mentors, who shaped my capabilities and patiently waited
to see their hard work come to fruition. To my colleges, who work with me in many settings as we explore
new research areas. Lastly, to my students, who provided research ideas, thoughts and emotions that have
shaped my point of view. Without these people, I could not have reach this stage in my life, thus I humbly
cherish their contribution to every aspect in this work.
iv
Acknowledgments
Many people are involve in this research and contribute in many aspects. The industrial engineering
department has demonstrated its support in providing recognition to our efforts. With the help of Dr. Smith,
department chair, we have been given a laboratory to conduct our experiments as well as IT support from
Mr. Clark. This has been a great encouragement for our research efforts.
The creative inquiry (CI) program have been our main financial support as an internally funded re-
search initiative. Altogether, this research expenditures totaled to $20,000 worth of equipment and software.
The program promotes the collaboration of undergraduate students into research endeavors with faculty and
graduate students. It has been my pleasure to lead such a research group when focusing on this research
area. The Watt’s family innovation center has provided us a unique learning environment where our tech-
nology could be optimized. The supporting efforts of Dr. Barbara Speziale, are tremendous in promoting
our research endeavors. Mr. Burns and Mrs. Lockhart provided endless technical support in operating the
advance technological capabilities of the innovation center, to accommodate our research activities.
Specialist that have contribute beyond the call of duty have conducted various type of activities
with our research group. Dr. Stewart, former director of the student disability center in Clemson university,
provided workshops as well as research guides to our research group. She has been an incredible source of
inspiration in utilizing our research to investigate disability conditioning. In the same note, Dr. Ramsay,
director of the Marcus Autism Center in Emory university, has provided us with a unique look on running
longitude research as well as insight on laboratory settings. Miss. Norungolo, a specialist in student disability
at Clemson university, has work with us in developing our understanding of attention deficit / hyper active
(ADHD) disorder. Her efforts have led to a collaboration with the disability center as well as harness
the support of the Dr. Griffin, dean of undergraduate studies. These specialist have shaped the vibrant
atmosphere of our research group and promoted our ideas with a methodological approach and guides.
Undergraduate students have been a major part of this research as they contribute to the experiments
v

design and execution. The research have utilized over 70 undergraduate students, who were involved in
multiple aspects and performed a variety of activities to explore this research area in its broad perspective.
They have been the back bone of this research and with out their participation, this research could not have
developed to this stage.
Last but not least, Dr. Kevin Taaffe has been my mentor for the last six years. I have learned so
much from him when accustoming to Clemson culture, overcoming my learning disabilities, planning and
running an internally funded research program, teaching simulation classes, and engineering the operating
room of the future (RIPCHD.OR, AHRQ). Dr. Taaffe has invested efforts in developing my skills and I can’t
learn enough from him, as we overcome many challenges together.
These people have been instrumental in my development as a researcher and I am looking forward
to continue our relationships beyond Clemson university.
vi
Table of Contents
Title Page . . . . . . . . . . . . . . . . . . . . . . . . . . . . . . . . . . . . . . . . . . . . . . . . i
Abstract . . . . . . . . . . . . . . . . . . . . . . . . . . . . . . . . . . . . . . . . . . . . . . . . . ii
Dedication . . . . . . . . . . . . . . . . . . . . . . . . . . . . . . . . . . . . . . . . . . . . . . . . iv
Acknowledgments . . . . . . . . . . . . . . . . . . . . . . . . . . . . . . . . . . . . . . . . . . . v
List of Tables . . . . . . . . . . . . . . . . . . . . . . . . . . . . . . . . . . . . . . . . . . . . . . ix
List of Figures . . . . . . . . . . . . . . . . . . . . . . . . . . . . . . . . . . . . . . . . . . . . . . x
1 Introduction . . . . . . . . . . . . . . . . . . . . . . . . . . . . . . . . . . . . . . . . . . . . . 11.1 Background . . . . . . . . . . . . . . . . . . . . . . . . . . . . . . . . . . . . . . . . . . . . . . 11.2 Motivation . . . . . . . . . . . . . . . . . . . . . . . . . . . . . . . . . . . . . . . . . . . . . . 21.3 Structure . . . . . . . . . . . . . . . . . . . . . . . . . . . . . . . . . . . . . . . . . . . . . . . 31.4 Research Questions . . . . . . . . . . . . . . . . . . . . . . . . . . . . . . . . . . . . . . . . . . 4
2 Improving Tennis Player Performance Using System Development InterpretationsMethodology . . . . . . . . . . . . . . . . . . . . . . . . . . . . . . . . . . . . . . . . . . . . . 62.1 Abstract . . . . . . . . . . . . . . . . . . . . . . . . . . . . . . . . . . . . . . . . . . . . . . . . 62.2 Introduction . . . . . . . . . . . . . . . . . . . . . . . . . . . . . . . . . . . . . . . . . . . . . . 62.3 Literature review . . . . . . . . . . . . . . . . . . . . . . . . . . . . . . . . . . . . . . . . . . . 82.4 SDI methodology development . . . . . . . . . . . . . . . . . . . . . . . . . . . . . . . . . . . 112.5 SDI methodology implementation with the Clemson tennis program . . . . . . . . . . . . . . 132.6 Future research . . . . . . . . . . . . . . . . . . . . . . . . . . . . . . . . . . . . . . . . . . . . 222.7 Discussion . . . . . . . . . . . . . . . . . . . . . . . . . . . . . . . . . . . . . . . . . . . . . . . 222.8 Conclusions . . . . . . . . . . . . . . . . . . . . . . . . . . . . . . . . . . . . . . . . . . . . . . 232.9 References . . . . . . . . . . . . . . . . . . . . . . . . . . . . . . . . . . . . . . . . . . . . . . . 23
3 Improving The Player’s Recruitment Process Using Scenario-Based Decision MakingAnalysis . . . . . . . . . . . . . . . . . . . . . . . . . . . . . . . . . . . . . . . . . . . . . . . . 273.1 Abstract . . . . . . . . . . . . . . . . . . . . . . . . . . . . . . . . . . . . . . . . . . . . . . . . 273.2 Introduction . . . . . . . . . . . . . . . . . . . . . . . . . . . . . . . . . . . . . . . . . . . . . . 283.3 The Recruitment Process and its Tools . . . . . . . . . . . . . . . . . . . . . . . . . . . . . . . 293.4 Player Recruitment using Game Theory . . . . . . . . . . . . . . . . . . . . . . . . . . . . . . 323.5 The Recruitment Framework . . . . . . . . . . . . . . . . . . . . . . . . . . . . . . . . . . . . 333.6 Case Study: Decision Making Evaluation of College Tennis Players . . . . . . . . . . . . . . 493.7 Conclusions and Future Research . . . . . . . . . . . . . . . . . . . . . . . . . . . . . . . . . . 543.8 Aknowledgements . . . . . . . . . . . . . . . . . . . . . . . . . . . . . . . . . . . . . . . . . . . 553.9 References . . . . . . . . . . . . . . . . . . . . . . . . . . . . . . . . . . . . . . . . . . . . . . . 553.10 Appendix . . . . . . . . . . . . . . . . . . . . . . . . . . . . . . . . . . . . . . . . . . . . . . . 57
vii

4 Improving a Tennis Player’s Shot Selection by Accounting for Fatigue . . . . . . . . . . 604.1 Abstract . . . . . . . . . . . . . . . . . . . . . . . . . . . . . . . . . . . . . . . . . . . . . . . . 604.2 Introduction . . . . . . . . . . . . . . . . . . . . . . . . . . . . . . . . . . . . . . . . . . . . . . 604.3 Motivation and literature . . . . . . . . . . . . . . . . . . . . . . . . . . . . . . . . . . . . . . 614.4 Methods . . . . . . . . . . . . . . . . . . . . . . . . . . . . . . . . . . . . . . . . . . . . . . . . 644.5 Results and discussion . . . . . . . . . . . . . . . . . . . . . . . . . . . . . . . . . . . . . . . . 674.6 Simulation and optimization modeling . . . . . . . . . . . . . . . . . . . . . . . . . . . . . . . 744.7 Discussion . . . . . . . . . . . . . . . . . . . . . . . . . . . . . . . . . . . . . . . . . . . . . . . 834.8 Conclusions . . . . . . . . . . . . . . . . . . . . . . . . . . . . . . . . . . . . . . . . . . . . . . 834.9 Acknowledgments . . . . . . . . . . . . . . . . . . . . . . . . . . . . . . . . . . . . . . . . . . . 844.10 Reference . . . . . . . . . . . . . . . . . . . . . . . . . . . . . . . . . . . . . . . . . . . . . . . 844.11 Appendix . . . . . . . . . . . . . . . . . . . . . . . . . . . . . . . . . . . . . . . . . . . . . . . 86
5 Conclusions and Discussion . . . . . . . . . . . . . . . . . . . . . . . . . . . . . . . . . . . . 875.1 Main Research Findings . . . . . . . . . . . . . . . . . . . . . . . . . . . . . . . . . . . . . . . 875.2 Research contributions . . . . . . . . . . . . . . . . . . . . . . . . . . . . . . . . . . . . . . . . 885.3 Shaping my professional approach . . . . . . . . . . . . . . . . . . . . . . . . . . . . . . . . . 905.4 Future endeavors . . . . . . . . . . . . . . . . . . . . . . . . . . . . . . . . . . . . . . . . . . . 91
viii

List of Tables
2.1 Error list and relative weight . . . . . . . . . . . . . . . . . . . . . . . . . . . . . . . . . . . . 142.2 First order relationships . . . . . . . . . . . . . . . . . . . . . . . . . . . . . . . . . . . . . . . 182.3 Second order relationships . . . . . . . . . . . . . . . . . . . . . . . . . . . . . . . . . . . . . . 192.4 Third order relationships . . . . . . . . . . . . . . . . . . . . . . . . . . . . . . . . . . . . . . . 21
3.1 Performance characteristics assessment . . . . . . . . . . . . . . . . . . . . . . . . . . . . . . . 383.2 Performance characteristics assignment . . . . . . . . . . . . . . . . . . . . . . . . . . . . . . . 393.3 Tactic benefits and costs for player 1 . . . . . . . . . . . . . . . . . . . . . . . . . . . . . . . . 393.4 Execution capability scale . . . . . . . . . . . . . . . . . . . . . . . . . . . . . . . . . . . . . . 403.5 Scenario (x) tactics expected payoff summary . . . . . . . . . . . . . . . . . . . . . . . . . . . 413.6 Scenario (y) summary 1 . . . . . . . . . . . . . . . . . . . . . . . . . . . . . . . . . . . . . . . 423.7 Localized decision making cut off for tactic 5 . . . . . . . . . . . . . . . . . . . . . . . . . . . 443.8 Scenario (y) summary 2 . . . . . . . . . . . . . . . . . . . . . . . . . . . . . . . . . . . . . . . 443.9 Sample grading scale with five possible answers . . . . . . . . . . . . . . . . . . . . . . . . . . 523.10 Tactical data . . . . . . . . . . . . . . . . . . . . . . . . . . . . . . . . . . . . . . . . . . . . . 573.11 Tactical data when in play and its expected payoff . . . . . . . . . . . . . . . . . . . . . . . . 58
4.1 Statistical differences between targets in moderate and intense drill settings . . . . . . . . . . 694.2 Statistical testing: differences in bio-markers rate of change . . . . . . . . . . . . . . . . . . . 704.3 Statistical testing: average bio-marker trends in target hitting . . . . . . . . . . . . . . . . . 714.4 Statistical testing: accuracy and consistency differences . . . . . . . . . . . . . . . . . . . . . 734.5 Heart rate thresholds per player . . . . . . . . . . . . . . . . . . . . . . . . . . . . . . . . . . . 754.6 Probability of success per heart rate threshold . . . . . . . . . . . . . . . . . . . . . . . . . . . 764.7 Results from calibration of the simulation model . . . . . . . . . . . . . . . . . . . . . . . . . 784.8 Decision pattern testing results . . . . . . . . . . . . . . . . . . . . . . . . . . . . . . . . . . . 794.9 Comparison between decision-making patterns . . . . . . . . . . . . . . . . . . . . . . . . . . 81
ix
List of Figures
2.1 SDI algorithm example . . . . . . . . . . . . . . . . . . . . . . . . . . . . . . . . . . . . . . . . 162.2 SDI aggregating statistics method logic . . . . . . . . . . . . . . . . . . . . . . . . . . . . . . 17
3.1 Mapping possible strategies and tactics . . . . . . . . . . . . . . . . . . . . . . . . . . . . . . . 363.2 Structuring benefit, cost and execution quality to the decision making tree . . . . . . . . . . . 413.3 The expected payoff from game plan possibilities . . . . . . . . . . . . . . . . . . . . . . . . . 463.4 Summarized results from four different players . . . . . . . . . . . . . . . . . . . . . . . . . . 53
4.1 Experiment court structure . . . . . . . . . . . . . . . . . . . . . . . . . . . . . . . . . . . . . 654.2 Heart rate comparison between targets and drill intensity . . . . . . . . . . . . . . . . . . . . 684.3 Differences in heart rate based on drill settings . . . . . . . . . . . . . . . . . . . . . . . . . . 704.4 Accuracy and consistency in the moderate and intense drill settings . . . . . . . . . . . . . . 724.5 The players decision breakdown . . . . . . . . . . . . . . . . . . . . . . . . . . . . . . . . . . . 734.6 Modeling outline . . . . . . . . . . . . . . . . . . . . . . . . . . . . . . . . . . . . . . . . . . . 744.7 Simulation outline . . . . . . . . . . . . . . . . . . . . . . . . . . . . . . . . . . . . . . . . . . 764.8 Optimization logic addition . . . . . . . . . . . . . . . . . . . . . . . . . . . . . . . . . . . . . 804.9 Optimization results . . . . . . . . . . . . . . . . . . . . . . . . . . . . . . . . . . . . . . . . . 814.10 Optimization sequencing results . . . . . . . . . . . . . . . . . . . . . . . . . . . . . . . . . . . 82
x

Chapter 1
Introduction
1.1 Background
This research was born from the integration of engineering tools into player performance as a small
project for the Clemson tennis team program. As a researcher and a coach, I was able to collect data
on each player, creating a rich data set from video recording to match statistics. Analyzing this data, I
identified initial relationships that could directly affect their training structure. Upon implementation of
short term improvement features with positive outcomes, it became evident that additional research was
needed if changes to the program were to be achieved.
A request from the tennis program management level (director Bill D’Andrea) pushed me to pursue
a robust method that would expose a variety of features that affect player performance. It was critical that
we involve several individual’s such as the management director, the tennis coaches, the physical trainers,
the academic supervisor, the nutritionist, and the players on the team. This research began with a process
improvement attitude from all specialists involved, and excitement was beginning to foster motivation among
all participants. The research insights pointed towards evidence-based program approach. As a result, a
”high performance team” management structure was established in January 2014. In this structure, each
trainer contributed his players’ records into one data set that allowed the management team to capture the
team status and make decisions based on inputs from each specialist involved.
Upon this successful experience in working together with various sports management specialists,
trainers and coaches, the head coach of the tennis program was really determined to improve their recruiting
process. We had many conversations on how to capture a broader picture of player performance; however the
1

recruiting process is not well suited for this kind of approach. I decided to further investigate the recruiting
process by leading multiple Creative Inquiry teams (comprised of Clemson undergraduate students ) and
began working with more sports management specialists from the Clemson athletic program.
Working with support from the students, we studied the recruiting process across different types of
sports. Focusing on the decision-making evaluation, I utilized decision trees and game theory to quantify
the available choices for a player in a game, resulting in a pool of questions with answers that can be easily
ranked. Furthermore, the answers rank will help to identify if the decision-making style of the player fits the
coach expectation for that position in the game.
In my final phase of this research project I began to explore how performance characteristics impact
decision-making. Fatigue is perhaps an easy concept to grasp, but its impact on decision-making has not
been fully explored. Specifically in tennis, it is demonstrated by researchers that fatigue reduces the level
of the player performance due to physiological, psychological and emotional implications (Ferranti et al.
(2001),Davey et al. (2002), Lyons et al. (2013), Pearcey et al. (2015), Bachasson et al (2016), and Bouaziz
et al. (2016) just to name a few). The work that is presented in this dissertation (specifically Chapter 4),
aims to identify how fatigue should be handled in a target selection game. Since fatigue degrade the player
performance (this is shown in the chapter analysis as well as in the literature), at a certain point the player
will have to adapt his decisions to accommodate for that change. In order to explore this logic, a drill is
designed to capture the way that the player will adapt when he gets tired and as he recuperates. In this
research, I tested the effect of fatigue on several players, and I explain the patterns behind individual shot
selection and how performance (and ultimately success in shot selection) can be improved.
1.2 Motivation
My research contains an environment that I have pursued professionally as a junior tennis player.
Representing the state of Israel at the Maccabi games, playing in the Spanish Federation League, and
participating in various national competitions have provided me a firm background in the sport of tennis.
At the age of 15 I was offered a scholarship from the Sergi Bruguera academy in Barcelona but could not
pursue that dream as my family could not financially support it. From this phase in my life, I carried a
feeling of a missed opportunity to fulfill my dream of becoming a professional player. Through the years of
my life devoting to this sport I began coaching players of all ages, from little toddlers who barely can hold
a racket to senior players who overcome various difficulties in order to play the game. By the age of 18, I
gained experience from training, learning, teaching and performing.
2

Enlisting to the military is mandatory in Israel, and I volunteered to serve in a special forces unit
called Maglan. In this unit, cadets train for two years before completing their required level of proficiency,
ranging from hand to hand combat to missile guidance systems. Coming from a very strict program of
performance in the tennis world, the military program pushed performance to a whole new level. In the
tennis wold, you are independent but in the military you are a part of a team. In the tennis world you
engage in the game when you are in perfect conditions - rested, energize, focused and prepared. However
in the military you train to perform at your best in the worst of conditions, such as when you are tired,
weak, hungry, exhausted, cold or hot, injured or hurt, as well as under great uncertainty. From these
experiences, and my resulting higher level of self control and situational awareness, my tennis game has
improved significantly as I experience new levels of physical, emotional and mental capability.
A month before my service time was supposed to end, I was severely injured in the second Lebanon
War. The war left me physically disabled as well as demonstrating post traumatic stress disorder (PTSD)
behavior. The rehabilitation facility had just received a new interactive game for patients to improve their
physical training as they interact with a big screen. In an unthinkable coincidence, the chosen game for the
training was tennis. I had controllers that followed my striking motion and transferred it to the avatar in
the game, as if it was me who hit the ball to the second player in the game. I still hold the highest score in
the facility, yet to be broken.
Coming to Clemson University I naturally was drawn to the tennis courts. I immediately got an
offer to participate as a volunteer coach for the women’s tennis team. This position lead to some of the ideas
presented in this research.
Tennis has always been a big part of my life and miraculously finds me at every turn that I take. I
love everything about the game, from the equipment, to the social relationships and the challenges that the
game presents. It is with great pleasure that I present this research into how individuals can achieve more
than what their physical abilities would imply.
1.3 Structure
The work presented is organized in a way that allows the reader to see the natural progression
of how the research was conducted, first through an exploration into the connections between personal
characteristics and performance, then through a model that quantifies decision-making while accounting
for opponent characteristics, and finally through an examination of a specific performance characteristic –
fatigue. As we zoom into our application outcome, the logical development is illustrated. The breakdown of
3
the dissertation is as follows:
• Chapter two presents a process improvement approach that investigated the cause and effect relation-
ship of tennis player performance. Implementing a quality engineering methodology with the Clemson
women’s tennis team program resulted in a restructuring scheme for managing the program.
• In chapter three, a theoretical framework for evaluating the decision-making nature of a player is
developed and tested in a small case study. More work in this area will be pursued outside of the
dissertation scope.
• The fourth chapter in this research binds the two former chapters conceptual work, as it investigate the
relationship between specific performance characteristic (i.e., fatigue) and the decision-making nature
of the player in a target selection game.
1.4 Research Questions
The research questions presented here show the logical progression of the work over time. In chapter
two, the following research questions guided the collaborated work with the women’s tennis program.
1. What are the tennis player characteristics of performance?
2. How do these characteristics impact player performance?
Working to answer these questions exposed the complexity of the player performance and aided
with the improvement processes that occur in the athletic department. One of the following issues of process
improvement for the athletic program was recruiting, thus chapter three is guided by the following three
research questions. The first question guided the literature review in the chapter, the second question
generated a theoretical framework which is presented, and the final question was explored in a case study at
the end of the chapter.
1. What are the gaps in the recruiting process in different sports?
2. What solutions can be develop in order to close the gaps illustrated in the research?
3. How can we make initial examination of the solution framework?
Isolating one specific performance characteristics impact on decision-making, chapter four present
how fatigue influence the player performance when guided by the following questions.
4

1. How fatigue impacts tennis player performance in a target selection game?
2. How can player decision-making be improved when considering the impact of fatigue over time?
The first question drove the design of the drill and the game that is presented in the chapter and
the second question promoted a problem solving modeling using simulation. The answers to these questions
are illustrated in the chapters but summarized in the conclusion section of the dissertation.
5
Chapter 2
Improving Tennis Player Performance
Using System Development
Interpretations Methodology
2.1 Abstract
This research demonstrates a unique analytical approach to improving a player’s performance in
the game of tennis. We introduce a system development interpretations (SDI) methodology for associating
player characteristics and factors in a hierarchical structure. We then show how this tool is applied in a
human performance environment such as tennis. This approach was developed as a multidisciplinary quality
tool for process improvement that identifies factor dependencies and depicts their impact on the resulting
player performance. From the implementation of the SDI methodology, the research was able to define the
tennis player’s difficulties and it has allowed the researchers to build an entire team profile of the Clemson
University tennis program as well as to introduce important conceptual foundations in this field.
2.2 Introduction
In order to achieve a high performance level in the tennis match, the tennis player must understand
the relationship between different factors that affect his level of performance. Those factors can be divided
6

into two main concentrations: internal and external. The internal factors could be characterised as internal
inputs to our decision-making process such as stroke technique (Landlinger et al., 2012; Pugh et al., 2003),
body resources management (Hofe and Fery, 1991; Mead and Drowarzky, 1997) and emotional intensity
(Fernandez et al., 2006; Gondola and Wughalter, 1991; Hornery et al., 2007). The external factors could be
characterised as external inputs to our decision-making process such as court conditions, weather conditions
and the opponent game type (George, 1973; Howard, 1980; ODonoghue and Ingram, 2001). The key to
achieving a high level of performance lies within the ability to translate the external inputs and the internal
inputs into a winning game plan. The process of developing a game plan is not an open loop process but
rather a closed one. A game plan could change at any time due to a change in the internal or external
inputs (Weinberg et al., 1980; Whitaker-Bleuler, 1982). A winning game plan can be considered similar in
its process to quality methodologies seen in production systems. However, with human performance, system
quality is more difficult to establish. When we consider a production process, there are many tools that
are used to increase the quality of the process, the capacity of the production line and the efficiency of
the machines. Those tools can quantify data from the production process, thus allowing mathematical or
statistical methods to be employed. This research is attempting to create the same quality approach which
is embedded in the industry, to increase the tennis player’s performance level. We have used the system
development interpretations (SDI) methodology (Shvorin, 2011) which was developed to improve the plastic
injection manufacturing process. The SDI methodology is enabling us to identify the ways in which factors
in manufacturing are related. In using the SDI method in the plastic injection manufacturing setting better
machine tolerances were defined which ultimately lead to manufacturing error reduction and material savings.
Quality control protocols for material handling and work force quality assurance proceedings were created to
ensure that a high level of performance was established. Furthermore, key performance indicators (KPI) were
created in order to better schedule maintenance applications and to increase production efficiency. However,
we note that the implementation of the SDI methodology on human performance is not a simple plug and
play methodology; it requires an understanding of how to define human behavior within an engineering
approach. With the SDI method a team profile of performance measurements was developed. With the
help of the tennis program coaches, behavior characteristics were identified and solution applications were
implemented. An in-depth literature review will provide information about the history of the tennis game
development as well as a relevant range of the game’s analysis methodologies. Next we will discuss the SDI
methodology development and its implementation on the tennis game, with the creation of the tennis team
profile. After analyzing the SDI methodology outcomes, we will open a discussion on the research findings
7
and conclude the future possibilities for advance research
2.3 Literature review
The tennis game development takes us back to the 12th century as a part of a rivalry between two
opponents. In those times, games were developed to test one person’s ability to overcome an opponent. The
outcome of the game or test was heavily considered in the ability to maintain a certain status, class and
honor among the relevant societies. The name of the game refers to the word tenez in French which means
receive a key feature of the actual game. Over the last 100 years, the game has advanced in many ways (from
equipment and venues to the ability of the players) (Antnez et al., 2012). In particular, not only were the
physical characteristics of the player advancing but the mental approach to the game was also advancing.
The need for the player to be better, stronger, faster and more mentally prepared has opened the sport to
the research of how to attain these qualities to achieve the desired outcome. Since the game was orchestrated
by the upper class, it was driven from knowledge, which was used to overcome the opponent. The rivalry of
two opponents in the game can be defined from a wide range of behavioral characteristics of each player such
as the ability to perform, the techniques employed to execute a course of action and other strategies and
tactics. According to del Villar et al. (2007), there is a substantial difference between the levels of a player’s
performance that emerge from his or her decision-making capabilities. Experienced players consider more
characteristics in their decision-making process and have a better ability to select the right approach in a
certain scenario in order to overcome their opponent. This line of research was first explored by Nielsen and
McPherson (2001). They defined three components in the player’s performance characteristics that could
signify the differences between the levels of a player: control skill, response selection skills and response
execution. The first component measures the player’s ability to technically perform a certain stroke or
movement in a given situation. It refers to the player’s coordination, perception of space and his body bio-
mechanics potential. The second component refers to the player’s ability to select the suitable approach from
a wide variety of possibilities in order to overcome his opponent. This component describes strategic and
tactical choices that a player makes based on his interpretation of the game. The final component measures
the outcome implications from the selected approach execution. Those performance measurements proved
themselves as a way to evaluate the level of a player and to identify his weaknesses as well as his strengths.
Since this research was based on observation characteristics only, it did not address the players state of mind.
In research by Gonzalez et al. (2012) a more rigorous approach was taken based on the same method except
that it now included an interview application during the player’s match. They were able to classify a wider
8
range of features to represent the player’s level of performance. Lames (2006) extended this point of view by
adding time perspective and momentum building aspects to the performance and response characteristics
of a player, which was similar to that discussed in del Villar et al. (2007). Beyond the somewhat constant
skills and abilities of an athlete, tennis contains a complex system of cause and effect interactions, which
can result in a significant change in the actual performance level of the player. Performance level changes
are time dependent, when fatigue takes its toll for example or momentum dependent when a player wins a
few points in a row. The dynamic aspect creates numerous decision possibilities over time. As one response
is perfect for one moment in time it could be devastating for another. For example, the player can be
continuously searching for a successful strategic and tactic behavior based on the actual score or based on
the actions of the opponent. One analysis method used in Lames (2006) is the relative phase concept. This
analysis deals with the special features of the player with respect to his court positioning as a response to
the opponent’s reaction. A relative phase means that the player’s court movements are relatively similar to
one another. The relative phase is balanced when both of the players are in a proper position to hit the
ball. As the point plays out, the balance of the relative phase begins to be unstable. The unbalanced phase
ultimately results a point won or lost. This analysis was driven from signal detection theory as it allows
calculating continuous relative phase, which is mandatory because we have comparatively few strokes in the
rally. This research allowed considering three more characteristics in addition to the player’s component
descriptions such as time dependence, momentum build up and court positioning functionality. Palut and
Zanone (2005) further defined the relative phase concept as one of two relationships: In-phase or out- phase.
They also addressed the transitions between them as another indicator for court positioning characteristics.
The phases mentioned above simply tend to define the relationship between attacking and defending. When
an attack is made, we can expect a phase out which means that the balance of the relative phase is about
to be broken. If a defensive course of action is taken then we can expect a phase in which means that
the relative balance is about to be restored. Relative phase research provided further interpretation for
the player court positioning characteristics in response to the executable course of action. One of the most
dominating factors in the player’s performance received its respectable attention in Akpinar et al. (2012).
Their research dealt with anticipation abilities in racket sports. This research method of analysis used a Basin
anticipation timer, a LED bulb runway that creates the illusion of motion from the way that it operates. It
is by adjusting the speed and stopping distance of the flashing red lights that the level of anticipation could
be evaluated. The anticipation ability serves as one of the most critical attributes to the tennis player as it
demonstrates prediction abilities (Triolet et al., 2013; Williams et al., 2002). Once a player predicts the ball
9
interception location, opponent movement orientation and a decision execution outcome, he has more time
to prepare, adjust and select the best way to overcome his opponent. A shortage of this ability will result
in a disadvantage which will immediately affect the player’s level of performance. This concept extends the
research found in Lames (2006) and it provides one feature that could make a huge difference in the player
performance capabilities. Beyond the internal characteristics of a player, the performance level of a player
can be affected by external characteristics of the game such as the surface of the court, weather conditions
and equipment. ODonoghue and Ingram (2001) and Fernandez et al. (2008) addressed the court surface
attributes and how they affect the interaction between the players. There are four types of tennis court
surfaces, each one with distinct features.
The grass court poses a low level of friction, thus the ball slides on the surface instead of bouncing.
For the same reason, the player’s ability to accelerate and change direction decreases as well. In the red clay
court, the characteristics are reciprocal to those in grass because clay poses the highest friction properties.
The last two courts are the mitigation courts between the two extremes. The hard court and the light clay
(blue, green) court demonstrate more friction then grass but less friction then heavy clay (red clay). These
surfaces affect stroke variety selection and a player’s execution abilities and as mentioned earlier, each change
requires a new game plan that affects the player’s performance level. In the last section of the literature
review, we focus on the statistical characteristics of player decisions and performance over time. Research
by Klaassen and Magnus (2001) tested individual game points in relation to each other from a statistical
point of view. The research revealed that points are neither independent nor identically distributed. They
found that the outcome and characteristics of the previous point affect the current point and each point has
a slim chance of being the same as the previous point. This concept proves that the game analysis could not
be established from isolated characteristics but rather a chain of events. This means that the characteristics
of each player affect the other and result in (time-dependent) performance ability (Wong and Zigarovich,
2007). Over the past three decades, there has been a wide variety of research conducted on tennis player
performance, which range from specific player’s technical assessments (Stepien et al., 2011) to a unique
behavior analysis (Rees et al., 2000). This review raises a need for a unique analysis platform that could
establish the connection between the player’s characteristics with the necessary statistical reliance in order to
understand the path for performance improvement. In the next section, we will engage in a multidisciplinary
quality approach in order to understand the player’s characteristics and their relation to his ability to win
or lose a point (i.e., his performance level).
10

2.4 SDI methodology development
Quality is a well-established discipline in the engineering management profession (Hopp and Spear-
man, 2008). However, it took 50 years before it gained prominence as a means of process improvement
in industry. It was during the 1970s and 1980s when Japanese companies gained a significant advantage
over their competitors by implementing a just in time (JIT) methodology in their manufacturing processes.
Other countries eventually recognized the improvements being made in Japan and began developing their
own quality programs. In particular, it was not until the 1980s that US industry really took notice of the
strategic potential of the quality approach. More recently, lean manufacturing and Six Sigma continue to
be ubiquitous programs for process and quality improvement in many industries today. The main goal of
quality improvement is to reduce process randomness, process variability and increase the overall process
performance level. Our research methodology takes another step in the development of a quality approach by
examining the characteristics of the variability and how they may contribute differently to the randomness
above the process mean value or below the process mean value. Specifically, SDI analysis takes the next step
in variability reduction by asking when and where variability reduction needs to occur. We can support this
aspect of variability reduction by including defect analysis consideration into tolerance optimization. If we
can assume that there is an optimum point of operation, then tolerance definition tells us that we can have
a certain allowable variability around this optimum point and the reduction of variability may be different
in each direction from the optimum point (Shvorin, 2011). Consider the following analogy. Assume that
our goal is to find the balancing point of a beam when two people are sitting on opposite ends of the beam.
Based on the weight difference of the two people, the balancing point will shift towards the heavier person
until a balance can be established. This may cause more variability to exist on one side of the process,
leading to a significant portion of outcomes that are outside the acceptable tolerance limits. If we cannot
change the balancing point we need to reduce the distance from the heavier side to the optimum point in
order to achieve a balanced system. In order to achieve balance in the system, we need to figure out which
side is heavier (creates more defect in the system) when we consider variability definitions. If we want to
develop those concepts we need to take a step back and look at the cumulative effect of the deviations on the
system. Once we can define the cumulative effects we will be able to characterize the variability behavior
and adapt our tolerance definitions to increase our system performance capabilities. In order to achieve this
point of view, the SDI analysis method was developed. The first application of this methodology was to im-
prove a polymer injection manufacturing process. In the polymer production environment, the relationships
between the process materials and the time window for their reaction were a key ingredient in the quality of
11
the product. By identifying the material effects to one another, while considering a certain time reference,
the SDI method was able to tune the manufacturing process to achieve a higher level of performance. The
research was triggered when a leading irrigation equipment manufacturer was facing increased production
levels while managing it with a reduced workforce. This led to a rise in the defect percentage. By using the
SDI methodology, they were able to understand how those defects were created. Then, new machine toler-
ances were established and the defect percentage was reduced. SDI combines the field research knowledge
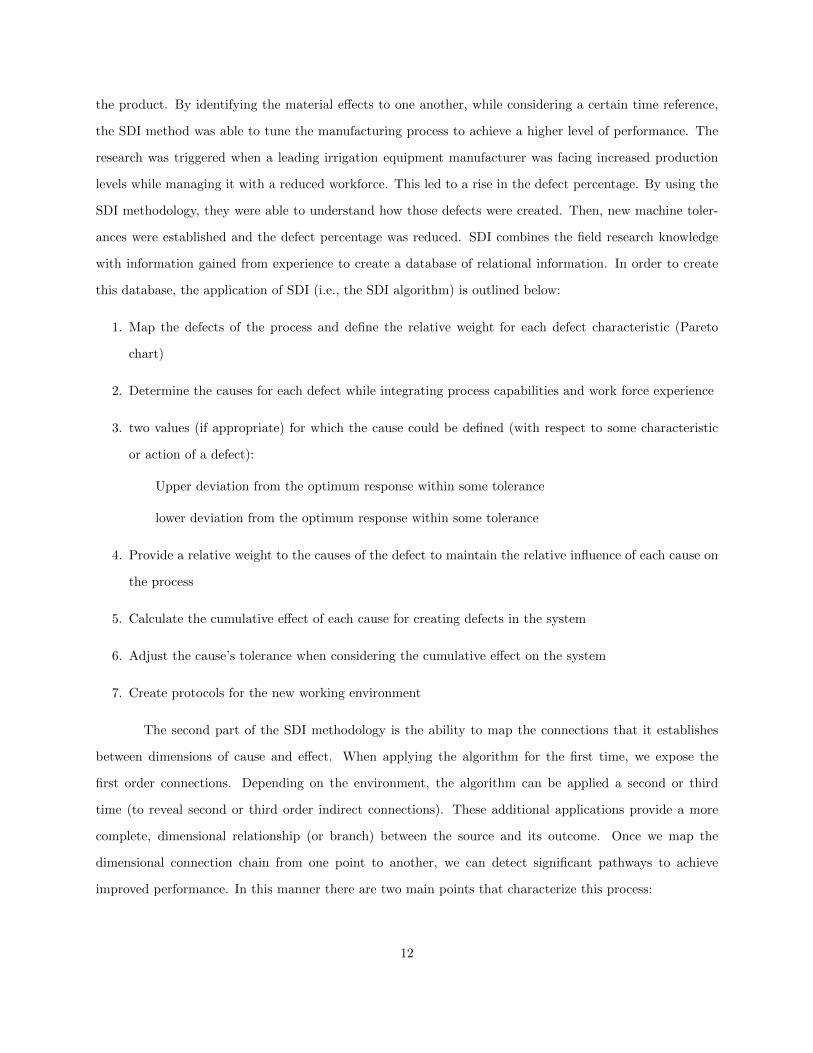
with information gained from experience to create a database of relational information. In order to create
this database, the application of SDI (i.e., the SDI algorithm) is outlined below:
1. Map the defects of the process and define the relative weight for each defect characteristic (Pareto
chart)
2. Determine the causes for each defect while integrating process capabilities and work force experience
3. two values (if appropriate) for which the cause could be defined (with respect to some characteristic
or action of a defect):
Upper deviation from the optimum response within some tolerance
lower deviation from the optimum response within some tolerance
4. Provide a relative weight to the causes of the defect to maintain the relative influence of each cause on
the process
5. Calculate the cumulative effect of each cause for creating defects in the system
6. Adjust the cause’s tolerance when considering the cumulative effect on the system
7. Create protocols for the new working environment
The second part of the SDI methodology is the ability to map the connections that it establishes
between dimensions of cause and effect. When applying the algorithm for the first time, we expose the
first order connections. Depending on the environment, the algorithm can be applied a second or third
time (to reveal second or third order indirect connections). These additional applications provide a more
complete, dimensional relationship (or branch) between the source and its outcome. Once we map the
dimensional connection chain from one point to another, we can detect significant pathways to achieve
improved performance. In this manner there are two main points that characterize this process:
12
• It is possible to achieve a multiplicative (as opposed to a linear) improvement in system performance
based on making a small (but significant) change in the source
• the difficulty of imposing a change is increasing with further iterations of the SDI algorithm
In the next section we will use this approach to analyze the Clemson tennis team in order to improve
their performance level. First, we will define the analytical approach and then we will explain the research
findings.
2.5 SDI methodology implementation with the Clemson tennis
program
Using the SDI methodology requires that we identify connections between factors that affect the
performance level. One contributing area of research in tennis is negotiation theory. Similar to tennis where
two opponents are battling to win the match, in negotiation, the two sides are trying to achieve the best deal
for each other. The foundations of negotiation theory are decision analysis, behavioral decision-making, game
theory and negotiation analysis (Alfredson, 2008; Wall, 1985). Negotiation theory provides three concepts
to characterize the interaction between two sides.
• The first concept that is integrated in to the SDI methodology from the negotiation analysis is strategy
definition. Strategy can be only one of two things: uncompromised (attack) or compromised (defend).
Similar in the conscious choice for deciding what to do (strategy), player first needs to decide whether
to attack his opponent or to defend himself from his opponent’s attack.
• The second concept inherited from negotiation analysis is tactical definition which tells us how to
perform the chosen strategy. Similar in the tennis game, the player needs to decide how he is going to
execute his attack.
• The third concept which is integrated here from negotiation analysis as behavioral decision-making is
addressed in this research as a mental mode description. This concept forces the operator to understand
why he chose this mode of operation. In tennis, this is a main feature of consideration because it points
out to the player’s decision-making triggers.
In order to begin the SDI algorithmic approach we have to define a main concept that will guide
us in the analysis process. In the SDI method we are identifying defects but what are defects in the tennis
13
player’s game. A defect in the tennis player game by definition in this research is a wrong decision-making
in the player’s game. A wrong decision does not necessarily mean that the player lost the point; it is a
statistical consideration of the long run probabilities that he will lose that point according to his decision.
For example, player A performs a touch stroke and player B did not pass the ball over the net such that
player A won the point. However, if this scenario is played ten times, player A would win the point only
once while player B would win the point nine times. If player A decides to perform a touch stroke against
player B he statistically made a wrong decision. Next, we create an error list that characterizes errors based
on all of the players on the team. In this stage the list is constructed from the knowledge of the tennis game
and the experience learned from the team performance. With the implementation of the SDI method on the
Clemson tennis team, over 50 observations of singles and doubles matches were gathered and analyzed by
the coaches. Some of the matches were evaluated live and some were evaluated through a video recording
system. As mentioned earlier, the definitions of the error list were made based on expert opinion from the
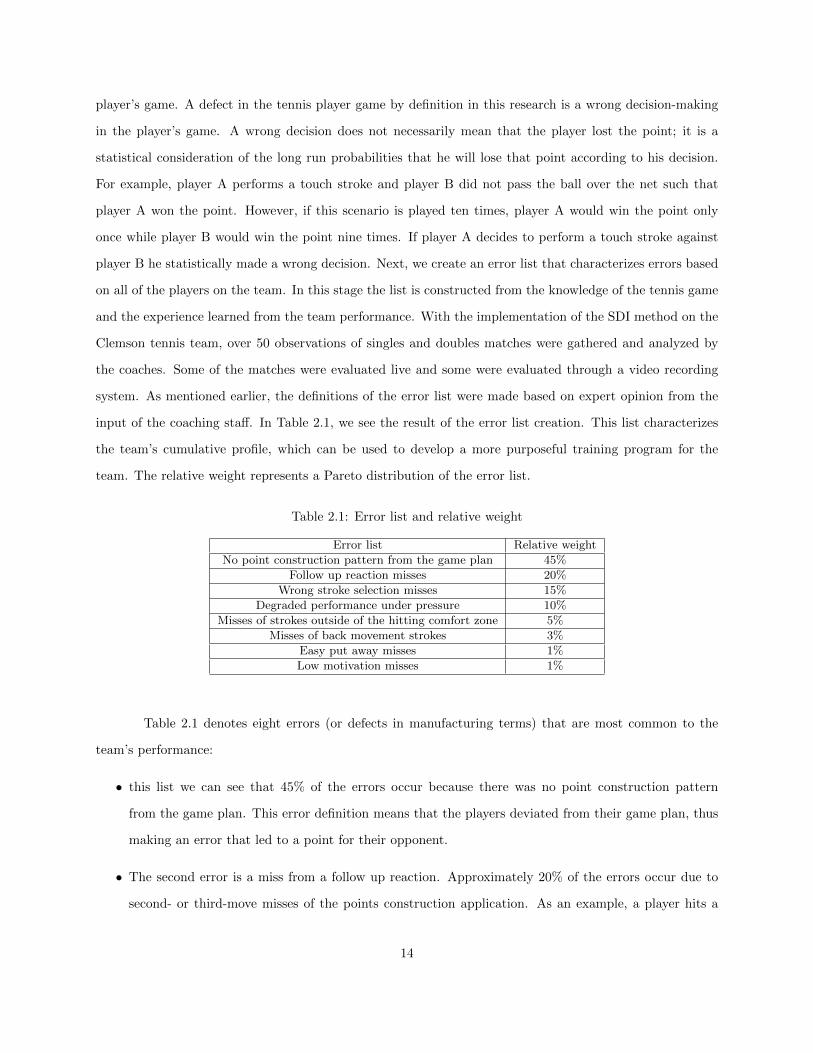
input of the coaching staff. In Table 2.1, we see the result of the error list creation. This list characterizes
the team’s cumulative profile, which can be used to develop a more purposeful training program for the
team. The relative weight represents a Pareto distribution of the error list.
Table 2.1: Error list and relative weight
Error list Relative weight
No point construction pattern from the game plan 45%
Follow up reaction misses 20%
Wrong stroke selection misses 15%
Degraded performance under pressure 10%
Misses of strokes outside of the hitting comfort zone 5%
Misses of back movement strokes 3%
Easy put away misses 1%
Low motivation misses 1%
Table 2.1 denotes eight errors (or defects in manufacturing terms) that are most common to the
team’s performance:
• this list we can see that 45% of the errors occur because there was no point construction pattern
from the game plan. This error definition means that the players deviated from their game plan, thus
making an error that led to a point for their opponent.
• The second error is a miss from a follow up reaction. Approximately 20% of the errors occur due to
second- or third-move misses of the points construction application. As an example, a player hits a
14

very powerful shot that forces their opponent to return a short ball. However, the player misses the
next pressure shot and loses the point.
• The third error is when the players choose the wrong shot to execute. For example, after the opponent
attacks, the player chooses to respond by attacking and loses control over the ball and, ultimately,
loses the point.
• The fourth error is degraded performance under pressure which means that in critical moments of
the game the player does not execute their chosen course of action as well as they would have done
otherwise. Examples of such pressure situations are break points, tie breaker games, etc.
• The fifth item addresses the ability to react to a difficult challenge shot. For instance, a player loses
the point due to failed shot execution from a difficult positioning.
• The sixth item refers to hitting the ball with a backward movement. This means that an error occurs
when a player is moving backwards while trying to execute their shot selection.
• The last two items address those points that should not be missed and points where players do not
possess the right attitude.
Once we defined our error list (defects) we can carry on with the analysis. The first group of factors
are intuitively the first order connections to the decision-making process. We can define those factors when
we examine what attributes can contribute to the creation of an error from the error list. We will get a list
of factors that can be classified to the three concentrations: strategy, tactics and mental mode. The second
order list is created when we ask the same questions (activating the SDI algorithm for the second time) but
now we are examining what elements could contribute to the factors that caused the first order error list.
We can continue in this same pattern in order to identify all factor relationships and dependencies. These
connections and dimensions are critical because once they are defined their contributions will aggregate
throughout the SDI algorithm. Consider Figure 2.1:
We see that this error has three first order causes (A, B, C) with two second order attributing causes
(W, Y) that lead to cause A. We can also see that each cause has its own relative weight within the order
level. The statistical attribution in this case is very clear and we can evaluate how a second order cause can
indirectly affect the creation of this error. Once a path or relationship is defined, this research will be able
to identify those relationships with the highest statistical effect on the players’ decision-making, the players’
performance level and the game training applications. We now introduce the three levels of connections that
we will specify as part of the SDI algorithm:
15

Figure 2.1: SDI algorithm example
1. The first order connections reveal the direct connections. Any change in these characteristics will
directly affect the performance level of the players, which would change the error list percentile at-
tributes.
2. The second order connections will be characterized by indirect connections and an indirect effect on
the player’s performance level (e.g., a change in the second level will cause changes in the first level
which will change the players’ performance level directly). A change in this order level possesses the
potential to affect the player’s understanding of the game, thereby increasing his performance level
beyond what can be done by focusing solely on the first order characteristics.
3. The third order connections address core values (or building blocks) and their connection to making
an error. These relationships possess a greater potential for performance improvement because they
contain the ability to change the player’s game perception, situational awareness and behavior.
We propose that all errors can be classified as being caused by strategic, tactical and or mental mode
failures. In order to classify characteristics as being of type strategy, tactics or mental mode, we adopt the
following leading questions.
• What caused this error? (if a characteristic answers this question, then it is strategic)
• How was this error created? (if a characteristic answers this question, then it is tactical)
• Why was this error created? (if a characteristic answers this question, then it is mental mode)
From the first implementation of the SDI methodology, we received an error list and a list of causes
to each error. We then aggregate the relative weight of an error on to its causes in order to determine the
extent to which each cause affects the error list. For simplification purposes, consider the example in Figure
2.2:
16

Figure 2.2: SDI aggregating statistics method logic
Here we see that there are two errors in our list. We can see that one error is occurring 60% of the
time while the other error occurs 40% of the time. There are three causes for the first error one strategic
cause (which explains what causes the error), one tactical cause (which explain how the error is occurring)
and one mental mode cause (which explains why the error is occurring). There is a single tactical cause for
the second error. In order to apply the statistical weighting (or effect) to our three classifications of strategic,
tactical and mental mode, we apply the following logic:
StrategicWight =
∑StrategicCausei∑
StrategicCausei +∑
TacticCausej +∑
MentalModek=
60
60 + 100 + 60= 27.3%
(2.1)
TacticalWight =
∑TacticCausej∑
StrategicCausei +∑
TacticCausej +∑
MentalModek=
100
60 + 100 + 60= 45.4%
(2.2)
MentalModeWight =
∑MentalModek∑
StrategicCausei +∑
TacticCausej +∑
MentalModek=
60
60 + 100 + 60= 27.3%
(2.3)
In Table 2.2, we present first order relationship results from our actual case study. Using this same
logic, we see that strategy (defined by three direct characteristics or traits) affects 47.5% of the error list. We
also record the cumulative error effect of each characteristic. Identifying opponent strengths and weaknesses
has a 19% effect from the strategic point of view, but this parameter affects 84% of the original error list in
Table 2.1. This implies that these strategic characteristics are connected to many items in the error list and
17

the tasks affect each error in a different way. The second concentration of factors (i.e., tactical) affects 39%
of the error list and it is also characterized by three direct characteristics or traits. The third concentration
of factors (i.e., mental mode) affects 13.4% of the error list and it is characterized by three characteristics as
well. With this structure in mind, we can now realize the most important elements of the direct connection
for improved performance.
Table 2.2: First order relationships
Direct characteristic/trait % Cumulative error effect
Strategy 47.5%
Identify opponent strengths and weaknesses 19% 84%
Classifying opponent game type 14% 59%
Comprehend and formulate a game plan 14% 62%
Tactics 39.1%
Stroke adaptation 9% 39%
Court positioning 10% 45%
Point construction 20% 85%
Mental mode 13.4%
Decreased level of physical ability 2% 9%
Decreased level of play 6% 24%
Error replications 6% 25%
From the first order relationships, we can identify two player characteristics that stand out: iden-
tifying strengths and weaknesses (strategy) and point construction (tactics). Both of these characteristics
signify that most of the errors come from inappropriate decision-making (both at the macro and micro level).
In order to understand the second level causes that affect the first level causes, we engage in the second it-
eration of the SDI method. We present the data in Table 2.3, where we can look at the micro effect of each
classification (strategy, tactics and mental mode) and the macro effect that transcends to the first level. The
second order relationship characteristics have the same statistical structure as the first order relationship
database. The SDI method was used to determine how to aggregate the relative weight on to the second
order causes.
The secondary causal relationships expose more parameters that take their toll in the performance
considerations. However, different from Table 2.2, these relationships introduce the effect on errors based
on both the over-use and under-use of any characteristic/trait. This is different than the ’yes/no’ mentality
of the first order characteristics where we evaluated whether or not a particular characteristic was present
in a player’s performance. For example, the player will make more inappropriate strategic errors when he
does not sufficiently probe (i.e., experiment to evaluate and gain knowledge about the opponent capabilities)
his opponent. If he does not probe his opponent and thus cannot identify the opponent’s strengths and
18

Table 2.3: Second order relationships
Direct characteristic/trait % Cumulative error effect
High value/over use Low value/under use
Strategy 47.5%
Probing applications 11% 30% 70%Stroke variety 14% 31% 87%Self-awareness 11% 67% 47%
Clarity of thought 11% 33% 67%
Tactics 39.1%
Reaction time 6% 40% 60%Stroke power 6% 56% 16%Stroke angle 8% 34% 80%
Stroke height level 10% 28% 98%Stroke spin 9% 13% 88%
Mental mode 13.4%
Confidence level 2% 54% 71%Self-belief 3% 65% 91%
Fear intensity 2% 42% 64%Temper implications 2% 37% 75%
Mental pressure 2% 77% 35%Stroke motivation 2% 58% 42%
weaknesses, then he will not be able to build a game plan accordingly. On the other hand, if the player
over probes his opponent, this could result in confusion and difficulty in deciding on a specific game plan.
Moreover, probing takes time, during which the player’s game plan has not really been set yet. This will
lead to the errors mentioned in Table 2.1. We summarize findings based on the subjective interpretation of
the coaching staff where the second-level SDI methodology data was applied.
• The strategic findings show that that the players (and team as a whole) should increase their probing
abilities, stroke variety and clarity of thought (i.e., separating relevant information from irrelevant
information). Reducing their self-awareness mainly implies that the player will increase his focus on
the opponent.
• The tactical findings point out that the players need to increase their stroke angle, height and spin in
order to improve their performance. In this case, we often see that the team uses more power than
they are able to control which leads to unforced errors.
• The mental mode findings indicate that the team needs to have more psychological preparation to deal
with confidence, self-belief and temper control in order to improve their performance level.
Finally, Table 2.4 allows examination of the team profile at a deeper level of consciousness. This
is an area where these characteristics can be analyzed and tested in training sessions. The last iteration
19
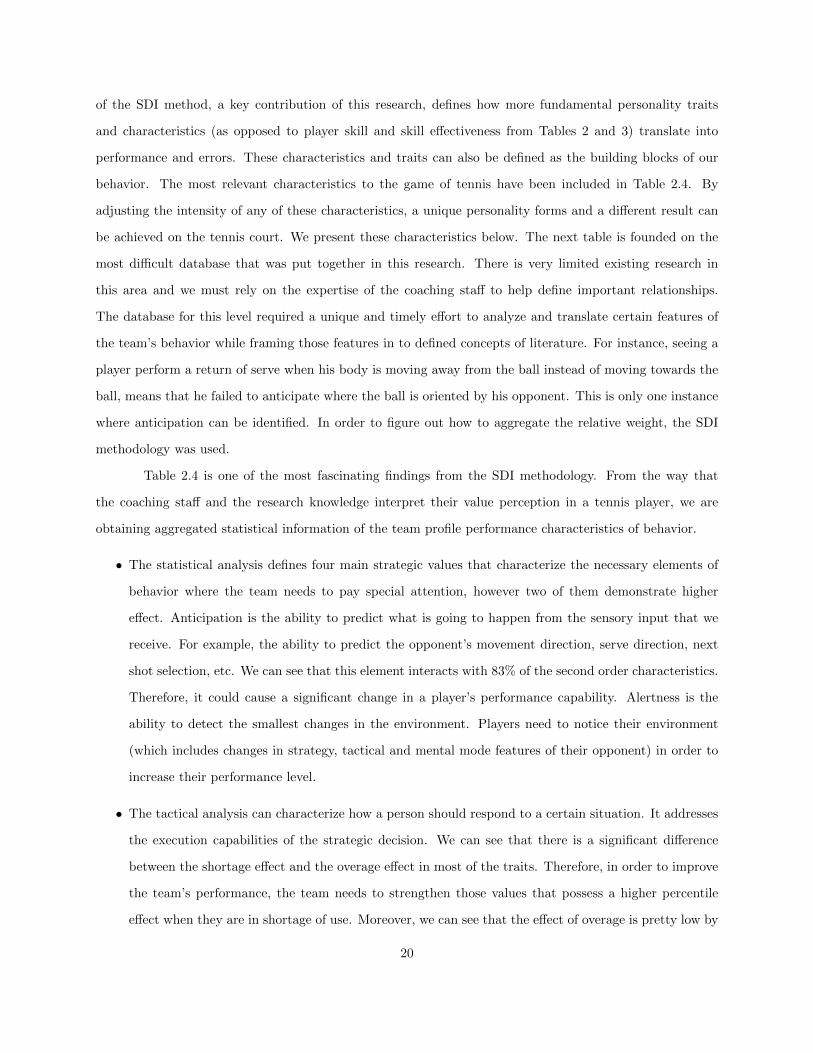
of the SDI method, a key contribution of this research, defines how more fundamental personality traits
and characteristics (as opposed to player skill and skill effectiveness from Tables 2 and 3) translate into
performance and errors. These characteristics and traits can also be defined as the building blocks of our
behavior. The most relevant characteristics to the game of tennis have been included in Table 2.4. By
adjusting the intensity of any of these characteristics, a unique personality forms and a different result can
be achieved on the tennis court. We present these characteristics below. The next table is founded on the
most difficult database that was put together in this research. There is very limited existing research in
this area and we must rely on the expertise of the coaching staff to help define important relationships.
The database for this level required a unique and timely effort to analyze and translate certain features of
the team’s behavior while framing those features in to defined concepts of literature. For instance, seeing a
player perform a return of serve when his body is moving away from the ball instead of moving towards the
ball, means that he failed to anticipate where the ball is oriented by his opponent. This is only one instance
where anticipation can be identified. In order to figure out how to aggregate the relative weight, the SDI
methodology was used.
Table 2.4 is one of the most fascinating findings from the SDI methodology. From the way that
the coaching staff and the research knowledge interpret their value perception in a tennis player, we are
obtaining aggregated statistical information of the team profile performance characteristics of behavior.
• The statistical analysis defines four main strategic values that characterize the necessary elements of
behavior where the team needs to pay special attention, however two of them demonstrate higher
effect. Anticipation is the ability to predict what is going to happen from the sensory input that we
receive. For example, the ability to predict the opponent’s movement direction, serve direction, next
shot selection, etc. We can see that this element interacts with 83% of the second order characteristics.
Therefore, it could cause a significant change in a player’s performance capability. Alertness is the
ability to detect the smallest changes in the environment. Players need to notice their environment
(which includes changes in strategy, tactical and mental mode features of their opponent) in order to
increase their performance level.
• The tactical analysis can characterize how a person should respond to a certain situation. It addresses
the execution capabilities of the strategic decision. We can see that there is a significant difference
between the shortage effect and the overage effect in most of the traits. Therefore, in order to improve
the team’s performance, the team needs to strengthen those values that possess a higher percentile
effect when they are in shortage of use. Moreover, we can see that the effect of overage is pretty low by
20

Table 2.4: Third order relationships
Direct characteristic/trait % Cumulative error effect
High value/over use Low value/under use
Strategy 47.5%
Anticipation 14% 16% 84%
Alertness 16% 7% 93%
Cleverness 9% 49% 51%
Intuition 9% 52% 48%
Tactics 39.1%
Adaptability 4% 16% 84%
Aggressiveness 2% 50% 50%
Determination 4% 14% 86%
Endurance 4% 18% 82%
Patience 4% 24% 76%
Composure 5% 0% 100%
Precision 4% 27% 73%
Assertiveness 5% 5% 95%
Agility 4% 16% 87%
Imagination 4% 9% 91%
Mental mode 13.4%
Appreciation 1.1% 21% 79%
Honesty/integrity 1.2% 13% 87%
Valor/courage 0.9% 66% 34%
Principles guided 0.9% 63% 37%
Leadership 0.7% 49% 51%
Responsibility 1.3% 6% 94%
Enjoyment 1.2% 11% 89%
Motivation 1.2% 11% 89%
Reliability 1.2% 11% 89%
Self-discipline 1.0% 27% 73%
Compassion 1.0% 27% 73%
Professionalism 1.1% 16% 84%
Devotion 0.8% 40% 60%
comparison. This implies that relaxing these values would have little effect on the team’s performance.
• The mental mode analysis identifies 13 items that characterize behavior. We can see that the dominant
values are honesty, responsibility, enjoyment, motivation, reliability and professionalism. Improvement
in each one of those traits would significantly increase the team’s performance capabilities. Moreover,
we can see that the overage of those traits (with the exception of valor, guiding principles and lead-
ership) does not have a great impact on error creation because of their positive effect on the team’s
performance capabilities.
The SDI methodology addressed three-level orders that are connected through the classification
of strategy, tactics and mental mode. The analysis provided a database for improvement that could be
used to increase the team’s performance. Implementing these recommendations in the player’s physical
21

training program, game plan development education and in the tennis program structure will result in
greater achievements.
2.6 Future research
In order to advance to the second stage of the SDI methodology which addresses cause and effect
relationship with the addition of a time element and intensity scale, we will engage in computer simulation
model development. The simulation model will allow the research team to explore the responsiveness of a
player’s current ability based on the time-based decisions (and level of intensity of those decisions) that are
applied during game settings. The time scale would likely be different for each order level when considering
the ability to create a performance change. For instance, creating a performance change based on first order
characteristics would be relatively easy to implement but its ability to result in long-lasting change is less
likely. In contrast, creating a performance change based on second order characteristics would be much
harder (from the former example) to implement but its effect would likely last longer. In order to teach a
child how to correct his spelling mistakes could be relatively easier when you correct his mistakes as he is
speaking but that correction last only momentarily. However, if a spelling mistake is explained to the child,
it will be harder and take more time, but he may never make the same mistake again. We will further explore
the long-term benefits of addressing second- and third-order traits via the simulation modeling approach. We
will also try to identify elements of human behavior that could create a trigger for performance improvement.
Grunting, for example, is a physical element of performance when the player releases airflow while performing
a certain shot, thus allowing his body to function without air congestion and to increase his motion. The
improved motion could generate more power, faster reaction time and greater stability. Interestingly, the
physical aspect of grunting may not even be the dominant cause for performance improvement. The mental
aspect of grunting seems to be more beneficial to performance improvement as it triggers positive outcomes in
attitude, character and confidence. The connections to higher order performance effects will be investigated
further.
2.7 Discussion
When we consider performance improvements methods, we need a method that would adapt itself to.
This research exposes the ability to define the KPIs, although for a tennis player KPIs are learned through
many m the real time measurements of KPI. It is a closed loop concept that leads to continuous improvement
22
methods such as trial and error, video recordings of matches, books, papers and other sources. The SDI error
listing, characteristics and traits can be unique for each player and using the player’s feedback a continuous
improvement approach can be achieved in the player’s abilities. When considering the second and third-order
characteristics, implementing this methodology may result not only in improvement in player’s tennis game
but also in the individual’s daily life.
2.8 Conclusions
Quality development is one of the most desired features in industry today. It began its journey almost
a century ago with simple process charts and reached multidisciplinary tools for process improvements.
The SDI methodology was developed as a quality development tool for improved performance. In this
research, an implementation of the SDI method revealed interesting findings on the tennis player performance
characteristics. Those findings resulted in the creation of a team performance profile for the Clemson
University tennis team. While the current possibilities for improved performance have been outlined, the
next stage of this research is to create a dynamic system where the player interacts with another player and
performance of each player is monitored and recorded. This can be accomplished through a mathematical
tool such as computer simulation. Through the interaction between the players, the game features would
be tested for their performance application. A statistical definition would be created to a certain strategy
and the level of effectiveness could be measured. This is one of the fascinating research areas that take its
first steps in the current field as it absorbs information and methodologies from the industrial engineering
discipline and implements those techniques in professional sports.
2.9 References
Akpinar, S., Devrilmez, E. and Kirazci, S. (2012) Coincidence, anticipation timing requirements are
different in racket sports, Perceptual & Motor Skills: Exercise & Sport, Vol. 115, No. 2, pp.581593.
Alfredson, T. (2008) Negotiation Theory and Practice: A Review of Literature, Food and Agriculture Orga-
nization of the United Nations, FAO, EASYPol online resource materials for policy making, series number
179, ISBN: 2219-9497
Antnez, R., Hernndez, F., Garca, J., Vallo, R. and Arroyo, J. (2012) Relationship between motor variability,
accuracy and ball speed in the tennis serve, Journal of Human Kinetics, Vol. 33, pp.4553, DOI:10.2478/v10078-
012-0043-3.
23

del Villar, F., Garcia, L., Iglesias, D., Moreno, M. and Cervello, E. (2007) Expert novice differences in cogni-
tive and execution skills during tennis competition, Perceptual and Motor Skills, doi: 10.2466/PMS.104.2.355-
365.
Fernandez, J., Mendez-Villanueva, A. and Pluim, B. (2006) Intensity of tennis match play, Br J Sports Med,
Vol. 40, No. 5, pp.387391, doi: 10.1136/bjsm.2005.023168.
Fernandez, J., Sanz-Rivas, D., Fernandez-Garcia, B. and Mendez-Villanueva, A. (2008) Match activity and
physiological load during a clay court tennis tournament in elite female players, Journal of Sports Sciences,
November, Vol. 27.
George, S. (1973) Optimal strategy in tennis: a simple probabilistic model, Journal of the Royal Statistical
Society. Series C (Applied Statistics), Vol. 22, No. 1, pp.97104.
Gondola, J. and Wughalter, E. (1991) The personality characteristics of internationally rank female tennis
players as measured by the Cattell 16PF, Perceptual and Motor Skills, Vol. 73, No. 3, pp.987992.
Gonzalez, L. del Villar, F., Iglesias, D., Moreno, A. and Moreno, M.P. (2012) Tactical knowledge in tennis:
a comparison of two groups with different levels of expertise, Perceptual & Motor Skills: Exercise & Sport,
Vol. 115, No. 2, pp.567580.
Hofe, A. and Fery, Y. (1991) Attentional demands of a temporal prediction task: the trajectory of a tennis
ball, Perceptual and Motor Skills, Vol. 73, No. 3, pp.12351243.
Hopp, W. and Spearman, M. (2008) Factory Physics, 3rd ed., Waveland Press, Inc. Long Grove, IL, ISBN
1-57766-739-5.
Hornery, D., Farrow, D., Mujika, I. and Young, W. (2007) An integrated physiological and performance
profile of professional tennis, Br J Sports Med, Vol. 41, pp.531536, doi: 10.1136/bjsm.2006.031351.
Howard, R. (1980) An assessment of decision analysis, Operations Research, Vol. 28, No. 1, Design Analysis
Special Issue, JanuaryFebruary, pp.427.
Klaassen, F.J.G.M. and Magnus, J.R. (2001) Are points in tennis independent and identically distributed
(?), Journal of the American Statistical Association, Vol. 96, No. 454 (June), pp.500509.
Lames, M. (2006) Modeling the interaction in game sports relative phase and moving correlations, The 8th
Australasian Conference on Mathematics and Computers in Sport, 35 July 2006, Queensland, Australia.
Landlinger, J., Stggl, T., Lindinger, S., Wagner, H. and Mller, E. (2012) Differences in ball speed and
accuracy of tennis ground strokes between elite and high-performance players, European Journal of Sport
Science, July, Vol. 12, No. 4, pp.301308.
Mead, T. and Drowarzky, J. (1997) Interdependence of vision and audition among inexperienced and expe-
24

rienced tennis players, Perceptual and Motor Skills, Vol. 85, No. 1, pp.163166.
Nielsen, T. and McPherson, S. (2001) Response selection and execution skills of professional and novices
during singles tennis competition, Perceptual and Motor Skills, Vol. 93, pp.541555.
ODonoghue, P. and Ingram, B. (2001) A notational analysis of elite tennis strategy, Journal of Sports Sci-
ences, Vol. 19, pp.107115.
Palut, Y. and Zanone, P. (2005) A dynamical analysis of tennis: concepts and data, Journal of Sports Sci-
ences, OctoberVol. 23, No. 10, pp.10211032.
Pugh, S., Kovaleski, J., Heitman, T. and Gilley, W. (2003) Upper and lower body strength in trlation to
vall speed during a serve by male collegiate tennis players, Perceptual and Motor Skills, Vol. 97, No. 3,
pp.867872.
Rees, T., Hardy, L. and Ingledew, D. (2000) Performance assessment in sport: formulation, justification and
confirmatory factor analysis of a measurement instrument for tennis performance, Journal of Applied Sport
Psychology, Vol. 12, No. 2, pp.203218
Shvorin, D. (2011) Improving the polymer injection manufacturing process by using quality engineering
methodology, Quality Leading to Success Conf., Haifa, Israel, 31-10.4-3.
Stepien, A., Bober, T. and Zawadzki, J. (2011) The kinematics of trunk and upper extremities in one-handed
and two-handed backhand stroke, Journal of Human Kinetics, Vol. 30, pp.3747, DOI: 10.2478/v10078-011-
0071-4.
Triolet, C., Benguigui, N., Runigo, C. and Williams, A. (2013) Quantifying the nature of anticipation in
professional tennis, Journal of Sports Sciences, Vol. 31, No. 8, pp.820830
Wall, J.A. (1985) Negotiation in Business, Negotiation, Theory and Practice, BF637.N4 W35 1985, 102-376-
208.
Weinberg, R., Gould, D., Jackson, A. and Barnes, P. (1980) Influence of cognitive strategies on tennis serves
of players of high and low ability, Perceptual and Motor Skills, Vol. 50, No. 2, pp.663666.
Whitaker-Bleuler, S. (1982) Information transmission of initial vs. later between point nonverbal behaviors
in tennis, Perceptual and Motor Skills, Vol. 54, No. 3, pp.11351138.
Williams, A., Ward, P., Knowles, J. and Smeeton, N. (2002) Anticipation skill in a real-world task: measure-
ment, training and transfer in tennis, Journal of Experimental Psychology: Applied Copyright, American
Psychological Association, Inc., Vol. 8, No. 4, pp.259270.
Wong, R. and Zigarovich, M. (2007) Tennis with Markov, The College Mathematics Journal, Vol. 38, No.
1, January, pp.5355.
25

26

Chapter 3
Improving The Player’s Recruitment
Process Using Scenario-Based
Decision Making Analysis
3.1 Abstract
High performance physical characteristics can be found today in most of the potential recruits for
any athletic program and it has become increasingly difficult to select the right candidate based solely on
these characteristics. As a result there is a growing need for a recruiter to evaluate the decision-making
capability of a player in order to understand the mind of the player in addition to the player physical
assessment. We employ scenario-based analysis to evaluate such decision-making capabilities while enabling
any recruiting to customize the potential candidate evaluation, based on the specific program’s needs. The
proposed method provides a platform for decision making evaluation within a specific sport position through
the use of game theory approach. In particular, we assess decisions that a player would make based on being
given certain game scenarios,in an effort to identify the player’s decision making type. The performance
level of the athletic program depends heavily on its recruits, and scenario-based analysis can significantly
enhance the capability to find the right recruit for the right position in the game and as a result, improve
the athletic program management.
27

3.2 Introduction
Evaluating the decision-making capabilities of a potential candidate has not received the attention
it deserves in the recruiting process, yet it can be one of the most critical performance determinants in game
situations. Many professional recruiters tend to evaluate the physical capabilities of the player, some consider
the raw talent of the player, and others still assess the player’s social skills and work ethic. In the research
by Dumond et al. (2008), it was demonstrated that Rivals.com, a player licensing and marketing company,
utilizes various parameters and provides generic statistics of the player performance. Thus, an economic
module has been conceptualized to assist in predicting player performance, but it does not indicate the
player’s decision-making capabilities that would enable the college recruiter to estimate performance relevant
to their specific program. A multivariate model of a player’s success, suggested by Spieler et al. (2008),
used similar demographic characteristics. Although physical and environmental characteristics are significant
factors in recruiting, Griffith et al. (1928) initiated an approach that demonstrated how there are key player
characteristics, specifically psychological traits, which might prove to be more valuable. Furthering this line
of research, Niednagel et al. (1992) created a classification system of sixteen groups that would define a
player’s brain type. Although significant steps were taken to advance the ability to recognize potential, the
task of finding the suitable player for the right position in a specific program remains as the main challenge
in the recruiting process. One of the reasons is that each program manager or head coach has his/her
own unique game plan, which contains a combination of various strategies and tactics. As each game plan
requires different characteristics of each player/team position in the game, the coach needs to change his
players for efficient player-position fit. This is the essence of recruiting and could explain why a certain
player can be a successful recruit for one team but an unsuccessful recruit for another. The study of Patil
and Pasodi (2012) revealed the inherent difficulty of communicating with an athlete during the recruiting
process and, thus, demonstrated that an interview analysis can help bridge the gap between the coach’s
expectation and the player’s expectation for a certain position in the game. They have indicated that more
research is required in order to examine the difference between successful and unsuccessful recruits. As such,
the present research would complement this line of research by evaluating the player’s cognitive capabilities.
Many athletic programs structure their recruiting methods to rely solely on the player’s physical capabilities,
only to discover that their recruits fail to deliver the expected level of performance at game time. Linhares
et al. (2012) presented the hierarchy of processing in the decision making phase as well as the capability
difference between a skilled thinker and a novice one. Each decision level describes a type of thinking that
aids the recruiter in classifying players based on their unique decision processing. Diverse patterns may
28

explain why successful doubles tennis players are not as successful in singles matches, or why a superb
snooker player may not be as successful at pool. According to Ilundin-Agurruza (2015) and Park et al.
(2015), brain EEG technology can demonstrate the difference between processing capabilities in high level
players as apposed to amateurs. Each player in the game has a given decision space that determines his
ability to maximize his potential. The player must be able to adapt by incorporating real-time information
during the game to making his decisions accordingly.
Although these examples may have players with identical physical capabilities, the decision-making
capabilities are completely different from one type of player to another. With more research and attention
based on evaluating the cognitive aspects of players, progress can be made in understanding the future
potential of a player. In the next section, we evaluate the recruitment process tools and their use across
four different college sports. In sections 3 and 4 we introduce the player recruitment logic and framework.
In section 5 we employ our suggested framework and evaluate several players from the Clemson club tennis
team. We provide conclusions and recommendation for future work in section 6.
3.3 The Recruitment Process and its Tools
Player-position recruitment is a process containing a high level of uncertainty that athletic programs
are trying to eliminate. From the introduction we can understand that there is great difficulty in assessing
potential candidates. In order to overcome these difficulties, each sports program creates its own set of tools
in order to improve recruitment success. For example, when evaluating a baseball pitcher, according to Dan
et al. (2010), the Defensive Independent Pitching Statistic (DIPS) is used in order to evaluate the level of a
pitcher. A pitcher’s earned run average (ERA) is at least somewhat dependent on his defensive teammates
that play behind him, and DIPS tries to evaluate the pitcher based solely on variables that he can control.
Dan and Davis (2010) showed that the three most important variables that correlate strongly to positive
performance for pitchers were (1) strikeout rates, (2) walk rates, and to a lesser degree, (3) home-run rates.
The statistic is very helpful when evaluating past performance of pitchers, but is not as valuable when trying
to gauge the potential of a pitcher, especially when the pitcher is moving from one level of competition to
a higher level. A complementary approach to the statistical findings and analysis of player performance is
the four A’s methodology according to Scott et al. (1996). Since baseball is considered to have a unique
rhythm, the team performance is heavily determined by the individual maturity of the players; thus, the
recruitment process must account for more than statistical data. In assessing the academics, ability, attitude
and adjustment capabilities of the recruitment candidate, the recruiter can receive an in-depth profile of the
29

player patterns of behavior. Although implementing the four A’s might be an essential tool for any given
athletic program, there is still a high level of uncertainty, as this method’s main assumption is that past
behavior patterns will continue in the future. Moreover, the transition from high school to college or from
college to professional have a tremendous effect on a player performance.
A recruitment example from the sprot of American Football. The cornerback position as described
by former University of Toledo head coach Frank Lauterbur, must have great speed and quickness, must be
a good-to-fair tackler, and must like to hit (Lauterbur 2000). He must be able to cover open receivers to
prevent them from catching passes. Traditionally, cornerbacks have been smaller than receivers, primarily
because smaller players generally had more speed and agility than taller players. According to Miller (2014),
popular sports scouting and news site Bleacher Report states that an ideal corner’s size is over 5’10” tall
and weighs around 200 pounds. Shorter, lighter corners may have trouble keeping up with today’s receivers
that are often 6’4” or taller. In Miller’s description of recruiting tools for such a position, recruiters measure
the athlete’s forty-yard dash time. This test not only evaluates the athlete’s straight-line speed but also
gives insight into the athlete‘s explosion and acceleration rate. Nelson (1994) describes that one of the main
areas of the cornerback’s body scouts observe is how well he can turn his hips. The quicker a cornerback can
change his hips, the less ground he gives up to the receiver when covering the receiver’s route. Moreover, a
cornerback must have good technique in his backpedal as the transition to a full sprint should be abrupt,
explosive, and in one movement. Recruiters will look for the way a cornerback breaks on the ball once it is
thrown, whether he is still in his backpedal or already in stride with the receiver.
Besides the physical demands of the game, Scouts Inc. (2014) states that, aside from quarterbacks,
cornerbacks require the most mental toughness of any player on the field. The mental part of the game
is just as, if not more, important than the physical part of the game. Cornerbacks must have excellent
anticipation because they have no idea where the wide receiver will make the cut in his route or exactly
when the quarterback will throw the ball. They must also have great instincts in order to be in the right
place at the right time. This is something scouts place great emphasis on when recruiting for the cornerback
position. Corners need to have great awareness of the receiver, as he must be able to close the distance
before the ball arrives.
Stepping away from the recruitment process in team sports, we now consider athlete recruitment
within track and filed - specifically the pole vaulter. Officially adopted at the first modern Olympic Games
described in 1896, Jordan (2014), state that pole vaulting may present the highest level of requirements from
its recruits. The sport began back in the days of the ancient Greeks, where poles were used as means of
30

avoiding obstacles and jumping over animals. Since those days, the sport has become highly versatile and
incredibly challenging, according to McCormick (2010). A recruiter may consider a variety of details such as
the athletes initial stance, how he or she grips the pole, the manner in which he or she sprints, the motions
that take place during the planting of the pole, how the athlete manipulates his or her body during the
swing up, how the athlete orients himself or herself when jumping over the bar, the athlete‘s speed, strength,
explosiveness as well as mental characteristics such as body awareness, fearlessness, thought process, visual
processing and many more factors. According to Risk (2000), vision plays a critical part in pole vaulting.
The depth perception and visual tracking are important when making jump decisions. He concludes that
he requires his athletes to take an 11-part test when not only recruiting but also for the development of
the athletes. This allowed him to further train the team on certain vision techniques. As the National Pole
Vault Chair for Canada during the 2000 Sydney Olympics, he often assessed the sprints, long jump, and
hurdle events for future pole vaulting recruits due to requirements of speed and agility. He also emphasized
the importance of the recruitment candidate’s academic performance, because it often facilitates efficient
learning and training of techniques. Lastly, he wrote that he had to make sure that this potential team
member gels with the current team, in order to avoid any future conflicts. According to Nyberg (2014) there
is a great difference between the physical characteristics and the mental characteristics that are expected
from a pole vaulter. He discusses the complementary ability to use cognitive skills and perform an intended
motor skill, such as reading music while playing the piano, and the ability to use motor skills to perform
cognitive skills such as using a calculator to solve a math problem. Because this sport is very complex, the
mental characteristics play a critical role for evaluating potential recruits. Thus, a tool that would help
create a pole vaulter profile may reduce the level of uncertainty in the recruitment process.
While pole vaulting athletes are faced with a static challenge (a bar), tennis players are presented
with a challenge in a dynamic setting (an opponent), with feedback from a certain course of action chosen by
the player. According to Shvorin and Taaffe (2014), there are many performance characteristics that could be
evaluated during the recruiting process. Each performance characteristic may have a direct or indirect effect
on the player decision-making process that translates into a defined level of performance. Upon creating
a profile for the player decision making capability, the improvement potential may be evaluated in greater
depth as decision making patterns have a direct impact in real time performance in the game. In the next
section we will provide inferences about the recruitment process and its tools, and provide reasoning for
creating a generic tool with customizing application for each athletic discipline. Such a tool is expected to
improve the recruitment process and the athletic program as a whole.
31
The review of the four position recruitment characteristics indicates the growing need for a systematic
method to evaluate the decision-making capabilities of the athlete as the human physical capabilities have
reached a certain plateau. It is becoming increasingly difficult to achieve an advantage in performance based
solely on physical features when most of the elite athletes have similar characteristics. Thus, identification of
the player’s thinking patterns undoubtedly will better inform the level of expected performance. Although
there are different performance requirements in each athletic program, we can see that there is common
ground where decision making capabilities can be tested. Moreover, while game scenarios can be customized
to each sport and its demand characteristics, the ability to make decisions rests with the player’s predominant
patterns of thinking, individual interpretation, analytic analysis, comprehension, and execution abilities. In
the next two sections we will focus on the methodology development and provide the basic structure for
evaluating a player’s decision making capabilities, using a game theoretic approach.
3.4 Player Recruitment using Game Theory
Recruiting a potential candidate requires great effort on behalf of the athletic management team.
Each scout or coach is trying to predict performance potential when integrating subjective experience and
expertise. The difficulty that the management team is faced with is identifying a candidate who, after
receiving team training and coaching, will be able to make smart decisions in actual game situations. Making
the right (or smart) decision requires knowing the decision that will produce the highest gain or payoff for
the team in that specific scenario. Game theory is often employed to calculate mathematically what the
best response would be (Tadelis, 2013). Such an approach could also be used to test recruitment candidates
by scripting various game-time scenarios and measuring their performance using a scenario-based approach.
After a brief introduction to game theory in this section, we explore the model development process and
employ that framework in a case study with current college tennis players.
3.4.1 Game theory approach description
The setting of the game is one of the most important aspects as it determines certain values in
the model and the decision-making alternatives that are being addressed. The most basic game theoretic
model, including both uncertainty and time elements, can be found in the calculation of expected value
from a decision-making tree (Tadelis, 2013). In order to establish a meaningful decision-making process, the
player must be able to compare uncertain consequences when he makes a certain decision. We introduce a
32

simple lottery model in this section to describe the decision-making process. Consider a decision situation
where xi denotes the ith outcome (i = i, · · · , n), thus by definition, a simple lottery over outcomes X =
(x1, x2, x3, · · · , xn) is defined as a probability distribution P = (p(x1), p(x2), p(x3), · · · , p(xn)) where p(x) ≥
0 is the probability that xi occurs and∑
p(xi) = 1. The next example can explain the simple model
structure.
Consider a simple lottery model where player has a 70% chance to receive $10 if he chooses lottery
A and 80% chance to receive $8 if he chooses lottery B. In order to evaluate a certain decision in an
uncertain condition we will use the expected payoff calculation. By definition, if u(x) is the payoff function
(utility) of the player over outcomes of X = (x1, x2, x3, · · · , xn) such that p(x) is a lottery over X, and
p(xi) = Pr(x = xi), then we define the expected payoff from lottery p(x) as:
E[u(x)|p(x)] =
n∑i=1
p(xi) · u(xi) = p(x1) · u(x1) + p(x21) · u(x2) + p(x3) · u(x3) + · · ·+ p(xn) · u(xn) (3.1)
In order to evaluate the simple lottery, lottery A returns a $7 expected payoff and lottery B returns
a $6.40 expected payoff. Therefore, a rational player who would like to maximize his profit should choose
to play lottery A, despite the higher probability of success associated with lottery B. In order to utilize this
simple model in the recruiting process we need to define certain basic characteristics in the decision making
space. Similar to the lottery example, a sport recruit will need to decide between a number of alternative
in order to identify the best decision in a specific scenario settings. From the simple lottery model we can
understand that there are a few guidelines that need to be defined in order to create a decision-making
evaluation for a potential recruit.
3.5 The Recruitment Framework
In this section, we present the recruitment model that evaluates a player’s approach to decision
making in game scenarios. To make use of our approach, we assume that the coaching staff has a need at a
particular player position. Each sport has its own set of unique player positions, and each position requires
unique player characteristics. Moreover, desirable player characteristics could vary among teams, due to
the abilities of existing players on the team and the strategic plan of the coaching staff. For example, in
Basketball, a point guard who is highly skilled in maneuvering the ball would be a key player to recruit
in a team that already has skills in shooting guards, power forwards and centers. However, a team that
is disadvantaged in these positions may require a point guard who is a skilled shooting guard as well, in
33

order for him to have the desired impact or significance. This is just one aspect of player characteristics that
should be addressed in the recruiting process and, thus, it is extremely important to determine exactly what
the goals are for the recruiter. In preparing the player recruitment analysis, the following steps in a player
recruitment model are proposed.
1. Describe the specific game scenario
2. Map the player’s decision alternatives
3. Identify performance characteristics critical in decision making
4. Create a performance scale and evaluate a player’s relative advantage
5. Perform cost and benefit analysis for the possible decision alternatives
6. Quantify execution capabilities and decision making
7. Guidelines for a decision making question
3.5.1 Describe the specific game scenario
We must first describe a specific scenario in the game that challenges a player’s decision-making.
Each coach has his/her own unique set of strategies and tactics he uses to govern the players in the game.
There are many situations in the game that can demonstrate the decisions of the players; thus, if the
decision follows the guidelines of the coach, the player would meet the coach’s expectations. However, if the
decision of the player is different from the coach’s expectation, it creates difficulty for the coach to establish
tactical plays in the game. A player’s decision-making process should be evaluated in the recruitment stage
rather than during real-time performance. By evaluating the thinking preferences of the player early in
the recruiting process, the recruiter would quickly recognize player compatibility with the coach’s approach
to the game. This compatibility would prove to be most valuable in real-time under pressure where the
cognitive capability and the motor skill of the player are put to the test.
3.5.2 Map the player’s decision alternatives
There are many levels of decision-making in the game and many different player positions. A player
could be a part of a team and have a determined decision-making space (e.g. basketball players positions)
or he could be an independent individual responsible for a wider space of decision making in the game
34

(e.g. tennis, ping-pong, snooker). The space of the player decision-making can be very large or very small;
however, the importance of the decision is independent of the size of the decision-making space.
Each position may require up to two levels of decision-making: a strategic decision and a tactical
decision. In some disciplines there is much confusion among professionals regarding the definition of the two
concepts, however, this research aims to create a common language. A strategy is the overarching objective
that aims to take advantage of the gap between the cumulative strengths and cumulative weaknesses. We
suggest identifying a strategy by answering the following question: What do I need to do in order to win
the game? Examples could be to play at a fast pace, play with power or be aggressive, play with patience,
play to the weaker side of the opponent, play with high consistency, play under pressure and play to create
the element of surprise. A tactic, on the other hand, is a short-term alternative that helps attain the overall
strategy as well as aims to take advantage of the gap between strengths and weaknesses in an isolated
situation. We suggest identifying a tactic by answering the following question: How should I achieve my
selected strategy? A few examples here would create the set of alternatives for the chosen strategy. If
we assume that our strategy is to play at a fast pace, tactical alternatives could be to physically perform
activities faster, eliminate any disturbances, breaks or delays during the game to increase game flow, execute
operations sooner so that the opponent would have less time to prepare, etc.
Consider the following scenario. A quarterback leads his team by selecting a certain play to run that
will give the team the highest payoff in his objective of yards gained towards a touchdown. In selecting a
strategy, he asks himself what he should do in order to have the highest probability of scoring a touchdown
or advancing in the field. Our quarterback identified that the rival team has weaker defensive capabilities on
the left side based on prior experience. Thus, his strategy is to play to the weaker left side of the rival team.
In selecting a tactic, he needs to decide which play to run. Thus, a tactic would be to select one among
alternatives, such as a long pass, a short pass, an inside run, etc. Evaluating the position decision-making
choices would lead to a creation of a decision making tree that articulates the possible strategies and tactics
from which to choose.
A decision tree can demonstrate the decision process according to the selected scenario. Figure 3.1
demonstrates how to map out the decision-making process for a given scenario in the game. The player
can choose between four different strategies in the given scenario. Each strategy presents different tactic
alternatives and, in some cases, the same tactic alternatives (tactic 2 can be selected for strategies 1, 3, 4).
The key outcome is the establishment of a game plan. A game plan, by definition in this research, is the
set of decisions selected for execution by the player. Let S and T denote the sets of strategies and tactics
35
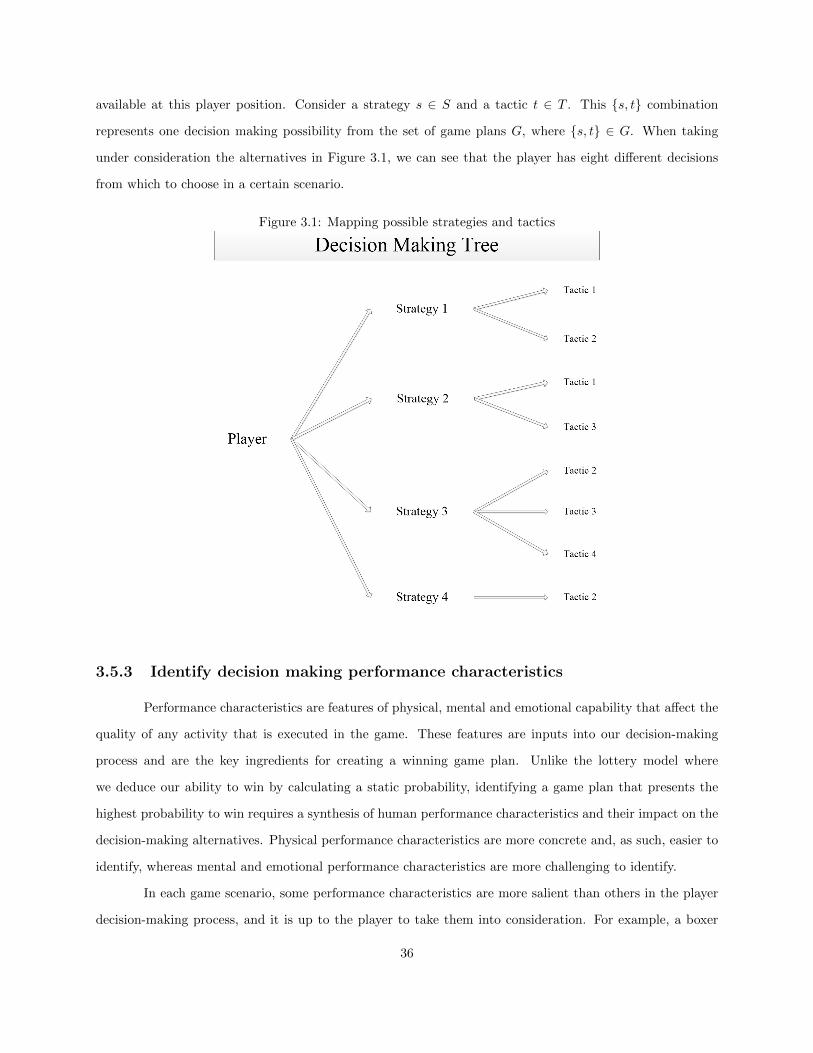
available at this player position. Consider a strategy s ∈ S and a tactic t ∈ T . This {s, t} combination
represents one decision making possibility from the set of game plans G, where {s, t} ∈ G. When taking
under consideration the alternatives in Figure 3.1, we can see that the player has eight different decisions
from which to choose in a certain scenario.
Figure 3.1: Mapping possible strategies and tactics
3.5.3 Identify decision making performance characteristics
Performance characteristics are features of physical, mental and emotional capability that affect the
quality of any activity that is executed in the game. These features are inputs into our decision-making
process and are the key ingredients for creating a winning game plan. Unlike the lottery model where
we deduce our ability to win by calculating a static probability, identifying a game plan that presents the
highest probability to win requires a synthesis of human performance characteristics and their impact on the
decision-making alternatives. Physical performance characteristics are more concrete and, as such, easier to
identify, whereas mental and emotional performance characteristics are more challenging to identify.
In each game scenario, some performance characteristics are more salient than others in the player
decision-making process, and it is up to the player to take them into consideration. For example, a boxer
36

starting his first round recognizes that his opponent has very quick jabs and moves quickly. The boxer also
notices his advantage in delivering more powerful punches. In this scenario, the performance characteristics
that play a critical role are the boxer’s agility, endurance and power. Assuming that our boxer is starting the
fifth round, he notices that his fast and agile opponent begins to anticipate his slow but powerful punches.
Moreover, his opponent is demonstrating a behavior of superiority and ego, while our boxer demonstrates
a calm and collected behavior. In this example, the performance characteristics that play a critical role in
the decision-making process are the ones that reflect the relative advantage between the two boxers such as
anticipation, awareness, focus and arrogance. In order to devise a winning game plan for both boxers, we
need to consider the physical, mental and emotional performance characteristics of each one.
When considering these performance characteristics, one game plan for our boxer could be to con-
serve effort, move the opponent around so he will get tired, present a high variety of punches and go for
the knockout punch. On the other hand, his opponent’s game plan could be to circle around while studying
moves, demonstrating irritating behavior in order to create distractions, and deliver as many punches to
establish a high scoring margin. Selecting the performance characteristics and identifying an appropriate
performance scale for representation is explained in the following section.
3.5.4 Evaluate players relative advantage
It is very difficult to quantify the level of a certain performance characteristic in a player; however,
it is more attainable to define performance characteristics relative to other players or teams. Each player
needs to be able to assess himself as well as his opponent in order to determine what are his strengths and
weaknesses. This scaling process is used in quality engineering as it helps reduce uncertainty and create a
quantified method for continuous improvement. In Montgomery (2013) and Foster (2013) as well as many
more quality engineering educational text books, many tools require scaling. For example, quality function
deployment (QFD), failure mode and effects analysis (FMEA), servqual, prioritization grids, matrix diagrams
and six sigma (DMAIC), have a way to determine relativity between factors of influence. In our case, human
performance characteristics needs to be scaled in order to identify relative advantage. For example, height
is a basic parameter that contains inherent scaling in inches or centimeters. This characteristic can pose
a major element for a point guard when he is considering a two-point shot or a three-point shot. The
same reasoning can be inferred from other performance characteristics such as anticipation, adaptability,
endurance, patience, agility as they are all participating in our decision making process.
This is the basic stage for evaluating a certain decision in the game, as each decision can be compiled
37
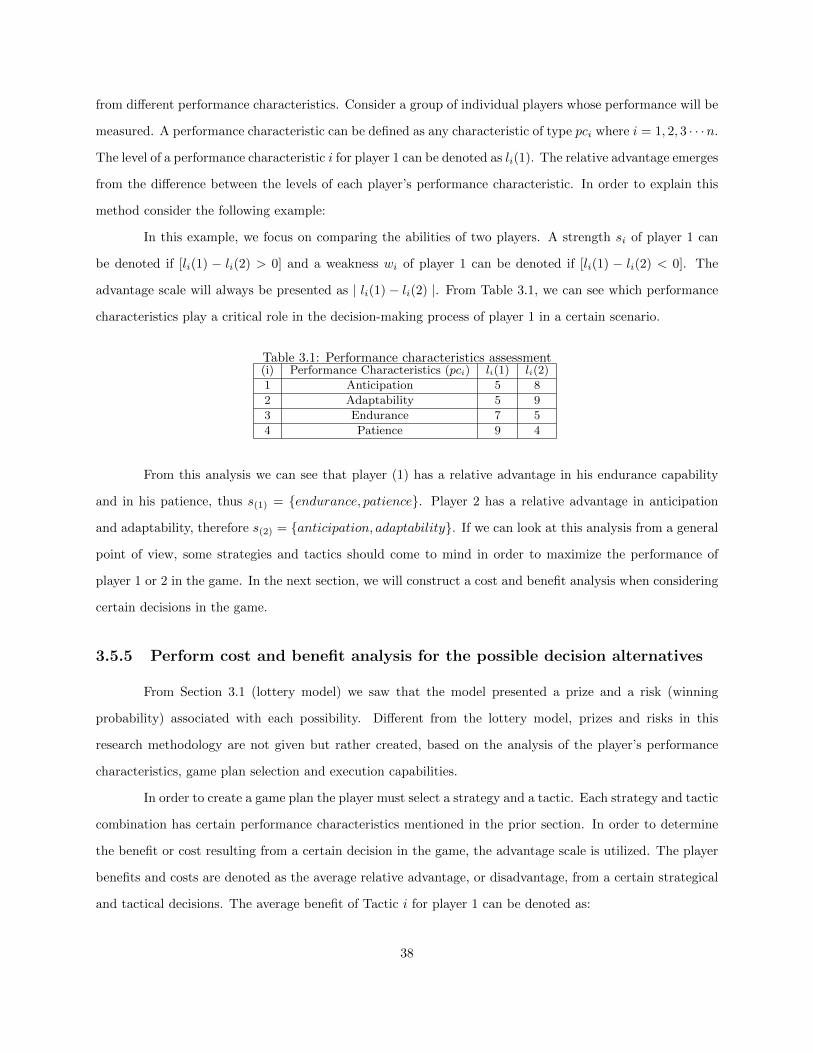
from different performance characteristics. Consider a group of individual players whose performance will be
measured. A performance characteristic can be defined as any characteristic of type pci where i = 1, 2, 3 · · ·n.
The level of a performance characteristic i for player 1 can be denoted as li(1). The relative advantage emerges
from the difference between the levels of each player’s performance characteristic. In order to explain this
method consider the following example:
In this example, we focus on comparing the abilities of two players. A strength si of player 1 can
be denoted if [li(1) − li(2) > 0] and a weakness wi of player 1 can be denoted if [li(1) − li(2) < 0]. The
advantage scale will always be presented as | li(1) − li(2) |. From Table 3.1, we can see which performance
characteristics play a critical role in the decision-making process of player 1 in a certain scenario.
Table 3.1: Performance characteristics assessment(i) Performance Characteristics (pci) li(1) li(2)
1 Anticipation 5 8
2 Adaptability 5 9
3 Endurance 7 5
4 Patience 9 4
From this analysis we can see that player (1) has a relative advantage in his endurance capability
and in his patience, thus s(1) = {endurance, patience}. Player 2 has a relative advantage in anticipation
and adaptability, therefore s(2) = {anticipation, adaptability}. If we can look at this analysis from a general
point of view, some strategies and tactics should come to mind in order to maximize the performance of
player 1 or 2 in the game. In the next section, we will construct a cost and benefit analysis when considering
certain decisions in the game.
3.5.5 Perform cost and benefit analysis for the possible decision alternatives
From Section 3.1 (lottery model) we saw that the model presented a prize and a risk (winning
probability) associated with each possibility. Different from the lottery model, prizes and risks in this
research methodology are not given but rather created, based on the analysis of the player’s performance
characteristics, game plan selection and execution capabilities.
In order to create a game plan the player must select a strategy and a tactic. Each strategy and tactic
combination has certain performance characteristics mentioned in the prior section. In order to determine
the benefit or cost resulting from a certain decision in the game, the advantage scale is utilized. The player
benefits and costs are denoted as the average relative advantage, or disadvantage, from a certain strategical
and tactical decisions. The average benefit of Tactic i for player 1 can be denoted as:
38

tbi(1) =
∑j:lj(1)≥lj(2);jεT
PCi
[lj(1)− lj(2)]
|TPCi |
(3.2)
The average cost of Tactic i for player 1 can be denoted as:
tci(1) =
∑j:lj(1)≤lj(2);jεT
PCi
[lj(1)− lj(2)]
|TPCi |
(3.3)
When looking at the example from Table 3.1 and the decision making mapping from Figure 3.1
we can see that there are four available tactics to select from. Each tactic presents different characteristics
that are critical to the player performance. In Table 3.2 we assign the performance characteristics that are
involved in each tactic and in Table 3.3 calculate the benefit and cost using equations (2) and (3).
Table 3.2: Performance characteristics assignment(i) Performance Characteristics (pci) li(1) li(2) Tactic 1 Tactic 2 Tactic 3 Tactic 4
1 Anticipation 5 8 v v
2 Adaptability 5 9 v v v
3 Endurance 7 5 v v v
4 Patience 9 4 v v
Table 3.2 shows that tactic 1 has three performance characteristics that play a critical role in
the player performance. Endurance means that this tactic includes intensive physical effort. Anticipation
presents the capability to surprise the opponent and patience reflects the consideration of time. In tennis
for example, playing long rallies while trying to wrong foot the opponent can explain what tactic 1 might
look like in the game.
Table 3.3: Tactic benefits and costs for player 1(i) Tactic 1 Tactic 2 Tactic 3 Tactic 4
Benefit Cost Benefit Cost Benefit Cost Benefit Cost
1 - 3 - 3
2 - 4 - 4 - 4
3 2 - 2 - 2 -
4 5 - 5 -
tbi(1) and tci(1) 2.33 1 1 2 0.67 2.33 2.5 2
Table 3.3 demonstrates how to calculate the average benefit and cost for a certain tactic based on
which PC’s are critical for the tactic performance. The number of PC’s involved changes from one tactic
39
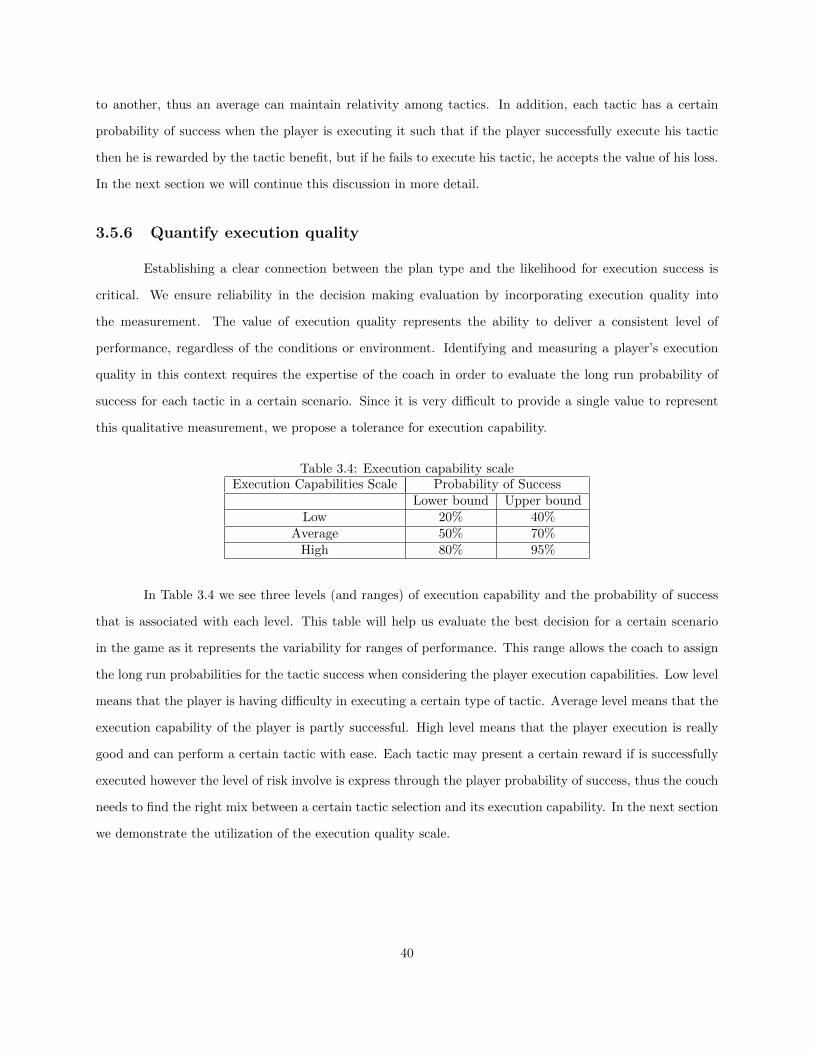
to another, thus an average can maintain relativity among tactics. In addition, each tactic has a certain
probability of success when the player is executing it such that if the player successfully execute his tactic
then he is rewarded by the tactic benefit, but if he fails to execute his tactic, he accepts the value of his loss.
In the next section we will continue this discussion in more detail.
3.5.6 Quantify execution quality
Establishing a clear connection between the plan type and the likelihood for execution success is
critical. We ensure reliability in the decision making evaluation by incorporating execution quality into
the measurement. The value of execution quality represents the ability to deliver a consistent level of
performance, regardless of the conditions or environment. Identifying and measuring a player’s execution
quality in this context requires the expertise of the coach in order to evaluate the long run probability of
success for each tactic in a certain scenario. Since it is very difficult to provide a single value to represent
this qualitative measurement, we propose a tolerance for execution capability.
Table 3.4: Execution capability scaleExecution Capabilities Scale Probability of Success
Lower bound Upper boundLow 20% 40%
Average 50% 70%High 80% 95%
In Table 3.4 we see three levels (and ranges) of execution capability and the probability of success
that is associated with each level. This table will help us evaluate the best decision for a certain scenario
in the game as it represents the variability for ranges of performance. This range allows the coach to assign
the long run probabilities for the tactic success when considering the player execution capabilities. Low level
means that the player is having difficulty in executing a certain type of tactic. Average level means that the
execution capability of the player is partly successful. High level means that the player execution is really
good and can perform a certain tactic with ease. Each tactic may present a certain reward if is successfully
executed however the level of risk involve is express through the player probability of success, thus the couch
needs to find the right mix between a certain tactic selection and its execution capability. In the next section
we demonstrate the utilization of the execution quality scale.
40

3.5.7 Quantify strategies and tactics
In Figure 3.2 we present the decision tree structure when uploading the information from Table 3.3
and assigning the execution quality to each tactical decision as articulated in Table 3.4. We can see that
Tactic 1 and Tactic 3 have a high level of execution quality while Tactic 2 and Tactic 4 have average and
low execution quality respectively. With this scheme we utilize formula 1 to calculate the expected payoff
for Tactics 1 thought 4. For example, Tactic 1 expected payoff can be denoted as: E[t1(value)|p(quality)] =
p1(success) · tb1(benefit) − p1(failure) · tc1(cost) = 0.9 · 1 − 0.1 · 2.33 = 0.667 The next table present the
Tactics expected payoff summary for scenario (X).
Figure 3.2: Structuring benefit, cost and execution quality to the decision making tree
Table 3.5: Scenario (x) tactics expected payoff summaryTactic Tactic Expected Payoff
Tactic 1 0.6Tactic 2 0.1Tactic 3 0.5Tactic 4 0.2
41

The expected payoff from selecting a certain tactic will involve the benefit and cost analysis while
considering the execution quality associated with it. Utilizing formula 1 we denote the tactic expected payoff
as:
E[ti(value)|p(quality)] = pi(success) · tbi(benefit)− pi(failure) · tci(cost) (3.4)
3.5.8 Quantify the game structure
In order to create a plan for the game at any level the opponent capabilities and decision making
needs to be evaluated. Moreover, a prediction of response should be assign to each situation in order to
create the best game plan. According to our framework the basic relative advantage analysis from Table
3.2 and Table 3.3 may give us the basic intuition. The next model can articulate the basic structure for
evaluating a game plan (See appendix Table 3.10 & 3.11).
1. Players: N=1,2
2. Strategy Sets:
S1 = Strategy A, Strategy B, Strategy C for player 1 ∈ scenario (X)
S2=Strategy F, Strategy G for player 2 ∈ scenario (X)
3. Tactic Sets:
t1 = Tactic 1, Tactic 2, Tactic 3, Tactic 4 for player 1 ∈ scenario (X)
t2=Tactic 5, Tactic 6, Tactic 7, Tactic 8 for player 2 ∈ scenario (X)
Assuming we have created the same framework for player 2 and quantify the tactics (5,6) and strategies
(F,G) values. The next table demonstrate the articulated payoff when considering the decisions of player 1
and player 2.
Table 3.6: Scenario (y) summary 1% PA PB PC
Strategy A Strategy B Strategy C% PA(T1) PA(T2) PB(T1) PB(T3) PC(T2) PC(T3) PC(T4)
Tactic 1 Tactic 2 Tactic 1 Tactic 3 Tactic 2 Tactic 3 Tactic 4
PF Strategy FPF(T5) Tactic 5 2.4 , 1.6 2.2 , -0.1 2.4 , 1.6 2.5 , 1.3 2.2 , -0.1 2.5 , 1.3 1.6 , -0.7PF(T6) Tactic 6 3.3 , 4.5 3 , 2 3.3 , 4.5 3.3 , 4.1 3 , 2 3.3 , 4.1 2.7 , 0.7
PG Strategy GPG(T7) Tactic 7 2.9 , 2.6 2.6 , 0.9 2.9 , 2.6 2.9 , 2.3 2.6 , 0.9 2.9 , 2.3 2.3 , 0.2PG(T8) Tactic 8 0.1 , 1.5 0 , -1 0.1 , 1.5 0.3 , 1.1 0 , -1 0.3 , 1.1 -1.2 , -2.2
When two tactics collide a new benefit and cost assessment will be made for each player as they
may address difference performance characteristics. From this point, equation 4 will be apply to quantify
42
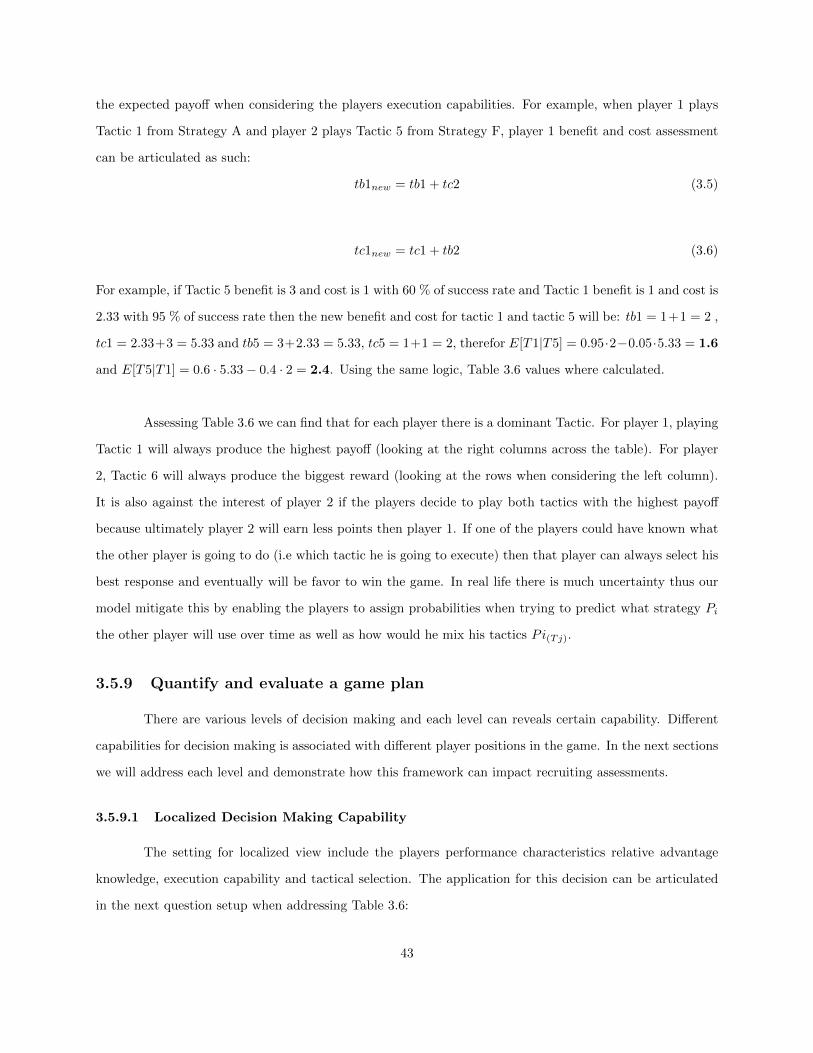
the expected payoff when considering the players execution capabilities. For example, when player 1 plays
Tactic 1 from Strategy A and player 2 plays Tactic 5 from Strategy F, player 1 benefit and cost assessment
can be articulated as such:
tb1new = tb1 + tc2 (3.5)
tc1new = tc1 + tb2 (3.6)
For example, if Tactic 5 benefit is 3 and cost is 1 with 60 % of success rate and Tactic 1 benefit is 1 and cost is
2.33 with 95 % of success rate then the new benefit and cost for tactic 1 and tactic 5 will be: tb1 = 1+1 = 2 ,
tc1 = 2.33+3 = 5.33 and tb5 = 3+2.33 = 5.33, tc5 = 1+1 = 2, therefor E[T1|T5] = 0.95·2−0.05·5.33 = 1.6
and E[T5|T1] = 0.6 · 5.33− 0.4 · 2 = 2.4. Using the same logic, Table 3.6 values where calculated.
Assessing Table 3.6 we can find that for each player there is a dominant Tactic. For player 1, playing
Tactic 1 will always produce the highest payoff (looking at the right columns across the table). For player
2, Tactic 6 will always produce the biggest reward (looking at the rows when considering the left column).
It is also against the interest of player 2 if the players decide to play both tactics with the highest payoff
because ultimately player 2 will earn less points then player 1. If one of the players could have known what
the other player is going to do (i.e which tactic he is going to execute) then that player can always select his
best response and eventually will be favor to win the game. In real life there is much uncertainty thus our
model mitigate this by enabling the players to assign probabilities when trying to predict what strategy Pi
the other player will use over time as well as how would he mix his tactics Pi(Tj).
3.5.9 Quantify and evaluate a game plan
There are various levels of decision making and each level can reveals certain capability. Different
capabilities for decision making is associated with different player positions in the game. In the next sections
we will address each level and demonstrate how this framework can impact recruiting assessments.
3.5.9.1 Localized Decision Making Capability
The setting for localized view include the players performance characteristics relative advantage
knowledge, execution capability and tactical selection. The application for this decision can be articulated
in the next question setup when addressing Table 3.6:
43
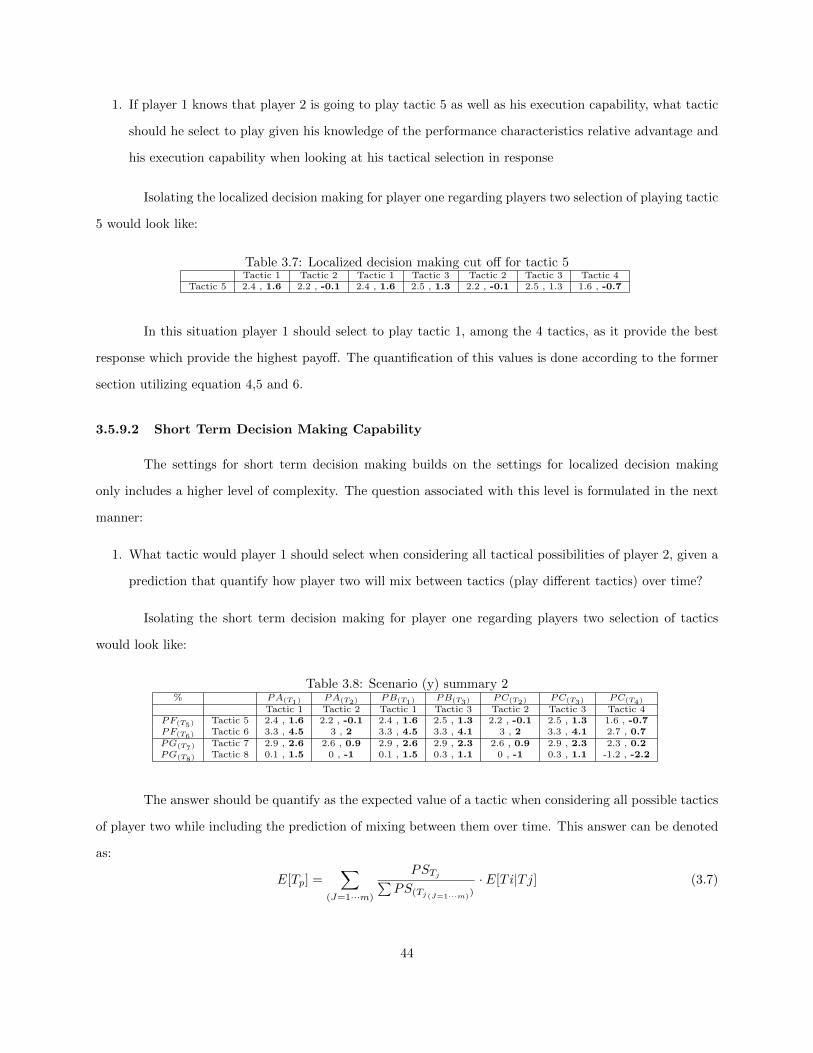
1. If player 1 knows that player 2 is going to play tactic 5 as well as his execution capability, what tactic
should he select to play given his knowledge of the performance characteristics relative advantage and
his execution capability when looking at his tactical selection in response
Isolating the localized decision making for player one regarding players two selection of playing tactic
5 would look like:
Table 3.7: Localized decision making cut off for tactic 5Tactic 1 Tactic 2 Tactic 1 Tactic 3 Tactic 2 Tactic 3 Tactic 4
Tactic 5 2.4 , 1.6 2.2 , -0.1 2.4 , 1.6 2.5 , 1.3 2.2 , -0.1 2.5 , 1.3 1.6 , -0.7
In this situation player 1 should select to play tactic 1, among the 4 tactics, as it provide the best
response which provide the highest payoff. The quantification of this values is done according to the former
section utilizing equation 4,5 and 6.
3.5.9.2 Short Term Decision Making Capability
The settings for short term decision making builds on the settings for localized decision making
only includes a higher level of complexity. The question associated with this level is formulated in the next
manner:
1. What tactic would player 1 should select when considering all tactical possibilities of player 2, given a
prediction that quantify how player two will mix between tactics (play different tactics) over time?
Isolating the short term decision making for player one regarding players two selection of tactics
would look like:
Table 3.8: Scenario (y) summary 2% PA(T1) PA(T2) PB(T1) PB(T3) PC(T2) PC(T3) PC(T4)
Tactic 1 Tactic 2 Tactic 1 Tactic 3 Tactic 2 Tactic 3 Tactic 4PF(T5) Tactic 5 2.4 , 1.6 2.2 , -0.1 2.4 , 1.6 2.5 , 1.3 2.2 , -0.1 2.5 , 1.3 1.6 , -0.7PF(T6) Tactic 6 3.3 , 4.5 3 , 2 3.3 , 4.5 3.3 , 4.1 3 , 2 3.3 , 4.1 2.7 , 0.7
PG(T7) Tactic 7 2.9 , 2.6 2.6 , 0.9 2.9 , 2.6 2.9 , 2.3 2.6 , 0.9 2.9 , 2.3 2.3 , 0.2PG(T8) Tactic 8 0.1 , 1.5 0 , -1 0.1 , 1.5 0.3 , 1.1 0 , -1 0.3 , 1.1 -1.2 , -2.2
The answer should be quantify as the expected value of a tactic when considering all possible tactics
of player two while including the prediction of mixing between them over time. This answer can be denoted
as:
E[Tp] =∑
(J=1···m)
PSTj∑PS(Tj(J=1···m))
· E[Ti|Tj] (3.7)
44

For example, if player 1 estimate that player 2 will mix between his tactics over time in this manner:
PFT5= 40%, PFT6
= 60%, PGT7= 80%, PGT8
= 20%, then the expected payoff from playing his tactics
will be:
E[T1] =0.4
2· 1.6 +
0.6
2· 4.5 +
0.8
2· 2.6 +
0.2
2· 1.5 = 2.86
E[T2] =0.4
2· (−0.1) +
0.6
2· 2 +
0.8
2· 0.9 +
0.2
2· (−1) = 0.84
E[T3] =0.4
2· 1.3 +
0.6
2· 4.1 +
0.8
2· 2.3 +
0.2
2· 1.1 = 2.52
E[T4] =0.4
2· (−0.7) +
0.6
2· 0.7 +
0.8
2· 0.2 +
0.2
2· (−2.2) = −0.07
In this setting, player 1 best response selection will be to play tactic 1 as it demonstrates the highest
payoff. We can also see that there is a minor difference between tactic 1 and tactic 3 but a large difference
between tactics 1 and 3 to tactics 2 and 4. When producing this type of question to a player that we intend
to recruit it is logical that some flexibility can be given if the player select answers that contain tactic 1 and
tactic 3, however if he selects answers containing tactics 2 and 4 we know that the player did not demonstrate
a good capability in this question, thus his short term decision making score will be demonstrated in the
evaluation report.
3.5.9.3 Long Term Decision Making Capability
The settings for long term decision making builds on the settings for short decision making only
includes a higher level of complexity. The question associated with this level is formulated in the next
manner:
1. What game plan should player 1 select given player 2 game plan?
This question address Table 3.6 in its completion. The answer to this question should be quantify
as such:
E[GP ] =∑
d=1···m
PSd ·∑
i=1···nPSTi
· {∑
k=1···l
PSk·
∑J=1···b
PSTJ· E[Ti|Tj]} (3.8)
For example, if player 2 will have this following game plan: PFT5= 20%, PFT6
= 80%, PGT7=
80%, PGT8= 20% as well as mix between his strategies in this way: PF = 80%, PG = 20%, then we can
45

evaluate player 1 payoff when compared to player 2. In this case we are providing 4 options to select from
in this manner:
1. PA = 10%{PAT1= 80%, PAT2
= 20%}, PB = 80%{PBT1= 80%, PBT3
= 20%}, PC = 10%, {PCT2=
10%, PCT3 = 80%, PCT4 = 10%}
2. PA = 20%{PAT1= 10%, PAT2
= 90%}, PB = 20%{PBT1= 10%, PBT3
= 90%}, PC = 60%, {PCT2=
10%, PCT3 = 10%, PCT4 = 80%}
3. PA = 30%{PAT1= 80%, PAT2
= 20%}, PB = 30%{PBT1= 80%, PBT3
= 20%}, PC = 40%, {PCT2=
10%, PCT3 = 60%, PCT4 = 30%}
4. PA = 20%{PAT1= 20%, PAT2
= 80%}, PB = 60%{PBT1= 20%, PBT3
= 80%}, PC = 20%, {PCT2=
10%, PCT3= 10%, PCT4
= 80%}
The following figure will demonstrate each game plan expected value among the 4 possibilities that
the recruit will have to select from given his opponent game plan.
Figure 3.3: The expected payoff from game plan possibilities
Figure 3.3 demonstrate that option 1 is the best game plan setup for player 1(The computation is
addressed in the appendix). This decision is the most difficult to make as the recruit need to understand
how performance characteristics establishes tactical benefits and costs which determine critical features when
playing a certain strategy.
46

3.5.10 Guidelines for a decision making question
Assessing a player’s decision making capability is a challenging, yet essential, task in evaluating the
fit of the recruit for the particular program. In that process, the recruiter needs to validate that the recruit
understand the questions and scenarios for which he is being evaluated. In order to reliably achieve such
a task we offer a model that is adopted in the health care industry, Scholl et al. (2011). The goal of this
model is to test the physician patient interaction when a course of treatment must be selected.
Similar to our approach, the physician needs to explain the scenario to the patient, explain the
options of treatments available, and explain the benefits and costs associated with each alternative for the
short term and the long term. In order to change these settings and test the decision making capability
in the context of a tennis player, the consequences of the decision making alternatives are not discussed,
therefore allowing the player to determine this on his own. If a player’s decision matches or suits a the
coach’s approach then we have identified a fit.
The shared decision making model provide insights into the decision making process which we will
conceptualize to achieve our evaluation objectives. Scholl et al. (2011) provided a review of this model in
2011, and Scholl et al. (2012) tested the model a year later with funding from the Germany Ministry of
Health. They have concluded that the assessment tool is statistically valid and reliable. The model presents
nine statements and an associated scale for each response. The statements are:
1. I made clear to my patient that a decision needs to be made
2. I wanted to know exactly from my patient how he/she wants to be involved in making the decision
3. I told my patient that there are different options for treating his/her medical condition
4. I precisely explained the advantages and disadvantages of the treatment options to my patient
5. I helped my patient understand all the information
6. I asked my patient which treatment option he/she prefers
7. My patient and I thoroughly weighed the different treatment options
8. My patient and I selected a treatment option together
9. My patient and I reached an agreement on how to proceed
In order to use this structure in the survey we offer in Section 3.6, several aspects of the above
statements are incorporated into the questions and scenarios. Here are examples of how that is accomplished.
47

• Question introduction: A decision needs to be made in the following scenario and you will represent
player A’s best interests. You need to select one alternative that, in your opinion, will have the best
consequence (addressing statement 1-3).
• Question body: In the following scenario, player A’ has the advantage over his opponent in certain
performance characteristics while his opponent has the advantage in other performance characteristics
(addresses part 5 of the statement for the shared decision making model).
• Determine the type of decision making question you would like to address and provide the scenario
details. For example, in localized decision making the scenario will be describe as such: Player A’s
opponent is playing Tactic 5 and have certain probability for implementing it in the game. Player
A can select to implement Tactic 1, Tactic 2, Tactic 3 or Tactic 4 and his implementation success
is a certain percent for Tactic 1, a certain percent for Tactic 2, a certain percent for Tactic 3 and a
certain percent for Tactic 4(Addresses statements 7,8 and 9 as the recruit will perform these processes
independently).
• Question conclusion: Considering player A’s alternatives in this scenario, what will be the best one to
implement against his opponent? (Refers to statement 6 which concludes the question structure).
The listing of a probability is important to illustrate the player perception of capability according to
his own internal scale. A similar situation occurs in the physician patient encounter as the patient receives
his information in successful percentages. This is the only valid information about the decision making
consequence that the physician can confidently share with this patient, i.e. successful procedures that he or
the department performed.
3.5.11 Decision making attributes
In this research we have demonstrated how we can work through a framework and build a ques-
tionnaire based on a given scenario. Our case study refers to a set of parameters that are static in time,
however, we know that real time decision making are dynamic. Dynamic decision making brings about a
higher level of complexity when considering two main attributes that affect the expected payoff over time.
The first one refers to the sequence or the order by which a decision is executed as there is effect from one
decision to the next. A player’s assigned values for performance characteristics which play an important
role in quantifying the expected payoff of a certain decision in the game. Any change in the performance
characteristics (physical, mental, or emotional) will affect the likelihood of success. For example, a sequence
48
of decisions have led to 6 points won back to back; this might change the confidence level of the player (emo-
tional aspect). Another example would be that a sequence of decisions has exhausted the player, resulting in
degraded level of performance (physical aspect). The sequencing attribute needs to be accounted for when
considering dynamics in the game.
The second attribute that needs to be consider is the response learning curve to a certain type of
decision in the game. The nature of the players is to maximize their performance thus they are constantly
looking for the best response to a certain situation. The opponent will learn to adapt and perform better
based on the frequency of decisions and their types, ultimately affecting expected payoff in future evaluations.
The more an opponent will encounter the same play the better his response will be over time thus the play’s
expected payoff will decrease over time as well. This logic brings about the motivation for mixing strategies
and tactics as there is a balance to determine when a certain play is profitable or not. These dynamics can
be further examined using simulation especially when considering decision making affect over time.
3.5.12 framework summary
The research framework demonstrates how to analyze decisions in the game, overcome uncertainty
and maintain relativity throughout the subjective assessment of specialist in the field. Once this framework
is utilized any change to the analysis setup will demonstrate the effects at each level of decision making.
This flexibility can prove to be quit significant in the recruitment process when evaluating the decision
making capabilities based on a determined scenario. In the following section we have applied the research
framework to analyze the decision making capabilities of tennis players in order to improve the Clemson
Tennis Club team to have the best chance of winning. The objective of this collaboration is to understand
how to mach players with their opponents based on their decision making capabilities in order to achieve
the highest relative advantage. This case study resulted in elevating the players awareness, improved the
players training program and provide a logical reasoning for creating a certain lineup.
3.6 Case Study: Decision Making Evaluation of College Tennis
Players
Now, we would like to examine if a potential recruit is able to reach this logical reasoning when
challenged to make a decision in a specific game scenario. We have created an appropriate survey using six
tennis game scenarios. Each player was introduced to the evaluation logical reasoning with a consent form,
49

as well as a response/survey form to complete at certain points during the evaluation. This research and
survey received institutional review board approval under protocol # IRB2015-365 at Clemson University,
named ”Human Performance Engineering and Decisions”. The only identifiers were the department name
and position title. The individual staff names were not recorded. Following the evaluation, each participant
received a full analysis of the evaluation findings. Each participant also received a set of recommendations
for improving his decision making capabilities in the future.
3.6.1 Creating evaluation questions
An evaluation question should contain a structure that imitates the actual player environment. In
the introduction to the question (or series of questions), the recruit is first familiarized with the scenario.
All performance characteristics of the players in the scenario are also described to the recruit. At this point,
the recruit activates his imagination while he embeds himself in the described scenario. He imagines his
opponent and the field of play, and he establishes a set of goals with which he is already familiar. From this
point, the question should expose the available alternatives or possible decisions that the player could make
in this scenario. The last part of this section is the question itself, where the recruiter can tailor to examine
specific decision and its considerations of the potential recruit. This enables the recruiter to evaluate a
player’s ability to:
1. Identify performance characteristics that provide a relative advantage and their effect on the physical
and mental aspect of the player’s performance capability
2. Understand the relationship between performance characteristics, tactics and strategies in the game
3. Differentiate between successful tactics when considering player execution capabilities
Differentiation between executions of tactics could be addressed as localized decision-making. Suc-
cessful execution of a certain tactic relies on the ability to control certain performance characteristics, re-
sulting in less resistance from the opponent. These types of players can assess a specific situation and make
a decision based on current capability. These players can make good decisions in a short time span, having
exceptional execution abilities so that they can reach high level of performance.
A successful relationship between performance characteristics to tactics or strategies in the game
could be addressed as short-term decision-making. These types of players can look at more than localized
situations and make a decision according to a larger set of information. They can put together a game
plan and be more effective in preserving energy than localized decision-making players. Players with an
50
effective short-term decision-making capability have a strong ability to tune themselves to certain situations
and specialize in several skills. In high levels of performance, these players can potentially win any type of
match.
Successful selection of game strategy reflects on the long-term decision-making capability. These
player’s are usually very consistent during high levels of performance and can play the game with a wide
variety of skills. They can determine when and how to employ a strategy; thus, they can adapt to any type
of situation and can predict many outcomes in the game. Such players may demonstrate the highest level of
analytical thinking as they can look closely at specifics as well as considering the larger scheme in the game
progression. Strategic players have the inert capability to make localized decision and short-term decision
as well.
An evaluation form containing 42 scenario-based questions is created in order to examine the traits
that are required to fill a certain position in the game (see appendix). As we mention earlier, these traits
might depend on a subjective evaluation in order to establish the best fit for that position. Once the potential
recruit has completed the evaluation form, quantitative and qualitative methodologies will be used.
The quantitative analysis section requires a system that would reveal the difference between a good
decision maker and a superb one. In order to create this feature in the analysis, we need to be able to quantify
each answer in a high variate scaling system. For example, for a multiple-choice answer, an exponential
scoring response could be used in order to increase variability between the possible answers. Assuming we
have a question to which we select an answer among five possibilities, each possibility will contain different
level of descriptive information. An answer that is selected and contains irrelevant information will be of
poor or inferior quality, thus its score should be the lowest. The range of answers contains many types of
information and the scoring difference should be substantial in order to identify the player who considers
the right type of information in the questioned scenario.
We propose the following scheme - the response’s answers are assigned a quality level from inferior
to superior, with a total of five possibilities. They are considered equally (spaced on a log2 scale, with the
information score being given a value. Then, the difference between the remaining quality levels is expressed
as 2 to the power of 1,2,3 and 4, thus the difference between the inferior level and the superior level is 30
points (see Table 3.9). This scale would generate a wider range of scores among the answers, thus providing
an easier mechanism for detecting differences between the decision making levels among the players.
The qualitative section of the questionnaire asks the players to explain their reasoning behind their
answers. This aspect allows the recruiter to extract more details about the way the potential recruit thinks.
51

Table 3.9: Sample grading scale with five possible answersAnswer QualityInferior 0
Low 2Average 6
High 14Superior 30
The recruiter can identify certain processing patterns and can evaluate the player’s knowledge of the game.
From a current pilot study that is conducted with the Clemson Tennis Club team, college tennis
players are presented an evaluation form. The form includes scenario-based expertise from former professional
tennis players and tennis coaches, including an author of this paper. In this study the decision making
capability of the players is challenged in an effort to identify strengths and weaknesses. Presented below are
four players that demonstrate different decision making capabilities.
3.6.2 Analyzing the responses of a recruit - A Case Study
The 42 questions were divided into four grading sections: Performance Characteristics Assessment
(PCA), Tactical Execution (TE), Tactical Selection (TS) and Strategic and Tactical Selection (STS). The
percentage represents the success rate of the possible points earn from the available points in each section.
Each player worked through the questionnaire at their own pace, and the graphs are the quantitative assess-
ments of the questionnaire. When looking at the each player’s decision making analysis, generic trends were
captured. For player 3, we see how performance deteriorates as different aspects of decision making are being
exposed. Player 1 presents the highest success in strategic decisions. Player 2 has the highest capability in
tactical decisions. Player 3 understands performance characteristics but has a low level of strategic thinking.
Player 4 excels in tactical decision making but poor strategic decision making. The meaning of these trends
is very important as we conclude this section. Player 1 is an all around player, with high capabilities in every
aspect of decision making. His average success is 73.5%. This player is consistent in his performance in the
game. Player 2 has similar features as player one only he demonstrate higher level of capability. His average
success is 77.7%. When compare to player 1 there are certain features of strength and weaknesses especially
when considering game plan creation. Player 3 demonstrate lower level of performance then player’s 1 and
2. He present the lowest success average with 63%. Player 4 present a better performance then player 3 but
still lower then player 1 and 2. His success rate stands on 67.7%.
52
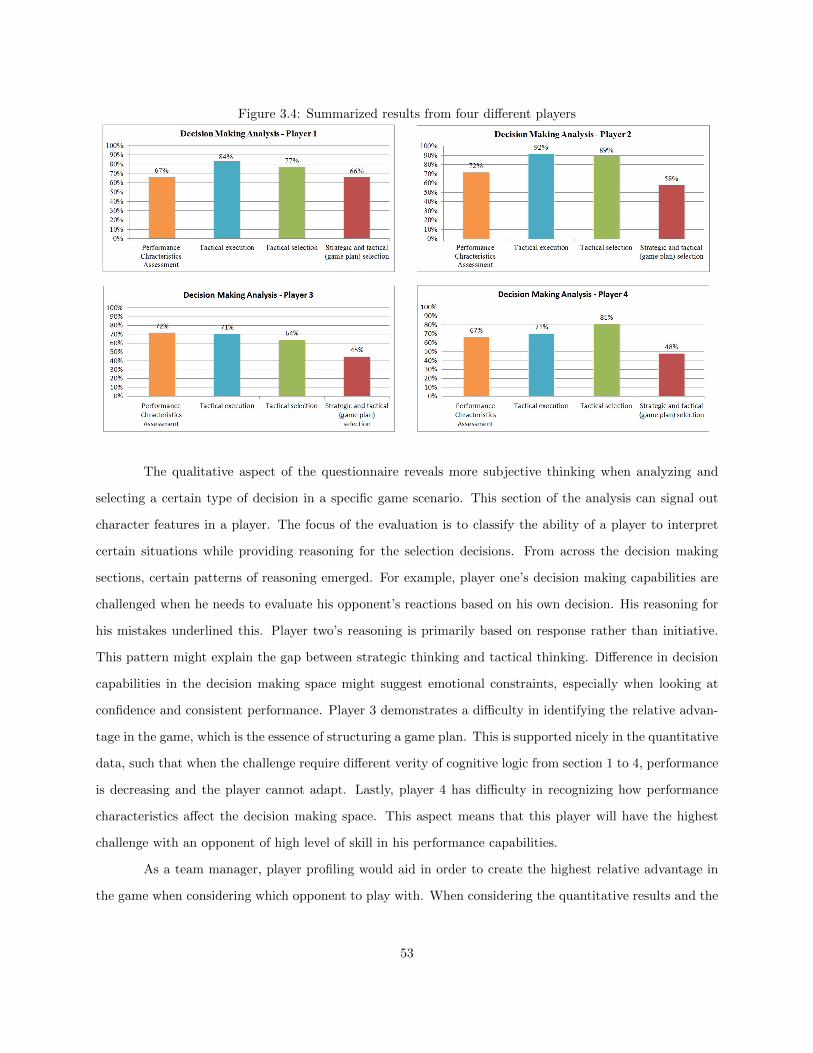
Figure 3.4: Summarized results from four different players
The qualitative aspect of the questionnaire reveals more subjective thinking when analyzing and
selecting a certain type of decision in a specific game scenario. This section of the analysis can signal out
character features in a player. The focus of the evaluation is to classify the ability of a player to interpret
certain situations while providing reasoning for the selection decisions. From across the decision making
sections, certain patterns of reasoning emerged. For example, player one’s decision making capabilities are
challenged when he needs to evaluate his opponent’s reactions based on his own decision. His reasoning for
his mistakes underlined this. Player two’s reasoning is primarily based on response rather than initiative.
This pattern might explain the gap between strategic thinking and tactical thinking. Difference in decision
capabilities in the decision making space might suggest emotional constraints, especially when looking at
confidence and consistent performance. Player 3 demonstrates a difficulty in identifying the relative advan-
tage in the game, which is the essence of structuring a game plan. This is supported nicely in the quantitative
data, such that when the challenge require different verity of cognitive logic from section 1 to 4, performance
is decreasing and the player cannot adapt. Lastly, player 4 has difficulty in recognizing how performance
characteristics affect the decision making space. This aspect means that this player will have the highest
challenge with an opponent of high level of skill in his performance capabilities.
As a team manager, player profiling would aid in order to create the highest relative advantage in
the game when considering which opponent to play with. When considering the quantitative results and the
53
qualitative information, matching of players with opponents should follow these guidelines. Player 1 should
be matched with a player that has a few tactical alternatives and his game style should be very transparent.
Player 2 should be matched with an opponent who demonstrates the same level of play or higher but does
not hold high levels of strategic capabilities. Player 3 should be matched with an opponent with low tactical
capabilities and who takes many risky shots in the game. Player 4 should be matched with an opponent
who demonstrates low levels of skills and transparent physical and technical capabilities that would allow
for specific tactical alternatives to be dominant.
3.7 Conclusions and Future Research
With many athletes possessing similar physical abilities that enable them to perform at a high
level, the relative advantage can be found with the player’s decision making capabilities. In this research
we present a method to improve recruiting by evaluating decision-making in a potential candidate. Our
framework creates a systematic way to form a recruitment evaluation, which could be tailored to any player
position in the game. Using the results from the analysis of players on the Clemson Club Tennis team, we
are enabling the recruiter to look at the decision-making capabilities of the player within his decision-making
space. These findings give rise to a more analytic thinking when managing a sport team in order to achieve
the highest relative advantage in the game.
Professional recruiters in the field have many issues to consider in a relatively short amount of time.
Thus, this tool can help promote the recruitment process as it will create a structured framework that will
sharpen the recruiter’s ability to find the right player for the right position. The recruiter’s ability to assess
the decision-making type of the player will reduces the coach’s uncertainty when he consider the player’s
performance in a certain game scenario.
This line of research can open the door for more examination of how performance characteristics
take part in the decision-making capability of a player in the hope of achieving a higher level of performance.
As we know how to scale a level of characteristics and evaluate the relative advantage, we can test these
concepts further to quantify performance characteristics. Using computer simulation or similar tools, our
approach in this research can help shape management setup and structure of an athletic program as its
implementation will require a process of identifying, classifying and comprehending all aspects of human
performance.
54
3.8 Aknowledgements
We would like to thank the Clemson Club Tennis players who participate in the experiments. We
would also like to thank the undergraduate research group (known as Creative Inquiry (CI) at Clemson)
who took part in conducting and running this research.
3.9 References
S. Tadelis (2013), Game Theory: an introduction, Princeton University Press, UK.
W. J. Hopp, M. C. Spearman(2011), Factory Physics Third Edition, Waceland Press, Inc. IL.
A. Linhares, A. Elizabeth, T. A. Freitas, A. Mendes, J. S. Silva (2012), ’Entanglement of perception and
reasoning in the combinatorial game of chess: Differential errors of strategic reconstruction’, Cognitive Sys-
tems Research, Vol 13, No 1, pp 72-86.
Dumond, J.M., Lynch, A.K. & Platania, J. 2008, ”An Economic Model of the College Football Recruiting
Process”, Journal of Sports Economics, vol. 9, no. 1, pp. 67-87.
Huffman, L.T. & Cooper, C.G. 2012, ”I’m Taking my Talents to...An Examination of Hometown Socio-
Economic Status on the College-Choice Factors of Football Student-Athletes at a Southeastern University”,
Journal of Issues in Intercollegiate Athletics, vol. 5, pp. 225-246.
Moore, B. 2014, ”What Makes a Recruitable Athlete?”, Texas Coach, vol. 58, no. 8, pp. 34-37.
Morgan, T. & Martin, M. 2007, ”Student Recruiting: Implications for Athletic Training Education Pro-
grams”, Athletic Therapy Today, vol. 12, no. 6, pp. 29-32.
Petersen, A., Wagner, K. & Greener, T. 2012, ”Recruiting”, Strength & Conditioning Journal (Lippincott
Williams & Wilkins), vol. 34, no. 1, pp. 87-88.
J. Niednagel(1992), ’Your key to Sport success’, Laguna Press: Laguna Niguel, CA.
A. Patil, M. S. Pasodi (2012), ’Responsibility and Difficulty of Coaches in Selection of Athletes for Sports
Meet’, International Journal of Sports Sciences and Fitness, Vol 2, No 1.
M. Spieler, D. R. Czech, A. B. Joyner, B. Munkasy, N. G. J. Long (2007), ’Predicting Athletic Success:
Factors Contributing to the Success of NCAA Division I AA Collegiate Football Players’, The online journal
of sport psychology, vol 9, No 2.
Basco, D. & Davies, M. 2010, ”The many flavors of DIPS: a history and an overview”, The Baseball Research
Journal, vol. 39, no. 2, pp. 41.
Baker, S. 1996, ”The four A’s in recruiting college baseball”, Coach & Athletic Director, vol. 65, no. 10, pp.
55

90.
F. Lauterbur (2000), ’Defense Against a Strong Passing Team’, Defensive Football Strategies, Champaign,
IL: Human Kinetics, pp 176-177.
M. Miller (2013), How do Scouts Break Down NFL Cornerback Prospects?, [online] Copyright 2015 Bleacher
Report, Inc. Turner Broadcasting System, Inc. All Rights Reserved. BleacherReport.com is part of Bleacher
Report Turner Sports Network, part of the Turner Sports and Entertainment Network. Certain photos copy-
right 2015 Getty Images. Any commercial use or distribution without the express written consent of Getty
Images is strictly prohibited. AdChoice, http://bleacherreport.com/articles/1686545-how-do-scouts-break-
down-nfl-cornerback-prospects .
D. M. Nelson (1994), ’The Anatomy of a Game’, Cranbury, NJ: Associated University Presses, Scouts Inc.
Nyberg, G. 2014, ”Exploring knowings in human movement: The practical knowledge of pole-vaulters”,
European Physical Education Review, vol. 20, no. 1, pp. 72-89.
Ibrahim, S. & Kanniyan, A. 2013, ”Effect of Selected Physical, Technical and Motor Fitness Variables on
the Prediction of Pole Vaulting Performance of Men”, British journal of sports medicine, vol. 47, no. 10,
pp. 35-35.
Risk, B. 2000, ”Visual skill and pole vaulting. / Aptitudes visuelles et saut a la perche”, Track Coach, , no.
150, pp. 4784-4788.
T. Jordan (2014), ’Track and Field’, Scholastic. online ¡http://www.scholastic.com/teachers/article/track-
and-field¿ (Accessed 17 October 2015).
M. McCormick (2010), Soaring to New Heights: The Evolution of Pole Vaulting and Pole Materials, Illumin.
Online. ¡http://illumin.usc.edu/printer/143/soaring-to-new-heights-the-evolution-of-pole-vaulting-and-pole-
(Accessed 19 Oct. 2015).
D. Shvorin, K. Taaffe (2014), ’Improving tennis player performance using system development interpreta-
tions methodology’, International Journal of Quality Engineering and Technology (IJQET), Vol. 4, No. 3
A. Arad (2012), ’The Tennis Coach Problem: A Game-Theoretic and Experimental Study’, The B.E. Journal
of Theoretical Economics: Vol. 12 No. 1
D. Montgomery (2013), ’Introduction to Statistical Quality Control’, 7th edition, John Wiley and Sons, Inc.
T. Foster (2013), Managing Quality: Integrating the Supply Chain, 5th edition, Pearson Education, Inc.
Ilundin-Agurruza, J. 2015, ”From clumsy failure to skillful fluency: a phenomenological analysis of and
Eastern solution to sports choking effect”, Phenomenology and the Cognitive Sciences, vol. 14, no. 2, pp.
397-421.
56

Park, J.L., Fairweather, M.M. & Donaldson, D.I. 2015, ”Making the case for mobile cognition: EEG and
sports performance”, Neuroscience and biobehavioral reviews, vol. 52, pp. 117-130.
I. Scholl, L. Kriston, J. Dirmaier, A. Buchholz, M. Harter, ”Development and Psychometric Properties of the
Shared Decision Making Questionnaire–Physician Version (SDM-Q-Doc).” Patient education and counseling
88.2 (2012): 284. Web.
I. Scholl,M. K. Loon, K. Sepucha, G. Elwyn, F. Lgar, J. Dirmaier, ”Measurement of Shared Decision Making
a Review of Instruments.” Zeitschrift fuer Evidenz, Fortbildung und Qualitaet im Gesundheitswesen 105.4
(2011): 313-24. Web.
3.10 Appendix
Table 3.10: Tactical dataTactic Benefit Cost Success Rate
1 1 2.35 0.952 1 2 0.73 0.67 2.35 0.954 2.5 2 0.55 3 1 0.66 3 4 0.87 2 2 0.88 6 1.35 0.2
E[T1] =0.4
2· 1.6 +
0.6
2· 4.5 +
0.8
2· 2.6 +
0.2
2· 1.5 = 2.86
E[T2] =0.4
2· (−0.1) +
0.6
2· 2 +
0.8
2· 0.9 +
0.2
2· (−1) = 0.84
E[T3] =0.4
2· 1.3 +
0.6
2· 4.1 +
0.8
2· 2.3 +
0.2
2· 1.1 = 2.52
E[T4] =0.4
2· (−0.7) +
0.6
2· 0.7 +
0.8
2· 0.2 +
0.2
2· (−2.2) = −0.07
E[SA, T1] = 0.2 · 0.6 · {0.8 · 0.4 · 1.6 + 0.8 · 0.6 · 4.5 + 0.2 · 0.8 · 2.6 + 0.2 · 0.2 · 1.5+} = 0.38
Questionnaire Sample Questions
Performance Characteristics Assessment
• If I want to reduce my opponent reaction time, which characteristic would be the most beneficial to
my performance?
Anticipation ,Endurance, Adaptability, Patience
57

Table 3.11: Tactical data when in play and its expected payoffPlayer 1 Player 2
Tactic Benefit Cost E[v] Benefit Cost E[v]T1—T5 2 5.33 1.6335 5.33 2 2.398T2—T5 2 5 -0.1 5 2 2.2T3—T5 1.67 5.33 1.32 5.33 1.67 2.53T4—T5 3.5 5 -0.75 5 3.5 1.6T1—T6 5 5.33 4.4835 5.33 5 3.264T2—T6 5 5 2 5 5 3T3—T6 4.67 5.33 4.17 5.33 4.67 3.33T4—T6 6.5 5 0.75 5 6.5 2.7T1—T7 3 4.33 2.6335 4.33 3 2.864T2—T7 3 4 0.9 4 3 2.6T3—T7 2.67 4.33 2.32 4.33 2.67 2.93T4—T7 4.5 4 0.25 4 4.5 2.3T1—T8 2 8.33 1.4835 8.33 2 0.066T2—T8 2 8 -1 8 2 0T3—T8 1.67 8.33 1.17 8.33 1.67 0.33T4—T8 3.5 8 -2.25 8 3.5 -1.2
* Expected Payoff is calculated using equation 4 as well as Table 9
• If I want to take my opponent out of his comfort zone, which characteristic would be the most beneficial
to my performance?
Aggressiveness, Precision, Agility, Alertness, Motivation
• If I want to reduce my unforced errors and go for high percentage shots, which characteristic would be
the most beneficial to my performance?
Cleverness, Imagination, Self-Discipline
Tactical Execution Assessment
• Intro: Your opponent can anticipate your moves and he is highly adaptable, whereas you are more
patient and have an advantage in your endurance capabilities.
Body: Our game analysis indicates that when you try to reduce your opponent reaction time, you have
70% of implementing this tactic. When you try to bring you opponent to the net you have 70% of
implementing this tactic. When you try to approach the net and volley you have 70% of implementing
this tactic.
Conclusion: Which tactic would you choose that will eventually earn you more points in the game
58

given your opponent characteristics?
Bring my opponent to the net, Approach the net and volley
Tactical Selection Assessment
• Intro: Your opponent can anticipate your moves and he is highly adaptable, whereas you are more
patient and have an advantage in your endurance capabilities.
Body & conclusion: Given that you are mixing between reducing the opponent reaction time and high
variety shots. Which tactics would you choose that will eventually earn you more points in the game
given your opponent characteristics?
– Go for flat shots close to the net & hit the ball flat along the lines
– Serve Volley & go for the touch shot
– Approach and Volley & increase the shot height and depth
– Bring my opponent to the net & hit the ball with heavy spin to the court angles
Strategic and Tactical Selection Assessment
• Intro: Your opponent is highly aggressive and motivated whereas you are more precise, agile and alert
to what is happening in the game.
Body & conclusion: Given that you are mixing between taking your opponent out of his comfort zone
and changing court positions, which tactics will eventually earn you more points in the game given
your opponent characteristics?
– Hit the ball with heavy spine for high bounce & Mix between power shot and floaters
– Flat shot deep in the court & Mix between rally from the base line and rally at the net
– Slice the ball for low bounce & Mix between short angle shot and high deep balls
– Hit the ball with heavy spine for high bounce & Mix between short angle shot and high deep balls
59
Chapter 4
Improving a Tennis Player’s Shot
Selection by Accounting for Fatigue
4.1 Abstract
Performance characteristics (PC) play a vital role in the decision-making process. These PC’s can
be articulated by the player’s physical, emotional and mental states, as well as the environmental conditions
in certain situations. Although the relationship between these PC’s and decision-making are not yet known,
this study aims to specifically address how fatigue impact the player performance. The research evaluates the
tennis player ability to update his decision-making due a change in his physical capability. A simulation model
is developed to help players test various decision-making patterns in order to improve their decision-making
logic in the game. An optimization scheme utilizes the simulation model to find the best decision-making
pattern for each player. Our research findings demonstrate that at some point the player will select a lower
risk target under increasing levels of physical exhaustion and select a higher risk target once recuperated.
The study present a predicted player performance improvement of 18%, 11%, and 4% at the amateur,
intermediate and advance skill level of play.
4.2 Introduction
The dynamics of performance is very challenging to define when considering the physiological, psy-
chological and emotional capabilities. It is rational to assume that when energy is consumed from the body,
60
the capability of the player should decrease. In Lyons et al. (2013), there is an increase in the player ac-
curacy, for experts and amateurs, as the players reached 70% of their energy use (fatigue). However, both
player types experience a degradation in their accuracy as they reached 90% of their energy usage. One
explanation for this phenomena is due to a player’s practice experience, as players of all levels will spend
most of their practice in a physical range with proximity to what was recorded as the 70% mark. On the
other hand, players spend a limited amount of time practicing at the 90% level as it is also poses an in-
jury risk. In Ferranti et al. (2001) the players performance was significantly higher when given 10 seconds
recovery than 15 seconds recovery. Logically, if the player has more resting time between shots, he should
perform better but, as illustrated, this is not the case. Furthermore, in a review made by Kovacs (2006),
the physical condition of optimal performance is shown in various aspects for the tennis player, including
flexibility, power, speed and agility, strength, and fatigue.
It is demonstrated that too much or too little stimuli will not produce high level of performance
when considering the physical conditioning. Moreover, the same line of thinking can explain the emotional
and the cognitive features of the player as well. It is also evident that there are competing factors such as
accuracy vs. power, recovery time (rest) vs. endurance, fear vs. excitement, and planning vs. improvisation.
The key to maintaining a high level of performance under changing condition lies in the decision-making
capability of the player. In the next section we will look into the decision-making features and investigate
how they play a role in the decision-making process. Next, we will discuss our research approach and tools.
Following this, we will present our data collection scheme and explain our analysis method. Next we will
address the simulation model and its application in educating tennis players, discuss our findings and their
implications, and conclude with a discussion to complete this research paper.
4.3 Motivation and literature
There are many factors that impact the player performance ranging from emotional desires such as
pleasure and satisfaction to physiological capability such as flexibility and technique. These features are taken
under consideration in the decision-making process as they are dynamic in nature, and may change every
time the player starts a new tennis session. In this research, a game setting is proposed with an objective
of accumulating as many points as possible. The game settings take under consideration time limitation,
feedback, and past experience when evaluating the ability of the player perform and make decisions. The
study demonstrate how a characteristic like fatigue affects a player’s performance, and offer insights into
strategies for improving performance and decision-making when faced with fatigue.
61

With no time limitation, the majority of the population will behave consistently according to princi-
ples of rationality (Association of American Publishers Professional and Scholarly Excellence Award, Glim-
cher (2004)). Time pressure increasingly challenge the decision performance as it affects different individuals
to different extents, but the general trend remains consistent: with reduced time to react, individuals demon-
strated less ability to discern important information before making decisions, Glimcher (2004). The analysis
of decision times revealed that the existence of the time constraint, not time insufficiency, causes perfor-
mance degradation. It also caused participants to adopt simpler strategies instead of analyzing and making
decisions adequately.
Feedback to a decision may change the process of making decision (according to Zeelenberg (1996)).
The results of his experiments show that the anticipation of regret can promote risk-averse as well as risk-
seeking choices. This finding contradicts the claim that the anticipation of regret only results in risk-aversion
as suggested by Kardes et al. (1994). Feedback comes at the end of the decision-making process but
bias comes in the beginning. According to Evans (1989), decision-making bias is when previous events or
experiences, as well as individual personality traits, influence future decisions. In a different situation, bias
can lead someone to make riskier decisions due to a success streak with their choices. A rational decision
maker is someone who demonstrates consistent choices over time, however, humans, although demonstrate
principles of rationally, demonstrate bias over time. One interesting way to trigger bias is through the
presentation of information. In the study of Martino et al. (2006), subjects were shown the same problem
but in two versions of presentation: one with a positive frame and one with a negative frame. Their research
showed that under different presentations, the tendency to take risk is significantly different.
Perhaps the most powerful influence lies with past experience or an embedded habit (according
to Arts et al. (1998))). In their study they exposed the participants to decision-making alternatives given
ample time to gather the necessary information. They showed that, with repeated trials or gained experience,
participants learn to isolate certain ques in the presented information, thus executing their decision faster
and more efficiently. This repeated knowledge empowers the participant to develop insights that bypass
certain decision-making processes and enables the participant to deal with complex situations more quickly.
decision-making is a dynamic process as there are competing factors that assume new meaning with
each passing moment. Specifically in tennis, the physical, emotional and mental capability are put to the test
in every single point as the player is the sole decision maker, aiming to win the game. In the research of Kovacs
(2006), the game demands various elements that are customize to each experience. The game is unpredictable
in its point length, shot selection, strategy, match duration, weather, ball speed, distance covered by the
62

players, and various types of player characteristics that change throughout the match. Furthermore, Shvorin
and Taaffe (2014) offer an analysis scheme were performance characteristics are linked to create a profile of
the player capabilities. Once a profile is created for a player or a team, appropriate strategies and tactics
could be generated to maximize performance in the game.
Although we have yet to understand various types of performance characteristics impact on the
decision-making process, fatigue is considered extremely critical when considering injury prevention, per-
formance preservation, and play a vital rule in decision-making. According to Carpenter et al. (1998),
Mayers et al. (1999), and Murray et al. (2001), fatigue affect the player mechanics, reducing ball velocity,
limiting large range of motion, reducing proprioceptive ability, increasing response time, reducing sensation
of joint movement, reducing skeleton rotation, and reducing emotional and cognitive functioning. According
to Linossier et al. (1997), Hargreaves et al. (1998), Pearcey et al. (2015) and Bachasson et al. (2016), the
metabolic and physiological functioning such as duration of recovery, duration of the intensity of work, and
the regulation of physiological strain during intermittent exercise is also reduced by fatigue. According to
Bouaziz et al. (2016), fatigue cause a continuous degradation of phosphocreatine, thus placing greater de-
mand on glycogenolysis and glycolysis that increase the level of acid in the muscle. If exercise is undertaken
with limited rest periods for more than a few days in a row, it can lead to dangerous over-training syndrome.
Ferranti et al. (2001), suggest that a decrease in running speed results in inaccurate stroke prepara-
tion, leading to a decrease in stroke speed (performance), as well as possible stroke intention (avoiding errors
as opposed to hitting winners). According to Davey et al. (2002/2003) as well as reaffirmed by Lyons et al.
(2013), shot accuracy is reduced by as much as 81% when a tennis player is nearing volitional fatigue. After
the fatiguing test employed in their study, four minute side to side forehand and backhands drill with a 40
second rest period until volitional fatigue was achieved, they demonstrated a 69% deterioration in hitting
accuracy of ground strokes and a 30% decline in accuracy of the service to the right hand court. In addition,
it has been reported that after a two hour strenuous training session, an increase in ground stroke errors
during defensive rallies and an increase in errors on first serves were observed.
Fatigue in these experiments is not representative of the physiological strain encountered during a
match setting, nor of most practice drills. This artificially induced fatigue state will lead to high lactate levels
that are not typically seen in tennis matches. As tennis competition has average points lasting less than 10
seconds, with rest periods of approximately 20 seconds between points and 90 seconds after every second
game, the physiological variables are unlikely to lead to a large accumulation of lactate. Thus accumulating
lactate levels are not a major cause of fatigue in tennis match play.
63

4.4 Methods
While there is evidence for performance degradation due to fatigue, it is less clear how fatigue
impacts the decision-making process, especially when considering risk taking. Logically, if the performance
level of the player is reduced as fatigue comes into play, the player should select targets that require less
effort. This means that the player should accommodate his performance degradation with reducing his risk
taking shots in the game. In order to test this theory, we created a drill that test how target selection might
change due to fatigue impact on shot accuracy in a tennis drill.
The study is internally funded by the Watts Family Innovation Center (WFIC) creative inquiry
program. It received its Internal Review Board (IRB) confirmation number (e.g. IRB2016-249) in 10/6/2016.
Our team encompass five undergraduate researchers, one graduate researcher and a faculty adviser. This
study collaborates with the Clemson University club tennis team and coordinates its activity based of the
team availability.
4.4.1 Participants and testing site
This study included three college players who are actively training in the Club Tennis Team program
at Clemson University. The players are males, ages of 19.8± 1.2 years. The tennis players experience ranges
through 5 ± 2.2 years. The players train four times a week roughly around two hours per training session.
The players participate in an amateur level league between schools, organized by clubs of different schools in
the country, unlike the formal division league which is registered with the Atlantic Cost Conference (ACC)
and play in the National College Athletic Association (NCAA) games. The players also present three levels,
amateur, intermediate and advanced performance skills.
The experiments were hosted in the indoor courts at the evening sessions of practice between 6:00
and 9:00 pm. The courts are standardize according to the NCAA specifications and made out of Asphalt
Cushioned Surface. The courts meet American Sports Builders Association (ASBA) requirements for safety
regulations. Lighting is uniform and glare-free and is provided from six direction to each court. In winter,
the facility temperature is between 13-17C (55-62F), and in summer, the temperature of 23-35C (75-95F).
Humidity is between 55-60% and noise do not exceed 45 dB according to the facility specification.
64

4.4.2 Experimental design
The study used a similar design structure such as presented in Ferranti et al. (2001), Davey et al.
(2002/2003), and Lyons et al. (2013). Informed consent were collected as required according to the study
IRB protocol. Medical approval is required from all athletes who participates in a club sport activity thus
naturally accommodates the IRB protocols. Each participant was made fully aware of the purpose of this
study and participated on a voluntary basis with the option to steer away from the study at any time. The
study requires one session from each participant that includes baseline measurements (moderate fatigue, and
intense fatigue)and a decision-making game.
The court setup takes into account two different type of shots as each one have a purpose in the
experiment as you can see in Figure 4.1. Target A is located at the edge of the service box and require a
delicate control shot of slice type, using a continental grip (recommended). Target B is located at the edge
of the baseline and the single court boundaries and require a forehand shot cross court. The distance from
the center of target A to the hitting zone is roughly 42 foot and the distance from the center of target B to
the hitting zone is roughly 60 foot. Both targets have the same size and shape (6.56 x 6.56 squared foot).
The consistency zones have the same size and shape (13 x 13 squared foot), and they include the accuracy
zones in the drill. The hitting zone area is located in the center of the court slightly closer to the service
boxes. This means that the serving ball actually bounce near the end of the service boxes allowing this shot
to be consider an approach shot thus making the two targets effective in a real match (depending where the
opponent is located). The two cones next to the hitting zone mark the movement area between shots.
Figure 4.1: Experiment court structure
The objective of this study focuses on decision-making thus its structure relays on former studies
such as Davey et al. (2002/2003) and Leyons et al. (2013) when it comes to performance degradation due to
65
fatigue. Players will first warm up for at least 15 minutes and get familiarized with the targets and the shot
recommendations, although they can use their own comfort shot style. The players will only hit forehand
shot for the duration of the drill. In the moderate session the players will hit 100 balls to target A following
by 100 balls to target B, throughout the drill the players will be require to minimize their movement so they
do not have to move between shots. In the intense portion, the same setup will occur only the player will
have to mimic a game movement between shots. After each shot from the hitting zone, the players will move
as close as they can to one of the cones. If they are hitting to target A, they will move backwards and if
they are hitting for target B they will move sideways.
The last session includes a game were the players can make a decision and select the target they
want to aim at. Similar to the intense settings, the players will have to move between shots, however, they
will hit 141 balls which will take more play time. The drill will take roughly six minutes to perform. This
play time period resembled the time phase for achieving high levels of fatigue as discussed in Davey et al.
(2002/2003) and Leyons et al. (2013).
4.4.3 Data collection and scoring
The base line measurements (moderate and intense) will take into account the amount of shots that
were accurate (hitting target A and B), the amount of shots that were consistent (hitting the consistency
zones) and the amount of shots that were out of court or hit the net. Each player will be fitted with a bio-
sensor (empatica) device which present real time information such as heart rate, body temperature, hitting
acceleration, and stress levels.
In the baseline session there is no scoring but only a reflecting percentage for hitting the target and
the consistency zone. These two session enable us to show the player how his performance degrades when
the drill intensity changes and fatigue starts to build up. In the game session, scoring is determine in the
following way. For each consistency zone that the player hit, he will receive one point. Hitting target A will
earn the player two points while target B will earn the player four points (double in benefits).
The goal of the player is to achieve the maximum score in the game, which means that the player
should get as many points as he can in the allotted amount of shots.
4.4.4 Experiment equipment
• The Emaptica 4 or in short E4 device, is a wearable body sensor that sits on the human risk. It has
four sensors that measure blood volume pulse (BVD), electrodermal activity (EDA), infrared thrmopile
66

and three axis accelerometer. These sensors provide information regarding hart rate, stress levels, skin
temperature and motion in space. The device is blue tooth and wireless and is used to record body
function over the duration of the experience. The data is uploaded via WIFI and downloaded as a
cvs data file. The photoplethysmography sensor measures BVP, from which heart rate (HR), heart
rate variability (HRV), and other cardiovascular features is derived. The EDA Sensor measures the
sympathetic nervous system arousal to derive features related to stress, engagement, and excitement.
In recent studies, Hernandez et al. (2015), Bidwell et al. (2015), Picard et al. (2015) and Callaway
et al. (2015), significant relationships were detected between stress levels and hart rates to various
medical conditions. Currently this device is under a clinical trial for detecting seizure and bio-markers
in epilepsy, Van Dooren et al. (2012).
• The Lobster Sports Elite Liberty Tennis Ball Machine is used in our experiment. The machine can
produce ball speeds from 20 mph up to 80 mph and offer spin control which can be adjusted for both
topspin and backspin and at different levels. The large ball capacity can hold up to 200 balls and
battery last for four hours at most. The machine also offer full corner-to-corner random oscillation and
up to 50-degree lobs to practice overheads.
The empatica E4, was design to measure resting heart rate (not while playing a game), thus there
is a constant deviation from real heart rate. Temperature measurement reflects skin temperature and not
internal body heat level, which might create different behavior due to sweat (the body cooling itself utilizing
its skin).
4.5 Results and discussion
In this section we will examine specific aspects of the experiment. First, we will address the design
of the drill as it fosters the link between fatigue and decision-making. We will continue to examine the
physiological trends that occur and link these changes with the ability of the player to perform (hitting the
target). Lastly, we will address the game structure and the decision patterns that it produces.
The statistical testing, using MinTab17, was conducted to determine where statistically significant
differences or trends existed between participants or between groups of shots (representing periods of time
during the experiment).
67

4.5.1 Drill design validation
The drill designed intend that Target B would be more difficult to hit than Target A, and that the
Intense level of physical engagement would exert more energy from the player than the Moderate level of
physical engagement. In order for the drill to achieve what is intended, we test the following hypotheses:
H0: Hitting the ball to target B, on average, will not require higher levels of physical engagement
(HR, EDA, ACC, Temp) from the player than hitting the ball for target A.
H1: Hitting the ball to target B, on average, will require higher levels of physical engagement (HR,
EDA, ACC, Temp) from the player than hitting the ball for target A.
In order to test this hypotheses we look into our biodata. In Figure 4.2, we can see the drill
settings trend of heart rate average level when comparing target A to target B. The analysis of variance
(ANOVA) compares between the three players average heart rate when hitting at Target A and Target B,
when considering the moderate and intense levels of physical engagement. The intense drill setting presents
a significant difference in heart rate levels when hitting for target A as opposed to target B. From the intense
portion of the drill, with p-value =0.002, we can conclude that the null hypotheses can be rejected, thus
target B consumes more energy then target A when considering heart rate level.
Figure 4.2: Heart rate comparison between targets and drill intensity
In the Table 4.1, we can see that differences between target A and B were significant when considering
heart rate and shot acceleration at the intense physical level. Since the rest of the measurements have
received lower significant results (i.e. there was no difference on average between players in these settings),
we can conclude that they are the same. In conclusion, target B have demonstrated higher level of physical
68

engagement than target A, confirming that the drill achieves its design objectives. At this point, we can
conclude that the null hypotheses can be rejected, thus target B requires higher levels of physical engagement
then target A when considering heart rate and shot acceleration level.
Table 4.1: Statistical differences between targets in moderate and intense drill settingsPhysical Level (P-value) Heart Rate Electrodermal Activity Shot Acceleration Skin Temperature
Moderate 0.095 0.630 0.111 0.765
Intense 0.002 0.128 0.047 0.691
While the biomarkers, presented in Table 4,1, could have some effect on physical engagement and
fatigue (and ultimately shot accuracy), the only consistent measure is heart rate. So as we move into the
simulation/optimization section, we will focus our attention on this measure.
Looking further into the drill design, we need to assess how the bio-markers rate differ across the
drill physical level when hitting to Target A and Target B. The following hypotheses is defined as:
H0: Hitting the ball to target B, on average, will not cause higher heart rate increase than hitting
the ball to target A.
H1: Hitting the ball to target B, on average, will cause higher heart rate increase than hitting the
ball to target A.
In order to test this hypotheses we look into our biodata and continue to examine heart rate, shot
acceleration, stress level (EDA) and skin temperature. In Figure 4.3, a breakdown of heat rate elevation per
drill settings is shown in the left side. The rate of change is calculated utilizing the following formula:
HeartRateIncreasePerShot =MaxHeartRate −MinHeartRate
TheNumberofShots(4.1)
This calculation is done for each player thus we receive a table with 12 entries. As you can see, the
drill settings demonstrate a trend as, on average, heart rate level increase the most in the intense section
when hitting the ball to target B. On the right side, you can see the difference in heart rate increase between
hitting to target A and hitting to target B per shot on average. This graph includes both the data from the
moderate and the intense level of physical engagement.
When testing for differences in heart rate increase within each drill setting, we could not reject the
null hypotheses thus across the drill settings there is no justification for significant change in increase rate.
69

Figure 4.3: Differences in heart rate based on drill settings
However, when looking at the two different targets, there is statistical evidence that the increase of heart
rate is significantly higher when hitting the ball for target B, thus we reject the null hypotheses. In the
Table 4.2, the summary of our statistical testing is presented across the bio-markers which was recorded in
the drill.
Table 4.2: Statistical testing: differences in bio-markers rate of changeBio Marker (P-value) Drill Settings Target Comparison
Heart Rate 0.181 0.036Shot Acceleration 0.156 0.259
Stress (EDA) 0.158 0.246Skin Temperature 0.699 0.646
From Table 4.2, we can see that across the drill settings there is no significant change in rate
when considering the recorded bio markers. Due to insufficient statistical evidence we fail to reject the null
hypotheses, thus we can’t determine that a bio marker is producing a different result or value based on drill
settings.
When comparing between targets, heart rate is the only bio-marker that demonstrates a significant
70

change. For this bio-marker, we reject the null hypotheses and conclude that there is significant difference
in the rate of change when hitting to Target A and when hitting to Target B. The rest of the bio markers
show lack of statistical evidence when considering differences between the two targets thus we fail to reject
the null hypotheses and conclude that the bio-markers rates of change do not produce differences in results
when compared between targets.
4.5.2 Player bio-markers - first 50 shots vs. last 50 shots
From our drill validation we have concluded that hitting the ball to Target B will increase heart rate
more than twice as fast when compared to Target A. In this section we take a closer look at the trends in
the bio-markers data for intense drill setting only. Since we only have 100 shots, we have divided the data
to look at the first 50 shots and the last 50 shots.
In Table 4.3 we can see that when fatigue comes into play, the heart rate of the players increases
over the duration of the drill in both targets. Beside heart rate, the rest of the bio-markers do not present
significant trends, however with more data (and a larger sample) it is expected that the average sore per
shot and shot acceleration will decrease while skin temperature and stress will increase.
Table 4.3: Statistical testing: average bio-marker trends in target hittingDescription Score Per Shot Heart Rate EDA ACC Temperature
Target A Response - First 50 shots 1.08 110.76 18.19 0.75 33.79Target A Response - Last 50 shots 0.91 121.11 15.6 0.77 33.66
Percent change -16% 9% -14% 3% -0.4%p-value 0.476 0.039 0.354 0.842 0.933
Target B Response - First 50 shots 1.01 123.85 21.94 1.01 33.97Target B Response - Last 50 shots 0.88 146.46 22.39 0.98 34.64
Percent change -13% 18% 2% -3% 2%p-value 0.468 0.003 0.898 0.749 0.624
To strengthen these bio-marker changes over time, more players are required as the data that we
currently have, relates to a small sample of three players. Although statistical justification for all bio markers
do not exist at the moment, the trends reflect the behavior observed in reality and strengthen the drill design
validation.
4.5.3 Accuracy and consistency in different drill settings
As was noted in the prior section, the average score per shot appears to decrease for the second
50 shots, and we believe the result is not statistically significant due to the small sample size. However, it
71
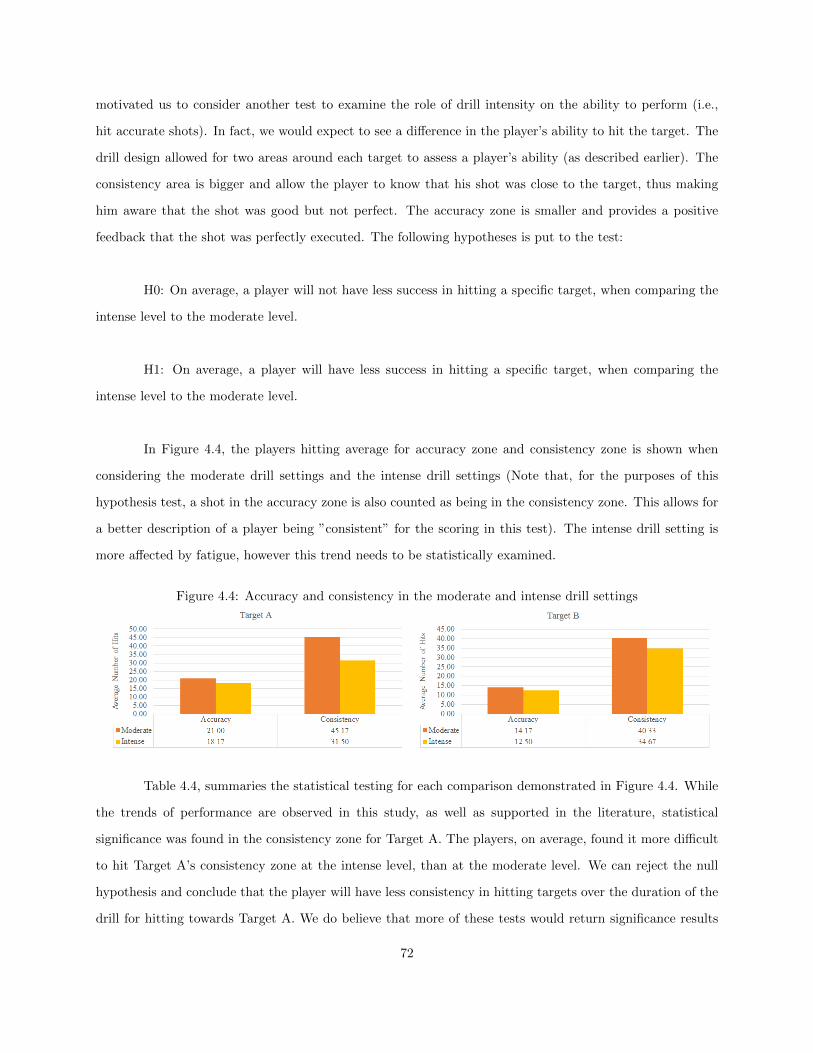
motivated us to consider another test to examine the role of drill intensity on the ability to perform (i.e.,
hit accurate shots). In fact, we would expect to see a difference in the player’s ability to hit the target. The
drill design allowed for two areas around each target to assess a player’s ability (as described earlier). The
consistency area is bigger and allow the player to know that his shot was close to the target, thus making
him aware that the shot was good but not perfect. The accuracy zone is smaller and provides a positive
feedback that the shot was perfectly executed. The following hypotheses is put to the test:
H0: On average, a player will not have less success in hitting a specific target, when comparing the
intense level to the moderate level.
H1: On average, a player will have less success in hitting a specific target, when comparing the
intense level to the moderate level.
In Figure 4.4, the players hitting average for accuracy zone and consistency zone is shown when
considering the moderate drill settings and the intense drill settings (Note that, for the purposes of this
hypothesis test, a shot in the accuracy zone is also counted as being in the consistency zone. This allows for
a better description of a player being ”consistent” for the scoring in this test). The intense drill setting is
more affected by fatigue, however this trend needs to be statistically examined.
Figure 4.4: Accuracy and consistency in the moderate and intense drill settings
Table 4.4, summaries the statistical testing for each comparison demonstrated in Figure 4.4. While
the trends of performance are observed in this study, as well as supported in the literature, statistical
significance was found in the consistency zone for Target A. The players, on average, found it more difficult
to hit Target A’s consistency zone at the intense level, than at the moderate level. We can reject the null
hypothesis and conclude that the player will have less consistency in hitting targets over the duration of the
drill for hitting towards Target A. We do believe that more of these tests would return significance results
72
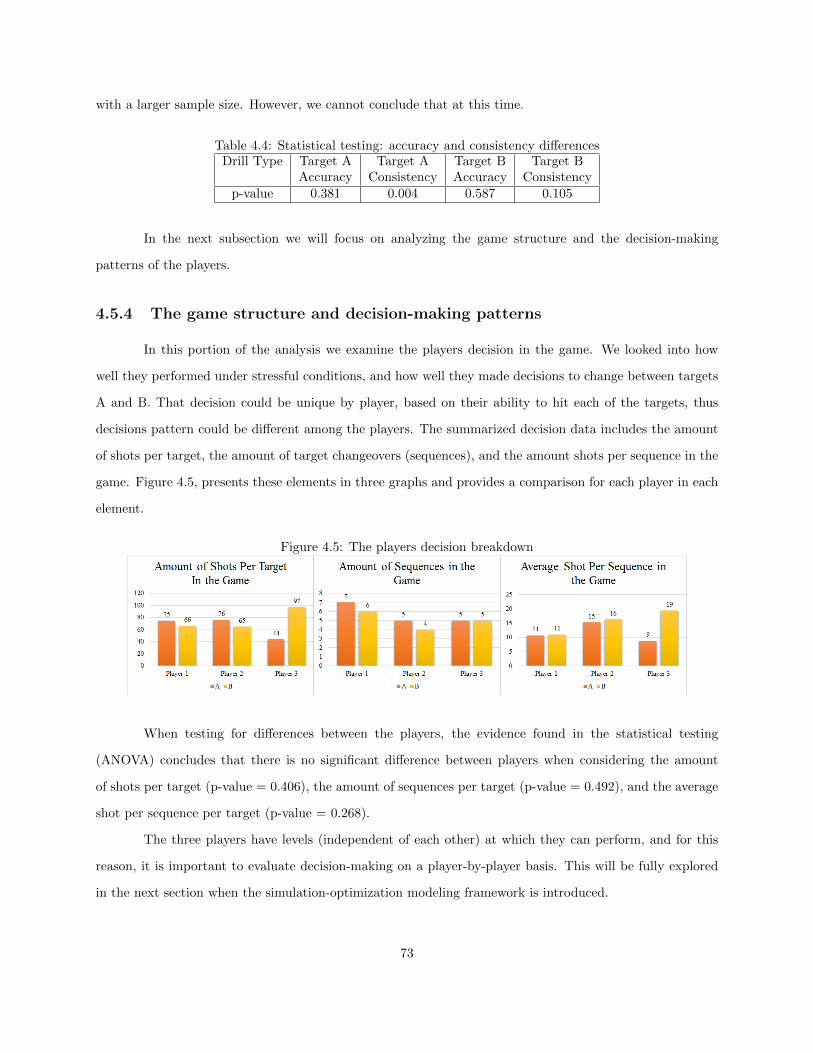
with a larger sample size. However, we cannot conclude that at this time.
Table 4.4: Statistical testing: accuracy and consistency differencesDrill Type Target A Target A Target B Target B
Accuracy Consistency Accuracy Consistencyp-value 0.381 0.004 0.587 0.105
In the next subsection we will focus on analyzing the game structure and the decision-making
patterns of the players.
4.5.4 The game structure and decision-making patterns
In this portion of the analysis we examine the players decision in the game. We looked into how
well they performed under stressful conditions, and how well they made decisions to change between targets
A and B. That decision could be unique by player, based on their ability to hit each of the targets, thus
decisions pattern could be different among the players. The summarized decision data includes the amount
of shots per target, the amount of target changeovers (sequences), and the amount shots per sequence in the
game. Figure 4.5, presents these elements in three graphs and provides a comparison for each player in each
element.
Figure 4.5: The players decision breakdown
When testing for differences between the players, the evidence found in the statistical testing
(ANOVA) concludes that there is no significant difference between players when considering the amount
of shots per target (p-value = 0.406), the amount of sequences per target (p-value = 0.492), and the average
shot per sequence per target (p-value = 0.268).
The three players have levels (independent of each other) at which they can perform, and for this
reason, it is important to evaluate decision-making on a player-by-player basis. This will be fully explored
in the next section when the simulation-optimization modeling framework is introduced.
73

4.5.4.1 Decision-making patterns conclusions
The evidence presented here confirms that the players each respond to the drill with their unique
decision making pattern. Once these patterns are analyzed, the risk taking nature of the players can be
evaluated as well as be reflected in the score. In order to assess this part of the decision-making process, a
simulation model was created and will be addressed in the following section.
4.6 Simulation and optimization modeling
In this section, we employ a simulation model to examine a player’s shot selection sequence (i.e.,
decision-making pattern) with a goal of achieving a higher score in the game used in the prior section.
Upon completing the baseline drill and the game, the player’s data is entered into the simulation in order to
customize its feedback according to the player’s performance profile. Here is an outline of the performance
improvement methodology:
Figure 4.6: Modeling outline
In the following subsections, we will follow the outline described in Figure 4.6 and demonstrate the
data outcomes from our drill when comparing results between our three players. The ARENA simulation
software package (version 15) as well as its built in optimization tool OptQuest, were used to conduct the
modeling and analysis.
74
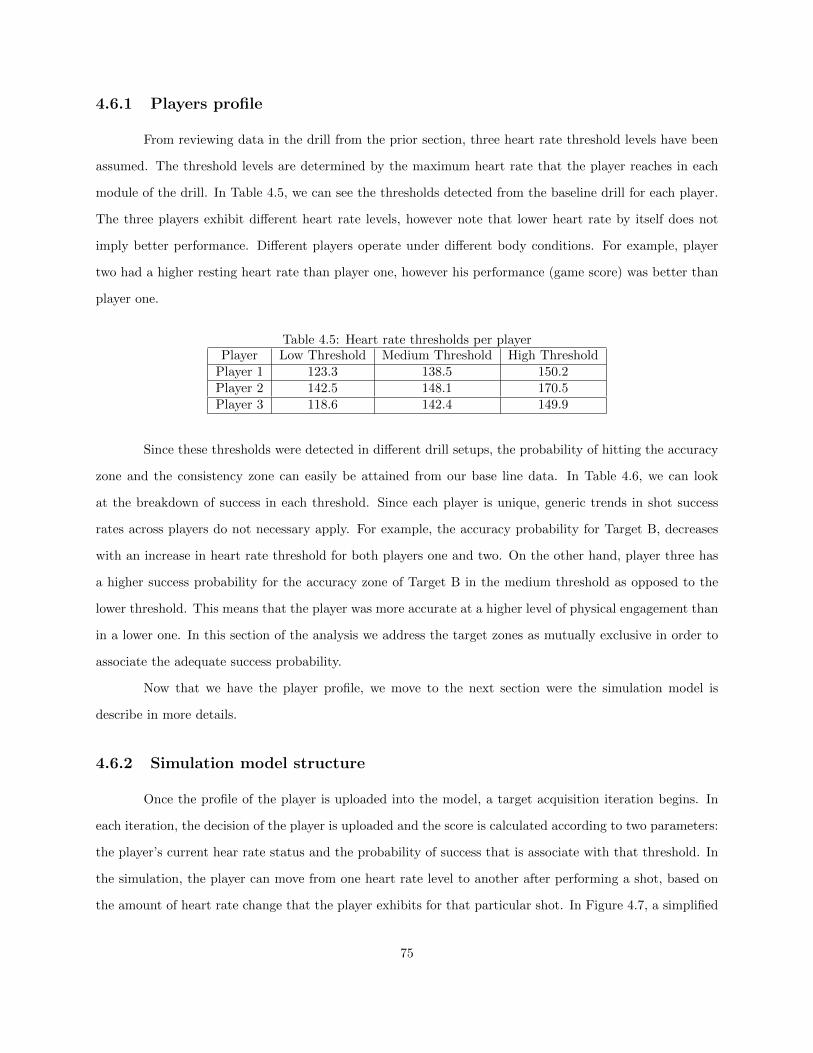
4.6.1 Players profile
From reviewing data in the drill from the prior section, three heart rate threshold levels have been
assumed. The threshold levels are determined by the maximum heart rate that the player reaches in each
module of the drill. In Table 4.5, we can see the thresholds detected from the baseline drill for each player.
The three players exhibit different heart rate levels, however note that lower heart rate by itself does not
imply better performance. Different players operate under different body conditions. For example, player
two had a higher resting heart rate than player one, however his performance (game score) was better than
player one.
Table 4.5: Heart rate thresholds per playerPlayer Low Threshold Medium Threshold High Threshold
Player 1 123.3 138.5 150.2Player 2 142.5 148.1 170.5Player 3 118.6 142.4 149.9
Since these thresholds were detected in different drill setups, the probability of hitting the accuracy
zone and the consistency zone can easily be attained from our base line data. In Table 4.6, we can look
at the breakdown of success in each threshold. Since each player is unique, generic trends in shot success
rates across players do not necessary apply. For example, the accuracy probability for Target B, decreases
with an increase in heart rate threshold for both players one and two. On the other hand, player three has
a higher success probability for the accuracy zone of Target B in the medium threshold as opposed to the
lower threshold. This means that the player was more accurate at a higher level of physical engagement than
in a lower one. In this section of the analysis we address the target zones as mutually exclusive in order to
associate the adequate success probability.
Now that we have the player profile, we move to the next section were the simulation model is
describe in more details.
4.6.2 Simulation model structure
Once the profile of the player is uploaded into the model, a target acquisition iteration begins. In
each iteration, the decision of the player is uploaded and the score is calculated according to two parameters:
the player’s current hear rate status and the probability of success that is associate with that threshold. In
the simulation, the player can move from one heart rate level to another after performing a shot, based on
the amount of heart rate change that the player exhibits for that particular shot. In Figure 4.7, a simplified
75

Table 4.6: Probability of success per heart rate threshold
Player 1
Threshold Target A Target A Target A Target B Target B Target BAccuracy Consistency Misses Accuracy Consistency Misses
123.3 42% 46% 12% 22% 52% 26%138.5 38% 60% 2% 16% 62% 22%150 30% 34% 36% 12% 62% 26%
Player 2
Threshold Target A Target A Target A Target B Target B Target BAccuracy Consistency Misses Accuracy Consistency Misses
142.5 42% 48% 10% 32% 54% 14%148.1 30% 42% 28% 30% 38% 32%170.5 26% 20% 54% 18% 28% 54%
Player 3
Threshold Target A Target A Target A Target B Target B Target BAccuracy Consistency Misses Accuracy Consistency Misses
118.6 52% 44% 4% 24% 64% 12%142.4 48% 50% 2% 46% 44% 10%149.9 36% 34% 30% 34% 46% 20%
Note that the game scoring is as follow:Target A: Accuracy = 2 points, Consistency = 1 point, Miss = 0 points.Target B: Accuracy = 4 points, Consistency = 1 point, Miss = 0 points.
version of the model is presented to illustrate the flowchart of processes in the model.
Figure 4.7: Simulation outline
At this point, the profile and the decision-making list of the player is addressed in the model, however
there are some gaps when customizing the model to reality. As described earlier in section 4.4, each player
will have his own heart rate trend as he plays the game. This is why we need to calibrate the model to
reflect unique characteristics of each player.
4.6.3 Model calibration to player profiles - model 1
The game structure is different from our baseline drill thus in order to fit the model to the player we
need to find the right heart rate trends that will reflect the approximate score of the player when executing
the same decision-making patterns. In order to figure out this calibration we follow a constraint satisfaction
model. The objective of the model is to find the heart rates trends that will produce a simulation score
76

approximate to the real score of the player in the game. Utilizing an optimization framework (OptQuest)
the model follows the following scheme:
Objective: Maximize Score
Subject to: Score must be less than the player’s achieved score in the drill
• As threshold level increase heart rate elevation from hitting Target B will decrease
• As threshold level increase heart rate redaction from hitting Target A will increase
For the mathematical notation and heart rate parameters produced by the model, please see the
appendix. Upon completing this customization we have a simulation model that approximates the player
heart rate conditions in the real game. From this point, any change to his decision-making pattern (or shot
selection sequence) will result in a different score, as it will change his physiological status in the game, which
will alter his performance. This environment will allow the model to test various patterns of decision-making
while predicting the expected and compare the resulting score.
Each player’s game data contained three main characteristics: number of sequences, number of shots
in each sequence, and the target of the sequence. Data analysis of the game data revealed that a player will
create a sequence to Target B (worth more points) until fatigue impacts the player performance to a certain
point. At this point the player will be motivated to create a new sequence to Target A,in order to increase
shot success and increase their score, even though the target is worth fewer points. This also allowed the
player to recuperate and reduce his heart rate to a point when he felt comfortable again to create a sequence
of shots to Target B. This pattern is consistent among the players in our study (please see section 4.5).
The players only played the game once, thus only one score was captured during this study. This
score by no means represents the long term performance of the player in the game as his performance will
likely change each time he plays the game. The advantage of the simulation model is in replicating the player
performance in order to infer an expected performance level over the long run. In Table 4.7, we can see that
the real score of the players is approximated as if it was a long term estimation. The simulation included 30
replications that included the player decision and heart rate thresholds (historical data) as well as the rate
of change in hear rate for every threshold (OptQuest data). The half width help us to identify the range of
the true average of performance. For example, with 95% we estimate that the true average score of player
one’s performance will be between 154 and 167 (when rounding the score).
In the low, medium and high threshold rates, we can see the difference between hear rate changes
per shot for Target A and Target B. Since all the players starts at a common heart rate (103.5), it will take a
sequence of seven shots to Target B, for player one to move from the low threshold to the medium threshold.
77
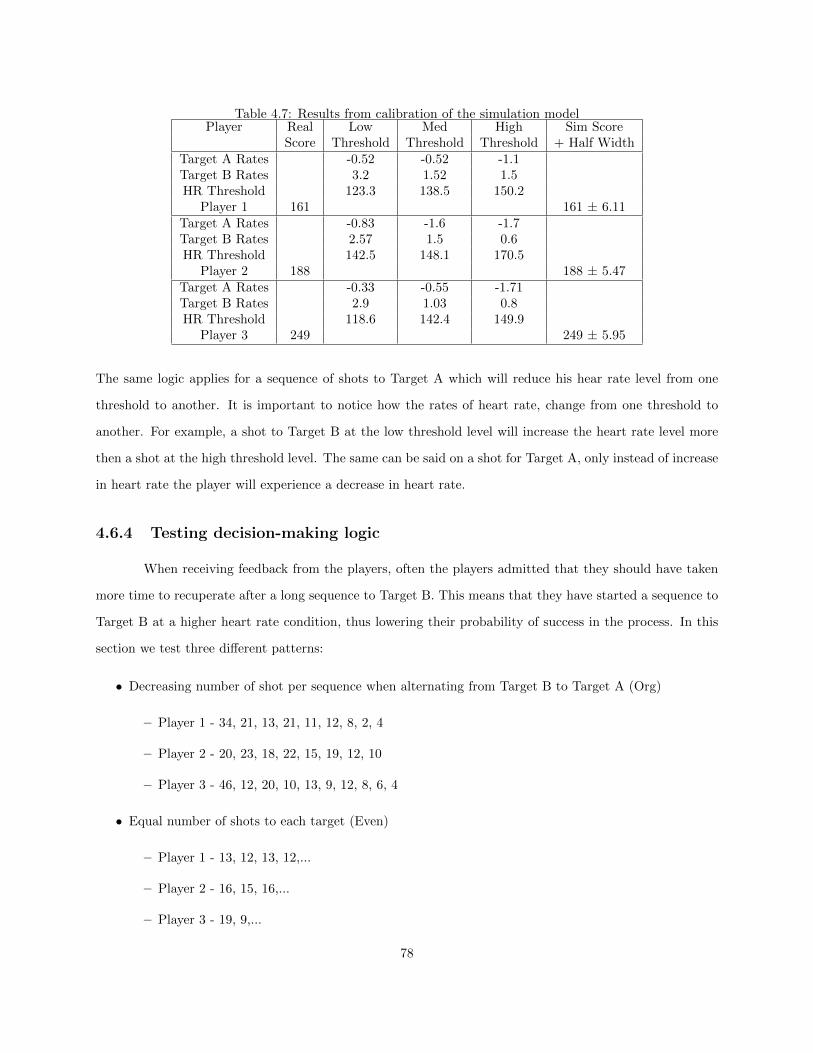
Table 4.7: Results from calibration of the simulation modelPlayer Real Low Med High Sim Score
Score Threshold Threshold Threshold + Half WidthTarget A Rates -0.52 -0.52 -1.1Target B Rates 3.2 1.52 1.5HR Threshold 123.3 138.5 150.2
Player 1 161 161 ± 6.11Target A Rates -0.83 -1.6 -1.7Target B Rates 2.57 1.5 0.6HR Threshold 142.5 148.1 170.5
Player 2 188 188 ± 5.47Target A Rates -0.33 -0.55 -1.71Target B Rates 2.9 1.03 0.8HR Threshold 118.6 142.4 149.9
Player 3 249 249 ± 5.95
The same logic applies for a sequence of shots to Target A which will reduce his hear rate level from one
threshold to another. It is important to notice how the rates of heart rate, change from one threshold to
another. For example, a shot to Target B at the low threshold level will increase the heart rate level more
then a shot at the high threshold level. The same can be said on a shot for Target A, only instead of increase
in heart rate the player will experience a decrease in heart rate.
4.6.4 Testing decision-making logic
When receiving feedback from the players, often the players admitted that they should have taken
more time to recuperate after a long sequence to Target B. This means that they have started a sequence to
Target B at a higher heart rate condition, thus lowering their probability of success in the process. In this
section we test three different patterns:
• Decreasing number of shot per sequence when alternating from Target B to Target A (Org)
– Player 1 - 34, 21, 13, 21, 11, 12, 8, 2, 4
– Player 2 - 20, 23, 18, 22, 15, 19, 12, 10
– Player 3 - 46, 12, 20, 10, 13, 9, 12, 8, 6, 4
• Equal number of shots to each target (Even)
– Player 1 - 13, 12, 13, 12,...
– Player 2 - 16, 15, 16,...
– Player 3 - 19, 9,...
78
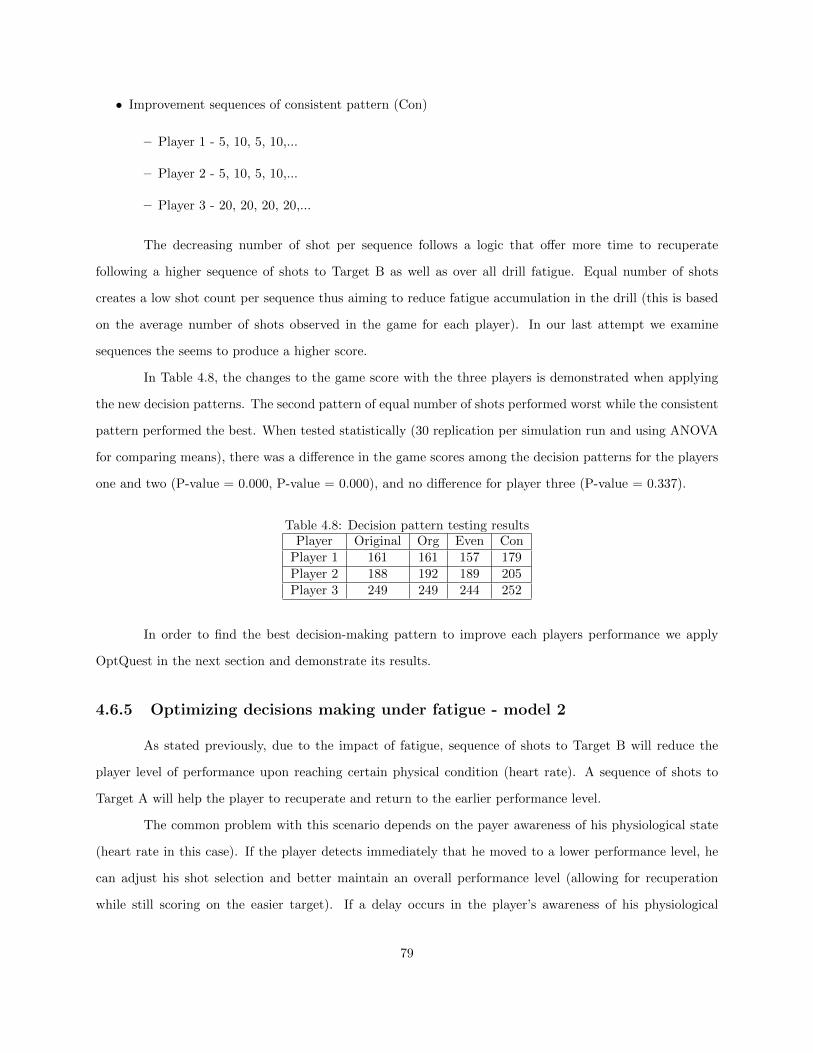
• Improvement sequences of consistent pattern (Con)
– Player 1 - 5, 10, 5, 10,...
– Player 2 - 5, 10, 5, 10,...
– Player 3 - 20, 20, 20, 20,...
The decreasing number of shot per sequence follows a logic that offer more time to recuperate
following a higher sequence of shots to Target B as well as over all drill fatigue. Equal number of shots
creates a low shot count per sequence thus aiming to reduce fatigue accumulation in the drill (this is based
on the average number of shots observed in the game for each player). In our last attempt we examine
sequences the seems to produce a higher score.
In Table 4.8, the changes to the game score with the three players is demonstrated when applying
the new decision patterns. The second pattern of equal number of shots performed worst while the consistent
pattern performed the best. When tested statistically (30 replication per simulation run and using ANOVA
for comparing means), there was a difference in the game scores among the decision patterns for the players
one and two (P-value = 0.000, P-value = 0.000), and no difference for player three (P-value = 0.337).
Table 4.8: Decision pattern testing resultsPlayer Original Org Even Con
Player 1 161 161 157 179Player 2 188 192 189 205Player 3 249 249 244 252
In order to find the best decision-making pattern to improve each players performance we apply
OptQuest in the next section and demonstrate its results.
4.6.5 Optimizing decisions making under fatigue - model 2
As stated previously, due to the impact of fatigue, sequence of shots to Target B will reduce the
player level of performance upon reaching certain physical condition (heart rate). A sequence of shots to
Target A will help the player to recuperate and return to the earlier performance level.
The common problem with this scenario depends on the payer awareness of his physiological state
(heart rate in this case). If the player detects immediately that he moved to a lower performance level, he
can adjust his shot selection and better maintain an overall performance level (allowing for recuperation
while still scoring on the easier target). If a delay occurs in the player’s awareness of his physiological
79

conditions, it will require more time to return to his earlier level of success and, as a result, will decrease
overall performance.
In order to determine the best decision-making pattern for each player, additional logic is added to
the simulation model. Utilizing OptQuest (and new decision variables in the simulation model), we ask the
model to find the best sequence setup when alternating between targets, with the objective of maximizing
the player score (see Figure 4.9). In this scheme, all player profile characteristics remains the same (e.g.
probability of success, heart rate trends, and physiological thresholds).
Figure 4.8: Optimization logic addition
As demonstrated in Figure 4.8, the decision for the next sequence is made the former sequence is
completed, thus the model mimics the logic of the player in terms of how decisions are made and when do
they take place. Moreover, the model takes into consideration the expected performance over the sequence,
knowing what will happen to the heart rate level of the player and how performance may change accordingly.
In Figure 4.10, we can see the optimization results for the long run estimated performance. The
expected average game score is compared between the actual score achieved and the optimization estima-
tion. As demonstrated, the players will improve their performance by 18%, 11%, and 4% with statistical
significance(P-value = 0.000, 0.000, 0.002 for player one, two and three). The three players represent dif-
ferent skill levels, and as projected, player one (amateur level) has a higher improvement potential then
player three (professional) when adjusting their decision-making patterns. The optimized decision pattern
also impacted the average heart rate of the player during the game. In general, a heart rate reduction on
average among players is expected, however, there are some players that will reflect differently. For example,
player two will perform better at a higher level of average heart rate in the game. It can also be an early
indication that his awareness for recuperating (when to hit again to Target B) is lower then it should be,
thus he is taking more time (in a sequence of shots to target A) then he needed.
Although there is an improvement in the game score, further analysis is required in order to under-
80
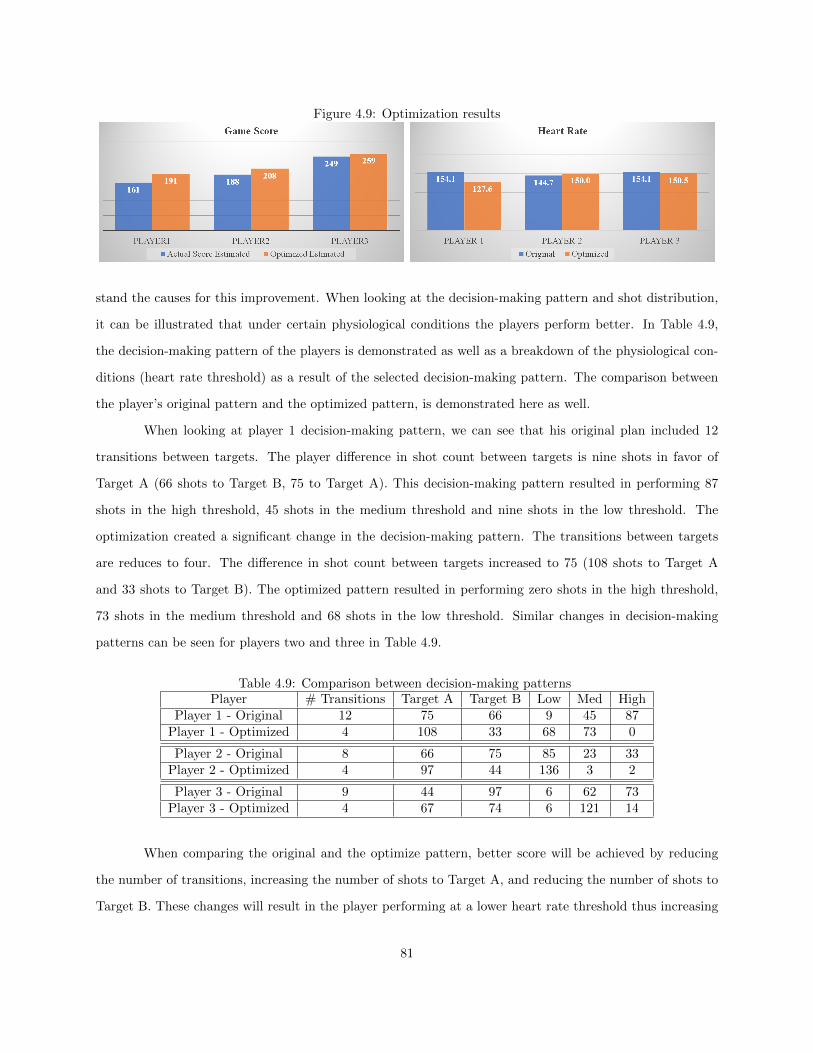
Figure 4.9: Optimization results
stand the causes for this improvement. When looking at the decision-making pattern and shot distribution,
it can be illustrated that under certain physiological conditions the players perform better. In Table 4.9,
the decision-making pattern of the players is demonstrated as well as a breakdown of the physiological con-
ditions (heart rate threshold) as a result of the selected decision-making pattern. The comparison between
the player’s original pattern and the optimized pattern, is demonstrated here as well.
When looking at player 1 decision-making pattern, we can see that his original plan included 12
transitions between targets. The player difference in shot count between targets is nine shots in favor of
Target A (66 shots to Target B, 75 to Target A). This decision-making pattern resulted in performing 87
shots in the high threshold, 45 shots in the medium threshold and nine shots in the low threshold. The
optimization created a significant change in the decision-making pattern. The transitions between targets
are reduces to four. The difference in shot count between targets increased to 75 (108 shots to Target A
and 33 shots to Target B). The optimized pattern resulted in performing zero shots in the high threshold,
73 shots in the medium threshold and 68 shots in the low threshold. Similar changes in decision-making
patterns can be seen for players two and three in Table 4.9.
Table 4.9: Comparison between decision-making patternsPlayer # Transitions Target A Target B Low Med High
Player 1 - Original 12 75 66 9 45 87Player 1 - Optimized 4 108 33 68 73 0
Player 2 - Original 8 66 75 85 23 33Player 2 - Optimized 4 97 44 136 3 2
Player 3 - Original 9 44 97 6 62 73Player 3 - Optimized 4 67 74 6 121 14
When comparing the original and the optimize pattern, better score will be achieved by reducing
the number of transitions, increasing the number of shots to Target A, and reducing the number of shots to
Target B. These changes will result in the player performing at a lower heart rate threshold thus increasing
81
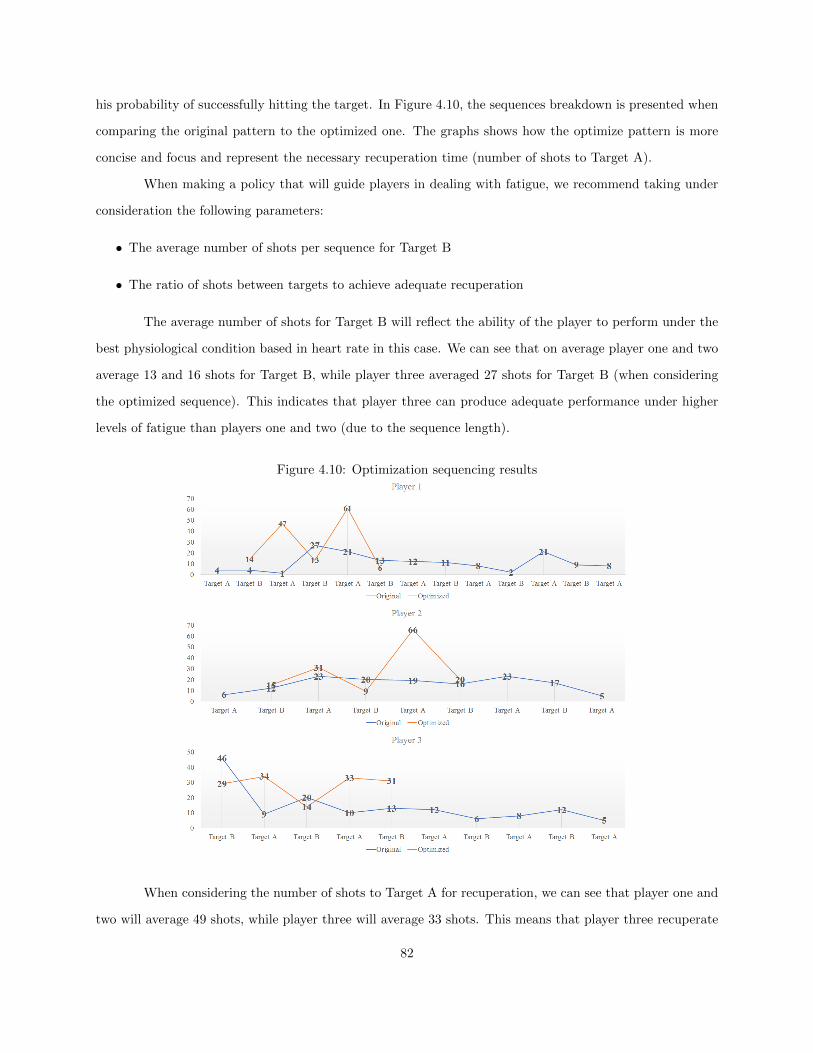
his probability of successfully hitting the target. In Figure 4.10, the sequences breakdown is presented when
comparing the original pattern to the optimized one. The graphs shows how the optimize pattern is more
concise and focus and represent the necessary recuperation time (number of shots to Target A).
When making a policy that will guide players in dealing with fatigue, we recommend taking under
consideration the following parameters:
• The average number of shots per sequence for Target B
• The ratio of shots between targets to achieve adequate recuperation
The average number of shots for Target B will reflect the ability of the player to perform under the
best physiological condition based in heart rate in this case. We can see that on average player one and two
average 13 and 16 shots for Target B, while player three averaged 27 shots for Target B (when considering
the optimized sequence). This indicates that player three can produce adequate performance under higher
levels of fatigue than players one and two (due to the sequence length).
Figure 4.10: Optimization sequencing results
When considering the number of shots to Target A for recuperation, we can see that player one and
two will average 49 shots, while player three will average 33 shots. This means that player three recuperate
82

faster thus explain the advantage over player one and two.
4.7 Discussion
The ability to determine the best level of performance based on physiological conditions is of great
value to athletes. When fatigue settles in, performance capability changes and this often leads to a change
in the decision pattern. In practice, the ability to teach the player to tune his decisions to his physiological
condition can make a critical difference in performance. In competition, the ability to alert the player to
his physical state will help guide the player to a better strategic and tactical choices in the game. In tennis
specifically, winning a grand slam will require eight consecutive wins over matches that can take between
three to five sets each. The conservation of energy is important in these settings, as the level of fatigue will
impact the physiological, psychological and emotional state of the player.
Our research represents only one parameter in this sophisticated environment, thus this framework
can aid the calibration and testing of additional variables like, stress, awareness, intuition and more. The
utilization of simulation can foster a higher level of complexity between the decision-making logic, the state
in which a decision is made and dynamics that arise from the game scenario. This research area will require
more technological innovation to capture such data, and an high level of processing capability to streamline
this into a practical application in real time.
4.8 Conclusions
This research provides support to existing literature on how fatigue accumulation affects tennis player
performance. There are many challenges when considering the cause and effect relationships of performance
characteristics. This study presented a framework for analyzing and improving performance under fatigue
specifically in the designed game. decision-making patterns could be tested with various logical settings as
well as in different game scenarios. The potential application of this research is to establish an interactive
tool for players and coaches to learn from, in training and in competition. With innovative technologies
more information can be drawn about the players physiological, psychological and emotional conditions in
order to generate better training mechanisms and real time indicators of performance. The utilization of
the simulation and optimization modeling could be further developed to include a higher level of complexity
and deliver a variety of alternatives based on the player’s style of play.
83
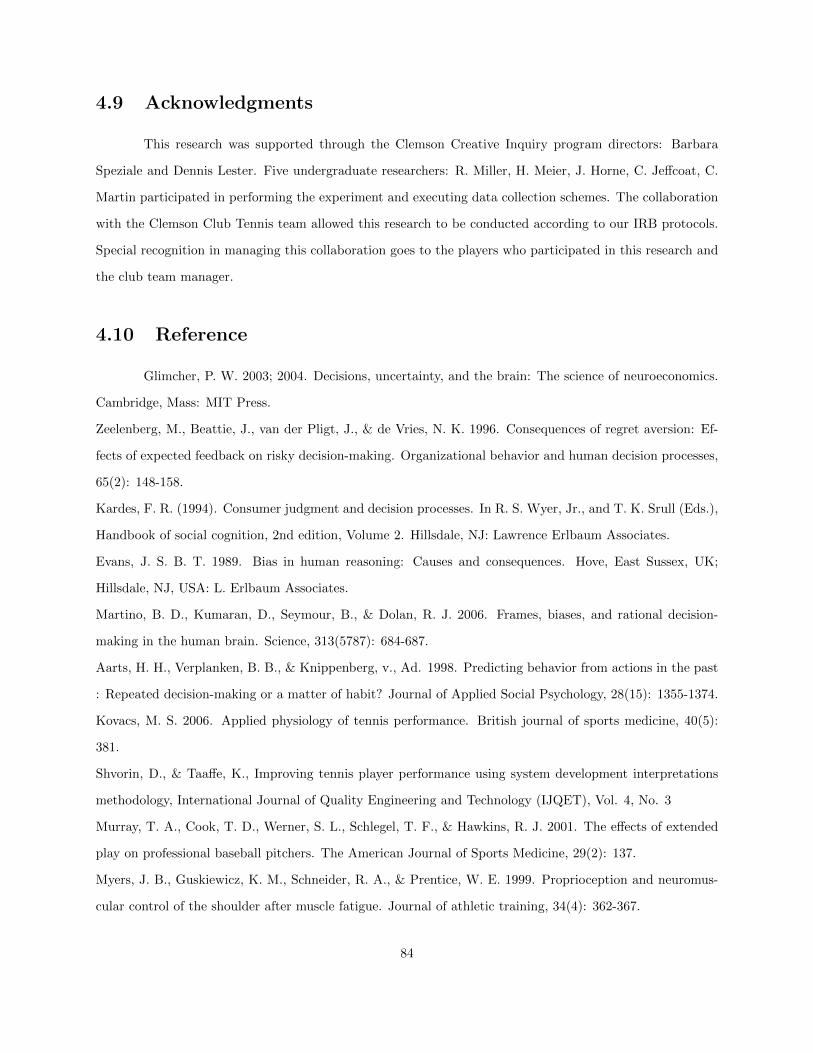
4.9 Acknowledgments
This research was supported through the Clemson Creative Inquiry program directors: Barbara
Speziale and Dennis Lester. Five undergraduate researchers: R. Miller, H. Meier, J. Horne, C. Jeffcoat, C.
Martin participated in performing the experiment and executing data collection schemes. The collaboration
with the Clemson Club Tennis team allowed this research to be conducted according to our IRB protocols.
Special recognition in managing this collaboration goes to the players who participated in this research and
the club team manager.
4.10 Reference
Glimcher, P. W. 2003; 2004. Decisions, uncertainty, and the brain: The science of neuroeconomics.
Cambridge, Mass: MIT Press.
Zeelenberg, M., Beattie, J., van der Pligt, J., & de Vries, N. K. 1996. Consequences of regret aversion: Ef-
fects of expected feedback on risky decision-making. Organizational behavior and human decision processes,
65(2): 148-158.
Kardes, F. R. (1994). Consumer judgment and decision processes. In R. S. Wyer, Jr., and T. K. Srull (Eds.),
Handbook of social cognition, 2nd edition, Volume 2. Hillsdale, NJ: Lawrence Erlbaum Associates.
Evans, J. S. B. T. 1989. Bias in human reasoning: Causes and consequences. Hove, East Sussex, UK;
Hillsdale, NJ, USA: L. Erlbaum Associates.
Martino, B. D., Kumaran, D., Seymour, B., & Dolan, R. J. 2006. Frames, biases, and rational decision-
making in the human brain. Science, 313(5787): 684-687.
Aarts, H. H., Verplanken, B. B., & Knippenberg, v., Ad. 1998. Predicting behavior from actions in the past
: Repeated decision-making or a matter of habit? Journal of Applied Social Psychology, 28(15): 1355-1374.
Kovacs, M. S. 2006. Applied physiology of tennis performance. British journal of sports medicine, 40(5):
381.
Shvorin, D., & Taaffe, K., Improving tennis player performance using system development interpretations
methodology, International Journal of Quality Engineering and Technology (IJQET), Vol. 4, No. 3
Murray, T. A., Cook, T. D., Werner, S. L., Schlegel, T. F., & Hawkins, R. J. 2001. The effects of extended
play on professional baseball pitchers. The American Journal of Sports Medicine, 29(2): 137.
Myers, J. B., Guskiewicz, K. M., Schneider, R. A., & Prentice, W. E. 1999. Proprioception and neuromus-
cular control of the shoulder after muscle fatigue. Journal of athletic training, 34(4): 362-367.
84

Carpenter, J. E., Blasier, R. B., & Pellizzon, G. G. 1998. The effects of muscle fatigue on shoulder joint
position sense. The American Journal of Sports Medicine, 26(2): 262.
Linossier, M. -., Dormois, D., Geyssant, A., & Denis, C. 1997. Performance and fibre characteristics of
human skeletal muscle during short sprint training and detraining on a cycle ergometer. European journal
of applied physiology and occupational physiology, 75(6): 491-498.
Hargreaves, M., McKenna, M. J., Jenkins, D. G., Warmington, S. A., Li, J. L., Snow, R. J., & Febbraio,
M. A. 1998. Muscle metabolites and performance during high-intensity, intermittent exercise. Journal of
applied physiology, 84(5): 1687-1691.
Pearcey, G. E. P., Murphy, J. R., Behm, D. G., Hay, D. C., Power, K. E., & Button, D. C. 2015. Neu-
romuscular fatigue of the knee extensors during repeated maximal intensity intermittentsprints on a cycle
ergometer. Muscle & nerve, 51(4): 569-579.
Bachasson, D., Decorte, N., Wuyam, B., Millet, G. Y., & Verges, S. 2016. Original research: Central and
peripheral quadriceps fatigue in young and middle-aged untrained and endurance-trained men: A compara-
tive study. Experimental biology and medicine, 241(16): 1844-1852.
Bouaziz, T., Makni, E., Passelergue, P., Tabka, Z., Lac, G., Moalla, W., Chamari, K., & Elloumi, M. 2016.
Multifactorial monitoring of training load in elite rugby sevens players: Cortisol/cortisone ratio as a valid
tool of training load monitoring. Biology of sport, 33(3): 231-23
Ferranti A, Pluim BM, Weber K. The effect of recovery duration on running speed and stroke quality during
intermittent training drills in elite tennis players. J Sports Sci 2001;19 23542.
Davey, P. R., Thorpe, R. D., & Williams, C. 2003. Simulated tennis matchplay in a controlled environment.
Journal of sports sciences, 21(6): 459-467.
Davey, P. R., Thorpe, R. D., & Williams, C. 2002. Fatigue decreases skilled tennis performance. Journal of
sports sciences, 20(4): 311-318.
Lyons, M., Al-Nakeeb, Y., Hankey, J., & Nevill, A. 2013. The effect of moderate and high-intensity fatigue
on groundstroke accuracy in expert and non-expert tennis players. Journal of sports science and medicine,
12(2): 298-308.
Mascret, N., Elliot, A. J., & Cury, F. 2015. Extending the 3 2 achievement goal model to the sport domain:
The 3 2 achievement goal questionnaire for sport. Psychology of Sport and Exercise, 17: 7-14.
85

4.11 Appendix
Optimization notation based on the simulation parameters
maximize GS
subject to Thi = Ti, i = 1, . . . , n.
Tpjk = Pjk, j = 1, k = 1, . . . ,m, l.
Ld ≤ Trd ≥ Ud, d = 1, . . . D.
vLT(HRA) ≥ vMT(HRA) ≥ vHT(HRA)
vLT(HRB) ≥ vMT(HRB) ≥ vHT(HRB)
GS ≤ RS
86

Chapter 5
Conclusions and Discussion
In this final section of the dissertation, I will address the lessons that I have learned throughout this
research project as well as the overall research development and future implications. The initial section will
address the research questions that guided this work which will be followed by my contribution to sports
management and performance. Next I will discuss the key skills and knowledge that I gained throughout
this project and how they have shaped my professional approach as a researcher. Lastly, I will address future
endeavors that I will pursue in my career.
5.1 Main Research Findings
The research questions that guided this research came from a collaboration between engineers,
players, coaches, sports managers and athletic program directors.
In chapter two, the work illustrates how to classify human performance characteristics, as they affect
a player’s perception, decision making and execution capabilities. Moreover, we presented both direct impact
relationships (first level) and indirect impact (successive levels) relationships. The impact of the performance
characteristics was determined from a top to bottom framework as described in detail in the chapter. The
knowledge gained through this engagement resulted in an integration of performance characteristics assess-
ment within the tennis training program, led by the former Clemson athletic director Bill D’Andrea. Our
findings indicated that some features of performance reside deep within the character of the player, and in
order to make a change at that level, much effort is required. Recruiting is a critical element of success, and
program management realized that the recruitment process should include determining if potential players
87

have a baseline performance level that fits the coaches’ training style as well as the needs of the program
(from a player decision making and characteristics point-of-view).
Led by insights from chapter two, chapter three focused on comparing a player’s performance char-
acteristics to that of an opponent, the resulting decisions to be made on style of play, and how this approach
can help match the coach’s expectation with the player’s performance capability. The recruiting process
for college level players has specific guidelines that serve to protect the player, the coaches and the athletic
program. From literature research, data collection and interviews with professional coaches and managers
in different fields, we observed a lack of focus on the decision making nature of the player. Since physical
assessments are necessary and provided by the player, physical capabilities are easily determined and pose
no challenge to the recruiting process. The physical requirements are translated directly to numbers on
a screening mechanism for performance evaluation, but it his decision making nature that is often a de-
termining factor of performance. With this in mind, the work in this chapter provided a framework that
could be used to determine the player decision making style while he is going through the recruiting process.
A player that fits the recruiting position criteria from the physical and logical perspectives will fulfill the
coach’s expectation, thus will prove to be a match to that position in the program. Although the framework
contained a solid mathematical background, its practical application should be customized to the specific
recruiting process in order to be effectively implemented.
We then focused on examining the connection between chapter two and chapter three. In order
to understand how performance characteristics impact decision making we created a game that challenged
decision making logic under conditions of fatigue. Designed to improve the tennis player performance, the
game presented a scenario of high risk and high reward target selection as well as low risk and low reward
target selection, where player performance (the ability to hit the targets) degrades over time. The findings
supported existing literature when considering performance changes over time. Moreover, we illustrated how
a change in the decision making pattern, can improve the overall player performance in the game. This
work addressed one of the key elements of human performance which is the awareness of performance under
certain physiological conditions. Managing shot selection (i.e., decision making patterns) more effectively
allowed a player to achieve higher game scores in spite of reduced physical ability (i.e., fatigue).
5.2 Research contributions
Each chapter in this work presents an area of contribution, some more practical than others. In
chapter two, my contribution can be illustrated in many aspects. At first, the integration of an engineer into
88

an athletic program is unique. The athletic director Bill D’Andrea saw this as an opportunity to promote
analytics within various athletic programs. Specifically in the woman tennis program, the tennis program
expanded their resources and involved more people in their management procedures, including a specialized
physical trainer, nutritionist, academic adviser and an industrial engineer. The practice changed from a
group development to personal development. The competition preparation was embedded in various aspects
of the practice, which promoted a high level of readiness at all times as well as continuous improvement of
performance under conditions of uncertainty. The research allowed the program to understand the inner
world of the player and the various factors that dictate the players performance. The research engagement
allowed the tennis coaches to have confidence as results were analyze and prediction put in place when testing
their training strategies. In this research engagement we noticed changes in players due to the implementation
of the SDI methodology. Players, coaches and managers were challenged when asked to assess factors of
influence beyond the direct cause and effect relationship. In each encounter, we noticed that by asking
iterative questions to get root causes, people started to think outside of the box. In the first month of the
research, players provided answers, mainly revolving around their own setting (how they feel, how much
energy they have, if they are out of focus from studying to much or just tired from over practicing), coaches
provided answers, revolving around program settings (practice hours, how many drills they run, etc.) and
management provided perspectives based on individual player accomplishments and team accomplishment.
During the later months the answers started to change as the framework helped them realize how elements
of player capabilities were connected at each level within a player and across players to the team concept.
As I was working along side of the coaching staff, I felt as if we have all learned a new language; we were
excited to see how our results had change as each course of action had a fundamental reasoning that was
not there before.
We then chose to focus on the recruiting process as it became evident that it is a critical element
of success. When we discussed with the coaching staff the idea of testing a player decision making logic
they began to question why they didn’t have this already embedded in their recruiting process. With much
excitement, we soon realized that there is a gap in this area, thus the opportunity of contributing to the tennis
program as well as to various athletic recruiting programs, presented it self. In this work, we have provided
a mathematical settings using decision trees, to identify the best player response in a given scenario. The
analysis is taking under consideration the relative advantage of specific performance characteristics, when
evaluating strategies and tactics in a given situation. This work have provided a method that allows recruiters
(coaches) to design a scenario so that each decision alternative reveals information about the player’s decision
89

making style and as a result, improving the recruiting process by including the decision making nature to
the physical profile when evaluating a potential recruit.
In chapter four, we created a model that provided insights into how a player can manage perfor-
mance under fatigue. The method included a baseline drill, a game and a simulation model. Players that
participated in this study helped establish decision making patterns that validated the drill design, and they
learned about the impact of fatigue on their performance. The Clemson University creative inquiry research
group helped run portions of the experiment , it helped open another area for undergraduate engineers as
they had a hands-on learning experience outside of the classroom. The research demonstrated how decision
making can be improved when considering he impact of fatigue on the player performance. In particular,
simulation was used to model the combination of target selection, heart rate, and fatigue over a series of
consecutive shots taken without rest. For a particular player profile, different shot selection patterns can be
tested in an effort to maximize player score, which is affected by a reduction in success rate of hitting the
targets as the player gets tired (i.e., heart rate increases). The model not only demonstrated theses changes
in the form of a predicted score of the game but can also suggested a decision making pattern that would
lead to better results over time by simultaneously managing fatigue and shot selection.
Throughout my research and time spent here in Clemson University, I have work diligently to pro-
mote undergraduate research, innovative technology and student mentorship. Leading a research group in
this dissertation was a great experience and our contribution is valuable to the Clemson Undergraduate Cre-
ative Inquiry Program. As a group, presenting findings of this dissertation, we have presented in conferences
and submitted papers to publication in the field of human performance. Due to this contribution I received
an award for mentorship in April 2017.
5.3 Shaping my professional approach
This research presented in the dissertation is multidisciplinary, and require input and guides from
various specialists. It is a hands-on research where data needed to be collected, experiments needed to be
coordinated and approval was needed to be achieved for conducting human trials. It presented innovative
spirit and dealt with various challenges. Motivated to include a vast and rich data set while addressing high
level of complexity, I have learn to structure this research under the allowable time and available resources
in my degree program. Knowing your limitation as a researcher will be of grate value, especially when
considering future grant proposals.
Working with tennis players, coaches and directors, I learned that different job responsibilities
90
generate different perceptions. In order to improve a system that present this complexity, the first thing to
do it to determine a common language. In addition, I have learned that making real changes takes time
and effort beyond what is expected. In order to effectively make changes, people needs to be involved in
a way that influence ”out of the box” line of thinking. In order to convince people that change is a good
thing, scientific evidence needs to be presented. People will accept change more intuitively if it is based on
facts rather then estimation or feelings. Motivation and excitement is key to improvement process as well
as harnessing the leverage of a managerial position (promotes the willingness to participate).
Working with undergraduate students have taught me how to connect with students of different
backgrounds and create a group effort for completing a project. I have learned how to motivate students
and help each one in their own way to achieve his goals. Most importantly, I have learned how much I can
learn from them, as they are curious, full with new ideas, and questions that I surprise me every time. I
cherish this engagement and hope to continue developing it wherever I go.
Mentored by my adviser, the experience has truly shaped my research approach. Dr. Kevin Taaffe
was enabling me to experience research in a way that was quit unique. I was able to work under his guides
while researching an area that is not traditional to our discipline, and it feels like we only scratch the surface
of what we can accomplish together. I have learned from him that research takes time and that focus is
key. Differently from my personality trait of innovating and creating new ideas, research needs to be very
constructed and focus. I have learned that it is very beneficial to reach out and consult with specialist,
friends and colleagues, as that feedback is always positive in its own way. I have learned that working with
people takes patience and diligence as I watched him lead our collaboration with various departments on
campus. Lastly, Perhaps the most important lesson that I learned from my mentor is to be a man of value
and character, especially when life challenges arises. He had always treated me with a sense of care and
kindness throughout my time here at Clemson, especially when dealing with a student who is challenged by
a reading disorder and dyslexia.
5.4 Future endeavors
My experience at Clemson created various opportunities for research collaborations. Humans are the
most complex systems in the world and demonstrate multilevel dynamic structure that involve knowledge
from all disciplines that currently exist. Understanding features of this complex system will be my career
path as it is embedded in me to pursue it. In order to investigate this area, I need to learn more about
the human biology, anatomy, circuitry and functionality. With this in mind, an opportunity had presented
91

itself in the health field. With the submission of this dissertation, I will assume a post-doctoral position
with the emergency medicine department in Greenvill Memorial Hospital. This experience will allow me to
expand my understanding of human performance from a medical point of view as well as allow me to aid the
emergency department with various process improvement projects. It intend to promote my relationships
here at Clemson as they will be forever part of my life.
92