understanding the mechanism of non-enzymatic glycation
TRANSCRIPT

RSC Advances
PAPER
Publ
ishe
d on
11
July
201
6. D
ownl
oade
d on
1/2
8/20
22 3
:40:
15 A
M.
View Article OnlineView Journal | View Issue
Understanding th
aDepartment of Agricultural Microbiology, Al
India. E-mail: [email protected];
2703516; +91-9897902936bDepartment of Biochemistry, Faculty of L
Aligarh, 202002, India
† Electronic supplementary informa10.1039/c6ra12321j
Cite this: RSC Adv., 2016, 6, 65322
Received 12th May 2016Accepted 30th June 2016
DOI: 10.1039/c6ra12321j
www.rsc.org/advances
65322 | RSC Adv., 2016, 6, 65322–6533
e mechanism of non-enzymaticglycation inhibition by cinnamic acid: an in vitrointeraction and molecular modelling study†
Faizan Abul Qais,a Md. Maroof Alam,b Imrana Naseemb and Iqbal Ahmad*a
Under hyperglycaemic conditions non-enzymatic glycation of proteins gives rise to advanced glycation end
products (AGEs). The AGEs thus formed generate free radicals, which foster the development of diabetes
and its associated complications. Inhibition of glycation is expected to play a role in controlling diabetes.
Plant derived antioxidants like cinnamic acid (CA) are known for limiting AGE formation, however, the
mechanism involved is poorly understood. Therefore, we aimed to investigate the possible mechanism
of inhibition of AGEs formation by CA through various experimental approaches. Glycation of HSA was
achieved by incubating the reaction mixture with glucose for 30 days at 37 �C. The protein samples were
tested for levels of free lysine & thiol groups, carbonyl content and reactive oxygen species (ROS).
Interaction between CA and HSA was also studied through various biophysical techniques.
Thermodynamic studies showed a strong exothermic interaction between CA and HSA. The positive
value of TDS� and negative value of DH� indicates that the HSA–CA complex is mainly stabilized by
a hydrophobic interaction and hydrogen bond. Further, molecular docking reveals that CA binds to HSA
subdomain IIA (Sudlow's site I) with a binding energy of �7.0 kcal mol�1, nearly the same as obtained in
isothermal titration calorimetry (ITC) and fluorescence spectroscopy. The results of various
spectroscopic techniques along with molecular docking and examination of many biomarkers highlights
the role of CA in preventing disease progression.
1. Introduction
The reaction of reducing sugars such as fructose and glucosewith proteins, gives rise to Amadori products.1 These furtherundergo a complex cascade of repeated rearrangements,condensations, oxidative modications and cause the abnormalcross-linking of proteins to form advanced glycation endproducts (AGEs).2 The major AGEs in vivo appear to be formedfrom highly reactive intermediate carbonyl groups, known asoxoaldehydes or -dicarbonyls, including 3-deoxyglucosone,methylglyoxal and glyoxal.3,4 These can accumulate in the bodyand cause massive damage to the tissues by stimulating reactiveoxygen species (ROS) production. AGEs directly stimulated byNADPH oxidase (NOX) aer interaction with AGE receptor(RAGE) are present on the cell surface in several tissues or mayindirectly increase ROS levels by altering antioxidant proteins.Of note, the expression of both NOX and antioxidant enzymes
igarh Muslim University, Aligarh, 202002,
Fax: +91-571-2703516; Tel: +91-571-
ife Sciences, Aligarh Muslim University,
tion (ESI) available. See DOI:
7
might also be affected by AGEs and thereby trigger age-relateddisorders and even diabetic complications such as neurop-athy, nephropathy and retinopathy.5
Diabetes is a heterogeneous metabolic disorder character-ized by hyperglycaemia and altered carbohydrate, fat andprotein metabolism.6 The mechanism of diabetes in humans issubjected to wide scrutiny on a physiological, molecular andgenetics basis. Despite advances in understanding the disorder,mortality and the morbidity due to this disease is still high. Onemechanism increasingly considered as a fundamental cause ofdiabetic tissue damage is glycation (non-enzymatic glycosyla-tion).7 Although many drugs and interventions are available tomanage diabetes, they are increasingly expensive and haveinherent adverse effects. As such, there is a growing interestamong researchers to use natural products with combined anti-glycation and antioxidant properties to prevent tissue damage.A primary approach has been the use of plant derived productsto control disease progression. Various plant herbal medicineand phytocompounds have shown antidiabetic activities in vitroand in vivo. Due to their safety, and lesser side effects a widevariety of plant products have been explored as therapeuticintervention options.8
It is well established that dietary micronutrients containbioactive compounds, that inhibit AGEs formation in vitro andin vivo.9,10 One such component is cinnamic acid. It is derived
This journal is © The Royal Society of Chemistry 2016

Paper RSC Advances
Publ
ishe
d on
11
July
201
6. D
ownl
oade
d on
1/2
8/20
22 3
:40:
15 A
M.
View Article Online
from cinnamon which has been used in several cultures asa traditional medicine. Many studies have shown antioxidantand antidiabetic properties of cinnamic acid and its deriva-tives.11,12 It has been reported to modulate gluconeogenesis,glycogenesis and accelerate the insulin sensitivity in diabeticrats.13,14 However the mechanism involved in still unclear. Inour previous study, our group demonstrated the inhibitoryeffect of plant avonoid, quercetin in the formation of AGEs.15
To the best of our knowledge, themechanism of antiglycation ofcinnamic acid is not yet fully explored. Therefore, the aim ofthis study, was to determine the inhibitory effect of cinnamicacid against glycation using human serum albumin (HSA) asa protein model and to understand its possible mode of inter-ference through in vitro interaction studies and molecularmodelling.
2. Material and methods2.1. Materials
Fatty acid-free human serum albumin (HSA) (A3782), TNBSA,ibuprofen and gluconolactone (G2164) were purchased fromSigma-Aldrich, Chemical Company, USA. Cinnamic acidextrapure (034812), aminoguanidine (AG), DMSO, glucosewarfarin and DTNB were obtained from SRL chemicals(India). All other chemicals and reagents used were ofanalytical grade.
2.2. Human serum albumin (HSA) in vitro glycation assay
To determine the antiglycation activity of test compound, themethod by Alam et al. was adopted with minor modications.15
Human serum albumin (300 mM) was incubated with glucose(165 mM) in 10 mM PBS (pH 7.4) containing 0.02% NaN3 toavoid microbial contamination, at 37 �C for 30 days. Amino-guanidine (10 mM) incubated with HSA (300 mM) in presence ofglucose (165 mM) was taken as positive control. HSA wasincubated with glucose in the same concentration asmentionedabove in the presence of varying concentration of cinnamic acid(25, 50, 100, 200 and 500 mM) for test group. On completion ofincubation, all samples were dialyzed overnight against PBS toremove excess amount of glucose. All samples were stored at�20 �C for further examination and protein concentration ineach sample were estimated by Lowry method.16
2.2.1. AGEs-uorescence measurements. Advanced glyca-tion end products (AGEs) show strong uorescence emissionwhen excited between 300 and 400 nm. The formation of AGEswas detected by exciting all the samples at 322, 335, 365 and 375nm.17 All samples were diluted to 3 mM in 10 mM PBS (pH 7.4).The emission spectra were recorded in the range of 300–600 nmusing uorescence spectrophotometer (RF-5301PC, Shimadzu,Japan).
2.2.2. ANS uorescence. Each protein sample was dilutedto 3 mM in PBS (10 mM). Briey, 5 mL ANS (8-anilino-1-naphthalenesulfonic acid) from 5 mM stock solution wasmixed with of 2.995 mL diluted samples just before scanning.All the samples were excited at 385 nm and uorescence emis-sion spectra were recorded in the range 400–600 nm at 298 K.18
This journal is © The Royal Society of Chemistry 2016
The increase in ANS uorescence intensity indicates the extentof exposure of hydrophobic domains of HSA.
2.2.3. Methylglyoxal–HSA reactivity. Methylglyoxal–HSAreactivity assay was performed according to Lee et al. (1998) withminor modications.19 HSA (50 mg mL�1) was incubated with40 mM methyl-glyoxal (MG) in absence and presence of 25, 50,100 and 200 mM cinnamic acid. Aminoguanidine (10 mM) wastaken as positive control. All the sample were prepared in 10mM sodium phosphate buffer and incubated for 14 days at37 �C. The percent inhibition in AGEs formation was calculateusing formula given below:
% AGEs inhibition¼�1� fluorescence intensity of test group
fluorescence intensity of control
�
�100 (1)
2.2.4. Thiol and free lysine group estimation. The quanti-tative estimation of free thiol (–SH) group was performed byEllman's method.20 Briey, 50 mL DTNB (5,50-dithiobis,2-nitrobenzoic acid) (3 mM) and 150 mL of EDTA (0.1 M) wasadded to 50 mL of each sample in 100 mM Tris–HCl (pH 8.0)making a nal volume of 1.5 mL. Double distilled water wasused in place of sample for control. Absorbance of each samplewas recorded at 412 nm aer incubation for 20 min at 37 �C andthe free thiol group was calculated using the standard curve ofL-cysteine.
The amount of free amino groups in all samples were esti-mated by using 2,4,6-trinitrobenzene sulfonic acid (TNBSA).21
Briey, all protein samples were diluted to 0.2 mgmL�1 in 0.1 Msodium bicarbonate buffer (pH 8.5). To all diluted samples(0.5 mL), 0.25 Ml of the 0.01% (w/v) TNBSA solution was addedand then the reaction mixture was incubated for 2 h at 37 �C.Aer incubation, 0.25 mL SDS (10%) and 0.125 mL of 1 N HClwas added to each sample. For blank, distilled was addedinstead of protein. The absorbance of each sample was recordedat 335 nm against blank.
2.2.5. Carbonyl content estimation. Total carbonyl contentin the HSA was estimated to study the level of protein oxidation.Carbonyl content in all treated and control samples wereexamined by Levine method.22 The absorbance was noted at 360nm and the amount of carbonyl content was calculated usingmolar absorption coefficient of 22 000 M�1 cm�1. All the resultsare expressed in nmol per mg protein.
2.2.6. Determination of secondary structure by circulardichroism. Circular dichroism spectra of all the samples wererecorded by using JASCO spectropolarimeter (J-815). All thespectral measurements were done at 25 �C by a thermostaticallycontrolled cell holder attached to Neslab's RTE 110 water bathhaving a temperature accuracy of �0.1 �C. To study the changesin the secondary structure of HSA, far-UV CD analysis wasevaluated by diluting each protein sample to 0.3 mg mL�1 in 10mM PBS (pH 7.4) and 1 mm path length quartz cuvettes.
2.2.7. Sodium dodecyl sulphate polyacrylamide gel elec-trophoresis (SDS-PAGE). To examine the change or damagescaused by AGEs, native HSA and glycated-HSA were analyzed bySDS-PAGE on 8% polyacrylamide gel, as described previously.23
RSC Adv., 2016, 6, 65322–65337 | 65323

RSC Advances Paper
Publ
ishe
d on
11
July
201
6. D
ownl
oade
d on
1/2
8/20
22 3
:40:
15 A
M.
View Article Online
Fieen microgram of each samples were loaded into the wells.Electrophoresis was performed at 80 volts for 4 h at roomtemperature. Protein was stained with Coomassie Brilliant Blue(CBBR-250) for 60 min followed by overnight destaining.
2.2.8. Reactive oxygen species (ROS) generation assay (NBTassay). Generation of the superoxide anion was measured by thenitrobluetetrazolium (NBT) assay with slight modication.24
Briey, 300 mL sodium phosphate buffer (100 mM), 100 mL NBT(1 mM), 300 mL EDTA (1 mM), 300 mL Triton-X-100 (0.06%) and50 mL of each native HSA, glycated HSA and treated HSA (25–200mM cinnamic acid) was added and the nal volume was made to3 mL using double distilled water. Aminoguanidine was takenas positive control and 50 mL of double distilled water was usedin place of sample for blank. The absorbance of all the sampleswas recorded at 560 nm at the interval of 30 min for 3 hours.
2.3. Interaction studies
2.3.1. Sample preparation. Phosphate Buffer Saline (PBS)10 mM of pH 7.4 was prepared in double distilled water. Thebuffer was then ltered through a 0.22 mm syringe lter. HSAwas dissolved in 1 mL PBS to make 300 mM stock solution and itwas diluted in same buffer for further use. For the 3 mM cin-namic acid stock, 4.44 mg of cinnamic acid was dissolved indouble distilled water containing 1% ethanol and volume wasadjusted to 10 mL.
2.3.2. UV-visible spectroscopic study. The UV spectra ofHSA and HSA–cinnamic acid complex were measured usingShimadzu 1800 UV-vis spectrophotometer and spectra wererecorded in the range of 200 to 600 nm. A xed concentration ofHSA (3 mM) was titrated in absence and presence of cinnamicacid (3–30 mM). Dilution from the stock solution to workingconcentration was made in 10 mM PBS (pH 7.4). The nalvolume in cuvette was maintained to 3 mL and base linecorrection was done with the same buffer.
2.3.3. Steady state uorescence. All the uorescencestudies were performed on Spectrouorophotometer RF-5301PC, Shimadzu Scientic Instruments, Japan. Briey, HSA(3 mM) was excited at 280 nm and the uorescence emissionspectra was recorded in the range of 285–600 nm. The change inthe uorescence intensity of the HSA was monitored withincreasing concentration of cinnamic acid (3–30 mM) at threedifferent temperatures (298 K, 303 K, and 310 K). The nalvolume of the reaction mixture was made to 3 mL by adding 10mM PBS.
2.3.4. Synchronous uorescence measurement. Tomeasure synchronous uorescence, spectrouorometer cellcontaining 3 mL of 3 mM HSA was titrated with increasingconcentration of cinnamic acid (0–30 mM) at 298 K. The exci-tation wavelength was set at 240 nm and emission spectra wasrecorded 255–600 nm, thereby, maintaining Dl ¼ 15 nm fortyrosine residue. Similarly, for tryptophan residue, Dl ¼ 60 nmwas kept xed with excitation wavelength at 240 nm andemission from 300–600 nm.
2.3.5. Competitive displacement assay. For site specicbinding experiment, HSA (3 mM) was rst saturated with sitespecic markers (ibuprofen and warfarin), in which the ratio of
65324 | RSC Adv., 2016, 6, 65322–65337
HSA to the site marker was 1 : 2. The HSA-site marker complexwas excited at 280 nm and emission spectra was recorded from285 nm to 600 nm both in absence and presence of cinnamicacid (3–30 mM).
2.3.6. Effects of ionic strength. This experiment was per-formed to check presence of any ionic interaction between HSAand cinnamic acid. Briey, HSA (3 mM) was saturated withcinnamic acid (6 mM) and the nal volume was made to 3 mL in10 mM PBS. This HSA–cinnamic acid complex was titrated withincreasing concentration of NaCl (10–100 mM). The excitationwavelength was set to 280 nm and emission spectra were recordin the range of 285 nm to 600 nm.
2.3.7. Isothermal titration calorimetric measurements(ITC). The thermodynamics of HSA and cinnamic interactionwas measured using a VP-ITC titration microcalorimeter(MicroCal Inc., Northampton, MA). HSA, cinnamic acid and thereference buffer were degassed in a thermovac for 15 min priorto their loading. The 20 mM HSA and 10 mM PBS was loadedinto the sample and reference cell, respectively. 29 successiveinjections of cinnamic acid (1.5 mM) of 10 mL each were titratedto sample cell containing 20 mM HSA with an initial delay of 60s. Time duration for each injection was set to 20 s and spacingbetween two consecutive injections was kept at 180 s. The stir-ring speed and the reference power were xed at 307 rpm and16 mcal s�1, respectively.
2.3.8. Molecular docking. In order to perform moleculardocking, AutoDock-vina program was deployed since it doesmore accurate calculations than Autodock soware and is re-ported to perform faster.25,26 To perform molecular modellingmeasurements, the three dimensional crystal structure of HSAwas downloaded from RCSB Protein Data Bank [PDB: 1AO6]. Toavoid hindrance while docking, all water molecules wereremoved. Kollman charges were added to HSA aer merging allthe non-polar hydrogen atoms and the coordinate le wasconverted into PDBQT format using MGL Tools-1.5.6.27 The sizeof the grid was set to 52 � 48 � 48 A with maximum spacing(1 A) to cover all the active site residues having centre of the gridat x ¼ �22.717, y ¼ �33.725, z ¼ 38.864. The 3D structure ofcinnamic acid [CID: 444539] was downloaded from https://pubchem.ncbi.nlm.nih.gov in SDF format which was con-verted to pdb format using Chimera 1.10.2. All other dockingparameters were kept as default and post modelling analysiswas done using Accelrys Discovery Studio 4.5.
3. Results and discussion3.1. Antiglycation activity of cinnamic acid
3.1.1. UV-visible spectral analysis for glycation. All thesamples were analysed by UV-visible absorption spectra for thestructural change in HSA aer incubation. Native HSA exhibiteda characteristic peak at 280 nm (ESI Fig. S1†). Glycated sampleshowed maximum hyperchromicity, up to 3 times the absor-bance of native samples. This increase in absorbance is thoughtto result from unfolding of protein due to glycation. This canaffect protein function. Samples incubated in the presence ofCA exhibited reduced absorption compared to glycated HSA.The change in native conformation of HSA results in loss of its
This journal is © The Royal Society of Chemistry 2016

Paper RSC Advances
Publ
ishe
d on
11
July
201
6. D
ownl
oade
d on
1/2
8/20
22 3
:40:
15 A
M.
View Article Online
function which is main carrier protein in human blood. Treat-ment of varying concentrations of cinnamic acid protected HSAfrom unfolding and thereby, retaining its function.
3.1.2. AGE uorescence examination. AGEs are one of themajor factors responsible for pathogenicity of several agerelated problems cardiovascular complications of diabetesmellitus. AGEs specic uorescence is commonly employed fortheir detection.28,29 The uorescence emission spectra of nativeHSA and HSA incubated with cinnamic acid is shown in Fig. 1 atspecic excitations (322 nm, 335 nm, 365 nm and 380 nm) forthe determination of uorescent AGEs. The intensity of uo-rescence decreased with increasing concentration of cinnamicacid indicating that CA prevents protein glycation. This resultillustrates a dose dependent inhibitory effect of cinnamic acidin the formation of AGEs.
3.1.3. ANS uorescence. ANS (1-anilinonaphthalene-8-sulfonate) is a uorescent molecular probe, widely used forthe detections of hydrophobic domains of proteins.30 ANSshows very strong uorescence when bound to protein aerexcited at 385 nm while it is non-uorescent when present infree form in the solution.31 Glycated sample showed more thantwo-fold increase in the ANS uorescence emission signal ascompared to native HSA. This is either due to the exposure ofhydrophobic domains of HSA upon glycation or due to theformation of Amadori products.32 Results showed that dosedependant treatment with cinnamic acid decreased ANS uo-rescence intensity as shown in Fig. 2. Treatment with 25, 50, 100and 200 mM of cinnamic acid decreased uorescence intensityby 3.7%, 6.5%, 12.2% and 17.4% respectively, as compared toglycated sample. This result demonstrates the burial of hydro-phobic domains of HSA with the treatment of cinnamic acidthat shows the inclination towards native conformation. The
Fig. 1 Fluorescence emission spectra of native HSA, glycated HSA, HSAcinnamic acid. All the data have been expressed in mean � SEM for thre
This journal is © The Royal Society of Chemistry 2016
reduction in ANS uorescence intensity with increasingconcentration of cinnamic acid also resulted in increase insurface hydrophobicity of HSA.
3.1.4. Methylglyoxal–HSA reactivity assay. Methylglyoxal(MG) is a metabolic intermediate of glucose metabolism whichis formed through polyol pathway. In hyperglycaemic condi-tions, there is increased ux of glucose that leads to theformation and accumulation of AGEs.33 MG is one of the mostreactive a-ketoaldehydes formed through glycolytic pathway invivo. This causes the modication of arginine residues of serumproteins leading to the formation of uorescent AGEs (mainlyargpyrimidine).34 This assay was performed for the quantitativeevaluation of inhibition in AGEs formation. The result obtained(Fig. 3) shows that there is dose dependent increase in AGEsinhibition with varying concentration of cinnamic acid. Therewas 7.6%, 14.1%, 19.4% and 23.7% inhibition in AGEs forma-tion upon treated with 25, 50, 100 and 200 mM cinnamic acid(Fig. 3). Aminoguanidine resulted in 34.3% AGEs inhibition ofMG-mediated HSA-glycation. The reduction in AGEs formationby cinnamic acid is due to the antioxidant capacity and ability toscavenge reactive carbonyl species.
3.1.5. Thiol and free lysine group measurements. Theamount of free sulydryl group is a direct parameter to analysethe redox status of a system. The oxidative modication inprotein samples was studied by estimating the free sulydrylgroup content. It is evident from Fig. 4A that there wasa remarkable decrease (47.5%) in free thiol group in glycatedprotein sample as compared to native HSA. Addition of 25, 50,100 and 200 mM cinnamic acid to HSA showed 46.9%, 42.4%36.6% and 21.8% decrease in free thiol group content. Themeasurement of thiol group in HSA is signicant to evaluate thegeneration of free radical as the degradation of Amadori
with aminoguanidine (PC) and HSA with different concentrations ofe independent experiments.
RSC Adv., 2016, 6, 65322–65337 | 65325

Fig. 2 Fluorescence spectra of ANS binding to HSA excited at 380 nm (PC is aminoguanidine treated). All the data have been expressed in mean� SEM for three independent experiments.
RSC Advances Paper
Publ
ishe
d on
11
July
201
6. D
ownl
oade
d on
1/2
8/20
22 3
:40:
15 A
M.
View Article Online
products may generate free radicals by oxidizing the proteins.20
It is evident from our ndings that addition of cinnamic acid toa HSA signicantly dampens protein oxidation even in presenceof glucose.
Fig. 3 MG–HSA assay. Inhibitory effect of cinnamic acid on middle staguanidine (10 mM) as a positive control). All the data have been expresignificantly different from MG at p # 0.05.
65326 | RSC Adv., 2016, 6, 65322–65337
The major site for non-enzymatic glycation of proteins is freeamino group present in lysine, but arginine, cysteine andhistidine have also found to be involved in this phenomenon.23
In this process, free 3-NH2 group of arginine and lysine react
ge of HSA glycation (MG is methylglyoxal as a control; PC is amino-ssed in mean � SEM for three independent experiments. * indicates
This journal is © The Royal Society of Chemistry 2016

Fig. 4 Thiol group and free lysine estimation. Concentration free thiol group in native HSA, glycated HSA and HSA treated with variousconcentration of cinnamic acid (A). Effect of cinnamic acid on free 3-NH2 group of lysine determined by TNBSA assay on native HSA, glycatedHSA and HSA treated with various concentration of cinnamic acid (B) (PC is aminoguanidine treated HSA). All the data have been expressed inmean � SEM for three independent experiments. * indicates significantly different from control at p # 0.05. # indicates significantly differentfrom group B at p # 0.05.
Paper RSC Advances
Publ
ishe
d on
11
July
201
6. D
ownl
oade
d on
1/2
8/20
22 3
:40:
15 A
M.
View Article Online
with carbonyl group of various sugars to form Amadori productand nally leading to the formation of heterogeneous class ofadvanced glycated end products such as carboxymethyllysine(CML), vesperlysine (VESP) and carboxyethyllysine (CEL) etc.35
One of the most common mechanism involved in antiglycationprocess is the masking of lysine and arginine residues by smallmolecule inhibitors. It is clear from Fig. 4B that glycation ofHSA with glucose for 28 days lead to 58.75% decrease in free
Fig. 5 Carbonyl content of native, glycated and cinnamic acid treated Hmean� SEM for three independent experiments. * indicates significantlyglycated HSA at p # 0.05.
This journal is © The Royal Society of Chemistry 2016
amino group of lysine. The treatment of 25, 50, 100 and 200 mMof cinnamic acid to HSA showed 29.1%, 63.2%, 83.7% and124.9% increment in availability of free 3-NH2 group of lysine ascompared to glycated HSA. This result reveals that cinnamicacid has potent antiglycation activity which might be due to themasking of free amino groups in HSA.
3.1.6. Carbonyl content estimation. Protein glycation viaSchiff base leads to the formation of stable ketoamines called
SA (PC is aminoguanidine treated). All the data have been expressed indifferent from native at p# 0.05. # indicates significantly different from
RSC Adv., 2016, 6, 65322–65337 | 65327

Fig. 6 Time dependent generation of reactive oxygen species from different samples by NBT assay. All the data have been expressed in mean �SEM for three independent experiments.
RSC Advances Paper
Publ
ishe
d on
11
July
201
6. D
ownl
oade
d on
1/2
8/20
22 3
:40:
15 A
M.
View Article Online
Amadori products. These can undergo enediol reaction,resulting in the formation of carbonylated protein.36 Theseketoamines are further converted into superoxide radicalcausing oxidative and cellular damage.37 Carbonyl content ofprotein is well known biomarker of cellular oxidative stress. Thelevel of carbonyl content in glycated sample was found to be
Fig. 7 Far UV-CD spectra of native, glycated and cinnamic acid treated H� SEM for three independent experiments.
65328 | RSC Adv., 2016, 6, 65322–65337
more than three fold as compared to the native HSA sample asshown in Fig. 5. While the samples treated with 25, 50, 100 and200 mM cinnamic acid resulted in 26.7%, 46.5%, 55.1% and58.2% decrease in carbonyl content compared to glycatedsample respectively. The result veried the free carbonylgroup trapping ability of cinnamic acid that was apparent from
SA at various concentrations. All the data have been expressed in mean
This journal is © The Royal Society of Chemistry 2016

Fig. 8 SDS-polyacrylamide gel electrophoresis of HSA on 8% SDS-PAGE for 4 h at 80 V. Protein samples (10 mg in each lane) were loadedon well. Lanes: (1) native HSA; (2) glycated HSA; (3) aminoguanidine; (4)50 mM; (5) 100 mM; (6) 200 mM cinnamic acid respectively.
Paper RSC Advances
Publ
ishe
d on
11
July
201
6. D
ownl
oade
d on
1/2
8/20
22 3
:40:
15 A
M.
View Article Online
the reduced carbonyl content detected in the presence of cin-namic acid.
3.1.7. Time dependent ROS generation. NBT assay wasperformed to detect the generation of reactive oxygen species.Fig. 6 demonstrates the generation of ROS which was found tobe maximum in glycated sample. While, native HSA did notexhibit any signicant ROS production. The generation ofsuperoxide anion decreased remarkably in concentrationdependent fashion by treatment with cinnamic acid. It is clearfrom the Fig. 6 that the ROS quenching ability of cinnamic acidwhich might be due to its antioxidant property. These resultssuggest that formation of AGE's which led to the developmenthighly reactive species that might be responsible for thedegradation of HSA.
3.1.8. Circular dichroism measurements. The changessecondary structure of HSA was analysed by far-UV CD spec-troscopy of each samples. The CD spectra for all the samplesshowed 2 negative bands, at 208 nm and 222 nm, anda positive band at 190 nm respectively (Fig. 7). DICHROWEBwas used for the quantitative estimation of the secondarystructural components in all the sample and details isenlisted in Table 1.38 Glycation of HSA resulted in 42.7% lossin regular a-helix as compared to native HSA. It is evidentfrom the data presented in Table 1 that the loss in secondarystructures of glycated HSA was accompanied by unordered orrandom coil conformation. In HSA samples treated with 25mM, 50 mM, 100 mM and 200 mM of cinnamic acid, the regulara-helix was found to be 16.1%, 22.6%, 25.5% and 26.3%respectively. This indicates that HSA got more inclined to itsnative or dened secondary structure aer treatment withcinnamic acid which evidently prevented glycation toa remarkable extent.
3.1.9. Electrophoresis (SDS-PAGE). The migration patternof native and glycated human serum albumin samples areshown on SDS-PAGE in Fig. 8. Native HSA showed a single bandwhile glycated-HSA showed more than one band. This could bedue the protein fragmentation caused by ROS generated byAGE's. All samples treated with cinnamic acid, exhibiteda single band showing the protective role of cinnamic acidagainst the formation of AGE's. There was negligible fragmen-tation in all the treated samples including the one withaminoguanidine.
Table 1 Secondary structure contents of native HSA, glycated HSA and(http://dichroweb.cryst.bbk.ac.uk)a
Samples Helix 1 (%) Helix 2 (%) Strand
Native 30.2 24.3 07.1Glycated 17.3 18.5 09.2Aminoguanidine 28.8 25.4 04.9CA (200 mM) 26.3 27.8 00.6CA (100 mM) 25.5 25.7 01.8CA (50 mM) 22.6 25.4 03.8CA (25 mM) 16.1 18.1 08.4
a Helix 1, Helix 2, Strand 1 and Strand 2 indicate a regular a-helix, distor
This journal is © The Royal Society of Chemistry 2016
3.2. Interaction studies
3.2.1. UV-visible spectroscopy. Interaction of small mole-cules that result in the formation of drug–protein complex arealso measured by UV-visible spectroscopy and the extent ofinteraction is characterized by changes in absorbance or shi inthe position of peak (lmax).39,40 Titration of HSA with increasingconcentration of cinnamic acid resulted in hyperchromism ofUV-visible spectrum of HSA with a negligible change in peakposition Fig. 9A. These changes in the UV-visible spectrum ofHSA may be due to corresponding changes in the conformationof HSA upon interaction with cinnamic acid.
The value of binding constant was calculated using eqn (2).41
A0
A� A0
¼ 3HSA
3Bþ 3HSA
3BK� 1
C(2)
where A0 and A are the absorbance of HSA in the absence andpresence of cinnamic acid, 3HSA and 3B are the molar extinctioncoefficient of HSA alone and the bound complex respectively, Kis the binding constant and C is the concentration of cinnamicacid.
treated HSA estimated from the CD spectra (Fig. 7) using DICHROWEB
1 (%) Strand 2 (%) Turns (%) Unordered (%)
0.90 12.9 24.502.0 17.0 36.00.40 14.0 26.40.60 17.9 26.80.20 16.2 30.60.9 16.9 30.4
02.8 19.4 35.2
ted a-helix, regular b-strand and distorted b-strand, respectively.
RSC Adv., 2016, 6, 65322–65337 | 65329
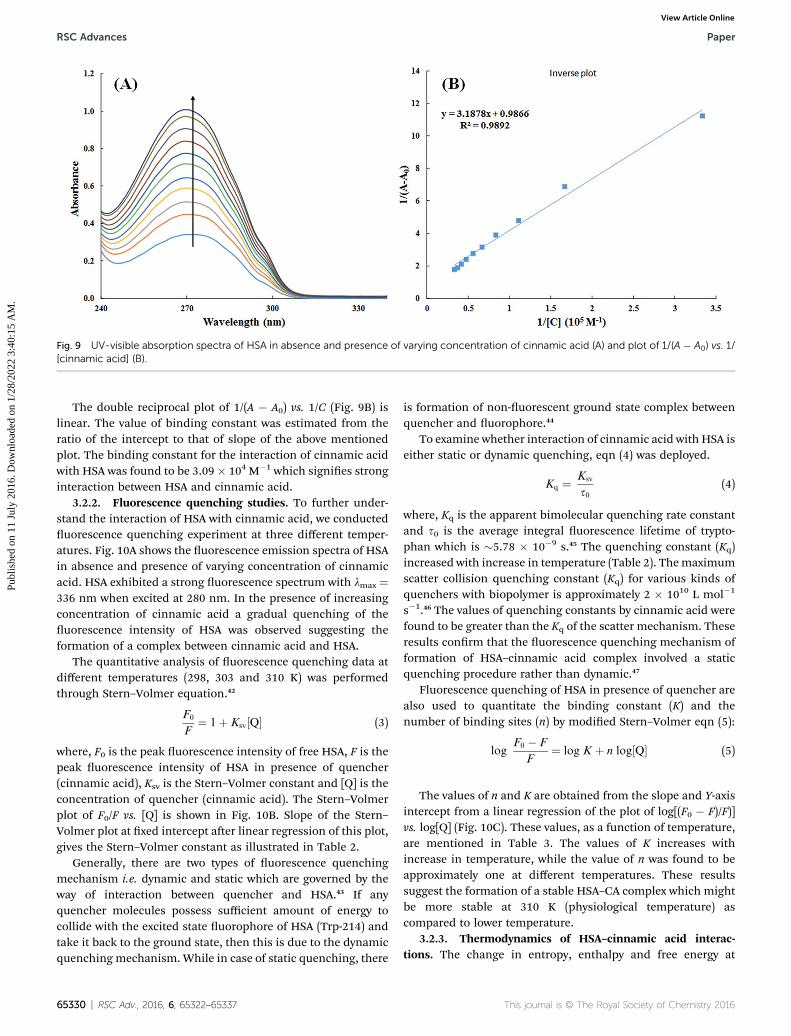
Fig. 9 UV-visible absorption spectra of HSA in absence and presence of varying concentration of cinnamic acid (A) and plot of 1/(A � A0) vs. 1/[cinnamic acid] (B).
RSC Advances Paper
Publ
ishe
d on
11
July
201
6. D
ownl
oade
d on
1/2
8/20
22 3
:40:
15 A
M.
View Article Online
The double reciprocal plot of 1/(A � A0) vs. 1/C (Fig. 9B) islinear. The value of binding constant was estimated from theratio of the intercept to that of slope of the above mentionedplot. The binding constant for the interaction of cinnamic acidwith HSA was found to be 3.09 � 104 M�1 which signies stronginteraction between HSA and cinnamic acid.
3.2.2. Fluorescence quenching studies. To further under-stand the interaction of HSA with cinnamic acid, we conducteduorescence quenching experiment at three different temper-atures. Fig. 10A shows the uorescence emission spectra of HSAin absence and presence of varying concentration of cinnamicacid. HSA exhibited a strong uorescence spectrum with lmax ¼336 nm when excited at 280 nm. In the presence of increasingconcentration of cinnamic acid a gradual quenching of theuorescence intensity of HSA was observed suggesting theformation of a complex between cinnamic acid and HSA.
The quantitative analysis of uorescence quenching data atdifferent temperatures (298, 303 and 310 K) was performedthrough Stern–Volmer equation.42
F0
F¼ 1þ Ksv½Q� (3)
where, F0 is the peak uorescence intensity of free HSA, F is thepeak uorescence intensity of HSA in presence of quencher(cinnamic acid), Ksv is the Stern–Volmer constant and [Q] is theconcentration of quencher (cinnamic acid). The Stern–Volmerplot of F0/F vs. [Q] is shown in Fig. 10B. Slope of the Stern–Volmer plot at xed intercept aer linear regression of this plot,gives the Stern–Volmer constant as illustrated in Table 2.
Generally, there are two types of uorescence quenchingmechanism i.e. dynamic and static which are governed by theway of interaction between quencher and HSA.43 If anyquencher molecules possess sufficient amount of energy tocollide with the excited state uorophore of HSA (Trp-214) andtake it back to the ground state, then this is due to the dynamicquenching mechanism. While in case of static quenching, there
65330 | RSC Adv., 2016, 6, 65322–65337
is formation of non-uorescent ground state complex betweenquencher and uorophore.44
To examine whether interaction of cinnamic acid with HSA iseither static or dynamic quenching, eqn (4) was deployed.
Kq ¼ Ksv
s0(4)
where, Kq is the apparent bimolecular quenching rate constantand s0 is the average integral uorescence lifetime of trypto-phan which is �5.78 � 10�9 s.45 The quenching constant (Kq)increased with increase in temperature (Table 2). Themaximumscatter collision quenching constant (Kq) for various kinds ofquenchers with biopolymer is approximately 2 � 1010 L mol�1
s�1.46 The values of quenching constants by cinnamic acid werefound to be greater than the Kq of the scatter mechanism. Theseresults conrm that the uorescence quenching mechanism offormation of HSA–cinnamic acid complex involved a staticquenching procedure rather than dynamic.47
Fluorescence quenching of HSA in presence of quencher arealso used to quantitate the binding constant (K) and thenumber of binding sites (n) by modied Stern–Volmer eqn (5):
logF0 � F
F¼ log K þ n log½Q� (5)
The values of n and K are obtained from the slope and Y-axisintercept from a linear regression of the plot of log[(F0 � F)/F)]vs. log[Q] (Fig. 10C). These values, as a function of temperature,are mentioned in Table 3. The values of K increases withincrease in temperature, while the value of n was found to beapproximately one at different temperatures. These resultssuggest the formation of a stable HSA–CA complex which mightbe more stable at 310 K (physiological temperature) ascompared to lower temperature.
3.2.3. Thermodynamics of HSA–cinnamic acid interac-tions. The change in entropy, enthalpy and free energy at
This journal is © The Royal Society of Chemistry 2016

Fig. 10 Steady-state fluorescence spectra of HSA in absence and presence of varying concentration of cinnamic acid (A) and the Stern–Volmerplots for the HSA–cinnamic acid interaction at different temperatures (B). log[(F0 � F)/F] vs. log[Q] plots for HSA–cinnamic acid interaction (C)and Van't Hoff plot (D).
Table 2 Stern–Volmer constant and quenching constant of the HSA–cinnamic acid complex at different temperatures
pH Temp (K)Ksv
(�104 M�1)Kq
(�1012 M�1 s�1) R2
7.4 298 1.310 2.267 0.9966303 1.560 2.699 0.9976310 1.819 3.146 0.9953
Paper RSC Advances
Publ
ishe
d on
11
July
201
6. D
ownl
oade
d on
1/2
8/20
22 3
:40:
15 A
M.
View Article Online
different temperatures were analysed from the van't Hoff'sequations mentioned below.
ln K ¼ � DH�
RTþ DS�
R(6)
and
DG� ¼ DH� � TDS� (7)
This journal is © The Royal Society of Chemistry 2016
where, K is the binding constant, DH� is the enthalpy change,DG� is the free Gibbs energy change, DS� is the entropy change,and R is the universal gas constant (1.987 cal mol�1 K�1).
The nature of forces involved in the formation of HSA–cin-namic acid complex can be depicted from the magnitude andsign of various thermodynamic parameters.48 Therefore, weplotted the van't Hoff's plot to know the involvement ofmolecular forces in the HSA–cinnamic acid complex from thebinding constants earlier obtained at their respective tempera-tures (Fig. 10D). The values of DH� and TDS� mentioned inTable 3 were determined from the slope and Y-axis intercept oflinear regression of van't Hoff's plot using eqn (6). The negativevalue of DG obtained from the eqn (7) suggest that the forma-tion of HSA–cinnamic acid complex in spontaneous. Non-covalent interactions, mainly van der Waal's forces andhydrogen bonds played major role in cinnamic acid–HSAinteractions.48 The positive TDS� is also a strong manifestationthat water molecules have been excluded from the interface of
RSC Adv., 2016, 6, 65322–65337 | 65331

Table 3 Thermodynamic parameters, binding constant and number of binding sites for HSA–cinnamic acid complex formation at varioustemperatures
pH Temp (K) K (�104 M�1) n R2 DG� (kcal mol�1) DH� (kcal mol�1) TDS� (kcal mol�1)
7.4 298 1.111 0.985 0.9972 �5.527 18.373 23.901303 1.949 1.033 0.9989 �5.928 24.301310 3.711 1.046 0.9940 �6.489 24.863
RSC Advances Paper
Publ
ishe
d on
11
July
201
6. D
ownl
oade
d on
1/2
8/20
22 3
:40:
15 A
M.
View Article Online
binding site of HSA, because the presence of water at bindingsite mimic nature of forces responsible for protein–ligandinteraction. The positive value of TDS� is routinely is regardedas quintessential affirmation of hydrophobic interactions.49
3.2.4. Synchronous uorescence study. Fluorescencequenching study only tells about the binding constants andvarious thermodynamic parameters. Synchronous uorescencespectroscopy was performed to examine whether the binding ofcinnamic acid to HSA affects the conformation and/or themolecular environment of HSA's uorophores.50 Any shi inmaximum uorescence emission wavelength of HSA is gov-erned by the changes of polarity around the uorophoremolecules. When Dl(lem � lex) is kept at 60 nm or 15 nm, thesynchronous uorescence spectra reveals the characteristicinformation of the microenvironment of tryptophan or tyrosineresidues respectively.51
The synchronous uorescence spectra of HSA in absence andpresence of cinnamic acid is shown in Fig. 11. It is evident fromthe Fig. 11A that there is negligible shi (�1 nm) on maximumemission wavelength of tyrosine residues, stating that the localenvironment around tyrosine residue did not had any signi-cant change. While the synchronous uorescence spectra oftryptophan (Fig. 11B) changed remarkably (3–4 nm) indicatingthe increase in polarity around the tryptophan residue therebylowering the hydrophobicity of the residue.52
Fig. 11 Synchronous fluorescence spectra at Dl ¼ 15 (A) and Dl ¼ 60concentrations.
65332 | RSC Adv., 2016, 6, 65322–65337
3.2.5. Evaluation of binding site of cinnamic to HSA in thepresence of site markers (ibuprofen and warfarin). The crystalstructure of HSA unveils that it has three homologous domainsnamed I, II, and III, and each domain contain two sub-domainsi.e. A and B.53 To nd out the precise binding site, some sitespecic markers are oen used, whose binding sites to HSA arealready known. From the X-ray crystallographic studies, it is wellknown that warfarin is a probe for sub-domain IIA or theSudlow site I. Similarly, ibuprofen is a probe for sub-domainIIIA or Sudlow site II.54 To facilitate the comparison of theinuence of site markers on HSA–cinnamic acid system, a graphwas plotted using the Stern–Volmer equation (Fig. 12). It isevident from the gure that the uorescence property of cin-namic acid–HSA system did not had any signicant change inpresence of ibuprofen. This result indicates that ibuprofen didnot had any effect on the binding of cinnamic acid to its usuallocation in HSA. In contrast, the uorescence quenchingproperty by cinnamic acid was remarkably decreased in thepresence of warfarin. This illustrates that binding of cinnamicacid was greatly affected due to the presence of warfarin in thesolution. The site specic experiment conrms that the bindingsite of cinnamic acid to HSA is mainly located in Sudlow's site I(sub-domain IIA) of HSA.
3.2.6. Effects of ionic strength. In this study, we furtherevaluated the involvement of electrostatic interaction in the
(B) of HSA in absence and in presence of cinnamic acid at different
This journal is © The Royal Society of Chemistry 2016

Fig. 13 Isothermal titration calorimetry profile of HSA and cinnamicacid interaction.
Fig. 12 Competitive binding of cinnamic to HSA in the presence of site markers at 37 �C [HSA at 3 mM and site markers at 6 mM].
This journal is © The Royal Society of Chemistry 2016
Paper RSC Advances
Publ
ishe
d on
11
July
201
6. D
ownl
oade
d on
1/2
8/20
22 3
:40:
15 A
M.
View Article Online
stability of HSA–cinnamic acid complex. ESI Fig. S2† shows thetitration of different concentration (10–100 mM) of NaCl toa xed concentration of HSA–cinnamic acid complex whichresulted in a very small increase in the uorescence emissionsignal. The result suggests a negligible involvement of electro-static interactions in the formation of HSA–cinnamic acidcomplex.
3.2.7. Isothermal titration calorimetric (ITC) characteriza-tion of HSA–cinnamic acid interaction. The validation ofvarious thermodynamic parameters of HSA–cinnamic acid wasfurther investigated from ITC studies. ITC experiments not onlyprovides information about thermodynamic quantities such asenthalpy change (DH�), entropy change during binding (DS�),Gibb's free energy change (DG�) but also determines thebinding affinity (K) and the number of binding sites (n).55 ITCproles of the binding of cinnamic acid with HSA is depicted inFig. 13. Measurements of various thermodynamic quantities aredescribed in Table 4.
The negative value of DH� conrms that the formation ofHSA–cinnamic acid complex is exothermic. The value on n closeto unity deciphers that HSA has single binding site for cinnamicacid. The positive value of TDS� and negative value of DH� alsoindicates that HSA–cinnamic acid complex is mainly stabilizedby hydrophobic interaction and hydrogen bond.54 The values ofbinding constant and Gibb's energy change (DG�) obtainedfrom spectroscopy and calorimetry (Tables 3 and 4) arecomparable and found to in same order. In contrast, the valuesof TDS� and DH� differ signicantly from that of obtained by theuorescence spectroscopy. This is due the fact that the value ofDH� is temperature dependent while uorescent spectroscopictechnique calculates it as temperature-independent param-eter.45,56–58 Furthermore, the differences in the values of ther-modynamic parameters obtained by uorescence spectroscopy
RSC Adv., 2016, 6, 65322–65337 | 65333

Table 4 Isothermal titration calorimetry of HSA and cinnamic acid interaction
pH Temp. (K) Kb (�104 M�1) n DG� (kcal mol�1) DH� (kcal mol�1) TDS� (kcal mol�1)
7.4 298 5.87 0.986 �6.503 �5.586 0.917
RSC Advances Paper
Publ
ishe
d on
11
July
201
6. D
ownl
oade
d on
1/2
8/20
22 3
:40:
15 A
M.
View Article Online
and ITC is due to the fact that ITC measures a global change inthe thermodynamic property, whereas the uorescence spec-troscopy only measures the local changes around the uo-rophore (Trp-214).59,60
3.2.8. Molecular docking studies. Molecular docking hasbeen employed for further validation of spectroscopic andcalorimetric experimental studies and to get a closer look of thesite specic binding of cinnamic acid. HSA is 585 amino acidspolypeptide chain having three domains as domain I (residues1–195), domain II (196–383) and domain III (384–585) with
Fig. 14 Molecular models of HSA complexed with cinnamic acid. (A) Deselected protein side-chains are shown as ribbons. (B) Cinnamic acid isCinnamic acid in hydrophobic pocket of HSA surrounded by hydrophob
65334 | RSC Adv., 2016, 6, 65322–65337
further subdivision of each domain as subdomain A and B.Most common binding sites for drugs are located in thehydrophobic cavity of subdomain IIA of HSA.54 AutoDock-vinaresulted in 9 best conformations with increasing order ofGibb's free energy and the conformation having lowest energy isdepicted in Fig. 14. Molecular docking result reveals that cin-namic acid binds to subdomain IIA (Sudlow's site I) witha binding energy of �7.0 kcal mol�1, nearly the same valueobtained using ITC and uorescence spectroscopy. Cinnamicacid forms two hydrogen bonds with Ser287 and Arg257 of HSA
tailed view of the docking poses of the HSA–cinnamic acid complex,shown in the binding pocket of HSA with interacting amino acids. (C)ic amino acids. (D) A 2-dimensional view by Discovery Studio 4.5.
This journal is © The Royal Society of Chemistry 2016

Paper RSC Advances
Publ
ishe
d on
11
July
201
6. D
ownl
oade
d on
1/2
8/20
22 3
:40:
15 A
M.
View Article Online
and hydrophobic interactions with Leu219, Leu234, Leu238, Ile264 and Leu260. The complex is also being stabilized by van derWalls forces that are formed between Arg222, Ile290, Ala291,Phe223 and Tyr150 of HSA and cinnamic acid. The cinnamicacid was found to be in the binding pocket (Sudlow's site I) ofHSA surrounded by many hydrophobic residues such as Ala254,Val241, Leu233, Ile219, Val216, Ser287 etc. is in accordance withour site specic displacement experiments.49
4. Conclusion
It is concluded that cinnamic acid strongly inhibits the forma-tion of AGEs and acts as a potent antiglycating agent. The valuesof binding constants obtained both from UV-visible and uo-rescence spectroscopy show a strong interaction between HSAand CA. While The negative value of Gibb's free energy changedemonstrated that the process of HSA–CA complex formation isspontaneous, ITC results conrm that the reaction isexothermic in nature. Further, molecular docking studiesshowed that the interaction between HSA and CA are stabilisedmainly through hydrophobic and hydrogen bond. The bindingsite of CA was at one of the major glycating sites in HSA. In thestable HSA–CA complex, reduced numbers of glycating sites areavailable to react further with free glucose, thereby inhibitingglycation. Evaluation of secondary structure by far-UV CD showsthat treatment with CA, allows HSA to retained its nativeconformation required for proper function even in the presenceof high concentration of glucose. Furthermore, the estimationof various biomarkers such as free lysine group, carbonylcontent, free sulydryl group, reactive oxygen species etc.depicts that cinnamic acid is a quencher of free radical andcould prove benecial for diabetes and associated complica-tions. Reckoning with these facts, the study may be valuable tocompare the effect of different concentrations of CA on HSA–glucose structure and conformation upon glycation. However,most of the investigations in this area are limited to in vitroexperimental studies and therefore, further investigationsshould examine the in vivo efficacy of cinnamic acid in suitableanimal model.
Conflict of interest
The authors declare there are no conicts of interest.
Acknowledgements
We are grateful to Prof. Mohd. Shakir, Chairman, Departmentof Chemistry, and Prof. Javed Musarrat, Department of Agri-cultural Microbiology Aligarh Muslim University, Aligarh forproviding Instrumentation facilities and encouragement.
References
1 F. Akhter, M. S. Khan, U. Shahab and S. Ahmad, Bio-physicalcharacterization of ribose induced glycation: a mechanisticstudy on DNA perturbations, Int. J. Biol. Macromol., 2013,58, 206–210.
This journal is © The Royal Society of Chemistry 2016
2 T. J. Lyons, S. R. Thorpe and J. W. Baynes, Glycation andautoxidation of proteins in aging and diabetes, inHyperglycemia, Diabetes, and Vascular Disease, Springer,New York, 1992, pp. 197–217.
3 M. Brownlee, Biochemistry and molecular cell biology ofdiabetic complications, Nature, 2001, 414(6865), 813–820.
4 P. J. Thornalley, Advanced glycation and the development ofdiabetic complications. Unifying the involvement of glucose,methylglyoxal and oxidative stress, Endocrinol. Metab., 1996,3, 149–166.
5 S. Adisakwattana, W. Sompong, A. Meeprom, S. Ngamukoteand S. Yibchok-anun, Cinnamic acid and its derivativesinhibit fructose-mediated protein glycation, Int. J. Mol. Sci.,2012, 13(2), 1778–1789.
6 L. Kardesler, N. Buduneli, B. Bıyıkoglu, S. Çetinkalp andN. Kutukçuler, Gingival crevicular uid PGE 2, IL-1b, t-PA,PAI-2 levels in type 2 diabetes and relationship withperiodontal disease, Clin. Biochem., 2008, 41(10), 863–868.
7 V. P. Singh, A. Bali, N. Singh and A. S. Jaggi, Advancedglycation end products and diabetic complications, KoreanJ. Physiol. Pharmacol., 2014, 18(1), 1–4.
8 A. A. Chinchansure, A. M. Korwar, M. J. Kulkarni andS. P. Joshi, Recent development of plant products with anti-glycation activity: a review, RSC Adv., 2015, 5(39), 31113–31138.
9 D. Cervantes-Laurean, D. D. Schramm, E. L. Jacobson,I. Halaweish, G. G. Bruckner and G. A. Boissonneault,Inhibition of advanced glycation end product formation oncollagen by rutin and its metabolites, J. Nutr. Biochem.,2006, 17(8), 531–540.
10 S. Sang, X. Shao, N. Bai, C. Y. Lo, C. S. Yang and C. T. Ho, Teapolyphenol (�)-epigallocatechin-3-gallate: a new trappingagent of reactive dicarbonyl species, Chem. Res. Toxicol.,2007, 20(12), 1862–1870.
11 F. Natella, M. Nardini, M. Di Felice and C. Scaccini, Benzoicand cinnamic acid derivatives as antioxidants: structure–activity relation, J. Agric. Food Chem., 1999, 47(4), 1453–1459.
12 I. M. Liu, F. L. Hsu, C. F. Chen and J. T. Cheng,Antihyperglycemic action of isoferulic acid instreptozotocin-induced diabetic rats, Br. J. Pharmacol.,2000, 129(4), 631–636.
13 D. W. Huang and S. C. Shen, Caffeic acid and cinnamic acidameliorate glucose metabolism viamodulating glycogenesisand gluconeogenesis in insulin-resistant mousehepatocytes, J. Funct. Foods, 2012, 4(1), 358–366.
14 W. Arlt, P. Neogi, C. Gross and W. L. Miller, Cinnamic acidbased thiazolidinediones inhibit human P450c17 and3beta-hydroxysteroid dehydrogenase and improve insulinsensitivity independent of PPARgamma agonist activity, J.Mol. Endocrinol., 2004, 32(2), 425–436.
15 M. M. Alam, I. Ahmad and I. Naseem, Inhibitory effect ofquercetin in the formation of advance glycation endproducts of human serum albumin: an in vitro andmolecular interaction study, Int. J. Biol. Macromol., 2015,79, 336–343.
16 O. Classics Lowry, N. Rosebrough, A. Farr and R. Randall,Protein measurement with the Folin phenol reagent, J.Biol. Chem., 1951, 193, 265–275.
RSC Adv., 2016, 6, 65322–65337 | 65335
RSC Advances Paper
Publ
ishe
d on
11
July
201
6. D
ownl
oade
d on
1/2
8/20
22 3
:40:
15 A
M.
View Article Online
17 M. Bohlooli, M. Ghaffari-Moghaddam, M. Khajeh,Z. Aghashiri, N. Sheibani and A. A. Moosavi-Movahedi,Acetoacetate promotes the formation of uorescentadvanced glycation end products (AGEs), J. Biomol. Struct.Dyn., 2016, 1–9.
18 N. Sattarahmady, A. A. Moosavi-Movahedi, F. Ahmad,G. H. Hakimelahi, M. Habibi-Rezaei, A. A. Saboury andN. Sheibani, Formation of the molten globule-like stateduring prolonged glycation of human serum albumin,Biochim. Biophys. Acta, Gen. Subj., 2007, 1770(6), 933–942.
19 C. Lee, M. B. Yim, P. B. Chock, H. S. Yim and S. O. Kang,Oxidation-reduction properties of methylglyoxal-modiedprotein in relation to free radical generation, J. Biol. Chem.,1998, 273(39), 25272–25278.
20 B. Bouma, L. M. Kroon-Batenburg, Y. P. Wu, B. Brunjes,G. Posthuma, O. Kranenburg, P. G. de Groot, E. E. Voestand M. F. Gebbink, Glycation induces formation ofamyloid cross-b structure in albumin, J. Biol. Chem., 2003,278(43), 41810–41819.
21 M. L. Kakade and I. E. Liener, Determination of availablelysine in proteins, Anal. Biochem., 1969, 27(2), 273–280.
22 R. L. Levine, J. A. Williams, E. P. Stadtman and E. Shacter,[37] Carbonyl assays for determination of oxidativelymodied proteins, Methods Enzymol., 1994, 233, 346–357.
23 Neelofar, J. Ahmad and K. Alam, Impact of in vitro non-enzymatic glycation on biophysical and biochemical regimesof human serum albumin: relevance in diabetes associatedcomplications, RSC Adv., 2015, 5(78), 63605–63614.
24 M. A. Husain, T. Sarwar, S. U. Rehman, H. M. Ishqi andM. Tabish, Ibuprofen causes photocleavage through ROSgeneration and intercalates with DNA: a combinedbiophysical and molecular docking approach, Phys. Chem.Chem. Phys., 2015, 17, 13837–13850.
25 O. Trott and A. J. Olson, AutoDock Vina: improving the speedand accuracy of docking with a new scoring function,efficient optimization, and multithreading, J. Comput.Chem., 2010, 31(2), 455–461.
26 P. Pandya, L. K. Agarwal, N. Gupta and S. Pal, Molecularrecognition pattern of cytotoxic alkaloid vinblastine withmultiple targets, J. Mol. Graphics Modell., 2014, 54, 1–9.
27 G. M. Morris, D. S. Goodsell, R. S. Halliday, R. Huey,W. E. Hart, R. K. Belew and A. J. Olson, Automateddocking using a Lamarckian genetic algorithm and anempirical binding free energy function, J. Comput. Chem.,1998, 19(14), 1639–1662.
28 J. Leclere and I. Birlouez-Aragon, The uorescence ofadvanced Maillard products is a good indicator of lysinedamage during the Maillard reaction, J. Agric. Food Chem.,2001, 49(10), 4682–4687.
29 M. E. Westwood and P. J. Thornalley, Molecularcharacteristics of methylglyoxal-modied bovine andhuman serum albumins. Comparison with glucose-derivedadvanced glycation endproduct-modied serum albumins,J. Protein Chem., 1995, 14(5), 359–372.
30 D. Matulis and R. Lovrien, 1-Anilino-8-naphthalenesulfonate anion-protein binding depends primarily on ionpair formation, Biophys. J., 1998, 74(1), 422–429.
65336 | RSC Adv., 2016, 6, 65322–65337
31 S. A. Bhat, A. Sohail, A. A. Siddiqui and B. Bano, Effect ofnon-enzymatic glycation on cystatin: a spectroscopic study,J. Fluoresc., 2014, 24(4), 1107–1117.
32 T. A. Khan, M. Saleemuddin and A. Naeem, Partially foldedglycated state of human serum albumin tends toaggregate, Int. J. Pept. Res. Ther., 2011, 17(4), 271–279.
33 R. Nagai, K. Matsumoto, X. Ling, H. Suzuki, T. Araki andS. Horiuchi, Glycolaldehyde, a reactive intermediate foradvanced glycation end products, plays an important rolein the generation of an active ligand for the macrophagescavenger receptor, Diabetes, 2000, 49(10), 1714–1723.
34 R. Gomes, M. S. Silva, A. Quintas, C. Cordeiro, A. Freire,P. Pereira, A. Martins, E. Monteiro, E. Barroso andA. P. Freire, Argpyrimidine, a methylglyoxal-derivedadvanced glycation end-product in familial amyloidoticpolyneuropathy, Biochem. J., 2005, 385(2), 339–345.
35 S. Awasthi and N. T. Saraswathi, Vanillin restrains non-enzymatic glycation and aggregation of albumin bychemical chaperone like function, Int. J. Biol. Macromol.,2016, 87, 1–6.
36 M. Khajehpour, J. L. Dashnau and J. M. Vanderkooi, Infraredspectroscopy used to evaluate glycosylation of proteins, Anal.Biochem., 2006, 348(1), 40–48.
37 M. F. Beal, Oxidatively modied proteins in aging anddisease 1, 2, Free Radicals Biol. Med., 2002, 32(9), 797–803.
38 N. Sreerama and R. W. Woody, A self-consistent method forthe analysis of protein secondary structure from circulardichroism, Anal. Biochem., 1993, 209(1), 32–44.
39 J. Jaumot and R. Gargallo, Experimental methods forstudying the interactions between G-quadruplex structuresand ligands, Curr. Pharm. Des., 2012, 18(14), 1900–1916.
40 H. Sun, J. Xiang, Y. Liu, L. Li, Q. Li, G. Xu and Y. Tang, Astabilizing and denaturing dual-effect for naturalpolyamines interacting with G-quadruplexes depending onconcentration, Biochimie, 2011, 93(8), 1351–1356.
41 S. Tabassum, W. M. Al-Asbahy, M. Afzal, F. Arjmand andR. H. Khan, Interaction and photo-induced cleavagestudies of a copper based chemotherapeutic drug withhuman serum albumin: spectroscopic and moleculardocking study, Mol. BioSyst., 2012, 8(9), 2424–2433.
42 M. R. Eink, Fluorescence quenching reactions, inBiophysical and biochemical aspects of uorescencespectroscopy, Springer, US, 1991, pp. 1–41.
43 J. Mariam, P. M. Dongre and D. C. Kothari, Study ofinteraction of silver nanoparticles with bovine serumalbumin using uorescence spectroscopy, J. Fluoresc., 2011,21(6), 2193–2199.
44 A. Bhogale, N. Patel, P. Sarpotdar, J. Mariam, P. M. Dongre,A. Miotello and D. C. Kothari, Systematic investigation onthe interaction of bovine serum albumin with ZnOnanoparticles using uorescence spectroscopy, ColloidsSurf., B, 2013, 102, 257–264.
45 M. Ishtikhar, S. Khan, G. Badr, A. O. Mohamed andR. H. Khan, Interaction of the 5-uorouracil analog 5-uoro-20-deoxyuridine with ‘N’and ‘B’isoforms of humanserum albumin: a spectroscopic and calorimetric study,Mol. BioSyst., 2014, 10(11), 2954–2964.
This journal is © The Royal Society of Chemistry 2016

Paper RSC Advances
Publ
ishe
d on
11
July
201
6. D
ownl
oade
d on
1/2
8/20
22 3
:40:
15 A
M.
View Article Online
46 Q. Saquib, A. A. Al-Khedhairy, S. A. Alari, S. Dwivedi,J. Mustafa and J. Musarrat, Fungicide methyl thiophanatebinding at sub-domain IIA of human serum albumintriggers conformational change and protein damage, Int.J. Biol. Macromol., 2010, 47(1), 60–67.
47 S. Monti, S. Ottani, F. Manoli, I. Manet, F. Scagnolari,B. Zambelli and G. Marconi, Chiral recognition of 2-(3-benzoylphenyl) propionic acid (ketoprofen) by serumalbumin: an investigation with microcalorimetry, circulardichroism and molecular modelling, Phys. Chem. Chem.Phys., 2009, 11(40), 9104–9113.
48 P. D. Ross and S. Subramanian, Thermodynamics of proteinassociation reactions: forces contributing to stability,Biochemistry, 1981, 20(11), 3096–3102.
49 M. Ishtikhar, G. Rabbani and R. H. Khan, Interaction of 5-uoro-50-deoxyuridine with human serum albumin underphysiological and non-physiological condition: a biophysicalinvestigation, Colloids Surf., B, 2014, 123, 469–477.
50 N. Ibrahim, H. Ibrahim, S. Kim, J. P. Nallet and F. Nepveu,Interactions between antimalarial indolone-N-oxidederivatives and human serum albumin, Biomacromolecules,2010, 11(12), 3341–3351.
51 J. N. Miller, Recent advances in molecular luminescenceanalysis, in Proc Anal Div Chem Soc, 1979, vol. 16, no. 7, pp.203–208.
52 U. Kragh-Hansen, Molecular aspects of ligand binding toserum albumin, Pharmacol. Rev., 1981, 33(1), 17–53.
53 T. Chakraborty, I. Chakraborty, S. P. Moulik and S. Ghosh,Physicochemical and conformational studies on BSA–surfactant interaction in aqueous medium, Langmuir, 2009,25(5), 3062–3074.
This journal is © The Royal Society of Chemistry 2016
54 G. D. Sudlow, D. J. Birkett and D. N. Wade, Thecharacterization of two specic drug binding sites onhuman serum albumin, Mol. Pharmacol., 1975, 11(6), 824–832.
55 M. W. Freyer and E. A. Lewis, Isothermal titrationcalorimetry: experimental design, data analysis, andprobing macromolecule/ligand binding and kineticinteractions, Methods Cell Biol., 2008, 84, 79–113.
56 M. Ishtikhar, G. Rabbani and R. H. Khan, Interaction of5-uoro-50-deoxyuridine with human serum albumin underphysiological and non-physiological condition: a biophysicalinvestigation, Colloids Surf., B, 2014, 123, 469–477.
57 A. A. Thoppil, R. Sharma and N. Kishore, Complexation of b-lactam antibiotic drug carbenicillin to bovine serumalbumin: energetics and conformational studies,Biopolymers, 2008, 89(10), 831–840.
58 E. Ahmad, G. Rabbani, N. Zaidi, S. Singh, M. Rehan,M. M. Khan, S. K. Rahman, Z. Quadri, M. Shadab,M. T. Ashraf and N. Subbarao, Stereo-selectivity of humanserum albumin to enantiomeric and isoelectronicpollutants dissected by spectroscopy, calorimetry andbioinformatics, PLoS One, 2011, 6(11), e26186.
59 H.Watanabe, S. Tanase, K. Nakajou, T. Maruyama, U. Kragh-Hansen and M. Otagiri, Role of Arg-410 and Tyr-411 inhuman serum albumin for ligand binding and esterase-like activity, Biochem. J., 2000, 349(3), 813–819.
60 M. T. Rehman, H. Shamsi and A. U. Khan, Insight into thebinding mechanism of imipenem to human serumalbumin by spectroscopic and computational approaches,Mol. Pharmaceutics, 2014, 11(6), 1785–1797.
RSC Adv., 2016, 6, 65322–65337 | 65337