understanding the impact of leadership and organizational
TRANSCRIPT

Virginia Commonwealth University Virginia Commonwealth University
VCU Scholars Compass VCU Scholars Compass
Theses and Dissertations Graduate School
2015
Understanding the Impact of Leadership and Organizational Understanding the Impact of Leadership and Organizational
Culture on Nonprofit Employees’ Commitment and Turnover Culture on Nonprofit Employees’ Commitment and Turnover
Intention Intention
Nancy A. Toscano Virginia Commonwealth University
Follow this and additional works at: https://scholarscompass.vcu.edu/etd
Part of the Leadership Studies Commons, Organization Development Commons, and the Public
Administration Commons
© The Author
Downloaded from Downloaded from https://scholarscompass.vcu.edu/etd/3904
This Dissertation is brought to you for free and open access by the Graduate School at VCU Scholars Compass. It has been accepted for inclusion in Theses and Dissertations by an authorized administrator of VCU Scholars Compass. For more information, please contact [email protected].

Understanding the Impact of Leadership and Organizational Culture on Nonprofit Employees’ Commitment and Turnover Intention
A dissertation submitted in partial fulfillment of the requirements for the degree of Doctor of Philosophy at Virginia Commonwealth University.
By Nancy Toscano
Master of Social Work, New York University, 1998 Bachelor of Social Work, Siena College, 1996
Dissertation Chair: Nancy Stutts, Ph.D. Assistant Professor of Public Administration
L Douglas Wilder School of Government and Public Affairs
Virginia Commonwealth University Richmond, VA August, 2015

ii
ACKNOWLEDGEMENTS
I would like to thank my chair, Dr. Nancy Stutts for her support, guidance and
willingness to take on the chair role, midstream. Dr. Stutts introduced me to nonprofit and
leadership literature during the early stages of my doctoral coursework. The passion and
knowledge she shared in the classroom inspired me to choose my dissertation topic. I am grateful
to have been her student. I also wish to appreciate my former chair, Dr. Blue Wooldridge for his
support during the early stages of my dissertation process. I would like to thank Dr. Richard Huff
for his insightful feedback, encouragement as well as his phenomenal responsiveness with my
many questions. Dr. Patrick Dattalo is a tremendous teacher. He has clearly mastered the art of
guiding doctoral students through their methodology and statistics with patience, calm, and
clarity. Finally, I wish for every doctoral student to have a committee member like Dr. Richard
Couto. Dr. Couto is a renowned expert, accomplished scholar, editor, and activist; yet he
managed to consistently convey the message that my success was deeply important. Dr. Couto is
a key reason, I was able to complete my dissertation. He generously gave his attention, time,
kindness and emotional support, especially when I was unable to see the finish line.
My husband, John is my rock, my partner and my love. John is my unwavering support.
He is the reason I have been able to chase dreams, like becoming Dr. Nancy Toscano -- while
charging forward with my ideal career path and being a mom. I know how lucky I am to be
married to this wonderful man. Lastly, I have been in school for most of my son, Jack’s life. Not
everyone would believe that an eleven-year-old could be as wise, caring and mature as he truly
is. I am sure he will have childhood memories of his mom’s nose in a book or her staring at a
laptop screen, with papers strewn across the table. He has been my consistent coach, support,
venting partner, and practice audience throughout this process. I thought “out loud” endlessly,

iii
and there was Jack, in the background, responding with an encouraging or acknowledging word.
Jack was the most important person at my dissertation defense. My beautiful son keeps
everything in perspective for me.
iv
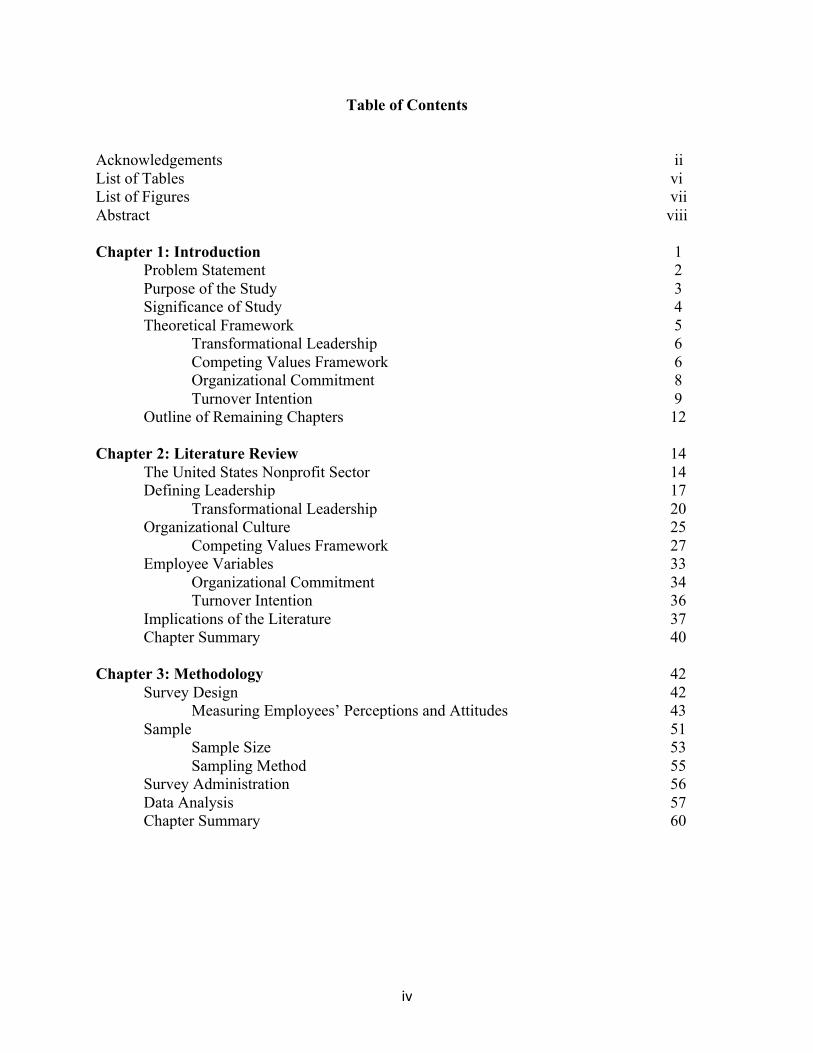
Table of Contents
Acknowledgements ii List of Tables vi List of Figures vii Abstract viii Chapter 1: Introduction 1 Problem Statement 2 Purpose of the Study 3 Significance of Study 4 Theoretical Framework 5 Transformational Leadership 6 Competing Values Framework 6 Organizational Commitment 8 Turnover Intention 9 Outline of Remaining Chapters 12 Chapter 2: Literature Review 14 The United States Nonprofit Sector 14 Defining Leadership 17 Transformational Leadership 20 Organizational Culture 25 Competing Values Framework 27 Employee Variables 33 Organizational Commitment 34 Turnover Intention 36 Implications of the Literature 37 Chapter Summary 40 Chapter 3: Methodology 42 Survey Design 42 Measuring Employees’ Perceptions and Attitudes 43 Sample 51 Sample Size 53 Sampling Method 55 Survey Administration 56 Data Analysis 57 Chapter Summary 60

v
Chapter 4: Results 61 Sample 61 Sample Characteristics 63 Data Preparation 68 Coding 69 Reference Category 71 Pre-Screening 71 Dominant Organizational Culture 74 Data Analysis: Hypotheses Testing 75 Chapter Summary 95 Chapter 5: Discussion and Implications 96 Discussion of Findings 96 Impact of Transformational Leadership on Commitment and Turnover 98 Impact of Organizational Culture on Commitment and Turnover 99 Interaction of Transformational Leadership and Organizational Culture 103 Limitations of the Study 105 Policy Implications 109 Practice Implications 112 Recommendations for Further Research 114 Conclusion 118 References 120
vi
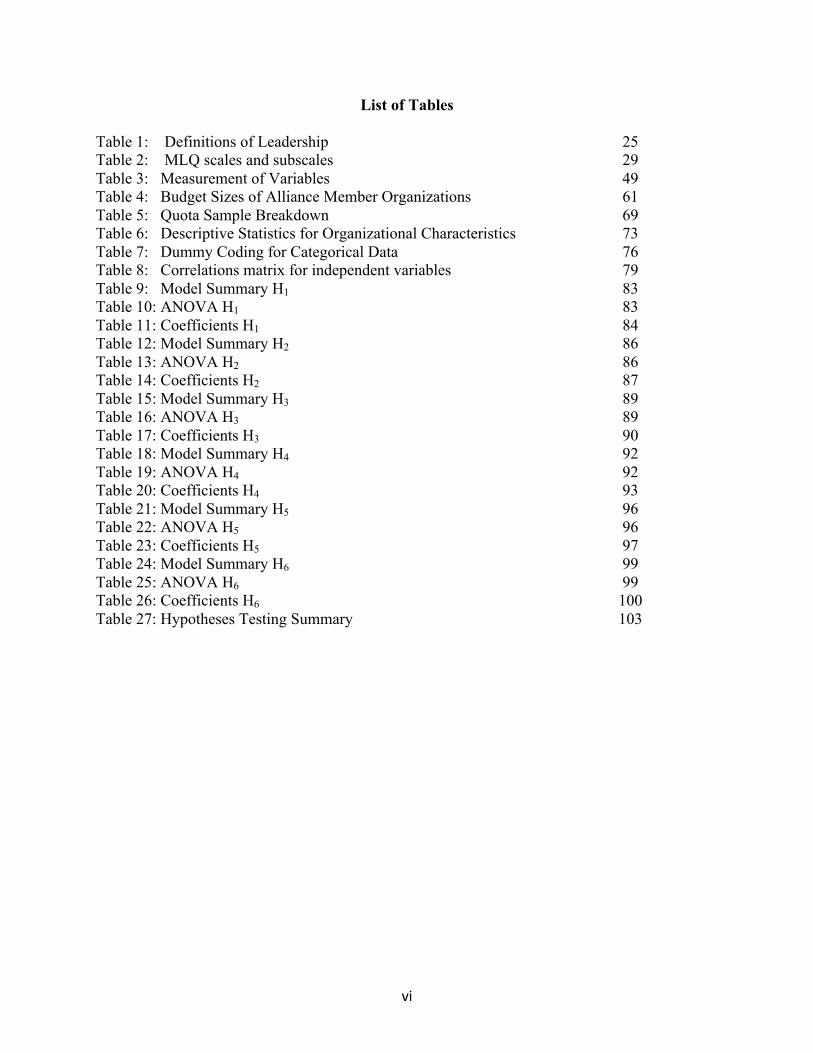
List of Tables
Table 1: Definitions of Leadership 25 Table 2: MLQ scales and subscales 29 Table 3: Measurement of Variables 49 Table 4: Budget Sizes of Alliance Member Organizations 61 Table 5: Quota Sample Breakdown 69 Table 6: Descriptive Statistics for Organizational Characteristics 73 Table 7: Dummy Coding for Categorical Data 76 Table 8: Correlations matrix for independent variables 79 Table 9: Model Summary H1 83 Table 10: ANOVA H1 83 Table 11: Coefficients H1 84 Table 12: Model Summary H2 86 Table 13: ANOVA H2 86 Table 14: Coefficients H2 87 Table 15: Model Summary H3 89 Table 16: ANOVA H3 89 Table 17: Coefficients H3 90 Table 18: Model Summary H4 92 Table 19: ANOVA H4 92 Table 20: Coefficients H4 93 Table 21: Model Summary H5 96 Table 22: ANOVA H5 96 Table 23: Coefficients H5 97 Table 24: Model Summary H6 99 Table 25: ANOVA H6 99 Table 26: Coefficients H6 100 Table 27: Hypotheses Testing Summary 103

vii
List of Figures
Figure 1: Competing Values Framework 36 Figure 2: Four Impulses of Nonprofit Organizations 39 Figure 3: Power Analysis 60 Figure 4: Gender of Respondents 70 Figure 5: Position Level of Respondents 71 Figure 6: Age of Respondents 71 Figure 7: Tenure of Respondents 72 Figure 8: Length of Time Supervised 72 Figure 9: Breakdown of Organizational Budget Size 74 Figure 10: Perceived Organizational Culture Type 81 Figure 11: Transformational Leadership Predicting Affective Commitment 104 Figure 12: Transformational Leadership Predicting Turnover Intention 104 Figure 13: Organizational Culture Type Relationship to Turnover Intention 106 Figure 14: Organizational Culture Type Relationship to Affective Commitment 106 Figure 15: Breakdown of Dominant Organizational Culture Type 108 Figure 16: Moderating Effect of Organizational Culture on Transformational Leadership and Affective Commitment 109 Figure 17: Moderating Effect of Organizational Culture on Transformational Leadership and Turnover Intention 109

viii
Abstract
UNDERSTANDING THE IMPACT OF LEADERSHIP AND ORGANIZATIONAL CULTURE ON NONPROFIT EMPLOYEES’ COMMITMENT AND TURNOVER INTENTION A dissertation submitted in partial fulfillment of the requirements for the degree of Doctor of Philosophy at Virginia Commonwealth University.
Nancy Toscano
Virginia Commonwealth University, 2015
Dissertation Chair: Nancy Stutts, Ph.D. Assistant Professor of Public Administration
Child and family nonprofit organizations are essential for the implementation of United
States public policy in their role as service providers. Human service nonprofit organizations
held approximately 20,000 government contracts, totaling more than $100 billion in 2009 (Boris,
deLeon, Roeger, & Nikolva, 2010). Almost 33,000 human service nonprofit organizations
contract with the government to deliver services (Boris, et al., 2010). The services provided by
these organizations are critical to the lives of vulnerable American citizens. These organizations
depend on committed employees to serve this group, carry out the mission, and reach
organizational goals. Employees are nonprofit organizations’ greatest resource, investment, and
also expense (Rutowski, Guiler, & Schimmel, 2009), thus turnover is considered a critical
problem facing the nonprofit sector (Salamon, 2012).
Retaining highly committed employees in this important work has been of interest to
those studying the nonprofit sector because it is a significant problem particularly in the area of

ix
human services (Mor Barak, Levin, Nissly, & Lane, 2006). This study asks if leadership and
organizational culture have an impact on nonprofit employees’ commitment to their workplace.
This quantitative research uses a quota sample of 103 nonprofit employees to understand the
relationships between their perceptions of their managers’ transformational leadership, their
perceptions of their organizations’ culture types (clan, adhocracy, hierarchy, market) and two
important and distinct employee outcomes, affective commitment and turnover intention.
The findings indicate that perceived transformational leadership matters to nonprofit
employees as it positively predicts their affective commitment and negatively predicts their
turnover intentions. The majority of respondents reported that they perceived their organizations
as clan cultures, which are known to be friendly, personal places where belonging and
connectedness is high. The findings also reveal that hierarchical cultures play a role in this
predictive relationship, having a moderating effect on the relationship between transformational
leadership and affective commitment. In contrast, the findings reveal that compared to clan
cultures, hierarchical and market cultures may be problematic in that they positively predict
employees’ turnover intentions. Further, perceived hierarchical cultures negatively predict the
employees’ affective commitment.

1
Chapter 1: Introduction
The United States has the largest nonprofit sector of any nation in the world (Salamon,
2012), playing an integral role in the lives of American citizens. In 2011, there were 2.3 million
nonprofit organizations in the U.S., with 1.6 million registered with the IRS—an increase of 21
percent from 2001 (Roeger, Blackwood, & Pettijohn, 2012). Those reporting organizations
account for $2.06 trillion in revenue and $4.49 trillion in assets in 2010 (Roeger, et al., 2012).
The sector accounts for $836.9 billion of the U.S. economy, or 5.6 percent of the gross domestic
product (GDP) and 8.3 percent of wages and salaries paid in the United States. Voluntary
contributions of time and money are another way of measuring the nonprofit sector’s size. In
2011, private giving from individuals, businesses and foundations exceeded $300 billion.
Furthermore, 26.8 percent of adults in the United States volunteered with a nonprofit
organization, and these volunteers contributed 12.7 billion hours, worth an estimated $259
billion (Roeger, et al., 2012).
In addition to the unique size, the U.S. nonprofit sector plays a distinctive public role and
embodies the democratic principles of civic engagement and pluralism. French political
philosopher Tocqueville identified the sector as “one of the most distinctive and critical features
of American life” (1840, as cited in Salamon, 1999, p.7), noting that citizens joined “voluntary
associations” when addressing social problems instead of turning to the government. In fact,
virtually all American social movements, such as those related to civil rights, children’s rights,
environmentalism, and women’s rights had their roots in nonprofit organizations (Salamon,
1994, p. 109).
Nonprofit organizations serve a wide range of public purposes and have a unique and
important relationship with the government. They enhance the arts, promote sports, protect

2
animals, and provide critical human services. These organizations fall under the Internal
Revenue Code 501(c)(3), reserved for organizations that operate for religious, charitable,
scientific, or educational purposes (Nonprofit Almanac, 2012). Of the registered nonprofit
organizations, 501(c)(3) public charities accounted for three-quarters of the sector’s revenue and
expenses and three-fifths of the assets in 2011. The government relies on the nonprofit sector to
deliver government funded human services. Almost 33,000 human service nonprofit
organizations contract with the government to deliver services (Boris, et al, 2010). Human
service nonprofit organizations held approximately 200,000 government contracts totaling more
than $100 billion in 2009 (Boris, et al., 2010). In fact, nonprofit organizations receive more
income from the government than from any other single source (Salamon, 2010).
Problem Statement
The United States depends heavily on the nonprofit sector, not only for public services,
but to provide citizens with critical human services. For example, child and family nonprofit
organizations, which are one subset with the human services subsector, serve some of the most
vulnerable citizens. Public support for these organizations is evident by their federal tax-exempt
status as a result of their orientation toward public purposes (Nonprofit Almanac, 2012).
Historically, nonprofit organizations have played an important role as the nation embraced a
democratic form of government. Involvement in the nonprofit organizations provides a means
through which individuals can address the complex needs of society and avoid total reliance on
the government to meet communities’ problems.
Just as the public policies of human services depend on a portion of nonprofit
organizations, the nonprofit sector depends on committed employees to achieve their mission
and organizational goals. Employees are nonprofit organizations’ greatest resource, investment,
3
and expense (Rutowski, Guiler, & Schimmel, 2009), so turnover is considered a critical problem
facing the nonprofit sector (Salamon, 2012). Retaining highly committed employees in this
important work has been of interest to those studying the nonprofit sector because it is a
significant problem particularly in the area of human services (Mor Barak, Levin, Nissly, &
Lane, 2006). Employees’ commitment and turnover intentions matter to nonprofit organizations
as they relate to progress toward the organizations’ mission and productivity (Harter, Schmidt,
Killham, & Agrawal, 2009) to the financial expense of turnover to the organization, and
potentially to organizational effectiveness (Abbasi & Hollman, 2000; Gray, Phillips, &
Normand, 1996). Turnover can have grave implications for vulnerable children and families
served within these human service organizations (Mor Barak et al., 2006). Affective
commitment and retention within nonprofit human service organizations are important factors of
success in public policy implementation for those citizens in greatest need.
Purpose of the Study
The purpose of this study is to examine the effects of transformational leadership and
organizational culture on two important issues facing the nonprofit sector: turnover intentions of
employees and their level of commitment to their organization. Employees who work within
child and family nonprofit organizations are the subjects of this study. The sampling frame
consists of employees from member organizations of the Alliance for Strong Families and
Communities, a national membership association for child and family nonprofit organizations.
The study does not intend to measure the impact of leadership and organizational culture on
overall effectiveness of nonprofit organizations.
Specifically, this quantitative cross-sectional study focuses on the perceptions and
attitudes of nonprofit employees who work with child and family nonprofit organizations using a

4
survey design. First, this study examines the nonprofit employees’ perception of their manager’s
transformational leadership behaviors and the relationship to affective commitment, and then to
turnover intention. Second, the study investigates the relationship of nonprofit employees’
perceived organizational culture type with their affective commitment and turnover intention.
Finally, the study examines whether there is a moderating effect of organizational culture types
on the relationship between transformational leadership and affective commitment, and then to
turnover intention.
Significance of Study
Staff turnover is “perhaps the most important problem” facing the wider nonprofit sector.
It is an ongoing and costly problem that negatively affects staff morale, teamwork, and
ultimately organizational success (Abassi & Hollman, 2000; Moynihan & Landuyt, 2008).
Turnover intention has implications for the organization even before an employee’s departure,
including negative employee attitudes, lowered commitment, absenteeism, and desire to leave
the human-services field (Blankertz & Robinson, 1997; R. Lee & Ashforth, 1996; Mor Barak,
Nissly, & Levin, 2001). Conversely, findings from the for-profit sector demonstrate that high
affective commitment is known to be positively associated with beneficial outcomes for the
organization (Mathieu & Zajac, 1990; Meyer & Allen, 1997; Mowday, Porter, & Spears, 1982).
The important relationship between public policy implementation and the nonprofit
sector explains why nonprofit organizations are exempt from federal income taxes by virtue of
their orientation toward public purposes (Nonprofit Almanac, 2012). Nonprofit organizations,
especially human services, have an integral role in implementing public policy where
government provisions of public goods and services are inadequate or nonexistent (Boris, 1999;
Young, 2006). The government relies on the nonprofit sector to deliver government-funded

5
human services. Employees of the government-funded nonprofit sector are, in essence, third-
party actors on behalf of government. Therefore, studies focused on the nonprofit sector are
increasing the need to know more about them for the effective implementation of policy.
There are several significant ways to study the nonprofit sector. For example, there has
been growing scholarly interest in the crossover between for-profit businesses and nonprofit
organizations, as the distinction between for-profit and nonprofit organizations is less evident
than in the past (Harris, 2012). Nonprofit organizations may engage in market-driven practices
to achieve financial sustainability and for-profits may engage in social causes (Harris, 2012).
This study explores the roles of leadership and organizational culture from the literature of for-
profit organizations and applies them to nonprofit organizations. A manager’s transformational
leadership strengthens organizational commitment and loyalty of followers (Bass, 1999), and
strengthened organizational commitment can decrease turnover intentions (Meyer, Stanley,
Herscovitch, & Topolnytsky, 2002; Stinglhamber & Vandenberghe, 2003). Additionally, unlike
other studies, this study examines both leadership and organizational culture, instead of one or
the other. Studying the relationship between leadership, organizational culture, and the
perceptions of the employees who work within them adds to the nonprofit literature.
Theoretical Framework Four central concepts undergird this study: transformational leadership theory, competing
values framework, turnover intention and organizational commitment. Each of these concepts is
thoroughly reviewed in chapter two. This brief description serves to introduce the questions and
hypotheses of the study.

6
Transformational Leadership
Transformational leadership is defined as a leadership approach that supports the
personal and professional growth in others through the use of inspiration, consideration for the
individual, intellectual stimulation, motivation, and influence. It intends to develop leadership in
others (Bass & Riggio, 2005). There are several reasons to examine transformational leadership.
Most importantly, research in the for-profit sector has found that it is a factor in employees’
intention to stay or leave an organization (Hughes, Avey, & Nixon, 2010; Rafferty & Griffin,
2004) and in their organizational commitment (Bycio, Hackett, & Allen, 1995).
Evidence has accumulated to demonstrate that transformational leadership can move
employees to exceed expected performance as well as lead to high levels of employee
satisfaction and commitment to the group and organization (Dvir, Eden, Avolio, & Shamir,
2002; Judge & Piccolo, 2004). Transformational leadership is a widely tested and well-
developed model of leadership. The most commonly used instrument in studies is the
Multifactor Leadership Questionnaire (MLQ-Form 5X), which asks employees to rate the
managers on transformational leadership behaviors. Leadership studies have found that
compared to transactional managers, more transformational managers achieve greater
improvements and are considered to be more effective with regard to employee effort,
commitment, and performance (Bass & Avolio, 1990). However, these studies do not address
the organizational culture through which the employees experience the leadership.
Competing Values Framework
At the root of any organization are the core values that most members share, and these
values drive the way acceptable behavior, decision-making, and success are defined and
measured. Organizational culture has been defined as “the set of shared, taken-for-granted
7
implicit assumptions that a group holds and determines how [the group] perceives, thinks about
and reacts to its various environments” (Schein, 1996, p.236). Organizational culture influences
the myriad actions and decisions employees make on a daily basis. The culture consists of the
unspoken rules and norms—simply put; it is the way things are done around here (Schein,
2010). One way to examine organizational culture is through the competing values framework.
The competing values framework (CVF) organizing taxonomy (Quinn, Cameron,
Degraff, & Thakor, 2006; Quinn & Rohrbaugh, 1983) is widely used in scholarly work on
organizational culture. The CVF was originally derived from several studies on organizational
effectiveness measures (Quinn et al., 2006; Quinn & Rohrbaugh, 1983) that focused on making
sense of effectiveness criteria and has since been validated and expanded upon (Cameron &
Quinn, 2006; Helfrich, Li, Mohr, Meterko, & Sales, 2007; Howard, 1998). The dimensions were
purported to represent competing core values that “represent what people value about an
organization’s performance” (Cameron & Quinn, 2011, p. 31).
The CVF posits that organizations experience competing demands and tensions along
two key dimensions: flexibility vs. stability and control, and internal maintenance vs. external
competitive positioning (Cameron & Quinn, 2006). These two dimensions provide cross
sections along two axes, creating four sets of values associated with one of four types of
organizational cultures: clan, adhocracy, hierarchy, and market. Through the CVF, an
organization’s cultural values can be determined and dominant culture type identified. When no
dominant culture emerges, the dominant culture is considered balanced.
Each of the four culture types has a cluster of characteristics that represent the
organization’s values that are communicated and reinforced with employees. While
organizations span all or most of the four types, each typically has a dominant culture. Clan

8
cultures, also referred to as collaborate cultures (Cameron & Quinn, 2006; Cameron & Quinn,
2011), combine a focus on flexibility and internal maintenance. Clan cultures are typically
friendly places to work and are associated with high morale and job satisfaction (Cameron &
Quinn, 2006; Cameron & Quinn, 2011). Adhocracy cultures, also referred to as create cultures,
combine a focus on flexibility with an external focus on competitive positioning. Adhocracy
teams are comfortable responding to changing external demand and dealing with ambiguous
situations. They also tend to be flexible and creative (Cameron & Quinn, 2006; Cameron &
Quinn, 2011). Market cultures, also referred to as compete cultures, combine a focus on stability
and control with external competitive market positioning. Hierarchical cultures, also referred to
as control cultures, emphasize stability and internal maintenance (Cameron & Quinn, 2006;
Denison & Spreitzer, 1991), and strong centralized management control (Cameron & Quinn,
2011).
Organizational Commitment
Organizational commitment is viewed as a stable attachment to the organization by the
employee over time, where the employee strongly identifies with, is involved in, and enjoys
membership in the organization (Meyer & Allen, 1991). Employees who are committed to the
organization internalize the organizational goals. An employee’s organizational commitment
relies upon his or her prediction of continued identification with and involvement in the
organization (Cooper-Hakim & Viswesvaran, 2005). However, it should be noted that
employees are committed to their organizations in different ways and for different reasons, and
this led scholars to investigate different types of organizational commitment.
Meyer and Allen (1991) developed a model of organizational commitment to provide a
framework and aid in interpreting research on organizational commitment. The model comprises

9
three different types of commitment: affective, continuance, and normative commitment.
Affective commitment is evident when an employee becomes emotionally attached to the
organization and perceives congruence between personal goals and the organization’s goals.
Employees with a strong affective commitment continue employment with the organization
because they want to (Meyer & Allen, 1997). Continuance commitment is evident when an
employee sees the relationship with the organization as a calculated view of exchanges.
Employees with a strong continuance commitment remain in the organization because they need
to do so (Meyer & Allen, 1997). Finally, normative commitment is demonstrated when an
individual commits to and remains with the organization because of feelings of obligation.
Employees with a strong level of normative commitment feel they ought to remain with their
organization (Meyer & Allen, 1997).
Affectively committed employees are seen as having a sense of belonging and
identification that increases their involvement in the organization’s goals and thus desire to
remain with the organization (Meyer & Allen, 1991; Mowday et al., 1982). Affective
commitment is known to be positively associated with beneficial outcomes for the organization
(Mathieu & Zajac, 1990; Meyer & Allen, 1997; Mowday et al., 1982); therefore, it is used as a
dependent variable in this study.
Turnover Intention
Turnover intention is defined as a conscious and deliberate willingness to leave an
organization (Tett & Meyer, 1993). One reason turnover intention is used is that it is a strong
and consistent predictor of actual turnover (Griffeth, Hom & Gaertner, 2000; Vandenberg &
Nelson, 1999). The intention to leave has implications for the organization even before the
employee’s actual departure. Shaw (2011) noted that high turnover rates have substantial

10
negative implications for organizations. While there is little data on the exact turnover rates in
nonprofit child and family organizations, it has been noted in the literature that child welfare
organizations have experienced high turnover rates, resulting in staff shortages, high caseloads,
and discontinuity in service, negatively impacting service to vulnerable youth and families
(American Public Human Services Association, 2005). A 2003 General Accounting Office
(GAO) report documented that staff shortages, high caseloads, high staff turnover, and low
salaries negatively affected the delivery of services to support the well being of children. This
report noted that staff turnover in child welfare organizations (both public and nonprofit) is
estimated to be 30 to 40 percent annually nationwide; the average length of employment is less
than 2 years. Others report turnover rates as high as 57 percent for some private agencies and 45
percent for some public child welfare agencies nationally (Williams, Nichols, Kirk, & Wilson,
2011).
Staff turnover is costly and can negatively affect staff morale, team performance,
productivity, and, potentially, organizational effectiveness (Abbasi & Hollman, 2000; Argote et
al., 1995; Gray et al., 1996; Shaw, 2011). Previous research has found that transformational
leadership is negatively associated with turnover intention (Bycio et al., 1995; Hughes et al.,
2010; Rafferty & Griffin, 2004). Intention to leave has consistently been linked to negative
employee attitudes, including commitment, absenteeism, and desire to leave the human services
field (Blankertz & Robinson, 1997; R. Lee & Ashforth, 1996; Mor Barak et al., 2001)

11
Research Questions and Hypotheses
This study takes the research supporting these concepts from the for-profit sector and
applies them to the non-profit sector. It expands the scope of previous research by looking at
perceptions of transformational leadership and organizational culture in the same sample and
their relationship with turnover and commitment. Unlike previous research, this study also
looks at the transformational leadership and organizational culture for their combined influences
on turnover and commitment. Thus, the questions driving this study and their related hypotheses
are:
1. Do employees’ perceptions of transformational leadership impact turnover intention
and organizational commitment in the nonprofit workplace?
H1: Perceived transformational leadership will positively predict organizational
affective commitment by the employee, controlling for position tenure, time
supervised by manager, gender, age, and position level.
H2: Perceived transformational leadership will negatively predict turnover intention
by the employee, controlling for position tenure, time supervised by manager, gender,
age, and position level.
2. Do employees’ perceptions of organizational culture impact turnover intention and
organizational commitment in the nonprofit workplace?

12
H3: Perceived organizational culture types (clan, hierarchy, adhocracy, market,
balanced) are predictive of employee’s turnover intention, controlling for position
tenure, time supervised by manager, gender, age, and position level.
H4: Perceived organizational culture types (clan, hierarchy, adhocracy, market,
balanced) are predictive of employee’s organizational affective commitment,
controlling for position tenure, time supervised by manager, gender, age, and position
level.
3. Do employees’ perceptions of organizational culture change how transformational
leadership impacts organizational commitment and turnover intention?
H5: Perceived organizational culture type is a statistically significant moderator of the
relationship between perceived transformational leadership style and employees’
affective commitment, controlling for position tenure, time supervised by manager,
gender, age, and position level.
H6: Perceived organizational culture type is a statistically significant moderator of the
relationship between perceived transformational leadership style and employees’
turnover intention, controlling for position tenure, time supervised by manager,
gender, age, and position level.
Outline of Remaining Chapters
Chapter one introduces the study and outlines the problem statement, purpose, research
questions, research significance, key term definitions, and underlying theories. Chapter two
reviews the pertinent literature through four sections: (a) nonprofit sector, (b) transformational

13
leadership, (d) organizational culture and competing values framework, and (e) organizational
commitment and affective commitment. Chapter three outlines the methodology, explaining the
procedures used to investigate the variables in five sections: (a) research design, (b) sample, (c)
instrumentation, (d) data collection, and (e) data analysis. Chapter four provides the response
rate, description of the data preparation, sample characteristics, and descriptive statistics.
Additionally, chapter four presents the results of the regression analyses and findings. Chapter
five provides a discussion of the findings, interpretations of both descriptive and hypotheses
findings, an examination of the benefits and limitations of the study, recommendations for
further study and a discussion of policy and practice implications.
14
Chapter 2: Literature Review
This chapter will provide a thorough review of the literature related to the nonprofit
sector, leadership, organizational culture, organizational commitment, and turnover intention.
The first section provides an overview of the nonprofit sector, focusing on its unique role in
American society and relationship to the government. The second section gives a review of
several leadership definitions and theories, with particular attention to transformational
leadership theory. The third section describes organizational culture, including the theory of the
competing values framework. The fourth section provides a review of the employee outcome
variables: organizational commitment and turnover intention. The fifth section outlines the
literature pertaining to all these variables and relates them to the questions and hypotheses of the
study.
The United States Nonprofit Sector
Nonprofit organizations have a rich and important history in American society. Salamon
(2002) characterized the nonprofit sector as “the life force that has long been a centerpiece of
American culture” (p. 3). The underpinnings of America’s relationship with the nonprofit sector
can be traced to the espoused core beliefs of its founding fathers. The United States
Constitution, with its ideals and desired aims, was a vast departure from the once familiar British
monarchy. This movement away from a strong central government and an emphasis on self-
reliance, self-responsibility, and individual rights of its people led to the beginnings of a
democracy and development of “voluntary associations” or early nonprofit organizations
(Salamon, 2002). The prominence of nonprofit organizations was due in part to this emphasis
and to the fact that American society came into existence before government was established.
The hostility toward centralized authority felt by many immigrants made a virtue of joining

15
volunteer groups to address public problems (Salamon, 2002). Currently, the nonprofit sector
provides a means for citizens to connect to the democratic processes of our society. The
nonprofit sector epitomizes the American values of democratic pluralism, civic engagement, and
individualism (Boris & Steuerele, 2006). Involvement in the nonprofit sector can provide a
means through which individuals can address and express the complex needs of society and
avoid total reliance on the government to meet the communities’ problems (Eikenberry &
Kluver, 2004).
Similar to government institutions, nonprofit organizations serve public purposes and
addresses critical human needs. Frenchman Alexis de Tocqueville wrote about Americans’
propensity for addressing these needs and solving problems through voluntary associations,
which were early forms of nonprofit organizations, in Democracy in America in 1840, stating:
Americans of all ages, all conditions, and all dispositions constantly form associations.
They have not only commercial and manufacturing companies, in which they take part,
but associations of a thousand other kinds, religious, moral, serious, futile, general or
restricted, enormous or diminutive. The Americans make associations to give
entertainments, to found seminaries, to build inns, to construct churches, to diffuse books,
to send missionaries to antipodes; in this manner they found hospitals, prisons, and
schools. If it is proposed to inculcate some truth or foster some feeling by the
encouragement of a great example, they form a society. Wherever the head of some new
undertaking you see the government in France, or a man of rank in England, in the United
States you will be sure to find an association. (1840/1945, p.106)
16
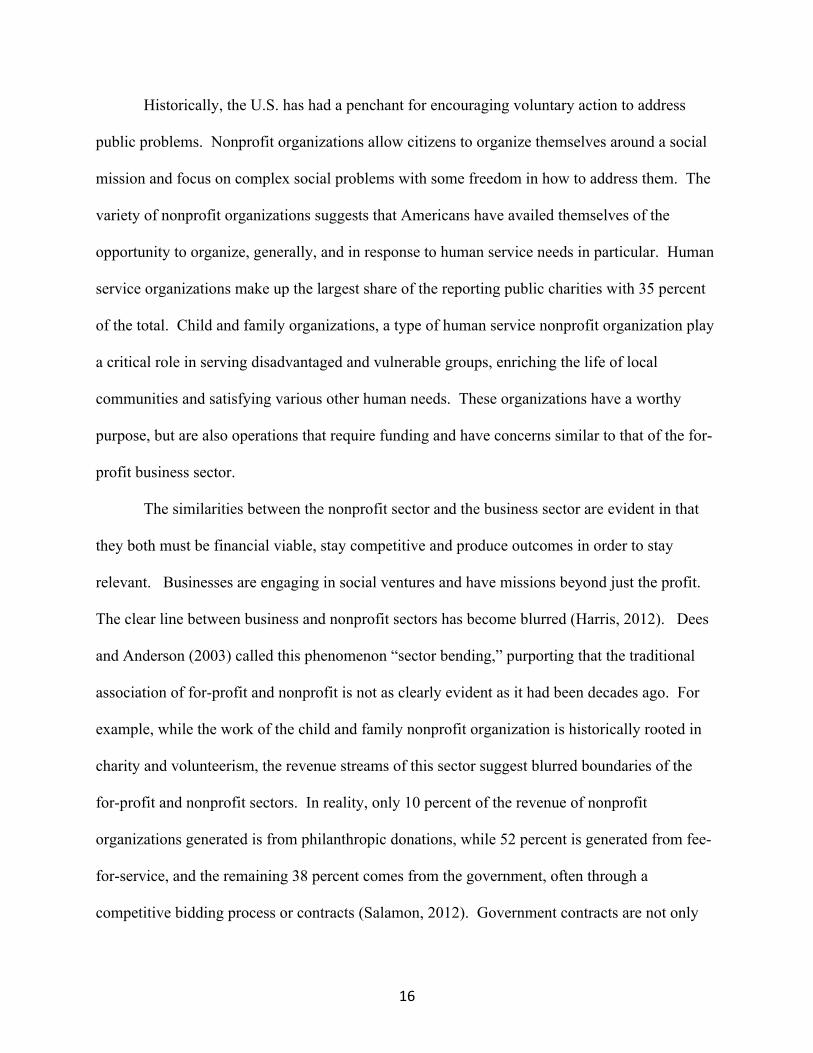
Historically, the U.S. has had a penchant for encouraging voluntary action to address
public problems. Nonprofit organizations allow citizens to organize themselves around a social
mission and focus on complex social problems with some freedom in how to address them. The
variety of nonprofit organizations suggests that Americans have availed themselves of the
opportunity to organize, generally, and in response to human service needs in particular. Human
service organizations make up the largest share of the reporting public charities with 35 percent
of the total. Child and family organizations, a type of human service nonprofit organization play
a critical role in serving disadvantaged and vulnerable groups, enriching the life of local
communities and satisfying various other human needs. These organizations have a worthy
purpose, but are also operations that require funding and have concerns similar to that of the for-
profit business sector.
The similarities between the nonprofit sector and the business sector are evident in that
they both must be financial viable, stay competitive and produce outcomes in order to stay
relevant. Businesses are engaging in social ventures and have missions beyond just the profit.
The clear line between business and nonprofit sectors has become blurred (Harris, 2012). Dees
and Anderson (2003) called this phenomenon “sector bending,” purporting that the traditional
association of for-profit and nonprofit is not as clearly evident as it had been decades ago. For
example, while the work of the child and family nonprofit organization is historically rooted in
charity and volunteerism, the revenue streams of this sector suggest blurred boundaries of the
for-profit and nonprofit sectors. In reality, only 10 percent of the revenue of nonprofit
organizations generated is from philanthropic donations, while 52 percent is generated from fee-
for-service, and the remaining 38 percent comes from the government, often through a
competitive bidding process or contracts (Salamon, 2012). Government contracts are not only

17
competitive but are also increasingly performance based, with pay being tied to outcomes. These
nonprofit organizations are businesses that have challenges and tensions that, in many ways, are
similar to their for-profit counterparts.
Child and family nonprofit organizations, like other nonprofit and for-profit
organizations, have pressures related to financial health and sustainability, attracting and
retaining the best talent, and accountability to and producing for their funders and referral
sources. In fact, the role of the nonprofit sector has evolved to address market pressures such as
competition for clients, marketing, attracting highly qualified and effective employees, and
attracting investors (Salamon, 1999). The financial pressures are mounting from a political and
economic standpoint as well. In addition to a competitive market, proposals to cap federal tax
deductions for philanthropic contributions and a growing number of tax deductions imposed by
various states have led to this financial pressure (Salamon, Gellar, & Newhouse, 2012).
Defining Leadership
Perspectives on and definitions of leadership have evolved as scholarly attention has
focused on the topic over the past 60 years. Leadership has been conceptualized in terms of
leaders’ personal traits and characteristics, power, authority, position, and skills. Further,
perspectives on leadership have moved to a focus on the leader–follower relationship as well as
emerging theories related to the nonhierarchical process orientation of leadership. The shift was
highlighted when Heifetz (1994) stressed that while leadership can be exhibited from a person in
authority, it is not required, nor does the position or traits define a leader; leadership involves the
dynamic and influential relationship between the person exhibiting leadership and groups of
people, where power and leadership are shared and dynamic. Various scholars have offered their
perspectives on leadership resulting in various definitions (see Table 1).

18
Northouse (2012) drew upon the various components central to leadership including
leadership (a) as a process, (b) involving influence, (c) occurring in a group context, and (d)
involving goal attainment. From this, he developed a concise definition of “a process whereby
an individual influences a group of individuals to achieve a common goal” (p. 3). This definition
is important because it represents movement through the evolution of leadership theories to a
more modern conceptualization. As much as the definition describes what leadership is, it also
implies what leadership is not, including a position, authority, or power.

19
Table 1
Definitions of Leadership
Source Definition
Bass, 1999 “Transformational leadership refers to the leader moving the follower beyond immediate self-interests through idealized influence (charisma), inspiration, intellectual stimulation, or individualized consideration” (p. 11).
Burns, 1978 “Leadership is the reciprocal process of mobilizing…various economic, political and other resources…in order to realize goals…mutually held by both leaders and followers” (p. 425).
Ciulla, 1998 Leadership is not a person or a position. It is a complex moral relationship between people based on trust, obligation, commitment, emotion, and a shared vision of the good.
Greenleaf, 1977
“The servant-leader is a servant first…Do those served grow as persons? Do they, while being served, become healthier, wiser, freer, more autonomous, more likely themselves to become servants? And, what is the effect on the least privileged in society; will they benefit or at least, not be further deprived? (p. 7).
Heifetz, 1994, 2002
Leadership involves the dynamic and influential relationship between leader (with or without positional authority) and groups of people.
Kouzes & Posner, 2011
“Leadership is a relationship between those who aspire to lead and those who choose to follow. It’s the quality of relationship that matters most when we’re engaged in getting extraordinary things done” (p. 24).
Northouse, 2012
“Leadership is a process whereby an individual influences a group of individuals to achieve a common goal” (p. 3).
Pearce & Conger, 2003
“Shared leadership is a dynamic, interactive influence process among individuals in groups for which the objective is to lead one another to the achievement of group or organizational goals. This process can involve peer, lateral influence as well as upward or downward hierarchical influence” (p. 1).
Rost, 1993 “Leadership is an influence relationship among and followers who intend real changes that reflect their mutual purposes” (p. 102)
Cohen & Tichy, 1997
“Leadership is the capacity to get things done through others by changing people’s mindset and energizing them to action” (p. 44).
Yukl, 2006 “Leadership is the process of influencing others to understand and agree on what needs to be done and how to do it, and the process of facilitating individual and collective efforts to accomplish shared objectives” (p. 8).

20
Transformational Leadership
This study focuses on one type of leadership, called transformational leadership.
Transformational leadership focuses on raising the level of one’s awareness, influencing others
and self to transcend self-interest for the benefit of the team, and to motivate others to achieve
more than they thought possible (Arnold, Turner, Barling, Kelloway, & McKee, 2007; Bass,
1998; Bass & Riggio, 2005). Transformational managers are those who stimulate and inspire
others to both achieve extraordinary outcomes and, in the process, develop their own leadership
capacity as well. Transformational leadership concentrates on long-term rather than short-term
goals and places value on developing a vision or inspiring and encouraging followers to pursue
this vision (Bass & Riggio, 2005). Those leading are also transformed also in this reciprocal
relationship. Transformational managers support others to grow and develop their leadership by
responding to their individual needs. These managers align the objectives and goals of the
individual employees, the manager, the group, and the larger organization (Bass & Riggio,
2005).
Burns (1978) first introduced the concept of transforming leadership in his descriptive
research focused on political leaders in his seminal book Leadership. This concept was later
applied to managers and supervisees in organizational behavioral studies as well (Bass & Riggio,
2005). Burns described transforming leadership stresses the mutual, reciprocal relationship
between a leader and followers whereby the motivation and the morality of both the leader and
the followers are raised to higher levels (Burns, 1978). This relationship results in higher
potential in both parties as well as greater capacity for change. Transforming leadership is
contrasted with transactional leadership, which describes the relationship based on a transaction
or exchange between a leader and follower, such as giving a raise for meeting certain

21
performance standards. A key belief of transactional managers is that employees are motivated
by rewards and avoidance of punishment. According to Burns, the transforming approach
creates significant change in the life of people and organizations by influencing employees’
perceptions and values, and changing expectations and aspirations.
Burns noted the differentiation between management and leadership and claimed that the
differences are in characteristics and behaviors. He established two concepts: transforming
leadership and transactional leadership. According to Burns, the transforming approach creates
significant change in the life of people and organizations by influencing perceptions and values,
and it changes expectations and aspirations of employees. Unlike the transactional approach,
transforming leadership is not based on a give-and-take relationship but on the leader’s
personality, traits, and ability to make a change through setting an example, articulating an
energizing vision, and establishing challenging goals. Transforming leadership is a process in
which those leading and those following help each other to advance to a higher level of morale
and motivation (Burns, 1978). This relationship results in higher potential in both parties as well
as a greater capacity for personal and professional growth. Transforming leadership is contrasted
with transactional leadership, which describes the relationship based on a transaction or
exchange between a leader and a follower, such as giving a monetary raise for meeting certain
performance standards.
Bernard Bass (1985, 1998), an academician trained in industrial psychology, was
influenced by Burns and by House’s theory (1971) of charismatic leadership. Bass is largely
credited with further developing and influencing the theory of transformational leadership (Hunt,
1999; Miner, 2005; Yukl, 2013). As opposed to Burns, Bass did not see transformational and
transactional leadership as mutually exclusive; instead, he identified a range of leadership

22
behaviors and recognized that managers will exhibit varied leadership behaviors. Transactional
and transformational leadership are two of the primary components of Bass and Avolio’s full-
range leadership theory (Antonakis & House, 2002). The full range of leadership extends from
passive to laissez-faire, transactional, and transformational leadership. Passive leadership is the
least and transformational leadership the most effective and satisfying (Antonakis & House,
2002). Both types of leadership have been defined primarily in terms of their component
behaviors: intellectual stimulation, individualized consideration, inspirational motivation, and
idealized influence.
Bass (1985) also indicated that there are four different components of transformational
leadership:
1. Intellectual stimulation: Those exhibiting transformational leadership not only
challenge the status quo; they also encourage creativity, new ways of doing things,
and new opportunities to learn.
2. Individualized consideration: Transformational leadership also involves offering
support and encouragement to individual followers. In order to foster supportive
relationships, managers who exhibit transformational leadership keep lines of
communication open so that others feel free to share ideas and receive recognition for
their unique contributions.
3. Inspirational motivation: Those exhibiting transformational leadership have a clear
vision that they are able to articulate well. They help others to use their passion and
motivation to fulfill common goals.

23
4. Idealized influence: Those exhibiting transformational leadership serve as a role
model for others. Because trust and respect is established, others emulate the these
individuals and internalize his or her ideals.
Transformational leadership is a widely tested and highly developed model of leadership.
The Multifactor Leadership Questionnaire (MLQ Form 5X-short) is the most commonly
employed measure of transformational and transactional leadership styles (Avolio, Bass, & Zhu,
2004). The manager’s effect on both the personal and intellectual development of self and others
is measured. The current version of the MLQ Form 5X includes 36 items that are broken down
into 9 scales with 4 items measuring each scale (see Table 2). For this study, only the
transformational questions were used (20 items) to determine the perceived level of
transformational qualities of the manager.
Table 2
MLQ scales and subscales
Multifactor Leadership Questionnaire 5x Short (Transformational Measures)
Subscale Description
Transformational Measures
Idealized influence (attribute) Motivates pride and respect from associating with her or him
Idealized influence (behavior) Shares values, mission, and vision
Inspirational motivation Exhibits enthusiasm and optimism about goals and vision
Intellectual stimulation Exhibits new and innovative ways of resolving issues and achieving goals
Individualized consideration Understands and treats each individual uniquely
_____________________________________________________________________________
Note. Avolio, Bass, and Zhu, 2004.

24
The body of research supporting the benefits of transformational leadership is extensive.
Leadership studies have found that compared to transactional managers, more transformational
managers achieve greater improvements and are considered more effective with regard to
employee effort attitudes and performance (Bass & Avolio, 1990). Studies have indicated
positive relationships between transformational leadership and perceived leader effectiveness
and employee satisfaction with the leader (Bono & Judge, 2004; Viator, 2001). Studies have
also confirmed that transformational leadership is positively related to willingness to put forth
extra effort in job performance (Bono & Judge, 2003; Dvir et al., 2002; Fuller, Patterson, Hester,
& Stringer, 1996; Hater & Bass, 1988; D. Jung & Sosik, 2002; Keller, 1992; McColl-Kennedy &
Anderson, 2002; Sosik, Potosky, & D. Jung, 2002; Viator, 2001). Oberfield (2014) performed a
7-year longitudinal study across public organizations with findings supporting increased
organizational improvement with increased transformational leadership behaviors.
There has been some criticism of transformational leadership including observations that
some effective managers do not necessarily conform to a transformational leadership style and
that their behaviors are not fully captured in any currently identified styles (Avolio, Gardner,
Walumbwa, Luthans, & May, 2004). Weaknesses of the transformational theory include some
problems in methodology, lack of clarity on how followers respond to the leaders’ vision, and
failure to explain the nature of effective strategic leadership in organizations (Northouse, 2012;
Yukl, 2006). Another weakness is that virtually all the studies examined the leadership style of a
person within a position of authority. While this is likely a product of hierarchical structure in
most organizations, it does not address the leadership without authority. Additionally, most of
these studies did not address the organizational culture through which employees experienced the
leadership and might have gleaned their commitment to the organization and desire to remain in

25
their organization. Transformational leadership has rarely applied to the nonprofit sector
(Riggio, Bass, & Orr, 2004).
Organizational Culture
Scholars have not reached consensus on how to define or measure organizational culture
(Cooke & Rousseau, 1988; Hofstede, Neuijen, Ohayv, & Sanders, 1990; Schein, 2010).
However, researchers seem to agree that organizational culture is likely an important factor in
employee workplace behaviors (e.g., Cameron & Quinn, 2011; Denison & Mishra, 1995; Schein,
1990). Organizational culture is broadly understood and conceptualized as being shared among
members (Glisson & James, 2002), existing at multiple levels, including group and
organizational levels (Detert, Schroeder, & Mauriel, 2000) and influencing employees’ attitudes
and behaviors (Schein, 1990, 2010; Smircich, 1983).
Drawing on these components, organizational culture has been defined as the shared
basic assumptions, values, and beliefs that characterize a setting and are taught to newcomers as
the way to think and feel, communicated by myths and stories people tell about how the
organization came to be the way it is and how they solve problems (Schein 2010, Trice & Beyer,
1993). It is within the organizational culture that values are embedded and behaviors are
reinforced or reproved, subtly or overtly (Schein, 2010).
The construct of culture has its roots in the study of anthropology, sociology, and
psychology (O’Reilly, Chatman, & Caldwell, 1991; Trice & Beyer, 1993). It was later found to
be a central concept in organizational behavior studies. The term organizational culture first
appeared in management academic literature in 1979 in the article “On Studying Organizational
Culture,” by Andrew Pettigrew in Administrative Science Quarterly, and has been studied
extensively since. Pettigrew (1979) provided a perspective on organizations, describing the

26
culture as the amalgam of beliefs, identity, rituals and myths within an organization. This early
conceptualization has clearly influenced the evolution of the study of organizational culture
today.
Schein (1990, 2010) highlighted the issue of organizational culture having levels,
proposing three: (a) artifacts and symbols, (b) espoused values, and (c) underlying assumptions.
The first layer, artifacts, represents the outer layer of the culture and is most visually identifiable.
Artifacts include rituals, language, myths, dress, and the organization of space (Schein, 2010).
Symbols are demonstrated through the interactions, words, gestures, and pictures that have a
specific meaning to organizational members (Hofstede, 2010; Schein, 2010). The second layer,
espoused values, involves the values purported by management as core to the organization
(Schein, 2010). Organizational values are the broad tendencies that are preferred among its
members (Hofstede, 2001). Espoused values are those values that are typically written and set
by the top managers of the organization but may or may not reflect the values of the members
(Bourne & Jenkins, 2013). The most influential values of an organization are unwritten and are
often unconsciously held beliefs that guide decisions (Bourne & Jenkins, 2013). Similarly,
Schein (2010) referred to these as assumptions. The third layer involves the underlying
assumptions of an organization. This involves the reasons why members go about their day-to-
day work, how they interpret what they experience, and what they should pay attention to
(Schein, 2010). They are so ingrained that they are difficult to articulate, requiring in-depth
interviewing to draw out from members.
Researchers have been widely considered organizational culture to be one of the most
important factors to influence an organization and its employees (Kloot & Martin, 2007;
Mannion, Davies, & Marshall, 2005; Morgan & Ogbanna, 2008). There have been several

27
instruments developed to measure various aspects (Cameron & Quinn, 2011; T. Jung et al.,
2009). One way to distinguish among methodological approaches to measuring culture is to
understand the two perspectives that organizations have cultures and organizations are cultures
(Schneider, Ehrhart, & Macey, 2013; Smircich, 1983). When a researcher views an organization
as having or possessing a culture, the research is focused on description and depth of
understanding about the way in which organizations function. These types of studies are almost
exclusively qualitative in nature (Ott & Shafritz, 1996) and studied in the anthropological and
sociological tradition of a single-organization case study. The time intensiveness and limited
generalizability of these qualitative methods are challenges to this qualitative approach.
When the research lens is framed as organizations are or embody cultures, the studies
have focused more on how the divergent cultures impact specific measures, such as
organizational effectiveness or employee attitude and behaviors (Cameron & Quinn, 2011;
Denison & Mishra, 1995; Schein, 1990). These studies have typically accessed quantitative
methods of research. Current research on organizational culture has been dominated by
quantitative studies, and some have utilized a mixed method. The most common method for
quantitatively capturing culture information has been through the use of survey assessments, as is
the case with this study.
Competing Values Framework
Competing values framework offers one method that approaches organizations as
embodying culture with a particular emphasis on cultural characteristics and organizational
outcomes. Competing values framework is a widely cited approach and organizing taxonomy to
examining organizational culture (Quinn et al., 2006; Quinn & Rohrbaugh, 1983). This
framework was originally derived from several studies on organizational effectiveness measures

28
to organize and make sense of effectiveness criteria (Quinn & Rohrbaugh, 1983). The
dimensions of culture were purported to represent competing core values that represent the
values held about an organization’s performance (Cameron & Quinn, 2006), and the model has
been further developed to capture the complexities of organizational culture (Cameron & Quinn,
2006).
The competing values framework posits that organizations experience competing
demands and tensions along two key dimensions: flexibility vs. stability and control, and internal
maintenance vs. external competitive positioning (Cameron & Quinn, 2006). These two
dimensions provide cross sections along two axes to create four sets of values associated with
one of four types of organizational cultures: clan, adhocracy, hierarchy, and market cultures.
Instruments have been created to measure organizational culture based on this framework. One
such tool is the organizational culture assessment tool (OCAI) (Cameron & Quinn, 2011). An
organization’s cultural values can be determined and a dominant culture type identified. The
four culture types each have a cluster of characteristics that represent the organization’s values
and thus what they communicate and reinforce to employees. While organizations span all or
most of the four types, each typically has a dominant culture type.
Clan cultures. Organizations with clan cultures, also referred to as collaborate cultures,
group, or team cultures (Helfrich et al., 2007) are typically friendly places to work, emphasizing
teamwork, attachment, membership, and collaboration, and they combine a focus on flexibility
and internal maintenance (Cameron & Quinn, 2006; Zammuto & O’Connor, 1992). Clan
cultures are associated with high morale, commitment, and job satisfaction (Cameron & Quinn,
2011). In clan cultures, there is the pervasive belief that “organizations succeed because they
hire, develop, and retain their human resource base” (Cameron & Quinn, 2006, p. 38). Group

29
dynamics and belonging to the group are strongly held values of this culture type.
Organizational practices focus on strengthening organizational commitment, team cohesion,
employee engagement, and development. Organizations that have a dominant clan culture
encourage participation and involvement and thus are associated with positive employee-level
attitudinal outcomes (Hartnell, Ou, & Kinicki, 2011).
Adhocracy cultures. Adhocracy cultures have an externally focused emphasis on
flexibility (Cameron & Quinn, 2006). Employees are oriented toward change and adaptation
with an eye toward competitive positioning and growth. Employees are encouraged to push the
boundaries, break rules, and go against conventional wisdom to build future success. The
underlying assumption in an adhocracy culture is that innovation and constant change are the
keys to becoming a market leader (Cameron & Quinn, 2006). Leadership supports
entrepreneurial ventures and risk-taking, and inspires creativity in employees. Adhocracy
cultures have a positive effect on aggregated employee attitudes related specifically to the central
value of autonomy (Hartnell et al., 2011). Autonomy through job design is a motivating work
characteristic that indirectly enhances employees’ attitudes toward the organization (Humphrey,
Nahrgang, & Morgeson, 2007).
Hierarchical cultures. Hierarchical cultures, also referred to as control cultures,
emphasize internally focused control and combine a focus on stability with internal maintenance
(Cameron & Quinn, 2006; Zammuto & O’Connor, 1992). Organizational strategies are inwardly
focused. The key assumption is that control and efficiency lead to success (Cameron & Quinn,
2006). Organizational practices focus on standardization, minimizing errors and uncertainty, and
increasing consistency. Strict guidelines tend to regulate behaviors, and employees value job
security in this somewhat rigid environment (Gregory, Harris, Armenakis, & Shook, 2009).

30
Conservative, cautious, and logical leadership and decision-making styles that encourage
predictability are encouraged (Cameron & Quinn, 2006; Zammuto & O’Connor 1992).
Market cultures. Market cultures, also referred to as compete cultures, emphasize an
orientation toward competitive positioning and a focus on stability with external market
positioning (Cameron & Quinn, 2006; Zammuto & O’Connor, 1992). Goal attainment is highly
valued in this culture. Organizational practices emphasize a focus on satisfying customer
demands, competing aggressively to expand market share and rapidly responding to the demands
of the marketplace (Cameron & Quinn, 2006). These cultures value productivity, achievement,
competence, and beating the competition. Some of the behaviors associated with market cultures
include planning, centralized decision making, and articulation of clear goals. Leadership styles
encouraged in market cultures are hard driving, aggressive, directive, and goal oriented
(Cameron & Quinn, 2006).
Figure 1. Competing values framework culture types. Adapted from Cameron and Quinn, 2006.

31
Schein (2010) recognizes that cultures are developed, in part, based on the members’ (or
employees’) espoused core values. Members of the organization demonstrate their core and
shared values, in response to the competing demands and tensions. Salamon (2012)
acknowledges these tensions exist, suggesting nonprofit organizations are operating with
conflicting identities and are forced to adapt to several internal and external demands.
These tensions and demands exist for a variety of reasons. Nonprofit organizations have
a rich tradition based in grassroots efforts, volunteerism and social movements. The sector has
historically addressed adaptive challenges – that is, complex civic challenges that are not easily
solvable (Heifetz, 2010). This requires a level of external focus as well as flexible and adaptable
thinking. But as the community needs, funding sources, and regulations change, the sector has
had to adapt (Salamon 2012). For example, there are changes related to regulations demanded
by various funding sources, such as Medicaid and commercial insurance. This has led to need
for organizations to respond with and create some value for internal controls and bureaucracy in
order to survive. There is more competition from both for-profit and nonprofit human service
providers, leading to a market-based or commercialism impulse. These internal and external
demands, in some ways, mirror the internal and external tensions that Cameron and Quinn
suggest is central to the competing values framework (2006).
Salamon (2012) highlighted the competing tensions in the nonprofit sector by suggesting
four impulses of the sector related to volunteerism, commercialism, civic activism, and
professionalism:
1. Volunteerism impulse: The impulse of volunteerism reflects the role of the sector to
transform individuals and alleviate suffering through counseling, material assistance

32
and other support. The leadership style of the manager is informal, paternalistic,
spiritual, and volunteer dominant. The informal, paternalistic management style
reflects clan cultures from the competing values framework.
2. Professionalism impulse: The professionalism impulse, contrary to volunteerism,
emphasizes specialized, formal training of paid professionals who deliver treatment
often through a medical model resulting from funding mechanisms (e.g., Medicaid).
The professionalism management style is formal, rule bound, and bureaucratic. The
management style mirrors that of a hierarchical culture from the competing values
framework.
3. Commercialism impulse: The commercialism impulse relates to the sector’s
relationship to the market and the need to operate efficiently and effectively. The
commercialism leadership style of the manager is often entrepreneurial, efficiency
oriented, profit focused, and measurement driven. The profit-oriented approach
indicated in this management style is reminiscent of the style in a market culture.
4. Civic activism impulse: The civic activism impulse emphasizes economic, political,
and social power differentiation and its impact on individuals. The focus of the work
is on mobilizing social and political pressure to address the imbalances of
opportunities among citizens. The management style is participatory, consensual and
conflict engaging. This style is reflective of the adhocracy culture.

33
Figure 2. Four Impulses of Nonprofit Organizations. Adapted from Salamon, 2012.
Employee Variables
Whether in for-profit or nonprofit organizations, employees’ commitment and turnover
intention potentially impact organizational effectiveness (Abbasi & Hollman, 2000; Argote et al.,
1995; Gray et al., 1996). The relationships among employee turnover, organizational
commitment, and organizational performance are most often explained using human and social
capital theories (Shaw, Duffy, Johnson, & Lockhart, 2005) that contend that more experienced
employees accumulate knowledge and skills through extended practice, training, and experience
(Kacmar, Andrews, Van Rooy, Steilberg, & Cerrone, 2006). In addition, committed employees
with the intention to stay, build networks of interpersonal relationships and quality social ties to
other employees and stakeholders, which provide the potential to unite groups around collective
organizational goals. Human and social capital is believed to be particularly critical to the
effectiveness of human services nonprofit organizations because they often rely on relationship-

34
based techniques and technologies to achieve goals (Collins-Camargo, Ellet, & Lester, 2012).
Therefore, turnover intention and affective organizational commitment was used as dependent
variables for this study.
Organizational Commitment
Organizational commitment has been the subject of considerable research over the past
two decades (Klein, Molloy, & Cooper, 2009) and it has been associated with several
organizational outcomes impacting performance (Cooper-Hakim & Viswesvaran, 2005; Mathieu
& Zajac, 1990; Meyer et al., 2002). Organizational commitment is viewed as a stable attachment
to the organization by the employee over time, where the employee strongly identifies with, is
involved in, and enjoys membership with the organization (Allen & Meyer, 1996). Luthans
(2006) stated that organizational commitment is “an attitude reflecting employees’ loyalty to
their organization and is an ongoing process through which organizational participants express
their concern for their organization and its continued success and well-being” (p. 147). It has
sometimes been referred to as the psychological tie between the employee (Verkhohlyad &
McLean, 2012) and the organization that impacts the likelihood that an employee will remain at
the organization and become a high performer (Allen & Meyer, 1996; Meyer et al., 2002).
Organizational commitment is of high interest to those involved in the nonprofit sector
because highly committed employees are more likely to exhibit desirable workplace behaviors,
including willingness to remain, and to potentially become high performers and exert extra effort
(Organ & Ryan, 1995). Employees who are committed to the organization internalize the
organizational goals. An employee’s organizational commitment relies upon his or her
prediction of continued identification with and involvement in the organization (Cooper-Hakim
& Viswesvaran, 2005). However, it should be noted that employees are committed to their

35
organizations in different ways and for different reasons, and this has led scholars to investigate
different types of organizational commitment.
Meyer and Allen (1991) developed the three-component model of organizational
commitment to provide a framework for and aid in interpreting research on organizational
commitment. They contended that there are three different types of commitment: affective,
continuance, and normative. Each corresponds with three different mindsets related to emotional
attachment, perceived costs, and obligation to the organization. Meyer and Allen (1991)
developed the Organizational Commitment Questionnaire (OCQ) that measures these three types
of commitment. Affective commitment is evident when employees become emotionally attached
to the organization, and they perceive congruence between personal goals and organizational
goals. Employees with a strong affective commitment continue employment with the
organization because they want to (Meyer & Allen, 1997). Continuance commitment is evident
when an employee sees the relationship with the organization as a calculated view of exchanges.
Employees with a strong continuance commitment remain in the organization because they need
to do so or the cost of leaving is seen as too high (Meyer & Allen, 1997). Finally, normative
commitment is demonstrated when an individual commits to and remains with the organization
because of feelings of obligation. Employees with a strong level of normative commitment feel
they ought to remain with the organization (Meyer & Allen, 1997).
Research has consistently demonstrated that those with high affective commitment who
want to stay tend to perform at a higher level than those with lower affective commitment scales
(e.g., Allen & Meyer, 1996, 2000; Meyer et al., 2002). Affective commitment has been defined
as “an attitude of emotional dedication to organizations” (Grant, Dutton, & Rosso, 2008, p.
898). The employees who remain because they feel obligated (high normative commitment)

36
outperform those who feel no such obligation (low normative commitment); the effect is not as
strong as those with a desire to stay (high affective commitment). Lastly, employees who stay
because of the costs associated with leaving (e.g., benefits, salary, no better opportunities) often
have little incentive to do anything more than are required of them to retain their positions.
Affectively committed employees are seen as having a sense of belonging and
identification that increases their involvement in the organization’s goals and thus desire to
remain with the organization (Meyer & Allen, 1991; Mowday et al., 1982). There has been
empirical support demonstrating that affective commitment is linked with job satisfaction,
competence, loyalty, and job performance more so than continuance or normative commitment.
Allen and Meyer (1996) reported extensive evidence linking affective commitment to turnover
intention and turnover behavior. Overall, affective organizational commitment is the most
widely studied form of commitment because this form has greater reliability and validity than
normative and continuance (Lavelle et al., 2009).
Commitment theorists have often identified leadership as a factor in the development of
employees’ organizational commitment (Meyer & Allen, 1997; Wayne, Coyle-Shapiro,
Eisenberger, Liden, Rousseau, & Shore, 2009). Because affective organizational commitment is
known to be most positively associated with positive outcomes for the organization, this form of
commitment was used for this study as a dependent variable.
Turnover Intention
Turnover intention is defined as the degree to which the respondent intends to leave his
or her position in an organization in the near future (Tett & Meyer, 1993). Actual turnover may
be involuntary or due to external factors (e.g., moving out of the area, spouse’s job change);
however, most turnover is related to job-related factors (Mor Barak et al., 2001). It has been

37
confirmed that turnover intention is a strong and consistent predictor of actual turnover, at least
in the for-profit sector (Griffeth et al., 2000; Vandenberg & Nelson, 1999).
Staff turnover is costly and can negatively affect staff morale, team performance,
productivity, and, potentially, organizational effectiveness (Abbasi & Hollman, 2000; Argote et
al., 1995; Gray et al., 1996). As Egan, Yang, and Bartlett (2004) noted, decreased turnover may
lead to increased organizational performance and a reduction in costs associated with job-
specific knowledge, hiring, and the retraining of replacement employees. Further, this retraining
of new employees requires additional time for the managers to support them and typically
diminishes productivity for a period of time for the manager as they support the new employee.
Studies of the relationship between turnover and performance in organizational literature support
this view, noting that turnover rates are negatively and linearly associated with a wide range of
organizational outcomes (Shaw et al., 2005; Strober, 1990). The financial expense of turnover to
the organization is another reason nonprofit managers care about these measures. Previous
research has found that transformational leadership is negatively associated with turnover
intention (e.g., Bycio et al., 1995; Hughes et al., 2010; Rafferty & Griffin, 2004) and moderates
the effect of organizational climate on turnover intention (Aarons & Sawitzky, 2011).
Implications of the Literature
Previous studies have linked transformational leadership to organizational commitment
and worker engagement (Zhu, Avolio, & Walumbwa, 2009) and to turnover intention (Bycio et
al., 1995; Hughes et al., 2010; Rafferty & Griffin, 2004). Yukl (2013) noted that
transformational leadership brings changes in the attitudes and behaviors of organizational
members and induces commitment to the organization’s mission and goals. Kim (2014) found
that transformational leadership had a significant positive effect on affective organizational

38
commitment for employees of local governments in South Korea. Jackson, Meyer, and Wang
(2013) also found a positive relationship between transformational leadership and affective
organizational commitment in a meta-analytic study across different cultures.
Research on transformational leadership has been robust but primarily focused on the for-
profit and governmental sectors. Transformational leadership theory is relevant and has value
for the nonprofit sector. Riggio and Smith-Orr (2004) called for more research focused on
transformational leadership and the nonprofit sector, yet there has been just a few studies
conducted since this call. One such study investigated the leadership of nonprofit human service
chief executive officers (Mary, 2005).
Researchers have used the competing values framework (Cameron & Quinn, 2006, 2011)
to identify organizational culture types with an aim to analyze the relationship between culture
types and organizational effectiveness measures. There has been a small body of empirical
support for the effects of organizational culture on positive outcomes in both nonprofit and for-
profit organizations (Fey & Denison, 2003; Hartnell et al., 2011; Jaskyte, 2004 Van &
Wilderom, 2004).
Transformational leadership and organizational culture have been theoretically and
empirically linked to employee attitudes and perceptions (Judge & Piccolo, 2004; Lowe et al.,
1996; Xenikou & Simosi, 2006; Wang, Tsui, & Xin, 2011). Furthermore, Schein (2010) notes
that it is critical to understand both organizational culture and leadership in the study of
organizations, because they have reciprocal influences on each other, provide similar functions in
organizations (Bass & Avolio, 1994; Schein, 2010; Schneider, 1987; Trice & Beyer, 1993), and
each reinforces how employees meet organizational goals (Schein, 2010). Leadership and
organizational culture may be so interconnected that it is possible to observe a transformational

39
culture in an organization (Bass & Avolio, 1993). Further, numerous researchers have suggested
that there is constant interaction between organizational culture and leadership (Bass & Avolio,
1993; Schein, 2010; Trice & Beyer, 1993; Waldman & Yammarino, 1999), and yet there are
limited empirical studies examining the moderating effect of organizational culture types on the
relationship between transformational leadership and important employee outcomes.
There have been a few studies on incorporating both leadership and organizational
culture in the nonprofit literature. Jaskyte (2004) studied a group of chapters of the nonprofit
organization Association for Retarded Citizens (ARC) and examined linkages between
transformational leadership, organizational culture, and innovativeness. She found that
transformational leadership was important in understanding how organizational cultures were
developed to promote innovation. Similarly, Sarros, Cooper, and Santora (2008) investigated the
relationship between leadership vision, organizational culture types, and innovation. They
examined these variables by comparing the for-profit and nonprofit sectors. They found that
nonprofit organizations scored higher on the socially responsible culture orientation, while their
for-profit counterparts scored higher on the competitive culture orientation. However, the
authors did not find a significant difference between the two sectors in the strength of the
relationships amongst leadership vision, organizational culture types, and innovation. Recently,
Mahalinga Shiva and Suar (2012) studied Indian nongovernmental organizations (NGO), which
are similar to nonprofit organizations, examining the interplay between transformational
leadership, organizational culture, and program outcomes. Findings from this study reveal that
transformational leadership builds organizational culture that, in turn, impacts effectiveness
measures.

40
Building upon this research, this study approaches the nonprofit sector with analytical
concepts and measures developed in the for-profit sector. Because of its concerns with the
policy implications of staff turnover and organizational commitment in human service agencies,
the study focuses on them rather than dependent variables other studies have used.
This study breaks new ground in examining the relationship of transformational
leadership and organizational culture measures on turnover and commitment. Similarly,
although considerable attention has been given to the interplay between organizational culture
and leadership, there have been only a few empirical studies related to the moderating effect of
organizational culture on the relationship between leadership and employee variables. This
study examines this effect.
Chapter Summary
The United States depends on the nonprofit sector to implement public policy designed to
serve vulnerable and disadvantaged citizens. To do this, nonprofit organizations need to retain
committed employees to carry out these critical services effectively. This study draws from
concepts typically applied to the for-profit business sector and utilizes them with nonprofit
organizations. The for-profit and nonprofit sectors have important similarities and
This study draws upon literature on the evolution of the leadership theories and applies
transformational leadership to the nonprofit sector. Transformational leadership was chosen
because of the theoretical and empirical evidence demonstrating the impact it has on employees.
This theory has infrequently been applied to the nonprofit sector, thus important insights can be
gained. A valuable contribution of this study relates to the investigation of another factor known
to impact employees, organizational culture. The study uses the competing values framework to
study organizational culture, which also has been infrequently applied to the nonprofit

41
organizations. This study is unique because it examines both organizational culture and
leadership on nonprofit employees’ retention and commitment. Significant contributions were
made to leadership, nonprofit, turnover and commitment bodies of literature by jointly
examining leadership and organizational culture.
Chapter three will focus on the research methods and procedures for the study, including
instrumentation, data collection, sampling, and data analysis plan.
42
Chapter 3: Methodology
This chapter outlines the procedures used to investigate the relationship between the
transformational leadership nonprofit employees perceived about their managers, the perceived
organizational culture types, and employees’ turnover intentions and affective commitment.
This chapter presents material in six sections: (a) Survey Design, (b) Sample, (c)
Instrumentation, (d) Data Collection, and (e) Data Analysis Plan.
Survey Design
This quantitative cross-sectional study focuses on the perceptions and attitudes of
nonprofit employees who work with child and family nonprofit organizations. The survey along
with the consent form was administered via a web-based survey, measuring transformational
leadership of the manager, organizational culture, affective organizational commitment, and
turnover intention. The survey was designed to measure the respondent’s perception of their
manager’s transformational leadership and their organization’s culture. The survey also
collected information about the respondents’ intention to leave (turnover intention), and their
feelings of commitment to the organization (affective commitment). The survey collected
demographic information such as gender, tenure, position level, organizational budget size, and
the organization’s geographic location as well. The independent variables for this study are the
respondents’ perceptions of their manager’s transformational leadership and dominant
organizational culture. The dependent variables are affective commitment and turnover
intention. The control variables are tenure, length of time supervised by manager, age and
gender. A summary of the variables and tools are listed in Table 3 below.

43
Table 3
Measurement of Variables
Variables Type Hypotheses Measurement Number of Questions
Transformational Leadership
IV H1, H2, H5, H6
MLQ-5x short—overall transformational score was assessed by averaging the results of the subscales
20 items
Dominant Organizational Culture Type
IV H3, H4, H5, H
OCAI—consists of 6 questions, each with 4 alternatives, thus making a total of 24 items.
24 items
Affective Commitment
DV H1, H4, H6 Affective commitment was measured using items from Allen and Meyer (1990, 1993; 1996)
6 items
Turnover Intention DV H2, H3, H6 3 questions related to their intentions to leave on a 5-point scale (Aryee & Tan, 1992)
3 items
Tenure Control H1–H6 Demographic question 1
Length of Time Supervised by Manager
Control H1–H6 Demographic question 1
Age Control H1–H6 Demographic question 1
Gender Control H1–H6 Demographic question 1
Position Level Control H1–H6 Demographic question 1
Organizational Budget Size
Used for Quota Sample
H1–H6 Demographic question 1
Measuring Employees’ Perceptions and Attitudes
The Multifactor Leadership Questionnaire 5X (MLQ-5X) (Avolio, Bass, & Zhu, 2004)
was used to assess participants’ attitudes and perceptions of their supervisors’ leadership
behaviors. Participants were asked to report on the extent to which their manager engaged in

44
specific behaviors (e.g., spends time teaching and coaching). Each behavior was rated on a 5-
point scale ranging from 0, “Not at all” to 4, “To a very great extent.” The following four
subscales: idealized influence (8 items), inspirational motivation (4 items), intellectual
stimulation (4 items), and individualized consideration (4 items) were used to assess the
respondents’ perceptions of their managers’ transformational leadership. Overall
transformational leadership was calculated as the summed score across all items in these four
subscales (20 items). The MLQ 5X survey is designed to measure the full range of leadership
behavior, including transactional leadership behaviors to transformational ones. However, for
the purposes of this study and because of extensive literature on the benefits of transformational
leadership, only the 20 questions measuring the extent of perceived transformational leadership
qualities were measured (e.g., Xenikou & Simosi, 2006).
The Multifactor Leadership Questionnaire (MLQ Form 5X-short) is a widely used
measure of transformational and transactional leadership styles (Avolio et al., 2004a). The tool
is used to measure the impact of the leader’s effect on both the personal and intellectual
development of the respondent. There are two forms of the MLQ. The first is the Leader Form,
which asks the leader to rate the frequency of his or her own leader behavior. Research has
shown that self-ratings of one’s own leader behavior are prone to bias and would not be useful
for the purposes of this study (Avolio, Bass, & Zhu, 2004). The MLQ Rater Form is more
commonly used and was selected for this study to measure the nonprofit employees’ perceptions.
Strong evidence supports the validity and reliability the current version of the Multifactor
Leadership Questionnaire (MLQ) Form 5X (Antonakis, Avolio, & Sivasubramaniam, 2003).
Researchers confirmed the validity of the proposed nine-factor MLQ model using two very large
samples (Study 1: N = 3368; Study 2: N = 6525) (Antonakis et al., 2003). Still, there have been

45
criticisms of the MLQ, particularly related to the first version of the instrument, regarding the
wording of items. Most items in the scale of charismatic leadership described the result of
leadership instead of specific actions of the leader that can be observed and that, in turn, lead to
the results. In response to the critics, Bass and Avolio (1990) included in the revised, and now
subsequent versions with items that describe leadership actions, which are directed observed.
They also split out attributions of leadership associated with idealized influence and behaviors
and actions into two separate scales.
In addition to leadership, organizational culture is an important factor in understanding
nonprofit employees’ turnover intentions and their commitment to their respective nonprofit
organizations. Employees are influenced by leadership, but it is also the daily interactions,
exchanges, and ways of doing things—or the organizational culture—that also impact their
attitudes and should be considered as well (Cameron & Quinn, 2006; Schein, 2010; Jaskyte,
2004; Sarros, Cooper, & Santora, 2008). A manager may set the tone for the organization, but
the organizational culture is the means through which employees are socialized and how they
conduct their work (Cameron & Quinn, 2006; Schein, 2010).
Organizational Culture Assessment Instrument (OCAI) was the second tool utilized.
This instrument is based on the competing values framework and is designed to provide
researchers with a tool to quantitatively assess organizational culture (Cameron & Quinn, 2006).
The competing values framework differentiates organizational cultures into four culture types:
clan, adhocracy, hierarchy, and market. An organization’s overall cultural profile and dominant
characteristics can be determined using the OCAI through a self-reported survey. Studies using
this approach to examine organizational culture have revealed that an organization often has one

46
dominant culture type but demonstrates varying degrees of each of the other types (Goodman,
Zammuto, & Gifford, 2001; Kwan & Walker, 2004; Prajogo & McDermott, 2005).
For this study, one of the independent variables was the employee’s perception of
dominant organizational culture (clan, hierarchy, adhocracy, and market), measured by the OCAI
instrument. The organizational culture was determined by calculating the number of points
awarded to a particular cultural dimension. The dominant cultural orientation was indicated by
highest score of the four types. The OCAI tool consists of six questions, and each question had
four alternatives, thus making a total of 24 items. Each question was worth 100 points, and the
respondents were required to divide the 100 points among these four alternatives, depending on
the extent to which each alternative was similar to their own organization. The respondents were
expected to award a higher number of points to the alternative that was perceived most similar to
their organization.
The OCAI tool was utilized in part due to its simplicity and practical application. Simple
arithmetic calculations are required to score the OCAI. The first step was to add together all A
(clan) responses and divide by six, computing an average score for the A alternatives. This step
was repeated for B (adhocracy), C (market), and D (hierarchy) alternatives (Cameron & Quinn,
2011). Several studies have indicated that the OCAI is a valid and reliable instrument in
measuring organizational culture (Cameron & Quinn, 2011). Quinn and Spreitzer (1991)
reported a Cronbach’s alpha coefficient for reliability that was greater than .70 using a sample
size of 800 participants from 86 public organizations. In addition to Cameron and Quinn’s
(2011) findings, numerous other studies relating to human resources (e.g., Boggs, 2004;
Goodman et al., 2001; Kwan & Walker, 2004; Prajogo & McDermott, 2005) found the
instrument to be valid. Tests conducted by Quinn and Spreitzer, 1991; Yeung, Brockbank, and

47
Ulrich (1991); and Zammuto and Krakower (1991) confirmed the reliability of the instrument
within an acceptable margin of error (Cameron & Quinn, 2006; Woodman & Pasmore, 1998).
Additionally, Quinn and Spreitzer (1991), and Zammuto and Krakower (1991) produced
evidence of validity of the OCAI, demonstrating that the instrument accurately measures four
dominant culture types within organizations (Cameron & Quinn, Woodman & Pasmore, 1998).
This study focused on respondents’ perceptions of leadership and organizational culture
because they are factors that are theoretically and empirically linked to the employees experience
in the workplace (e.g. Bass & Avolio, 1993; Schein, 2010; Trice & Beyer, 1993; Waldman &
Yammarino, 1999). This study used the OCAI and MLQ-5X instruments to measure the
employee’s perceptions of their manager’s transformational leadership and their organizational
and these scores. They were the independent variables for this study. This study examined each
concept separately with employee-related outcomes, then jointly with these outcomes to
understand the moderating effect of organizational culture. The two employee-related
dependent variables were turnover intention and affective commitment. Demographic variables
were collected and used as either control variables or for the chosen sampling method.
Turnover intention was measured using a three-item scale (Aryee & Tan, 1992).
Respondents rate their desire to quit (l = strongly disagree, 5 = strongly agree; “I often think
about quitting”); the likelihood of looking for another employer (l = highly unlikely, 5 =
extremely likely; “How likely is it that you will actively look for a new organization to work
with in the next year?”); and their intention to quit (l = strongly disagree, 5 = strongly agree; “I
will probably look for a new organization to work within the next year”). The turnover intention
measure has a high reliability score of .85 as noted in prior research (Aryee & Tan, 1992).

48
Lastly, affective commitment was measured using six items from Meyer and Allen
(1996). Meyer and Allen (1991) developed an eight-item survey that they later reduced to six
(Meyer & Allen, 1993). The two items eliminated from the original affective commitment scale
had the lowest factor loading in previous studies (Meyer & Allen, 1993). Items include “This
organization has a great deal of personal meaning for me” and “I feel like the organization’s
problems are my own.” Researchers who have used this instrument have reported that this scale,
when computed and reported with a single factor, and has a high reliability (Allen & Meyer,
1996; Hackett, Bycio, & Hausdorf, 1994). When the responses were combined and reported in a
single factor, the affective commitment scale also has a high reliability (Allen & Meyer, 1996;
Hackett, Bycio, & Hausdorf, 1994; Meyer et al., 1990).
In addition, the survey asked for demographic data from respondents and some used as
control variables to avoid potentially spurious relationships. Age, gender, and position level
have been identified as potentially related to commitment and turnover intentions (Griffeth et al.,
2000; Mossholder, Settoon, & Henagan, 2005) and may influence the strength of the relationship
between variables. Organizational tenure was controlled because the length of time a person was
employed at an organization will impact their impression of the organizational culture (Schein,
2010); so too will the length of time a person has been supervised by a manager impact his or her
perception of leadership. “Honeymoon biases” occur at the start of one’s tenure, where “overly
positive” attitudes about the organization or leader may prevail; and the “hangover effect”
describes the decline and eventual stability in positive attitudes about managers and
organizations (Boswell, Boudreau, & Tichy, 2005 p. 884).

49
The demographic variables collected are:
• Gender: This was a dichotomous variable measured by asking the respondent to select
male (0) or female (1). This variable was measured for descriptive statistical
information and was used as a control variable as it might impact turnover intention
or affective commitment.
• Age: The respondent’s age was offered in five categories: (1) under 29, (2) 30–39, (3)
40–49 (4) 50–59, (5) 60 or older.
• Organizational tenure: This was categorized in terms of years employed in the
organization. Five options were offered to respondents: (1) less than one year, (2) 1
year to less than 3 years, (3) 3 years to less than 5 years, (4) 5 years to less than 7
years, (5) 7 years or more. This was used in descriptive information and a control
variable for the study’s findings.
• Position level: This was categorical data offered in three categories: (1) senior
management, (2) management or supervisory, (3) non-management. This was used as
a control variable as it might impact turnover intention, perception of the culture, or
affective commitment.
• Time supervised: This was derived from a question asked about how long the
respondent has been supervised by their current supervisor. Five options were
offered: (1) less than one year, (2) 1 year to less than 3 years, (3) 3 years to less than 5
years, (4) 5 years to less than 7 years, (5) 7 years or more. This was used in
descriptive information and as a control variable as it might impact turnover
intention, perception of the organizational culture, or affective commitment.

50
• Organization size (annual revenue): This was categorized based on the organizational
dues structure of the Alliance. Six options were given to respondents: (1) under
$500,000, (2) $1,500,000–$3,000,000, (3) $3,000,001–$5,000,000, (4) $5,000,001–
$7,000,000, (5) $7,000,001–$20,000,000, (6) $20,000,001 and above. This was used
to establish quotas so that there was not under- or overrepresentation of any one
budget size category. It was used for descriptive statistics.
• Location of organization: This was categorized into regions of the US and Canada.
The eight options given were the categories of geographic regions and numbers of
respondents as follows: (1) East North Central (OH, IN, IL, MI, WI); (2) Mid-
Atlantic (NY, NJ, PA); (3) Mountain (MN, ID, WY, CO, NM, AZ, UT, NV); (4) New
England (ME, NH, VT, MA, RI, CT); (5) Pacific (WA, OR, CA, AK, HW); (6) South
Atlantic (DE, MD, DC, VA, WV, NC, SC, SC, GA, FL); (7) West North Central
(MN, IA, MS, ND, SD, NE, KS); (8) West South Central (AR, LA, OK, TX).
According to Dillman (2011), the use of web surveys reduces various costs related to
paper printing, postage, package-mailing processes, and data entry. Cost efficiency is another
advantage of web surveys because, compared to mail surveys (which could take at least a few
weeks to complete data collection), much less time is needed for data collection (Singleton &
Straits, 2005). Dillman (2011) also mentioned another advantage—that web surveys enable
researchers to survey a larger sample size and cover broader geographical areas with lower cost
because the cost of access to additional subjects is very small compared to traditional mail or
interview methods. This consideration was relevant for this study, given the respondents were
drawn from all over the United States. However, Couper (2000) stated that web surveys usually

51
show lower response rates compared to traditional mail surveys and literature shows this rate is
traditionally lower for nonprofit organizational research (Hager et al., 2003).
Sample
The sample for this study was drawn from a national nonprofit membership organization,
the Alliance for Strong Families and Communities, also known as the Alliance, which represents
over 500 member organizations and an estimated 138,000 employees across the United States
and Canada. Members include private, nonprofit child and family organizations. The member
organizations provide an array of programs and services to children, families, and communities
and are both religiously affiliated and secular. According to their website, Alliance members
provide an array of programs and services, including domestic abuse counseling and shelters;
adoption, foster care, and aging-out-of-foster care services; credit counseling and financial
literacy; Head Start and after-school programs; crisis management; a variety of counseling
services; and in-home health and youth residential treatment.
The Alliance suggests that their members represent a significant force in the nonprofit
human service sector with an important public purpose. Collectively they:
• Serve more than 4.6 million clients annually;
• Operate with a combined $6.3 billion budget;
• Employ approximately 138,300 full-time employees;
• Operate in 2,200 locations;
• Are governed by more than 8,600 board members;
• Benefit from roughly 200,000 volunteers; and
• Receive support from approximately 296,000 individual donors.

52
The Alliance provided thousands of employees who work within the child and family
nonprofit sector from across the country as a pool of potential participants. The analysis focused
on employees at all levels of the organization from these child and family nonprofit 501(c)(3)
organizations. Focusing on one type of organization helps to isolate other factors, such as laws,
regulations, and diverse funding opportunities that may vary from one set of nonprofit
organizations to another (e.g., Jaskyte, 2004).
I was employed in a senior management position at a child and family nonprofit
organization, United Methodist Family Services (UMFS) in Virginia at the time of recruitment of
the study participants. UMFS is a member of the Alliance. I am also a graduate of the Executive
Leadership Institute co-sponsored by the Alliance and the University of Michigan. These
connections allowed me better access to member organizations from across the country for
recruitment for this study. Respondents participated via self-selection rather than recruited via
known contact information. This may have potential advantages regarding accessibility and
potential disadvantages related to response bias and generalizability. These will be discussed
further in the limitations section in chapter five.
Research shows that nonprofit studies have been often plagued by low response rates
(Hager, Wilson, Pollak, & Rooney, 2003), so recruitment methods should be multifaceted.
Participants were recruited for this study through three main methods. These methods included
invitations to participate: (a) via Alliance’s “communities of practice” e-mail groups, b) from
referrals from respondents, and c) through an invitation to participate on the Alliance E-news,
email announcements to members. There are 2,390 employees of various levels of the
organization who are registered on twelve Alliance communities of practice e-mail groups
(personal communication, L. Pinsoneault, July 1, 2014). These groups are centered on a

53
particular topic (e.g., performance excellence, civic engagement, residential services, or health
and wellness). Alliance members (nonprofit employees) opt in by registering their name and
then send and receive information from colleagues who have also registered. The names and
contact information of those in the groups were not available to me. However, an invitation to
participate was sent to each group. The second method was to use a snowball method of
sampling by requesting respondents to refer other potential participants. The third method was
through an invitation to participate on the Alliance E-news to solicit voluntary participation.
Sample Size
For this study, the unit of analysis is the individual employee. A unit of analysis is the
actual source of information, which may be a person, an organization, or a group (Creswell,
2013). Depending on the research questions and purpose the unit of analysis may be the
individual or the organization, in organizational research (Babbie, 1990). If the study had been
focused on organizational outcomes, such as financial stability or organizational effectiveness,
the unit of analysis would be the organization. The focus instead was on nonprofit employees’
affective commitment and turnover intention, so the individual was used.
Sample size is a critical element in ensuring that a study’s findings represent the
population as a whole (Dattalo, 2008). To determine the appropriate sample size, the researcher
conducted a power analysis to ensure its findings would represent the population as a whole
(Dattalo, 2008). A statistical power analysis can be conducted during the study’s design (a
priori) or after the data has been collected (a posteriori). The researcher chose to conduct the
power analysis during the study’s design, thus providing a target number of respondents, before
implementing survey. An a priori power analysis requires: (a) the type of statistical treatment,
(b) the alpha value or significance level, (c) the expected effect size, (d) the desired power, and

54
(e) the number of predictor variables. This provides an estimate of the minimum number of
required cases. For this study, the type of statistical treatment was multiple regression. The
alpha level, or error rate, was set at .05, as is accepted within the social sciences field (Frankfort
& Nachmias-Frankfort, 2000). The expected effect size was set at a moderate level of .15. The
power was set at the generally accepted level of .8. The web-based statistical calculator,
G*Power, illustrated in Figure 3 below, determined the sample size, for this study was between
103 and 153, with 103 being the minimum required number of cases to obtain the desired power
of .8.
Figure 3. Power analysis.

55
Sample Method
This study used a nonprobability sampling method called quota sampling.
Nonprobability samples are used by social scientists when all units of the population are not
precisely known (Frankfort-Nachmias & Nachmias, 2008), as is the case with the full employee
population of Alliance Member Organizations. In quota sampling, a population is first
segmented into mutually exclusive sub-groups. For this study, the sub-groups were budget sizes
of the organizations. This grouping was chosen because it was data collected and supplied by
the Alliance to the researcher from their membership dues structure. The percentages of
member organizations in each of the membership dues category allowed the researcher to
develop quota targets. The use of quota sampling is particularly useful for this study because
there is no known database of all individuals employed in Alliance’s member organizations.
Therefore quotas could not be set based on employees’ characteristics. Nonprobability samples
are widely used by social scientists in certain circumstances such as conducting exploratory
studies or when convenience and economy outweigh the benefits of probability sampling
(Frankfort-Nachmias & Nachmias, 2000). For these reasons, quota sampling based on budget
size was the chosen sampling method for this study.
Although the unit of analysis is the individual employee, it is beneficial to have an array
of organizations so that the population is more closely represented. According to Cooper and
Schindler (2011), the ultimate test of a sampling design is how well it represents the
characteristics of the population it purports to represent. In order to get this array of
organizations of different sizes, the researcher contacted the director of research and evaluation
at the Alliance, who provided the aggregated data on the size of member organizations in Table 4
below.
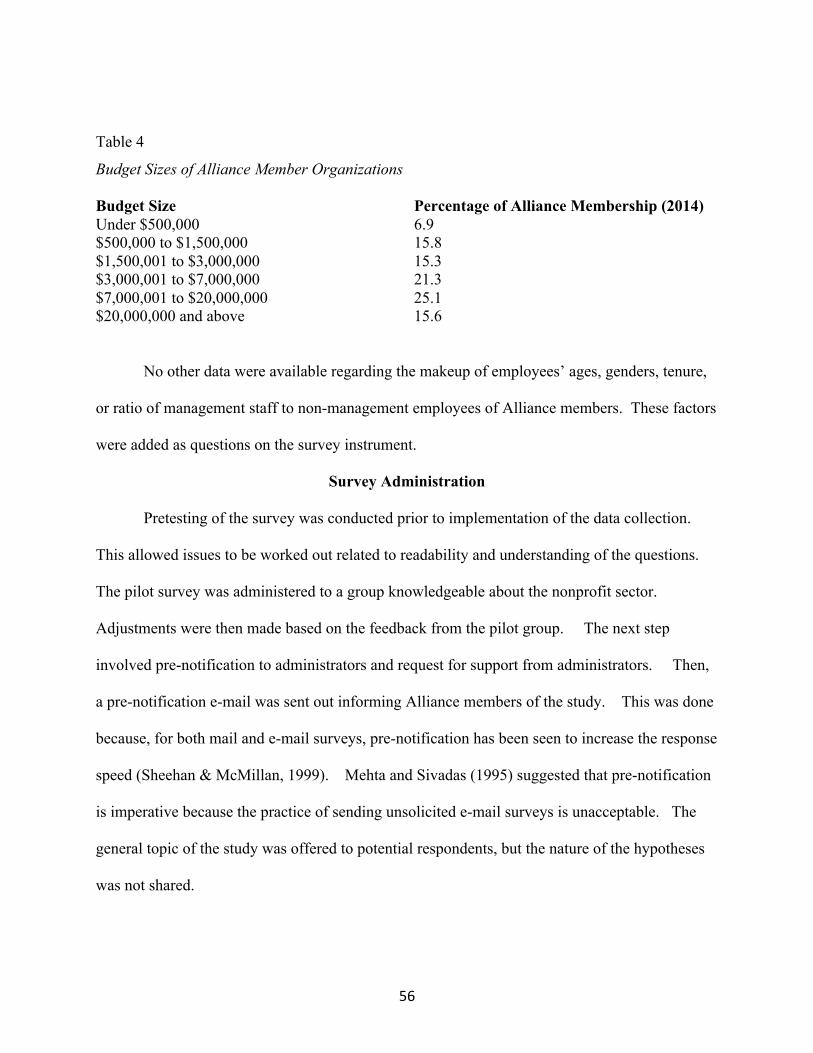
56
Table 4
Budget Sizes of Alliance Member Organizations
Budget Size Percentage of Alliance Membership (2014) Under $500,000 6.9 $500,000 to $1,500,000 15.8 $1,500,001 to $3,000,000 15.3 $3,000,001 to $7,000,000 21.3 $7,000,001 to $20,000,000 25.1 $20,000,000 and above 15.6
No other data were available regarding the makeup of employees’ ages, genders, tenure,
or ratio of management staff to non-management employees of Alliance members. These factors
were added as questions on the survey instrument.
Survey Administration
Pretesting of the survey was conducted prior to implementation of the data collection.
This allowed issues to be worked out related to readability and understanding of the questions.
The pilot survey was administered to a group knowledgeable about the nonprofit sector.
Adjustments were then made based on the feedback from the pilot group. The next step
involved pre-notification to administrators and request for support from administrators. Then,
a pre-notification e-mail was sent out informing Alliance members of the study. This was done
because, for both mail and e-mail surveys, pre-notification has been seen to increase the response
speed (Sheehan & McMillan, 1999). Mehta and Sivadas (1995) suggested that pre-notification
is imperative because the practice of sending unsolicited e-mail surveys is unacceptable. The
general topic of the study was offered to potential respondents, but the nature of the hypotheses
was not shared.

57
The survey instrument was administered using the Survey Monkey© electronic survey
tool. This web-based instrument was chosen based on recommendations and because of ease of
use, multiple features, and the free limited subscription. The survey link was sent to self-
identified participants who had responded to the invitation to participate.
There were three phases involved in the invitation to participate. The first phase involved
sending the invitation with the link to the survey to the communities of practice e-mail groups,
which included approximately 2,390 (with some duplication) employees who registered for one
or more of twelve topic-focused e-mail groups. The second phase involved an e-mail reminder
to communities of practice e-mail group participants. The third phase involved a final reminder
to participate three weeks after the initial e-mail invitation.
The study’s findings can be shared through a webinar format and/or conference
presentation to Alliance members. The study’s findings can also be shared through a report
shared electronically if requested. Additionally, an incentive of entry into a raffle for eight $25
Amazon gift cards was offered and distributed to assist with a higher response rate.
Data Analysis
The data analyses plan for this study involved using ordinary least squares (OLS)
regression with moderation analyses. Ordinary least squares regression, also referred to as
multiple regression, is used to predict the variance in a dependent variable based on the linear
combinations of the independent variables. OLS can establish that the predictor variables
explain a proportion of the variance in a dependent variable at a statistically significant level and
establish the relative predictive importance of the independent variable (Berry, 1993).
Moderation analysis was also used in conjunction with OLS for this study to determine the

58
statistical interaction of dominant organizational culture on the relationship between
transformational leadership and employees’ commitment and turnover intention.
Extensive data preparation was conducted prior to hypotheses testing which involved
several steps to prepare for analysis. The data were exported from the Survey Monkey© survey
software into the Statistical Package of the Social Science (SPSS) Version 21. SPSS was used to
create a dataset and to prescreen and statistically analyze the data. The response rate, completion
rate, and criteria for the quota sample were determined and reported. The data were then
prescreened. This prescreening involved examining the dataset for accuracy, input errors,
missing data, extreme values, or outliers. The absence of outliers was analyzed using Cook’s D
to estimate the influence of a data point when performing OLS regression analysis. Other
important assumptions were assessed to include the absence of multicollinearity, normality,
linearity, and homoscedasticity.
The analysis included the use of descriptive statistics, beginning with a univariate
statistical analysis. Descriptive statistics provides a way to summarize the data in a meaningful
way, though no conclusion can be drawn regarding hypothesis testing. An analysis of
frequencies and minimum and maximum values for categorical data was conducted. Frequency
distributions described the composition of the budget sizes of participants’ organizations,
respondents’ genders, position tenures, time supervised by manager, and position levels.
Organizational data was analyzed including budget sizes, geographic location of respondents’
organizations, and a summary of the perceived organizational culture types.
The next stage of data analysis was the examination of bivariate relationships between
variables, which were first examined using a chi square test for significance with the categorical
variables as an initial analysis of the variables. Before hypothesis testing, bivariate analysis was

59
conducted to examine any significant relationships between the independent and dependent
variables. The bivariate correlation coefficient, or Pearson’s r, would show the degree of a linear
relationship between variables with no distinction necessary between independent and dependent
variables (Tabachnick & Fidell, 2013). The resulting coefficient would demonstrate the strength
of the relationship with criteria drawn from the literature, indicating r = .20 as a weak
relationship and r = .70 as a strong relationship (Drake & Jonson-Reid, 2007). A
multicollinearity test was performed for both the independent as well as the control variables to
ensure that assess correlation strength between the variables.
The third stage of data analysis involved testing the six hypotheses. Multiple linear
regression is widely used for predicting the value of one dependent variable from the value of
one of two or more independent variables. This regression analysis was used for this study
because there was more than one explanatory variable for each hypothesis. While there were
two dependent variables, each hypothesis denoted only one so that the researcher could isolate
the impact on leadership and organizational culture on each separately. There were several
control variables, and in linear regression, these are treated like independent variables in the
statistical manipulation using this method.
Moderation analysis, using multiple regressions was conducted for H5 and H6 to
determine if the perceived dominant organizational type was a statistically significant moderator
between perceived transformational leadership and the employee’s affective commitment and
turnover intention.
The models developed for each hypothesis are as follows:
H1: AC = a +b1 (TL) + b2 (gender) + b3 (position tenure) + b4 (yrs supervised) + b5 (position level) + b6 (time supervised) + b7 + (age) + b0 (culture type)

60
H2: TI = a + b1(TL) + b2 (gender) + b3 (position tenure) + b4 (yrs supervised) + b5 (position level) + b6 (time supervised) + b7 + (age) + b0 (culture type)
H3: TI = a + b1(OC) + b2 (gender) + b3 (position tenure) + b4 (yrs supervised) + b5 (position level) + b6 (time supervised) + b7 + (age) + b0 (TL)
H4: AC = a + b1 (OC) + b2 (gender) + b3 (position tenure) + b4 (yrs supervised) + b5 (position level) + b6 (time supervised) + b7 + (age) + b0 (TL) H5: TI = a + b1 (OC) + b2 (TL) + b3 (position tenure) + b4 (yrs supervised) + b5 (position level) + b6 (time supervised) + b7 + (age) + b8 (gender) + b9 (OC*TL)
H6: AC = a + b1 (OC) + b2 (TL) + b3 (position tenure) + b4 (yrs supervised) + b5 (position level) + b6 (time supervised) + b7 + (age) + b8 (gender) + b9 (OC*TL)
Chapter Summary
The general aim of this study was to investigate the effect of transformational leadership
and organizational culture types on important employee outcomes—affective commitment and
turnover intention within child and family nonprofit organizations. This chapter provided an
overview of the research methods, data collection, and data analysis plan. An overview of the
instruments that were used to develop the survey was provided as well.

61
Chapter 4: Results
The purpose of this study is to better understand the relationship between
transformational leadership, organizational culture, and employees’ affective commitment and
turnover intention in child and family nonprofit organizations. Specifically, the study tested the
relationship between nonprofit employees’ perceptions of their manager’s transformational
leadership and their affective commitment to their workplace and turnover intention. The study
also examined the predictive relationship of organizational culture on affective commitment and
turnover intention. Finally, the study investigated the moderating effect of organizational culture
on these two relationships. Each test used several control variables including: gender, age,
tenure, position level, and the length of time supervised by manager. The methodology, outlined
in chapter three, utilized a quantitative, cross-sectional survey design. The analysis was
conducted using ordinary least squares regression and moderation analysis. This chapter
presents the results of the data collection and analysis.
Sample
Nonprofit employees of child and family service organizations were the participants for
this study. Their organizations were current members of the Alliance for Strong Families and
Communities, an association for child and family nonprofit organizations. This study design was
intended to reach a wide range of respondents while protecting their anonymity. The researcher
obtained access to employees through Alliance e-mail groups and Alliance e-news notifications.
Then, the researcher sent a request to participate with a further request to forward the request to
other employees in their respective organizations. There is no record of how many potential
respondents received the invitation. Therefore, a response rate for the actual survey cannot be
calculated.

62
Survey Monkey© software, has several capabilities, which include providing information
on the number of respondents starting and completing the surveys. The survey was started 219
times with 176 surveys completed for an overall completion rate of 80.3 percent. Based on an a
priori power analysis, the study’s minimal data collection target was 103 responses.
The research method incorporated quota sampling to obtain a representative sample of
Alliance member organizations. The quota categories were based on budget size of the
organizations and were obtained from receiving the Alliance’s membership dues structure. The
target numbers were set for each category. The organizational budget sizes and percentage of
overall membership are outlined in Table 5 below.
An error became apparent after about 60 surveys were completed. Instead of six budget
categories, five options were given. The survey question on the organization’s budget size
collapsed the second and third categories. The two categories were ($500,000 to $1,500,000)
and ($1,500,001 to $3,000,000), which were condensed into the category ($500,000 to
$3,000,000). Since 60 participants had already responded, changing the survey would have
caused validity problems. It would have been impossible to determine which of the two
collapsed categories the organization of the first 60 respondents fit. A new quota number for
each category was created, based on the percentages of the five budget categories that are
outlined below in Table 5. The error was problematic for true representation, but not detrimental
to the overall study.
In order to achieve the quota targets for each category, the survey remained open for
three weeks past the original deadline because of challenges with obtaining survey responses
from employed in smaller organizations. The researcher sent reminder e-mails through e-mail
groups in an effort to gather responses from smaller (under $500,000) organizations. By the end

63
of the third additional week, the quota of seven respondents was met for that category. Meeting
the quota target was critical to obtain some form of representation with a nonprobability
sampling method.
Table 5 Quota Sample Breakdown Revised Budget Size
Percentage (%) of Alliance Membership (2014)
Quota Targets
Under $500,000
6.9 7
$500,000–$3,000,000
31.1 32
$3,000,001–$7,000,000
21.3 22
$7,000,001–$20,000,000
25.1 26
Above $20,000,000
15.6 16
Total 100 103
Sample Characteristics
All of the respondents were employees of child and family nonprofit organizations, and
their organizations were members of the Alliance for Strong Families and Communities. Table 7
below provides an overview of the demographic characteristics of the participants. Respondents
were from all position levels of the organization with the exception of the senior-most manager,
such as the chief executive officer or executive director. The requirements for participation were
shared on the first page of the survey, and participants were required to agree before proceeding.
This measure offered clarity about the intended target respondent group for the study. The link

64
was sent to the target group, but since the survey link could be sent to others, it was important to
be clear.
The majority of the respondents were female at 78 percent. Gender was a control
variable for this study.
Figure 4. Gender of respondents
Just over half, 51 percent of the respondents, were in senior management positions in
their organization, while 20 percent were in non-management roles, and 29 percent were in
supervisory or mid-management positions.
Female 81
Male 22
Gender Breakdown of Sample n=103

65
Figure 5. Position Level of Respondents.
Data on the age of participants were collected via five age categories: under 29, between
30 and 39, between 40 and 49, between 50 and 59, and 60 and over. The ages of respondents
varied, with the largest percentage, 37 percent, falling between 40 and 49 years old. The
smallest percentage was of respondents under the age of 29.
Figure 6. Age of Respondents.
20%
29%
51%
Posi%on Level
Non-‐manager Supervisor or Manager Senior Manager
0 5 10 15 20 25 30 35 40
under 29
30-‐39 40-‐49 50-‐59 60 & older
Ages of Respondents
Frequency

66
With 103 total respondents, the largest percentage of respondents with 50.5 percent, were
employed 7 years or more. Lastly, the length of the time supervised by manager varied. The
largest percentage, 28.2 percent, were those supervised by a manager less than one year,
followed closely by those supervised between 1 and 3 years at 27.2 percent.
Figure 7. Tenure of Respondents
Figure 8. Length of time supervised

67
The survey asked some organizational characteristics to illustrate the breadth of
organizations included in the study. This included the location and budget size of the
organizations. All nine regions of the United States were represented in this study. The highest
percentage of respondents with 28 percent, were from the Mid-Atlantic region, followed closely
by respondents from the East North Central region (23 percent). Table 6 provides a full
description of the regional locations represented. Figure 9 outlines the budget sizes of the
organizations, which were representative of the quota sample earlier.
Table 6 Descriptive Statistics for Organizational Characteristics
Variable n=103 Frequency % Organization Location
East North Central 23 22.3 East South Central 5 4.9
Mid-Atlantic 28 27.2 Mountain 1 1.0
New England 4 3.9 Pacific 4 3.9
South Atlantic 16 15.5 West North central 18 17.5 West South Central 4 3.9

68
Figure 9. Breakdown of Organizational Budget Sizes
Data Preparation
All survey data were downloaded from Survey Monkey© and exported into Excel then
into Statistical Package of the Social Sciences (SPSS) version 21. When the data was exported
to SPSS all of the data was separated into multiple variables representing each question response.
The researcher calculated scores for four variables used for this study: transformational
leadership, dominant organizational culture, affective commitment, and turnover intention. The
researcher then screened survey responses for missing data since this can be a major dilemma in
data analysis (Tabachnick & Fidell, 2013). A complete set of responses was found for all
participants. Thus, the researcher proceeded to the next stage of data preparation, which was
dummy coding the categorical variables and selecting a reference category for the categorical
independent variable.

69
Coding
Dummy coding variables is a way of adding the values of nominal or ordinal variables to
a regression equation. Dummy coding uses only ones and zeros to convey all of the necessary
information on group membership. The researcher uses dummy coding when comparing other
groups of the predictor variable with one specific group of the predictor variable. The specific
group is often called the reference group or category. For this study, one of the independent
variables, dominant organizational culture types was categorical data. This included a category,
called balanced culture, wherein no dominant culture was found, because two or more categories
were evenly scored. Gender was coded as dichotomous data (0,1). Additionally, this study
involved several control variables, some of which were nominal and required transformation.
Using SPSS, these variables were transformed into dummy variables. Table 7 provides a
summary of this coding.

70
Table 7 Dummy Coding for Categorical Data Dominant Org Culture
Clan Adhocracy Hierarchical Market Balanced
Clan 1 0 0 0 0 Adhocracy 0 1 0 0 0
Hierarchical 0 0 1 0 0 Market 0 0 0 1 0
Balanced 0 0 0 0 1
Position Level Senior Manager
Supervisor or Manager
Non-manager
Senior Manager 1 0 0 Supervisor or Manager 0 1 0
Non-manager 0 0 1 Tenure Under 1 yr 1 - 3 yrs 3 – 5 yrs 5 - 7yrs 7 yrs or more
Under 1 yr 1 0 0 0 0 1 - 3 yrs 0 1 0 0 0 3 – 5 yrs 0 0 1 0 0 5 - 7yrs 0 0 0 1 0
7 yrs or more 0 0 0 0 1 Length of Time Supervised
Under 1 yr 1 - 3 yrs 3 – 5 yrs 5 - 7yrs 7 yrs or more
Under 1 yr 1 0 0 0 0 1 - 3 yrs 0 1 0 0 0 3 – 5 yrs 0 0 1 0 0 5 - 7yrs 0 0 0 1 0
7 yrs or more 0 0 0 0 1
Budget Size of Org > $500K $500K- $3M
$3M-$7M $7M- $20M
Above $20M
>$500K 1 0 0 0 0 $500K- $3M 0 1 0 0 0
$3M-$7M 0 0 1 0 0 $7M- $20M 0 0 0 1 0
Above $20M 0 0 0 0 1
Age 29 & under 30-39 40- 49 50-59 60 & older 29 & under 1 0 0 0 0
30-39 0 1 0 0 0 40-49 0 0 1 0 0 50-59 0 0 0 1 0
60 and older 0 0 0 0 1

71
Reference Category
Dummy coding is used when the researcher wants to compare other groups of the
independent variable with a reference group. A reference group was required for the predictor
variable, dominant organizational culture. Garson (2006) suggests that researchers should
choose a reference category based on frequency of responses or theoretical framework. In this
case, clan culture is the obvious choice as the reference category because the majority of
respondents perceived their organizations’ cultures as clan. Theoretically, clan cultures research
(Cameron & Quinn, 2006; Quinn et al. 2007; Zammuto and O’Connor 1992) suggests that clan
cultures have a positive impact on employees in the workplace thus supporting the theoretical
underpinning of this study. Therefore, for the hypotheses testing that involved organizational
culture, clan culture was the category by which all other cultures were compared.
Pre-Screening
Data analysis and hypothesis testing for this study utilized ordinary least squares (OLS).
The method of OLS was based on several statistical assumptions. To address these assumptions
several steps were taken to ensure the data was ready for analysis. First, the model was screened
for the absence of outliers. Second, multicollinearity was assessed to ensure the residuals were
not correlated with one another over time. Third, linearity was determined by examining
patterns in the data. Fourth, homoscedasticity was assessed to ensure the residuals (errors)
reflected a constant variance. These assumptions are addressed next.
Absence of Outliers. The researcher screened the data for outliers, which are unusual or
extreme values that appear inconsistent with observations in the full data set (Dattalo, 2013).
Outliers can occur by chance, but may also stem from data entry error. Outliers can cause results
to appear significant when, in fact, removing the outlying values renders them insignificant

72
(Mertler & Vannatta, 2005). Outliers can overstate the coefficient of determination (R2),
producing erroneous values for slope and intercept (Dattalo, 2013). Ordinary least squares
(OLS) regression analysis is also sensitive to outliers. Researchers often use Cook’s distance, or
Cook’s D, to estimate of the influence of a data point when performing least squares
regression.
Opinions vary on what criterion or cut-off value one should use to identify outliers,
which are also considered highly influential points. Some authors have suggested that values of
D greater than 1 indicate influential cases (Bollen, Kenneth, & Jackman, 1990; Dattalo, 2013).
Others have recommended D values greater than 4/(n-k-1), where n is the number of cases and k
the number of independents. In this case, D would equal .0412. A third option is to add the
aforementioned quantities and divide by two. The following equation illustrates this: (.0412 +
1)/2 = .5206. Using .5206 for Cook’s D reveals that no outliers appear in this sample.
Multicollinearity. Multicollinearity occurs when a model includes multiple factors that
are highly correlated not just to the dependent variable, but also to each other. In other words, it
results when you have factors that are redundant. A possible solution to this problem is
eliminating the variables from the study, or transforming the data by weighting them differently.
Multicollinearity issues were assessed through bivariate correlations as well as tolerance value.
When bivariate correlation r>=.8 or tolerance is close to 0 (Mertler & Vannatta, 2005).The
researcher conducted correlation analysis summarized in Table 8. A moderate correlation did
occur for one pair: clan and hierarchical (r= .597). There were no pairs of the independent
variables with Pearson’s r-value exceeds .50 . The control variables were also assessed for
multicollinearity, with two pairs with Pearson’s r-value exceeding .50, in the moderate range.
These were Senior Manager and Supervisor and Manager at (p=.647) and Supervisor and

73
Manager with Non-manager (p=.511). Collectively, such correlations suggest the absence of
multicollinearity. Therefore, transformations of the data were unnecessary.
Table 8 Correlation matrix for independent variables.
Correlations Adhocracy Market Hierarchical Clan TL score Adhocracy Pearson
Correlation 1 -.095 -.156 -
.412** .014
Sig. (2-tailed) .339 .116 .000 .885 N 103 103 103 103 103
Market Pearson Correlation
-.095 1 -.138 -.364**
-.112
Sig. (2-tailed) .339 .164 .000 .259 N 103 103 103 103 103
Hierarchical Pearson Correlation
-.156 -.138 1 -.597**
-.276**
Sig. (2-tailed) .116 .164 .000 .005 N 103 103 103 103 103
Clan Pearson Correlation
-.412** -.364** -.597** 1 .264**
Sig. (2-tailed) .000 .000 .000 .007 N 103 103 103 103 103
TL score Pearson Correlation
.014 -.112 -.276** .264** 1
Sig. (2-tailed) .885 .259 .005 .007
N 103 103 103 103 103 **. Correlation is significant at the 0.01 level (2-tailed).
Linearity. Ordinary least squares analysis is a linear procedure. Linearity is the
assumption that variables possess a straight-line relationship. When nonlinearity is present,
predictions are likely to produce large residuals, leading to underestimated relationships. One
can use scatterplots to assess linearity. In this case, the scatterplot exhibited no extreme values
and, in fact, displayed a random pattern. Therefore, the linearity assumption was met.

74
Homoscedasticity. Homoscedasticity means that the variance around the regression line
is the same for all the values of the predictor variable. Violations in homoscedasticity may cause
one to overestimate the goodness of fit as measured by the Pearson coefficient. To prescreen for
homoscedasticity, the researcher inspected a plot of the standardized predicted values as a
function of the standardized residual values. The researcher examined histogram graphs, P-P
plots, and scatterplots for each model of this study and it revealed no outliers, indicated
normality across the DVs, and displayed only slight deviation from homoscedasticity. The
model did not perfectly meet the homoscedasticity criterion, but that slight deviation did not
warrant transformation of the variables.
Dominant Organizational Culture
Respondents were asked to assess six key aspects of their organizational culture. They
were asked to divide 100 points over four statements. Each of the set of four statements
represented the organizational culture type (clan, adhocracy, market and hierarchy). Using an
excel spreadsheet, the scores were calculated to determine the set of statements that yielded the
highest scores for each respondent. This provided the respondent’s perceived dominant
organizational culture. If the scores were equally distributed between two or more culture types,
culture was considered balanced.
The majority of respondents (61%) perceived their organizational culture as clan cultures.
Clan cultures are friendly places to work, emphasizing teamwork, attachment, membership, and
collaboration (Cameron & Quinn, 2006; Zammuto & O’Connor, 1992). In clan cultures, there is
the pervasive belief that “organizations succeed because they hire, develop, and retain their
human resource base” (Cameron & Quinn, 2006, p. 38). Group dynamics and belonging to the
group are strongly held values of this culture type. Clan cultures encourage participation and

75
involvement and thus are associated with positive employee-level attitudinal outcomes (Hartnell,
Ou, & Kinicki, 2011). Noteworthy, eighty-four percent of those from smaller organizations
(under $50,000 budget) perceived a clan culture in their organization. Only eight respondents in
total, perceived their organization as market culture, six of which were from large organizations
(above $20,000,000 budget). Just three respondents perceived their organization’s culture as
balanced. While hierarchical was the second-most frequently perceived culture types, just 18
percent of the total respondents perceived their culture as hierarchical.
Figure 10. Perceived Organizational Culture Types
Data Analysis: Hypotheses Testing
After screening all the data and determining the culture types, the researcher conducted
an analysis to test the six hypotheses of this study.
Clan, 63 Adhocracy, 10
Hierarchical, 19 Market, 8 Balanced, 3

76
The first hypothesis tested was:
H1: Perceived transformational leadership will positively predict organizational affective
commitment by the employee, controlling for position tenure, time supervised by
manager, gender, age, and position level.
This hypothesis is in response to the question: Do employee’s perceptions of transformational
leadership impact turnover intention and organizational commitment in the nonprofit
workplace?
Specifically, the researcher conducted multiple regression analysis to examine the
relationship between affective commitment and transformational leadership, with various control
variables taken into account. Tables 9, 10, and 11 below summarize the descriptive statistics and
analysis results. Affective commitment (dependent variable) was regressed on transformational
leadership (independent variable) and the control variables (treated as independent variables in
multiple regression) of position tenure, time supervised by manager, gender, age, and position
level. Affective commitment is positively and significantly correlated with transformational
leadership, indicating those who perceive higher levels of transformational leadership have
higher levels of affective commitment. The multiple regression model for all variables
produced R2adj =.293, which was statistically significant (F19, 83 = 3.227, p <.05). With all other
variables held constant, affective commitment scores were positively related to transformational
leadership scores (p <.05). Only one of the control variables, a tenure category (Tenure one –
three years) contributed to the model with statistically significance (p > .05). Tenure was
negatively correlated, which suggests that shorter tenure is predicted of lowered affective
commitment. In other words, those who have not been employed long do not feel the deep sense

77
of belonging and connection to the workplace (affective commitment) compared to those who
have been employed longer.
Table 9 Model Summary H1
Model R R Square Adjusted R Square
Std. Error of the Estimate
1 .652a .425 .293 4.369
a. Predictors: (Constant), Above $20,000,000, 40-49, TL score, Tenure5to7yrs,
time Sup Under 1 yr, Under $500K, Supervisor or Manager, Tenure3to5yrs,
Tenure 1-3 years, 60 and over, $3,00001 - $7,000,000, Time Sup 5 to 7 yrs,
Non-managers, Tenure less than 1 yr, 30-39, Time Sup 3 to 5 yrs, $7,000,001-
$20,000,000, Under 29, Time Sup 7 yrs or more
Table 10 ANOVAa H1
Model Sum of Squares
df Mean Square
F Sig.
1
Regression 1170.140 19 61.586 3.227 .000b
Residual 1584.093 83 19.085
Total 2754.233 102
a. Dependent Variable: Affective commitment
b. Predictors: (Constant), Above $20,000,000, 40-49, TL score, Tenure5to7yrs, time Sup Under
1 yr, Under $500K, Supervisor or Manager, Tenure3to5yrs, Tenure 1-3 years, 60 and over,
$3,00001 - $7,000,000, Time Sup 5 to 7 yrs, Non-managers, Tenure less than 1 yr, 30-39, Time
Sup 3 to 5 yrs, $7,000,001-$20,000,000, Under 29, Time Sup 7 yrs or more

78
Table 11 Coefficientsa H1
Model Unstandardized Coefficients
Standardized Coefficients
t Sig.
B Std. Error Beta
1
(Constant) 15.177 2.484 6.109 .000
TL score .152 .031 .426 4.831 .000
Supervisor or Manager
-.355 1.147 -.031 -.310 .758
Non-managers -.291 1.317 -.023 -.221 .826
Under 29 -2.180 2.259 -.106 -.965 .337
30-39 1.038 1.428 .076 .727 .469
40-49 .597 1.197 .056 .499 .619
60 and over 2.610 1.621 .162 1.610 .111
Tenure less than 1 yr 1.268 2.221 .057 .571 .569
Tenure 1-3 years -3.382 1.654 -.243 -2.045 .044
Tenure3to5yrs -.909 1.573 -.064 -.578 .565
Tenure5to7yrs -.775 1.509 -.048 -.514 .609
Time Sup Under 1 yr -1.476 1.358 -.128 -1.087 .280
Time Sup 3 to 5 yrs -1.307 1.651 -.092 -.792 .431
Time Sup 5 to 7 yrs 1.646 1.809 .098 .910 .366
Time Sup 7 yrs or more
-.242 1.604 -.018 -.151 .881
Under $500K -.167 2.021 -.008 -.083 .934
$3,00001 - $7,000,000
.966 1.295 .077 .746 .458
$7,000,001-$20,000,000
1.370 1.273 .115 1.076 .285
Above $20,000,000 -1.568 1.501 -.110 -1.045 .299
a. Dependent Variable: Affective commitment
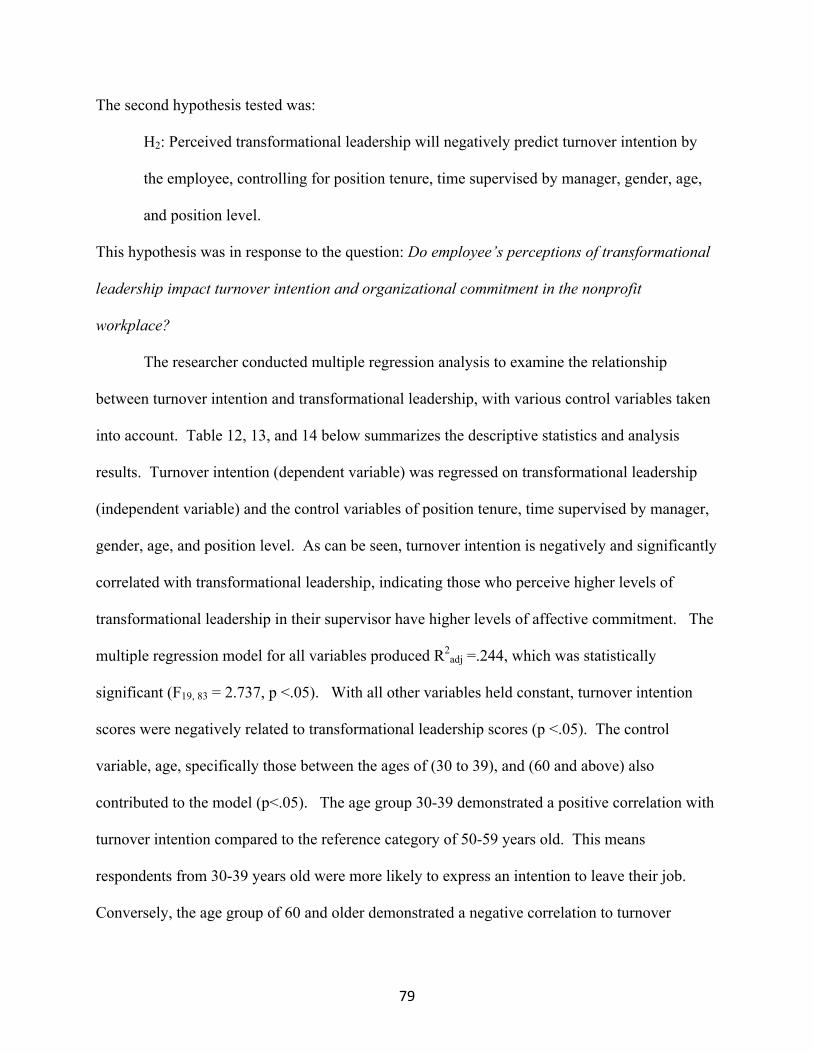
79
The second hypothesis tested was:
H2: Perceived transformational leadership will negatively predict turnover intention by
the employee, controlling for position tenure, time supervised by manager, gender, age,
and position level.
This hypothesis was in response to the question: Do employee’s perceptions of transformational
leadership impact turnover intention and organizational commitment in the nonprofit
workplace?
The researcher conducted multiple regression analysis to examine the relationship
between turnover intention and transformational leadership, with various control variables taken
into account. Table 12, 13, and 14 below summarizes the descriptive statistics and analysis
results. Turnover intention (dependent variable) was regressed on transformational leadership
(independent variable) and the control variables of position tenure, time supervised by manager,
gender, age, and position level. As can be seen, turnover intention is negatively and significantly
correlated with transformational leadership, indicating those who perceive higher levels of
transformational leadership in their supervisor have higher levels of affective commitment. The
multiple regression model for all variables produced R2adj =.244, which was statistically
significant (F19, 83 = 2.737, p <.05). With all other variables held constant, turnover intention
scores were negatively related to transformational leadership scores (p <.05). The control
variable, age, specifically those between the ages of (30 to 39), and (60 and above) also
contributed to the model (p<.05). The age group 30-39 demonstrated a positive correlation with
turnover intention compared to the reference category of 50-59 years old. This means
respondents from 30-39 years old were more likely to express an intention to leave their job.
Conversely, the age group of 60 and older demonstrated a negative correlation to turnover

80
intention, meaning those respondents were less likely to express an intention to leave their job.
The rest of the control variables: gender, tenure, position level and length of time supervised did
not contribute to the model with statistically significance (p > .05).
Table 12 Model Summary H2
Model R R Square Adjusted R Square
Std. Error of the Estimate
1 .621a .385 .244 2.287
a. Predictors: (Constant), Above $20,000,000, 40-49, TL score, Tenure5to7yrs,
time Sup Under 1 yr, Under $500K, Supervisor or Manager, Tenure3to5yrs,
Tenure 1-3 years, 60 and over, $3,00001 - $7,000,000, Time Sup 5 to 7 yrs,
Non-managers, Tenure less than 1 yr, 30-39, Time Sup 3 to 5 yrs, $7,000,001-
$20,000,000, Under 29, Time Sup 7 yrs or more
Table 13 ANOVAa H2
Model Sum of Squares
df Mean Square
F Sig.
1
Regression 272.107 19 14.321 2.737 .001b
Residual 434.301 83 5.233
Total 706.408 102
a. Dependent Variable: Turnover intention
b. Predictors: (Constant), Above $20,000,000, 40-49, TL score, Tenure5to7yrs, time Sup Under
1 yr, Under $500K, Supervisor or Manager, Tenure3to5yrs, Tenure 1-3 years, 60 and over,
$3,00001 - $7,000,000, Time Sup 5 to 7 yrs, Non-managers, Tenure less than 1 yr, 30-39, Time
Sup 3 to 5 yrs, $7,000,001-$20,000,000, Under 29, Time Sup 7 yrs or more

81
Table 14 Coefficientsa H2
Model Unstandardized Coefficients
Standardized Coefficients
t Sig.
B Std. Error Beta
1
(Constant) 8.157 1.301 6.271 .000
TL score -.069 .016 -.382 -4.186 .000
Supervisor or Manager
-.374 .601 -.065 -.623 .535
Non-managers -.754 .690 -.116 -1.093 .278
Under 29 .790 1.183 .076 .668 .506
30-39 1.498 .747 .217 2.004 .048
40-49 .197 .627 .036 .314 .754
60 and over -1.881 .849 -.230 -2.216 .029
Tenure less than 1 yr -.865 1.163 -.077 -.744 .459
Tenure 1-3 years 1.359 .866 .193 1.569 .121
Tenure3to5yrs .471 .824 .065 .572 .569
Tenure5to7yrs 1.453 .790 .178 1.839 .070
Time Sup Under 1 yr .536 .711 .092 .754 .453
Time Sup 3 to 5 yrs .259 .864 .036 .299 .766
Time Sup 5 to 7 yrs -.631 .947 -.074 -.666 .507
Time Sup 7 yrs or more
1.368 .840 .203 1.628 .107
Under $500K -.057 1.058 -.005 -.054 .957
$3,00001 - $7,000,000
-.745 .678 -.117 -1.099 .275
$7,000,001-$20,000,000
-.469 .667 -.078 -.703 .484
Above $20,000,000 .939 .786 .130 1.195 .236
a. Dependent Variable: Turnover intention

82
The third hypothesis tested was:
H3: Perceived organizational culture types (clan, hierarchy, adhocracy, market, balanced)
are predictive of the employee’s turnover intention, controlling for position tenure, time
supervised by manager, gender, age, and position level.
This hypothesis was in response to the question: Do employee’s perceptions of organizational
culture impact turnover intention and organizational commitment in the nonprofit workplace?
The researcher used multiple regression analysis to examine the relationship between
turnover intention and the potential predictor, dominant organizational culture types, and with
various control variables taken into account. Table 15, 16, and 17 below summarizes the
descriptive statistics and analysis results. Turnover intention (dependent variable) was regressed
on dominant organizational culture types (independent variable) and the control variables of
position tenure, time supervised by manager, gender, age, and position level. The multiple
regression model for all variables produced R2adj =.426, which was statistically significant (F22, 80
= 4.442, p <.05). With all other variables held constant, turnover intention scores were related
hierarchical and market cultures when compared to the clan reference group (p <.05). In other
words, those employees who perceived their organization to be hierarchical or market, were
more likely to think about leaving their workplace.
Consistent with the second hypothesis, the age group (30-39), with a positive correlation,
and (60 and older), with a negative correlation also contributed to the model (p < .05) with
turnover intention. This suggests respondents in their thirties were more likely to express an
intention to leave their job. Conversely, the age group of 60 and older demonstrated a negative
correlation to turnover intention, meaning those respondents were less likely to express an

83
intention to leave their job. The rest of the control variables: gender, tenure, position level and
length of time supervised did not contribute to the model with statistically significance (p > .05).
Table 15 Model Summary H3
Model R R Square Adjusted R Square
Std. Error of the Estimate
1 .742a .550 .426 1.994
a. Predictors: (Constant), Above $20,000,000, Hierarchical, Tenure less than 1
yr, 60 and over, Time Sup 3 to 5 yrs, Balanced, Tenure5to7yrs, Supervisor or
Manager, Under 29, Adhocracy, $3,00001 - $7,000,000, 30-39, Time Sup 5 to 7
yrs, Under $500K, Time Sup 7 yrs or more, Non-managers, 50- 59,
Tenure3to5yrs, Market, $7,000,001-$20,000,000, Time Sup 1 to 3 yrs, Tenure
1-3 years
Table 16 ANOVAa H3
Model Sum of Squares
df Mean Square
F Sig.
1
Regression 388.425 22 17.656 4.442 .000b
Residual 317.983 80 3.975
Total 706.408 102
a. Dependent Variable: Turnover intention
b. Predictors: (Constant), Above $20,000,000, Hierarchical, Tenure less than 1 yr, 60 and over,
Time Sup 3 to 5 yrs, Balanced, Tenure5to7yrs, Supervisor or Manager, Under 29, Adhocracy,
$3,00001 - $7,000,000, 30-39, Time Sup 5 to 7 yrs, Under $500K, Time Sup 7 yrs or more,
Non-managers, 50- 59, Tenure3to5yrs, Market, $7,000,001-$20,000,000, Time Sup 1 to 3 yrs,
Tenure 1-3 years
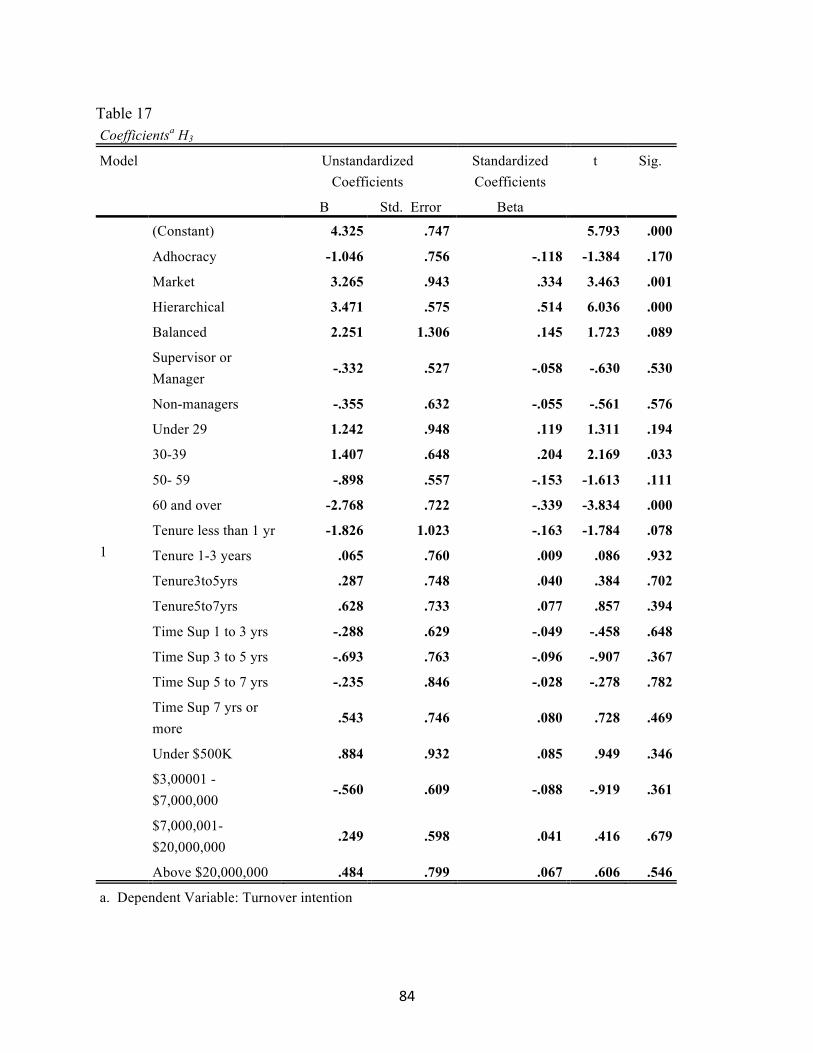
84
Table 17 Coefficientsa H3
Model Unstandardized Coefficients
Standardized Coefficients
t Sig.
B Std. Error Beta
1
(Constant) 4.325 .747 5.793 .000
Adhocracy -1.046 .756 -.118 -1.384 .170
Market 3.265 .943 .334 3.463 .001
Hierarchical 3.471 .575 .514 6.036 .000
Balanced 2.251 1.306 .145 1.723 .089
Supervisor or Manager
-.332 .527 -.058 -.630 .530
Non-managers -.355 .632 -.055 -.561 .576
Under 29 1.242 .948 .119 1.311 .194
30-39 1.407 .648 .204 2.169 .033
50- 59 -.898 .557 -.153 -1.613 .111
60 and over -2.768 .722 -.339 -3.834 .000
Tenure less than 1 yr -1.826 1.023 -.163 -1.784 .078
Tenure 1-3 years .065 .760 .009 .086 .932
Tenure3to5yrs .287 .748 .040 .384 .702
Tenure5to7yrs .628 .733 .077 .857 .394
Time Sup 1 to 3 yrs -.288 .629 -.049 -.458 .648
Time Sup 3 to 5 yrs -.693 .763 -.096 -.907 .367
Time Sup 5 to 7 yrs -.235 .846 -.028 -.278 .782
Time Sup 7 yrs or more
.543 .746 .080 .728 .469
Under $500K .884 .932 .085 .949 .346
$3,00001 - $7,000,000
-.560 .609 -.088 -.919 .361
$7,000,001-$20,000,000
.249 .598 .041 .416 .679
Above $20,000,000 .484 .799 .067 .606 .546
a. Dependent Variable: Turnover intention

85
The fourth hypothesis to be tested is:
H4: Perceived organizational culture types (clan, hierarchy, adhocracy, market, balanced)
are predictive of employee’s organizational affective commitment, controlling for
position tenure, time supervised by manager, gender, age, and position level.
This hypothesis was in response to the question: Do employee’s perceptions of organizational
culture impact turnover intention and organizational commitment in the nonprofit workplace?
The researcher conducted multiple regression to examine the relationship between
affective commitment and the potential predictor, dominant organizational culture types, and
accounting for various control variables. Table 18, 19, and 20 below summarizes the descriptive
statistics and analysis results. Affective commitment (dependent variable) was regressed on
dominant organizational culture types (independent variable) and the control variables of
position tenure, time supervised by manager, gender, age, and position level. The multiple
regression model for all variables produced R2adj =.282, which was statistically significant (F22, 80
=2.825, p <.05). With all other variables held constant, affective commitment scores were
negatively related to hierarchical culture types (p <.05) when compared with the reference group,
clan cultures. This indicates that hierarchical cultures may be a factor in an employee’s lowered
affective commitment. This has implications for nonprofit organizations that have high levels of
controls, formality and hierarchical chain of command.
None of the other dominant culture types when compared to the reference group, clan
cultures, predicted affective commitment with statistical significance (p< .05). None of the
control variables: gender, tenure, budget size, position level and length of time supervised,
contributed to the model with statistically significance (p > .05).
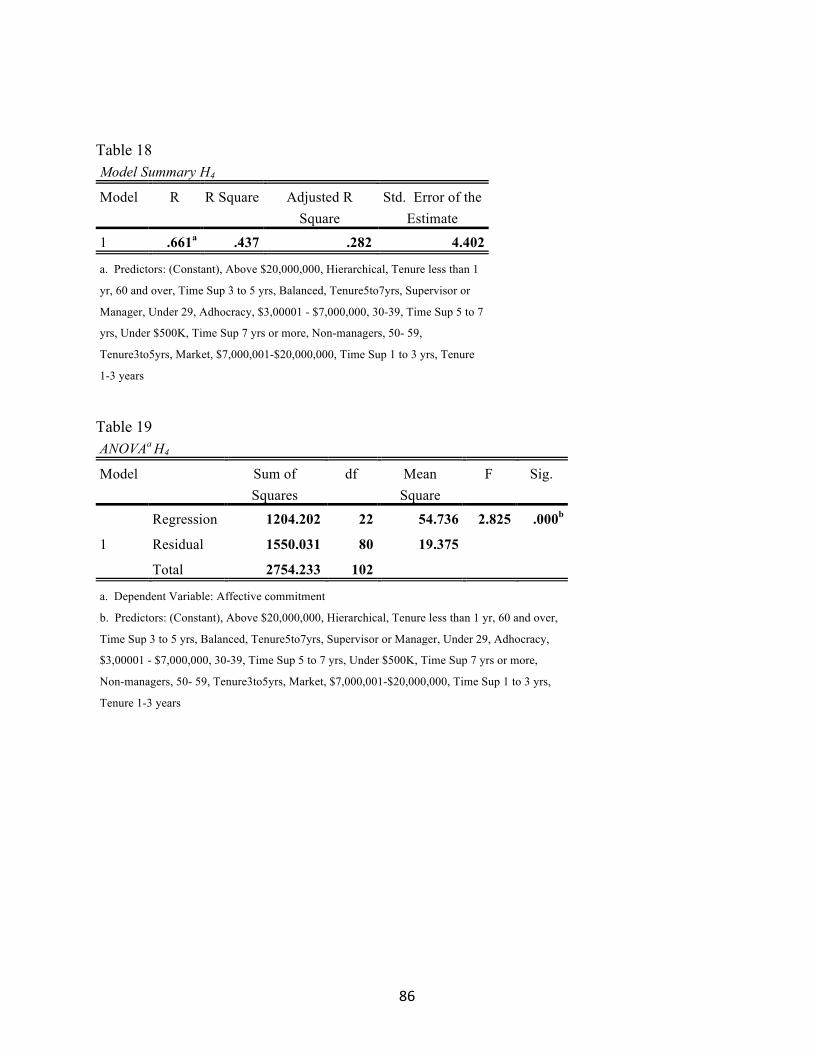
86
Table 18 Model Summary H4
Model R R Square Adjusted R Square
Std. Error of the Estimate
1 .661a .437 .282 4.402
a. Predictors: (Constant), Above $20,000,000, Hierarchical, Tenure less than 1
yr, 60 and over, Time Sup 3 to 5 yrs, Balanced, Tenure5to7yrs, Supervisor or
Manager, Under 29, Adhocracy, $3,00001 - $7,000,000, 30-39, Time Sup 5 to 7
yrs, Under $500K, Time Sup 7 yrs or more, Non-managers, 50- 59,
Tenure3to5yrs, Market, $7,000,001-$20,000,000, Time Sup 1 to 3 yrs, Tenure
1-3 years
Table 19 ANOVAa H4
Model Sum of Squares
df Mean Square
F Sig.
1
Regression 1204.202 22 54.736 2.825 .000b
Residual 1550.031 80 19.375
Total 2754.233 102
a. Dependent Variable: Affective commitment
b. Predictors: (Constant), Above $20,000,000, Hierarchical, Tenure less than 1 yr, 60 and over,
Time Sup 3 to 5 yrs, Balanced, Tenure5to7yrs, Supervisor or Manager, Under 29, Adhocracy,
$3,00001 - $7,000,000, 30-39, Time Sup 5 to 7 yrs, Under $500K, Time Sup 7 yrs or more,
Non-managers, 50- 59, Tenure3to5yrs, Market, $7,000,001-$20,000,000, Time Sup 1 to 3 yrs,
Tenure 1-3 years

87
Table 20 Coefficientsa H4
Model Unstandardized Coefficients
Standardized Coefficients
t Sig.
B Std. Error Beta
1
(Constant) 23.711 1.648 14.386 .000
Adhocracy -.394 1.669 -.023 -.236 .814
Market -2.730 2.082 -.141 -1.311 .194
Hierarchical -6.157 1.270 -.462 -4.850 .000
Balanced -3.392 2.884 -.110 -1.176 .243
Supervisor or Manager
-.682 1.163 -.060 -.586 .559
Non-managers -1.091 1.396 -.085 -.781 .437
Under 29 -3.926 2.092 -.191 -1.877 .064
30-39 .569 1.432 .042 .397 .692
50- 59 .665 1.229 .057 .541 .590
60 and over 2.985 1.594 .185 1.873 .065
Tenure less than 1 yr 2.815 2.260 .127 1.246 .217
Tenure 1-3 years -.943 1.678 -.068 -.562 .575
Tenure 3to5yrs -.063 1.652 -.004 -.038 .970
Tenure 5to7yrs 1.113 1.619 .069 .688 .494
Time Sup 1 to 3 yrs 1.235 1.388 .106 .889 .376
Time Sup 3 to 5 yrs .709 1.686 .050 .421 .675
Time Sup 5 to 7 yrs 2.456 1.867 .147 1.315 .192
Time Sup 7 yrs or more
2.622 1.647 .197 1.591 .115
Under $500K -1.603 2.057 -.078 -.779 .438
$3,00001 - $7,000,000
.797 1.345 .063 .592 .555
$7,000,001-$20,000,000
.401 1.320 .034 .304 .762
Above $20,000,000 -1.738 1.765 -.122 -.985 .328
a. Dependent Variable: Affective commitment

88
The fifth hypothesis to be tested was:
H5: Perceived organizational culture type is a statistically significant moderator of the
relationship between perceived transformational leadership style and employee’s
affective commitment, controlling for position tenure, time supervised by manager,
gender, age, and position level.
This hypothesis was in response to the question: Do employee’s perception of organizational
culture change how transformational leadership impacts how organizational commitment and
turnover intention?
The researcher used multiple regression to investigate whether the relationship between
transformational leadership and affective commitment depended on the perceived dominant
organizational culture type in the nonprofit employee’s workplace, controlling for various
variables: gender, age, tenure, position level, length of time supervised by manager. To do this,
an interaction effect was added to the model to incorporate the effect of two variables on the
dependent variable over and above their separate effects (Dattalo, 2013). However,
multicollinearity is common when creating interaction terms, so transformations are often done.
This involves centering variables, or subtracting the individual variable value from the mean of
the set of variables to create a centered value. Centering constituent continuous independent
variables before computing the interaction term can minimize the multicollinearity (Aiken &
West, 1991). New variables were created in SPSS to create interaction terms
(TL_Clan_Centered; TL_Adhocracy_Centered; TL_Hierarchical_Centered;
TL_Market_Centered; and TL_Balanced_Centered) by calculating the product of the
transformational leadership variable and each of the dominant organizational culture types.

89
The centered variables were entered with other variables in a simultaneous regression
model. This produced R2adj =.320, which was statistically significant (F26, 76 = 2.848, p <.05).
With all other variables held constant, the interaction term, TL_Hierachical_Centered was a
statistically significant moderator on the relationship between transformational leadership and
affective commitment scores (p >.05) presenting a negative correlation between the variables.
This means that hierarchical cultures impacted the relationship between the respondent’s
perception of transformational leadership and their affective commitment with significance.
Another way of looking at this, is hierarchical cultures were negatively related to affective
commitment. However, when jointly considered, hierarchical cultures and transformational
leadership scores are statistically significant and positively correlated with affective
commitment. This change and statistical significance, supports the hypothesis. The results also
suggest that while hierarchical cultures are problematic to nonprofit employee’s commitment,
those hierarchical cultures with leaders perceived to be transformational, still demonstrate a
positive relationship with the employee’s affective commitment.
Consistent with the above hypothesis, the control variable age category (60 y/o and over),
also contributed to the model, with a statistically significant correlation (p< .05). The rest of the
control variables: gender, tenure, position level and length of time supervised did not contribute
to the model with statistically significance (p > .05). Tables 21, 22, and 23 provide the model
summary, ANOVA and coefficients outlining the results of H5.

90
Table 21 Model Summary H5
Model R R Square Adjusted R Square
Std. Error of the Estimate
1 .702a .494 .320 4.284
a. Predictors: (Constant), TL_Balanced_Centered, TL_Adhocracy_Centered,
TL_Market_Centered, TL_Hierarchical_Centered, Supervisor or Manager,
Under $500K, 60 and over, Tenure 1-3 years, time Sup Under 1 yr,
Tenure5to7yrs, $7,000,001-$20,000,000, Adhocracy, 50- 59, Market, Balanced,
Time Sup 5 to 7 yrs, $3,00001 - $7,000,000, Tenure3to5yrs, Tenure less than 1
yr, Under 29, Non-managers, 30-39, Hierarchical, Time Sup 3 to 5 yrs, Time
Sup 7 yrs or more, Above $20,000,000
Table 22 ANOVAa H5
Model Sum of Squares
df Mean Square
F Sig.
1
Regression 1359.223 26 52.278 2.848 .000b
Residual 1395.010 76 18.355
Total 2754.233 102
a. Dependent Variable: Affective commitment
b. Predictors: (Constant), TL_Balanced_Centered, TL_Adhocracy_Centered,
TL_Market_Centered, TL_Hierarchical_Centered, Supervisor or Manager, Under $500K, 60
and over, Tenure 1-3 years, time Sup Under 1 yr, Tenure5to7yrs, $7,000,001-$20,000,000,
Adhocracy, 50- 59, Market, Balanced, Time Sup 5 to 7 yrs, $3,00001 - $7,000,000,
Tenure3to5yrs, Tenure less than 1 yr, Under 29, Non-managers, 30-39, Hierarchical, Time Sup
3 to 5 yrs, Time Sup 7 yrs or more, Above $20,000,000

91
Table 23 Coefficientsa H5
Model Unstandardized Coefficients Standardized
Coefficients
T Sig.
B Std. Error Beta
1
(Constant) 23.994 1.795 13.366 .000
Adhocracy -.544 1.633 -.031 -.333 .740
Market -2.670 2.068 -.138 -1.291 .201
Hierarchical -4.261 1.456 -.320 -2.926 .005
Balanced -3.233 2.993 -.105 -1.080 .283
Supervisor or Manager -.426 1.136 -.037 -.375 .709
Non-managers -.920 1.431 -.072 -.643 .522
Under 29 -3.306 2.106 -.161 -1.570 .121
30-39 -.052 1.470 -.004 -.035 .972
50- 59 .633 1.243 .054 .509 .612
60 and over 3.163 1.583 .196 1.999 .049
Tenure less than 1 yr 1.551 2.310 .070 .672 .504
Tenure 1-3 years -1.471 1.648 -.106 -.893 .375
Tenure3to5yrs -.181 1.632 -.013 -.111 .912
Tenure5to7yrs .586 1.602 .036 .366 .716
time Sup Under 1 yr -.062 1.444 -.005 -.043 .966
Time Sup 3 to 5 yrs .094 1.716 .007 .055 .956
Time Sup 5 to 7 yrs 1.541 1.869 .092 .824 .412
Time Sup 7 yrs or more 1.142 1.646 .086 .693 .490
Under $500K -.686 2.048 -.033 -.335 .738
$3,00001 - $7,000,000 1.714 1.364 .136 1.256 .213
$7,000,001-$20,000,000 1.541 1.359 .129 1.134 .260
Above $20,000,000 -.759 1.787 -.053 -.425 .672
TL_Adhocracy_Centered .064 .127 .047 .504 .616
TL_Market_Centered .068 .080 .085 .854 .396
TL_Hierarch_Centered .205 .080 .277 2.565 .012
TL_Balanced_Centered .412 .501 .076 .822 .414
a. Dependent Variable: Affective commitment

92
The sixth hypotheses to be tested was:
H6: Perceived organizational culture type is a statistically significant moderator of the
relationship between perceived transformational leadership style and employees’ turnover
intention, controlling for position tenure, time supervised by manager, gender, age, and
position level.
The sixth hypothesis analyzes the moderating effect of dominant organizational culture
types on the relationship between transformational leadership on turnover intention, controlling
for various variables: gender, age, tenure, position level, length of time supervised by manager.
Using the centered interaction terms (TL_Clan_Centered; TL_Adhocracy_Centered;
TL_Hierarchical_Centered; TL_Market_Centered; and TL_Balanced_Centered) the moderation
analysis was conducted to incorporate the effect of two variables on the dependent variable over
and above their separate effects (Dattalo, 2013).
The multiple regression model for all variables produced R2adj =.422, which was
statistically significant (F26, 76 =3.862, p <.05). Consistent with the second hypothesis, market
and hierarchical cultures are negatively related to turnover intention. However, the sixth
hypothesis was not supported in this model. Upon examining the interaction between each of
the culture types and transformational leadership, none of the relationships showed any statistical
significance. Tables 24, 25, and 26 below outline the results. The control variable age groups
(30- 39 and 60 and over) also contributed to the model, with a statistically significant correlation
(p<.05). This means respondents in thirties age group were more likely to express an intention to
leave their job. Conversely, the age group of 60 and older demonstrated a negative correlation to
turnover intention, meaning those respondents were less likely to express an intention to leave

93
their job. The rest of the control variables: gender, tenure, position level and length of time
supervised did not contribute to the model with statistically significance (p > .05).
Table 24 Model Summary H6
Model R R Square
Adjusted R Square
Std. Error of the Estimate
1 .754a .569 .422 2.001
a. Predictors: (Constant), TL_Balanced_Centered, TL_Adhocracy_Centered,
TL_Market_Centered, TL_Hierarchical_Centered, Supervisor or Manager,
Under $500K, 60 and over, Tenure 1-3 years, time Sup Under 1 yr,
Tenure5to7yrs, $7,000,001-$20,000,000, Adhocracy, 50- 59, Market, Balanced,
Time Sup 5 to 7 yrs, $3,00001 - $7,000,000, Tenure3to5yrs, Tenure less than 1
yr, Under 29, Non-managers, 30-39, Hierarchical, Time Sup 3 to 5 yrs, Time
Sup 7 yrs or more, Above $20,000,000
Table 25 ANOVAa H6 Model Sum of
Squares df Mean
Square F Sig.
1
Regression
402.078 26 15.465 3.862 .000b
Residual 304.330 76 4.004
Total 706.408 102
a. Dependent Variable: Turnover intention
b. Predictors: (Constant), TL_Balanced_Centered, TL_Adhocracy_Centered,
TL_Market_Centered, TL_Hierarchical_Centered, Supervisor or Manager, Under $500K, 60
and over, Tenure 1-3 years, time Sup Under 1 yr, Tenure5to7yrs, $7,000,001-$20,000,000,
Adhocracy, 50- 59, Market, Balanced, Time Sup 5 to 7 yrs, $3,00001 - $7,000,000,
Tenure3to5yrs, Tenure less than 1 yr, Under 29, Non-managers, 30-39, Hierarchical, Time Sup
3 to 5 yrs, Time Sup 7 yrs or more, Above $20,000,000
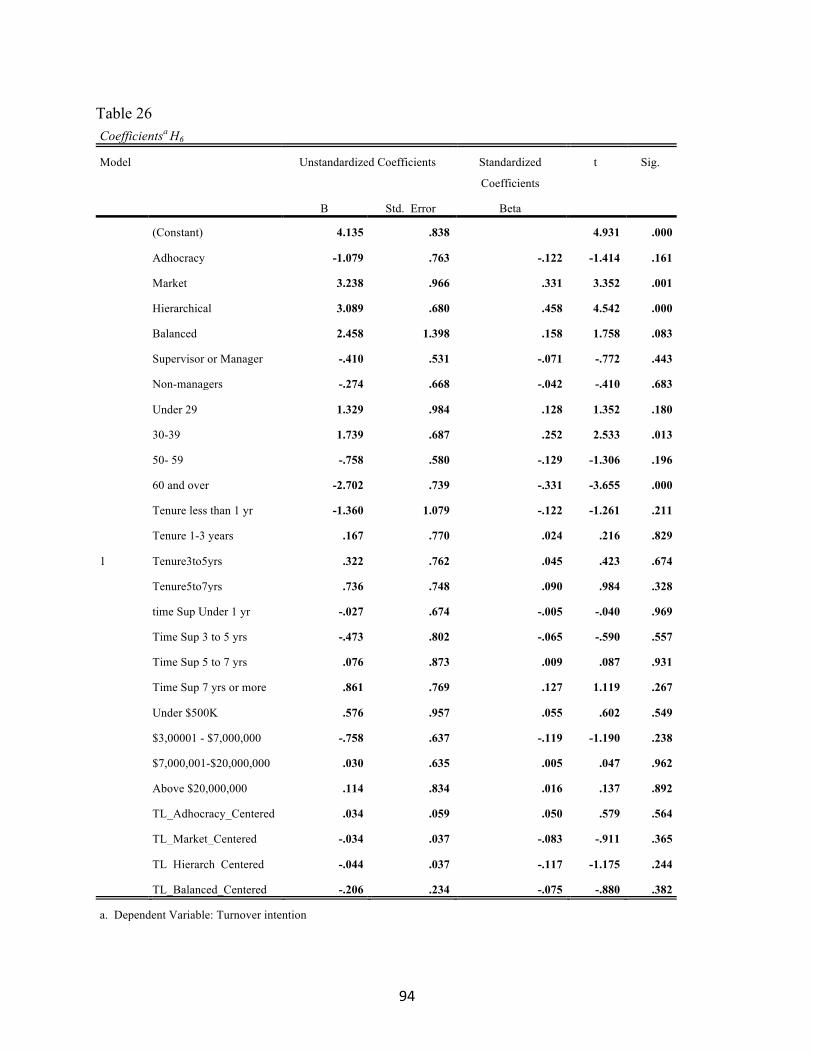
94
Table 26 Coefficientsa H6
Model Unstandardized Coefficients Standardized
Coefficients
t Sig.
B Std. Error Beta
1
(Constant) 4.135 .838 4.931 .000
Adhocracy -1.079 .763 -.122 -1.414 .161
Market 3.238 .966 .331 3.352 .001
Hierarchical 3.089 .680 .458 4.542 .000
Balanced 2.458 1.398 .158 1.758 .083
Supervisor or Manager -.410 .531 -.071 -.772 .443
Non-managers -.274 .668 -.042 -.410 .683
Under 29 1.329 .984 .128 1.352 .180
30-39 1.739 .687 .252 2.533 .013
50- 59 -.758 .580 -.129 -1.306 .196
60 and over -2.702 .739 -.331 -3.655 .000
Tenure less than 1 yr -1.360 1.079 -.122 -1.261 .211
Tenure 1-3 years .167 .770 .024 .216 .829
Tenure3to5yrs .322 .762 .045 .423 .674
Tenure5to7yrs .736 .748 .090 .984 .328
time Sup Under 1 yr -.027 .674 -.005 -.040 .969
Time Sup 3 to 5 yrs -.473 .802 -.065 -.590 .557
Time Sup 5 to 7 yrs .076 .873 .009 .087 .931
Time Sup 7 yrs or more .861 .769 .127 1.119 .267
Under $500K .576 .957 .055 .602 .549
$3,00001 - $7,000,000 -.758 .637 -.119 -1.190 .238
$7,000,001-$20,000,000 .030 .635 .005 .047 .962
Above $20,000,000 .114 .834 .016 .137 .892
TL_Adhocracy_Centered .034 .059 .050 .579 .564
TL_Market_Centered -.034 .037 -.083 -.911 .365
TL_Hierarch_Centered -.044 .037 -.117 -1.175 .244
TL_Balanced_Centered -.206 .234 -.075 -.880 .382
a. Dependent Variable: Turnover intention

95
Chapter Summary
The purpose of this study is to examine the relationship of nonprofit employees’
perceived transformational leadership and perceived organizational culture types (clan,
adhocracy, hierarchy, market) on two important and distinct employee outcomes, affective
commitment and turnover intention. Upon completion of the multiple linear regression analysis,
several findings were demonstrated. First, this study indicates that perceived transformational
leadership does positively predict nonprofit employees’ affective commitment. Second,
perceived transformational leadership negatively predicts turnover intention in nonprofit
employees. Third, certain perceived organizational culture types (hierarchical and market) do
positively predict employees’ turnover intentions. Fourth, perceived hierarchical cultures
negatively predict the employee’ affective commitment. While hierarchical cultures, considered
alone, negatively predicted affective commitment, the relationship changes when this culture
type is considered jointly with perceived transformational leadership. Therefore, fifth finding
was that hierarchical culture was a statistically significant moderator on the relationship between
transformational leadership and affective commitment scores. Lastly, none of the dominant
organizational cultures were statistically significant moderators on the relationship between
transformational leadership and affective commitment scores when compared to the reference
variable, clan culture.
.

96
Chapter 5: Discussion and Implications of Study
This chapter synthesizes the material developed in the first four chapters and offers a
discussion of findings, which provides interpretations of both descriptive and hypotheses results.
The chapter outlines the benefits and limitations related to the chosen research design, followed
by recommendations for future research. The last section provides policy and practical
implications for this study.
Discussion of Findings
Three research questions guided this research and led to the six hypotheses for this study.
The questions were: (a) Do employees’ perceptions of transformational leadership impact
turnover intention and organizational commitment in the nonprofit workplace? (b) Do
employees’ perceptions of organizational culture impact turnover intention and organizational
commitment in the nonprofit workplace? (c) Do employees’ perceptions of organizational
culture change how transformational leadership impacts organizational commitment and
turnover intention? An overview of the six hypotheses’ tests is provided in Table 27 below.

97
Table 27
Hypotheses Testing Summary
Hypothesis Supported? R2
adj
H1: Perceived transformational leadership will positively predict
organizational affective commitment by the employee,
controlling for position tenure, time supervised by manager,
gender, age, and position level.
Yes. .293
H2: Perceived transformational leadership will negatively
predict turnover intention by the employee, controlling for
position tenure, time supervised by manager, gender, age, and
position level.
Yes. .244
H3: Perceived organizational culture types (clan, hierarchy,
adhocracy, market, balanced) are predictive of employee’s
turnover intention, controlling for position tenure, time
supervised by manager, gender, age, and position level.
Yes. Hierarchy and market
.426
H4: Perceived organizational culture types (clan, hierarchy,
adhocracy, market, balanced) are predictive of employee’s
affective commitment, controlling for position tenure, time
supervised by manager, gender, age, and position level.
Yes. Hierarchy
.282
H5: Perceived organizational culture type is a statistically
significant moderator of the relationship between perceived
transformational leadership style and employees’ affective
commitment, controlling for position tenure, time supervised by
manager, gender, age, and position level.
Yes. Hierarchy
.320
H6: Perceived organizational culture type is a statistically
significant moderator of the relationship between perceived
transformational leadership style and employees’ turnover
intention, controlling for position tenure, time supervised by
manager, gender, age, and position level.
No. .422

98
Impact of Transformational Leadership on Turnover and Commitment
To answer the first question posed, the study tested two hypotheses, using multiple
regression to understand the employees’ perceptions of transformational leadership with
affective commitment and turnover intention. Figure 11 and Figure 12 illustrate the first two
models.
Figure 11. Transformational Leadership predicting Affective Commitment.
Figure 12. Transformational Leadership predicting Turnover Intention.
The first finding of this study indicated that perceived transformational leadership does
positively predict nonprofit employees’ affective commitment. This confirmed the findings from
previous leadership studies conducted in the for-profit and government sectors. A previous study
positively linked transformational leadership to organizational commitment and worker
engagement (Zhu, Avolio, & Walumbwa, 2009). Similarly, in a study focused on the South
Korean local government, Kim (2014) found that transformational leadership had a significant
positive effect on affective commitment for employees. Jackson, Meyer, and Wang (2013) also
found a positive relationship between transformational leadership and affective organizational

99
commitment in a meta-analytic study across different cultures. This study adds organizational
commitment to the positive outcomes of transformational leadership.
The second finding of this study indicated that perceived transformational leadership
negatively predicted turnover intention in nonprofit employees. This too confirms previous
studies from the for-profit sector that have linked transformational leadership to turnover
intention (Bycio et al., 1995; Hughes et al., 2010; Rafferty & Griffin, 2004). These results offer
further empirical support for Bass’ theory that transformational leadership leads to employee
outcomes, considered important to the employee’s feelings and perceptions about their
workplace.
The study responded to the suggestion from Riggio and Orr (2004) over a decade ago,
who noted that transformational leadership has relevance for the nonprofit sector and should be
explored by scholars. Mary (2005) answered that call, studying the transformational leadership
of nonprofit human service chief executive officers. That study found that transformational
leadership was positively related to better employee outcomes (extra effort, job satisfaction,
satisfaction of leader). This study sought to build upon the limited body of research on
transformational leadership within nonprofit organizations and add a new dimension,
organizational culture to the analysis.
Impact of Organizational Culture on Turnover and Commitment
To answer the second question posed, using multiple regression, the study tested the next
second set of hypotheses dealing with how employees’ perceptions of their organizational culture
impact their commitment and turnover intention. To answer this question, the study focused on
two more regression models, which are illustrated in Figure 13 and Figure 14. These models
also used control variables, which will be discussed in a later section. In this study, hierarchy

100
and market cultures positively predicted employees’ turnover intentions and hierarchical cultures
negatively predicted the employee’ affective commitment.
Figure 13. Organizational Culture Type Relationship to Turnover Intention
Figure 14. Organizational Culture Type Relationship to Affective Commitment
This study took models of leadership and organizational culture from the literature of for-
profit organizations and applied them to nonprofit organizations. The findings suggested that
nonprofit organizations may be better off valuing their volunteerism roots and embracing a
collaborative clan culture instead of becoming more like a for-profit business. This notion that
organizational culture impacts employees’ commitment challenges Bass’ leader-centric
perspective which suggests the manager alone impacts positive employee-related outcomes, such
as commitment. The finding also raises questions about nonprofit organizations becoming more
like a business. Further, for-profit business may learn about commitment and turnover from the
nonprofit sector. The results provided an answer to the second research question with evidence
that organizational culture does impact nonprofit employees’ affective commitment and turnover
intention. It also raised questions about the potentially problematic nature of hierarchical and

101
market cultures for employees. The findings suggest that an understanding of cultures in
nonprofit organizations is critical to addressing the staff retention crisis in the sector.
This study sought to understand the employees’ perceptions of their organization’s
culture type and investigate its relationship to affective commitment and turnover intention.
Respondents were asked to score sets of four statements on the survey and each of the four
reflected one of the competing values culture types’ values. The culture types are: clan,
hierarchy, adhocracy and market. Each culture type represents a shared set of values of the
members. These organizational values are influenced by the external demands and changing
community needs experienced by its members. Like the respondents’ organizations from this
study, Salamon (2012) suggests nonprofit organizations are operating with conflicting identities
and are forced to adapt to several internal and external demands. The tension created by these
demands stem from the sector’s history rooted in volunteerism, civic activism and philanthropy,
competing with the expectations of professionalism, efficiency, and commercialism (Salamon,
2012). These organizations are a part of a market driven sector, yet they are mission-driven and
serve an important public purpose (Salamon, 2012).
The notion of these competing impulses shaping the nonprofit sector, led to the adoption
of one of the theoretical frameworks of this study, the competing values framework. The
competing values framework was not designed for the nonprofit sector, but it does respond to the
idea that organizations are confronted by competing tensions which relate to the external
demands of the market, the internal needs of its employees, and the degree of formality in the
management style and structure. How members respond and resolve these competing tensions
lead to espoused values and characteristic culture types.

102
One surprising finding was that most (61 percent) employees perceived their
organizational culture as clan, or collaborative cultures, illustrated in Figure 15. This may
support Salamon’s assertion that while nonprofit organizations are more market-driven than in
the past, they are at the same time compelled by the impulse of their volunteerism roots.
Nonprofit organizations may be better able to balance this with creating an environment by
keeping an internal focus on their members, while still responding to the external demands of the
market. This implies that the for-profit business sector may be able to learn something from the
nonprofit sector, related to workforce retention and commitment. Another noteworthy finding is
that eighty-four percent of those from smaller organizations (under $50,000 budget) perceived a
clan culture in their organization. Just eight respondents perceived their organization as market
culture, six of which were from large organizations (above $20,000,000 budget). This raises
questions about the size of the nonprofit and organizational culture. It is possible and logical
that as the size of the nonprofit grows, so too does the market driven nature. This is an area for
future research.
Figure 15. Breakdown of Dominant Organizational Cultures.
Clan, 63 Adhocracy, 10
Hierarchical, 19
Market, 8 Balanced, 3

103
Interaction of Transformational Leadership and Organizational Culture
The last research question seeks to understand the impact of both transformational
leadership and organizational culture types with employees’ affective commitment and turnover
intention. Therefore, the next two regression models used moderation analysis, to discover
whether the relationship between transformational leadership and affective commitment depends
on the kind of organizational culture one experiences. Figure 16 and Figure 17 illustrate the
models below.
Figure 16. Moderating Effect of Organizational Culture on
Transformational Leadership and Affective Commitment.
Figure 17. Moderating Effect of Organizational Culture on
Transformational Leadership and Turnover Intention.

104
The third question of the study asked if organizational culture should be considered and
studied in conjunction with transformational leadership. This study asserted that
transformational leadership alone does not offer a comprehensive understanding of the nonprofit
employee’s experience in the workplace, nor does it tell the complete story about the factors that
relate to affective commitment and turnover intention. As we have seen, Schein (2010)
recommended studying culture and leadership, because they have reciprocal influences on each
other, provide similar functions in organizations, and each reinforces how employees meet
organizational goals. Bass and Avolio (1993) also acknowledged that leadership and
organizational culture may be so interconnected that it is possible to observe a transformational
culture in an organization (Bass & Avolio, 1993), yet most of their studies focus on leadership
solely.
As previously stated, the fourth finding showed that hierarchical cultures, considered
alone, negatively predicted affective commitment. However, in the fifth finding the relationship
changes when hierarchical culture is regressed with perceived transformational leadership on
employees; affective commitment and turnover intentions. While there is support for the fifth
hypothesis, the finding demonstrates the relative importance of transformational leadership to
nonprofit employees. The last two findings showed that the positive predictive relationship of
transformational leadership and affective commitment remained and the negative predictive
relationship of transformational leadership and turnover intention did not depend on the
perceived organizational culture.
In summary, this study demonstrated several findings that can help better address the
retention and commitment problem in the nonprofit sector outlined above. The first noteworthy
finding was that a majority of respondents perceived their organizations as clan cultures, which

105
are known to be friendly, personal places where belonging and connectedness is high. This
culture type is positively linked to commitment and negatively linked to turnover intention. The
findings also revealed that compared to clan cultures, hierarchical and market cultures positively
predicted the employees’ turnover intentions. Further, perceived hierarchical cultures negatively
predicted the employees’ affective commitment. The study also found that perceived
transformational leadership mattered to nonprofit employees as it too, positively predicted their
affective commitment and negatively predicted their turnover intentions. The findings also
revealed that hierarchical cultures played a role in this predictive relationship. Additionally, the
predictive power, as measured by the R2adj, was higher when measuring both organizational
culture and transformational leadership with the employee-related outcomes. This is further
evidence supporting the importance of considering both the manager’s leadership and the
organizational culture when addressing the staff retention problem in the nonprofit sector.
Compared to other cultures, clan cultures combined with transformational leadership was
positively predictive of affective commitment and negatively predictive of turnover intention.
In fact, the R2adj showed that the combination of organizational culture and transformational
leadership had a higher predictive power, then when considering each alone.
Limitations of Study
There were several benefits and limitations in the quantitative, cross-sectional survey
design that this study employed. Survey research is implemented with the general purpose of
investigating characteristics, attitudes, behaviors, or opinions of the targeted population
(Frankfort-Nachmias & Nachmias, 2000; Fraenkel & Wallen, 2003; Salant & Dillman, 1994).
Since the purpose of this study was to understand the perceptions and attitudes of nonprofit
employees, the design choice was logical. One of the advantages of survey research is that it

106
offers an effective means of social description. Survey research provides detailed information
about a large heterogeneous population, and it allows the researcher to reach individuals across a
large geographic region in cost-effective and time efficient way (Singleton & Straits, 2005).
This was a benefit in this study because it allowed the researcher to gather data from participants
in real-world situations from across a wide geographic region relatively easily. Every method of
scientific inquiry in the social sciences has inherent limitations and subject to tradeoffs. This
study is no exception. The study’s design, sampling method, and statistical techniques had
benefits, but also limitations, which are outlined next.
The surveys were self-administered and web-based. On-line, self-administered surveys
do not allow for clarification of the questions, so interpretation may differ among respondents. It
was also not possible to assess the truthfulness of responses from participants. The depth of
information that could have been gained through conducting a qualitative study was also not
possible. Survey research describes the associations between variables, but does not probe into
the reasons for the relationship. For example, the research findings showed that perceived
transformational research was predictive of affective commitment, but did not suggest the
reasons for it. The criteria for inferring cause-and-effect relationships cannot be easily
established in survey research. Again, the findings offered an understanding of the type of
relationship, it did not allow for a causal explanation.
The study used nonprobability sampling, and this has inherent limitations. First, non-
response is a challenge in these types of designs and potentially resulting in response bias.
Probability samples have strong advantages from a research standpoint because they avoid
selection biases, allow the research to generalize findings to larger subsets, and permit a precise
estimate of parameters (Frankfort-Nachmias & Nachmias, 2009). However, research in the

107
social sciences is not typically conducive to the application of this design (Frankfort-Nachmias
& Nachmias, 2000; Meier, Brudney, & Bohte, 2011) and was not used for this study. Using
control groups or assigning individuals into contingent and traditional groups is impractical and
unethical. Response bias is a particular problem when the characteristics of the non-responders
differ from the responders. In this study, 80 percent were in positions of formal authority, in
supervisory, managerial or senior managerial positions. It appeared that non-management staff
members were under-represented in this study. Under-representation may impact the
generalizability of the study’s conclusions.
This study used a quota sampling method and the target of 103 was set, based on a prioiri
power analysis. This target was met. While random selection with an experimental design is the
gold standard in research, this study used a non-probability technique, which made it impossible
to determine the sampling error. It also meant it was not possible to make statistical inferences
from the sample to the population, leading to problems with generalization. Quota sampling
does involve some steps to gain a more representative sample. In this case, the quotas were set
based on the Alliance’s dues structure, which were based on budget sizes of the organizations.
As noted in chapter four, the researcher found an error after about 60 individuals responded,
where the researcher inadvertently collapsed two quotas into one. So, though the researcher
adjusted the quota groups, it is not exactly reflective of the dues structure, as planned. This
error did not have a significant consequence for the study’s findings. Organizational size was
not entered as a control variable for the study, so there were no statistically significant findings
sought. However, it does erode the representativeness of the sample group, because the two
categories were collapsed. The representativeness of the sample could have been extended, by

108
adding other quota requirements, but this would have extended the overall sample size as well as
cost and time.
Cross-sectional survey research, as was used in this study also has inherent limitations.
In this type of research, variables are measured at a point in time. This does not allow for the
study to show a change over time. An option for addressing this limitation would be to conduct
a longitudinal study, which would have allowed for a more comprehensive examination.
However, cost and time would have been a significant challenge in this case.
This study used multiple linear regression analysis. As with any statistical treatment,
there are limitations. The conceptual limitation of any regression technique is that one can
ascertain relationships, but not determine causality. Several control variables were considered in
this model to address potential confounding variables, though very few contributed to the models
with statistical significance. There may be other confounding variables that could have
contributed to the outcome variables that were not considered. Next, the study’s delimitations
are outlined.
This study was delimited to study nonprofit employees’ perceptions of transformational
leadership of their manager and their perceptions of their organization’s culture. This study did
not use the organization as the unit of analysis or focus of the study; therefore, there were not
several raters for the culture or for a particular manager’s leadership. The study did not attempt
to assess multiple raters about a particular organization or about a particular manager.
Additionally, the study included all respondents who fit the quota and study requirements,
including those who were employed at their organization for a short period of time. Six percent
of respondents were employed in their organization under one year. Twenty-eight percent of the
respondents were supervised by their manager for less than one year. This was relevant because

109
the length of time a person was employed at an organization will impact their impression of the
organizational culture (Schein, 2010); so too will the length of time a person has been supervised
by a manager impact his or her perception of leadership. “Honeymoon biases” occur at the start
of one’s tenure, where “overly positive” attitudes about the organization or leader may prevail;
and the “hangover effect” describes the decline and eventual stability in positive attitudes about
managers and organizations (Boswell, Boudreau, & Tichy, 2005 p. 884). There are
implications for this study on policy and practical levels. These implications will be addressed
next.
Policy Implications
Similar to government institutions, nonprofit organizations serve public purposes and
address critical human needs. As noted, public support for these organizations is evident by their
federal tax-exempt status as a result of their orientation toward public purposes (Nonprofit
Almanac, 2012). Nonprofits are often partners in the implementation of public supported
human services. The services provided by child and family nonprofit organizations are vital to
the lives of vulnerable American citizens. The services include homeless shelters, foster care,
child-care centers, and schools for those with special needs.
Issues related to a strong, healthy workforce within these organizations are important to
policymakers, because the government depends on the sector for the provision of a multitude of
human services. One compelling finding of this study is that, in organizations that have
transformational leadership and clan organizational cultures, employees are more likely to feel a
deep sense of commitment (affective commitment) and less likely to want to leave (turnover
intention). Another important finding is that when considering organizational culture and

110
transformational leadership together may better model to explain the employee’s affective
commitment and turnover intention, than considered separately.
The role of nonprofit organizations as service providers is also significant to the nation’s
economy. The United States has the largest nonprofit sector of any nation in the world
(Salamon, 2012). In 2011, there were 2.3 million nonprofit organizations in the U.S., with 1.6
million registered with the IRS—an increase of 21 percent from 2001 (Nonprofit Almanac,
2012). Those reporting organizations account for $2.06 trillion in revenue and $4.49 trillion in
assets in 2010 (Roeger, Blackwood, & Pettijohn, 2012). The sector accounts for $836.9 billion
of the US economy, or 5.6 percent of the gross domestic product (GDP) and 8.3 percent of wages
and salaries paid in the United States.
The government’s reliance on nonprofit organizations to provide human services has
been increasing since the 1960s (Smith & Lipsky, 1993). Federal, state and local governments
have had contractual agreements worth about $100 billion dollars with nearly 33,000 human
service nonprofit organizations (Boris, et al., 2010). Human service nonprofit organizations
entered into an average of seven contracts or grants per organizations (Pettijohn & Boris, 2014).
In fact, nonprofit organizations receive more income from the government than from any other
single source (Salamon, 2010). Understanding factors that impact employee retention and
affective commitment in nonprofit human service providers may be paramount to achieving the
goals of public policies intended to meet the needs of the nation’s most vulnerable groups.
Just as the public policies of human services depend on a portion of nonprofit
organizations, the nonprofit sector depends on committed employees to achieve their
organizational missions and goals. Employees are nonprofit organizations’ greatest resource,
investment, and expense (Rutowski, Guiler, & Schimmel, 2009). Commitment and retention

111
within nonprofit human service organizations are important factors of success in public policy
implementation for those citizens in greatest need.
The government funds nonprofit organizations, and they also regulate them. Every
regulation, regardless of its value, involves the employee spending time on meeting and proving
their compliance to the requirements. In a study on human services nonprofit organizations
conducted in 2009, the most frequently cited problem in both years involved government’s time-
consuming regulatory application and reporting requirements. The study was replicated in 2012
with the same cited problem (Pettijohn & Boris, 2014).
It becomes critical for nonprofit managers to create internal controls and compliance
reviews in response to these reporting and regulatory requirements. This leads to a level of
bureaucracy that may impact the way things are done, where time is spent, and what is valued
within the organization, thus impacting the employees’ work experience and the organization’s
culture. Internal controls and bureaucracy are related to hierarchical cultures. This study’s
findings suggest that hierarchical cultures may be problematic to the employee’s affective
commitment and turnover intention. If the manager is not perceived as transformational, the
hierarchical culture may be even more problematic to the employee’s feelings of affective
commitment. While regulations are an important tool of government in managing service
provision, heavy use of these regulatory controls may have an unintended consequence of
creating a problematic culture for the workforce that provides critical services for vulnerable
citizens.
Heavy regulations may also impact the way in which a nonprofit manager supervises and
leads their employees. The supervisor may spend more time ensuring adherence to regulations,
than to inspiring and growing their employees, which is the form of professional development

112
that is a hallmark trait of transformational leaders. The findings show that transformational
leadership positively predicted affective commitment and negatively predicted turnover
intention. The growing need for managers to invest in their employees’ growth is clear, in the
face of growing regulations, external audits and contract requirements set by the government.
Practical Implications
This study’s findings have key practical implications related to the management of
nonprofit organizations’ greatest resource: employees. Staff turnover is “perhaps the most
important problem” facing the wider nonprofit sector, particularly in the area of human services
(Howe & McDonald, 2001, as cited in Salamon, 2012, p. 39). It is an ongoing and costly
problem that negatively affects staff morale, teamwork, and ultimately organizational success
(Abassi & Hollman, 2000; Moynihan & Landuyt, 2008). Therefore, employee commitment and
retention are practical issues important to those involved in the nonprofit sector. Consequently,
these issues are also important to the government sector, because government entities contract
with these organizations to provide critical services.
The implications of turnover intention include negative employee attitudes, lowered
commitment, absenteeism, and desire to leave the human-services field (Blankertz & Robinson,
1997; Lee & Ashforth, 1996; Mor Barak, Nissly & Levin, 2001). Additionally, it becomes
especially critical that turnover is not a significant problem because vulnerable children and their
families could be negatively impacted. The results of this study indicate that perceived
transformational leadership negatively predicts turnover intention in those responding in this
sample.
In one way, this finding confirms the assertion by Bass (1999) that transformational
leadership enhances organizational commitment and loyalty of followers, and may have the

113
effect of reduced turnover intention. However, when examining the impact of organizational
culture on employees, the study’s finding challenges Bass’ leader-centric notion. The findings
suggest, it is not just the leader that impacts the employees’ commitment and retention, but also
the culture of the organization, which involves the daily interaction and shared espoused values
among all members, matters. The findings suggest hierarchical cultures have negative
implications for employees. Since one key cause of the staff retention crisis is related to
overwhelming accountability requirements and concerns over liability (Salamon, 2012), this is a
problem for those in the nonprofit sector. Nonprofit organizations are often licensed and
accredited by government bodies in order to provide services and receive funding. The
organizations have contract requirements, which may include requirements for performance
metrics and reporting expectations. Medicaid has its own set of requirements that organizations
must meet in order to receive funding. All of this requires internal controls to ensure compliance
and may impact employees’ commitment and desire to stay or leave. Importantly, the study’s
findings indicate that market cultures are problematic for staff turnover. This is a caution to
nonprofit managers who may seek to be more “business-like” in an effort to respond to the
market.
Another practical implication relates to preparation of managers within nonprofit
organizations. There has been growth in nonprofit management education and training programs
particularly in graduate programs of public policy and administration (Rathgeb Smith, 2012).
Graduate programs should consider research-supported leadership practices, such as
transformational leadership, in the nonprofit management curriculum. Leadership training and
development for nonprofit employees could be created to include aspects of culture-building and
transformational leadership. It is a true challenge to foster a clan cultures amid an environment

114
of choking compliance to mounting government regulations. If nonprofit managers learn to
address the challenges of competition in the market and mounting regulation compliance, while
creating an environment where employees feel a sense of belonging and connection to the
workplace, it would be a true benefit. Additionally, incorporating organizational culture
development could be integrated into the nonprofit management curriculum. This would equip
potential nonprofit managers with the necessary leadership skills to manage the complex
challenges they will inevitably face, including retaining and supporting a highly committed
workforce. The findings suggest that some in the nonprofit sector may already be achieving this
balance.
Recommendations for Further Research
This quantitative, cross-sectional survey design had limitations that include: an inability
to establish causality, a lack of generalizability of the findings and lack of comparison between
sectors. Some of the recommendations for future research were in response to these limitations.
The study’s findings raised several questions, which also introduced possibilities for future
research. The areas for future research fall into two categories: organizational research and
demographics and employees’ workplace experience.
Organizational-Level Research
The study’s survey collected the organizational budget sizes from respondents for
sampling purposes. The descriptive findings led to questions about the relationship between
organizational size and organizational culture. For example, most (61 percent) employees
perceived their organizational culture as clan, or collaborative cultures. Eighty-four percent of
those from smaller organizations (under $50,000 budget) perceived a clan culture in their
organization. Just eight respondents perceived their organization as market culture, six of which
115
were from large organizations (above $20,000,000 budget). The differences in perceived culture
types and the size of the organization could be theoretically linked and researched from the
perspective of organizational life cycle. The basis for this life cycle theory is that, like most
systems, organizations go through life cycle stages. The features in each stage have markedly
different characteristics, in a similar way that each culture type has different traits. Light (2004)
developed one such life cycle model for nonprofit organizations, called the developmental spiral.
Light found that the age and budget size of the nonprofit organization were related, though
imperfectly, to the movement up and down the life cycle spiral (Light, 2004). This concept
could be a framework for future study, whereby the relationship between the size of the
organization, culture type and stage of the developmental cycle is studied.
Another organizational-level area for further research relates to organizational
effectiveness. Retention of committed employees is undoubtedly an important issue facing the
nonprofit sector. Turnover is costly and employees are the primary resource through which
organizations achieve their goals. The findings from this study support the relevance of
transformational leadership and organizational culture on employee-related outcomes. This
raises questions about the relative importance of affective commitment and turnover intention to
overall organizational effectiveness. It would be beneficial to research how these employee
variables relate to organizational outcomes such as achieved program goals, satisfaction of
clients and stakeholders, and financial health. This would be another contribution to the
nonprofit literature and invaluable information for practitioners as well.
The last organizational-level research recommendation involves replicating this study.
This study incorporated models and frameworks typically applied to the for-profit sector, and
occasionally the government sector. The similarities between the nonprofit and the business

116
sectors are evident in that they both must be financial viable, stay competitive and produce
outcomes in order to stay relevant. Businesses are engaging in social ventures and have
missions beyond just the profit. The clear line between business and nonprofit sectors has
become blurred (Harris, 2012). It would be valuable to create this study across the nonprofit,
government and for-profit organizations.
Demographic Characteristics of Nonprofit Employees
This study used several control variables including: age, tenure, gender, position level,
and length of time supervised by manager. Two control variables were important in
consideration of turnover intention and affective commitment: age and tenure. Tenure mattered
when considering the predictive relationship between transformational leadership and affective
commitment. Those whose tenure was one to three years, negatively predicted affective
commitment, indicating lowered tenure is a consideration in the degree affective commitment
employees feel.
Age group (30-39) and (60 and older) was a factor in the relationship between perceived
transformational leadership and turnover intention. Those in their thirties were more likely to
have an intention to leave, while those in 60 years or older were less likely to intend to leave
their jobs. This may relate to the stage in one’s career. Those who are earlier in their career
may have other reasons for wanting to leave their jobs, such as higher pay, elevated positions or
moving. This was not a focus of the study, and may be an area for future research. Age also
mattered when examining the moderating effect of culture. The age group (60 years or older)
was the only age group that showed a statistically significant predictive relationship (negative)
when hierarchical cultures were considered jointly with transformational leadership. Older staff
may be less likely to want to leave a hierarchical culture because of the stability and

117
predictability that is offered in these types of organizations. Further studies related to the
reasons behind the relationship are needed to uncover the reasons.
The contributions of some of these variables led to possibilities for future research,
particularly related to gender and age. For example, a majority (79 percent) of the respondents in
this study were women. Gender did not appear to play a role in the identification of clan
cultures. Fifty-nine percent of male respondents and 61 percent of female respondents perceived
their cultures as clan. It raises questions about whether women are more likely to work in
organizations that they perceived to be more clan or collaborative. In this study, only the gender
of the respondents was collected on the survey, not the gender of the managers. This also leads
to questions about whether male or female managers would be more likely to lead in
organizations with clan cultures. There have been studies that indicate that women are more
likely to be transformational in their management style (e.g., Ross & Offerman, 1997; Carless,
1998). To further this research, another area of study could be an investigation of the
relationship between manager’s gender and transformational leadership and the type of
organizational culture employees’ experience. Gender of the manager may be related to both
the culture of the organization and to leadership style and warrant another related area for future
research.
The ages of the respondents were distributed along a bell curve, with the most frequently
reported group (37 percent) between ages 40 and 49. Age did appear to be a factor in the
respondents’ turnover intentions. Those in their thirties were more likely to think about leaving,
while those 60 years or older were less likely to do so. The reasons for this may relate to career
paths, pay, promotion possibilities or some other factors. The chosen research design indicated
the relationships, but not the reasons behind the link. A qualitative or mixed method approach

118
might be better suited to make this discovery. A study designed to investigate the relationship
between age and retention factors would be another important contribution to the nonprofit and
organizational literature.
Conclusion
It has been said that the true measure of a nation is how it treats their most vulnerable
citizens. The United States has public policies designed to serve and support these vulnerable
groups. The government relies heavily nonprofit organizations to carry out these human service
policies. Studies, such as this one, addresses critical issues facing the nonprofit sector, thus
support effective policy implementation. The findings from this study demonstrate the
importance of transformational leadership and organizational culture in how employees feel
about their workplace.
This study was unique for three reasons. First, unlike previous studies, this one examines
both transformational leadership and organizational culture and their relationship to the
employee, instead of examining one or the other. This importance of this is reflected in the
findings. If the study had only looked at the manager’s transformational leadership impact on
affective commitment and turnover intention, the conclusion would be that the manager is the
primary factor impacting the employee’s experience at work. This study informs the need to
consider organizational culture and leadership in the understanding of nonprofit employees’
commitment and turnover intention. Second, this study uses research typically applied to the
business sector and applies it to nonprofit organizations. This adds a new perspective to the
nonprofit literature and addresses the literature suggesting a blurring of boundaries between the
sectors. Third, this study has policy implications, because human services nonprofit
organizations serve a public purpose. This study enriches and supports the effective

119
implementation of human services public policy. It is clear that the government depends on the
nonprofit sector to implement public policies as service providers who address important needs
for vulnerable citizens. These organizations rely on committed employees to serve this group
and reach the organizations’ goals.

120
References
Abbasi, S. M., & Hollman, K. W. (2000). Turnover: The real bottom line. Public Personnel
Management, 29(3), 333–342.
Aiken, L. S., & West, S. G. (1991). Multiple regression: Testing and interpreting interactions.
Newbury Park: Sage.
Allen, N. J., & Meyer, J. P. (1993). Organizational commitment: Evidence of career stage
effects? Journal of Business Research, 26(1), 49–61.
Allen, N. J., & Meyer, J. P. (1996). Affective, continuance, and normative commitment to the
organization: An examination of construct validity. Journal of Vocational Behavior,
49(3), 252–276.
Allen, N. J., & Meyer, J. P. (2000). Construct validation in organizational behavior research: The
case of organizational commitment. Problems and Solutions in Human Assessment (pp.
285–314). New York: Springer. doi:10.1007/978-1-4615-4397-8_13.
American Public Human Services Association. (2005). Report from the 2004 child welfare
workforce survey: State agency findings.
Antonakis, J., Avolio, B. J., & Sivasubramaniam, N. (2003). Context and leadership: An
examination of the nine-factor full-range leadership theory using the Multifactor
Leadership Questionnaire. The Leadership Quarterly, 14(3), 261–295.
Antonakis, J., & House, R. J. (2002). The full-range leadership theory: The way forward.
Transformational and Charismatic Leadership: The Road Ahead, 2, 3–34.

121
Argote, L., Insko, C. A., Yovetich, N., & Romero, A. A. (1995). Group learning curves: The
effects of turnover and task complexity on group performance. Journal of Applied Social
Psychology, 25(6), 512–529.
Arnold, K. A., Turner, N., Barling, J., Kelloway, E. K., & McKee, M. C. (2007).
Transformational leadership and psychological well-being: The mediating role of
meaningful work. Journal of Occupational Health Psychology, 12(3), 193.
Aryee, S., & Tan, K. (1992). Antecedents and outcomes of career commitment. Journal of
Vocational Behavior, 40(3), 288–305.
Avolio, B. J., Bass, B. M., & Zhu, F. W. W. (2004a). Multifactor leadership questionnaire:
Manual and sampler set. Menlo Park, CA: Mind Garden.
Avolio, B. J., Gardner, W. L., Walumbwa, F. O., Luthans, F., & May, D. R. (2004b). Unlocking
the mask: A look at the process by which authentic leaders impact follower attitudes and
behaviors. The Leadership Quarterly, 15(6), 801–823.
Avolio, B. J., Walumbwa, F. O., & Weber, T. J. (2009). Leadership: Current theories, research,
and future directions. Annual Review of Psychology, 60, 421–449.
Babbie, E. (1990). Survey research methods. Belmont, CA: Wadsworth.
Babbie, E., & Rubin, A. (2010). (7th ed). Research methods for social work. Belmont, CA:
Brooks Cole.
Barbuto, J. E., & Wheeler, D. W. (2006). Scale development and construct clarification of
servant leadership. Group & Organization Management, 31(3), 300–326.
Barling, J., Weber, T., & Kelloway, E. K. (1996). Effects of transformational leadership training
on attitudinal and financial outcomes: A field experiment. Journal of Applied
Psychology, 81(6), 827.

122
Bass, B. (1998). Transformational leadership : Industrial, military, and educational impact.
Mahwah, N.J.: Lawrence Erlbaum Associates.
Bass, B. M. (1999). Two decades of research and development in transformational leadership.
European Journal of Work and Organizational Psychology, 8(1), 9–32.
doi:10.1080/135943299398410
Bass, B. M., & Avolio, B. J. (1990). Transformational leadership development: Manual for the
Multifactor Leadership Questionnaire. Palo Alto, CA: Consulting Psychologists Press.
Bass, B., & Avolio, B. (1993). Transformational leadership and organizational culture.
Public Administration Quarterly, 17(1), 112-121.
Bass, B. M., & Avolio, B. J. (1994). Improving organizational effectiveness through
transformational leadership. Thousand Oaks, CA: Sage Publications.
Bass, B. M., & Riggio, R. E. (2005). Transformational leadership. Mahwah, NJ: Psychology
Press.
Berry, W. D. (1993). Understanding regression assumptions. Series: Quantitative Applications in
the Social Sciences, No. 92. Thousands Oaks, CA: Sage Publications.
Blankertz, L., & Robinson, S. (1997). Turnover intentions of community mental health workers
in psychosocial rehabilitation services. Community Mental Health Journal, 33(6), 517–
529. doi:10.1023/A:1025000703487
Boggs, W. B. (2004). TQM and organizational culture: A case study. Quality Management
Journal, 11(2) 42-52.

123
Boris, E. T. (1999). Nonprofit organizations in a democracy: Varied roles and responsibilities.
Nonprofits and Government: Collaboration and Conflict, 3–29.
Boris, E. T., de Leon, E., Roeger, K. L., & Nikolova, M. (2010). Contracts and grants between
human service nonprofits and governments. Washington DC: Urban Institute Report.
Boris, E. T., & Steurele, C. (2006). Scope and dimensions of the nonprofit sector. In Powell, W.,
& Steinberg, Richard. The Non-Profit Sector: A Research Handbook (66–88). New
Haven: Yale University Press.
Boswell, W. R., Boudreau, J. W., & Tichy, J. (2005). The Relationship Between Employee Job
Change and Job Satisfaction: The Honeymoon-Hangover Effect. Journal of Applied
Psychology, 90(5), 882-892.
Bourne, H., & Jenkins, M. (2013). Organizational values: a dynamic perspective. Organization
Studies, 34(4), 495-514.
Bowers, D. G., & Seashore, S. E. (1966). Predicting organizational effectiveness with a four-
factor theory of leadership. Administrative Science Quarterly,11(2), 238–263.
Burns, J. (1978). Leadership. New York: Harper & Row.
Bycio, P., Hackett, R. D., & Allen, J. S. (1995). Further assessments of Bass’s (1985)
conceptualization of transactional and transformational leadership. Journal of Applied
Psychology, 80(4), 468–478. doi:10.1037/0021-9010.80.4.468
Cameron, K. S., & Quinn, R. E. (2011). (3rd ed.) Diagnosing and changing organizational
culture: Based on the competing values framework. Hoboken, NJ:
& Sons.

124
Carson, J. B., Tesluk, P. E., & Marrone, J. A. (2007). Shared leadership in teams: An
investigation of antecedent conditions and performance. Academy of Management
Journal, 50(5), 1217–1234.
Ciulla, J. (1998). Ethics, the heart of leadership. Westport, CT.: Quorum Books.
Cohen, E., & Tichy, N. (1997). How leaders develop leaders. Training and Development, 51(5),
58-73
Collins-Camargo, C., Ellett, C. D., & Lester, C. (2012). Measuring organizational effectiveness
to develop strategies to promote retention in public child welfare. Children and Youth
Services Review, 34(1), 289–295.
Cooke, R. A., & Rousseau, D. M. (1988). Behavioral norms and expectations: A quantitative
approach to the assessment of organizational culture. Group & Organization
Management, 13(3), 245–273.
Cooper, D., & Schindler, Pamela S. (2011). Business research methods. (11th ed.)
New York: McGraw-Hill/Irwin.
Cooper-Hakim, A., & Viswesvaran, C. (2005). The construct of work commitment: Testing an
integrative framework. Psychological Bulletin, 131(2), 241.
Couper, M. (2000). Web surveys: A review of issues and approaches. Public Opinion
Quarterly, 64(4), 464-94.
Creswell, J. (2014). Research design : Qualitative, quantitative, and mixed methods
approaches (4th ed.). Thousand Oaks: SAGE Publications
Curry, D., McCarragher, T., & Dellmann-Jenkins, M. (2005). Training, transfer, and turnover:
Exploring the relationship among transfer of learning factors and staff retention in child
welfare. Children and Youth Services Review, 27(8), 931–948.

125
Daft, R. L. (1999). Leadership: Theory and practice. Fort Worth, TX: Dryden Press.
Dattalo, P. (2008). Determining sample size: Balancing power, precision, and practicality.
Oxford University Press.
Dattalo, P. (2013). Analysis of multiple dependent variables. NY, New York. Oxford University
Press.
Day, D. V., Gronn, P., & Salas, E. (2004). Leadership capacity in teams. The Leadership
Quarterly, 15(6), 857–880.
Deal, T. E., & Kennedy, A. A. (1982). Corporate cultures: The rites and rituals of
organizational life. MA: Addison-Wesley, 98–103.
De Bono, E. (1999). Six thinking hats. London et al: Penguin Books.
Dees, J., & Anderson, B. (2003). Sector-bending: Blurring lines between nonprofit and for-
profit. Society, 40(4), 16–27. doi:10.1007/s12115-003-1014-z
Denison, D. R., & Mishra, A. K. (1995). Toward a theory of organizational culture and
effectiveness. Organization Science, 6(2), 204–223.
Denison, D. R., & Spreitzer, G. M. (1991). Organizational culture and organizational
development: A competing values approach. Research in Organizational Change and
Development, 5(1), 1–21.
Detert, J. R., Schroeder, R. G., & Mauriel, J. J. (2000). A framework for linking culture and
improvement initiatives in organizations. Academy of Management Review, 25(4), 850–
863.
De Tocqueville, A. (1945). Democracy in America. New York, NY: Alfred A. Knopf
Dillman, D. A. (2011). Mail and internet surveys: The tailored design method—2007 update
with new internet, visual, and mixed-mode guide. Hoboken, NJ: John Wiley & Sons.

126
Drake, B., & Jonson-Reid, M. (2007). Social work research methods: From conceptualization to
dissemination. Boston, MA: Allyn and Bacon.
Draper, N.R. and Smith, H. Applied Regression Analysis. Wiley Science in Probability and
Statistics Cameron, K. S. and S. J. Freeman (1991). “Cultural Congruence, Strength, and
Type: Relationships to Effectiveness," in W. A. Pasmore and R. D. Woodman (Eds.),
Research in Organizational Change and Development. Vol. 5, Greenwich, CT: JAI Press.
Dvir, T., Eden, D., Avolio, B. J., & Shamir, B. (2002). Impact of transformational leadership on
follower development and performance: A field experiment. The Academy of
Management Journal, 45(4), 735–744.
Egan, T. M., Yang, B., & Bartlett, K. R. (2004). The effects of organizational learning culture
and job satisfaction on motivation to transfer learning and turnover intention. Human
Resource Development Quarterly, 15(3), 279–301.
Eikenberry, A. M., & Kluver, J. D. (2004). The marketization of the nonprofit sector: Civil
society at risk? Public Administration Review, 64(2), 132–140. doi:10.1111/j.1540-
6210.2004.00355.x
Fey, C. F., & Denison, D. R. (2003). Organizational culture and effectiveness: Can American
theory be applied in Russia? Organization Science, 14(6), 686–706.
Fiedler, F. (1964). A contingency model of leadership effectiveness. Advances in Experimental
Social Psychology, 1, 149-190.
Fiedler, F. E., & Garcia, J. E. (1987). New approaches to effective leadership: Cognitive
resources and organizational performance. Hoboken, NJ: John Wiley & Sons.
Fowler, F. J. (2014). Survey research methods. Thousand Oaks, CA: Sage.

127
Frankfort-Nachmias, C., & Nachmias, D. (2000). Research methods in the social sciences. New
York, NY: Worth.
Fuller, J. B., Patterson, C. E., Hester, K., & Stringer, D. Y. (1996). A quantitative review of
research on charismatic leadership. Psychological Reports, 78(1), 271–287.
García-Morales, V. J., Jiménez-Barrionuevo, M. M., & Gutiérrez-Gutiérrez, L. (2012).
Transformational leadership influence on organizational performance through
organizational learning and innovation. Journal of Business Research, 65(7), 1040–1050.
doi:10.1016/j.jbusres.2011.03.005
Gardner, W. L., Avolio, B. J., & Walumbwa, F. O. (2005). Authentic leadership theory and
practice: Origins, effects and development. San Diego, CA: Elsevier.
Glisson, C., & James, L. R. (2002). The cross-‐‑level effects of culture and climate in human
service teams. Journal of Organizational Behavior, 23(6), 767–794. doi:10.1002/job.162
Gong, Y., Huang, J, & Farh, J. -. (2009). Employee learning orientation, transformational
leadership, and employee creativity: The mediating role of employee creative self-
efficacy. Academy of Management Journal, 52(4), 765–778.
doi:10.5465/AMJ.2009.43670890
Goodman, E. A., Zammuto, R. F., & Gifford, B. D. (2001). The competing values framework:
Understanding the impact of organizational culture on the quality of work life.
Organization Development Journal, 19(3), 58-68
Gray, A. M., Phillips, V., & Normand, C. (1996). The costs of nursing turnover: Evidence from
the British National Health Service. Health Policy, 38(2), 117–128.
Greenleaf, R. K. (1977). Servant leadership: A journey into the nature of legitimate power and
greatness. New York: Paulist Press.
128
Gregory, B. T., Harris, S. G., Armenakis, A. A., & Shook, C. L. (2009). Organizational culture
and effectiveness: A study of values, attitudes, and organizational outcomes. Journal of
Business Research, 62(7), 673-679.
Griffeth, R. W., Hom, P. W., & Gaertner, S. (2000). A meta-analysis of antecedents and
correlates of employee turnover: Update, moderator tests, and research implications for
the next millennium. Journal of Management, 26(3), 463–488. doi:10.1016/S0149-
2063(00)00043-X
Hackett, R. D., Bycio, P. and Hausdorf, P. A. (1994) Further assessments of Meyer and Allen’s
(1991) three-component model of organizational commitment, Journal of Applied
Psychology, 79(1):15-23.
Hager, M. A., Wilson, S., Pollak, T. H., & Rooney, P. M. (2003). Response rates for mail
surveys of nonprofit organizations: A review and empirical test. Nonprofit and Voluntary
Sector Quarterly, 32(2), 252–267.
Harris, M. (2012). Nonprofits and business. Nonprofit and Voluntary Sector Quarterly, 41(5),
892–902. doi:10.1177/0899764012443735
Harter, J. K., Schmidt, F. L., Killham, E. A., & Agrawal, S. (2009). Q12 meta-analysis: The
relationship between engagement at work and organizational outcomes. Washington, DC,
USA: The Gallup Organization.
Hartnell, C. A., Ou, A. Y., & Kinicki, A. (2011). Organizational culture and organizational
effectiveness: A meta-analytic investigation of the competing values framework’s
theoretical suppositions. Journal of Applied Psychology, 96(4), 677–694.
doi:10.1037/a0021987

129
Hater, J. J., & Bass, B. M. (1988). Superiors’ evaluations and subordinates’ perceptions of
transformational and transactional leadership. Journal of Applied Psychology, 73(4), 695.
Hazy, J. K., Goldstein, J., & Lichtenstein, B. B. (2007). Complex systems leadership theory: New
perspectives from complexity science on social and organizational effectiveness.
Mansfield, MA: ISCE Publishers
Heifetz, R. A. (1994). Leadership without easy answers. London: Harvard University Press.
Heifetz, R. A., & Linsky, M. (2002). Leadership on the line: Staying alive through the dangers
of leading. London: Harvard Business Press.
Helfrich, C. D., Li, Y., Mohr, D. C., Meterko, M., & Sales, A. E. (2007). Assessing an
organizational culture instrument based on the competing values framework: Exploratory
and confirmatory factor analyses. Implementation Science, 2(13), 1–14.
Hersey, P., Blanchard, K. H., & Johnson, D. E. (1988). Management of organizational behavior.
Upper Saddle River, NJ. Prentice Hall.
Hofstede, G. (2001). Culture's consequences : Comparing values, behaviors, institutions, and
organizations across nations (2nd ed.). Thousand Oaks, CA: London: Sage
Hofstede, G., Neuijen, B., Ohayv, D. D., & Sanders, G. (1990). Measuring organizational
cultures: A qualitative and quantitative study across twenty cases. Administrative Science
Quarterly, 35, 286–316.
House, R. J. (1971). A path goal theory of leader effectiveness. Administrative Science
Quarterly, 16(13), 321–339.
House, R. J., & Aditya, R. N. (1997). The social scientific study of leadership: Quo vadis?
Journal of Management, 23(3), 409–473.

130
Howard, L. W. (1998). Validating the competing values model as a representation of
organizational cultures. International Journal of Organizational Analysis, 6(3), 231–250.
Hughes, L. W., Avey, J. B., & Nixon, D. R. (2010). Relationships between leadership and
followers’ quitting intentions and job search behaviors. Journal of Leadership &
Organizational Studies, 17(4), 351–362. doi:10.1177/1548051809358698
Humphrey, S. E., Nahrgang, J. D., & Morgeson, F. P. (2007). Integrating motivational, social,
and contextual work design features: A meta-analytic summary and theoretical extension
of the work design literature. Journal of Applied Psychology, 92(5), 1332.
Hunt, J. G. (1999). Transformational/charismatic leadership’s transformation of the field: An
historical essay. The Leadership Quarterly, 10(2), 129–144.
Hutcheson, G. D., & Sofroniou, N. (1999). The multivariate social scientist: Introductory
statistics using generalized linear models. Thousand Oaks, CA: Sage.
Jackson, T. A., Meyer, J. P., & Wang, X. H. F. (2013). Leadership, Commitment, and Culture A
Meta-Analysis. Journal of Leadership & Organizational Studies, 20(1), 84-106.
Jaskyte, K. (2004). Transformational leadership, organizational culture, and innovativeness in
nonprofit organizations. Nonprofit Management and Leadership, 15(2), 153–168.
doi:10.1002/nml.59
Judge, T. A., & Piccolo, R. F. (2004). Transformational and transactional leadership: A meta-
analytic test of their relative validity. Journal of Applied Psychology, 89(5), 755.
Jung, D. I., & Sosik, J. J. (2002). Transformational leadership in work groups: The role of
empowerment, cohesiveness, and collective-efficacy on perceived group performance.
Small Group Research, 33(3), 313–336.
Jung, T., Scott, T., Davies, H., Bower, P., Whalley, D., McNally, R., & Mannion, R. (2009).

131
Instruments for Exploring Organizational Culture: A Review of the Literature. Public
Administration Review, 69(6), 1087-1096.
Kacmar, K. M., Andrews, M. C., Van Rooy, D. L., Steilberg, R. C., & Cerrone, S. (2006). Sure
everyone can be replaced…but at what cost? Turnover as a predictor of unit-level
performance. Academy of Management Journal, 49(1), 133–144.
Keller, R. T. (1992). Transformational leadership and the performance of research and
development project groups. Journal of Management, 18(3), 489–501.
Kellerman, B. (2008). Followership: How followers are creating change and changing leaders.
ADD INFO
Kest, R. T. (2006). Principles of leadership: Leadership management. Social Psychology, 86(1),
77–94.
Kim, H. (2014). Transformational Leadership, Organizational Clan Culture, Organizational
Affective Commitment, and Organizational Citizenship Behavior: A Case of South
Korea's Public Sector. Public Organization Review, 14(3), 397-417
Kloot, L., & Martin, J. (2007). Public sector change, organisational culture and financial
information: A study of local government. Australian Journal of Public Administration,
66(4), 485–497.
Kouzes, J. M., & Posner, B. Z. (2011). Credibility: How leaders gain and lose it, why people
demand it. Hoboken, NJ: John Wiley & Sons.
Kwan, P., & Walker, A. (2004). Validating the competing values model as a representation of
organizational culture through inter-institutional comparisons. International Journal of
Organizational Analysis, 12(1), 21–37.
Lavelle, J., Brockner, J., Konovsky, M., Price, K., Henley, A., Taneja, A., & Vinekar, V. (2009).

132
Commitment, procedural fairness, and organizational citizenship behavior: A multifoci
analysis. Journal of Organizational Behavior, 30(3), 337-357.
Lavrakas, P. J. (2008). Encyclopedia of Survey Research Methods: AM (Vol. 1). Thousand Oaks,
CA: Sage.
Lee, R. T., & Ashforth, B. E. (1996). A meta-analytic examination of the correlates of the three
dimensions of job burnout. Journal of Applied Psychology, 81(2), 123–133.
doi:10.1037/0021-9010.81.2.123
Light, P. C. (2004). Sustaining nonprofit performance: The case for capacity building and the
evidence to support it. Brookings Institution Press.
Lowe, K. B., Kroeck, K. G., & Sivasubramaniam, N. (1996). Effectiveness correlates of
transformational and transactional leadership: A meta-analytic review of the MLQ
literature. The Leadership Quarterly, 7(3), 385–425.
Luthans, F. (2006). Organizational behavior (11th ed.). Boston, MA: McGraw-Hill/Irwin.
Mahalinga Shiva, M., & Suar, D. (2012). Transformational leadership, organizational culture,
organizational effectiveness, and programme outcomes in non-governmental
organizations. VOLUNTAS: International Journal of Voluntary and Nonprofit
Organizations, 23(3), 684–710. doi:10.1007/s11266-011-9230-4
Mannion, R., Davies, H., & Marshall, M. (2005). Cultural characteristics of “high” and “low”
performing hospitals. Journal of Health Organization and Management, 19(6), 431–439.
Mary, N. L. (2005). Transformational leadership in human service organizations. Administration
in Social Work, 29(2), 105–118.

133
Mathieu, J. E., & Zajac, D. M. (1990). A review and meta-analysis of the antecedents, correlates,
and consequences of organizational commitment. Psychological Bulletin, 108(2), 171–
194. doi:10.1037/0033-2909.108.2.171
McColl-Kennedy, J. R., & Anderson, R. D. (2002). Impact of leadership style and emotions on
subordinate performance. The Leadership Quarterly, 13(5), 545–559.
Mehta, R., & Sivadas, E. (1995). Direct marketing on the internet: An empirical assessment of
consumer attitudes. Journal of Direct Marketing,9(3), 21-32.
Meier, K., Brudney, J., & Bohte, J. (2011). Applied statistics for public and nonprofit
administration. Cengage Learning.
Meindl, J., & Shamir, Boas. (2007). Follower-centered perspectives on leadership : A tribute to
the memory of James R. Meindl (Leadership horizons series). Greenwich, Conn.: IAP.
Mertler, C. A., & Rachel, A. Vannatta. 2005. Advanced and Multivariate Statistical Methods,
Practical Application and Interpretation. 3rd ed. Glendale, CA: Pyrczak.
Meyer, J. P., & Allen, N. J. (1991). A three-component conceptualization of organizational
commitment. Human Resource Management Review, 1(1), 61–89.
Meyer, J. P., & Allen, N. J. (1997). Commitment in the workplace: Theory, research, and
application. Thousand Oaks, CA: Sage.
Meyer, J. P., Allen, N. J., & Gellatly, I. R. (1990). Affective and continuance commitment to the
organization: Evaluation of measures and analysis of concurrent and time-lagged
relations. Journal of Applied Psychology, 75(6), 710.
Meyer, J. P., Stanley, D. J., Herscovitch, L., & Topolnytsky, L. (2002). Affective, continuance,
and normative commitment to the organization: A meta-analysis of antecedents,
correlates, and consequences. Journal of Vocational Behavior, 61(1), 20–52.

134
Miner, J. B. (2005). Organizational behavior I: Essential theories of motivation and leadership.
Armonk, NY: M. E. Sharpe.
Mor Barak, M., Nissly, J., & Levin, A. (2001). Antecedents to retention and turnover among
child welfare, social work, and other human service employees: What can we learn from
past research? A review and metaanalysis. Social Service Review, 75(4), 625–661.
Mor Barak, M. E., Levin, A., Nissly, J. A., & Lane, C. J. (2006). Why do they leave? Modeling
child welfare workers’ turnover intentions. Children and Youth Services Review, 28(5),
548–577. doi:10.1016/j.childyouth.2005.06.003 Morgan, P. I., & Ogbonna, E. (2008).
Subcultural dynamics in transformation: A multi-perspective study of healthcare
professionals. Human Relations, 61(1), 39–65.
Mossholder, K. W., Settoon, R. P., & Henagan, S. C. (2005). A relational perspective on
turnover: Examining structural, attitudinal, and behavioral predictors. Academy of
Management Journal, 48(4), 607–618.
Mowday, R. T., Porter, L. W., & Steers, R. M. (1982). Employee–organization linkages: The
psychology of commitment, absenteeism, and turnover. New York, NY: Academic Press.
Moynihan, D. P., & Landuyt, N. (2008). Explaining turnover intention in state government:
Examining the roles of gender, life cycle, and loyalty. Review of Public Personnel
Administration. 28(2), 120 -143.
Nadler, D. A., & Tushman, M. L. (1989). Organizational frame bending: Principles for managing
reorientation. The Academy of Management Executive, 3(3), 194–204.
Northouse, P. G. (2012). Leadership: Theory and practice. Thousand Oaks, CA: Sage.

135
Oberfield, Z. W. (2014). Public management in time: A longitudinal examination of the full
range of leadership theory. Journal of Public Administration Research and Theory, 24(2),
407–429. doi:10.1093/jopart/mus060
Ogbonna, E., & Harris, L. C. (2000). Leadership style, organizational culture and performance:
Empirical evidence from UK companies. International Journal of Human Resource
Management, 11(4), 766–788.
O’Reilly, C. A., Chatman, J., & Caldwell, D. F. (1991). People and organizational culture: A
profile comparison approach to assessing person–organization fit. Academy of
Management Journal, 34(3), 487–516.
Organ, D. W., & Ryan, K. (1995). A meta-‐‑analytic review of attitudinal and dispositional
predictors of organizational citizenship behavior. Personnel Psychology, 48(4), 775–802.
Shafritz, J., & Ott, J. S. (1992). Classics of organization theory (3rd ed., Brooks/Cole series in
public administration). Pacific Grove, CA: Brooks/Cole Pub.
Pearce, C., & Conger, Jay Alden. (2003). Shared leadership : Reframing the hows and whys of
leadership. Thousand Oaks, Calif.: Sage Publications.
Pettigrew, Andrew M. (1979). On Studying Organizational Cultures. Administrative Science
Quarterly, 24(4), 570-81.
Pettijohn, S.L. & Boris, E. (2014). Contracts and Grants between Human Service Nonprofits and
Government: Comparative Analysis. Washington D.C.: The Urban Institute
Prajogo, D. I., & McDermott, C. M. (2005). The relationship between Total Quality
Management practices and organizational culture. International Journal of Operations &
Production Management, 25(11), 1101–1122.

136
Quinn, R., Cameron, K., Degraff, J., & Thakor, A. (2006). Competing values leadership.
UK: Edward Elgar
Quinn, R. E., & Rohrbaugh, J. (1983). A spatial model of effectiveness criteria: Towards a
competing values approach to organizational analysis. Management Science, 29(3), 363–
377.
Quinn, R. E., and Spreitzer, G. M. (1991). The psychometrics of the competing values culture
instrument and an analysis of the impact of organizational culture on quality of life.
Research in Organizational Change and Development, 5, 115-142. doi:
10.1108/02683940310459583
Rathgeb Smith, S. (2012). Changing government policy and its implications for nonprofit
management education. Nonprofit Management and Leadership,23(1), 29-41.
Rafferty, A. E., & Griffin, M. A. (2004). Dimensions of transformational leadership: Conceptual
and empirical extensions. The Leadership Quarterly, 15(3), 329–354.
doi:10.1016/j.leaqua.2004.02.009
Riggio, R. E., Bass, B. M., & Smith-Orr, S. (2004). Transformational leadership in nonprofit
organizations. Improving Leadership in Nonprofit Organizations, 49, 62.
Roeger, K.L., Blackwood, A. S., & Pettijohn, S. L. (2012) The Nonprofit Almanac 2012.
Washington D.C.: The Urban Institute.
Rost, J. C. (1993). Leadership for the twenty-first century. New York: Praeger. Rutowski, K. D., Guiler, J. K., & Schimmel, K. E. (2009). Benchmarking organizational
commitment across nonprofit human services organizations in Pennsylvania.
Benchmarking: An International Journal, 16(1), 135–150.

137
Salamon, L. (2012). The state of nonprofit America (2nd ed). New York, NY: Brookings.
Salamon, L. M. (1999). America’s nonprofit sector: A primer (2nd ed.). New York, NY:
Foundation Center.
Salamon, L. M. "The Rise of the Nonprofit Sector. Foreign Affairs 73(4) (1994):109-122. Salamon, L. M. (2010). Putting the civil society sector on the economic map of the
world. Annals of Public and Cooperative Economics, 81(2), 167-210.
Salamon, L., & Anheier, Helmut K. (1997). Defining the nonprofit sector : A cross-national
analysis (Johns Hopkins nonprofit sector series ; 4). Manchester, UK ; New York : New
York: Manchester University Press ; Distributed exclusively in the USA by St. Martin's
Press.
Salamon, L., Geller, S., & Newhouse, C. (2012). What Do Nonprofits Stand For?. Listening Post
Communique, 22.
Salamon, L. M., Sokolowski, S. W., & Geller, S. L. (2012). Holding the fort: Nonprofit
employment during a decade of turmoil. Johns Hopkins University: Center for Civil
Society Studies.
Salant, P., & Dillman, D. A. (1994). How to conduct your own survey. New York, NY: Wiley.
Sarros, J. C., Cooper, B. K., & Santora, J. C. (2008). Building a climate for innovation through
transformational leadership and organizational culture. Journal of Leadership &
Organizational Studies, 15(2), 145–158. doi:10.1177/1548051808324100
Schein, E., Fowler, R.D., Offermann, L.R., & Gowing, M. K. (1990).
Organizational Culture. American Psychologist, 45(2), 109-119.
Schein, Edgar H. (1996). Culture: The Missing Concept in Organization Studies. Administrative
Science Quarterly, 41(2), 229-40.

138
Schein, E. H. (2010). Organizational culture and leadership (4th ed.). Hoboken, NJ: Wiley.
Schneider, B. (1987). The people make the place. Personnel Psychology, 40(3), 437–453.
Schneider, B., Ehrhart, M. G., & Macey, W. H. (2013). Organizational climate and culture.
Annual Review of Psychology, 64, 361–388.
Shaw, J. D. (2011). Turnover rates and organizational performance review, critique, and research
agenda. Organizational Psychology Review, 1(3), 187–213.
Shaw, J. D., Duffy, M. K., Johnson, J. L., & Lockhart, D. E. (2005). Turnover, social capital
losses, and performance. Academy of Management Journal, 48(4), 594–606.
Sheehan, K. B., & McMillan, S. J. (1999). Response variation in e-mail surveys: An exploration.
Journal of Advertising Research, 39(4), 45–54.
Simsek, Z., & Veiga, J. F. (2001). A primer on internet organizational surveys. Organizational
Research Methods, 4(3), 218–235.
Singleton, R.A., Jr., & Straits, B.C. 2005. Approaches to social research.(4th ed.) New York:
Oxford University Press.
Smircich, L. (1983). Concepts of culture and organizational analysis. Administrative Science
Quarterly, 28(3), 339–358.
Sosik, J. J., Potosky, D., & Jung, D. I. (2002). Adaptive self-regulation: Meeting others’
expectations of leadership and performance. The Journal of Social Psychology, 142(2),
211–232.
Spears, L. C. (2004). Practicing servant-‐‑leadership. Leader to Leader, 2004 (34), 7–11.
Stinglhamber, F., & Vandenberghe, C. (2003). Organizations and supervisors as sources of
support and targets of commitment: A longitudinal study. Journal of Organizational
Behavior, 24(3), 251–270.

139
Stogdill, R. M. (1948). Personal factors associated with leadership: A survey of the literature.
The Journal of Psychology, 25(1), 35–71.
Strober, M. H. (1990). Human capital theory: Implications for HR managers. Industrial
Relations: A Journal of Economy and Society, 29(2), 214–239.
Tabachnick, B. G., & Fidell, L. S. (2013). Using multivariate statistics. (6th ed.) Boston, MA:
Pearson.
Tett, R. P., & Meyer, J. P. (1993). Job satisfaction, organizational commitment, turnover
intention, and turnover: Path analyses based on meta-‐‑analytic findings. Personnel
Psychology, 46(2), 259–293.
Trice, H. M., & Beyer, J. M. (1993). The cultures of work organizations. Englewood Cliffs, NJ:
Prentice-Hall.
Uhl-Bien, M., & Marion, R. (2008). Complexity leadership. IAP.
U.S. General Accounting Office (GAO). (2003). Child welfare: HHS could play a greater role in
helping child welfare agencies recruit and retain staff.
Van, D. B., & Wilderom, C. P. M. (2004). Defining, measuring, and comparing organisational
cultures. Applied Psychology, 53(4), 570–582. doi:10.1111/j.1464-0597.2004.00189.x
Vandenberg, R., & Nelson, J. (1999). Disaggregating the motives underlying turnover intentions:
When do intentions predict turnover behavior? Human Relations, 52(10), 1313–1336.
doi:10.1023/A:1016964515185
Verkhohlyad, O., & McLean, G. N. (2012). Applying organizational commitment and human
capital theories to emigration research. European Journal of Training and Development,
36(2/3), 308–328.

140
Viator, R. E. (2001). The relevance of transformational leadership to nontraditional accounting
services: Information systems assurance and business consulting. Journal of Information
Systems, 15(2), 99–125.
Waldman, D. A., & Yammarino, F. J. (1999). CEO charismatic leadership: Levels-of-
management and levels-of-analysis effects. Academy of Management Review, 24(2), 266–
285.
Wang, H., Tsui, A. S., & Xin, K. R. (2011). CEO leadership behaviors, organizational
performance, and employees’ attitudes. The Leadership Quarterly, 22(1), 92–105.
Wart, M. V. (2003). Public-‐‑sector leadership theory: An assessment. Public Administration
Review, 63(2), 214–228.
Wayne, S. J., Coyle-Shapiro, J., Eisenberger, R., Liden, R. C., Rousseau, D. M., & Shore, L. M.
(2009). Social influences. In Klein, H., T. Becker & Meyer, J. (Eds), Commitment in
Organizations: Accumulated Wisdom and New Directions, , 253–284. New York:
Rutledge.
Williams, S. E., Kirk, A., & Wilson, T. (2011). A recent look at the factors influencing
workforce retention in public child welfare. Children and Youth Services Review, 33(1),
157-160.
Woodman, R. W., Pasmore, W. A. (1998). Research in organizational change and development:
An annual series featuring advances in theory, methodology and research (Vol. 11)
(Woodman, R. W., Pasmore, W. A., Eds.). Stamford, CT: JAI Press.
Xenikou, A., & Simosi, M. (2006). Organizational culture and transformational leadership as
predictors of business unit performance. Journal of Managerial Psychology, 21(6),
Yeakey, G. W. (2002). Situational leadership. Military Review, 82(1), 72–82.

141
Yeung, A., Brockbank, J. & Ulrich, D. (1991). Organizational culture and human resource
practices: an Empirical assessment. Research in Organizational Change and
Development, 5, 59-81.
Young, D. R. (2006). Complementary, supplementary, or adversarial? Nonprofit-government
relations. Nonprofits & government: Collaboration & conflict, 37.
Yukl, G. A. (2013). Leadership in organizations (8th ed.). Englewood Cliffs, NJ: Prentice-Hall.
Zammuto, R.F., & Krakower, J.Y. (1991). Quantitative and qualitative studies of organizational
culture. Research in Organizational Change and Development, 5, 83–114.
Zammuto, R. F., & O’Connor, E. J. (1992). Gaining advanced manufacturing technologies’
benefits: The roles of organization design and culture. Academy of Management Review,
17(4), 701–728.
Zhu, W., Avolio, B. J., & Walumbwa, F. O. (2009). Moderating role of follower characteristics
with transformational leadership and follower work engagement. Group & Organization
Management. 34(5), 590-619.