understanding the hbs compute gridthe hbs compute grid is a great startfor using advance computing...
TRANSCRIPT

Understanding the HBSCompute Grid
RCS Training Series
Bob Freeman, PhDDirector, Research Technology Operations
HBS
29 January, 2020

Today's Training…Agenda• Introductions• Q&A• Integrated technologies of login, storage, & compute• Job information and control• Choosing resources
• Job efficiency – are 4 cores needed?• Less RAM + less CPU = more work
• Important points to remember & Troubleshooting
Goals• Understand the technology you are using• Learn how to get information on jobs and control them if needed• Look at RAM & CPU usage from previous jobs to inform choices for future work• Understand considerations for parallel processing
• Ultimately… help you be more efficient and successful with your research!
We're going assume you've been doing work for a few weeks. No worries if not!

The HBS Compute Grid is a great start for using advance computing resources (ACI). But there are things to remember:• NB! This is expensive, shared equipment and other people's research is at risk.
• This is a Level 3 & 4 HRCI environment. Please respect the security guidelines & be cautious with code you have not written.
• We promote not only fair use, but also fair access. With limited resources, we support• Batch, background processing, and• "Interactive" work that is truly interactive*
• Job information and control only happens through the terminal.• Do not be afraid! We have a Compute Grid: Unix Cheatsheet class!
• If problems, remember bjobs and bhist (& your friends at RCS!)• With project spaces, permissions can be a problem. See our online write-up• If parallel processing, ensure that you use the correct command sequence:
• Ask the scheduler for the CPUs• Tell your code these CPUs can be used via the LSB_MAX_NUM_PROCESSORS environment variable
• Do not run >20 jobs that have heavy disk I/O into the same directory. Use /export/scratch• Talk to us about workflow and usage questions! Guidance is FREE!• Perhaps FASRC’s Cannon might be more appropriate for the volume & shape of your work
3
Important Points

Integrated technologies of login, storage, & compute
Scheduler
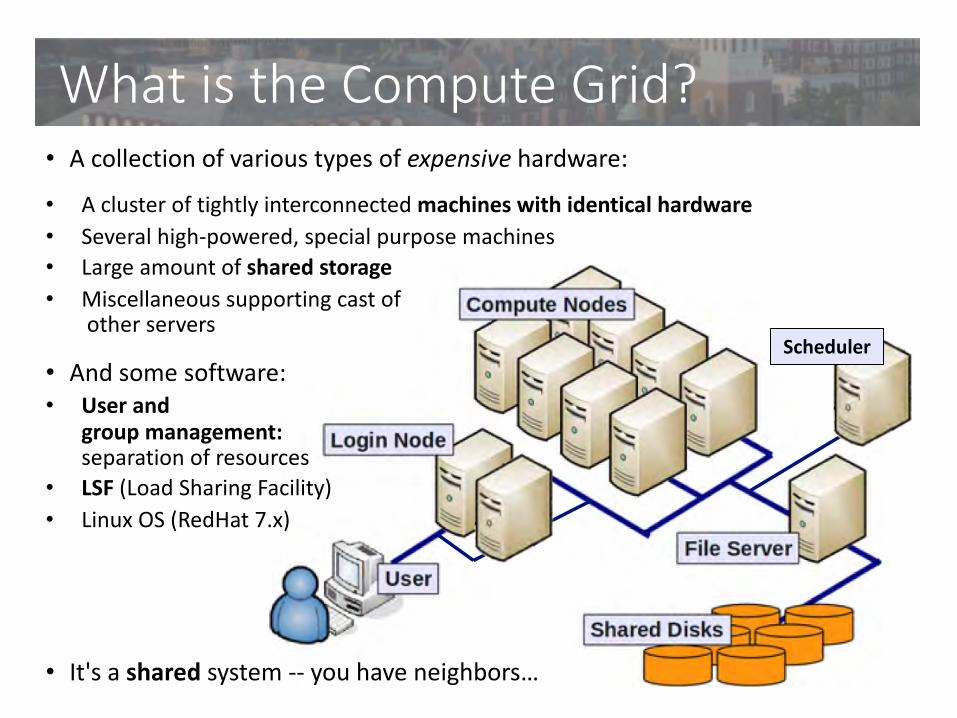
What is the Compute Grid?• A collection of various types of expensive hardware:
• A cluster of tightly interconnected machines with identical hardware• Several high-powered, special purpose machines• Large amount of shared storage• Miscellaneous supporting cast of
other servers
• And some software:• User and
group management:separation of resources
• LSF (Load Sharing Facility)• Linux OS (RedHat 7.x)
• It's a shared system -- you have neighbors…

Key DefinitionsThe typical hardware unit is called a node• Same stuff that's in a desktop/laptop: CPUs, Memory,
Hard drive, Network cards• But more powerful and more of them compared to a
typical desktop• Nodes are individual hosts with distinct names. E.g...
• rhrcscli1: one of the login nodes• rhrcsnod7: one of the compute nodes
The basic computational unit in a cluster is a CPU core• Each core runs one process, an average job• Most compute nodes have 32 cores
arranged on 4 CPUs (8 cores/CPU)• Thus, most nodes run 32 jobs (batch/interactive)
1 2 3 4
5 6 7 8
9 10 1112
1314 1516

Key DefinitionsA typical compute node is configured:• 32 cores• 256 GB RAM, or ~8 GB RAM/core• 1 network card to communicate within
the data center• Small, local hard disk/SSD
for boot and local /scratch
All cores on a node share all other resources of the node: memory, network bandwidth, etc.
Thus, how you use these resources affects the other 31 jobs on that compute node

A Closer Look…
Scheduler

A Closer Look…
Storage
Compute
Remote Access
Software
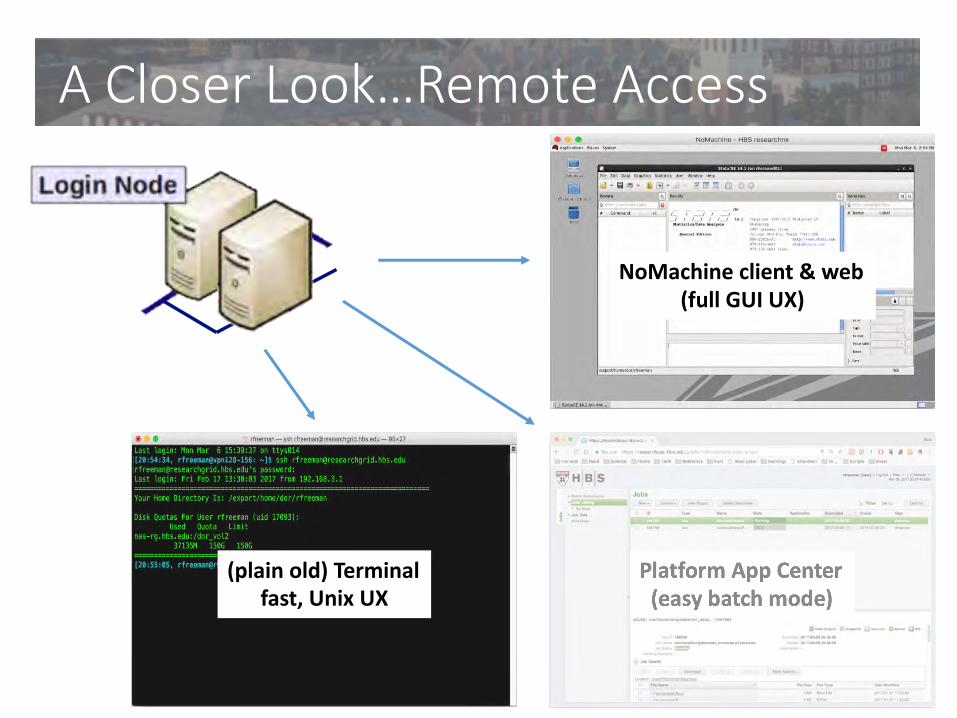
A Closer Look…Remote Access
NoMachine client & web(full GUI UX)
(plain old) Terminalfast, Unix UX

A Closer Look…at Compute

A Closer Look…at Compute
Scheduler
1. Run program from Application pull-down menu2. Scheduler is contacted to request work be done
(interactive program)3. Scheduler finds compute node with resources free4. Job is sent to compute node*5. Compute node starts executing code while the
display still appears on the login6. Program continues to run and resources are
unavailable until explicitly quit by user
* only if resource limits aren't hit

A Closer Look…at Compute
1. Start application…
2. Application launches…
3. Run terminal app… 4. Use bjobs command for job info…

Finite Limits of the Grid…32 cores * 10.5 boxes = 336 coreseach box = 256 GB RAM
resource limits: 150 cores max, batch18 cores max, interactive
& 3 concurrent sessionsno RAM limit
Do talk to us if you need a temporary increase of your allocation

A Closer Look…At Storage
/export/home/dor
/export/projects/jharvard_taxes
/export/scratch
rhrcscli01 rhrcsnod01 rhrcsnod02 rhrcsnod03
The filesystem looks the same* from every machine, even the login nodes!
Snapshots every hour, and quotas enforced.Use for solo & project work
No backup; Use for temp work; be careful of permissions; & not part of quota

A Closer Look…at Software
Execution PATH prioritizes: /usr/local/bin-wrappers/R-5g
Default wrapper scripts can be avoided by using direct LSF commands and options. See our website http://grid.rcs.hbs.org
scheduler
compute node
Execution PATH prioritizes: /usr/local/bin/R
Accessed via• interactive shell sessions• custom LSF job commands

A Closer Look…at Software
Default wrapper scripts can be avoided by using direct LSF commands and options.See our website http://grid.rcs.hbs.org/custom-submission-scripts
Default wrapper scripts: presets for RAM and (mostly single) core usage• Drop down menus• Command-line wrappers
Same effect can be used by writing your own LSF commandsbsub -q long_int -n 1 -Is -R "rusage[mem=5120]" –M 5120 –hl /usr/local/app/conda-R/conda-R-5.1/bin/rstudio
bsub -q long_int -n 1 -Is -app R-5g –hl /usr/local/app/conda-R/conda-R-5.1/bin/rstudio
bsub -q long_int -n 1 -Is -app R-5g –hl rstudio # sometimes, for pre-made shortcuts
# at the Unix command line, both are sameRstudio-5gRstudio
# -5g, -10g, -20g, for example…stata-mp4-5g
# these are both the samematlab -n2matlab-5g -n2
# batch, since files are namedmatlab-5g -n2 myscript.m output.txt

Running a Job…Interactive• Drop-down menus in NoMachine• In a terminal window…
• Executing a command-line wrapper script w/o naming a file matlab-5g
• Executing a custom LSF command that includes the -Ip flag and is sent to an interactive queuebsub -q long_int -Ip /bin/bash # assumes 1 core and 5-8 GB default RAM
Batch• (Cannot be done via drop-down menus in NoMachine)• In a terminal window…
• Executing a command-line wrapper script and naming a file matlab-5g myfile.m
• Executing a custom LSF command that omits the -Ip flag and is sent to an batch queuebsub -q long matlab -r "myfile“ # again assume 1 core and 5-8 GB default RAM
https://grid.rcs.hbs.org/interactive-vs-batch-jobs

Looking at Job Information

A Closer Look…• Get current job information
• bjobs # PEND, RUN, & SUSP• bjobs -l JOBID # long format
• Get historic information from past week or beyond• bhist # anything recent• bhist -l JOBID # long format• bhist -a –n0 -S 2017/09/01, # your jobs since 9/1/17
• Kill a job or all jobs• bkill JOBID # one job• bkill 0 # all jobs
• How busy is the cluster?• bjobs -u all # see all users• bqueues && bhosts && lsload # show cluster load

For Current Jobs…[16:57:27, rfreeman@rhrcscli01:~]$ bjobsJOBID USER STAT QUEUE FROM_HOST EXEC_HOST JOB_NAME SUBMIT_TIME144767 rfreema RUN interactiv rhrcscli01 rhrcsnod02 *n/rstudio Mar 6 16:44
[16:57:30, rfreeman@rhrcscli01:~]$ bjobs -l 144767
Job <144767>, User <rfreeman>, Project <R>, Application <R-5g>, Status <RUN>, Queue <interactive>, Interactive mode, Command </usr/local/apps/R/rstudio/v0.98.493/bin/rstudio>
Mon Mar 6 16:44:29: Submitted from host <rhrcscli01>, CWD <$HOME>;Mon Mar 6 16:44:29: Started on <rhrcsnod02>;Mon Mar 6 16:57:34: Resource usage collected.
The CPU time used is 37 seconds.IDLE_FACTOR(cputime/runtime): 0.04MEM: 169 Mbytes; SWAP: 2.2 Gbytes; NTHREAD: 13PGID: 12778; PIDs: 12778 PGID: 12779; PIDs: 12779 12781 12793
MEMORY USAGE:MAX MEM: 169 Mbytes; AVG MEM: 159 Mbytes
SCHEDULING PARAMETERS:r15s r1m r15m ut pg io ls it tmp swp mem
loadSched - - - - - - - - - - -loadStop - - - - - - - - - - -
RESOURCE REQUIREMENT DETAILS:Combined: select[type == local] order[r15s:pg] rusage[mem=5120.00]Effective: select[type == local] order[r15s:pg] rusage[mem=5120.00]

A Closer Look…
[16:59:29, rfreeman@rhrcscli01:~]$ bjobsJOBID USER STAT QUEUE FROM_HOST EXEC_HOST JOB_NAME SUBMIT_TIME144769 rfreema RUN interactiv rhrcscli01 rhrcsnod02 *n/rstudio Mar 6 17:02[17:09:08, rfreeman@rhrcscli01:~]$ bjobs -l 144769
Job <144769>, User <rfreeman>, Project <R>, Application <R-5g>, Status <RUN>, Queue <interactive>, Interactive mode, Command </usr/local/apps/R/rstudio/v0.98.493/bin/rstudio>
Mon Mar 6 17:02:25: Submitted from host <rhrcscli01>, CWD <$HOME>;Mon Mar 6 17:02:25: Started on <rhrcsnod02>;Mon Mar 6 17:08:43: Resource usage collected.
The CPU time used is 365 seconds.IDLE_FACTOR(cputime/runtime): 0.90MEM: 221 Mbytes; SWAP: 2.2 Gbytes; NTHREAD: 13PGID: 19033; PIDs: 19033 PGID: 19034; PIDs: 19034 19036 19048
MEMORY USAGE:MAX MEM: 221 Mbytes; AVG MEM: 204 Mbytes

[17:16:34, rfreeman@rhrcscli01:~]$ bjobs -l 144769
Job <144769>, User <rfreeman>, Project <R>, Application <R-5g>, Status <RUN>, Queue <interactive>, Interactive mode, Command </usr/local/apps/R/rstudio/v0.98.493/bin/rstudio>
Mon Mar 6 17:02:25: Submitted from host <rhrcscli01>, CWD <$HOME>;Mon Mar 6 17:02:25: Started on <rhrcsnod02>;Mon Mar 6 20:44:00: Resource usage collected.
The CPU time used is 975 seconds.IDLE_FACTOR(cputime/runtime): 0.07MEM: 244 Mbytes; SWAP: 2.3 Gbytes; NTHREAD: 13PGID: 19033; PIDs: 19033 PGID: 19034; PIDs: 19034 19036 19048
MEMORY USAGE:MAX MEM: 246 Mbytes; AVG MEM: 239 Mbytes
SCHEDULING PARAMETERS:r15s r1m r15m ut pg io ls it tmp swp mem
loadSched - - - - - - - - - - -loadStop - - - - - - - - - - -
RESOURCE REQUIREMENT DETAILS:Combined: select[type == local] order[r15s:pg] rusage[mem=5120.00]Effective: select[type == local] order[r15s:pg] rusage[mem=5120.00]
3 Hours later…
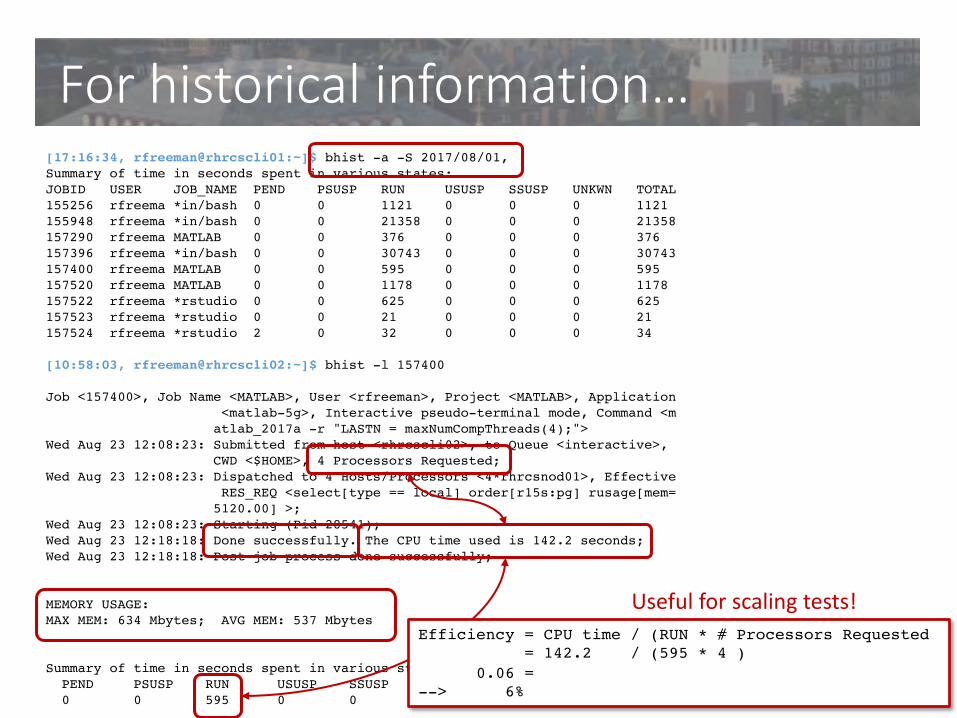
[17:16:34, rfreeman@rhrcscli01:~]$ bhist -a -S 2017/08/01,Summary of time in seconds spent in various states:JOBID USER JOB_NAME PEND PSUSP RUN USUSP SSUSP UNKWN TOTAL155256 rfreema *in/bash 0 0 1121 0 0 0 1121 155948 rfreema *in/bash 0 0 21358 0 0 0 21358 157290 rfreema MATLAB 0 0 376 0 0 0 376 157396 rfreema *in/bash 0 0 30743 0 0 0 30743 157400 rfreema MATLAB 0 0 595 0 0 0 595 157520 rfreema MATLAB 0 0 1178 0 0 0 1178 157522 rfreema *rstudio 0 0 625 0 0 0 625 157523 rfreema *rstudio 0 0 21 0 0 0 21 157524 rfreema *rstudio 2 0 32 0 0 0 34
[10:58:03, rfreeman@rhrcscli02:~]$ bhist -l 157400
Job <157400>, Job Name <MATLAB>, User <rfreeman>, Project <MATLAB>, Application<matlab-5g>, Interactive pseudo-terminal mode, Command <matlab_2017a -r "LASTN = maxNumCompThreads(4);">
Wed Aug 23 12:08:23: Submitted from host <rhrcscli02>, to Queue <interactive>,CWD <$HOME>, 4 Processors Requested;
Wed Aug 23 12:08:23: Dispatched to 4 Hosts/Processors <4*rhrcsnod01>, EffectiveRES_REQ <select[type == local] order[r15s:pg] rusage[mem=5120.00] >;
Wed Aug 23 12:08:23: Starting (Pid 28541);Wed Aug 23 12:18:18: Done successfully. The CPU time used is 142.2 seconds;Wed Aug 23 12:18:18: Post job process done successfully;
MEMORY USAGE:MAX MEM: 634 Mbytes; AVG MEM: 537 Mbytes
Summary of time in seconds spent in various states by Wed Aug 23 12:18:18PEND PSUSP RUN USUSP SSUSP UNKWN TOTAL0 0 595 0 0 0 595
For historical information…
Efficiency = CPU time / (RUN * # Processors Requested= 142.2 / (595 * 4 )
0.06 =--> 6%
Useful for scaling tests!

[10:58:27, rfreeman@rhrcscli02:~]$ bhist -l 157396
Job <157396>, User <rfreeman>, Project <default>, Interactive pseudo-terminal shell mode, Command </bin/bash>
Wed Aug 23 11:44:51: Submitted from host <rhrcscli01>, to Queue <interactive>,CWD <$HOME>, Requested Resources <rusage[mem=1000]>, Specified Hosts <rhrcsnod07>;
RUNLIMIT 1440.0 min of rhrcscli01Wed Aug 23 11:44:51: Dispatched to <rhrcsnod07>, Effective RES_REQ <select[type
== any] order[r15s:pg] rusage[mem=1000.00] >;Wed Aug 23 11:44:51: Starting (Pid 21766);Wed Aug 23 20:17:14: Exited by signal 9. The CPU time used is 191.2 seconds;Wed Aug 23 20:17:14: Completed <exit>; TERM_EXTERNAL_SIGNAL: job killed by a si
gnal external to LSF;
MEMORY USAGE:MAX MEM: 4 Mbytes; AVG MEM: 3 Mbytes
Summary of time in seconds spent in various states by Wed Aug 23 20:17:14PEND PSUSP RUN USUSP SSUSP UNKWN TOTAL0 0 30743 0 0 0 30743
For historical information…
Efficiency = CPU time / (RUN * # Processors Requested= 191.2 / (30743 * 1 )
0.01 ~=--> ~1%
Resources consumed by low efficiency "work" account for > 70% of the grid usage. If not actively using the resources, exit programs to release those resources for others to use!

Parallel Process &
Job Efficiency – Are More Cores Better? Faster?
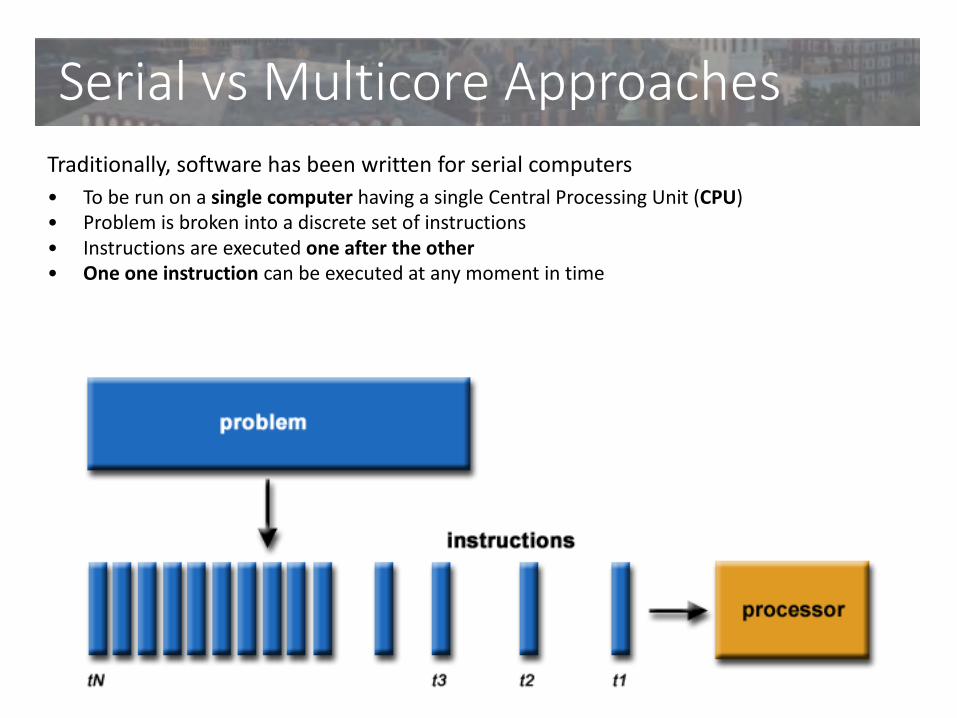
Traditionally, software has been written for serial computers• To be run on a single computer having a single Central Processing Unit (CPU)• Problem is broken into a discrete set of instructions• Instructions are executed one after the other• One one instruction can be executed at any moment in time
Serial vs Multicore Approaches

In the simplest sense, parallel computing is the simultaneous use of multiplecompute resources to solve a computational problem:• To be run using multiple CPUs• A problem is broken into discrete parts (either by you or the application itself) that can be
solved concurrently• Each part is further broken down to a series of instructions• Instructions from each part execute simultaneously on different CPUs
Serial vs Multicore Approaches

Stata/MP Performance Report Summary (1)
1 Summary
Stata/MP1 is the version of Stata that is programmed to take full advantage of multicore and multipro-cessor computers. It is exactly like Stata/SE in all ways except that it distributes many of Stata’s mostcomputationally demanding tasks across all the cores in your computer and thereby runs faster—muchfaster.
In a perfect world, software would run 2 times faster on 2 cores, 3 times faster on 3 cores, and soon. Stata/MP achieves about 75% e�ciency. It runs 1.7 times faster on 2 cores, 2.4 times faster on4 cores, and 3.2 times faster on 8 cores (see figure 1). Half the commands run faster than that. Theother half run slower than the median speedup, and some of those commands are not sped up at all,either because they are inherently sequential(most time-series commands) or because theyhave not been parallelized (graphics, mixed).
In terms of evaluating average performanceimprovement, commands that take longer torun—such as estimation commands—are ofgreater importance. When estimation com-mands are taken as a group, Stata/MP achievesan even greater e�ciency of approximately85%. Taken at the median, estimation com-mands run 1.9 times faster on 2 cores, 3.1 timesfaster on 4 cores, and 4.1 times faster on 8cores. Stata/MP supports up to 64 cores.
This paper provides a detailed report onthe performance of Stata/MP. Command-by-command performance assessments are pro-vided in section 8.
Median performance(estimation)
Median performance(all commands)
Logisticregression
Theoreticalupper bound
Lower bound (no improvement)1
2
4
8
Sp
ee
d r
ela
tive
to
sp
ee
d o
f si
ng
le c
ore
1 2 4 8Number of cores
Possible performance region
Figure 1. Performance of Stata/MP. Speed onmultiple cores relative to speed on a single core.
1. Support for this e↵ort was partially provided by the U.S. National Institutes of Health, National Institute on Aging
grants 1R43AG019542-01A1, 2R44AG019542-02, and 5R44AG019542-03. We also thank Cornell Institute for Social and
Economic Research (CISER) at Cornell University for graciously providing access to several highly parallel SMP platforms.
CISER sta↵, in particular John Abowd, Kim Burlingame, Janet Heslop, and Lars Vilhuber, were exceptionally helpful in
scheduling time and helping with configuration. The views expressed here do not necessarily reflect those of any of the
parties thanked above.
Revision 3.0.1 30jan2016
Stata offers a 293-page report on its parallelization efforts. They are pretty impressive. However:
Example: Stata Parallelization
With multiple cores, one might expect to achieve the theoretical upper bound of doubling the speed by doubling the number of cores—2 cores run twice as fast as 1, 4 run twice as fast as 2, and so on. However, there are three reasons why such perfect scalability cannot be expected: 1) some calculations have parts that cannot be partitioned into parallel processes; 2) even when there are parts that can be partitioned, determining how to partition them takes computer time; and 3) multicore/multiprocessor systems only duplicate processors and cores, not all the other system resources.
Stata/MP achieved 75% efficiency overall and 85% efficiency among estimation commands.
Speed is more important for problems that are quantified as large in terms of the size of the dataset or some other aspect of the problem, such as the number of covariates. On large problems, Stata/MP with 2 cores runs half of Stata’s commands at least 1.7 times faster than on a single core. With 4 cores, the same commands run at least 2.4 times faster than on a single core.
This parallelization benefit is mostly realized in batch mode … most of
interactive Stata is waiting for user input (or left idle), as CPU efficiency
is typically < 5% - 10%

In order to run in parallel, programs (code) must be explicitly programmed to do so.Thus, requesting cores from the scheduler does not automagically parallelize your code.
#!/bin/bash##BSUB -q normal # Queue to submit to#BSUB -J my_workflow # Job name#BSUB -n 8 # Number of cores#BSUB -N 1 # One machine...
stata-mp8 –b do mybatch.dopython myscript.py –n $LSB_MAX_NUM_PROCESSORS
mycompare –db mesh –out ids.mesh.txt # WRONG!!mycompare –db mesh –out ids.mesh.txt –num_threads 8 # WRONG!!mycompare –db mesh –out ids.mesh.txt –num_threads $LSB_MAX_NUM_PROCESSORS # YES!!
Parallel Processing…
Ask for cores
Tell your program

• By default, R, Python, Perl, and MATLAB* are not multithreaded … so do not ask for or try to use more than 1 core/CPU!!
• For all these programs, you cannot use the drop-down GUI menus / wrapper scripts.• Use command-line wrappers or write your own custom LSF submission scripts, and you must set
the # of CPUs/core dynamically! DO NOT USE STATIC VALUES!• For R, you can use appropriate routines with Rparallel
• Now part of base-R, and includes Rforeach, RdoMC, or Rsnow• For Python, you can use the multiprocessing library (or many others)• For Perl, there's threads or Parallel::ForkManager• MATLAB has parpool, and do not set the worker thread count in GUI settings
# R example (parallel.R)library(doMC)mclapply(seq_len(), run2, mc.cores = Sys.getenv('LSB_MAX_NUM_PROCESSORS'))
bsub –q short –n 4 -app R-5g –hl R CMD BATCH parallel.R # custom submission command
# MATLAB example (parallel.m)hPar = parpool( 'local' , str2num( getenv('LSB_MAX_NUM_PROCESSORS') ) );…
matlab-5g –n4 parallel.m # uses command-line wrapper
Multicore Options in R, Python, & MATLAB
See more info on our website at http://grid.rcs.hbs.org/parallel-processing

We've mostly been discussing explicit parallelization:writing code that uses more than 1 CPU/core
There's also implicit parallelization:code (usually from a vendor) that has been written to already use multiple cores
Pleasantly parallelizing:breaking a task into smaller independent pieces, which are submitted as jobscan also use job arrays if all pieces are shaped identically
More information can be found on our HBSGrid website!
Parallel Processing…

Less RAM + less CPU = more work

What are you working with?
Is it really worth it? Do you really need this?Do you need all that RAM?Do you need all that CPU?
Going beyond your resource limit causes PEND problems:[jharvard@rhrcscli1:~]$ bjobs –wJOBID USER STAT QUEUE FROM_HOST EXEC_HOST JOB_NAME SUBMIT_TIME144795 jharvard RUN interactive rhrcscli01 4*rhrcsnod08 /usr/local/bin/jobstarter_xstata-mp4.pl xstata-mp4 Mar 7 10:40144796 jharvard RUN interactive rhrcscli01 4*rhrcsnod07 /usr/local/bin/jobstarter_xstata-mp4.pl xstata-mp4 Mar 7 10:44144797 jharvard RUN interactive rhrcscli01 4*rhrcsnod07 /usr/local/bin/jobstarter_xstata-mp4.pl xstata-mp4 Mar 7 10:44144798 jharvard PEND interactive rhrcscli01 - /usr/local/bin/jobstarter_xstata-se.pl xstata-se Mar 7 10:44[jharvard@rhrcscli1:~]$
32 cores * 10.5 boxes = 336 coreseach box = 256 GB RAM
resource limits: 150 cores max, batch18 cores max, interactive
& 3 concurrent sessionsno RAM limit

Methods for Selecting CPU & RAM
Several good starting points:
• More is not really better, since this is a shared resource
• Use fewer cores, perhaps 1, for interactive work, unless finishing work in short period of time. • Interactive = computer is waiting for you
• If parallelizing, do some basic scaling tests• Check your MAX MEM usage from past job history (as shown in a few slides),
and select best-fit memory footprint • Give yourself 20% extra RAM for wiggle room!• (Harder) Write custom LSF job submit commands to closely match memory
usage• You'll need to do this if requiring RAM amounts > 20 GB*

Methods for Selecting RAMIf you don't really know where to start…
• Each language has commands that will give you the memory usage of your data while loaded (in memory):
Stata:. memory
grand total indicates used and allocated (!)
https://www.stata.com/manuals14/dmemory.pdf
MATLAB:memory function only available on Windows. Others, use monitor_memory_whos.mfunction to determine variable usage, and add 0.5 GB for application overhead.
https://www.mathworks.com/matlabcentral/answers/97560-how-can-i-monitor-how-much-memory-matlab-is-using
Python:guppy module for total program and object information:from guppy import hpyh = hpy()print h.heap()Total size = 19909080 bytes.
https://www.pluralsight.com/blog/tutorials/how-to-profile-memory-usage-in-python
R:mem_used() function of pryr package can inform your variable usage, and add 0.5 GB for application overhead.
http://adv-r.had.co.nz/memory.html

Methods for Selecting RAM If you don't really know where to start…
• Or, if not creating new data structures after reading in data file, try RAM footprint that is 10x the data file size. If creating new ones, try 20x to 30x.
• Or, try a large memory size (e.g. 20G), finish your work, and decrease the memory ask by checking the MAX MEM usage, and selecting best fit memory footprint next time
• Give yourself 20% wiggle room!
# One Unix command to rule them all...
[jharvard@rhrcscli1:~]$ bjobs -l | grep -E "Application|IDLE|MAX"
Job <144795>, User <jharvard>, Project <XSTATA>, Application <stata-mp4-30g>, S IDLE_FACTOR(cputime/runtime): 0.01 MAX MEM: 56 Mbytes; AVG MEM: 49 Mbytes

Important Points&
Troubleshooting

The HBS Compute Grid is a great start for using advance computing resources (ACI). But there are things to remember:• NB! This is expensive, shared equipment and other people's research is at risk.
• This is a Level 3 & 4 HRCI environment. Please respect the security guidelines & be cautious with code you have not written.
• We promote not only fair use, but also fair access. With limited resources, we support• Batch, background processing, and• "Interactive" work that is truly interactive*
• Job information and control only happens through the terminal.• Do not be afraid! We have a Compute Grid: Unix Cheatsheet class!
• If problems, remember bjobs and bhist (& your friends at RCS!)• With project spaces, permissions can be a problem. See our online write-up• If parallel processing, ensure that you use the correct commands:
• Ask the scheduler for the CPUs• Tell your code these CPUs can be used via the LSB_MAX_NUM_PROCESSORS environment variable
• Do not run >20 jobs that have heavy disk I/O into the same directory. Use /export/scratch• Talk to us about workflow and usage questions! Guidance is FREE!• Perhaps FASRC’s Cannon might be more appropriate for the volume & shape of your work
39
Important Points

Before seeking help, take some basic steps to ascertain what is going on with your job:
• If running interactive jobs, no log files, so must use bjobs & bhist commands• Use bjobs -l to query details from LSF. Look towards bottom for errors:
o Is your job waiting for space (Resources)?o Will your job ever run (Dependency)?o Is there an error code or message?
• Otherwise, check your log files:o Was a *.log file generated? What does it say?o If using custom submission commands, you did specify both -o and -e, yes?o Message about Pre-emption, Timeout, or Failure?o The last error in the log is usually not the problem. The first one is!
• Did you request e-mail messages for your jobs with -u [email protected]?• If you got a job report through email, did you look at this to understand the error?• Is your job script formatted properly?• Are you using the correct software paths? Possible software/library conflicts?
40
Basic Troubleshooting

RCS Website & Documentation -- only authoritative sourcehttps://grid.rcs.hbs.org/
Submit a help request [email protected]
Best way to help us to help you? Give us...Description of problemAdditional info (login/batch? queue? JobIDs?)Steps to Reproduce (1., 2., 3...)Actual resultsExpected results
Getting Help

• Please talk to your peers, and … We wish you success in your research!
• https://grid.rcs.hbs.org/• https://training.rcs.hbs.org/• http://intranet.hbs.edu/dept/research/
• Follow us @hbs_rcs
• Fill out attendance form & survey at http://bit.ly/grid_training_survey
Research Computing Services