understanding the green economy american reinvestment and recovery act performance accountability...
TRANSCRIPT
Understanding the Green EconomyAmerican Reinvestment and Recovery Act
Performance Accountability ForumDecember 9, 2009
Bonnie Graybill,Deputy Division Chief
California Labor Market Information Division

Understanding the Green Economy
What is California LMI Doing/Planning? Collaborate to expand knowledge
with federal/state/local research partners to review existing research and identify information gaps
with state and local partners to define workforce needs and support workforce development
with control entities and utilities responsible for bringing about climate change
Respond to state and national information needs Share knowledge across agencies and geographic areas
Host a shared “green web page” that addresses existing research, survey methods and tools; national, state and local activities; legislation; See our page at http://www.labormarketinfo.edd.ca.gov/?pageid=1032
Survey California businesses to establish baselines of green employment and green business practices
Conduct and publish career research to support workforce development
National Partnerships and Learning National Workforce Information Council (WIC)
Green Jobs Study Group. WIC commissioned the Green Jobs Study Group Define and recommend methods for measuring green jobs Eight states including California, BLS, O*NET (Not as easy as it sounds…)
See Study Group reports. Workforce Information Council web site “green jobs page” http://
www.workforceinfocouncil.org/GreenJobs.asp
Final report of the Workforce Information Council Green Jobs Study Group http://www.workforceinfocouncil.org/Documents/WICGreenJobsStudyGroupReport-2009-10-01t.pdf
Department of Labor Learning Occupational Information Network (O*NET)
Green Economy Sector
http://online.onetcenter.org/find/green Bureau of Labor Statistics (BLS) plans to study the
green economy include Industry survey adapted from Quarterly Census of Employment
and Wages (QCEW) Annual Refiling Survey Occupational survey adapted from Occupational Employment
Statistics (OES) survey Develop career information materials Beginning in 2010- 2011
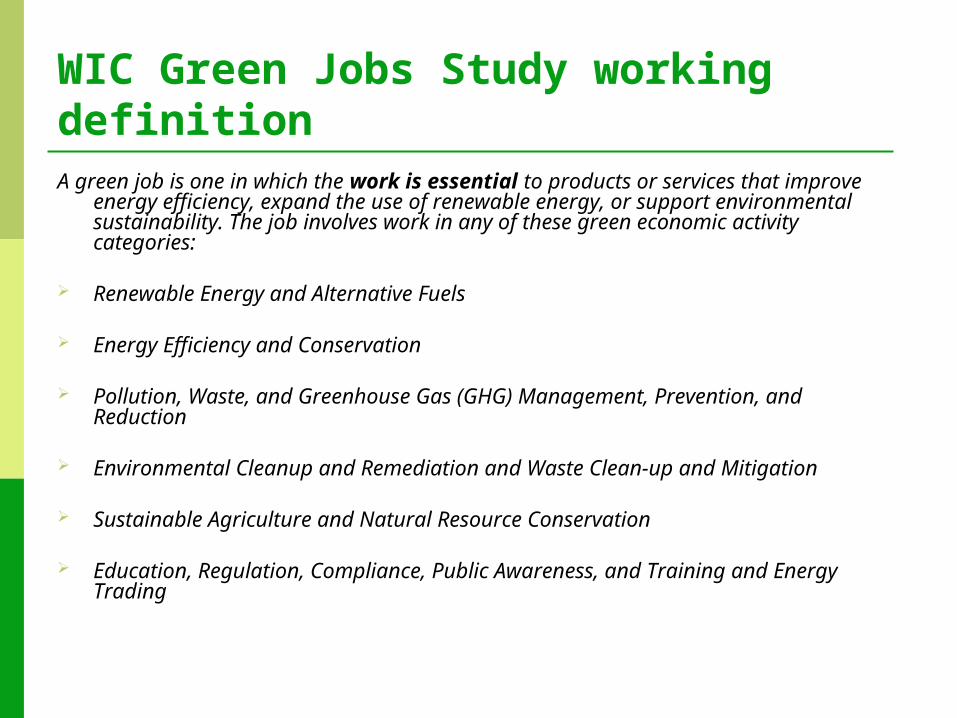
WIC Green Jobs Study working definitionA green job is one in which the work is essential to products or services that
improve energy efficiency, expand the use of renewable energy, or support environmental sustainability. The job involves work in any of these green economic activity categories:
Renewable Energy and Alternative Fuels Energy Efficiency and Conservation Pollution, Waste, and Greenhouse Gas (GHG) Management, Prevention,
and Reduction Environmental Cleanup and Remediation and Waste Clean-up and
Mitigation Sustainable Agriculture and Natural Resource Conservation Education, Regulation, Compliance, Public Awareness, and Training and
Energy Trading
Tie to Recovery Act Funding Smart Grid Transmission Lines Renewable Energy Energy Efficiency Weatherization
Recommended Strategy: Prepare dislocated workers for reemployment careers in these areas as appropriate
Green Industries tied to Recovery Act (Examples)
Energy Public and Private Utilities Power Generation plants (electric, hydroelectric, other fuels) Power Transmission Power Distribution Power and communication line construction
Construction Residential, commercial, industrial, remodeling Glazing contractors Roofing contractors
Manufacturing Various sectors—lighting, appliance, motor and generator,
storage batteries, motor vehicle, semiconductors Automatic environmental controls
Moving unemployed into green jobs “Re-skilling” (just a sampling…)
Professional (BA or Advanced degree): architects, cost estimators, engineers, planners, vocational education teachers
Skilled workers (AA or post secondary education): auto, bus and truck mechanics, biological and chemical technicians
Crafts and Trades workers (OJT—varying durations): assemblers, carpenters, electricians, plumbers, HVAC, insulation/weatherization
New Resources and Opportunities Employment and Training Administration Green
Economy LMI Improvement Grant Competition Notified in mid November that our proposal would be
funded. Planned activities include: Analyzing the results of our green employer survey currently
being conducted Conducting green occupational skills research; Improving skills transference by evaluating occupational skill
assessment tools, defining the relationships between assessment results and occupational characteristics, and automating the connection of these results to available labor market information;
Creating an online statewide green training inventory; and Improving electronic information delivery through enhancements
to the Labor Market Information Division’s information technology infrastructure.

California Labor Market Information’sWorking Definition of GreenGreen jobs produce (“supply”) goods or services that result in:
Generating and storing renewable energy
Recycling existing materials
Energy efficient product manufacturing, distribution, construction, installation, and maintenance
Education, compliance and awareness
Natural and sustainable product manufacturing
For the complete definition see:http://www.labormarketinfo.edd.ca.gov/contentpub/GreenDigest/Californias-Draft-Definition-Green-Industries.pdf
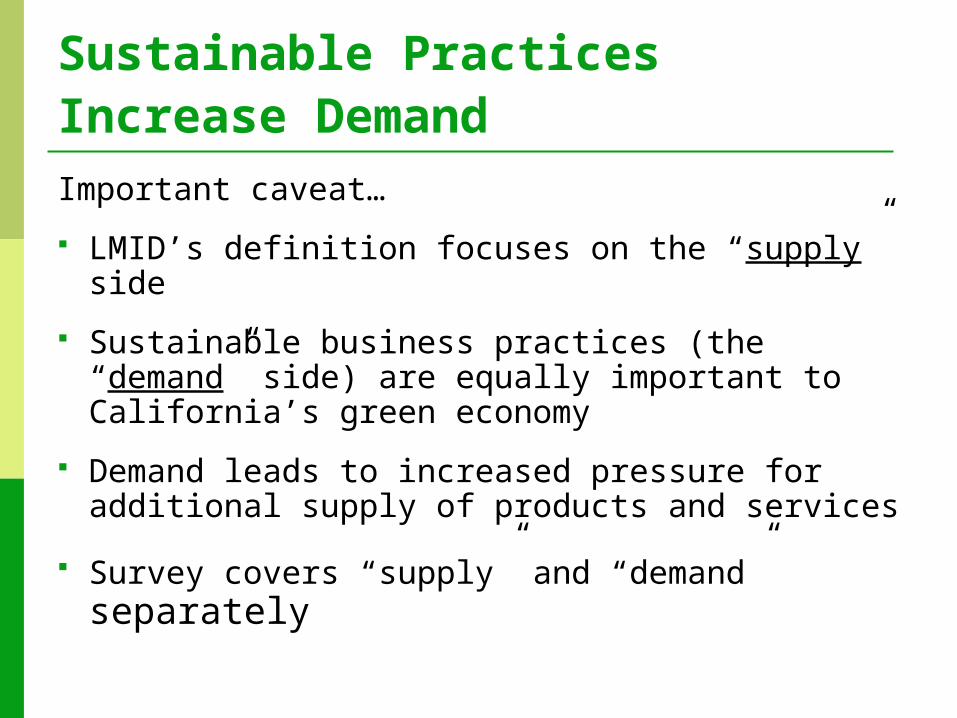
Sustainable Practices Increase Demand Important caveat…
LMID’s definition focuses on the “supply” side
Sustainable business practices (the “demand” side) are equally important to California’s green economy
Demand leads to increased pressure for additional supply of products and services
Survey covers “supply” and “demand” separately
Green Economy Survey Details
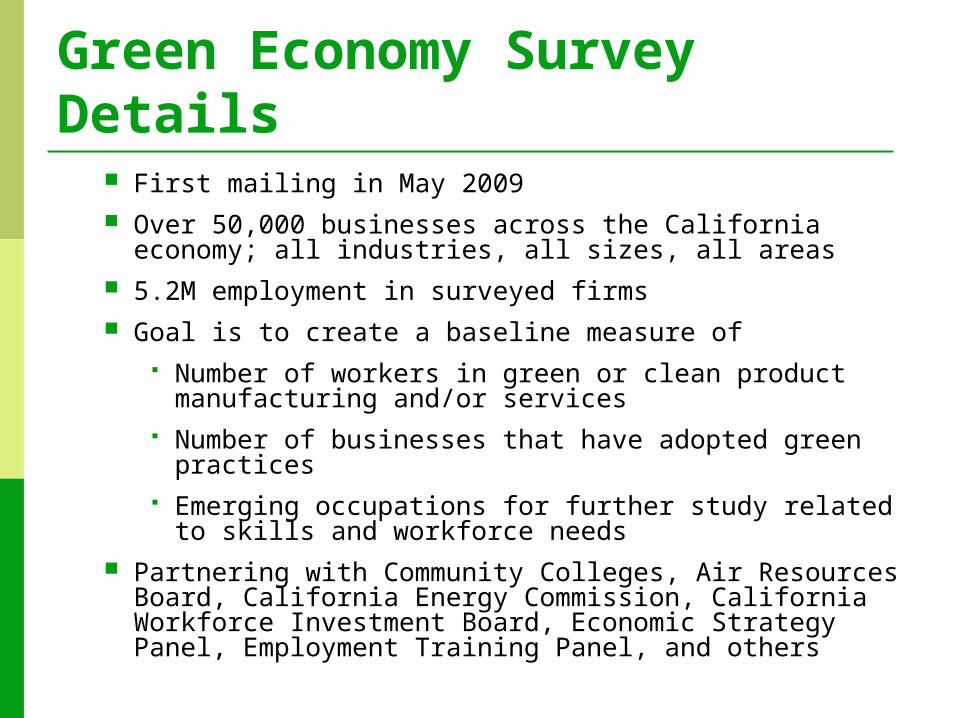
First mailing in May 2009 Over 50,000 businesses across the California economy; all
industries, all sizes, all areas 5.2M employment in surveyed firms Goal is to create a baseline measure of
Number of workers in green or clean product manufacturing and/or services
Number of businesses that have adopted green practices Emerging occupations for further study related to skills and
workforce needs Partnering with Community Colleges, Air Resources Board,
California Energy Commission, California Workforce Investment Board, Economic Strategy Panel, Employment Training Panel, and others
Preliminary data as of October 8, 2009
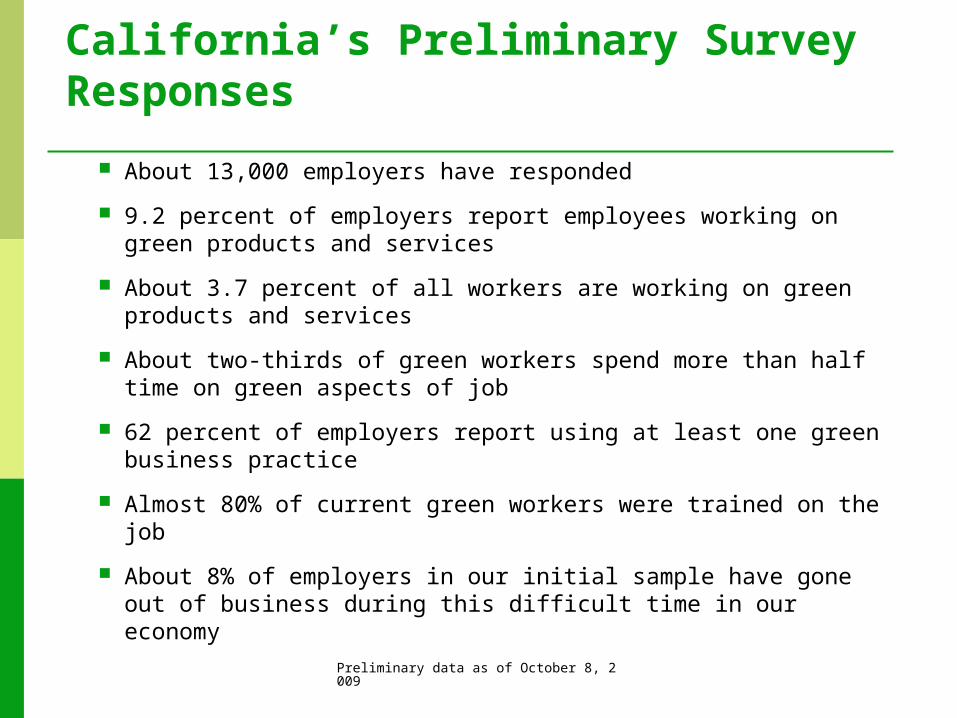
California’s Preliminary Survey Responses
About 13,000 employers have responded
9.2 percent of employers report employees working on green products and services
About 3.7 percent of all workers are working on green products and services
About two-thirds of green workers spend more than half time on green aspects of job
62 percent of employers report using at least one green business practice
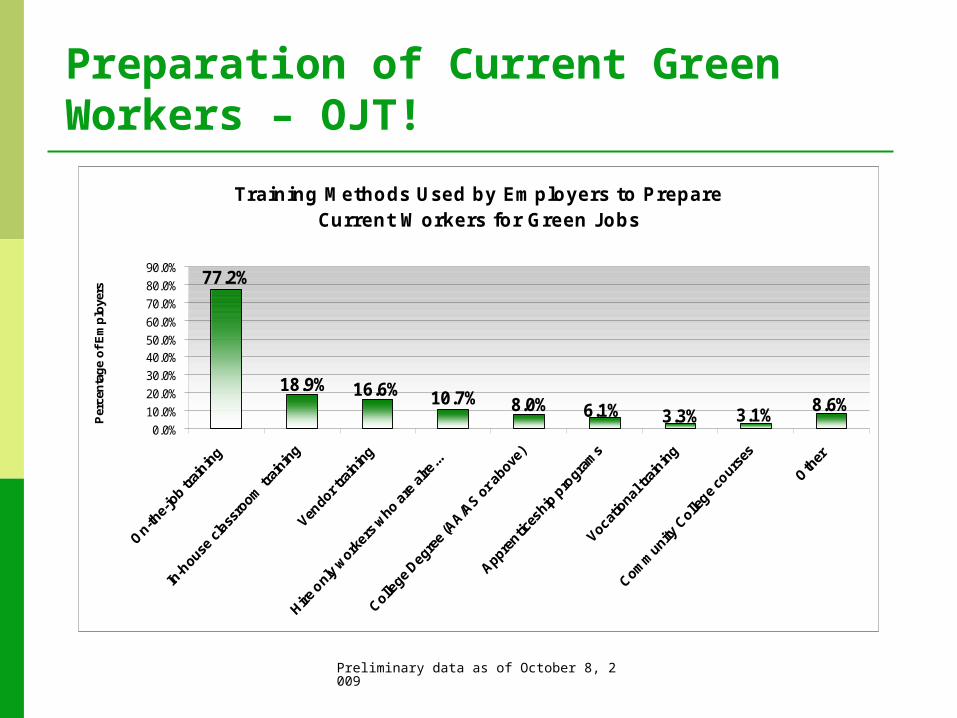
Almost 80% of current green workers were trained on the job
About 8% of employers in our initial sample have gone out of business during this difficult time in our economy

Preliminary data as of October 8, 2009
Comparison to Other States’ Recent Green Workforce Surveys?
Green as a percent of total employment
California 3.7 % (Prelim)Washington 1.6 %Oregon 3.0 %Michigan 3.0 %
Caveat…Definitions vary somewhat between states…
Renewable energy, recycling, and energy efficiency are in each states definition
Energy Efficiency
Recycling
Renewable Energy
Preliminary data as of October 8, 2009
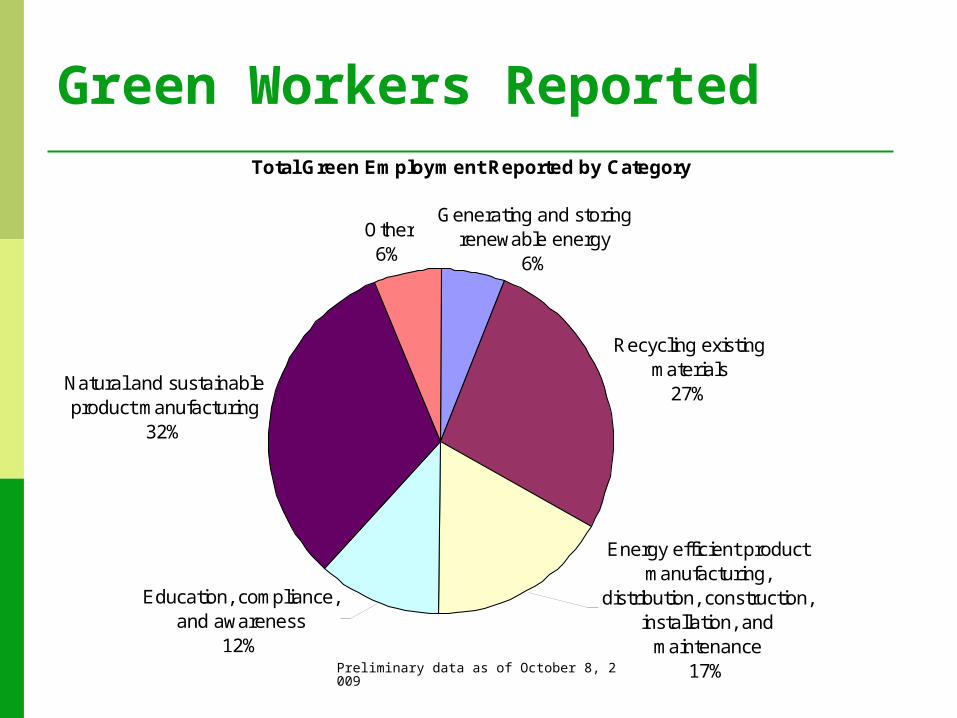
Green Workers ReportedTotal Green Employment Reported by Category
Recycling existing materials
27%Natural and sustainable product manufacturing
32%
Other6%
Generating and storing renewable energy
6%
Education, compliance, and awareness
12%
Energy efficient product manufacturing,
distribution, construction, installation, and
maintenance17%

Preliminary data as of October 8, 2009
6%
Generating and storing renewable energy
Top industries Professional and Business Services Utilities Wholesale Electronic Markets and Agents
Top occupations Architects, Except Landscape Alternative Energy Engineers Electrical Engineers Heating and Air Conditioning Technicians and
Installers Wastewater Technicians and Operators Plumbers, Pipefitters, and Steamfitters Solar Photovoltaic Panel Installers and Technicians Air Quality Engineers; Air Pollution Specialists; Air
Resources Engineers Building Performance or Retro-Fitting Specialists Electricians
Preliminary data as of October 8, 2009
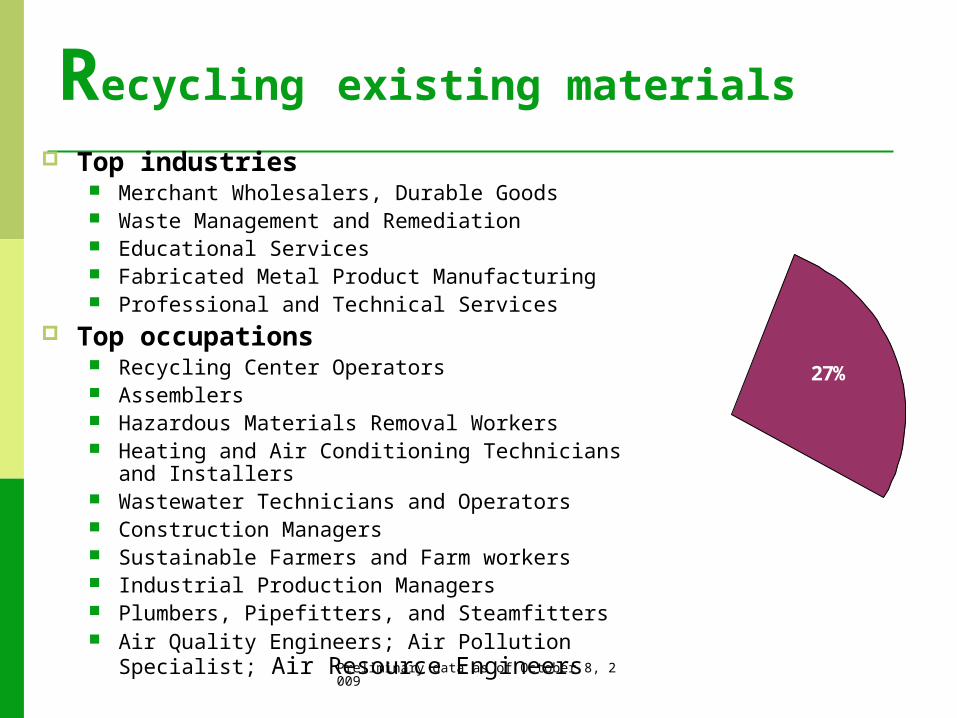
27%
Recycling existing materials
Top industries Merchant Wholesalers, Durable Goods Waste Management and Remediation Educational Services Fabricated Metal Product Manufacturing Professional and Technical Services
Top occupations Recycling Center Operators Assemblers Hazardous Materials Removal Workers Heating and Air Conditioning Technicians and Installers Wastewater Technicians and Operators Construction Managers Sustainable Farmers and Farm workers Industrial Production Managers Plumbers, Pipefitters, and Steamfitters Air Quality Engineers; Air Pollution Specialist; Air
Resource Engineers
Preliminary data as of October 8, 2009
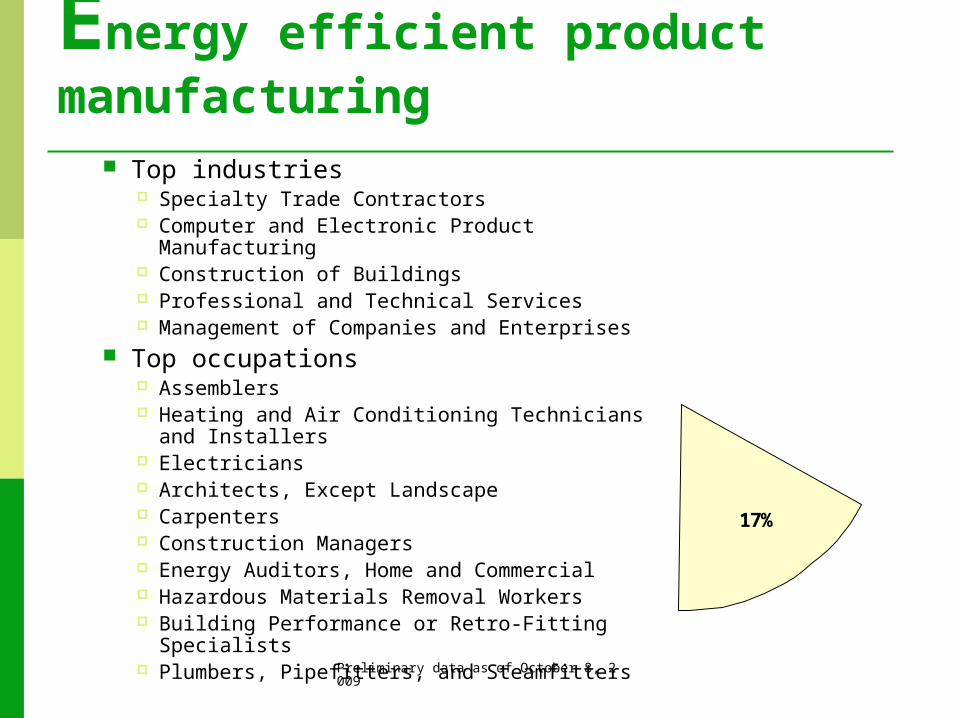
17%
Energy efficient product manufacturing
Top industries Specialty Trade Contractors Computer and Electronic Product Manufacturing Construction of Buildings Professional and Technical Services Management of Companies and Enterprises
Top occupations Assemblers Heating and Air Conditioning Technicians and
Installers Electricians Architects, Except Landscape Carpenters Construction Managers Energy Auditors, Home and Commercial Hazardous Materials Removal Workers Building Performance or Retro-Fitting Specialists Plumbers, Pipefitters, and Steamfitters
Preliminary data as of October 8, 2009
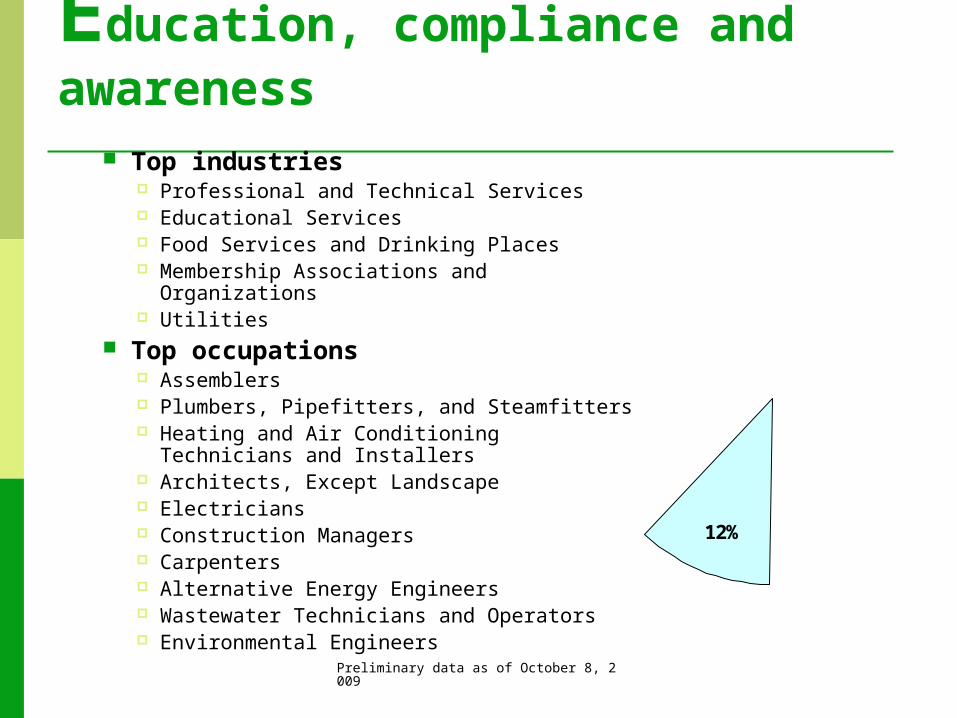
12%
Education, compliance and awareness
Top industries Professional and Technical Services Educational Services Food Services and Drinking Places Membership Associations and Organizations Utilities
Top occupations Assemblers Plumbers, Pipefitters, and Steamfitters Heating and Air Conditioning Technicians and
Installers Architects, Except Landscape Electricians Construction Managers Carpenters Alternative Energy Engineers Wastewater Technicians and Operators Environmental Engineers

Preliminary data as of October 8, 2009
32%
Natural and sustainable product mfg
Top industries Crop Production Food Manufacturing Paper Manufacturing Fabricated Metal Product Manufacturing Nonmetallic Mineral Product Manufacturing
Top occupations Sustainable Farmers and Farmworkers Assemblers Recycling Center Operators Carpenters Biomass Collectors Industrial Production Managers Biological Technicians Construction Managers Soil and Plant Scientists Hazardous Materials Removal Workers
Preliminary data as of October 8, 2009
Preparation of Current Green Workers – OJT!
Training Methods Used by Employers to Prepare Current Workers for Green J obs
3.1%3.3%6.1%8.0%10.7%16.6%18.9%8.6%
77.2%
0.0%10.0%20.0%30.0%40.0%50.0%60.0%70.0%80.0%90.0%
Per
cen
tag
e o
f E
mp
loye
rs
Preliminary data as of October 8, 2009
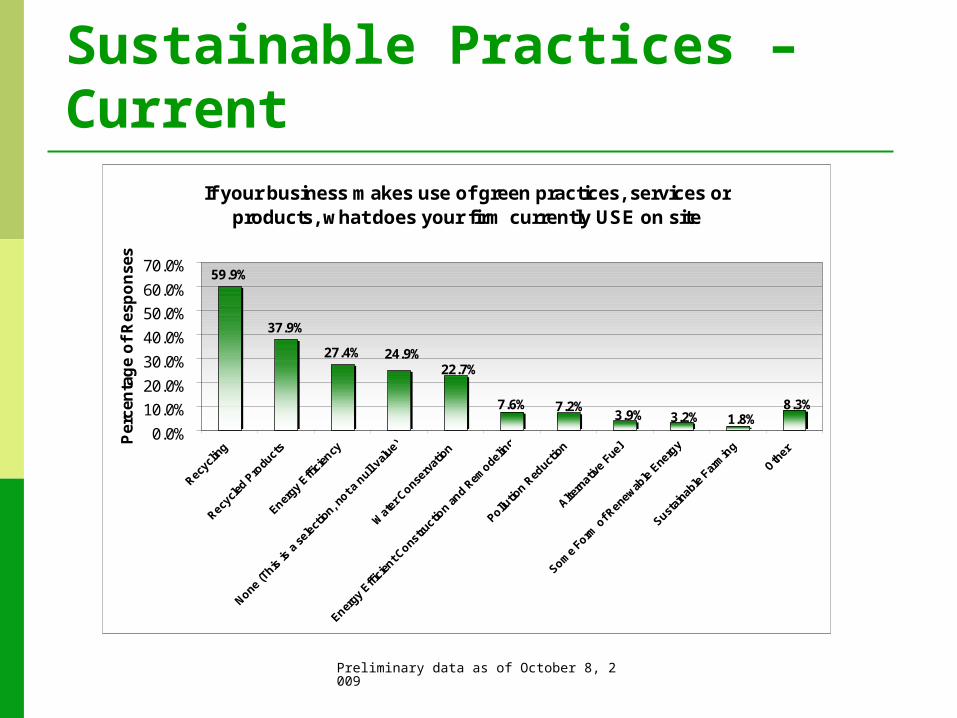
Sustainable Practices – Current
If your business makes use of green practices, services or products, what does your firm currently USE on site
59.9%
37.9%
27.4%22.7%
24.9%
1.8%8.3%
3.2%7.6% 7.2%
3.9%
0.0%
10.0%
20.0%
30.0%
40.0%
50.0%
60.0%
70.0%
Recycl
ing
Recycl
ed P
roduc
ts
Energy E
ffici
ency
None (T
his is
a s
elect
ion, n
ot a n
ull v
alue
)
Wat
er C
onserv
atio
n
Energy E
ffici
ent C
onstru
ctio
n an
d Rem
odelin
g
Pollutio
n Red
uctio
n
Altern
ativ
e Fuel
Some
Form
of R
enewab
le E
nerg
y
Sustai
nabl
e Far
min
g
Other
Per
cen
tag
e o
f R
esp
on
ses
Preliminary data as of October 8, 2009
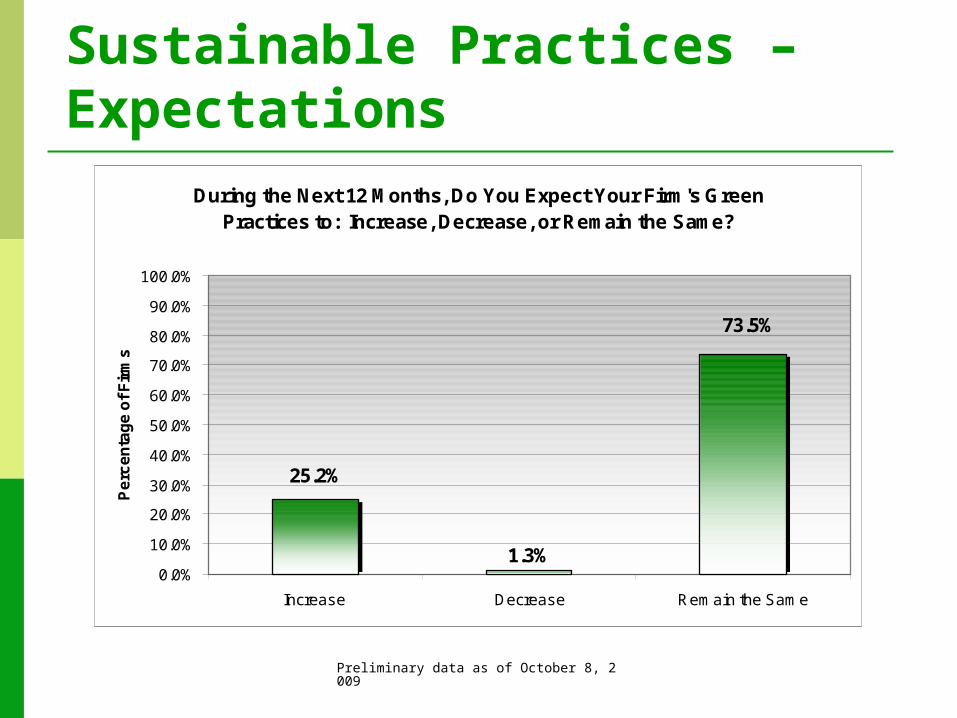
Sustainable Practices – Expectations
During the Next 12 Months, Do You Expect Your Firm's Green Practices to: Increase, Decrease, or Remain the Same?
25.2%
1.3%
73.5%
0.0%
10.0%
20.0%
30.0%
40.0%
50.0%
60.0%
70.0%
80.0%
90.0%
100.0%
Increase Decrease Remain the Same
Pe
rce
nta
ge
of
Fir
ms
Preliminary data as of October 8, 2009
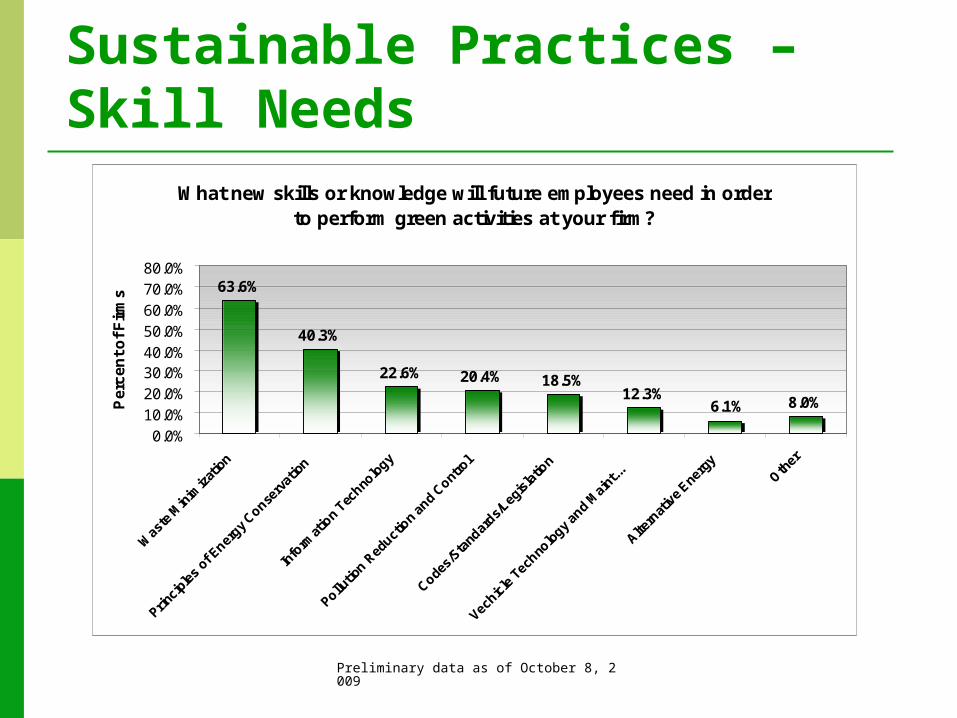
Sustainable Practices – Skill Needs
What new skills or knowledge will future employees need in order to perform green activities at your firm?
63.6%
40.3%
22.6% 20.4% 18.5%12.3%
8.0%6.1%
0.0%10.0%20.0%30.0%40.0%50.0%60.0%70.0%80.0%
Was
te M
inim
izatio
n
Princi
ples
of E
nergy C
onserv
atio
n
Info
rmat
ion
Techno
logy
Pollutio
n Red
uctio
n an
d Cont
rol
Codes/
Stand
ards/L
egis
latio
n
Vechicl
e Te
chno
logy a
nd M
aint
...
Altern
ativ
e Ene
rgy
Other
Pe
rce
nt
of
Fir
ms
Preliminary data as of October 8, 2009
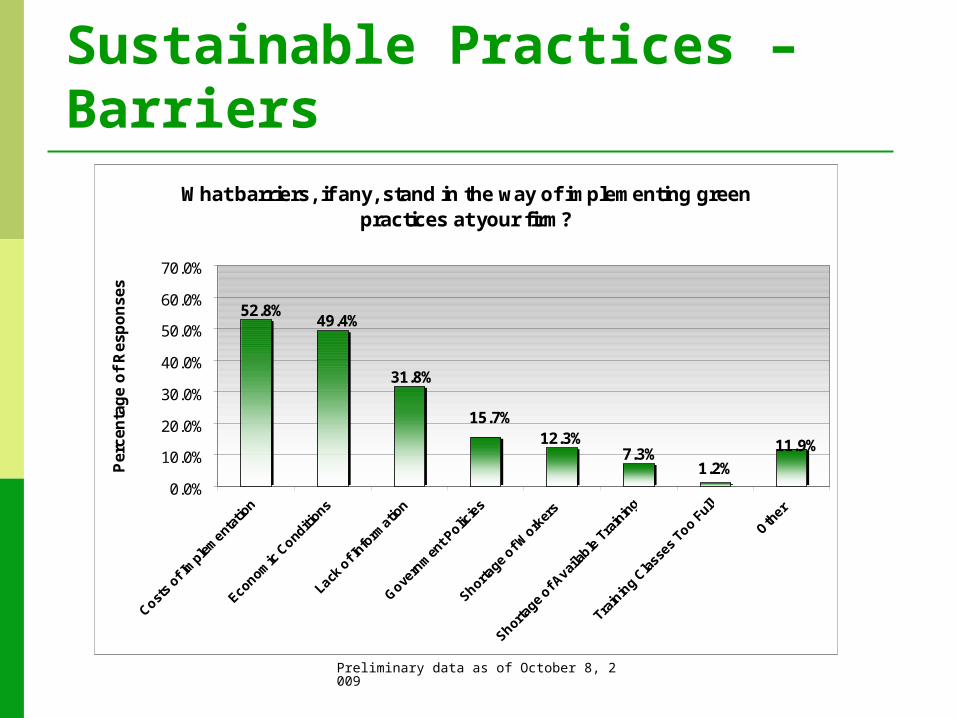
Sustainable Practices – Barriers
What barriers, if any, stand in the way of implementing green practices at your firm?
1.2%
31.8%
15.7%
11.9%
52.8%
12.3%7.3%
49.4%
0.0%
10.0%
20.0%
30.0%
40.0%
50.0%
60.0%
70.0%
Costs
of Im
plem
entatio
n
Economic
Conditi
ons
Lack o
f Info
rmatio
n
Govern
men
t Polic
ies
Shortage o
f Work
ers
Shortage o
f Avai
lable
Tra
inin
g
Train
ing C
lasse
s Too F
ull
Other
Per
cen
tag
e o
f R
esp
on
ses

Preliminary data as of October 8, 2009
Sustainable Practices – Benefits
What do you view as the largest benefit to your business in taking steps to reduce greenhouse gas emissions?
39.8%
11.1%
2.3% 1.1%
15.4%
30.3%
0.0%
10.0%
20.0%
30.0%
40.0%
50.0%
60.0%
None
Enviro
nmen
tally
ben
efic
ial
Cost-s
avin
gs
Compet
itive
adva
ntage/
com
munity
reco
gnition
Advanta
geous
positio
n should
som
e re
gulatio
n...Oth
er
Per
cen
tag
e o
f R
esp
on
ses
Preliminary data as of October 8, 2009
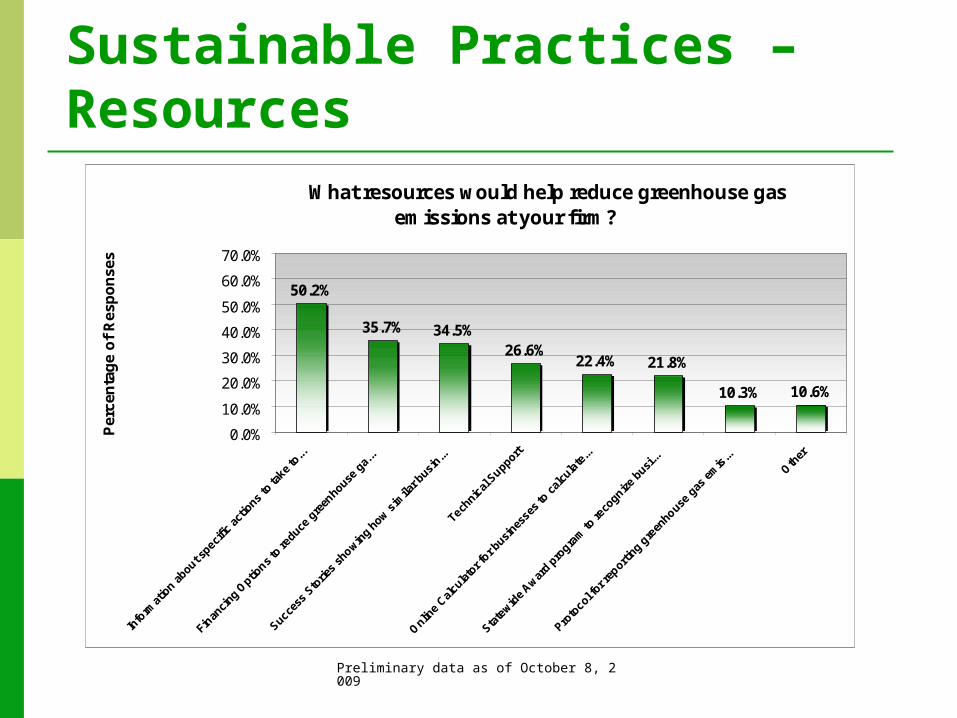
Sustainable Practices – Resources
What resources would help reduce greenhouse gas emissions at your firm?
50.2%
35.7% 34.5%26.6%
22.4% 21.8%
10.3% 10.6%
0.0%
10.0%
20.0%
30.0%
40.0%
50.0%
60.0%
70.0%
Per
cen
tag
e o
f R
esp
on
ses
Preliminary data as of October 8, 2009
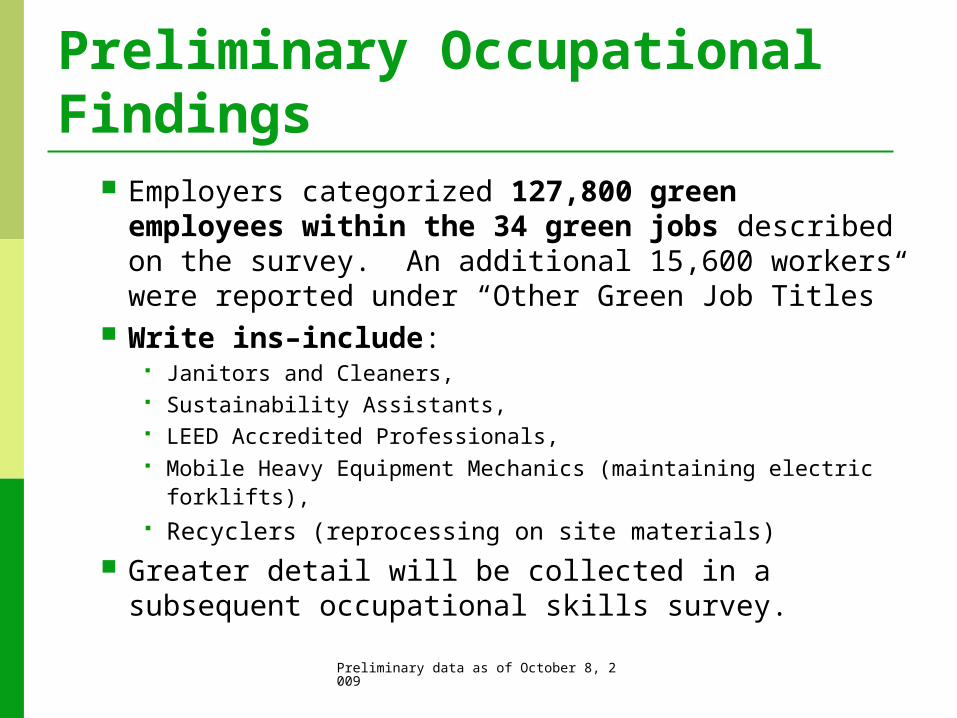
Preliminary Occupational Findings
Employers categorized 127,800 green employees within the 34 green jobs described on the survey. An additional 15,600 workers were reported under “Other Green Job Titles”
Write ins–include: Janitors and Cleaners, Sustainability Assistants, LEED Accredited Professionals, Mobile Heavy Equipment Mechanics (maintaining electric forklifts), Recyclers (reprocessing on site materials)
Greater detail will be collected in a subsequent occupational skills survey.
Preliminary data as of October 8, 2009
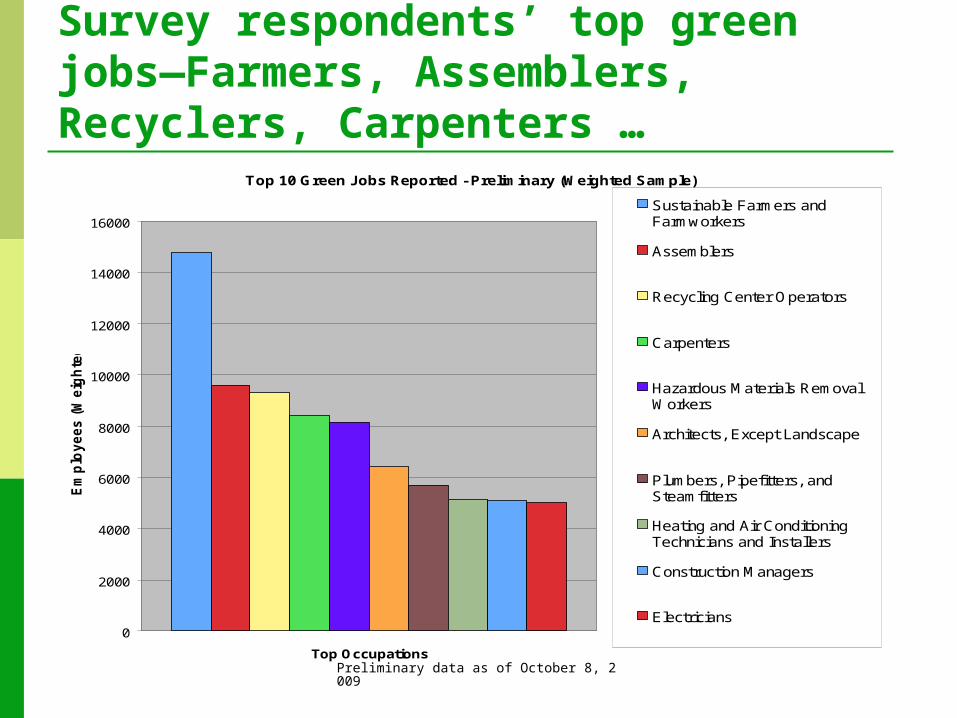
Survey respondents’ top green jobs—Farmers, Assemblers, Recyclers, Carpenters …
Top 10 Green Jobs Reported - Preliminary (Weighted Sample)
0
2000
4000
6000
8000
10000
12000
14000
16000
Top Occupations
Em
plo
ye
es
(W
eig
hte
d)
Sustainable Farmers andFarmworkers
Assemblers
Recycling Center Operators
Carpenters
Hazardous Materials RemovalWorkers
Architects, Except Landscape
Plumbers, Pipefitters, andSteamfitters
Heating and Air ConditioningTechnicians and Installers
Construction Managers
Electricians
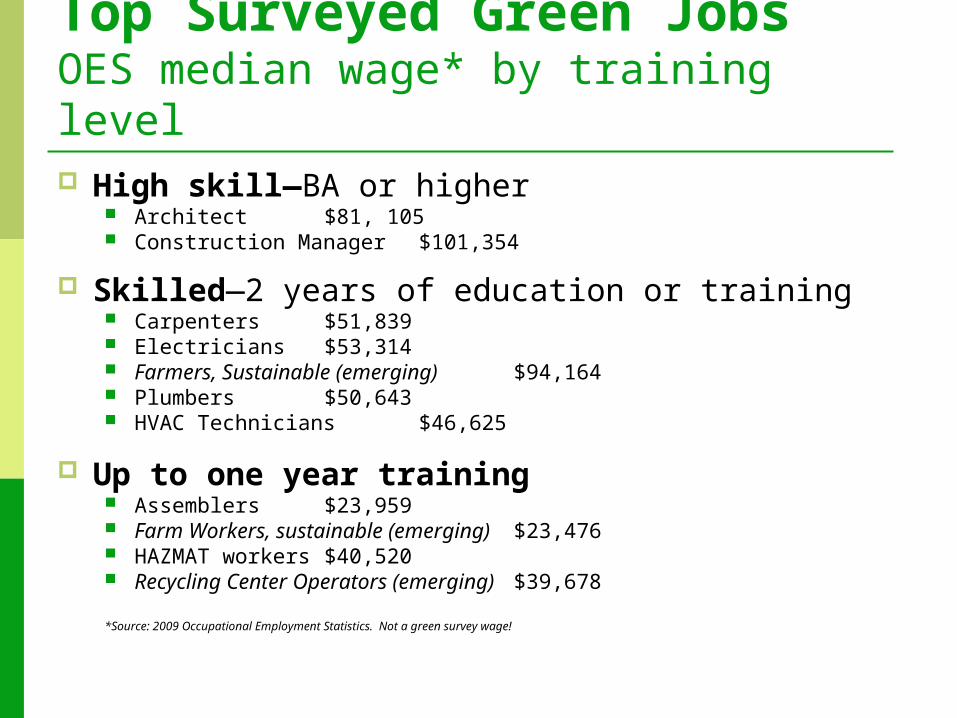
Top Surveyed Green Jobs OES median wage* by training level High skill—BA or higher
Architect $81, 105 Construction Manager $101,354
Skilled—2 years of education or training Carpenters $51,839 Electricians $53,314 Farmers, Sustainable (emerging) $94,164 Plumbers $50,643 HVAC Technicians $46,625
Up to one year training Assemblers $23,959 Farm Workers, sustainable (emerging) $23,476 HAZMAT workers $40,520 Recycling Center Operators (emerging) $39,678
*Source: 2009 Occupational Employment Statistics. Not a green survey wage!
Next Steps Complete data collection Analyze complete data Review findings with key players Prepare summary report, with regional distinctions
as warranted by the data Prepare industry level reports Detailed occupational follow-up surveys and
analysis Report on occupational skills and workforce
development needs