-I tried to condense the powerpoint and also keep most of the information/graphs that we had originally planned on presenting -most of the headline/topic slides that introduce minor sections have been removed just to save space and time -many slides have been condensed so that each slide will show more than one chart or graph (again to save space)
Our Team
Brady Dubin Christine Gepty Diamond Zambrano
Emily Cooper Farrah Al-Mansoor Jake Paston
ADVISORS: Mary Horstmann & Lark Allen
Laken Ethun Sierra Applegate Tanner Nassau
Our project involved researching various outdoor emergency food provider sites and their guests. We collected and analyzed the data we found and will present our findings. The results found by our research team will also assist us in making recommendations for maintaining and establishing effective outdoor emergency food provider sites in the future.
Goals of our Project
1. Identify the characteristics of the population
2. Understand their needs
3. Understand why they seek these meals
Benjamin Franklin Parkway
Presenter
Presentation Notes
-these are the goals how I see them, but they can definitely be edited or re-worded -when we talk about the goals in the actual presentation; -explain what exactly we mean by emergency food provider site -homeless people are a main population, BUT there are many people who use these sites who are not homeless (important to note) -explain how we introduced ourselves as part of the Food Access Collaborative to make connection to future pilot program
City Stats
City Poverty
Rate
State Average
National Average
1.5 mill • Total population of
Philadelphia.
400,000
• People accounted for as being food insecure.
130,000
• People under 18 accounted for as being food insecure.
Presenter
Presentation Notes
-keep all the general Philadelphia statistics together -elaborate on what it actually means to be “food insecure” (lack access to enough food for a healthy, active life)
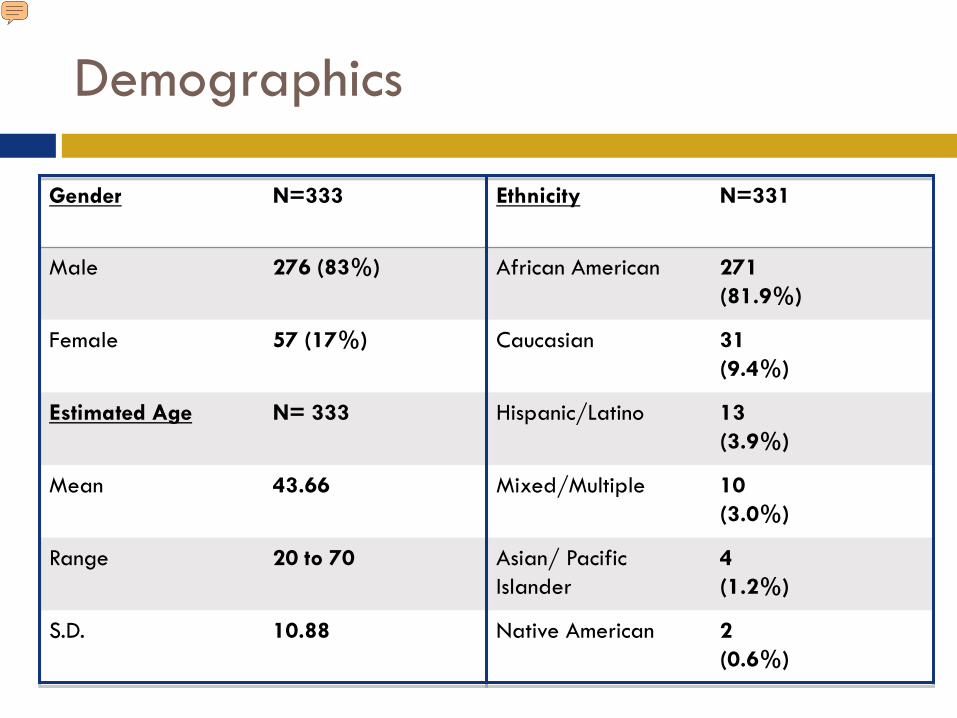
Demographics
Gender N=333 Ethnicity N=331
Male 276 (83%) African American 271 (81.9%)
Female 57 (17%) Caucasian 31 (9.4%)
Estimated Age N= 333 Hispanic/Latino 13 (3.9%)
Mean 43.66 Mixed/Multiple
10 (3.0%)
Range
20 to 70
Asian/ Pacific Islander
4 (1.2%)
S.D. 10.88 Native American 2 (0.6%)
Presenter
Presentation Notes
-proportionate or disproportionate to our findings??
Where We Surveyed
Home Neighborhood
Transportation to Meal Site
Distance Traveled
Living Situation (All Participants)
Living Situation (Outdoor Participants)
Living Situation (Indoor Participants)
Only 26% of participants surveyed have a place to prepare food.
Living Situation of Participants Who Have a Place to Prepare Food
Living Situation of Participants Who Have a Place to Prepare Food
Of those 26%...
Presenter
Presentation Notes
-important to note that most of these people do not have places to prepare food because they are not living in any sort of shelter (and most who are homeless do not prefer shelters)
Neediest Time of Month
Presenter
Presentation Notes
*removed first graph of neediest time of the month graph with ppts receiving/not receiving public assistance and all participants -in presentation, mention that about 60% of all 3 groups said all times of the month about equal for neediest time and the about 25-30% said the end of the month was the neediest time of the month and then go over this graph? (very similar except this one excludes “all equal”)
Prevalence of Medical Conditions
Presenter
Presentation Notes
*instead of having an entire slide for the graph of people w/ medical conditions vs. w/out medical conditions, just say in presentation that about 53% of our participants have medical conditions -then, explain those medical conditions of the 53%...
Types of Insurance
Presenter
Presentation Notes
-include specific forms of Medicare (many participants answered Keystone, etc.)
Sources of Medical Care
Sources of Income
Presenter
Presentation Notes
-need to explain the purple.....maybe rearrange the graph?
Recommendations
1. Increase coordination and collaboration 2. Develop a community forum 3. Improve food safety and nutrition