understanding the capacitance of pedot:pssunderstanding the capacitance of pedot:pss anton v....
TRANSCRIPT

General rights Copyright and moral rights for the publications made accessible in the public portal are retained by the authors and/or other copyright owners and it is a condition of accessing publications that users recognise and abide by the legal requirements associated with these rights.
Users may download and print one copy of any publication from the public portal for the purpose of private study or research.
You may not further distribute the material or use it for any profit-making activity or commercial gain
You may freely distribute the URL identifying the publication in the public portal If you believe that this document breaches copyright please contact us providing details, and we will remove access to the work immediately and investigate your claim.
Downloaded from orbit.dtu.dk on: May 21, 2020
Understanding the Capacitance of PEDOT:PSS
Volkov, Anton V. ; Wijeratne, Kosala ; Mitraka, Evangelia ; Ail, Ujwala; Zhao, Dan ; Tybrandt, Klas ;Andreasen, Jens Wenzel; Berggren, Magnus; Crispin, Xavier; Zozoulenko, Igor V.
Published in:Advanced Functional Materials
Link to article, DOI:10.1002/adfm.201700329
Publication date:2017
Document VersionPeer reviewed version
Link back to DTU Orbit
Citation (APA):Volkov, A. V., Wijeratne, K., Mitraka, E., Ail, U., Zhao, D., Tybrandt, K., Andreasen, J. W., Berggren, M., Crispin,X., & Zozoulenko, I. V. (2017). Understanding the Capacitance of PEDOT:PSS. Advanced Functional Materials,27(28), [1700329]. https://doi.org/10.1002/adfm.201700329

1
DOI: 10.1002/ (Full Paper, No. adfm.201700329) Article type: Full Paper Understanding the capacitance of PEDOT:PSS Anton V. Volkov, Kosala Wijeratne, Evangelia Mitraka, Ujwala Ail, Dan Zhao, Klas Tybrandt, Jens Wenzel Andreasen, Magnus Berggren, Xavier Crispin and Igor V. Zozoulenko*
Anton V. Volkov, Kosala Wijeratne, Evangelia Mitraka, Dr. Ujwala Ail, Dr. Dan Zhao, Dr. Klas Tybrandt, Prof. Magnus Berggren, Prof. Xavier Crispin and Prof. Igor V. Zozoulenko
Laboratory of Organic Electronics, Department of Science and Technology, Linköping University, 601 74 Norrköping, Sweden e-mail: [email protected]
Prof. Jens Wenzel Andreasen
Department of Energy Conversion and Storage, Technical University of Denmark DK-4000 Roskilde, Denmark Prof. Magnus Berggren Stellenbosch Institute for Advanced Study (STIAS), Wallenberg Research Centre at Stellenbosch University, Stellenbosch, South Africa Keywords: PEDOT:PSS, supercapacitance, cyclic voltammetry, double layers, Nernst-Planck-Poisson modelling
Abstracts PEDOT:PSS (poly(3,4-ethylenedioxythiophene):polystyrene sulfonate) is the most studied and explored mixed ion-electron conducting polymer system. PEDOT:PSS is commonly included as an electroactive conductor in various organic devices, e.g. supercapacitors, displays, transistors and energy-converters. In spite of its long-term use as a material for storage and transport of charges, the fundamentals of its bulk capacitance remains poorly understood. Generally, charge storage in supercapacitors is due to formation of electrical double layers or redox reactions, and it is widely accepted that PEDOT:PSS belongs to the latter category. Here, we report experimental evidence and theoretical modelling that significantly depart from this commonly accepted picture. By applying a two-phase, two-dimensional modeling approach we demonstrate that the major contribution to the capacitance of the two-phase PEDOT:PSS originates from electrical double layers formed along the interfaces between nanoscaled PEDOT-rich and PSS-rich interconnected grains that comprises two phases of the bulk of PEDOT:PSS. This new insight paves a way for designing materials and devices, based on mixed ion-electron conductors, with improved performance. 1. Introduction PEDOT:PSS (poly(3,4-ethylenedioxythiophene):polystyrene sulfonate)[1] represents a workhorse of organic electronics and is in fact one of the most studied and explored materials
2
today.[2] In part, this is due to its processability and stability in air and water, scalable green synthesis protocol, and high electrical conductivity along with optical transparency. PEDOT:PSS is extensively utilized as the conductor and electrode in various solid-state devices, such as in organic light emitting diodes,[3] field effect transistors,[4] and photovoltaics.[5] PEDOT:PSS is a polymeric mixed ion-electron conductor [6] with a relatively high ionic conductivity and specific capacitance. The density of holes in PEDOT:PSS can be reversibly modulated over a wide range by the compensation with ions provided from an electrolyte. This makes PEDOT:PSS ideal as the electrode in ion-based energy storage devices, such as supercapacitors,[6-‐7] and as the channel in electrochemical transistors[8] and sensors.[9] The swift and reversible modulation of the hole density is also accompanied with a switch in color between dark blue and transparent. PEDOT:PSS has therefore served as the pixel electrode in electrochromic displays.[2b, 10] Moreover, PEDOT:PSS is a first choice as the signal translating device in various bioelectronics devices operating in physiological media, such as in biosensors, electrochemical transistors[8e, 11] and electrodes[8e, 12] interfacing with neuronal systems, and as the electrodes in organic electronic ion pumps.[13]. In many of the abovementioned devices the operation principle relies on the capacitance of PEDOT:PSS, see Figure 1.
Generally, charge storage in supercapacitors is due to electric double-layers formed along electrode/electrolyte interfaces or is related to electrochemical processes (commonly termed pseudocapacitance).[14] The latter involves redox reactions including charge transfer across the electrolyte-electrode interface. Mechanisms of supercapacitive behavior and electron-ion coupling in conductive polymers are experimentally studied using cyclic voltammetry. A typical experimental setup is shown in Figure 1 a. In the forward voltage scan, positive cations (M+) escapes the PEDOT:PSS layer and are replaced by positive holes that are injected into the PEDOT from the electrode. This process is reversed in the backward scan and the hole density in the PEDOT is reduced. A typical voltammogram exhibits current peaks followed by the current plateaus, see Figure 1 b. The current peaks can be reproduced by the Butler-Volmer electrochemical model describing a faradaic current due to redox reactions, whereas the current plateaus can be described by a phenomenological term giving rise to the capacitive current as introduced in a seminal paper of Feldberg.[15] As a result, it is commonly assumed that the supercapacitive voltammograms of conducting polymers is due to pseudocapacitive processes involving faradaic reactions.[16] Note however that the origin of the phenomenological capacitive current has never been properly explained from a theoretical point of view.
Besides cyclic voltammetry, the capacitive behaviour and the ionic-electronic transport interplay in conductive polymers are also studied using other techniques. In “moving front” experiments the motion of the boundary between doped and undoped regions is monitored by dynamic color changes.[17] Conductance and impedance spectroscopy studies have been applied to three-terminal electrochemical transistors based on PEDOT:PSS whose resistance is controlled via a gate by an ionic inflow from the electrolyte.[8a, 8b, 18] Even though these electrode and device systems, and their underlying physics, are identical to those studied by the cyclic voltammetry, the interpretations made from the analysis of the results are strikingly different. In particular, the theoretical treatment of the experiments do not typically assume any redox reactions and is solely based on the coupling between electronic and ionic motion as described by the Nernst-Planck-Poisson equations (drift-diffusion equations).[18a, 19] Hence, even after decades of polymer research the most fundamental questions concerning the nature of capacitive behaviour and the electron-ion coupling in these materials still remain unsolved and are highly controversial.

3
In the present work we report the results of experimental studies and theoretical
modelling of polymeric mixed electron-ion conductors that represent a significant departure from a prevailing view on conducting polymers as faradaic redox supercapacitors. We demonstrate that the cyclic voltammetry of conducting polymers, in particular for PEDOT:PSS, can be understood within a Nernst-Planck-Poisson formalism in terms of the coupled ion-electron diffusion and migration without invoking the assumption of any redox reactions. We argue that it is important to treat PEDOT:PSS as a two phase system consisting of PEDOT-rich and PSS-rich grains, and by performing two-dimensional modeling we show that its capacitance originates from charging of double layers formed on boundaries between the two phases within the bulk. The results of our study are not only of the fundamental importance, but they are essential for designing of electron-ion mixed conductors and devices that rely on the capacitive charging.
2. Experimental results and a morphology model.
Cyclic voltammograms (CV) were recorded in the potential range of -1.0 V to +0.5 V at different scan rates (10, 20, 100 and 200 mV/s) in 0.1 M KCl for PEDOT:PSS/Au electrode in N2 atmosphere (Figure 1 b). The CV of PEDOT:PSS (PH1000) exhibits the characteristic rectangular shape in the range from -0.5V to 0.5V, indicating its capacitive nature.[20] The capacitive nature is confirmed by the linear dependence of the current with the scan rate (Figure 1 c). The volumetric specific capacitance C* of PEDOT extracted from the voltamogramms is 34 F/cm3. Typical values of C* , previously reported, range from C* = 39 F/cm3 [8b] to several hundreds F/cm3 .[21] Furthermore, we observe that in the forward potential scan, there is a single anodic peak (at V ≈ -0.7 V) attributed to the injection of holes into the undoped polymer and expulsion of cations. Accordingly, on the reverse scan the voltammogram shows one cathodic peak (V ≈ -0.7 V) corresponding to electron injection and cation incorporation, sequentially (see next Section for discussion). Finally, the negative current contribution at approximately – 0.9 V is due to the reduction of residual dioxygen.
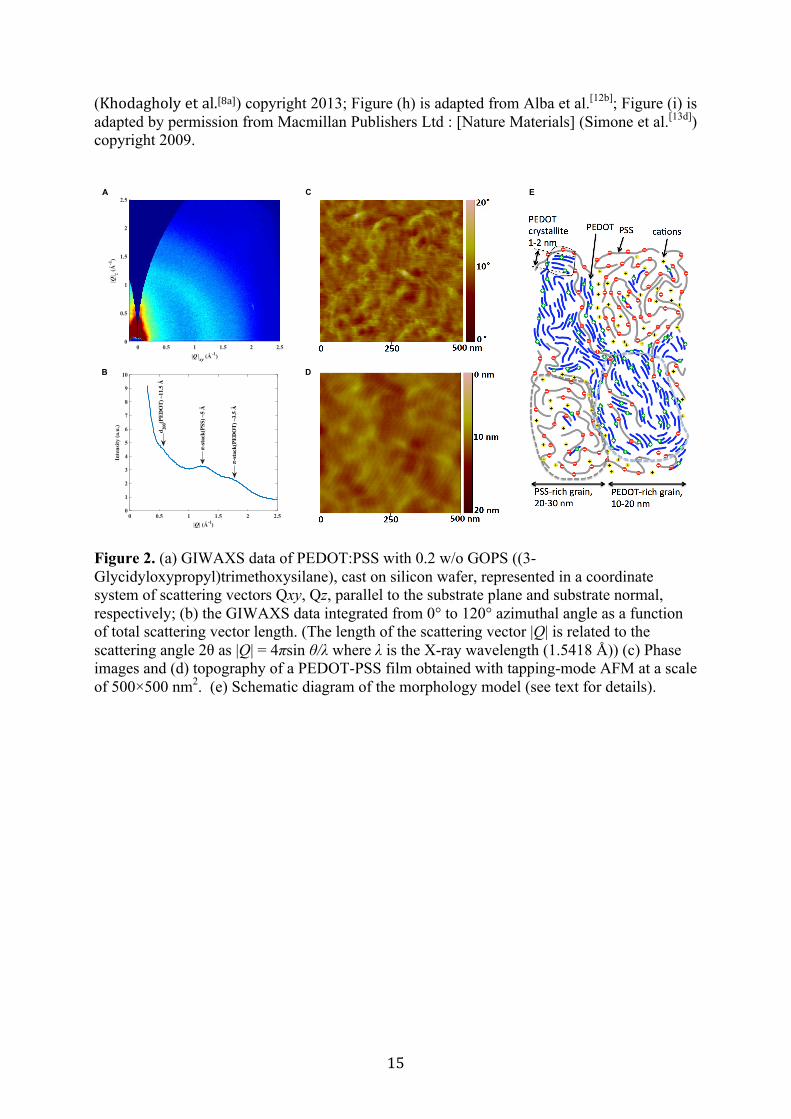
The morphology of the conducting polymers can be investigated at different scales. Grazing Incidence Wide-Angle X-ray Scattering (GIWAXS) provides information at the Ångström scale. The GIWAXS pattern presented in Figure 2 (a) indicates a mostly amorphous film, but with some weak and broad, isotropic scattering. These features are identified in the data integrated from 0° to 120° azimuthal angle as a function of total scattering vector length, see Figure 2 (b), where we according to observations reported in [22] ascribe the peak at ~ 0.55 Å-1 to the second order lamellar stack of PEDOT (200), and the two peaks at ~1.26 Å-1 and ~ 1.8 Å-1 to π-π stacking in small ordered domains of PSS and PEDOT, respectively. A characteristic size of the PEDOT crystallite domains can be estimated from the broadening of the diffraction peaks. A Scherrer analysis suggests that with an estimated peak width of ~ 0.3 Å-1 each crystalline domain is composed of up to 5 chains, which is consistent with previous studies [23].
The morphology of the PEDOT:PSS film on the scale above 1 nm is characterized with tapping-mode AFM. Figure 2 c, d shows the phase and topography images of a 500 × 500 nm2 area of the PEDOT-PSS film. 10-20 nm wide grains composed of small elongated structures are observed in the phase image. The relatively strong contrast in the phase image (full scale equals 20°) is associated with a different chemical composition. For polymer systems, with phase images captured under moderate tapping conditions, bright areas (high phase signal) in the phase image can be assigned to a relatively hard phase[24] attributed

4
to the PEDOT:PSS rich phase. While the lower phase signal (dark domains) is referred to the excess of PSS since PEDOT:PSS (PH1000) has a PSS/PEDOT ratio about 2.3/1.[25] Surface areas rich in this hygroscopic polyelectrolyte are expected to swell and soften due to ambient humidity, this also explained why the PSS region is slightly higher in the corresponding topography image[26]. Note that a similar granular organization of PEDOT:PSS has been reported in previous studies[8b, 23a, 26-27] but rarely with this clarity in the AFM image. Interestingly, the dimension of the granules observed in the film corresponds to the smallest particle size in the PEDOT:PSS water emulsion measured by dynamic light scattering.[28] The water emulsion is stable because the negatively charged PSS in excess surround the PEDOT:PSS particles. Thus upon drying, the film is composed of plenty of PEDOT:PSS rich particles connected in a PSS rich matrix.
Together, we conclude that PEDOT:PSS is composed of a continuous amorphous PSS phase hosting many nanometer-sized PEDOT crystallites and expected dispersed individual PEDOT chains in the PSS matrix. We propose a PEDOT:PSS morphology model sketched in Figure 1 e. PEDOT:PSS represents a two phase-system consisting of PEDOT-rich and PSS-rich grains of the dimensions of about 10-30 nm. PEDOT-rich grains support primarily hole conductivity, whereas PSS-rich grains support the ion conductivity. The PEDOT-rich grains consist of PEDOT crystallite domains of 1-2 nm (composed of up to ~5 chains) embedded in the amorphous PSS matrix. Because the system exhibits high conductivity in the oxidized state, the PEDOT crystallites and chains form a percolative network (presumably via π- π stacking) providing transport paths for the holes throughout the whole structure.
3. Theoretical modeling and discussion In order to describe the experimental voltammograms we consider two models for the system at hand. The first one is a standard one-dimensional model treating a polymeric region as a one-component system allowing for the diffusion of both holes and ions.[17b, 19c, 19d] The second model goes beyond the standard approach and treats PEDOT:PSS as a two-phase two-dimensional system according to the morphology model developed in the previous section. In both cases the ion and hole injection and transport leading to doping/dedoping of the system are described by the modified Nernst-Plank-Poisson formalism as outlined below. 3.1 Nernst-Plank-Poisson approach to ion and hole transport in conducting polymers In our modeling we use the modified Nernst-Plank-Poisson approach treating the electron and ion transport on the equal footing. (Note that in semiconductor device literature the Nernst-Plank equations are called drift-diffusion equations). Our theoretical treatment do not include electrochemical reactions because for the system at hand we do not have the evidence of their occurrence in the given voltage interval (except a peak at V=-0.9V).
We assume that the flux of holes 𝑗!→
obeys the modified Nernst Planck equation as derived from the hopping model [29]
𝑗!→= −𝐷!![∇
→𝑐! + 𝑓𝑐!(1−
!!!!° )∇→𝑉], (1)
where 𝑐! is the hole concentration, 𝑐!° is the concentration of accessible sites for holes, 𝐷!! = 10!! m!/s is the diffusion coefficient of holes in the polymer, 𝑓 ≡ F/RT (F is the

5
Faraday constant, R is the molar constant and T=300 K is the temperature) and V is the electric potential. The first term in Equation (2) describes a hole diffusion and the second term is related to migration in an electric field. The factor (1− !!
!!° ) in the second term assures that
the concentration of holes could not be larger than the concentration of the accessible states for hopping 𝑐!° . Typically, for PEDOT:PPS, 𝑐!° corresponds to the relative concentration of 33% (i.e. each third the monomer in the PEDOT chain can be charged).
The modified Nernst Planck equation describing ion fluxes reads [30]
𝑗±→= −𝐷±(𝒓) ∇
→𝑐± ± 𝑓𝑐±∇
→𝑉 + !±∇
→(!!!!!)
!!"#!(!!!!!), (2)
where 𝑗±
→ is the flux of cations (+) or anions (-), 𝑐! and 𝑐! are the concentrations of cations
and anions respectively, 𝐷±(𝒓) is the diffusion coefficient of ions. 𝑐!"# corresponds to the maximum concentration of ions in the system. In our calculations we thus set cmax = 6M, which is typical value for concentrated electrolyte. The last term in Equation (2) is a correction due to a finite size of ions. Typical values of the diffusion coefficient in the electrolyte 𝐷± = 10!!
!!
! and in the PSS region 𝐷± = 10!!"
!!
! were assumed.
The flux densities are obtained by solving the continuity equation !!!!!+ ∇
→𝑗!→= 0, (3)
together with the Poisson's equation
−𝜖𝜖! △ 𝑉 = 𝐹(𝑐! − 𝑐! + 𝑐! − 𝑐!"#$%(𝐫)), (4)
where 𝜖! is the permittivity of vacuum, 𝜖 = 81 is the dielectric permittivity of the system and 𝑐!"#$%(𝐫) is the concentration of the fixed charges. Concentration of fixed charges in the electrolyte domain is zero (𝑐!"#$%(𝐫) = 0 M). The different distribution of the fixed charges in polymer domain is used for one- and two- phase models as discussed in following sections.
The boundary conditions are as follows. The continuity boundary condition for the potential is used at all internal interfaces. At the electrode interface the potential 𝑉! is applied, the hole concentration is chosen to be 𝑐! = 0.99𝑐!° , and the ion fluxes vanish, 𝑛→⋅ 𝑗±→= 0 (𝑛
→ is the normal to the interface). Note that electrodes are not explicitly included in
our model because we assume the Ohmic contact between the electrode and the PEDOT:PSS layer. The latter assumption is motivated by the following experimental observations: (i) the electrical conductivity of PEDOT is known to decrease significantly by 3-4 orders of magnitude at cathodic potential. [31] However, its conductivity is still in the order of 10-3-10-4 S/cm beyond -0.7V, i.e. far beyond electrical insulator. Note that this is one of the reasons PEDOT displays highly reversible electrochromism. (ii) Spectroelectrochemistry reveals the presence of a remaining IR optical absorption background even at cathodic potential indicating a vanishingly small gap.[32] Those observations strongly suggest that PEDOT:PSS can still be considered as a Fermi glass of low density of state at the Fermi level in the potential range [-0.7V; -1V]. As a result, there is likely no large energy barrier between the metal electrode and the PEDOT:PSS film even at cathodic potential.
At the interface between the polymer and electrolyte the hole flux vanishes, 𝑛→⋅ 𝑗!→= 0,
since the holes cannot enter the electrolyte. This condition is supplemented by the continuity

6
condition for ion concentrations. The electrolyte reservoirs are introduced by a standard concept of the Nernst diffusion layer. At the distance 𝑙! = 1 mm from polymer-electrolyte boundary we assume that the ion concentration reaches the bulk concentration of electrolyte 𝑐! = 0.1 M and the potential is constant and equal to the potential the of bulk electrolyte 𝑉 = 0.
For the case of the two-dimensional model we also need to define boundary conditions at interfaces between hole conductive region (PEDOT-rich region), ion conductive region (PSS-rich regions) and electrolyte. At the interfaces between the hole and ion conductive regions the hole flux vanishes, 𝑛
→⋅ 𝑗!→= 0, whereas the ion flux vanishes at the interface
between the hole conductive regions and electrolyte, 𝑛→⋅ 𝑗±→= 0. The continuity boundary
condition for ion concentrations holds at the interface between ion conductive regions and electrolyte. Finally, the resulting nonlinear system of partial differential equations is solved with the finite element method using COMSOL Multiphysics software.
3.2. One-dimensional model.
The studied electrode system consists of a conducting PEDOT:PSS polymer film with thickness 𝑙! = 100 nm sandwiched between an electrolyte and a metal electrode, see Figure 3 a. We assume that fixed negative charges (counterions) are distributed homogeneously and both ions and holes can move in the polymer film.[17b, 19c, 19d] The concentration of the fixed charges was chosen to be equal to the concentration of accessible states for holes 𝑐!"#$% 𝐫 =𝑐!° = 1 M. The initial values for the concentrations and the potential inside the device were obtained by applying a reduction potential for 20 s to an oxidized film.
The calculated cyclic voltammograms are shown in Figure 3 b. The current density (which we will call the direct current density) is obtained by integration over the polymer film, 𝑗!"#$%& = 𝐹∫ !!!
!!𝑑𝑥. It reveals the oxidations and reduction peaks but, in contrast to the
experimental results (Figure 1b), it does not show a box shape behavior (i.e. plateaus) in the oxidized state for positive voltages. It is important to stress that a conventional electrochemical Butler-Volmer model describing a faradaic current due to redox reactions displays the same behavior.[16a, 16b] In order to reproduce experimental voltammograms, an additional phenomenological term describing the capacitive current was introduced in a seminal paper of Feldberg.[15] It is postulated to be of the form 𝑗!"#"!$%$&' = 𝐹∫ !!!
!!𝑑𝑥 , where
the concentration of the intrinsic capacitive charge in the polymer film is related to the concentration of holes 𝑐! = 𝑎∗ 𝑉! 𝑡 − 𝑉!"# 𝑐! , with 𝑉!"! ≈ −0.3 V being the potential of the zero charge and 𝑎∗ = 5 V!! . Thus, the total current is assumed to be a sum of the direct current and the capacitive current,
𝑗!"!#$ = 𝑗!"#$%& + 𝑗!"#"!$%$&'. (5)
The cyclic voltammogram calculated according to Equation (5) qualitatively reproduces the experimental one, exhibiting both the oxidation and reduction peaks and the current plateaus, see Figure 3 b.
Let us now analyze evolution of the concentration and potential profiles as the system goes from the reduced to the oxidized state. When the applied potential 𝑉! = −0.5 V the film is fully reduced 𝑐! ≈ 0 and therefore the direct and capacitive currents that pass through the film are negligible. In order to screen negative fixed charges and thus to keep an
7
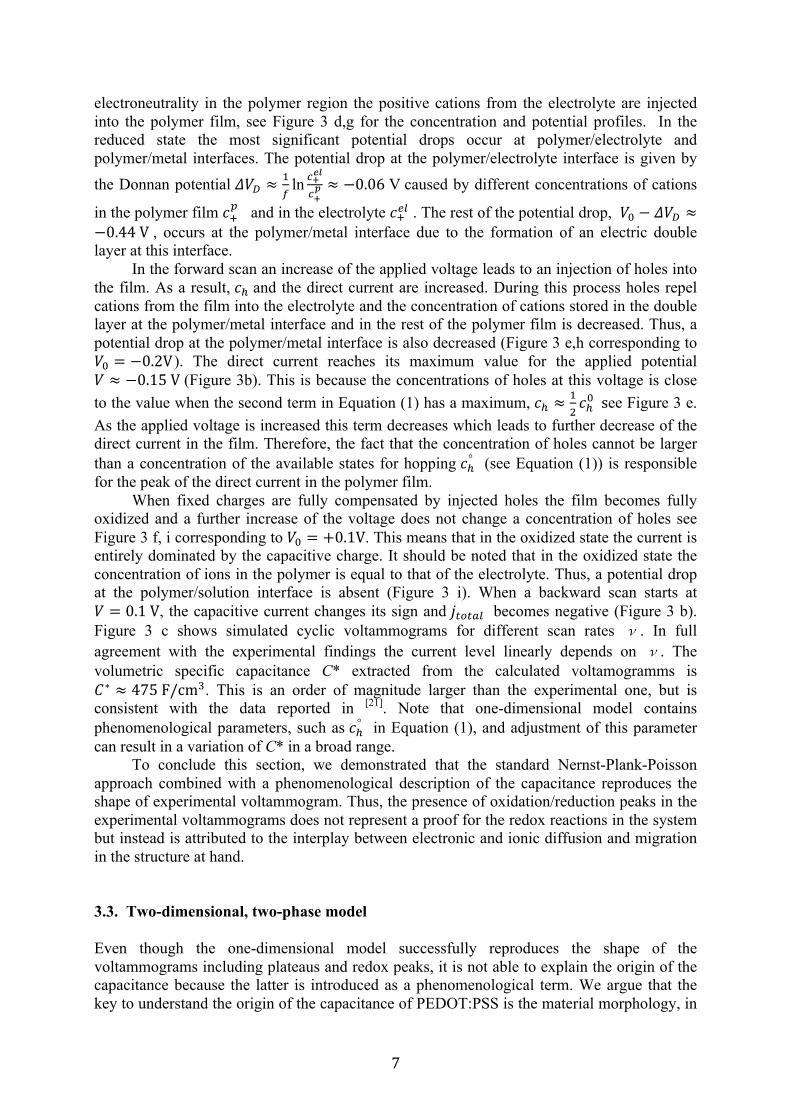
electroneutrality in the polymer region the positive cations from the electrolyte are injected into the polymer film, see Figure 3 d,g for the concentration and potential profiles. In the reduced state the most significant potential drops occur at polymer/electrolyte and polymer/metal interfaces. The potential drop at the polymer/electrolyte interface is given by the Donnan potential 𝛥𝑉! ≈
!!ln !!
!"
!!! ≈ −0.06 V caused by different concentrations of cations
in the polymer film 𝑐!! and in the electrolyte 𝑐!!" . The rest of the potential drop, 𝑉! − 𝛥𝑉! ≈
−0.44 V , occurs at the polymer/metal interface due to the formation of an electric double layer at this interface.
In the forward scan an increase of the applied voltage leads to an injection of holes into the film. As a result, 𝑐! and the direct current are increased. During this process holes repel cations from the film into the electrolyte and the concentration of cations stored in the double layer at the polymer/metal interface and in the rest of the polymer film is decreased. Thus, a potential drop at the polymer/metal interface is also decreased (Figure 3 e,h corresponding to 𝑉! = −0.2V). The direct current reaches its maximum value for the applied potential 𝑉 ≈ −0.15 V (Figure 3b). This is because the concentrations of holes at this voltage is close to the value when the second term in Equation (1) has a maximum, 𝑐! ≈
!!𝑐!! see Figure 3 e.
As the applied voltage is increased this term decreases which leads to further decrease of the direct current in the film. Therefore, the fact that the concentration of holes cannot be larger than a concentration of the available states for hopping 𝑐!° (see Equation (1)) is responsible for the peak of the direct current in the polymer film.
When fixed charges are fully compensated by injected holes the film becomes fully oxidized and a further increase of the voltage does not change a concentration of holes see Figure 3 f, i corresponding to 𝑉! = +0.1V. This means that in the oxidized state the current is entirely dominated by the capacitive charge. It should be noted that in the oxidized state the concentration of ions in the polymer is equal to that of the electrolyte. Thus, a potential drop at the polymer/solution interface is absent (Figure 3 i). When a backward scan starts at 𝑉 = 0.1 V, the capacitive current changes its sign and 𝑗!"!#$ becomes negative (Figure 3 b). Figure 3 c shows simulated cyclic voltammograms for different scan rates ν. In full agreement with the experimental findings the current level linearly depends on ν. The volumetric specific capacitance C* extracted from the calculated voltamogramms is 𝐶∗ ≈ 475 F/cm!. This is an order of magnitude larger than the experimental one, but is consistent with the data reported in [21]. Note that one-dimensional model contains phenomenological parameters, such as 𝑐!° in Equation (1), and adjustment of this parameter can result in a variation of C* in a broad range.
To conclude this section, we demonstrated that the standard Nernst-Plank-Poisson approach combined with a phenomenological description of the capacitance reproduces the shape of experimental voltammogram. Thus, the presence of oxidation/reduction peaks in the experimental voltammograms does not represent a proof for the redox reactions in the system but instead is attributed to the interplay between electronic and ionic diffusion and migration in the structure at hand.
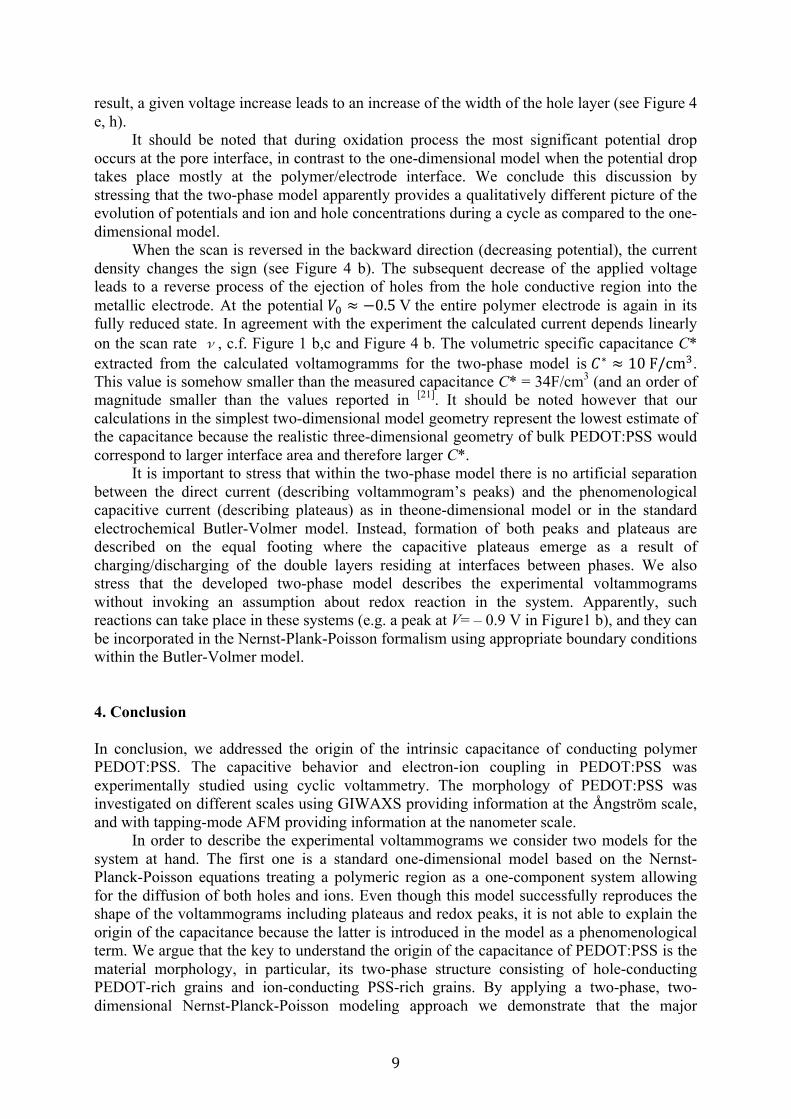
3.3. Two-dimensional, two-phase model
Even though the one-dimensional model successfully reproduces the shape of the voltammograms including plateaus and redox peaks, it is not able to explain the origin of the capacitance because the latter is introduced as a phenomenological term. We argue that the key to understand the origin of the capacitance of PEDOT:PSS is the material morphology, in

8
particular, its two-phase structure consisting of hole-conducting PEDOT-rich grains and ion-conducting PSS-rich grains. Such the morphology invites to another mechanism for charge storage with electric double layers formed at the interface between the electronically conducting PEDOT rich phase and the ionically PSS rich phase. This mechanism resembles the one present in supercapacitors based on porous electrodes storing the charge by the formation of electric double layer (a non-faradaic phenomenon).[33] In order to demonstrate this we construct and simulate the simplest model of PEDOT:PSS which is consistent with the morphology model outlined in the experimental section.
Figure 4 a shows schematics of our two-phase two-dimensional model representing a nanopore geometry. An internal region with a width 𝑤!"#$% = 10nm is an electronically conductive phase (corresponding to PEDOT-rich grain), and the outer region with a width 𝑤!"" = 20nm is an ion conductive phase (corresponding to PSS-rich grain). This geometry incorporates both main features of the morphology, namely the two-phase character of the material and the electronic conductivity path extending throughout the structure.
We assume that fixed negative charges (residing on PSS chains) are homogeneously distributed in the ion conductive region (𝑐!"#$% 𝐫 = 1 M ) and only ions can enter this region. Interestingly, the high electrical conductivity of PEDOT:PSS in the oxidized state in the presence of solvent indicates that the PEDOT nano-crystallites are not disrupted by the presence of the counterions; i.e. in other words, ions are not inserted between the PEDOT chains forming the π-π stacking. Hence, we also assume that there are no fixed charges inside the PEDOT-rich phase and ions cannot enter it. (It would be reasonably to assume that in real materials the PEDOT-rich grains can contain some PSS chains with negative fixed charges, as well as some ions can enter these grains. To keep our model conceptually simple we will disregard these effects). The concentration of accessible states for holes is 𝑐!° = 1 M. Figure 4 b shows cyclic voltammograms calculated for the case of two-dimensional model. The current density is obtained by integration over the polymer film 𝑗!"#$%& =
!!!∬ !!!
!!𝑑𝑠 , where the
width 𝑤! = 2𝑤!"" + 𝑤!"#$%. Apparently, the calculated voltammograms reproduce the main features of the experimental curves including the redox peaks and the box shape behavior in the oxidized state without any assumption of redox reactions and without introducing an additional phenomenological capacitive current.
In order to get insight into obtained results let us analyze the concentration and potential profiles, see Figure 4 c-h. When the applied potential 𝑉! = −0.5 V the polymer film is fully reduced and 𝑐! ≈ 0 (see Figure 4 c). The potential drops only at the metal/polymer and polymer/solution interfaces while inside film it has a constant value(see Figure 4 c,f). This is similar to the results obtained for the one-dimensional model. In particular, the potential in the both ion and hole conductive regions is approximately −0.06 V and corresponds to the Donnan potential discussed in Sec. IIIa. The forward increase of the applied voltage (𝑉! = −0.15 V) leads to an injection of holes into the pore, see Figure 4 d. The injected holes attract negative ions from the ion conductive region, which leads to the formation of double layers at the pore interface, see Figure 4 d,g. Outside the double layers the ion concentrations remain unchanged during the whole cycle. As a result, the potential inside the ion conductive region also remains constant and is equal to the Donnan potential 𝑉! ≈ −0.06 V. When the applied voltage increases the potential inside the pore increases because of the increase of the hole concentration. As in one-dimensional model the current density reaches its peak value (manifested as the redox peaks in the voltammograms) when the concentration of holes near
the interface of the pore reaches !!°
! . When the applied potential 𝑉! ≈ 0.5 V the concentration
of holes at the pore interface is equal to the concentration of the accessible sites 𝑐!° . As a
9
result, a given voltage increase leads to an increase of the width of the hole layer (see Figure 4 e, h).
It should be noted that during oxidation process the most significant potential drop occurs at the pore interface, in contrast to the one-dimensional model when the potential drop takes place mostly at the polymer/electrode interface. We conclude this discussion by stressing that the two-phase model apparently provides a qualitatively different picture of the evolution of potentials and ion and hole concentrations during a cycle as compared to the one-dimensional model.
When the scan is reversed in the backward direction (decreasing potential), the current density changes the sign (see Figure 4 b). The subsequent decrease of the applied voltage leads to a reverse process of the ejection of holes from the hole conductive region into the metallic electrode. At the potential 𝑉! ≈ −0.5 V the entire polymer electrode is again in its fully reduced state. In agreement with the experiment the calculated current depends linearly on the scan rate ν, c.f. Figure 1 b,c and Figure 4 b. The volumetric specific capacitance C* extracted from the calculated voltamogramms for the two-phase model is 𝐶∗ ≈ 10 F/cm!. This value is somehow smaller than the measured capacitance C* = 34F/cm3 (and an order of magnitude smaller than the values reported in [21]. It should be noted however that our calculations in the simplest two-dimensional model geometry represent the lowest estimate of the capacitance because the realistic three-dimensional geometry of bulk PEDOT:PSS would correspond to larger interface area and therefore larger C*.
It is important to stress that within the two-phase model there is no artificial separation between the direct current (describing voltammogram’s peaks) and the phenomenological capacitive current (describing plateaus) as in theone-dimensional model or in the standard electrochemical Butler-Volmer model. Instead, formation of both peaks and plateaus are described on the equal footing where the capacitive plateaus emerge as a result of charging/discharging of the double layers residing at interfaces between phases. We also stress that the developed two-phase model describes the experimental voltammograms without invoking an assumption about redox reaction in the system. Apparently, such reactions can take place in these systems (e.g. a peak at V= – 0.9 V in Figure1 b), and they can be incorporated in the Nernst-Plank-Poisson formalism using appropriate boundary conditions within the Butler-Volmer model.
4. Conclusion In conclusion, we addressed the origin of the intrinsic capacitance of conducting polymer PEDOT:PSS. The capacitive behavior and electron-ion coupling in PEDOT:PSS was experimentally studied using cyclic voltammetry. The morphology of PEDOT:PSS was investigated on different scales using GIWAXS providing information at the Ångström scale, and with tapping-mode AFM providing information at the nanometer scale.
In order to describe the experimental voltammograms we consider two models for the system at hand. The first one is a standard one-dimensional model based on the Nernst-Planck-Poisson equations treating a polymeric region as a one-component system allowing for the diffusion of both holes and ions. Even though this model successfully reproduces the shape of the voltammograms including plateaus and redox peaks, it is not able to explain the origin of the capacitance because the latter is introduced in the model as a phenomenological term. We argue that the key to understand the origin of the capacitance of PEDOT:PSS is the material morphology, in particular, its two-phase structure consisting of hole-conducting PEDOT-rich grains and ion-conducting PSS-rich grains. By applying a two-phase, two-dimensional Nernst-Planck-Poisson modeling approach we demonstrate that the major
10
contribution to the capacitance originates from electrical double layers formed along the interfaces between nanoscaled PEDOT-rich and PSS-rich interconnected grains that comprises two phases of the bulk of PEDOT:PSS. We show that the observed cyclic voltammograms of PEDOT:PSS can be understood within this model in terms of the coupled ion-electron diffusion and migration without invoking the assumption of redox reactions.
Finally, we argue that the developed model of capacitance charging explaining experimental voltammograms in terms of coupled electron/ion motion and double layer charging is not limited to PEDOT:PSS but is generic to a wide class of conducting polymers. The essential feature of the model is a presence of two phases corresponding to respectively electron and ion conducting regions. In PEDOT:PSS the phase separation occurs at the nanometer scale. Many conducting polymers (e.g. PEDOT doped with tosylate or another molecular counterions, or self-doped PEDOT-S) do not show grain formation. In such conducting polymers the phase separation between hole conducting PEDOT and counterions takes place on the Ångström scale, and the double layers represent the atomistic Stern layers forming directly at PEDOT crystallites. This type of phase separation can take place even in PEDOT:PSS in the PEDOT-rich grains that can contain PSS chains.[18b] For such systems the theoretical treatment based on the continuous Nernst-Plank equations is not appropriate and atomistic methods (e.g. molecular dynamics approaches) would be required to describe a formation of the atomistic Stern layers.
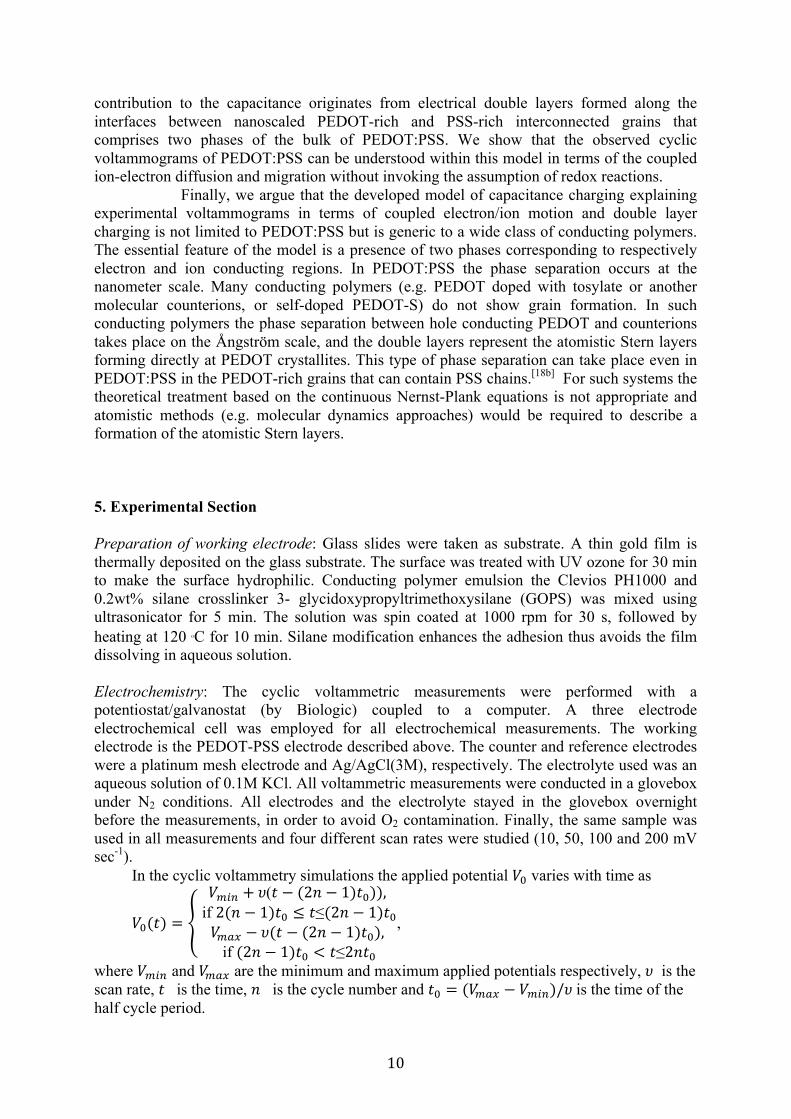
5. Experimental Section Preparation of working electrode: Glass slides were taken as substrate. A thin gold film is thermally deposited on the glass substrate. The surface was treated with UV ozone for 30 min to make the surface hydrophilic. Conducting polymer emulsion the Clevios PH1000 and 0.2wt% silane crosslinker 3- glycidoxypropyltrimethoxysilane (GOPS) was mixed using ultrasonicator for 5 min. The solution was spin coated at 1000 rpm for 30 s, followed by heating at 120 οC for 10 min. Silane modification enhances the adhesion thus avoids the film dissolving in aqueous solution. Electrochemistry: The cyclic voltammetric measurements were performed with a potentiostat/galvanostat (by Biologic) coupled to a computer. A three electrode electrochemical cell was employed for all electrochemical measurements. The working electrode is the PEDOT-PSS electrode described above. The counter and reference electrodes were a platinum mesh electrode and Ag/AgCl(3M), respectively. The electrolyte used was an aqueous solution of 0.1M KCl. All voltammetric measurements were conducted in a glovebox under N2 conditions. All electrodes and the electrolyte stayed in the glovebox overnight before the measurements, in order to avoid O2 contamination. Finally, the same sample was used in all measurements and four different scan rates were studied (10, 50, 100 and 200 mV sec-1).
In the cyclic voltammetry simulations the applied potential 𝑉! varies with time as
𝑉!(𝑡) =
𝑉!"# + 𝜐(𝑡 − (2𝑛 − 1)𝑡!)), if 2(𝑛 − 1)𝑡! ≤ 𝑡≤(2𝑛 − 1)𝑡!𝑉!"# − 𝜐(𝑡 − (2𝑛 − 1)𝑡!), if (2𝑛 − 1)𝑡! < 𝑡≤2𝑛𝑡!
,
where 𝑉!"# and 𝑉!"# are the minimum and maximum applied potentials respectively, 𝜐 is the scan rate, 𝑡 is the time, 𝑛 is the cycle number and 𝑡! = (𝑉!"# − 𝑉!"#)/𝜐 is the time of the half cycle period.

11
The specific capacitance of the film was obtained according to 𝐶 =!"#
!!(!!"!!!!"#)!!, where integration is performed over the area of the voltammogram, and
lp is the width of the film. Atomic Force Microscopy: The morphology of PEDOT-PSS films is characterized with tapping-mode AFM (Dimension 3100). The polymer films are cast on glass substrates. GIWAXS: PEDOT:PSS films spin coated on glass, silicon wafer with and without thermal oxide layer, and cross-linked with GOPS was measured at the dedicated GIWAXS setup at DTU Energy[34] The sample is exposed at a grazing incident angle of about 0.2° with respect to the sample surface, to maximize the signal from the thin film. A high-flux rotating Cu anode is used as X-ray source, focused and monochromatized by a 1D multilayer mirror (wavelength = 1.5418 Å). The scattered signal was recorded in vacuum on a photostimulable imaging plate. Data from the different substrates showed similar scattering features, with lowest background signal from the Si substrate, shown in the manuscript. Acknowledgments This work was financially supported by multiple funding sources: The Swedish Energy Agency (grant 38332-1), The Swedish research council Formas (grant 245-2010-1062), the research centre Security Link (VINNOVA 2009-00966) and the Norrköpings fond för Forskning och Utveckling, CeNano, Knut and Alice Wallenberg foundation (Power Paper), Swedish Foundation for Strategic Research (SSF) and the Advanced Functional Material SFO-center at Linköping University (Faculty Grant SFO-Mat-LiU # 2009-00971). Simulation resources are supported by The Swedish National Infrastructure for Computing (SNIC). XC, KW, EM, UA, DZ are supported by the European Research Council (ERC-starting-grant 307596), the Knut and Alice Wallenberg foundation (Tail of the Sun) and the Swedish Foundation for Strategic Research (0-3D). JWA is supported by the European Research Council (ERC Consolidator Grant 681881).
Received: ((will be filled in by the editorial staff)) Revised: ((will be filled in by the editorial staff))
Published online: ((will be filled in by the editorial staff)) References [1] a) G. Heywang, F. Jonas, Advanced Materials 1992, 4, 116; b) L. Groenendaal, F. Jonas, D.
Freitag, H. Pielartzik, J. R. Reynolds, Advanced Materials 2000, 12, 481. [2] a) D. C. Martin, J. Wu, C. M. Shaw, Z. King, S. A. Spanninga, S. Richardson-‐Burns, J. Hendricks,
J. Yang, Polymer Reviews 2010, 50, 340; b) H. Shi, C. Liu, Q. Jiang, J. Xu, Advanced Electronic Materials 2015, 1, 1500017.
[3] M. Cai, Z. Ye, T. Xiao, R. Liu, Y. Chen, R. W. Mayer, R. Biswas, K.-‐M. Ho, R. Shinar, J. Shinar, Advanced Materials 2012, 24, 4337.
[4] N. Stutzmann, R. H. Friend, H. Sirringhaus, Science 2003, 299, 1881. [5] K. Sun, S. Zhang, P. Li, Y. Xia, X. Zhang, D. Du, F. H. Isikgor, J. Ouyang, Journal of Materials
Science: Materials in Electronics 2015, 26, 4438.

12
[6] A. Malti, J. Edberg, H. Granberg, Z. U. Khan, J. W. Andreasen, X. J. Liu, D. Zhao, H. Zhang, Y. L. Yao, J. W. Brill, I. Engquist, M. Fahlman, L. Wagberg, X. Crispin, M. Berggren, Advanced Science 2016, 3, 9.
[7] a) T. Cheng, Y.-‐Z. Zhang, J.-‐D. Zhang, W.-‐Y. Lai, W. Huang, Journal of Materials Chemistry A 2016, 4, 10493; b) Z. Zhiheng, F. R. Georgia, M. Qingshi, Z. Shenmin, K. Hsu-‐Chiang, M. Jun, Nanotechnology 2016, 27, 042001; c) J. C. Carlberg, O. Inganäs, Journal of the Electrochemical Society 1997, 144, L61.
[8] a) D. Khodagholy, J. Rivnay, M. Sessolo, M. Gurfinkel, P. Leleux, L. H. Jimison, E. Stavrinidou, T. Herve, S. Sanaur, R. M. Owens, G. G. Malliaras, Nature Communications 2013, 4, 2133; b) J. Rivnay, P. Leleux, M. Ferro, M. Sessolo, A. Williamson, D. A. Koutsouras, D. Khodagholy, M. Ramuz, X. Strakosas, R. M. Owens, C. Benar, J.-‐M. Badier, C. Bernard, G. G. Malliaras, Science Advances 2015, 1; c) H. S. White, G. P. Kittlesen, M. S. Wrighton, Journal of the American Chemical Society 1984, 106, 5375; d) D. Nilsson, M. Chen, T. Kugler, T. Remonen, M. Armgarth, M. Berggren, Advanced Materials 2002, 14, 51; e) X. Strakosas, M. Bongo, R. M. Owens, Journal of Applied Polymer Science 2015, 132, n/a.
[9] Z.-‐T. Zhu, J. T. Mabeck, C. Zhu, N. C. Cady, C. A. Batt, G. G. Malliaras, Chemical Communications 2004, 1556.
[10] a) P. Tehrani, L.-‐O. Hennerdal, A. L. Dyer, J. R. Reynolds, M. Berggren, Journal of Materials Chemistry 2009, 19, 1799; b) Q. Pei, G. Zuccarello, M. Ahlskog, O. Inganäs, Polymer 1994, 35, 1347; c) ACREO, https://www.acreo.se/expertise/printed-‐electronic-‐technologies, https://www.acreo.se/expertise/printed-‐electronic-‐technologies, accessed.
[11] D. Khodagholy, T. Doublet, P. Quilichini, M. Gurfinkel, P. Leleux, A. Ghestem, E. Ismailova, T. Hervé, S. Sanaur, C. Bernard, G. G. Malliaras, Nature Communications 2013, 4.
[12] a) X. Cui, D. C. Martin, Sensors and Actuators B: Chemical 2003, 89, 92; b) N. Alba, Z. Du, K. Catt, T. Kozai, X. Cui, Biosensors 2015, 5, 618; c) N. K. Guimard, N. Gomez, C. E. Schmidt, Progress in Polymer Science 2007, 32, 876.
[13] a) J. Isaksson, P. Kjall, D. Nilsson, N. Robinson, M. Berggren, A. Richter-‐Dahlfors, Nat Mater 2007, 6, 673; b) A. Williamson, J. Rivnay, L. Kergoat, A. Jonsson, S. Inal, I. Uguz, M. Ferro, A. Ivanov, T. A. Sjöström, D. T. Simon, M. Berggren, G. G. Malliaras, C. Bernard, Advanced Materials 2015, 27, 3138; c) A. Jonsson, Z. Song, D. Nilsson, B. A. Meyerson, D. T. Simon, B. Linderoth, M. Berggren, Science Advances 2015, 1; d) D. T. Simon, S. Kurup, K. C. Larsson, R. Hori, K. Tybrandt, M. Goiny, E. W. H. Jager, M. Berggren, B. Canlon, A. Richter-‐Dahlfors, Nat Mater 2009, 8, 742.
[14] a) G. A. Snook, P. Kao, A. S. Best, Journal of Power Sources 2011, 196, 1; b) L. L. Zhang, X. S. Zhao, Chemical Society Reviews 2009, 38, 2520; c) A. M. Bryan, L. M. Santino, Y. Lu, S. Acharya, J. M. D’Arcy, Chemistry of Materials 2016, 28, 5989; d) P. Simon, Y. Gogotsi, Nat Mater 2008, 7, 845.
[15] S. W. Feldberg, Journal of the American Chemical Society 1984, 106, 4671. [16] a) T. Yeu, K. M. Yin, J. Carbajal, R. E. White, Journal of The Electrochemical Society 1991, 138,
2869; b) T. Yeu, T. V. Nguyen, R. E. White, Journal of The Electrochemical Society 1988, 135, 1971; c) J. Heinze, B. A. Frontana-‐Uribe, S. Ludwigs, Chemical Reviews 2010, 110, 4724.
[17] a) T. Johansson, N.-‐K. Persson, O. Inganäs, Journal of The Electrochemical Society 2004, 151, E119; b) X. Wang, B. Shapiro, E. Smela, The Journal of Physical Chemistry C 2009, 113, 382; c) S. Inal, G. G. Malliaras, J. Rivnay, Journal of Materials Chemistry C 2016, 4, 3942.
[18] a) V. N. Prigodin, F. C. Hsu, J. H. Park, O. Waldmann, A. J. Epstein, Physical Review B 2008, 78, 035203; b) C. M. Proctor, J. Rivnay, G. G. Malliaras, Journal of Polymer Science Part B: Polymer Physics 2016, 54, 1433.
[19] a) M. Modestov, V. Bychkov, D. Valiev, M. Marklund, The Journal of Physical Chemistry C 2011, 115, 21915; b) M. Modestov, V. Bychkov, G. Brodin, D. Valiev, M. Marklund, P. Matyba, L. Edman, Physical Review B 2010, 81, 081203; c) S. E. Feicht, G. D. Degen, A. S. Khair, AIChE

13
Journal 2015, 61, 1447; d) E. Stavrinidou, P. Leleux, H. Rajaona, M. Fiocchi, S. Sanaur, G. G. Malliaras, Journal of Applied Physics 2013, 113, 244501.
[20] S. Ghosh, O. Inganäs, Journal of The Electrochemical Society 2000, 147, 1872. [21] N. Kurra, J. Park, H. N. Alshareef, Journal of Materials Chemistry A 2014, 2, 17058. [22] N. Kim, B. H. Lee, D. Choi, G. Kim, H. Kim, J.-‐R. Kim, J. Lee, Y. H. Kahng, K. Lee, Physical Review
Letters 2012, 109, 106405. [23] a) A. Ugur, F. Katmis, M. Li, L. Wu, Y. Zhu, K. K. Varanasi, K. K. Gleason, Advanced Materials
2015, 27, 4604; b) C. M. Palumbiny, F. Liu, T. P. Russell, A. Hexemer, C. Wang, P. Müller-‐Buschbaum, Advanced Materials 2015, 27, 3391; c) T. Takano, H. Masunaga, A. Fujiwara, H. Okuzaki, T. Sasaki, Macromolecules 2012, 45, 3859.
[24] Y. Wang, R. Song, Y. Li, J. Shen, Surface Science 2003, 530, 136. [25] A. I. Hofmann, W. T. T. Smaal, M. Mumtaz, D. Katsigiannopoulos, C. Brochon, F. Schütze, O. R.
Hild, E. Cloutet, G. Hadziioannou, Angewandte Chemie International Edition 2015, 54, 8506. [26] X. Crispin, F. L. E. Jakobsson, A. Crispin, P. C. M. Grim, P. Andersson, A. Volodin, C. van
Haesendonck, M. Van der Auweraer, W. R. Salaneck, M. Berggren, Chemistry of Materials 2006, 18, 4354.
[27] a) U. Lang, E. Müller, N. Naujoks, J. Dual, Advanced Functional Materials 2009, 19, 1215; b) A. M. Nardes, M. Kemerink, R. A. J. Janssen, J. A. M. Bastiaansen, N. M. M. Kiggen, B. M. W. Langeveld, A. J. J. M. van Breemen, M. M. de Kok, Advanced Materials 2007, 19, 1196.
[28] Y. Xia, J. Ouyang, ACS Applied Materials & Interfaces 2012, 4, 4131. [29] C. E. D. Chidsey, R. W. Murray, The Journal of Physical Chemistry 1986, 90, 1479. [30] M. S. Kilic, M. Z. Bazant, A. Ajdari, Physical Review E 2007, 75, 021503. [31] M. C. Morvant, J. R. Reynolds, Synthetic Metals 1998, 92, 57. [32] O. Bubnova, M. Berggren, X. Crispin, Journal of the American Chemical Society 2012, 134,
16456. [33] J. Chmiola, G. Yushin, Y. Gogotsi, C. Portet, P. Simon, P. L. Taberna, Science 2006, 313, 1760. [34] D. Apitz, R. P. Bertram, N. Benter, W. Hieringer, J. W. Andreasen, M. M. Nielsen, P. M.
Johansen, K. Buse, Physical Review E 2005, 72, 036610.
14
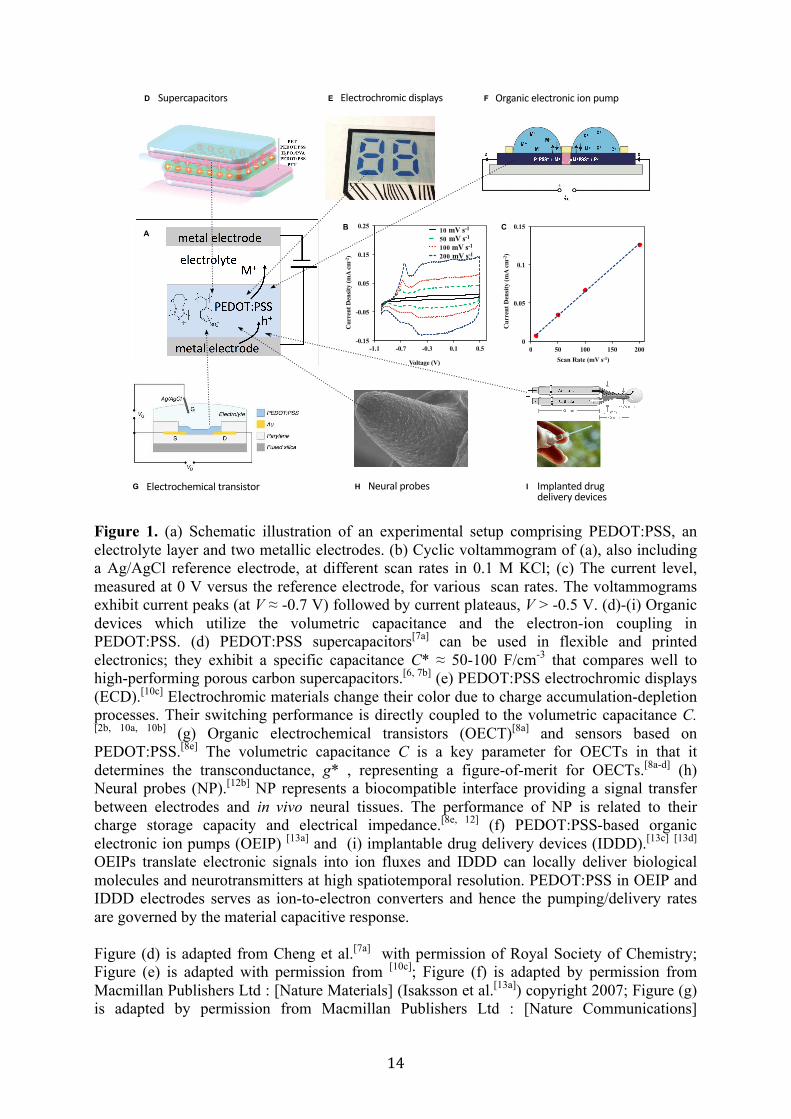
Figure 1. (a) Schematic illustration of an experimental setup comprising PEDOT:PSS, an electrolyte layer and two metallic electrodes. (b) Cyclic voltammogram of (a), also including a Ag/AgCl reference electrode, at different scan rates in 0.1 M KCl; (c) The current level, measured at 0 V versus the reference electrode, for various scan rates. The voltammograms exhibit current peaks (at V ≈ -0.7 V) followed by current plateaus, V > -0.5 V. (d)-(i) Organic devices which utilize the volumetric capacitance and the electron-ion coupling in PEDOT:PSS. (d) PEDOT:PSS supercapacitors[7a] can be used in flexible and printed electronics; they exhibit a specific capacitance C* ≈ 50-100 F/cm-3 that compares well to high-performing porous carbon supercapacitors.[6, 7b] (e) PEDOT:PSS electrochromic displays (ECD).[10c] Electrochromic materials change their color due to charge accumulation-depletion processes. Their switching performance is directly coupled to the volumetric capacitance C. [2b, 10a, 10b] (g) Organic electrochemical transistors (OECT)[8a] and sensors based on PEDOT:PSS.[8e] The volumetric capacitance C is a key parameter for OECTs in that it determines the transconductance, g* , representing a figure-of-merit for OECTs.[8a-d] (h) Neural probes (NP).[12b] NP represents a biocompatible interface providing a signal transfer between electrodes and in vivo neural tissues. The performance of NP is related to their charge storage capacity and electrical impedance.[8e, 12] (f) PEDOT:PSS-based organic electronic ion pumps (OEIP) [13a] and (i) implantable drug delivery devices (IDDD).[13c] [13d] OEIPs translate electronic signals into ion fluxes and IDDD can locally deliver biological molecules and neurotransmitters at high spatiotemporal resolution. PEDOT:PSS in OEIP and IDDD electrodes serves as ion-to-electron converters and hence the pumping/delivery rates are governed by the material capacitive response. Figure (d) is adapted from Cheng et al.[7a] with permission of Royal Society of Chemistry; Figure (e) is adapted with permission from [10c]; Figure (f) is adapted by permission from Macmillan Publishers Ltd : [Nature Materials] (Isaksson et al.[13a]) copyright 2007; Figure (g) is adapted by permission from Macmillan Publishers Ltd : [Nature Communications]
15
(Khodagholy et al.[8a]) copyright 2013; Figure (h) is adapted from Alba et al.[12b]; Figure (i) is adapted by permission from Macmillan Publishers Ltd : [Nature Materials] (Simone et al.[13d]) copyright 2009.
Figure 2. (a) GIWAXS data of PEDOT:PSS with 0.2 w/o GOPS ((3-Glycidyloxypropyl)trimethoxysilane), cast on silicon wafer, represented in a coordinate system of scattering vectors Qxy, Qz, parallel to the substrate plane and substrate normal, respectively; (b) the GIWAXS data integrated from 0° to 120° azimuthal angle as a function of total scattering vector length. (The length of the scattering vector |Q| is related to the scattering angle 2θ as |Q| = 4πsin θ/λ where λ is the X-ray wavelength (1.5418 Å)) (c) Phase images and (d) topography of a PEDOT-PSS film obtained with tapping-mode AFM at a scale of 500×500 nm2. (e) Schematic diagram of the morphology model (see text for details).

16
Figure 3. (a) Schematics of the electrode system for one-dimensional model. (b) Cyclic voltammograms calculated according to one-dimensional model at the scan rate ν =100 mV/s. The total current density, and its direct and capacitive contribution are shown. (c) Cyclic voltammograms for different scan rates ν. (d, e, f) Concentrations of mobiles anions, cations, and holes (c-, c+ and ch respectively) and (g, h, i) potential profiles at different applied voltages V0 calculated within the one-dimensional model.

17
Figure 4. (a) Schematics of the electrode system for two-phase model. (b) Cyclic voltammograms calculated according to two-phase model for different scan rates. (c, d, e) Concentrations and corresponding potential profiles at different applied voltages V0 for two-phase model. Profiles are shown along y-axis at x = 50 nm. c-, c+ and ch correspond to the concentration of mobile anions, cations and holes respectively. (f, g, h) Two-dimensional potential profiles at different applied voltages V0 for two-phase model.

18
Table of Contents By performing two-dimensional Nernst-Planck-Poisson modeling of experimental cyclic voltammograms we show that PEDOT:PSS capacitance originates from charging of double layers formed on boundaries between the two phases consisting of PEDOT-rich and PSS-rich grains. Anton V. Volkov, Kosala Wijeratne, Evangelia Mitraka, Ujwala Ail, Dan Zhao, Klas Tybrandt, Jens Wenzel Andreasen, Magnus Berggren, Xavier Crispin and Igor V. Zozoulenko
Anton V. Volkov, Kosala Wijeratne, Evangelia Mitraka, Dr. Ujwala Ail, Dr. Dan Zhao, Dr. Klas Tybrandt, Prof. Magnus Berggren, Prof. Xavier Crispin and Prof. Igor V. Zozoulenko
Laboratory of Organic Electronics, Department of Science and Technology, Linköping University, 601 74 Norrköping, Sweden e-mail: [email protected]
Prof. Jens Wenzel Andreasen
Department of Energy Conversion and Storage, Technical University of Denmark DK-4000 Roskilde, Denmark Prof. Magnus Berggren Stellenbosch Institute for Advanced Study (STIAS), Wallenberg Research Centre at Stellenbosch University, Stellenbosch, South Africa Keywords: PEDOT:PSS, supercapacitance, cyclic voltammetry, double layers, Nernst-Planck-Poisson modelling ToC figure ((Please choose one size: 55 mm broad × 50 mm high or 110 mm broad × 20 mm high. Please do not use any other dimensions))
-0.15
-0.05
0.05
0.15
0.25
-1.1 -0.7 -0.3 0.1 0.5
Cur
rent
Den
sity
(mA
cm
-2)
1050 100 mV s-1
200
Voltage (V)
−0.02
−0.01
0
0.01
0.02
0.03
−0.6 −0.4 −0.2 0 0.2 0.4 0.6 0.8
ν = 100 mV s-1
ν = 50 mV s-1
ν = 10 mV s-1
j (m
A c
m-2
)
V0 (V)
Experimental data
Simulated data
mV s-1
mV s-1
mV s-1