understanding spatial multi criteria decision making...understanding spatial multi‐criteria...
TRANSCRIPT

An analytical demonstration of AHP‐based MCDM and how it is used in GIS
Understanding Spatial
Multi‐Criteria Decision Making
by: Rodrigo Nobrega “Sal”[email protected]
Memphis‐in‐May NCRST‐SEPP WorkshopMay 7th, 2009
M S U - N C R S T - S E P P M E M P H I S - I N - M A Y W O R K S H O P M a y 6 t h – 8 t h , 2 0 0 9 M e m p h i s - T N
UNDERSTANDING SPATIAL MULTI‐CRITERIA DECISION MAKINGan analytical demonstration of MCDM‐AHP and how to is used in GIS
• Multi‐Criteria: What it is? How does it works? Techniques available
• Analytical Hierarchy Process
• AHP GIS Spatial MCDMdeveloping numbers from input rankings
• Results and future implementations
Topics presented

M S U - N C R S T - S E P P M E M P H I S - I N - M A Y W O R K S H O P M a y 6 t h – 8 t h , 2 0 0 9 M e m p h i s - T N
UNDERSTANDING SPATIAL MULTI‐CRITERIA DECISION MAKINGan analytical demonstration of MCDM‐AHP and how to is used in GIS
Systematic way to select the best available alternatives based on different opinions and conflicting priorities and values.
What is MCDM ?
Haas & Meixner (2006) http://www.boku.ac.at/mi/
Why should we use it?
• MCDM enables multiple stakeholder preferences to be modeled
• MCDM offers improved coordination and collaboration
• MCDM can be implemented to integrate spatial information

M S U - N C R S T - S E P P M E M P H I S - I N - M A Y W O R K S H O P M a y 6 t h – 8 t h , 2 0 0 9 M e m p h i s - T N
UNDERSTANDING SPATIAL MULTI‐CRITERIA DECISION MAKINGan analytical demonstration of MCDM‐AHP and how to is used in GIS
How does MCDM works ?
GoalI‐269
Objectives1) Economy
2) Safety
3) Minimum environmental impact
Factors1) Desired distance from urban areas
2) Avoid wetlands and forest
3) Stay out (but not far) of ag fields
Criteria1) D < 1mi very high
2) 1mi < D < 2mi high
3) 2mi < D < 3mi med
4) 3mi < D < 4mi low
5) 4mi < D < 6mi med
6) D > 6mi high
Alternatives
1) B1
2) B2
3) B3
Problem Solving technique
M S U - N C R S T - S E P P M E M P H I S - I N - M A Y W O R K S H O P M a y 6 t h – 8 t h , 2 0 0 9 M e m p h i s - T N
UNDERSTANDING SPATIAL MULTI‐CRITERIA DECISION MAKINGan analytical demonstration of MCDM‐AHP and how to is used in GIS
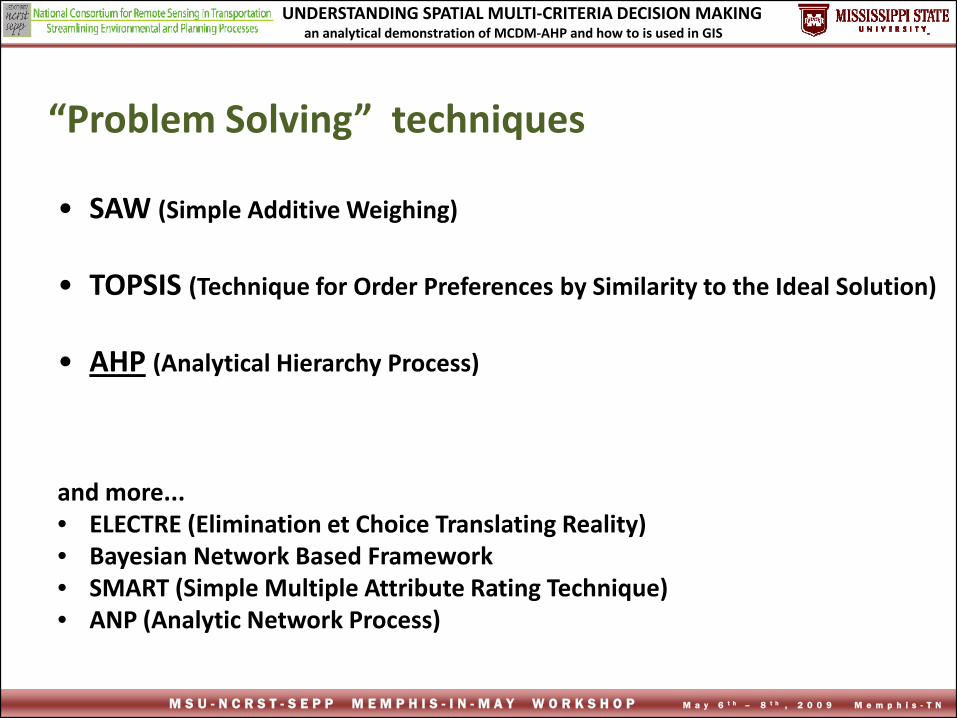
• SAW (Simple Additive Weighing)
• TOPSIS (Technique for Order Preferences by Similarity to the Ideal Solution)
• AHP (Analytical Hierarchy Process)
and more...• ELECTRE (Elimination et Choice Translating Reality)• Bayesian Network Based Framework• SMART (Simple Multiple Attribute Rating Technique)• ANP (Analytic Network Process)
“Problem Solving” techniques
M S U - N C R S T - S E P P M E M P H I S - I N - M A Y W O R K S H O P M a y 6 t h – 8 t h , 2 0 0 9 M e m p h i s - T N
UNDERSTANDING SPATIAL MULTI‐CRITERIA DECISION MAKINGan analytical demonstration of MCDM‐AHP and how to is used in GIS
Analytic Hierarchy Process ‐ AHP
• It is a very robust problem solve technique based on pairwise comparisons, developed in early 70’s by Dr. Thomas Saaty as a method to help solve conflicts in ecomonic models.
• MCDM has been adapted from AHP to assist numerous corporate and govenment decision makers in different fields
• Problems are decomposed into a hierarchy of factors and criteria.
M S U - N C R S T - S E P P M E M P H I S - I N - M A Y W O R K S H O P M a y 6 t h – 8 t h , 2 0 0 9 M e m p h i s - T N
UNDERSTANDING SPATIAL MULTI‐CRITERIA DECISION MAKINGan analytical demonstration of MCDM‐AHP and how to is used in GIS
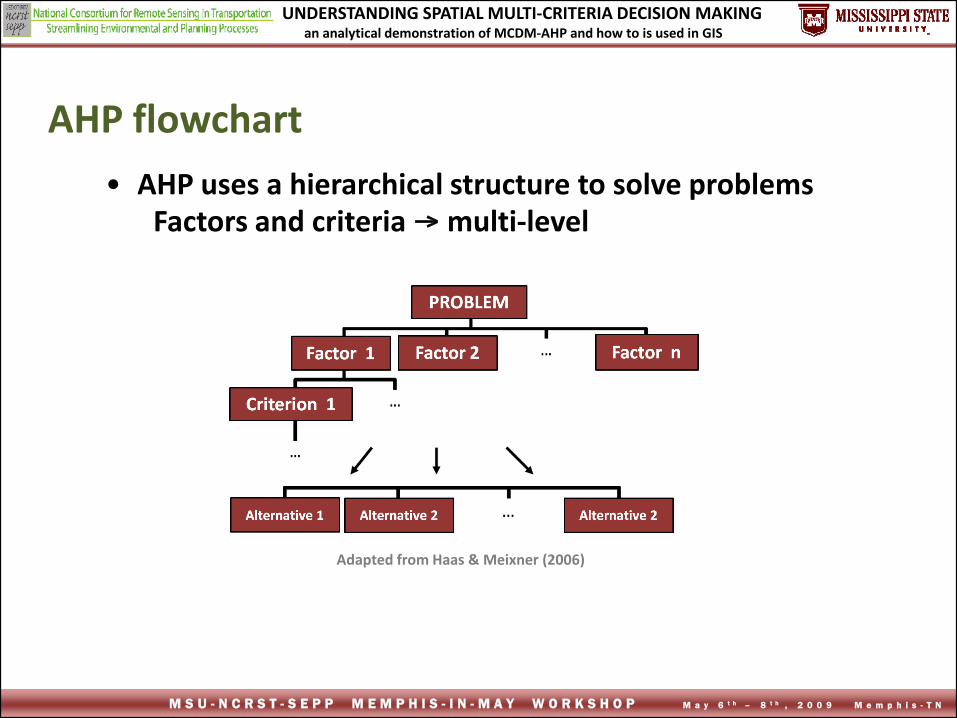
• AHP uses a hierarchical structure to solve problems Factors and criteria multi‐level
AHP flowchart
Adapted from Haas & Meixner (2006)

M S U - N C R S T - S E P P M E M P H I S - I N - M A Y W O R K S H O P M a y 6 t h – 8 t h , 2 0 0 9 M e m p h i s - T N
UNDERSTANDING SPATIAL MULTI‐CRITERIA DECISION MAKINGan analytical demonstration of MCDM‐AHP and how to is used in GIS
AHP – procedures

M S U - N C R S T - S E P P M E M P H I S - I N - M A Y W O R K S H O P M a y 6 t h – 8 t h , 2 0 0 9 M e m p h i s - T N
UNDERSTANDING SPATIAL MULTI‐CRITERIA DECISION MAKINGan analytical demonstration of MCDM‐AHP and how to is used in GIS
AHP – pair‐wise comparisons
Scale for pair‐wise comparison (Saaty 1980)
Pair‐wise comparisons should use the Saaty’s scale, which ranges from 1 (equal value) to 9 (extreme different)
Pair‐wise is applicable for all levels of the AHP process(concurrent factors and concurrent criteria as well)

M S U - N C R S T - S E P P M E M P H I S - I N - M A Y W O R K S H O P M a y 6 t h – 8 t h , 2 0 0 9 M e m p h i s - T N
UNDERSTANDING SPATIAL MULTI‐CRITERIA DECISION MAKINGan analytical demonstration of MCDM‐AHP and how to is used in GIS
AHP – normalization and consistency analysis
pair‐wise inputs normalized inputs

M S U - N C R S T - S E P P M E M P H I S - I N - M A Y W O R K S H O P M a y 6 t h – 8 t h , 2 0 0 9 M e m p h i s - T N
UNDERSTANDING SPATIAL MULTI‐CRITERIA DECISION MAKINGan analytical demonstration of MCDM‐AHP and how to is used in GIS
Normalization: “ behind the scene”
333231
232221
131211
CCCCCCCCC
For a matrix of pair-wise elements:
n
i ijij CC1
1) sum the values in each column of the pair-wise matrix
2) divide each element in the matrix by its column total to generate a normalized pair-wise matrix
n
i ji
ijji
C
CX
1
3) divide the sum of the normalized column of matrix by the number of criteria used (n) to generate weighted matrix
n
XW
n
j ji
ji 1
333231
232221
131211
XXXXXXXXX
13
12
11
WWW
M S U - N C R S T - S E P P M E M P H I S - I N - M A Y W O R K S H O P M a y 6 t h – 8 t h , 2 0 0 9 M e m p h i s - T N
UNDERSTANDING SPATIAL MULTI‐CRITERIA DECISION MAKINGan analytical demonstration of MCDM‐AHP and how to is used in GIS
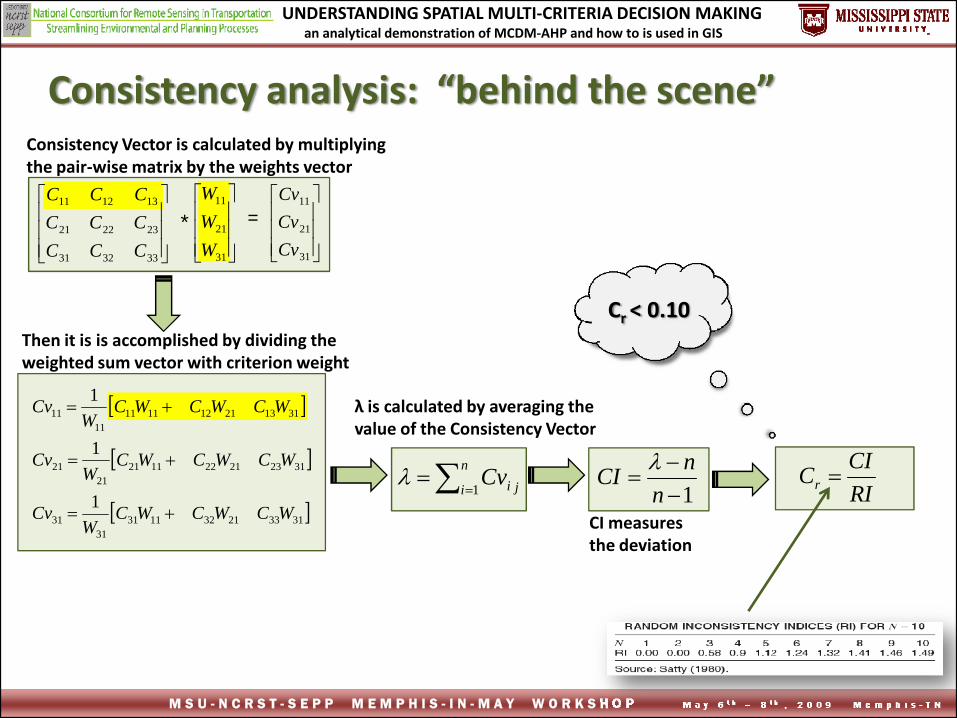
Consistency analysis: “behind the scene” Consistency Vector is calculated by multiplying the pair‐wise matrix by the weights vector
333231
232221
131211
CCCCCCCCC
31
21
11
WWW
31
21
11
CvCvCv
* =
31332132113131
31
31232122112121
21
31132112111111
11
1
1
1
WCWCWCW
Cv
WCWCWCW
Cv
WCWCWCW
Cv
1
n
nCI RICICr
n
i jiCv1
Cr < 0.10Then it is is accomplished by dividing the weighted sum vector with criterion weight
λ is calculated by averaging the value of the Consistency Vector
CI measures the deviation

M S U - N C R S T - S E P P M E M P H I S - I N - M A Y W O R K S H O P M a y 6 t h – 8 t h , 2 0 0 9 M e m p h i s - T N
UNDERSTANDING SPATIAL MULTI‐CRITERIA DECISION MAKINGan analytical demonstration of MCDM‐AHP and how to is used in GIS
Real world needs: ranking instead pair‐wise inputs

M S U - N C R S T - S E P P M E M P H I S - I N - M A Y W O R K S H O P M a y 6 t h – 8 t h , 2 0 0 9 M e m p h i s - T N
UNDERSTANDING SPATIAL MULTI‐CRITERIA DECISION MAKINGan analytical demonstration of MCDM‐AHP and how to is used in GIS
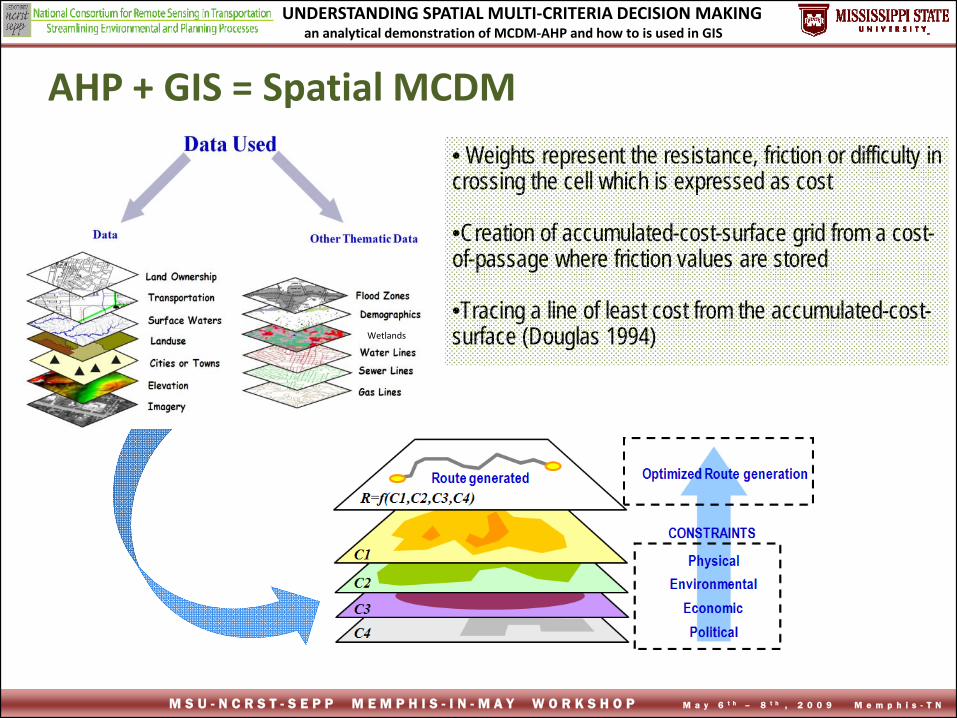
AHP + GIS = Spatial MCDM
M S U - N C R S T - S E P P M E M P H I S - I N - M A Y W O R K S H O P M a y 6 t h – 8 t h , 2 0 0 9 M e m p h i s - T N
UNDERSTANDING SPATIAL MULTI‐CRITERIA DECISION MAKINGan analytical demonstration of MCDM‐AHP and how to is used in GIS
• Weights represent the resistance, friction or difficulty in crossing the cell which is expressed as cost
•Creation of accumulated-cost-surface grid from a cost-of-passage where friction values are stored
•Tracing a line of least cost from the accumulated-cost-surface (Douglas 1994)Wetlands
AHP + GIS = Spatial MCDM

M S U - N C R S T - S E P P M E M P H I S - I N - M A Y W O R K S H O P M a y 6 t h – 8 t h , 2 0 0 9 M e m p h i s - T N
UNDERSTANDING SPATIAL MULTI‐CRITERIA DECISION MAKINGan analytical demonstration of MCDM‐AHP and how to is used in GIS
Data raster format (digital image)
AHP + GIS = Spatial MCDM
Cells or Pixels

M S U - N C R S T - S E P P M E M P H I S - I N - M A Y W O R K S H O P M a y 6 t h – 8 t h , 2 0 0 9 M e m p h i s - T N
UNDERSTANDING SPATIAL MULTI‐CRITERIA DECISION MAKINGan analytical demonstration of MCDM‐AHP and how to is used in GIS
Study Area
The testbed used is a part of the I‐269
Around 30‐mile corridor that connects Hernando‐MS to Collierville‐TN
Spatial MCDM: case application

M S U - N C R S T - S E P P M E M P H I S - I N - M A Y W O R K S H O P M a y 6 t h – 8 t h , 2 0 0 9 M e m p h i s - T N
UNDERSTANDING SPATIAL MULTI‐CRITERIA DECISION MAKINGan analytical demonstration of MCDM‐AHP and how to is used in GIS
Spatial MCDM: case application (hypothetical values)Four factors:
• Drainage density (waterbodies + streams)• Developed areas• Wetlands• Slope
Criteria
Factors
Goal Least‐cost path
Drainagedensity
Avoidancedistances
Developed areas
Avoidance distances
Wetlands
Avoidance distances
Slope
Avoidance distances
M S U - N C R S T - S E P P M E M P H I S - I N - M A Y W O R K S H O P M a y 6 t h – 8 t h , 2 0 0 9 M e m p h i s - T N
UNDERSTANDING SPATIAL MULTI‐CRITERIA DECISION MAKINGan analytical demonstration of MCDM‐AHP and how to is used in GIS
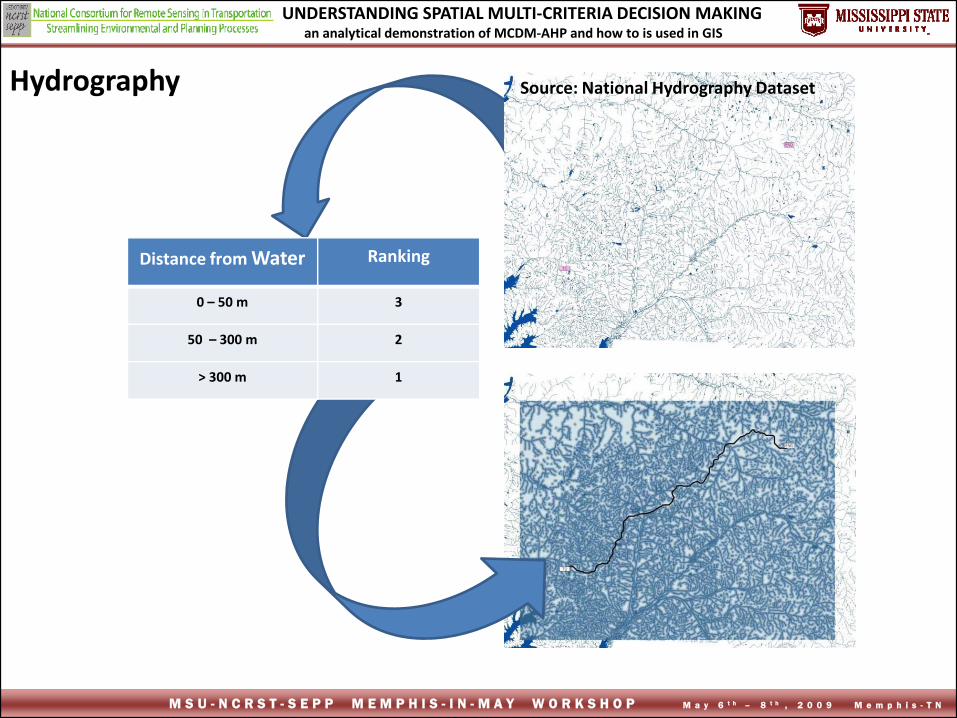
Source: National Hydrography Dataset
Distance from Water Ranking
0 – 50 m 3
50 – 300 m 2
> 300 m 1
Hydrography
M S U - N C R S T - S E P P M E M P H I S - I N - M A Y W O R K S H O P M a y 6 t h – 8 t h , 2 0 0 9 M e m p h i s - T N
UNDERSTANDING SPATIAL MULTI‐CRITERIA DECISION MAKINGan analytical demonstration of MCDM‐AHP and how to is used in GIS
..0.65.3833.11637.01666.01428.01818.01666.01428.01818.0312/13/132972.03333.02857.02727.03333.02857.02727.02212/125389.05.05714.05455.05.05714.05455.013211
./321321
TotalsClDDClDDClDD
WtStdnClClClClassesDDDDDDClassesIIIStepIIStepIStep
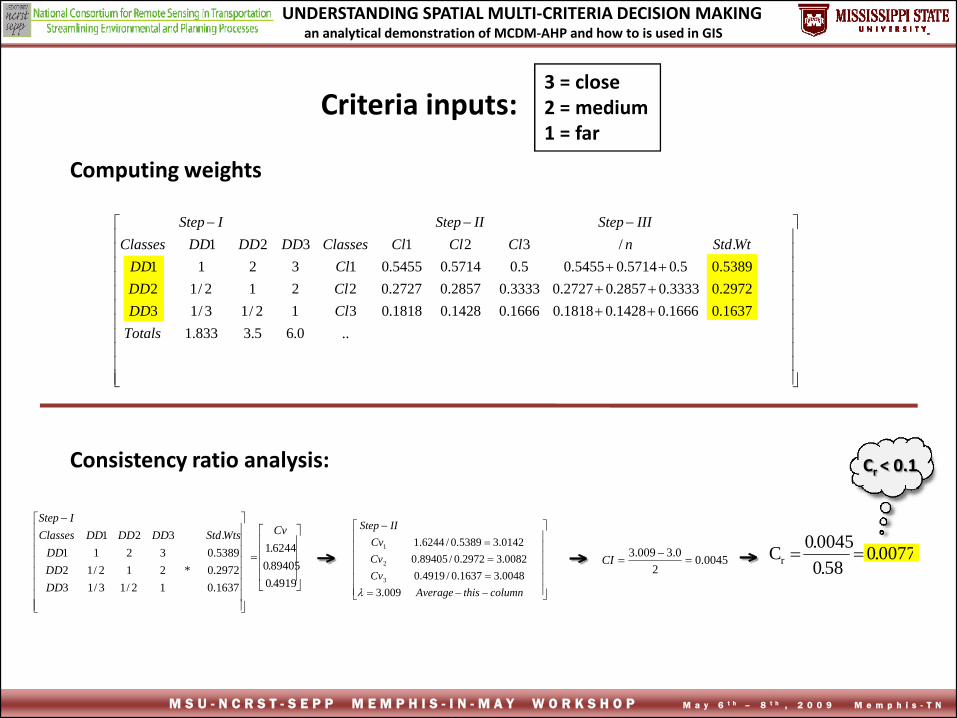
Computing weights
1637.02972.05389.0.
12/13/13*212/12
3211321 WtsStd
DDDDDD
DDDDDDClassesIStep
4919.089405.06244.1Cv
columnthisAverageCvCvCv
IIStep
009.30048.31637.0/4919.00082.32972.0/89405.0
0142.35389.0/6244.1
3
2
1
0045.02
0.3009.3
CI 0077.0
58.00045.0Cr
Cr < 0.1Consistency ratio analysis:
3 = close2 = medium1 = far
Criteria inputs:

M S U - N C R S T - S E P P M E M P H I S - I N - M A Y W O R K S H O P M a y 6 t h – 8 t h , 2 0 0 9 M e m p h i s - T N
UNDERSTANDING SPATIAL MULTI‐CRITERIA DECISION MAKINGan analytical demonstration of MCDM‐AHP and how to is used in GIS
Distance from MPO Urbanized Limits
Source: Memphis MPO
Distance from MPO Ranking
0 – 2 Km 5
2 – 4 Km 4
4 – 6 Km 3
6 – 8 Km 2
> 8 Km 1

M S U - N C R S T - S E P P M E M P H I S - I N - M A Y W O R K S H O P M a y 6 t h – 8 t h , 2 0 0 9 M e m p h i s - T N
UNDERSTANDING SPATIAL MULTI‐CRITERIA DECISION MAKINGan analytical demonstration of MCDM‐AHP and how to is used in GIS
Computing weights
Cr < 0.1Consistency ratio analysis:
155.108333.60833.42833.20624.00.066 + 0.047 + 0.048 + 0.061 + 0.087066.0047.0048.0061.0087.015.0333.025.02.0UD50986.00.133 + 0.095 + 0.073 + 0.081 + 0.109133.0095.0073.0081.0109.0215.0333.025.0UD41611.00.200 + 0.190 + 0.146 + 0.122 + 0.146200.0190.0146.0122.0146.03215.0.333.0UD32618.00.266 + 0.285 + 0.292 + 0.244 + 0.219266.0285.0292.0244.0219.043215.0UD24162.00.333 + 0.381 + 0.439 + 0.489 + 0.438333.0381.0439.0439.0438.054321UD1
../UD5UD4UD3UD2UD1UD5UD4UD3UD2UD1
Totals
WeigthStdnClassesIIIStepIIStepIStep
0624.015.03333.025.02.050986.0215.03333.025.041611.0*3215.03333.032618.043215.024162.0543211.54321
UDUDUDUDUD
WtsStdUDUDUDUDUDClassesIStep
3140.04952.08150.03372.11291.2Cv
columnlastthisAverageCvCvCvCvCv
IIStep
5342.20345.50624.0/3140.00234.50986.0/4952.00603.52618.0/8150.01080.52618.0/3372.1
11.54162.0/1291.2
5
4
3
2
1
6165.04
0.55342.2
CI 1233.0
12.16165.0C r
5 = inner city4 = close3 = medium2 = far1 = so far
Criteria inputs:

M S U - N C R S T - S E P P M E M P H I S - I N - M A Y W O R K S H O P M a y 6 t h – 8 t h , 2 0 0 9 M e m p h i s - T N
UNDERSTANDING SPATIAL MULTI‐CRITERIA DECISION MAKINGan analytical demonstration of MCDM‐AHP and how to is used in GIS
Source: National Land Cover Database 2001
Distance from Wetlands
Ranking
0 – 50 m 3
50 – 200 m 2
> 200 m 1
Wetlands

M S U - N C R S T - S E P P M E M P H I S - I N - M A Y W O R K S H O P M a y 6 t h – 8 t h , 2 0 0 9 M e m p h i s - T N
UNDERSTANDING SPATIAL MULTI‐CRITERIA DECISION MAKINGan analytical demonstration of MCDM‐AHP and how to is used in GIS
Computing weights
Cr < 0.1Consistency ratio analysis:
..0.65.3833.11637.01666.01428.01818.01666.01428.01818.0312/13/132972.03333.02857.02727.03333.02857.02727.02212/125389.05.05714.05455.05.05714.05455.013211
./321321
TotalsWlWlWlWlWlWl
WtStdnClClClClassesWlWlWlClassesIIIStepIIStepIStep
1637.02972.05389.0.
12/13/13*212/12
3211321 WtsStd
WlWlWl
WlWlWlClassesIStep
4919.089405.06244.1Cv
columnthisAverageCvCvCv
IIStep
009.30048.31637.0/4919.00082.32972.0/89405.0
0142.35389.0/6244.1
3
2
1
0045.02
0.3009.3
CI 0077.0
58.00045.0Cr
3 = close2 = medium1 = far
Criteria inputs:
M S U - N C R S T - S E P P M E M P H I S - I N - M A Y W O R K S H O P M a y 6 t h – 8 t h , 2 0 0 9 M e m p h i s - T N
UNDERSTANDING SPATIAL MULTI‐CRITERIA DECISION MAKINGan analytical demonstration of MCDM‐AHP and how to is used in GIS
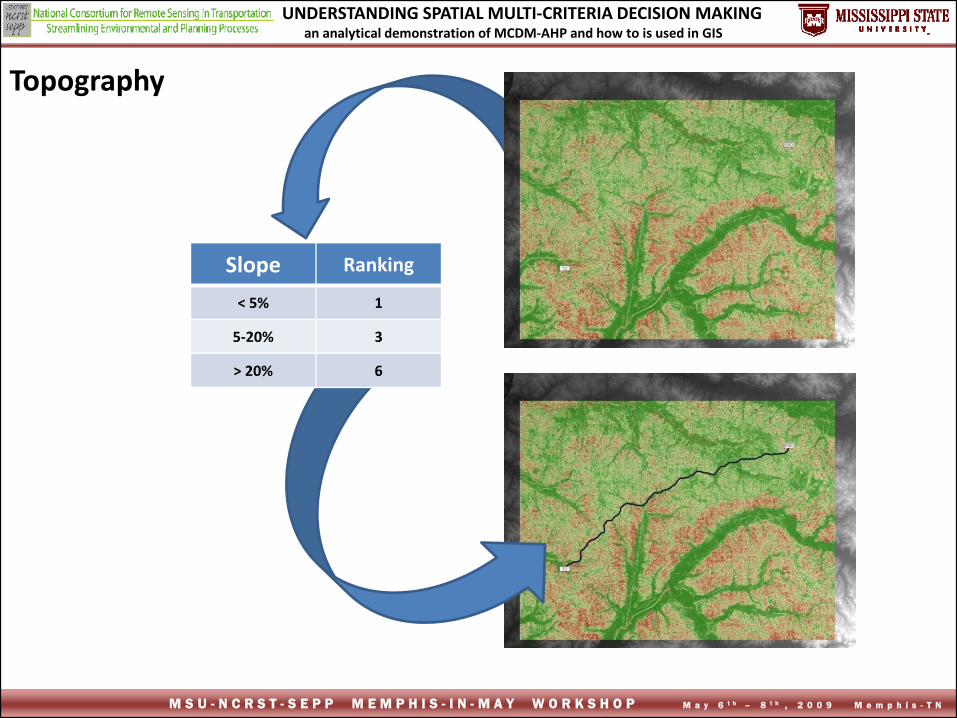
Slope Ranking
< 5% 1
5‐20% 3
> 20% 6
Topography

M S U - N C R S T - S E P P M E M P H I S - I N - M A Y W O R K S H O P M a y 6 t h – 8 t h , 2 0 0 9 M e m p h i s - T N
UNDERSTANDING SPATIAL MULTI‐CRITERIA DECISION MAKINGan analytical demonstration of MCDM‐AHP and how to is used in GIS
Computing weights
Cr < 0.1Consistency ratio analysis:
..0.1033.541.10935.01.00625.01182.01.00625.01182.0313/16/132216.03.01876.01773.03.01876.01773.02314/126865.06.07504.07092.06.07504.07092.016411
./321321
TotalsLDSCLDSCLDSC
WtStdnClClClClassesSCSCSCClassesIIIStepIIStepIStep
0935.02216.06865.0.
13/16/13*314/12
6411321 WtsStd
SCSCSC
SCSCSCClassesIStep
2816.06737.01339.2Cv
columnthisAverageCvCvCv
IIStep
0532.30117.30935.0/2816.00401.32216.0/6737.01083.36865.0/1339.2
3
2
1
0266.02
0.30532.3
CI 045.0
58.00266.0Cr
6 = Rugged 3 = medium1 = flat
Criteria inputs:

M S U - N C R S T - S E P P M E M P H I S - I N - M A Y W O R K S H O P M a y 6 t h – 8 t h , 2 0 0 9 M e m p h i s - T N
UNDERSTANDING SPATIAL MULTI‐CRITERIA DECISION MAKINGan analytical demonstration of MCDM‐AHP and how to is used in GIS
7 = develope area 4 = drainage density1 = slope3 = wetlands
Combining multiple scenarios (hypothetical values)
M S U - N C R S T - S E P P M E M P H I S - I N - M A Y W O R K S H O P M a y 6 t h – 8 t h , 2 0 0 9 M e m p h i s - T N
UNDERSTANDING SPATIAL MULTI‐CRITERIA DECISION MAKINGan analytical demonstration of MCDM‐AHP and how to is used in GIS
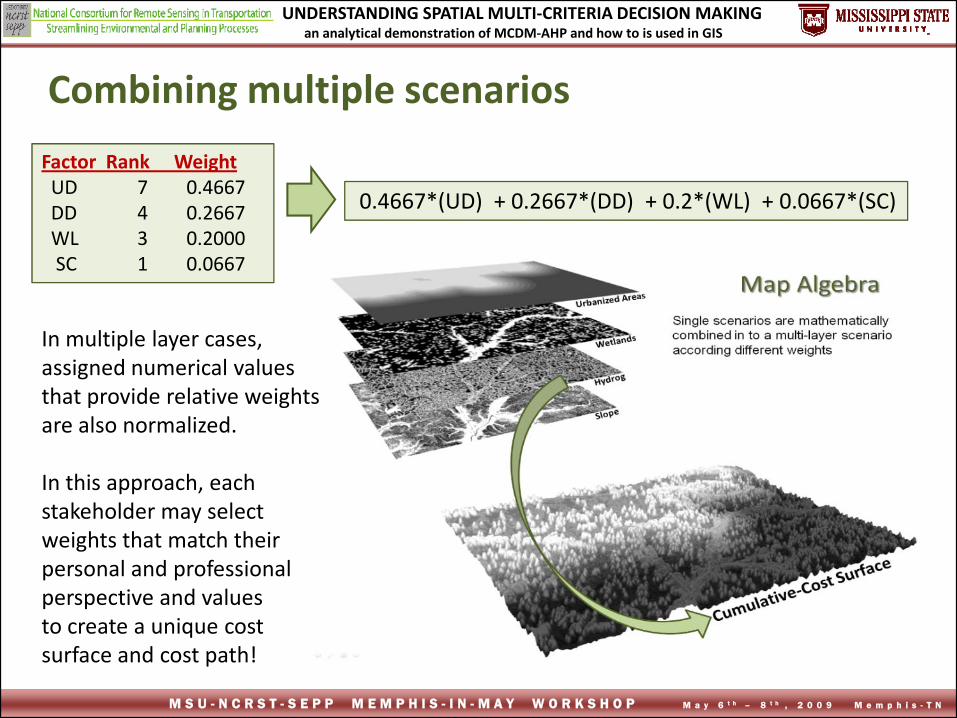
Combining multiple scenarios
0.4667*(UD) + 0.2667*(DD) + 0.2*(WL) + 0.0667*(SC)
Factor Rank WeightUD 7 0.4667DD 4 0.2667WL 3 0.2000SC 1 0.0667
In multiple layer cases,assigned numerical valuesthat provide relative weights are also normalized.
In this approach, each stakeholder may select weights that match their personal and professional perspective and values to create a unique cost surface and cost path!

M S U - N C R S T - S E P P M E M P H I S - I N - M A Y W O R K S H O P M a y 6 t h – 8 t h , 2 0 0 9 M e m p h i s - T N
UNDERSTANDING SPATIAL MULTI‐CRITERIA DECISION MAKINGan analytical demonstration of MCDM‐AHP and how to is used in GIS
Least‐Cost Path
Cumulative cost surface and the least‐cost path Least‐cost path visualized using Google Earth
M S U - N C R S T - S E P P M E M P H I S - I N - M A Y W O R K S H O P M a y 6 t h – 8 t h , 2 0 0 9 M e m p h i s - T N
UNDERSTANDING SPATIAL MULTI‐CRITERIA DECISION MAKINGan analytical demonstration of MCDM‐AHP and how to is used in GIS
SENSITIVE ANALYSIS USING MCDM

M S U - N C R S T - S E P P M E M P H I S - I N - M A Y W O R K S H O P M a y 6 t h – 8 t h , 2 0 0 9 M e m p h i s - T N
UNDERSTANDING SPATIAL MULTI‐CRITERIA DECISION MAKINGan analytical demonstration of MCDM‐AHP and how to is used in GIS
Putting together different scenarios
INPUT rankingsOUTPUT least‐cost path
Scenario 1 Scenario 2 Scenario 3

M S U - N C R S T - S E P P M E M P H I S - I N - M A Y W O R K S H O P M a y 6 t h – 8 t h , 2 0 0 9 M e m p h i s - T N
UNDERSTANDING SPATIAL MULTI‐CRITERIA DECISION MAKINGan analytical demonstration of MCDM‐AHP and how to is used in GIS
Results
Path 1 Path 2 Path 3

M S U - N C R S T - S E P P M E M P H I S - I N - M A Y W O R K S H O P M a y 6 t h – 8 t h , 2 0 0 9 M e m p h i s - T N
UNDERSTANDING SPATIAL MULTI‐CRITERIA DECISION MAKINGan analytical demonstration of MCDM‐AHP and how to is used in GIS
ADDING MORE FACTORS

M S U - N C R S T - S E P P M E M P H I S - I N - M A Y W O R K S H O P M a y 6 t h – 8 t h , 2 0 0 9 M e m p h i s - T N
UNDERSTANDING SPATIAL MULTI‐CRITERIA DECISION MAKINGan analytical demonstration of MCDM‐AHP and how to is used in GIS
FACTOR Ranking
MPO urban limits 9 criteria: dist from 0 – 7 Km
Wetlands 5avoidance
Forest 5avoidance
Agriculture 3High cost
Hydrography 2criteria: dist from 0 – 300 m
Roads 1Reuse existing roads
Slope 10‐ 20% , >20%
Increasing the complexity of the analysis
High weight for the avoidance areas
The system forces to follow existing roads away from avoid areas
Prefferentially don’t use prime ag fields nor intersect/follow streams/ponds
M S U - N C R S T - S E P P M E M P H I S - I N - M A Y W O R K S H O P M a y 6 t h – 8 t h , 2 0 0 9 M e m p h i s - T N
UNDERSTANDING SPATIAL MULTI‐CRITERIA DECISION MAKINGan analytical demonstration of MCDM‐AHP and how to is used in GIS
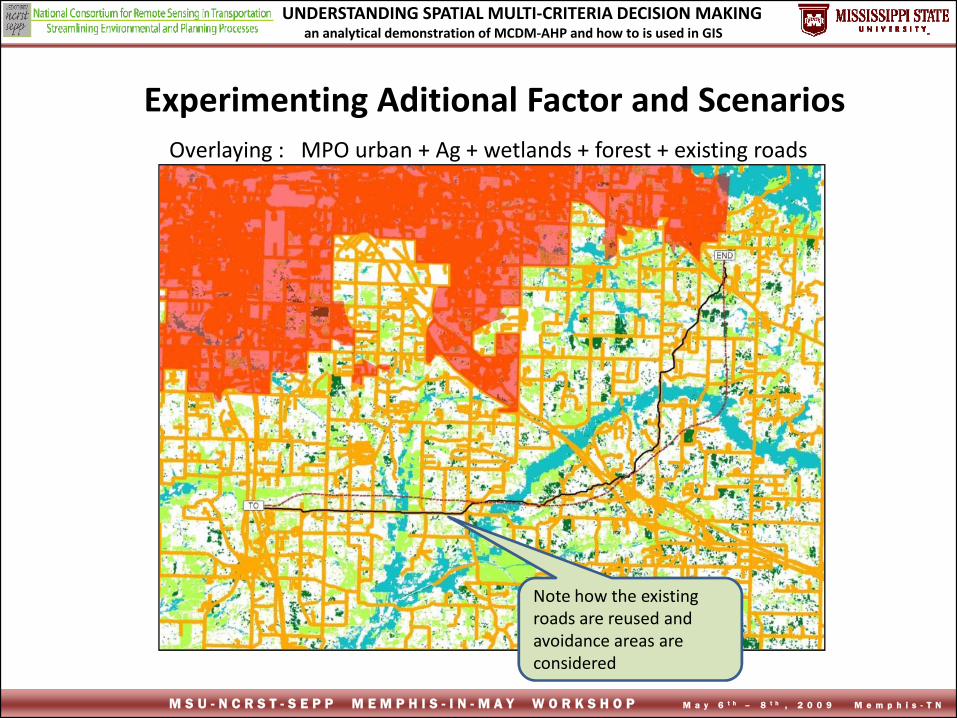
Experimenting Aditional Factor and ScenariosOverlaying : MPO urban + Ag + wetlands + forest + existing roads
Note how the existing roads are reused and avoidance areas are considered

M S U - N C R S T - S E P P M E M P H I S - I N - M A Y W O R K S H O P M a y 6 t h – 8 t h , 2 0 0 9 M e m p h i s - T N
UNDERSTANDING SPATIAL MULTI‐CRITERIA DECISION MAKINGan analytical demonstration of MCDM‐AHP and how to is used in GIS
• Feb 2009 ‐MSU Transportation WorkshopPoster presentation: NOBREGA et al. Environmental sensitive corridor planning using MCDM
• March 2009 – ASPRS Annual ConferencePaper/Oral presentation: SADASIVUNI et al. A transportation corridor case study for multi‐criteria decision analysis.
• April 2009 – Management of Environmental Qualify International JournalJournal paper (submitted): NOBREGA et al. Bridging decision making process and environmental needs in transportation corridor planning
• Journal papers in progress:MCDM and non‐traditional remote sensing data inputs (in collaboration with MTRI)
An innovative MCDM approach for corridor planning based on integrated multi‐scale data and AHP method
MCDM Research Results

M S U - N C R S T - S E P P M E M P H I S - I N - M A Y W O R K S H O P M a y 6 t h – 8 t h , 2 0 0 9 M e m p h i s - T N
UNDERSTANDING SPATIAL MULTI‐CRITERIA DECISION MAKINGan analytical demonstration of MCDM‐AHP and how to is used in GIS
That’s it!Next presentation: application & results