understanding soybean maturity groups in brazil...
TRANSCRIPT

CROP SCIENCE, VOL. 49, MAY–JUNE 2009 801
RESEARCH
Understanding and quantifying photoperiod × tempera-ture interactions often directly aff ects soybean [Glycine max
(L.) Merr.] breeders and producers when selecting varieties, deter-mining dates of planting, predicting dates of fl owering and matu-rity, and predicting fi nal yields (Zhang et al., 2001). Eff ect of the photoperiod response on area of adaptation is more pronounced in the soybean than in any other major crop. As soybean is classifi ed as a short-day plant, sensitivity to photoperiod is a hindering factor in increasing its adaptation range. When soybeans are cultivated under short-day conditions, in out-of-season plantings or in low latitude, those plants with the classic response to photoperiod fl ower early and result in short plants and low grain yields (Carpentieri-Pípolo et al., 2000). The length of the growing season for photoperiodic sensitive crops such as soybean is defi ned by complex interactions between temperature and photoperiod (Raper and Kramer, 1987).
Understanding Soybean Maturity Groups in Brazil:
Environment, Cultivar Classifi cation, and Stability
Luís Fernando Alliprandini,* Claudiomir Abatti, Paulo Fernando Bertagnolli, José Elzevir Cavassim, Howard Lewis Gabe, Andreomar Kurek, Marcos Norio Matsumoto, Marco
Antonio Rott de Oliveira, Carlos Pitol, Luís Cláudio Prado, and Cleiton Steckling
ABSTRACT
Maturity classifi cation is an important concept to
provide the best allocation of resources for soy-
bean [Glycine max (L.) Merr.] research and com-
mercialization. A similar maturity group system
used in North America is being used for some
seed companies in Brazil and needs research to
improve its use. This study evaluated the matu-
rity stability of 48 midwestern and 40 southern
Brazilian commercial cultivars ranging from
North American maturity groups VI to VIII at 15
locations. Relative maturity groups were attrib-
uted to all cultivars. All trials were planted in the
fi rst half of November. The effect of location was
very important in infl uencing the number of days
to maturity, number of days to fl owering and
reproductive growth period (RGP). The genotype
× environment interaction, although statistically
signifi cant, was much lower than the individual
effects of environment and genotype for all traits
and regions. Genotype × latitude and genotype
× altitude, considering also years of evaluation,
were generally low or nonsignifi cant. A recom-
mended list was developed of the most stable
genotypes and, consequently, of the most suit-
able check genotypes for each maturity group
classifi cation in the southern and midwestern
regions. Results indicate that the use in Brazil of
a maturity group system similar to that used in
North America to classify soybean genotypes is
an effi cient method for describing relative matu-
rity on a broad environmental basis.
L.F. Alliprandini, C. Abatti, J.E. Cavassim, and M.N. Matsumoto,
Monsanto do Brasil S.A., C. Postal 511, CEP 86600-000, Rolândia,
PR, Brazil; P.F. Bertagnolli, EMBRAPA, CNPT, C. Postal, 451, Passo
Fundo, RS, Brazil; H.L. Gabe, CEP 87014-380, Maringá, PR, Brazil;
A. Kurek, Syngenta Seeds, C. Postal 2, CEP 85825-000, Santa Ter-
eza do Oeste, PR, Brazil; M.A.R. de Oliveira, Coodetec, C. Postal
301, CEP 85.813-450, Cascavel, PR, Brazil; C. Pitol, Fundação MS,
C. Postal 105, CEP 79150-000, Maracajú, MS, Brazil; L.C. Prado, Pio-
neer Sementes, C. Postal 8283, CEP 73301-970, Brasília, DF, Brazil; C.
Steckling, Fundacep, C. Postal 10, CEP 98100-970, Cruz Alta, RS, Bra-
zil. Received 7 July 2008. *Corresponding author (luis.f.alliprandini@
monsanto.com).
Abbreviations: MG, maturity group; NDF, number of days to fl ow-
ering; NDM, number of days to maturity; RGP, reproductive growth
period; RM, relative maturity.
Published in Crop Sci. 49:801–808 (2009).doi: 10.2135/cropsci2008.07.0390© Crop Science Society of America677 S. Segoe Rd., Madison, WI 53711 USA
All rights reserved. No part of this periodical may be reproduced or transmitted in any form or by any means, electronic or mechanical, including photocopying, recording, or any information storage and retrieval system, without permission in writing from the publisher. Permission for printing and for reprinting the material contained herein has been obtained by the publisher.

802 WWW.CROPS.ORG CROP SCIENCE, VOL. 49, MAY–JUNE 2009
The development of elite Brazilian cultivars of diff er-ent maturities has long challenged breeders due the eff ects of large diff erences in latitude, climate, altitude, diversity of soil type, farming and planting practices, plant growth habit, presence or absence of the long-juvenile trait, dif-fering stress conditions, and diseases, resulting in large genotype × environment interactions (Alliprandini et al., 1993, 1994, 1998; Arantes and Souza, 1993; Rocha and Vello, 1999; Spehar, 1994; Vello et al., 1988).
As soybean breeding developed in the United States and Canada, it became a general practice to group soy-beans according to their photoperiod response and gen-eral area of adaptation. Thirteen maturity groups (MGs) are now recognized. They are designated by roman numerals, starting with “000’’ for the earliest maturity group adapted to the long days and short summers of southern Canada and northern United States, and ending with “X’’ for the latest maturity group, which is adapted to the short days of tropical regions on either side of the equator (Poehlman, 1987).
Relative maturity is a rating designed to account for all of the factors that aff ect maturity date and number of days from planting to maturity. These factors include variety, planting date, rainfall, latitude and disease. The MG is divided into tenths to get a relative maturity value. The method used to determine maturity is the 95% brown pods reading. According to Beuerlein et al. (1999), a variety with a relative maturity rating of 3.5 can reach the 95% brown pod stage 5 d later than a vari-ety with a rating of 3.0. Zhang et al. (2007) determined changes in U.S. cultivated materials regarding their maturity groups, and the latest groups are now cultivated on a limited basis. The classical approach to describe rel-ative maturity in Brazil has been the use of early, mid-, and full-season cultivars (EMBRAPA, 1998; Spehar, 1994). This method can describe relative maturity on a local basis, but it has not been successful in describing relative maturity over the wide range of environments and latitudes that occurs throughout the Brazilian soy-bean growing area.
The traditional Brazilian approach of classifying variet-ies as early, medium, and late, by region, is gradually being replaced as more and more private companies entering the commercial soybean market are using the North America system used by their parent companies (Monsoy, 1998a,b; Alliprandini et al., 2002; Prado et al., 2002; Fundação MT, 2003). Due to the large use of commercial U.S. germplasm, Argentina adopted this system earlier than Brazil, and groups II through VIII are grown throughout the country (Paschal et al., 2000). Monsanto was the fi rst company to introduce the concept of maturity groups in Brazil (Penariol, 2000). Despite this increase in the use of the U.S. maturity classifi -cation system by private companies in Brazil, however, lit-tle or no research has been published to validate its use and
to establish checks for improving the use of this approach under Brazilian conditions.
The objective of this study was to evaluate a collec-tion of Brazilian commercial cultivars, in a series of dif-ferent locations, and to attempt to classify their responses to diff erent latitudes and altitudes, as well as the genotype × environment interactions, utilizing a relative maturity group approach. This information will be useful in breed-ing research by providing a method for maturity classifi ca-tion of soybean materials that can become a standard for breeding lines in the entire Brazilian production system.
MATERIALS AND METHODSAs a starting point, the selection of the cultivars for this study was
based partly on previous knowledge, comparisons and discus-
sions of existing maturity groups, existing commercial cultivars,
and trial checks developed and/or used by Monsanto (Monsoy,
1998a,b), Syngenta Seeds Ltd. (Alliprandini et al., 2002), Pioneer
Seeds Ltd. (Prado et al., 2002), and FT Sementes ( J.L. Alberini,
personal communication, Naturalle, Ponta Grossa, PR, Brazil).
Other commercial materials were added by recommendation
of the participant companies. A total of 48 midwestern and 40
southern Brazilian commercial cultivars were planted in seven
southern and eight midwestern Brazilian locations (research sta-
tions) during the agricultural years of 2002–2003 and 2003–
2004. Morro Agudo is a transition region, and although it shown
as a midwestern location in Fig. 1, the tested cultivars were those
tested in the southern region. Five cultivars (ranging from matu-
rity groups VI to VIII) were common to all 15 diff erent locations
that represent the most important Brazilian soybean cultivated
areas. Locations were chosen also on the basis of their diversity
of latitude and altitude (Fig. 1). Each plot consisted of four rows,
5 m long, spaced 0.5 m apart, and 80 seeds were sown in each
row. Two replications were used in a randomized complete block
design. All trials were planted during the fi rst 2 wk of November
to eliminate the possible eff ect of the long juvenile trait in some
southern and midwestern cultivars (Toledo et al., 1993). Seed
source for each cultivar was the same for all trials, and fungicide
sprays of a triazol plus a strobirulin were applied at least twice to
prevent foliar disease eff ects on maturity. Data were collected
from the two center rows. Flowering dates were recorded when
50% of plants in a plot had open fl owers. Reproductive growth
period (RGP) was estimated by diff erence between number
of days to maturity (NDM) and number of days to fl owering
(NDF). Number of days to maturity was measured by counting
days from planting to the date when plants had 95% of their pods
dry (R8 on the scale of Fehr and Caviness, 1977). Analysis of
variance was performed using a mixed model for southern and
midwestern regions. The GLM procedure from SAS (SAS Inst.,
Cary, NC) was used because some locations as Morro Agudo
(southern cultivars) had one missing replication. For joint analy-
sis, both regions with fi ve cultivars, years, latitude, and altitude
were considered as a random eff ects and cultivars as a fi xed eff ect.
Stability parameters were determined using the Eberhart and
Russell (1966) model and were interpreted as described by Allip-
randini et al. (1998), where b values represent the response of the
cultivar to environmental changes, R2 indicates the predictabil-
ity of genotype across tested environments and s2d represents the

CROP SCIENCE, VOL. 49, MAY–JUNE 2009 WWW.CROPS.ORG 803
deviation from regression. Stabil-
ity was designated for materials
with high predictability and lower
environmental variance. A regres-
sion of NDM on assumed relative
maturity group was performed
using the most well known and
widely grown checks for each
maturity group. This regression
was used to calculate the maturity
group for all cultivars in southern
and midwestern regions.
RESULTS AND DISCUSSIONThe variance analysis in each region (Table 1) shows that the location and cultivars eff ects were signifi cant for NDM. Location accounted for 76% (midwestern), 91% (southern), and 62% (Brazil) of total variability for the trait in both regions, indicating the importance of that factor in the determination of maturity diff erences. Latitude and alti-tude were both signifi cant for all regions, indicating that the soybean maturity response was greatly aff ected by both. These results demon-strate that a good maturity group classifi cation should rely on data from trials grown in dif-ferent locations with a broad range of latitudes and altitudes that represent the adaptation region of the targeted lines and/or cultivars.
The year eff ect was signifi cant and rep-resented 11% of the variability for the mid-western region but was not signifi cant for the southern trials. A nonsignifi cant response was found for the fi ve tested cultivars common to both Brazilian regions. These results can be explained by the climate diff erences within the two regions. Such diff erences are greater in the midwestern region, which represents a larger crop area and with much divergence in farming practices, weather, type of soils, and rainfall pattern. The nonsignifi cance for the year eff ect in the joint analysis can be due to the fact of the fi ve common cultivars hav-ing lower relative maturities (up to RM 8.0) than most cultivars evaluated in the midwest-ern region. Thus, they would not be aff ected in a similar way by rainfall shortage or other environmental condition. Year × location was
Figure 1. The distribution of relative maturity groups for soybean cultivars in Brazil and localization
of trials for stability analyses, 2002–2003 and 2003–2004 seasons.
Table 1. Analysis of variance for number of days to maturity of commercial
cultivars in midwestern, southern, and combined midwestern and southern
regions in Brazil, 2002–2003 and 2003–2004.
SourceMidwestern Southern Combined
df Mean square df Mean square df Mean square
Year 1 2938* 1 419 1 391
Location (loc.) 7 20,368** 6 34,941** 14 4102**
Latitude (lat.) 5 6029** 4 32,811** 10 4435**
Altitude (alt.) 4 6090* 4 31,643** 5 2861*
Year × loc. 7 578** 6 1544** 14 153**
Year × lat. 5 447** 4 1981** 10 178**
Year × alt. 4 884** 4 1812** 5 263**
Rep (year × loc.) 16 6 13 3 29 4
Cultivar (cult.) 47 2996** 39 1227** 4 1893**
Cult. × year 47 18 39 18 4 20
Cult. × loc. 329 35** 234 22* 56 28*
Cult. × lat. 235 40** 156 21 40 37
Cult. × alt. 188 45** 156 28** 20 30*
Cult. × year × loc. 323 13** 231 13** 54 17**
Cult. × year × lat. 229 15** 156 10 40 16
Cult. × year × alt. 182 15** 156 19 20 12
Error 746 4 503 2 114 3
R2 0.99 0.99 0.99
CV 1.60 1.23 1.31
*Signifi cant at the 0.05 probability level.
**Signifi cant at the 0.01 probability level.

804 WWW.CROPS.ORG CROP SCIENCE, VOL. 49, MAY–JUNE 2009
signifi cant and ranged from 2 to 4%, indicating that year × location constitutes diff erent environments and as such can be used to evaluate genotypic maturity. Therefore it is important to note that the magnitude of the response to locations across the evaluated years was much less impor-tant than locations per se and that locations may substitute for years for the purpose of maturity classifi cation.
Cultivar eff ect was highly signifi cant and responsible for 11 and 3% of total variability accountable to midwest-ern and southern trials for NDM, respectively. When both regions were taken together, the fi ve tested cultivars represented about 29% of the total variation for the model. These diff erences can be explained by the divergence of tested environments that exposed the variability of the tested cultivars. It also indicates that this phenotypic vari-ability can be used to classify cultivars in diff erent relative maturity groups, as long as those cultivars are a repre-sentative sample of the maturities of all cultivars actually commercialized in Brazil.
The interaction of cultivar × location was also signifi -cant, suggesting that some of the genotypes evaluated had distinct maturity across environments. This interaction was signifi cant for all regions but accounted for just 0.1% (mid-western), 0.05% (southern), and 0.5% (Brazil) of total vari-ability for NDM. Despite the signifi cant response, the low
importance of this interaction suggests that well-conducted and well-distributed trials can lead to a satisfactory relative maturity group classifi cation once the majority of tested genotypes demonstrates a consistent maturity performance across diff erent environments (Tables 2 and 3). It is also important to note that although this interaction is small, it does exist and should be considered for regional evaluations to adequately attribute relative maturity groups to new cultivars. When partitioned between latitude and altitude, genotype × altitude interactions seem to be slightly more important than genotype × latitude, mainly for the south-ern region (Table 1). This result suggests that the evaluation of cultivars for determining maturity groups should con-sider locations both below and above 700 m altitude high for a precise evaluation. In Brazil, altitude is associated with diff erences in both temperatures and rainfall.
Figures 2, 3, and 4 show the variation of maturity for all cultivars, together with the latitude and altitude eff ect. Even with the interactions, the mean of all tested cultivars showed a similar response to the eff ects of latitude and alti-tude. There is an increase of days to maturity concomitant with the increment of latitude and altitude. The average diff erence of NDM of tested cultivars across environments ranged from 33 d for the midwestern to 39 for the southern and 49 for the combined areas. This response seemed to
Table 2. Number of days to fl owering (NDF), reproductive growth period (RGP), number of days to maturity (NDM), relative
maturity groups (MG), and stability parameters of southern Brazilian soybean cultivars.
Cultivar NDF RGP NDM MG† b‡ R2 s2d§ Cultivar NDF RGP NDM MG b R2 s2d
FT-Cometa 42 64 106 5.0 0.75** 0.97 4.5* BRS 184 53 70 123 6.7 1.01 0.98 5.0
NK8350 Spring¶ 42 66 108 5.2 0.79** 0.97 3.6 ns# RB603 49 75 124 6.8 1.05 0.98 3.7 ns
M-Soy 5942¶ 44 68 112 5.6 0.85** 0.95 8.8 CD208 53 71 124 6.8 1.09** 0.99 2.7 ns
NK412113¶ 45 69 114 5.8 0.85** 0.94 10.0 Embrapa 48 51 73 124 6.8 1.04 0.98 6.0
CD215 48 67 115 5.9 0.91* 0.97 6.3 CD206¶ 54 70 124 6.8 0.98 0.98 5.4
Fundacep 41 49 67 116 6.0 0.89 0.97 5.7 RB604 51 74 125 6.9 1.00 0.98 3.8*
CD207 53 64 117 6.1 0.95 0.98 4.7 Carrera¶ 57 69 126 7.0 1.07 0.99 3.8*
Ocepar-14 50 67 117 6.1 0.94 0.98 5.9 Embrapa 59 56 71 127 7.1 1.01 0.98 5.2
RB501 54 65 119 6.3 0.91* 0.97 6.5 KIS602 53 74 127 7.1 1.09 0.94 17.3
CD203 49 71 120 6.4 0.97 0.97 6.2 BRS 154 53 75 128 7.2 1.06 0.98 4.8
IAS-5¶ 49 71 120 6.4 0.96 0.97 6.4 Fundacep 38 52 76 128 7.2 1.20** 0.96 13.1
BR-16 50 70 120 6.4 1.00 0.92 18.4 BRS 133 60 70 130 7.4 1.12* 0.96 10.5
M-Soy 6101¶ 50 70 120 6.4 0.97 0.98 5.2 M-Soy 7501¶ 55 75 130 7.4 1.07 0.96 9.3
CD210 51 70 121 6.5 1.03 0.98 4.0* CD204 60 70 130 7.4 1.12* 0.97 7.9
CD202 52 69 121 6.5 1.02 0.98 3.8* CD209 54 77 131 7.5 1.09 0.94 16.5
BRS 183¶ 54 68 122 6.6 0.99 0.97 6.9 Fundacep 39 59 72 131 7.5 1.09 0.97 9.2
CD201¶ 51 71 122 6.6 1.04 0.97 7.6 BRS 134 56 76 132 7.6 1.06 0.97 7.2
RB502 52 70 122 6.6 0.92* 0.99 2.7 ns KIS702 57 76 133 7.7 0.76** 0.85 22.0
BRS137 51 71 122 6.6 0.90** 0.98 3.5 ns CD205 58 78 136 8.0 1.17** 0.98 5.6
RB605 50 73 123 6.7 0.99 0.98 5.3 M-Soy 8001¶ 58 79 137 8.1 1.22** 0.97 10.6
*Signifi cant at the 0.05 probability level.
**Signifi cant at the 0.01 probability level.†Estimated regression for relative maturity adjustment. Southern MG = 0.099 × NDM − 5.499 (R2 = 0.986).‡b of regression was tested by t test considering the hypothesis of b different from value 1.§Deviation from regression.¶Cultivars used as relative maturity groups standards and regression estimates.#ns, not signifi cant at 0.01 probability level.

CROP SCIENCE, VOL. 49, MAY–JUNE 2009 WWW.CROPS.ORG 805
be very clear for the midwestern area, but for the southern area and Brazil, the R2 value was not as high, showing the importance of choosing locations with diff erent latitudes and altitudes for good maturity group classifi cation. When we used only location × NDM, the regression (Table 2 and 3) was adjusted to the model and R2 values were very high, but when we used both latitude and altitude regressions in the same context with the same NDM scale (Fig. 2, 3, and 4), the model had lower values of R2, probably due to more complex interactions. More studies evaluating daylength and temperature eff ects and possible interactions with Bra-zilian germplasm can help to explain those results. Zhang et al. (2007) demonstrated the eff ect of latitude as a very important factor in adaptation of cultivars with regard to maturity groups in diff erent U.S. zones.
The three-way interaction cultivar × location × year (Table 1), although low, was signifi cant when year is included in the model and should be taken into account in maturity classifi cation trials. Again, latitude and altitude across years was nonsignifi cant for cultivar response in the southern area and in both areas with the fi ve control cultivars. The
midwestern region was again the exception. The range in latitude of this study can simulate diff erences in planting dates. Insertion of diff erent planting dates into the model introduces complexity and may produce diff erent results due to the presence of the Long Juvenile trait in most of the midwestern cultivars. This will require additional research. Low genotype × environment interactions were demon-strated by Tomkins and Shipe (1997) for Long Juvenile genotypes working with several traits evaluated between R1 and R8 for diff erent planting dates and years. Toledo et al. (1993), evaluating the growth of Brazilian determi-nate soybean genotypes, in three photoperiods, described November as the most desirable month for planting in Lon-drina, PR, Brazil.
Although these results indicate that experimentation with a great number of environments is probably not needed for relative maturity group classifi cation, the particular interactions between cultivars, planting dates, latitudes, and altitudes across years could constitute diff erent representa-tive environments and are an indication of a need for fur-ther research. Superior environments for testing purposes
Table 3. Number of days to fl owering (NDF), reproductive growth period (RGP), number of days to maturity (NDM), relative
maturity groups (MG) and stability parameters of midwestern Brazilian soybean cultivars.
Cultivar NDF RGP NDM MG† b‡ R2 s2d§ Cultivar NDF RGP NDM MG b R2 s2d
M-Soy 6101 48 60 108 7.2 0.72* 0.73 19.9 Monarca# 56 76 132 8.5 1.18** 0.98 3.5 ns
Emgopa-302 49 61 110 7.3 0.81* 0.87 10.1 FMT Mutum 60 73 133 8.6 0.83* 0.92 6.0 ns
Carrera¶ 53 60 113 7.5 0.92 0.87 13.5 FMT Xingú 64 70 134 8.6 0.97 0.93 7.3*
Emgopa-316 52 64 116 7.6 0.84* 0.90 8.4 UFV-18 62 73 135 8.7 1.22** 0.97 4.4 ns
CD205 50 67 117 7.7 0.87 0.87 11.8 FMT Perdiz 63 72 135 8.7 0.82 0.76 21.3
Splendor 54 64 118 7.7 0.84 0.87 11.0 Garantia 62 74 136 8.7 0.95 0.90 10.5
CD204 56 63 119 7.8 0.90 0.82 18.4 P98C81¶ 64 72 136 8.7 1.15* 0.97 4.2 ns
DM118 54 65 119 7.8 0.93 0.86 14.0 DM339 65 71 136 8.7 1.26** 0.95 9.5
M-Soy 8001¶ 52 69 121 7.9 1.02 0.94 6.3 ns# M-Soy 8866 66 71 137 8.8 1.12* 0.95 6.4*
Vencedora 55 67 122 8.0 0.89 0.91 8.4 DM Vitória 62 76 138 8.9 0.93 0.88 12.6
Conquista 55 69 124 8.1 1.03 0.93 8.6 BRS GOJatai 60 78 138 8.9 1.13 0.93 10.0
BRS GOGoiania 56 69 125 8.1 0.76** 0.84 11.2 DM309 63 75 138 8.9 1.15* 0.95 7.0*
FMT Cachara¶ 55 70 125 8.1 0.93 0.94 6.2 ns FMT Nambu¶ 62 77 139 8.9 1.04 0.95 6.5*
CD211 56 70 126 8.2 0.85* 0.92 6.3 ns FMT Tucano 64 76 140 9.0 1.08 0.94 8.3
FMT Tucunaré 57 69 126 8.2 0.93 0.95 4.7 ns FMT Kaiabi 63 77 140 9.0 1.02 0.96 3.9 ns
M-Soy 8326 58 69 127 8.2 0.96 0.95 5.5 ns M-Soy 8914 64 76 140 9.0 1.10 0.96 5.4 ns
Emgopa-315 60 68 128 8.3 0.76** 0.87 9.3 FMT Uirapuru¶ 65 75 140 9.0 1.08 0.97 3.7 ns
DM247¶ 59 70 129 8.4 0.95 0.96 4.4 ns Elite 65 76 141 9.0 1.20* 0.93 10.7
M-Soy 8411 61 68 129 8.4 1.06 0.96 4.6 ns FMT Maritaca 67 74 141 9.0 1.05 0.87 17.7
FMT Pintado 57 73 130 8.4 1.03 0.92 9.4 Emgopa-314 66 76 142 9.1 1.10 0.94 6.9*
M-Soy 8400¶ 58 72 130 8.4 1.04 0.97 3.7 ns M-Soy 9001 67 75 142 9.1 1.19* 0.92 13.0
A7002 56 76 132 8.5 1.11 0.91 12.3 DM Nobre 68 74 142 9.1 1.18 0.88 19.9
FMT Tabarana 58 74 132 8.5 0.97 0.84 18.6 Sambaíba¶ 65 80 145 9.3 1.09 0.90 14.0
LA Suprema 58 74 132 8.5 0.95 0.91 9.0 FMT Arara Azul 67 80 147 9.4 1.24* 0.89 20.5
*Signifi cant at the 0.05 probability level.
**Signifi cant at the 0.01 probability level.†Estimated regression for relative maturity adjustment. Midwestern MG = 0.056 × NDM + 1.117 (R2 = 0.992).‡b of regression was tested by t test considering the hypothesis of b different from value 1.§Deviation from regression.¶Cultivars used as relative maturity groups standards and regression estimates.#Not signifi cant at 0.01 probability level.

806 WWW.CROPS.ORG CROP SCIENCE, VOL. 49, MAY–JUNE 2009
need high correlations between the performance of a genotype relative to a test environment and its performance relative to the entire population of envi-ronments in which a selected genotype would be used (Allen et al., 1978).
Regression of number of days to maturity on the relative maturity of cultivars explained about 99% of the response over all environments. Using Bra-zilian maturity classifi cation, relative maturity in the south, started with group V, with FT Cometa being the earliest mate-rial (RM 5.0 and 106 d). Matu-rity Group VIII represented the latest maturity in the southern regional trial with M-Soy 8001 classifi ed as RM 8.1 with a mean of 137 d to maturity. The mid-western regional trial started in maturity group VII, with M-Soy 6101 the earliest mate-rial (RM 7.2 and 108 d) and Arara Azul the latest (RM 9.4 and 147 d). According to Paschal et al. (2000), cultivars ranging from North American MG V to VII account for approximately 56% of the planted soybean area in Brazil, mainly in the southern region, while MGs from VIII to IX account for 44% of the planted area in the midwestern region. Regressions successfully explained all the tested materi-als over the diff ering locations with values of R2 ranging from 0.85 to 0.99% for the southern area (Table 2) and 0.75 to 0.98% for the midwestern area (Table 3). These results indicate that almost all materials have excel-lent maturity stability and that data from maturity trials can be used for predicting phenology and culture management for other areas (Zhang et al., 2001; Yan and Rajcan, 2003).
The regression coeffi cients (b values) showed a tendency for Figure 4. Latitude and altitude regressions on number of days to maturity, combined regions,
Brazil, 2002–2003 and 2003–2004.
Figure 3. Latitude and altitude regressions on number of days to maturity, southern region, Brazil,
2002–2003 and 2003–2004.
Figure 2. Latitude and altitude regressions on number of days to maturity, midwestern region,
Brazil, 2002–2003 and 2003–2004.
CROP SCIENCE, VOL. 49, MAY–JUNE 2009 WWW.CROPS.ORG 807
responses under 1.0 for early materials (Table 2 and 3). This behavior indicates that most early materials, when compared with late ones, are more environmentally stable for matu-rity. FT-Cometa, NK Spring, CD211, and FMT Mutum showed b values much lower than 1.0, and considering also the calculated values for R2 and the deviation from regression (s2d), it is possible to classify them as less responsive, more predictable, and more environmentally stable than others in terms of their maturities. The b values of all genotypes and high values for R2 explain in part the genotype × loca-tion interaction presented in Table 1. The low magnitude of this interaction can be due to the fact that the majority of cultivars have coeffi cients near to 1.0 and similar responses across environments. When b values are near unity for the majority of genotypes, we can assume that materials with high values of R2 and low s2d, or low environmen-tal variance are quite predictable and less variable within and across locations, being also the most suitable for use as checks for relative maturity classifi cation. Following this concept, and the importance of having a range of RMs to build regressions to classify new genotypes, we can suggest as the most suitable checks for each maturity group the fol-lowing cultivars for the southern region: FT-Cometa (5.0), NK8350 Spring (5.2), CD215 (5.9), CD207 (6.0), CD210 (6.5), CD202 (6.5), RB502 (6.6), BRS 137 (6.6), CD208 (6.8), Carrera (7.0), BRS 154 (7.2), BRS 134 (7.6), and CD205 (8.0); and for the midwestern region: Emgopa-316 (7.6); M-Soy 8001 (7.9), FMT-Cachara (8.1), CD211 (8.2), FMT Tucunaré (8.2), M-Soy 8326 (8.2), DM247 (8.4), M-Soy 8400 (8.4), M-Soy 8411 (8.4), Monarca (8.5), FMT Mutum (8.6), UFV-18 (8.7), P98C81 (8.7), M-SOY 8866 (8.8), FMT-Nambú (8.9), FMT Kaiabi (9.0), M-Soy 8914 (9.0), FMT Uirapurú (9.0), and Emgopa-314 (9.1). The des-ignated relative maturity for most cultivars agrees closely with a previous Brazilian classifi cation made by companies that were using them as relative maturity checks, with a few examples where a much larger discrepancy was observed (Monsoy, 1998a,b; Alliprandini et al., 2002; Prado et al., 2002; Fundação MT, 2003). The main exception has been M-Soy 6101, previously classifi ed as group 6.1 (VI) by Monsoy (1998b), which was positioned as 6.4 (VI) in the southern region and as 7.2 (VII) in the midwestern region. This behavior has been confi rmed since this was the fi rst time that this material was tested for maturity simultane-ously in both regions (Penariol, 2000). Other cultivars that were also tested in both regions (Carrera, CD204, CD205, and M-Soy 8001), were classifi ed with almost the same rel-ative maturity, with a few minor diff erences between the southern and midwestern regions. This can be explained because these cultivars were planted in diff erent trials and the regressions that were used to classify their maturities were based on diff erent cultivars.
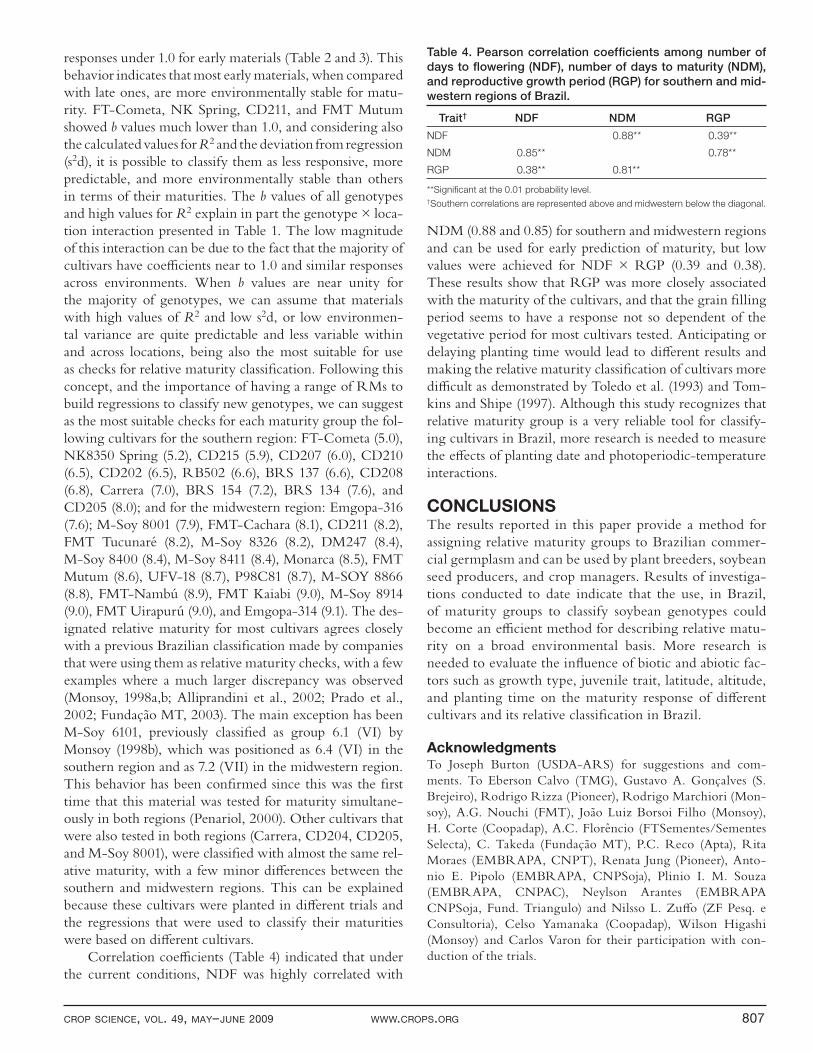
Correlation coeffi cients (Table 4) indicated that under the current conditions, NDF was highly correlated with
NDM (0.88 and 0.85) for southern and midwestern regions and can be used for early prediction of maturity, but low values were achieved for NDF × RGP (0.39 and 0.38). These results show that RGP was more closely associated with the maturity of the cultivars, and that the grain fi lling period seems to have a response not so dependent of the vegetative period for most cultivars tested. Anticipating or delaying planting time would lead to diff erent results and making the relative maturity classifi cation of cultivars more diffi cult as demonstrated by Toledo et al. (1993) and Tom-kins and Shipe (1997). Although this study recognizes that relative maturity group is a very reliable tool for classify-ing cultivars in Brazil, more research is needed to measure the eff ects of planting date and photoperiodic-temperature interactions.
CONCLUSIONSThe results reported in this paper provide a method for assigning relative maturity groups to Brazilian commer-cial germplasm and can be used by plant breeders, soybean seed producers, and crop managers. Results of investiga-tions conducted to date indicate that the use, in Brazil, of maturity groups to classify soybean genotypes could become an effi cient method for describing relative matu-rity on a broad environmental basis. More research is needed to evaluate the infl uence of biotic and abiotic fac-tors such as growth type, juvenile trait, latitude, altitude, and planting time on the maturity response of diff erent cultivars and its relative classifi cation in Brazil.
AcknowledgmentsTo Joseph Burton (USDA-ARS) for suggestions and com-
ments. To Eberson Calvo (TMG), Gustavo A. Gonçalves (S.
Brejeiro), Rodrigo Rizza (Pioneer), Rodrigo Marchiori (Mon-
soy), A.G. Nouchi (FMT), João Luiz Borsoi Filho (Monsoy),
H. Corte (Coopadap), A.C. Florêncio (FTSementes/Sementes
Selecta), C. Takeda (Fundação MT), P.C. Reco (Apta), Rita
Moraes (EMBRAPA, CNPT), Renata Jung (Pioneer), Anto-
nio E. Pipolo (EMBRAPA, CNPSoja), Plinio I. M. Souza
(EMBRAPA, CNPAC), Neylson Arantes (EMBRAPA
CNPSoja, Fund. Triangulo) and Nilsso L. Zuff o (ZF Pesq. e
Consultoria), Celso Yamanaka (Coopadap), Wilson Higashi
(Monsoy) and Carlos Varon for their participation with con-
duction of the trials.
Table 4. Pearson correlation coeffi cients among number of
days to fl owering (NDF), number of days to maturity (NDM),
and reproductive growth period (RGP) for southern and mid-
western regions of Brazil.
Trait† NDF NDM RGP
NDF 0.88** 0.39**
NDM 0.85** 0.78**
RGP 0.38** 0.81**
**Signifi cant at the 0.01 probability level.†Southern correlations are represented above and midwestern below the diagonal.

808 WWW.CROPS.ORG CROP SCIENCE, VOL. 49, MAY–JUNE 2009
Dedication (in memoriam)This paper is dedicated to João Luiz Alberini, M.Sc., for his
friendship, great contribution to the maturity group classifi ca-
tion and soybean breeding in Brazil.
ReferencesAllen, F.L., R.E. Comstock, and D.C. Rasmusson. 1978. Optimal
environments for yield testing. Crop Sci. 18:747–751.
Alliprandini, L.F., J.F.F. Toledo, N.S. Fonseca, Jr., R.A.S. Kiihl,
and L.A. Almeida. 1993. Genetic gain of soybean in the Paraná
State, Brazil, in the period of 1985/86 through 1989/90,
obtained by breeding. (In Portuguese, with English abstract.)
Pesqui. Agropecuária Brasileira 28:489–497.
Alliprandini, L.F., J.F.F. Toledo, N.S. Fonseca, Jr., L.A. Almeida,
and R.A.S. Kiihl. 1994. Eff ects of genotype × environment
interaction on soybean yield in Paraná State, Brazil. (In Por-
tuguese, with English abstract.) Pesqui. Agropecu. Brasileira
29:433–444.
Alliprandini, L.F., J.F.F. Toledo, N.S. Fonseca, Jr., L.A. Almeida,
and R.A.S. Kiihl. 1998. Stability and adaptability analysis of
soybean grown in Paraná State. (In Portuguese, with English
abstract.) Pesqui. Agropecu. Bras. 33:1321–1328.
Alliprandini, L.F., A. Krenski, and H.L. Gabe. 2002. Spring: Um
cultivar de super-precoce para o sul do Brasil. (Abstract.) p.
57. In EMBRAPA (ed.) Reunião de soja da Região Central
do Brasil, 24. EMBRAPA, São Pedro, Brazil.
Arantes, N.E., and P.I.M. Souza. 1993. Cultura da Soja nos Cer-
rados. Potafós. Piracicaba, Brazil.
Beuerlein, J.E., S. St. Martin, A. Dorrence, and C.D.K. Van Diest.
1999. Ohio performance trials 1999. Information Ext. Res.
Series 212. Ohio State Univ., Columbus.
Carpentieri-Pípolo, V., L.A. Almeida, R.A.S. Kiihl, and C.A.
Rosolem. 2000. Inheritance of long juvenile period under
short day conditions for the BR80-6778 soybean (Glycine max
(L.) Merrill) line. Euphytica 112:203–209.
Eberhart, S.A., and W.A. Russell. 1966. Stability parameters for
comparing varieties. Crop Sci. 6:36–40.
EMBRAPA. 1998. Cultivares. p. 66–78. In EMBRAPA (ed.)
Recomendações técnicas para a cultura da soja na região cen-
tral do Brasil. EMBRAPA, Londrina, Brazil.
Fehr, W.R., and C.E. Caviness. 1977. Stages of soybean develop-
ment. Spec. Rep. 80. Iowa State Univ., Ames.
Fundação MT. 2003. Cultivares. p. 27–111. In Fundação MT. (ed.)
Boletim de Pesquisa de Soja, 7. Rondonópolis, MT, Brazil.
Monsoy. 1998a. Guia Técnico de Cultivares de Soja: Região dos
Cerrados. Kugler Artes Gráfi cas, Castro, PR, Brazil.
Monsoy. 1998b. Guia Técnico de Cultivares de Soja: Região Sul.
Kugler Artes Gráfi cas, Castro, PR, Brazil.
Paschal, H., G. Berger, and C. Nari. 2000. Soybean breeding in
South America. p. 11–18. In American Seed Trade Association
Conf., 30th. ASTA, Chicago, IL.
Penariol, A. 2000. Soja: Cultivares no lugar certo. Informações
Agronômicas 90:13–14.
Poehlman, J.M. 1987. Breeding soybeans. p. 421–450. In J.M.
Poehlman (ed.) Breeding fi eld crops. 3rd ed. Van Nostrand
Reinhold, New York.
Prado, L.C., L.A. Oliveira, R. Jung, R.F. Paula, E.O. Melo, and P.S.
Cardoso. 2002. 98N41: Comportamento, descrição e indicação
de cultivo para os estados de Goiás e Distrito Federal. (Abstract.)
p. 90. In EMBRAPA (ed.) Reunião de soja da Região Central
do Brasil, 24. EMBRAPA, São Pedro, Brazil.
Raper, C.D., and P.J. Kramer. 1987. Stress physiology. p. 589–641.
In J.R. Wilcox (ed.) Soybeans: Improvement, production, and
uses. 2nd ed. ASA, CSSA, and SSSA. Madison, WI.
Rocha, M.M., and N.A. Vello. 1999. Genotype–location inter-
action for seed yield in soybean lines with diff erent matu-
rity cycles. (In Portuguese, with English abstract.) Bragantia
58:69–81.
Spehar, C.R. 1994. Breeding soybeans to the low latitudes of Brazil-
ian Cerrados (savannahs). Pesqui. Agropecu. Bras. 8:1167–1180.
Toledo, J.F.F., M.F. Oliveira, A.C. Tsutida, and R.A.S. Kiihl. 1993.
Genetic analysis of growth of determinate soybean genotypes
under three photoperiods. Braz. J. Genet. 16:713–748.
Tomkins, J.P., and E.R. Shipe. 1997. Environmental adaptation
of long-juvenile soybean cultivars and elite strains. Agron. J.
89:257–262.
Vello, N.A., D.M. Hiromoto, and J.B.V. Azevedo Filho. 1988.
Coeffi cient of parentage and breeding of Brazilian soybean
germplasm. Braz. J. Genet. 11:679–697.
Yan, W., and I. Rajcan. 2003. Prediction of cultivar performance
based on single- versus multiple-year tests in soybean. Crop
Sci. 43:549–555.
Zhang, L., R. Wang, and J.D. Hesketh. 2001. Eff ects of photo-
period on growth and development of soybean fl oral bud in
diff erent maturity. Agron. J. 93:944–948.
Zhang, L.X., S. Kyei-Boahen, J. Zhang, M.H. Zhang, T.B. Free-
land, C.E. Watson, Jr., and X.M. Liu. 2007. Modifi cations of
optimum adaptation zones for soybean maturity groups in the
USA. Crop Manage. doi:10.1094/CM-2007-0927-01-RS.