understanding software cohesion metrics:experimental assessment of conceptual cohesion
TRANSCRIPT
Tese de Doutorado
Bruno Carreiro da Silva
03 de Agosto de 2015, Sala 12, Instituto de Matemática - UFBA
Orientador: Prof. Dr. Cláudio Sant’AnnaCo-orientadora: Prof. Dra. Christina Chavez
Understanding Software Cohesion Metrics:Experimental Assessment of Conceptual Cohesion
Programa Multiinstitucional de Pós-Graduação em Ciência da Computação
2
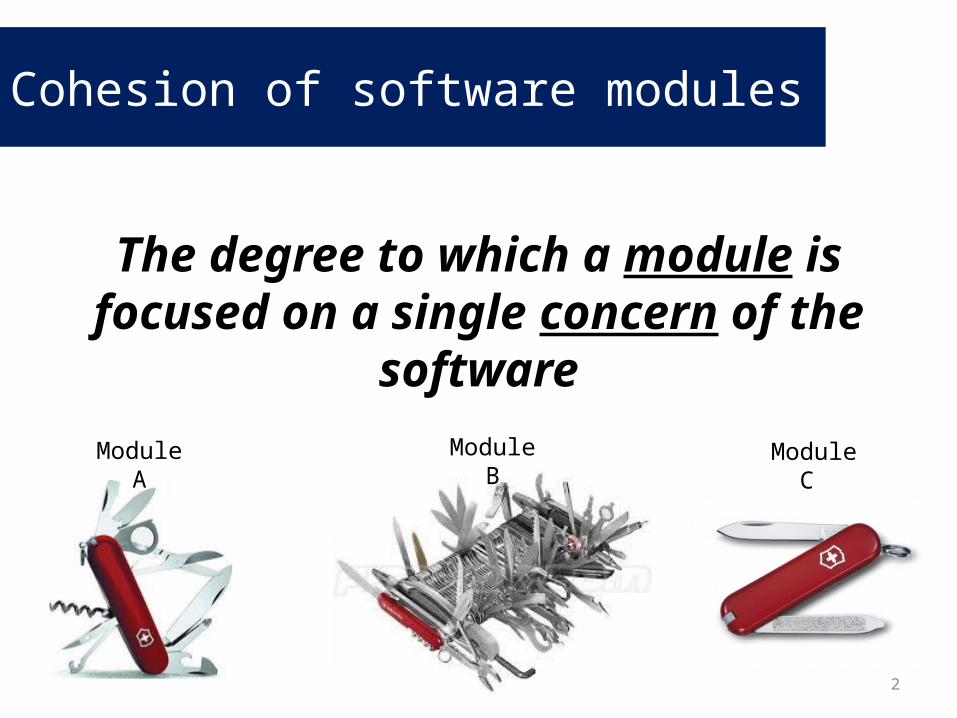
The degree to which a module is focused on a single concern of the software
Module A Module B Module C
Cohesion of software modules
3
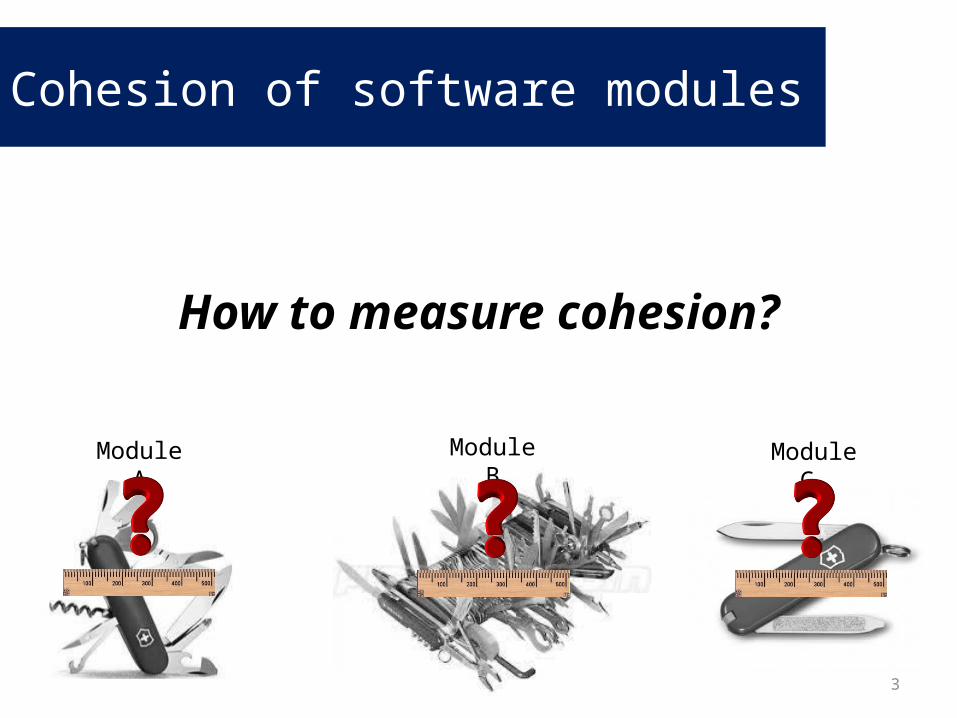
How to measure cohesion?
Module A Module B Module C
Cohesion of software modules
4
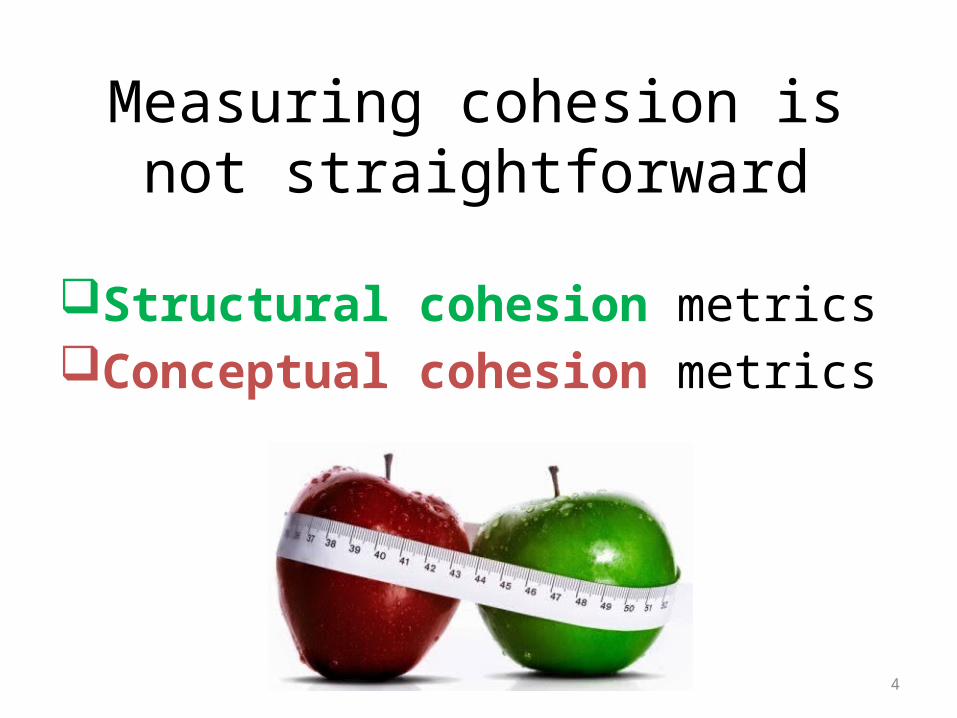
Measuring cohesion is not straightforward
Structural cohesion metricsConceptual cohesion metrics
5
6
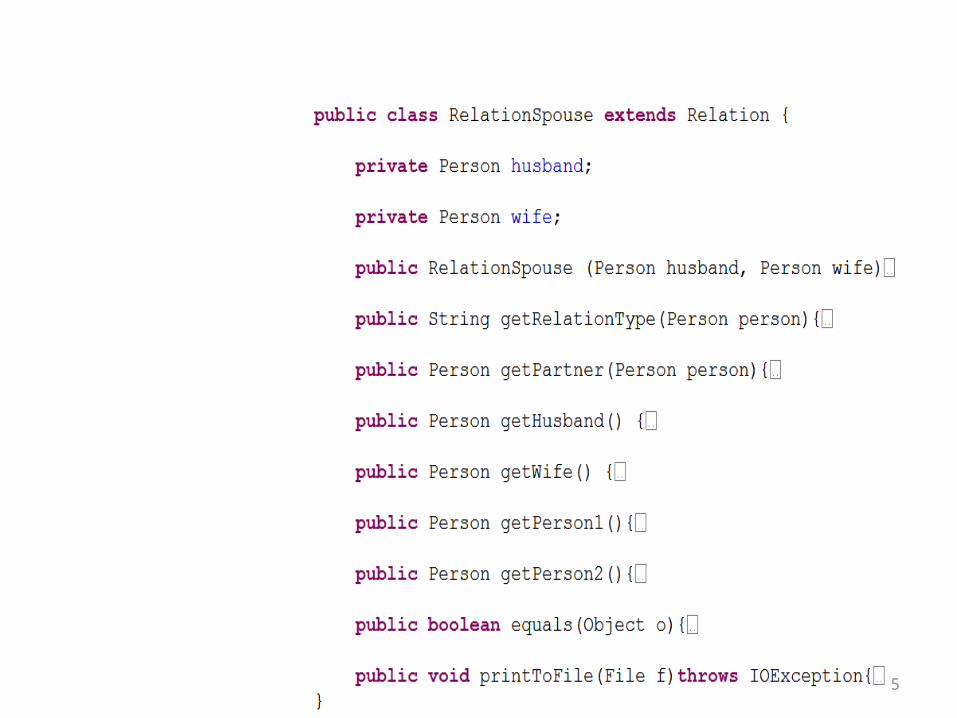
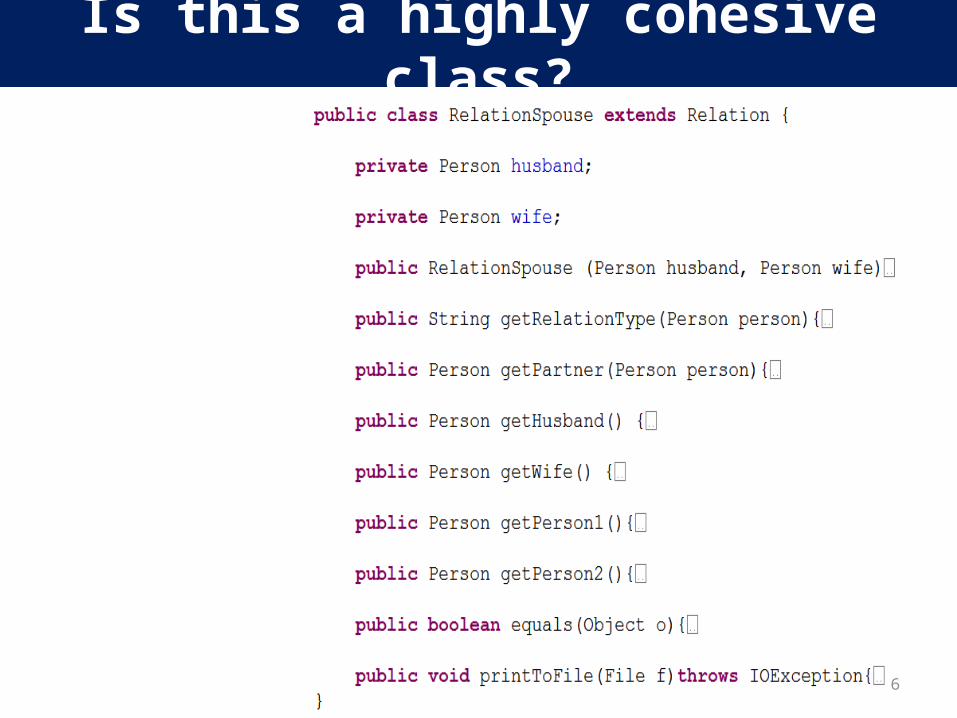
Is this a highly cohesive class?
7
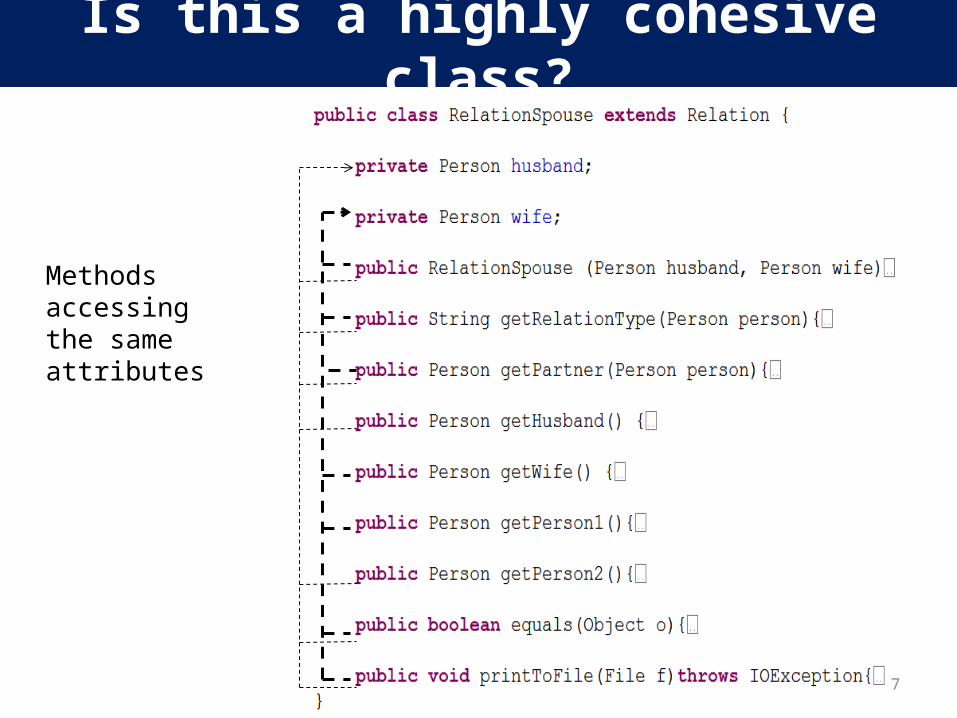
Methods accessing the same attributes
Is this a highly cohesive class?
8
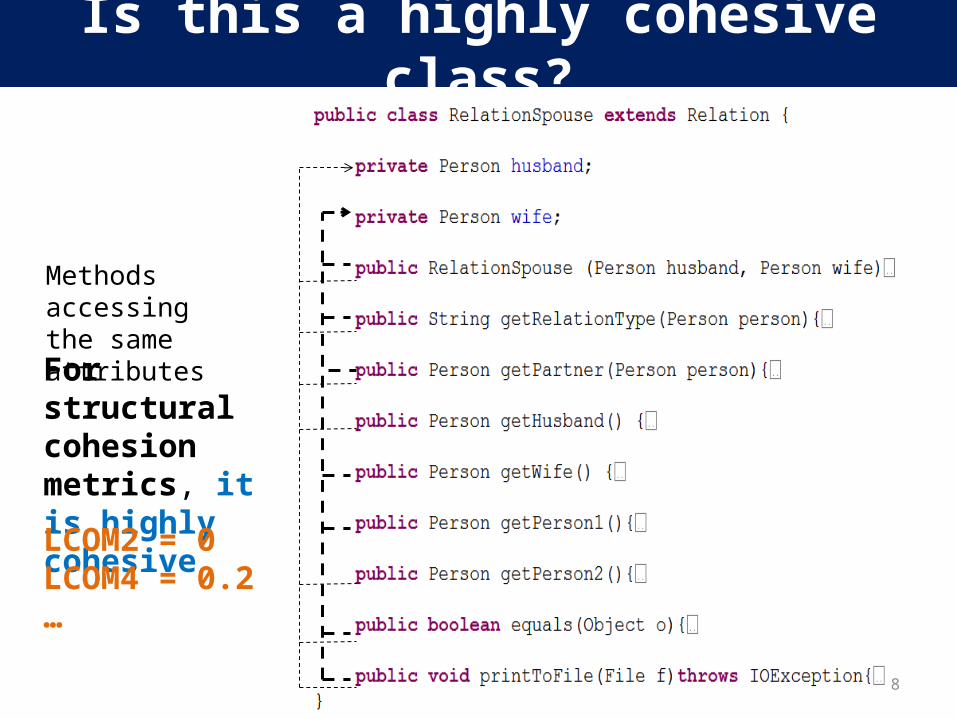
Methods accessing the same attributes
For structural cohesion metrics, it is highly cohesive
LCOM2 = 0LCOM4 = 0.2 …
Is this a highly cohesive class?
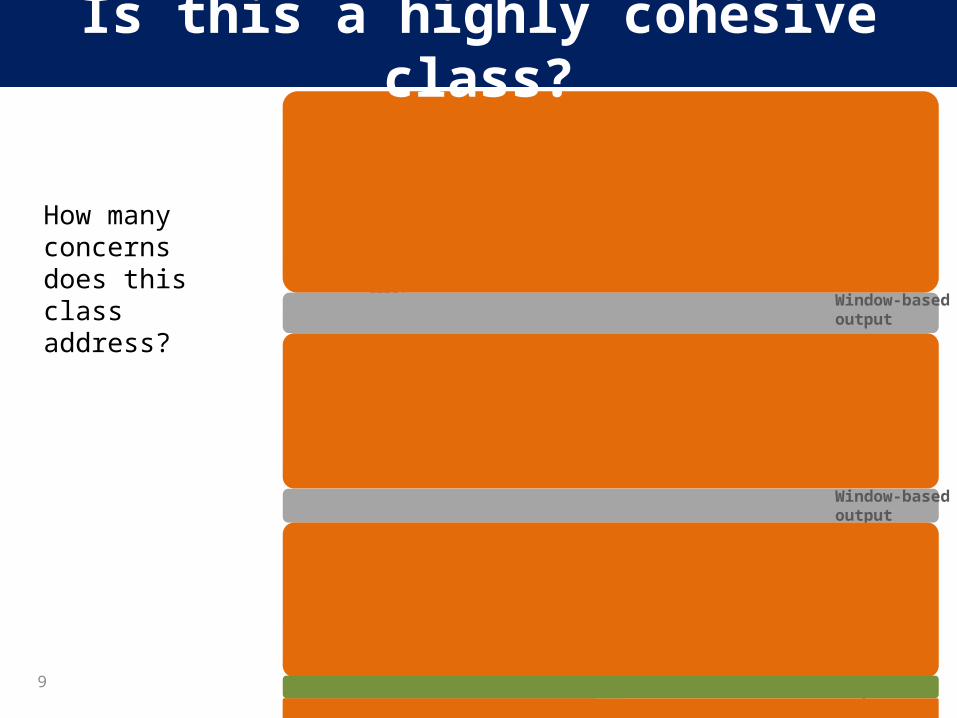
9
How many concerns does this class address?
Export to file
Window-based output
Window-based output
Is this a highly cohesive class?
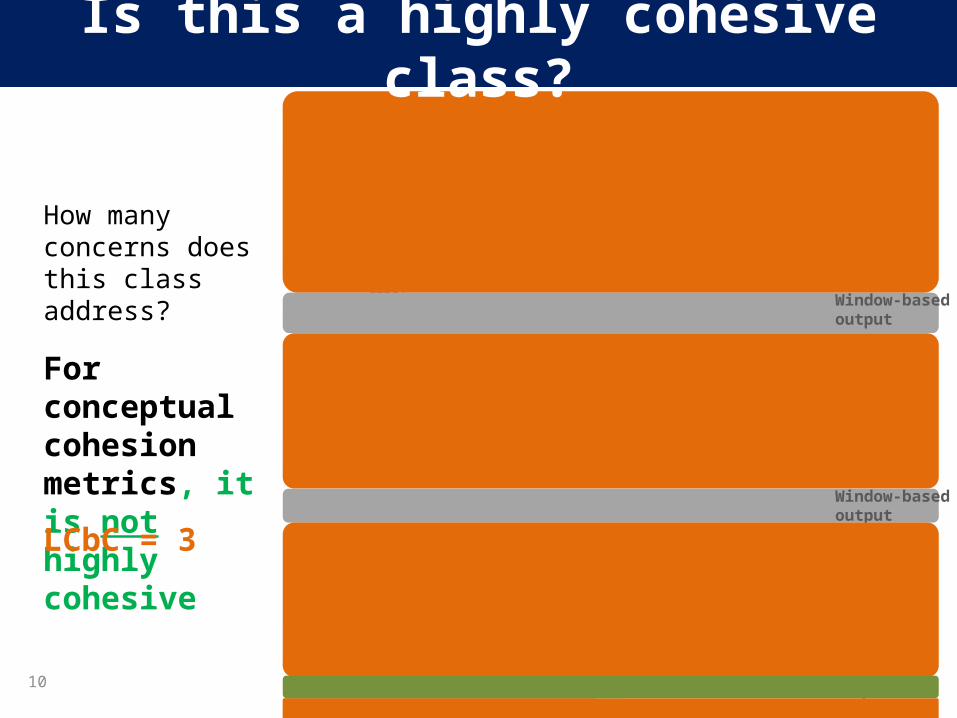
For conceptual cohesion metrics, it is not highly cohesive
How many concerns does this class address?
Export to file
Window-based output
Window-based output
10
LCbC = 3
Is this a highly cohesive class?

11
Concern Mapping
Concerns(Source)
CodeElements(Target)
concern 1 concern 2 concern 3

12
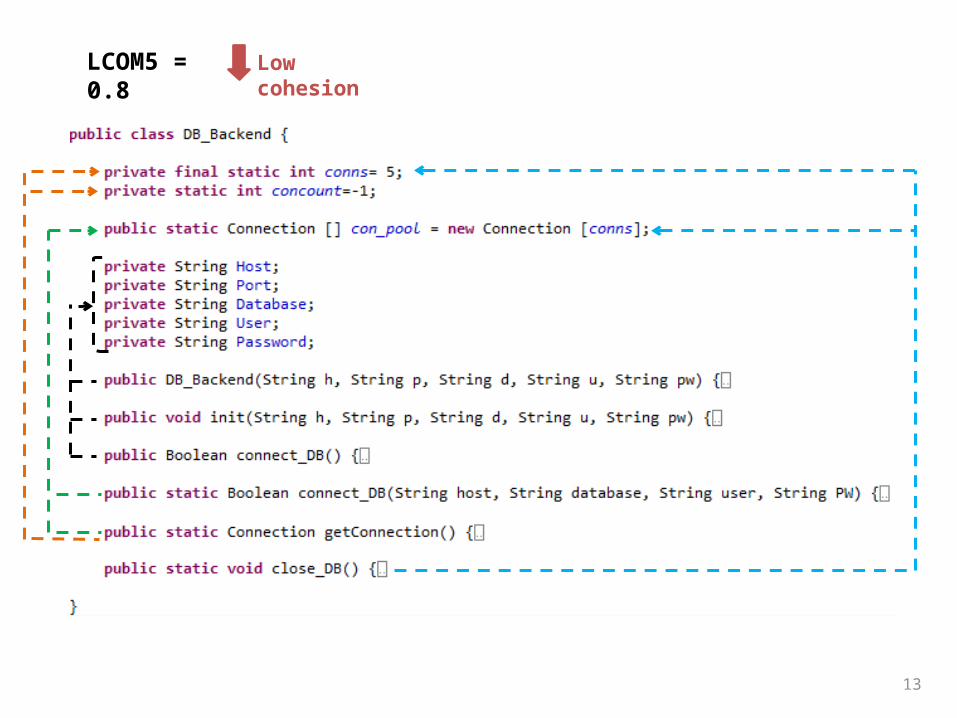
13
LCOM5 = 0.8 Low cohesion
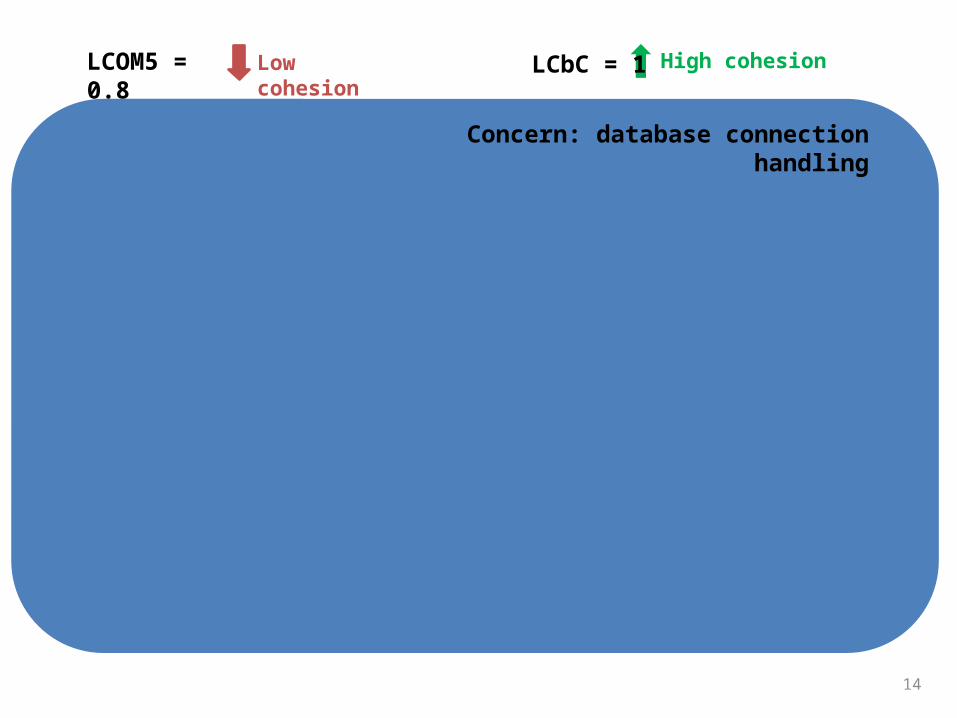
14
High cohesionLCbC = 1
Concern: database connection handling
LCOM5 = 0.8 Low cohesion
15
Overarching Question
What does explain conceptual cohesion as a different way of
cohesion measurement in contrast to conventional structural cohesion?
16
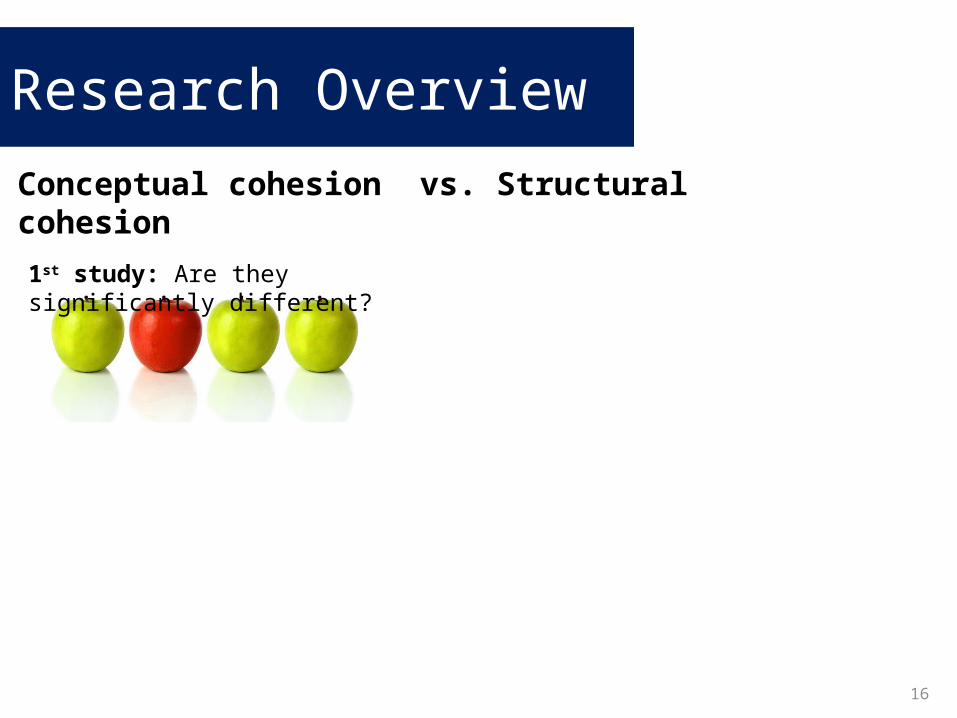
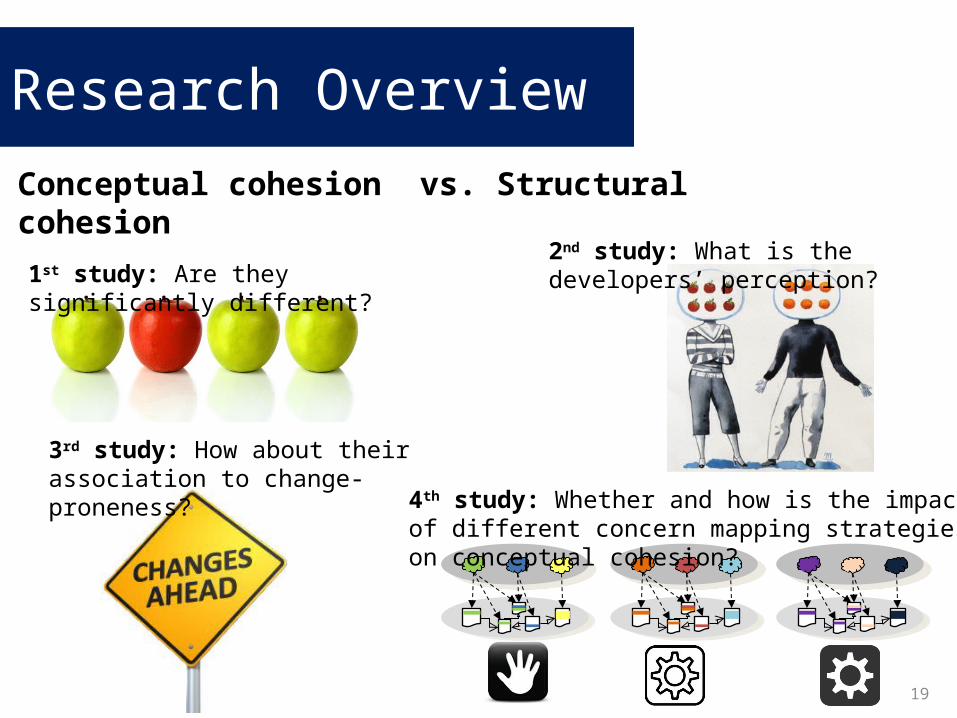
Conceptual cohesion vs. Structural cohesion
1st study: Are they significantly different?
Research Overview
17
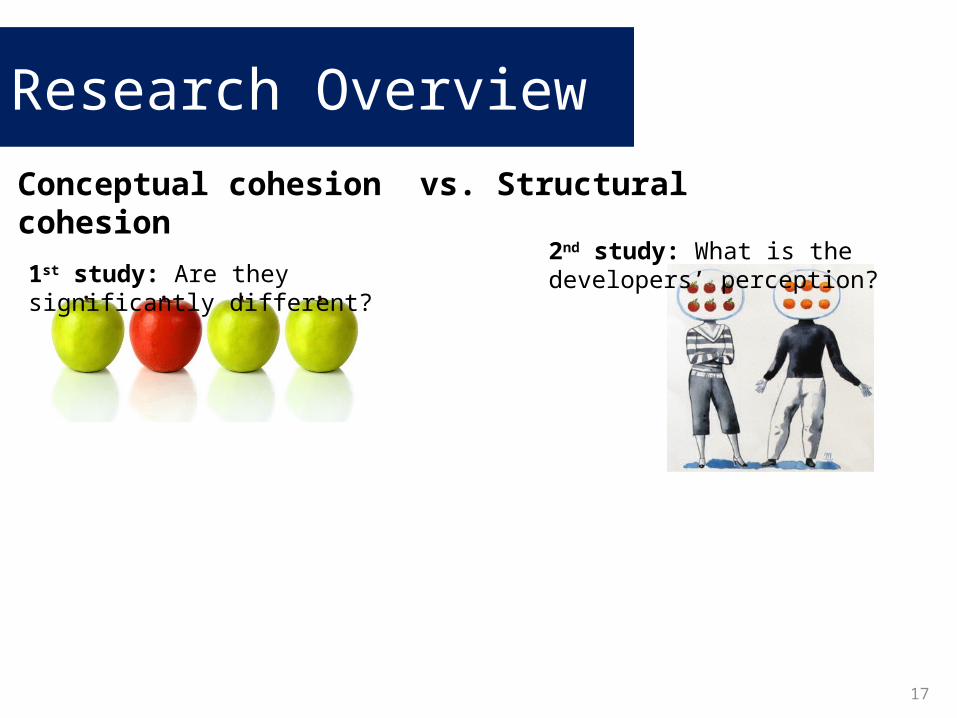
Conceptual cohesion vs. Structural cohesion
2nd study: What is the developers’ perception?1st study: Are they significantly different?
Research Overview
18
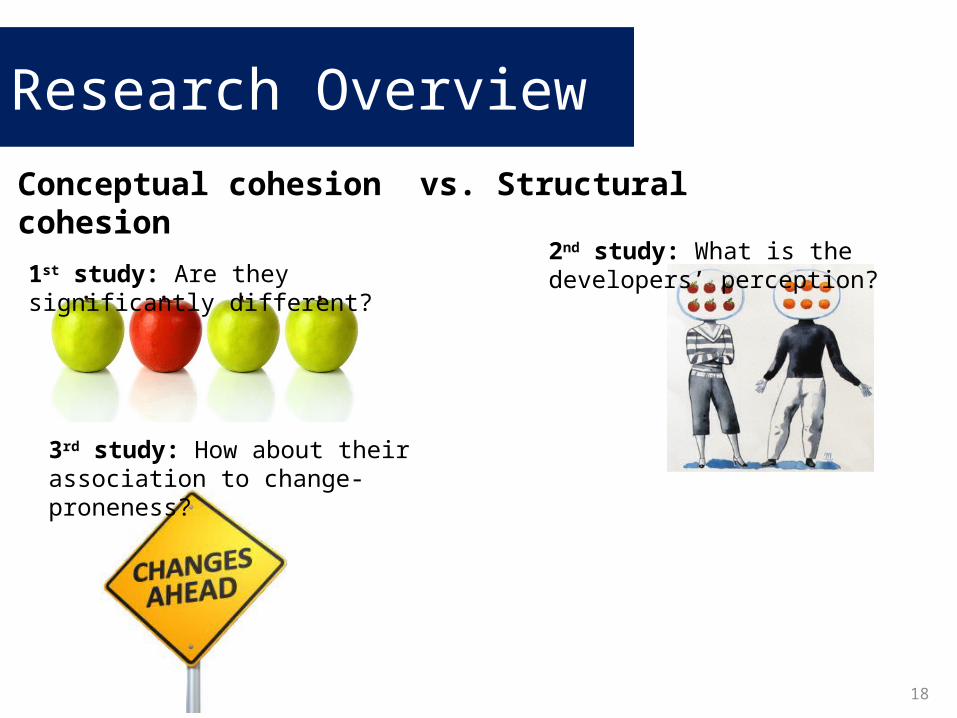
Conceptual cohesion vs. Structural cohesion
3rd study: How about their association to change-proneness?
1st study: Are they significantly different?2nd study: What is the developers’ perception?
Research Overview
19
Conceptual cohesion vs. Structural cohesion
4th study: Whether and how is the impact of different concern mapping strategies on conceptual cohesion?
1st study: Are they significantly different?2nd study: What is the developers’ perception?
3rd study: How about their association to change-proneness?
Research Overview
20
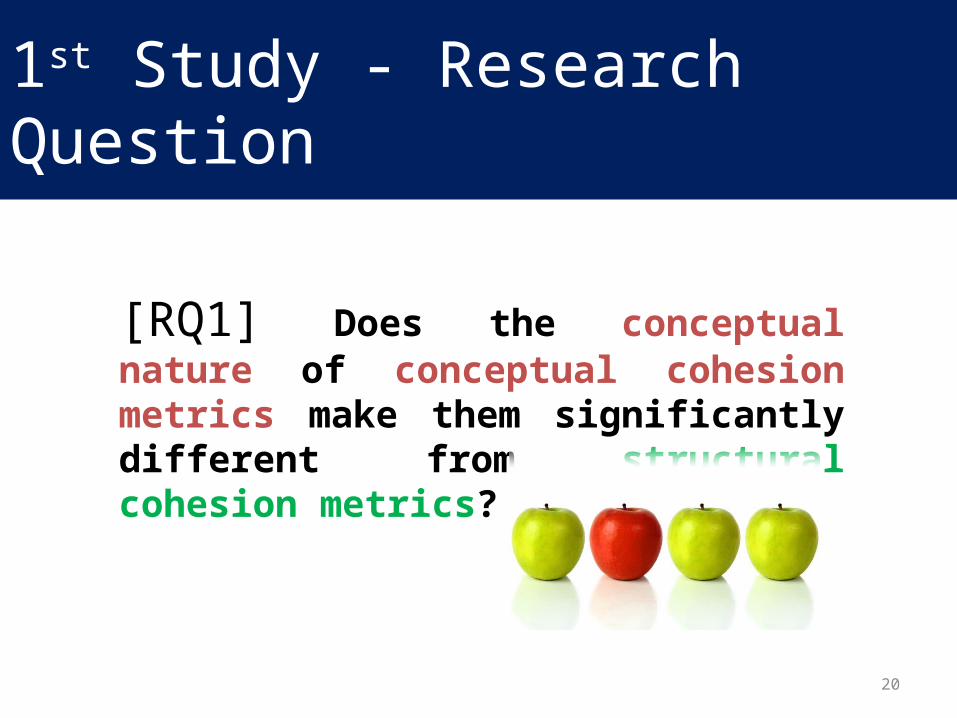
1st Study - Research Question
[RQ1] Does the conceptual nature of conceptual cohesion metrics make them significantly different from structural cohesion metrics?
21
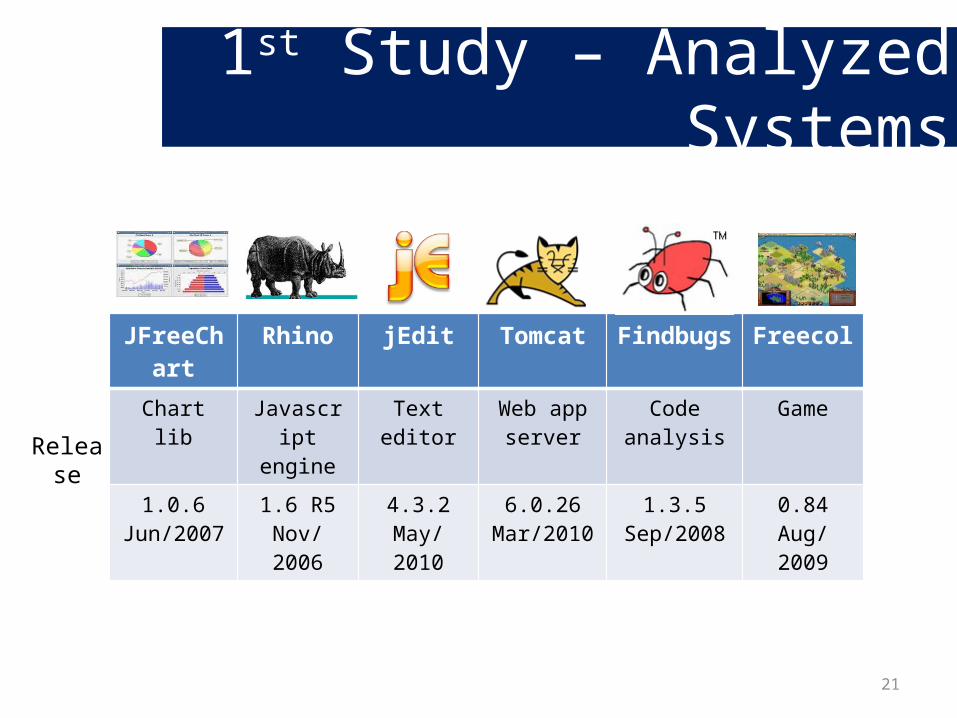
JFreeChart Rhino jEdit Tomcat Findbugs Freecol
Chart lib Javascript engine
Text editor Web app server
Code analysis Game
1.0.6Jun/2007
1.6 R5Nov/2006
4.3.2May/2010
6.0.26Mar/2010
1.3.5Sep/2008
0.84Aug/2009Release
1st Study – Analyzed Systems
22
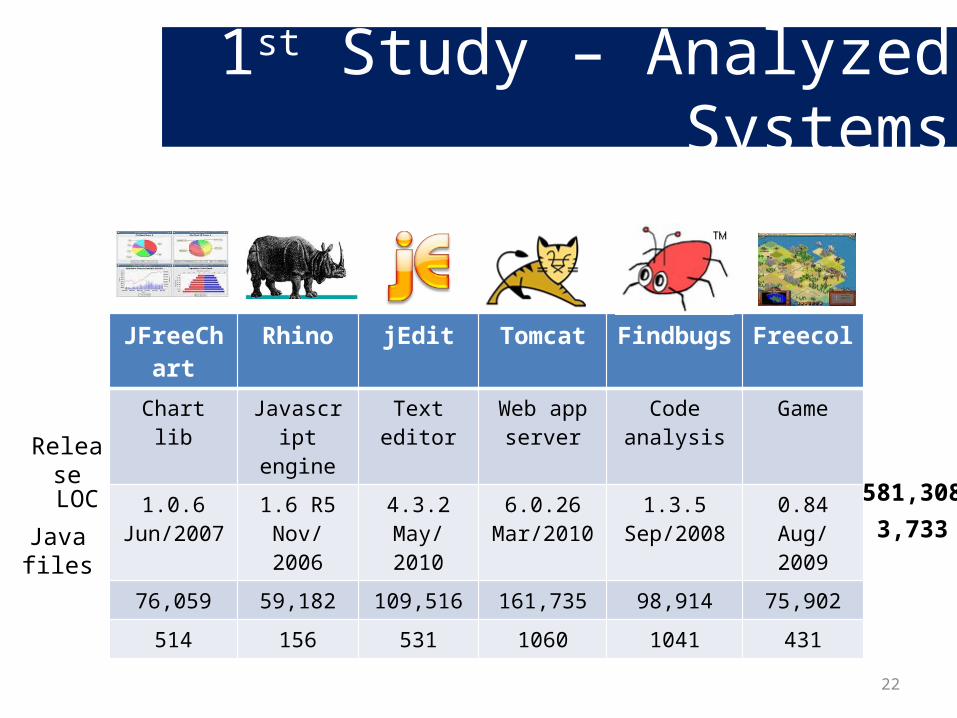
JFreeChart Rhino jEdit Tomcat Findbugs Freecol
Chart lib Javascript engine
Text editor Web app server
Code analysis Game
1.0.6Jun/2007
1.6 R5Nov/2006
4.3.2May/2010
6.0.26Mar/2010
1.3.5Sep/2008
0.84Aug/2009
76,059 59,182 109,516 161,735 98,914 75,902
514 156 531 1060 1041 431
Release
LOC
Java files
581,308
3,733
1st Study – Analyzed Systems

23
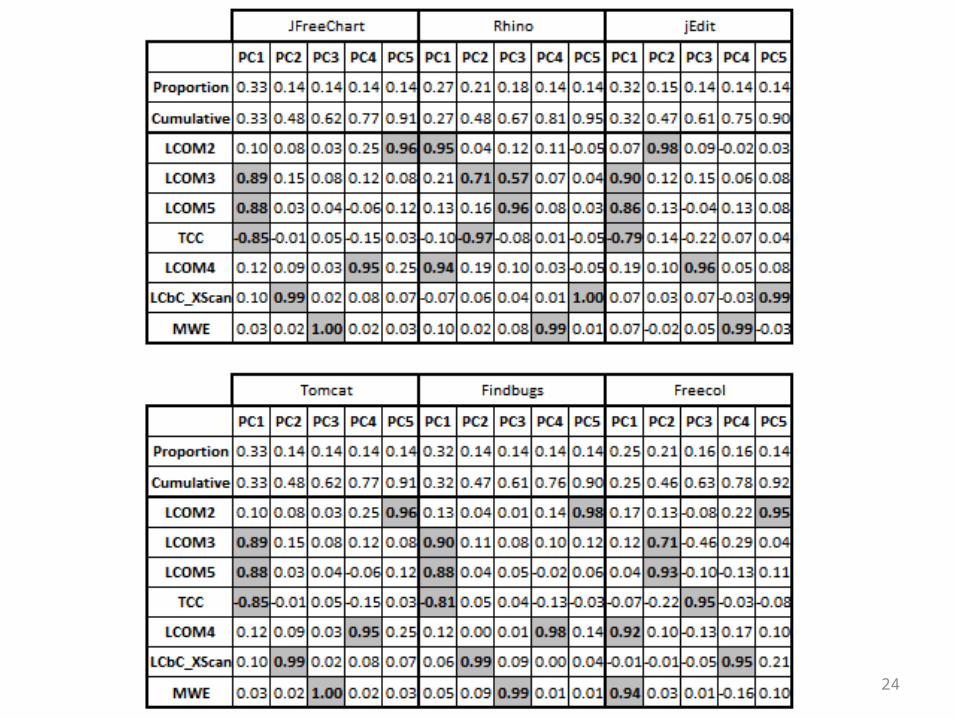
1st Study – Method
7 cohesion measurementsfor each Java module of each system PCA (Principal
Component Analysis)LCOM2, LCOM3,
LCOM4, LCOM5, TCC
MWE, LCbCXScan
24
25
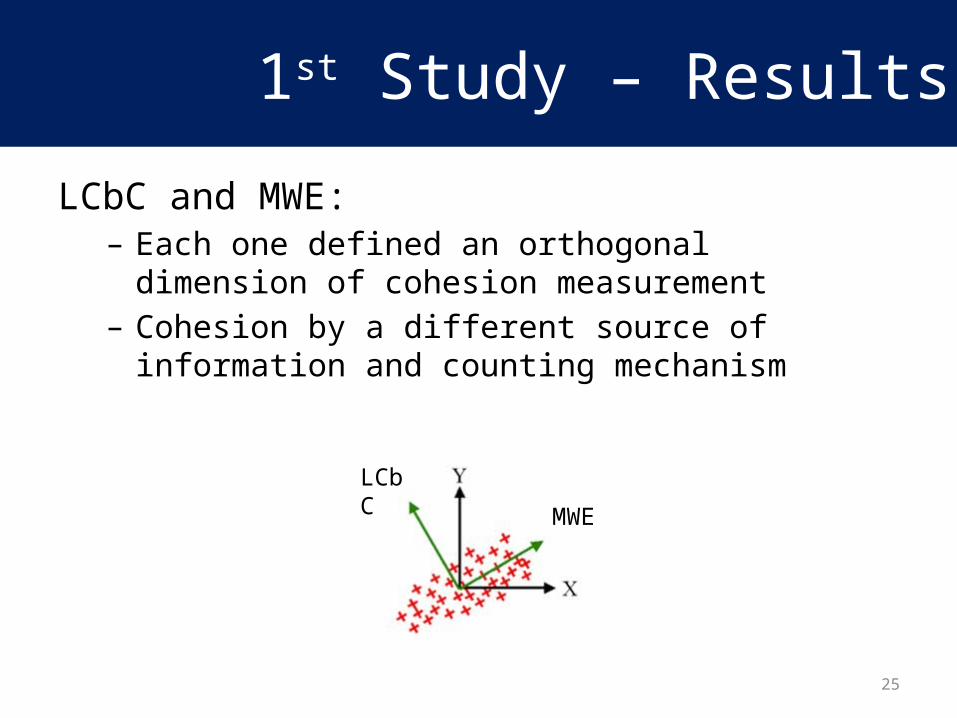
LCbC
MWE
LCbC and MWE: – Each one defined an orthogonal dimension of cohesion
measurement– Cohesion by a different source of information and counting
mechanism
1st Study – Results
26
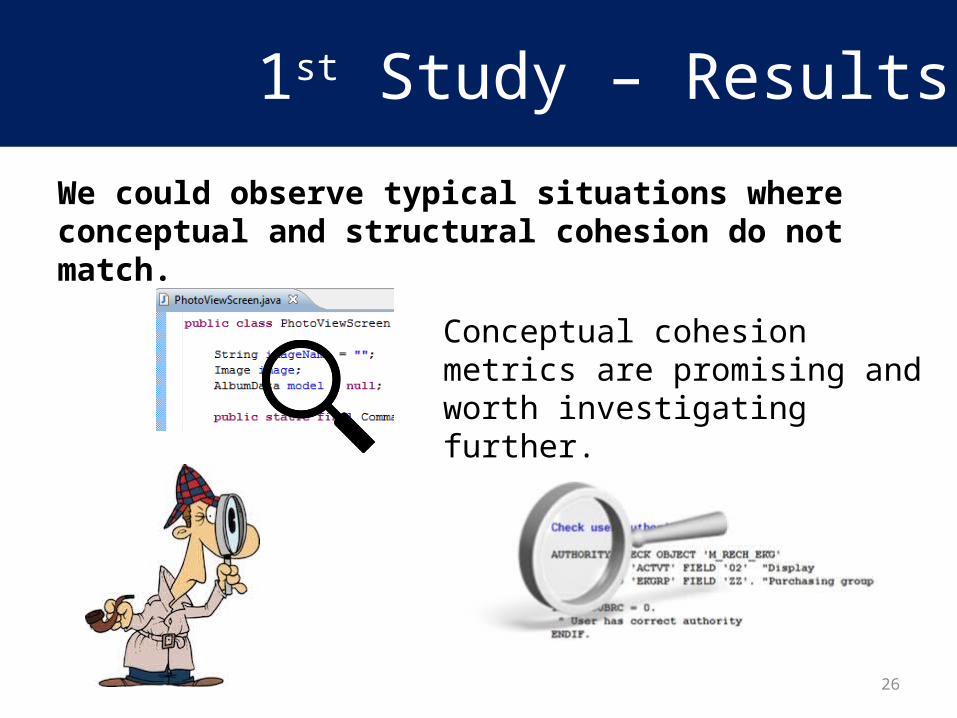
1st Study – Results
We could observe typical situations where conceptual and structural cohesion do not match.
Conceptual cohesion metrics are promising and worth investigating further.
27
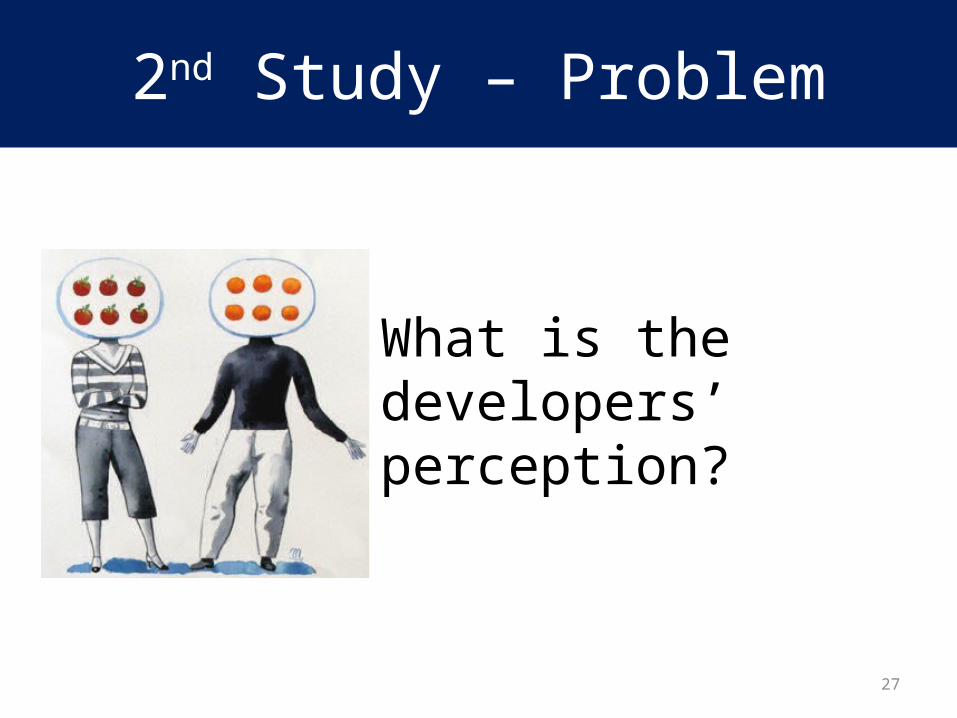
2nd Study – Problem
What is the developers’ perception?

28
[RQ2] How do developers perceive module cohesion? And how do they reason about it?
[RQ3] To what extent do structural cohesion and conceptual cohesion measurements relate with how developers rate cohesion of modules?
2nd Study - Research Questions
29
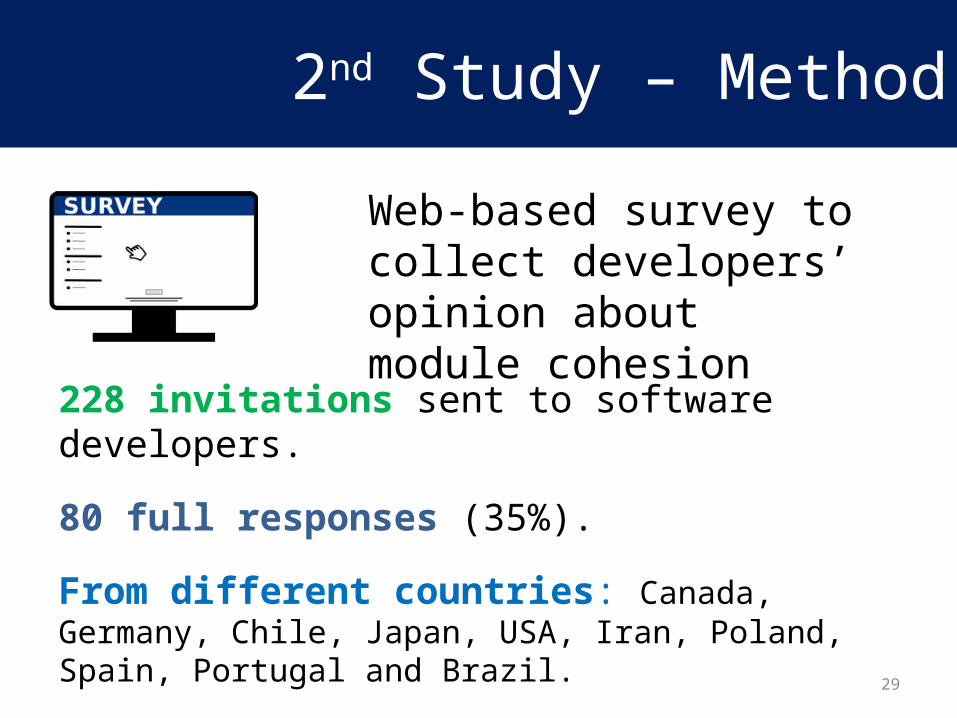
2nd Study – Method
Web-based survey to collect developers’ opinion about module cohesion
228 invitations sent to software developers.
80 full responses (35%).
From different countries: Canada, Germany, Chile, Japan, USA, Iran, Poland, Spain, Portugal and Brazil.
30
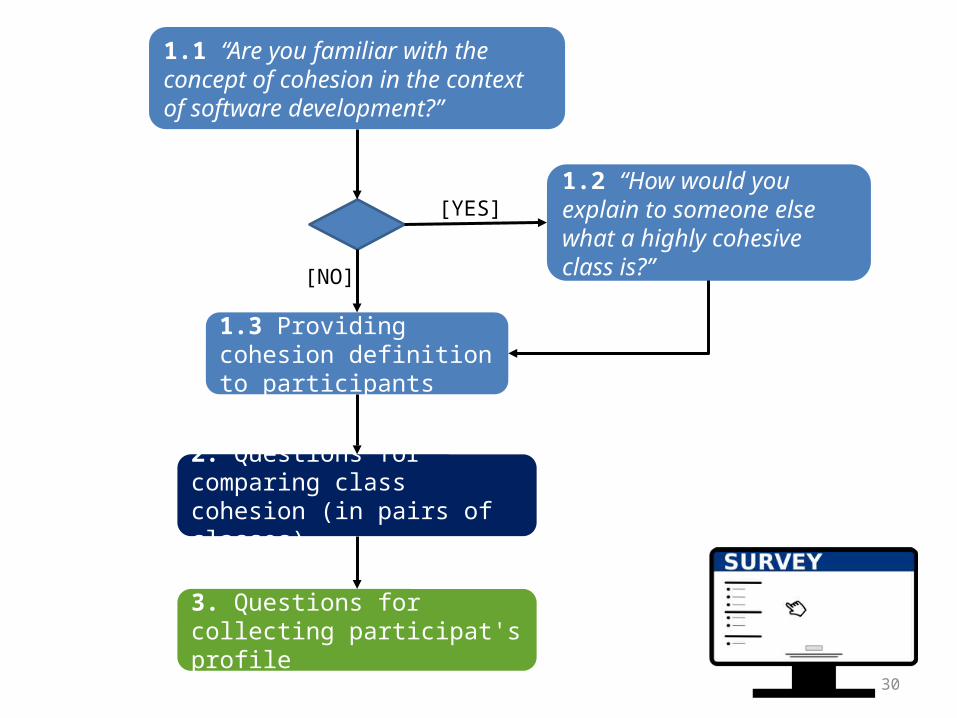
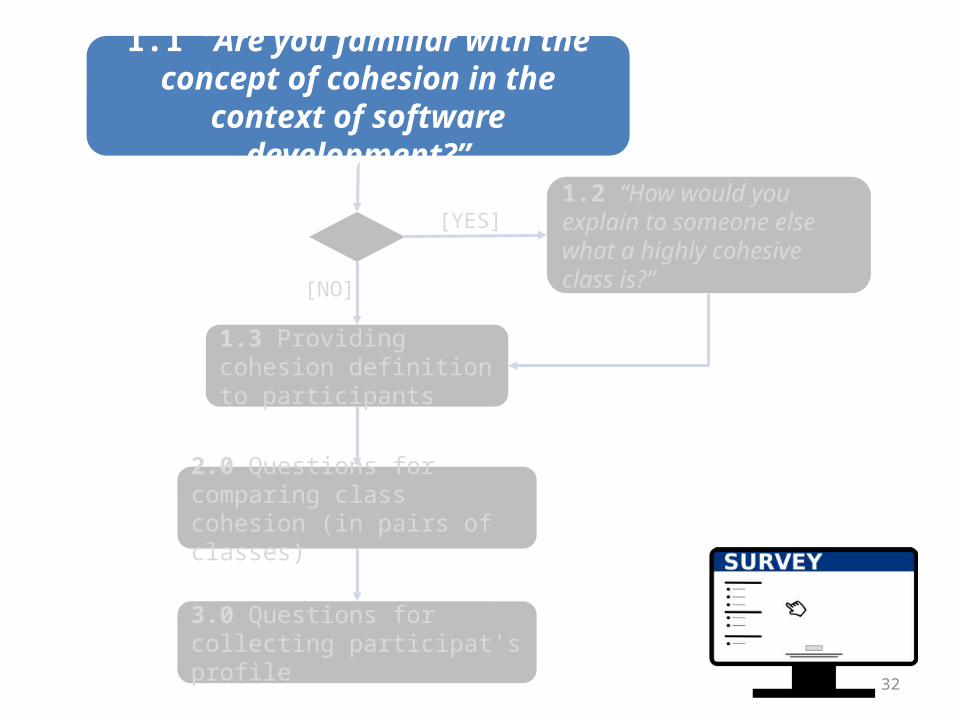
1.1 “Are you familiar with the concept of cohesion in the context of software development?”
1.2 “How would you explain to someone else what a highly cohesive class is?”
1.3 Providing cohesion definition to participants
[YES]
[NO]
2. Questions for comparing class cohesion (in pairs of classes)
3. Questions for collecting participat's profile
31
32
1.1 “Are you familiar with the concept of cohesion in the context of software
development?”
1.2 “How would you explain to someone else what a highly cohesive class is?”
1.3 Providing cohesion definition to participants
[YES]
[NO]
2.0 Questions for comparing class cohesion (in pairs of classes)
3.0 Questions for collecting participat's profile
33
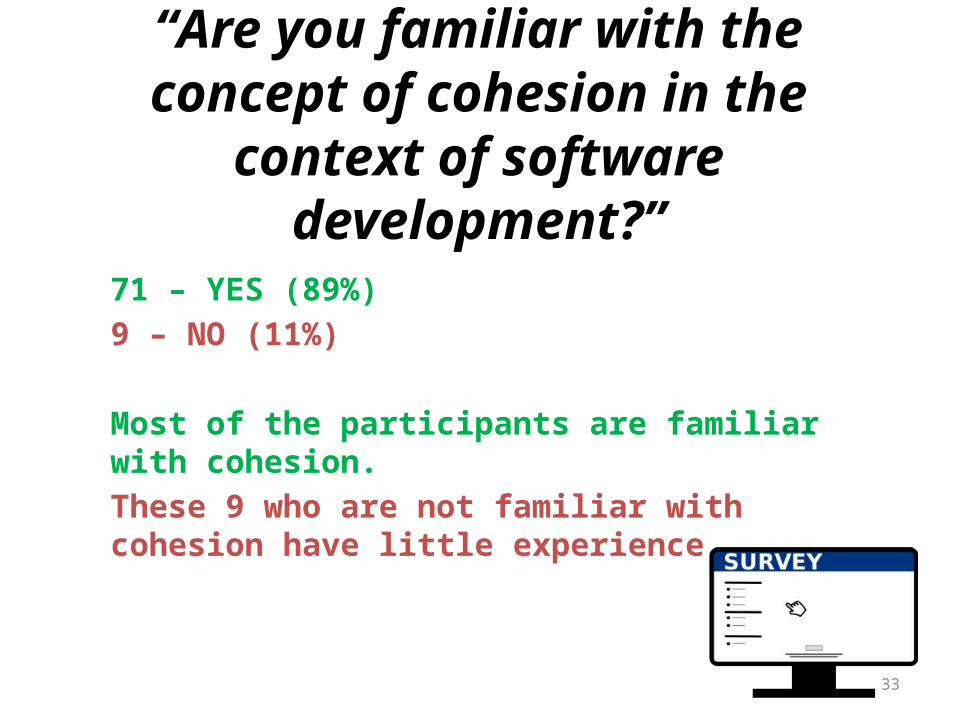
“Are you familiar with the concept of cohesion in the context of software
development?”
71 – YES (89%)9 – NO (11%)
Most of the participants are familiar with cohesion. These 9 who are not familiar with cohesion have little experience.
34
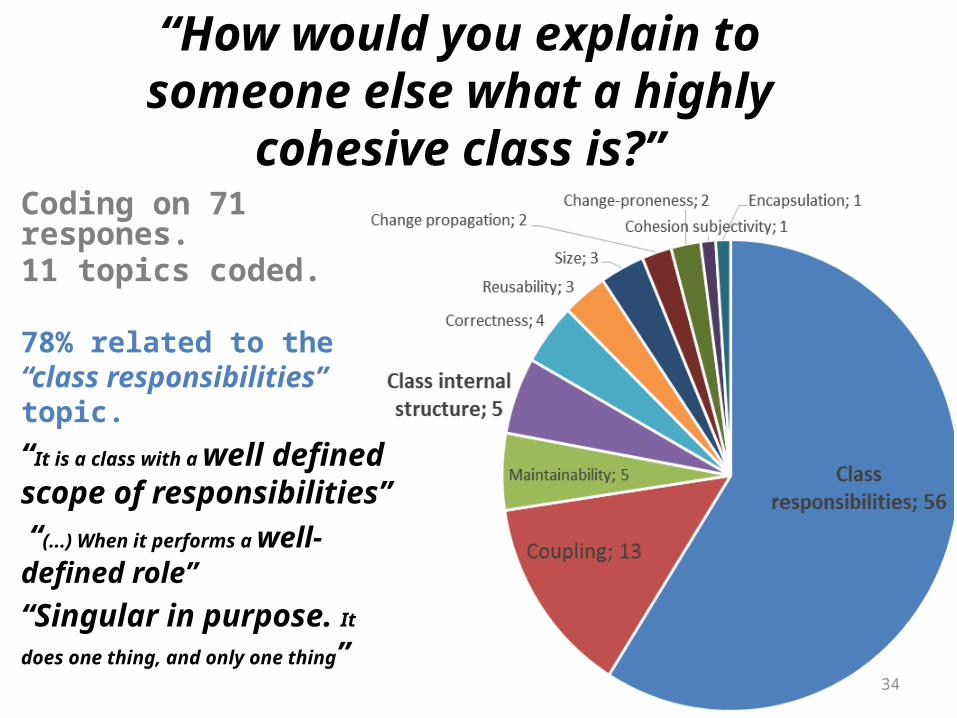
“How would you explain to someone else what a highly cohesive class is?”
Coding on 71 respones.11 topics coded.
78% related to the “class responsibilities” topic.“It is a class with a well defined scope of responsibilities” “(...) When it performs a well-defined role”“Singular in purpose. It does
one thing, and only one thing”
35
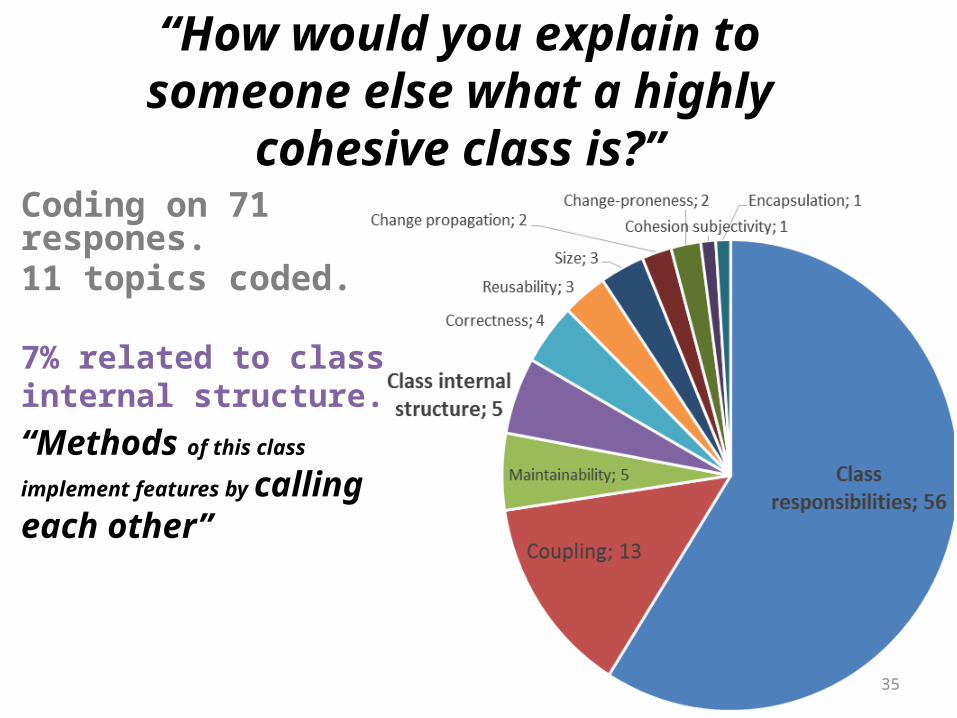
“How would you explain to someone else what a highly cohesive class is?”
Coding on 71 respones.11 topics coded.
7% related to class internal structure. “Methods of this class implement
features by calling each other”
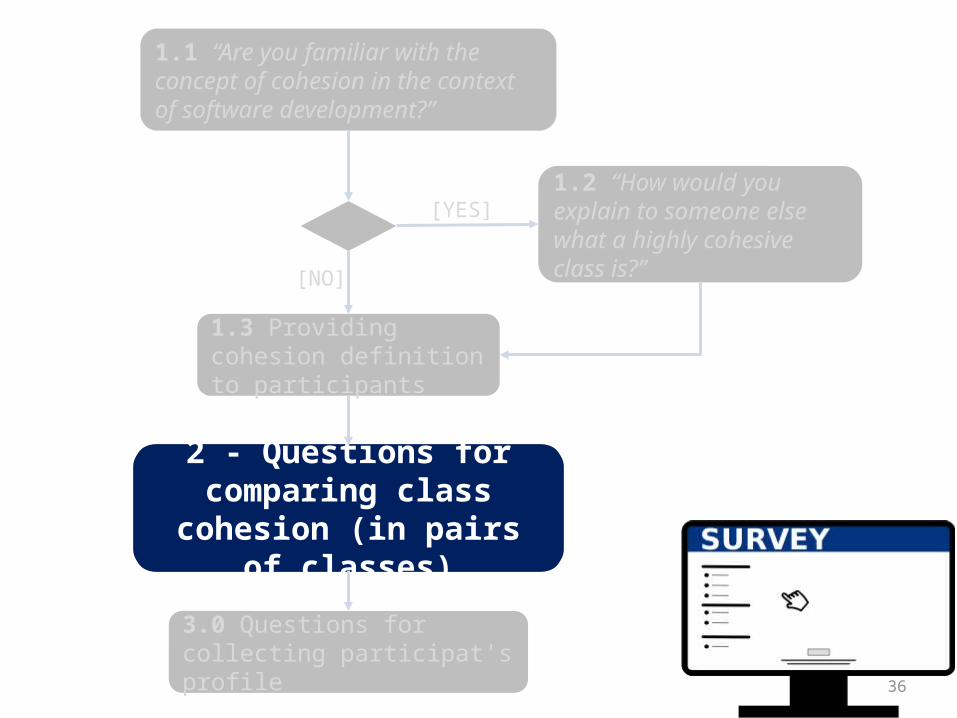
36
2 - Questions for comparing class cohesion (in pairs of
classes)
1.1 “Are you familiar with the concept of cohesion in the context of software development?”
1.2 “How would you explain to someone else what a highly cohesive class is?”
1.3 Providing cohesion definition to participants
[YES]
[NO]
3.0 Questions for collecting participat's profile
37
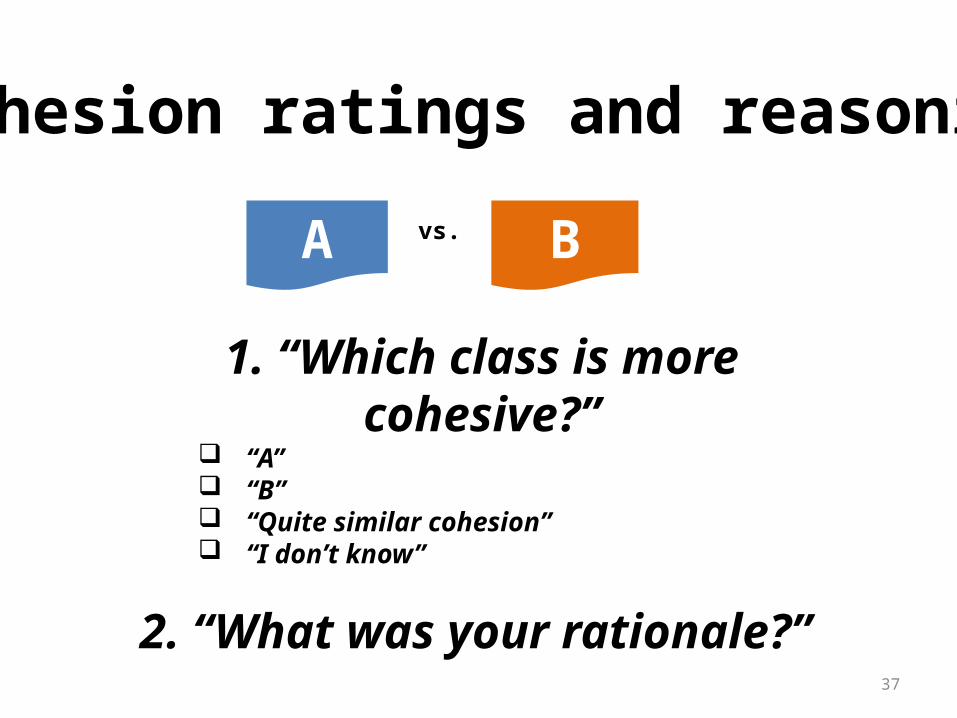
1. “Which class is more cohesive?” “A” “B” “Quite similar cohesion” “I don’t know”
2. “What was your rationale?”
Cohesion ratings and reasoning
A Bvs.
38
A Bvs.
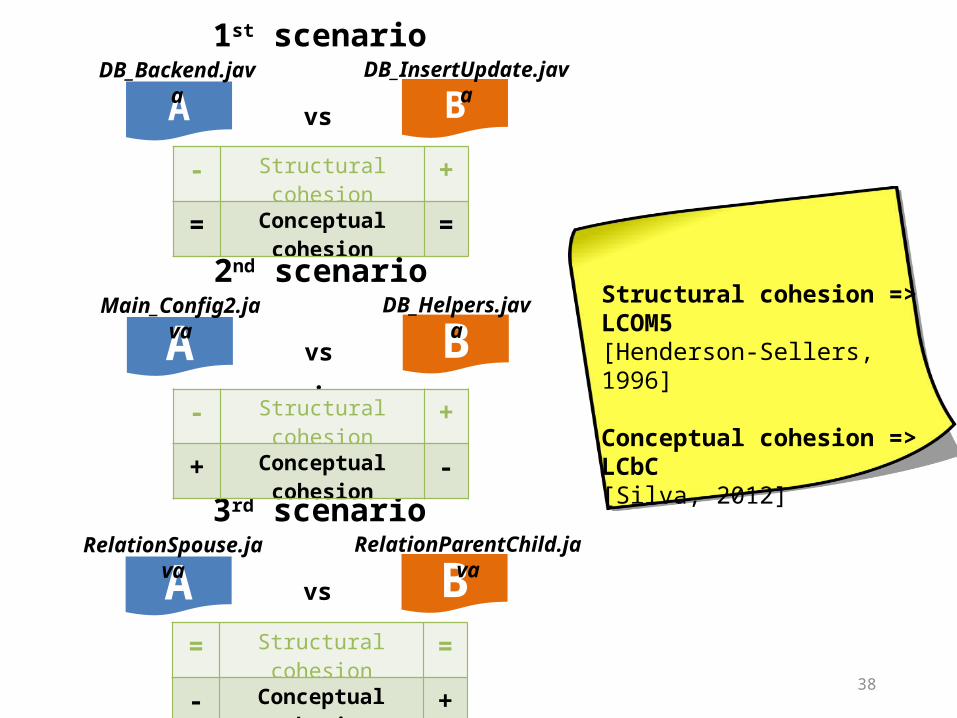
1st scenario
- Structural cohesion += Conceptual cohesion =
DB_Backend.java DB_InsertUpdate.java
A Bvs.
2nd scenarioMain_Config2.java DB_Helpers.java
A Bvs.
3rd scenarioRelationSpouse.java RelationParentChild.java
Structural cohesion => LCOM5[Henderson-Sellers, 1996]
Conceptual cohesion => LCbC[Silva, 2012]- Structural cohesion +
+ Conceptual cohesion -
= Structural cohesion =- Conceptual cohesion +
39
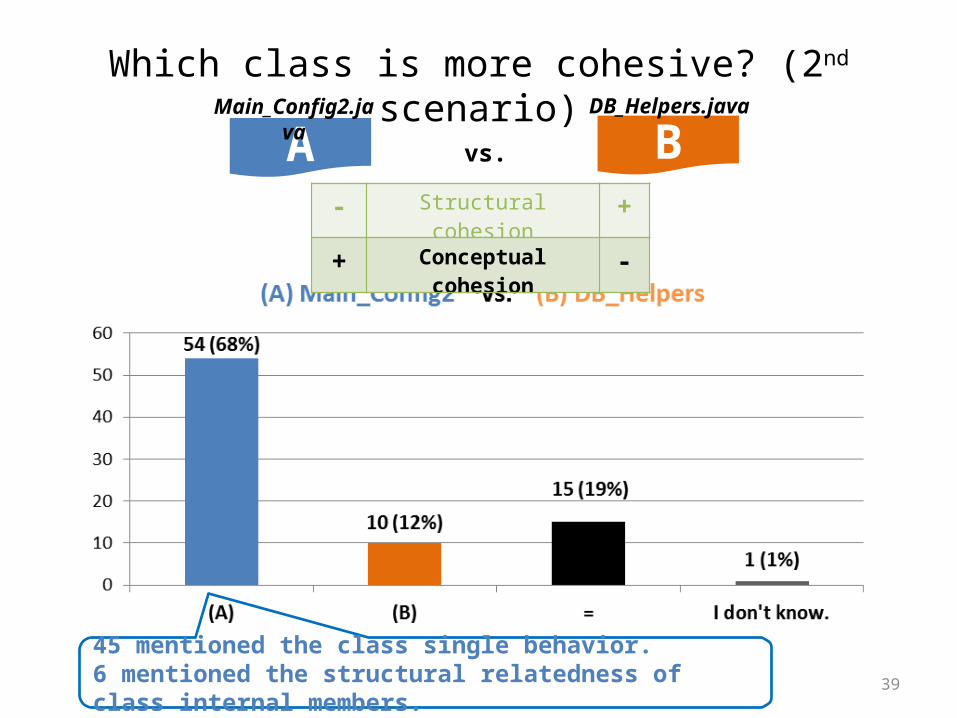
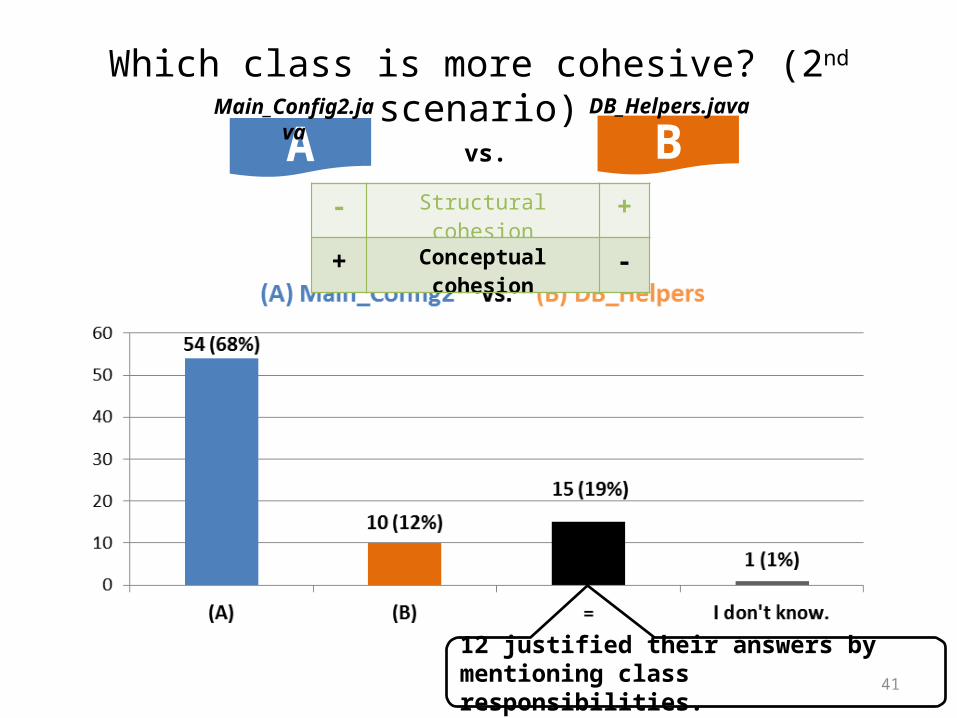
Which class is more cohesive? (2nd scenario)
45 mentioned the class single behavior.6 mentioned the structural relatedness of class internal members.
A Bvs.
- Structural cohesion ++ Conceptual cohesion -
Main_Config2.java DB_Helpers.java
40
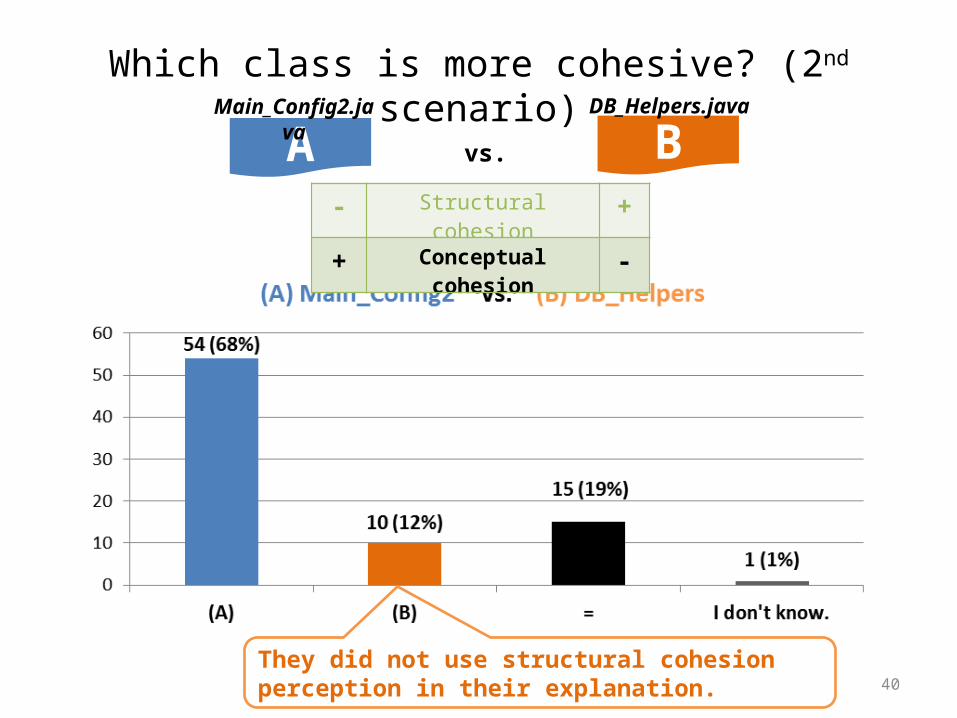
Which class is more cohesive? (2nd scenario)
A Bvs.
- Structural cohesion ++ Conceptual cohesion -
Main_Config2.java DB_Helpers.java
They did not use structural cohesion perception in their explanation.
41
Which class is more cohesive? (2nd scenario)
A Bvs.
- Structural cohesion ++ Conceptual cohesion -
Main_Config2.java DB_Helpers.java
12 justified their answers by mentioning class responsibilities.
42
Perception of conceptual cohesion was predominant.
Regardless experience
2nd Study –Results
43
Conceptual cohesion seems to be closer to the human-oriented
view of cohesion.
2nd Study –Results
44
3rd Study – Problem
How about their association to change-proneness?
Conceptual cohesion metrics…

45
3rd Study – Problem
Generally, the more concerns a class addresses the more reasons to undergo changes.
Single Responsibility Principle:
“There should never be more than
one reason for a class to change”
46
[RQ4] Whether and at what extent does conceptual cohesion associate to change proneness?
3rd Study - Research Question
47
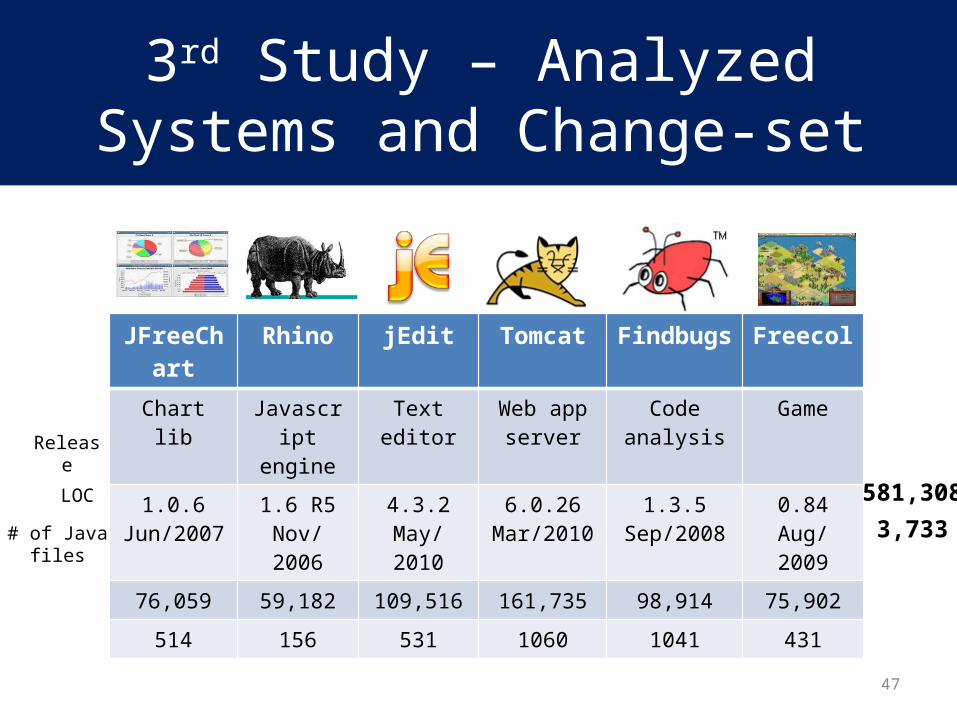
JFreeChart Rhino jEdit Tomcat Findbugs Freecol
Chart lib Javascript engine
Text editor Web app server
Code analysis Game
1.0.6Jun/2007
1.6 R5Nov/2006
4.3.2May/2010
6.0.26Mar/2010
1.3.5Sep/2008
0.84Aug/2009
76,059 59,182 109,516 161,735 98,914 75,902
514 156 531 1060 1041 431
Release
LOC
# of Java files
581,308
3,733
3rd Study – Analyzed Systems and Change-set
48
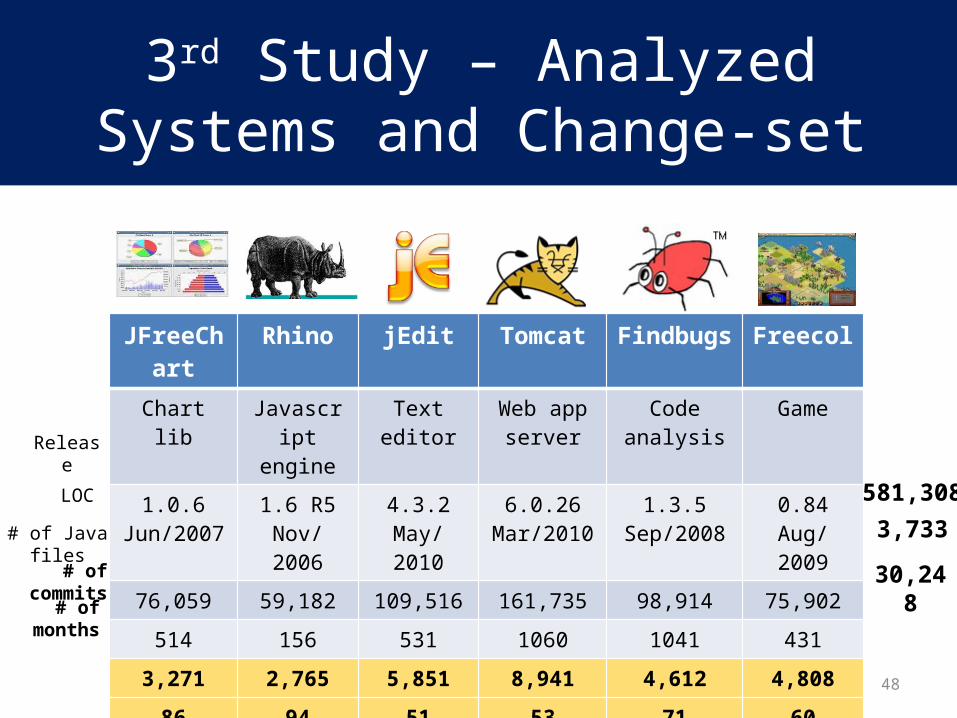
JFreeChart Rhino jEdit Tomcat Findbugs Freecol
Chart lib Javascript engine
Text editor Web app server
Code analysis Game
1.0.6Jun/2007
1.6 R5Nov/2006
4.3.2May/2010
6.0.26Mar/2010
1.3.5Sep/2008
0.84Aug/2009
76,059 59,182 109,516 161,735 98,914 75,902
514 156 531 1060 1041 431
3,271 2,765 5,851 8,941 4,612 4,808
86 94 51 53 71 60
Release
LOC
# of Java files
581,308
3,733
30,248# of commits
# of months
3rd Study – Analyzed Systems and Change-set
49
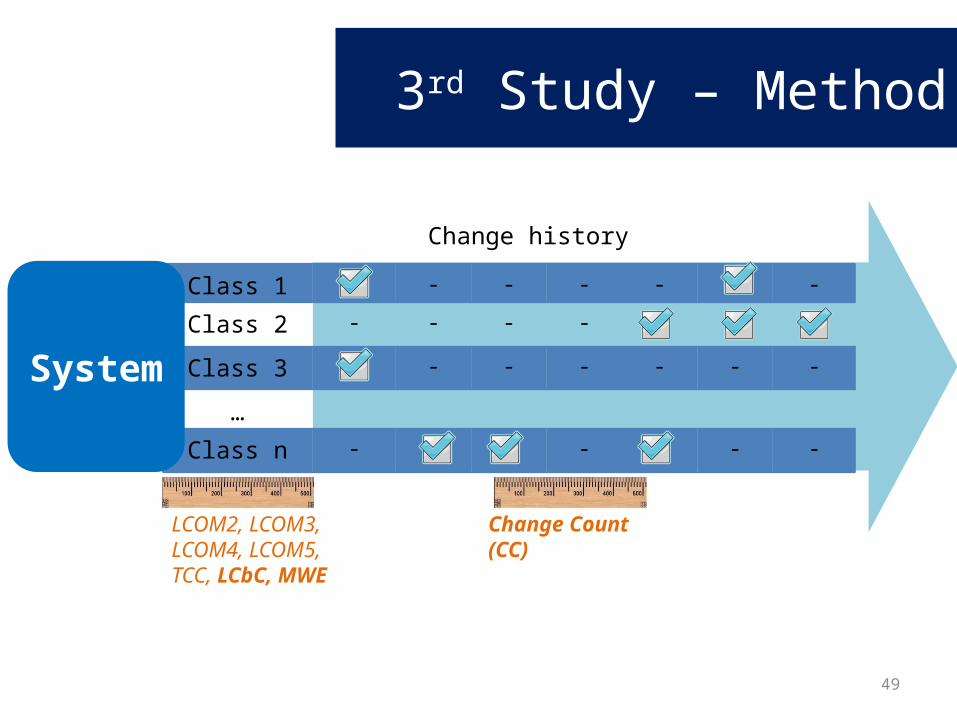
3rd Study – Method
Change history
Class 1 - - - - -
Class 2 - - - -
Class 3 - - - - - - -
…
Class n - - - -
System
LCOM2, LCOM3, LCOM4, LCOM5, TCC, LCbC, MWE
Change Count (CC)
50
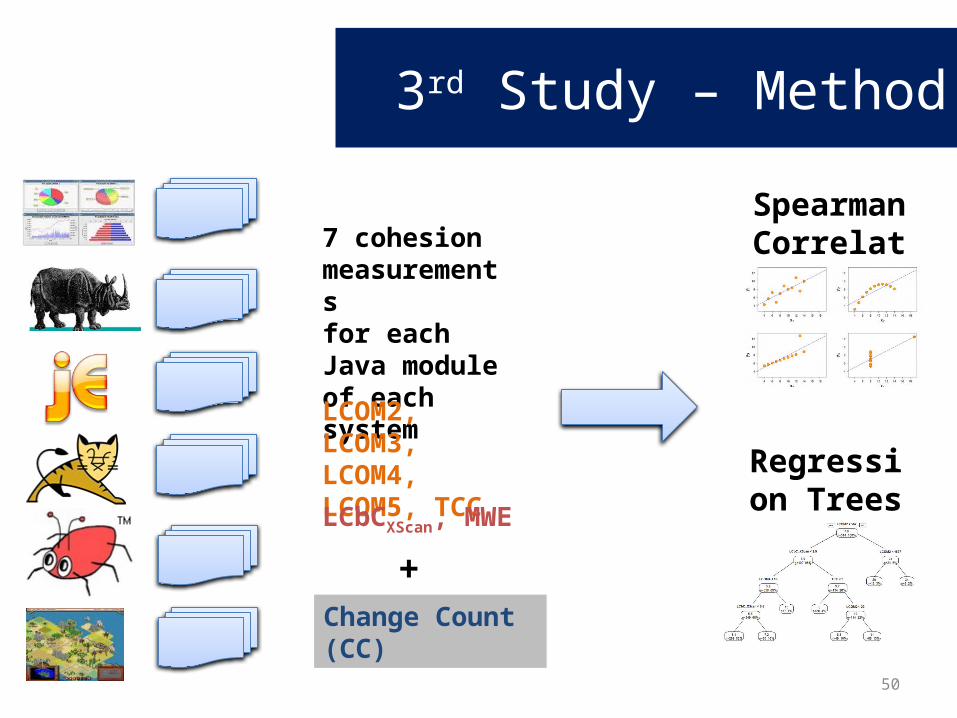
3rd Study – Method
7 cohesion measurementsfor each Java module of each system
Spearman Correlation
LCOM2, LCOM3, LCOM4, LCOM5, TCC
LCbCXScan, MWE
Change Count (CC)
Regression Trees
+
51
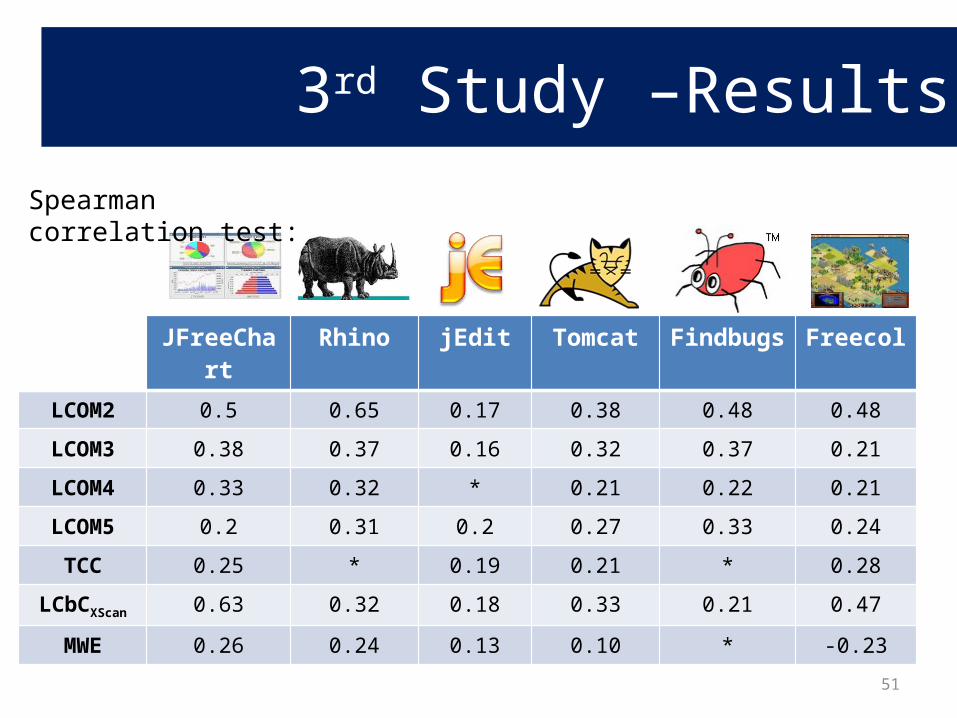
3rd Study –Results
JFreeChart Rhino jEdit Tomcat Findbugs Freecol
LCOM2 0.5 0.65 0.17 0.38 0.48 0.48
LCOM3 0.38 0.37 0.16 0.32 0.37 0.21
LCOM4 0.33 0.32 * 0.21 0.22 0.21
LCOM5 0.2 0.31 0.2 0.27 0.33 0.24
TCC 0.25 * 0.19 0.21 * 0.28
LCbCXScan 0.63 0.32 0.18 0.33 0.21 0.47
MWE 0.26 0.24 0.13 0.10 * -0.23
Spearman correlation test:
52
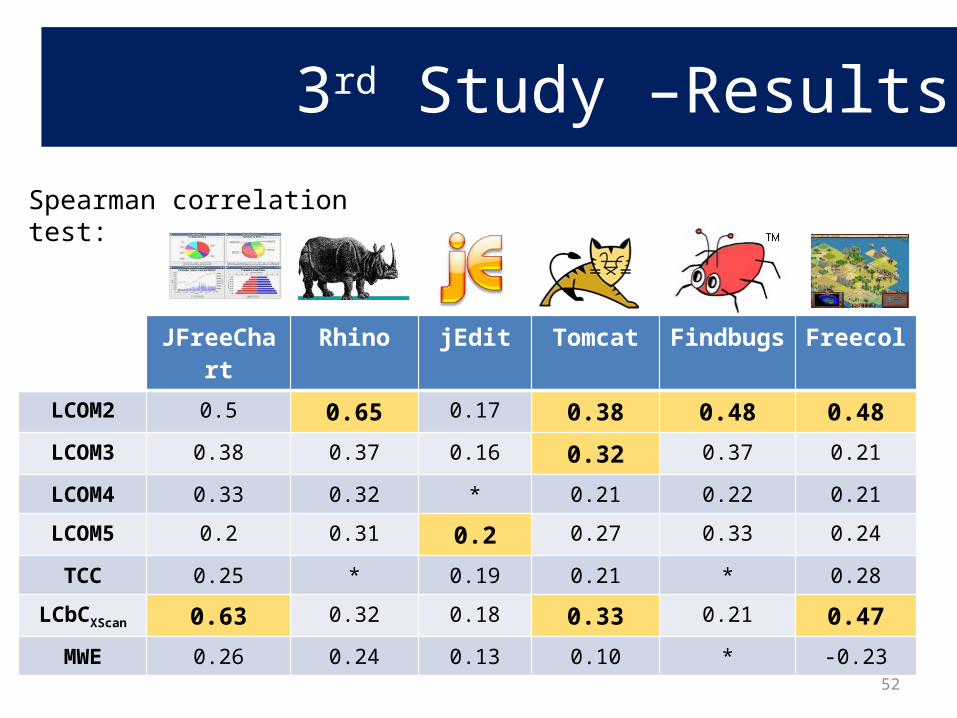
JFreeChart Rhino jEdit Tomcat Findbugs Freecol
LCOM2 0.5 0.65 0.17 0.38 0.48 0.48
LCOM3 0.38 0.37 0.16 0.32 0.37 0.21
LCOM4 0.33 0.32 * 0.21 0.22 0.21
LCOM5 0.2 0.31 0.2 0.27 0.33 0.24
TCC 0.25 * 0.19 0.21 * 0.28
LCbCXScan 0.63 0.32 0.18 0.33 0.21 0.47
MWE 0.26 0.24 0.13 0.10 * -0.23
Spearman correlation test:
3rd Study –Results
LCbC and LCOM2 are the most correlated with change count.53
JFreeChart Rhino jEdit Tomcat Findbugs Freecol
LCOM2 0.5 0.65 0.17 0.38 0.48 0.48
LCOM3 0.38 0.37 0.16 0.32 0.37 0.21
LCOM4 0.33 0.32 * 0.21 0.22 0.21
LCOM5 0.2 0.31 0.2 0.27 0.33 0.24
TCC 0.25 * 0.19 0.21 * 0.28
LCbCXScan 0.63 0.32 0.18 0.33 0.21 0.47
MWE 0.26 0.24 0.13 0.10 * -0.23
Spearman correlation test:
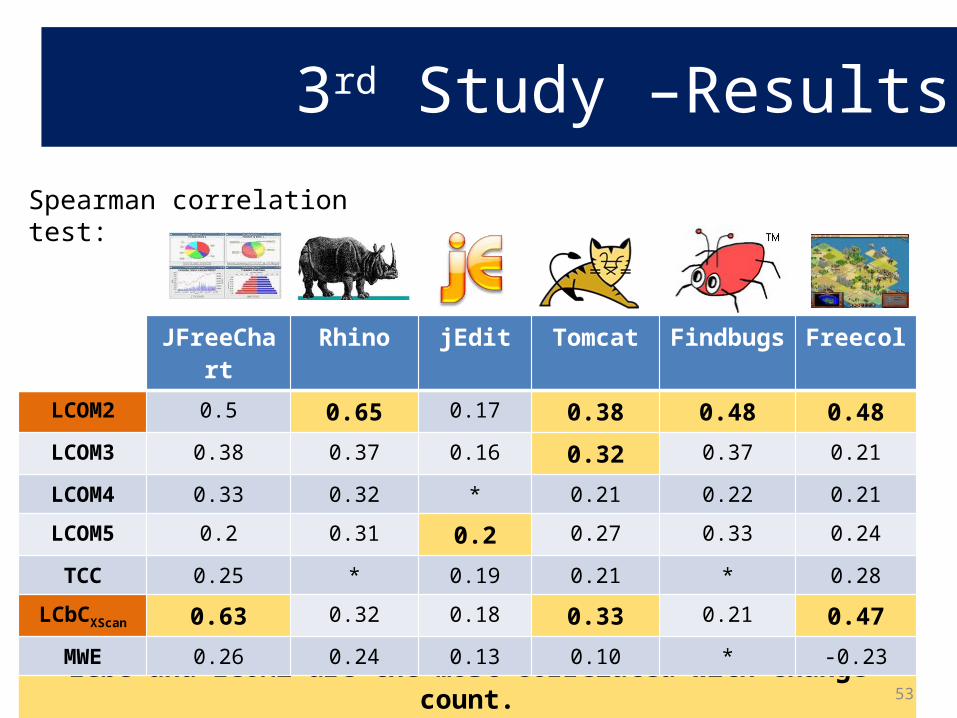
3rd Study –Results
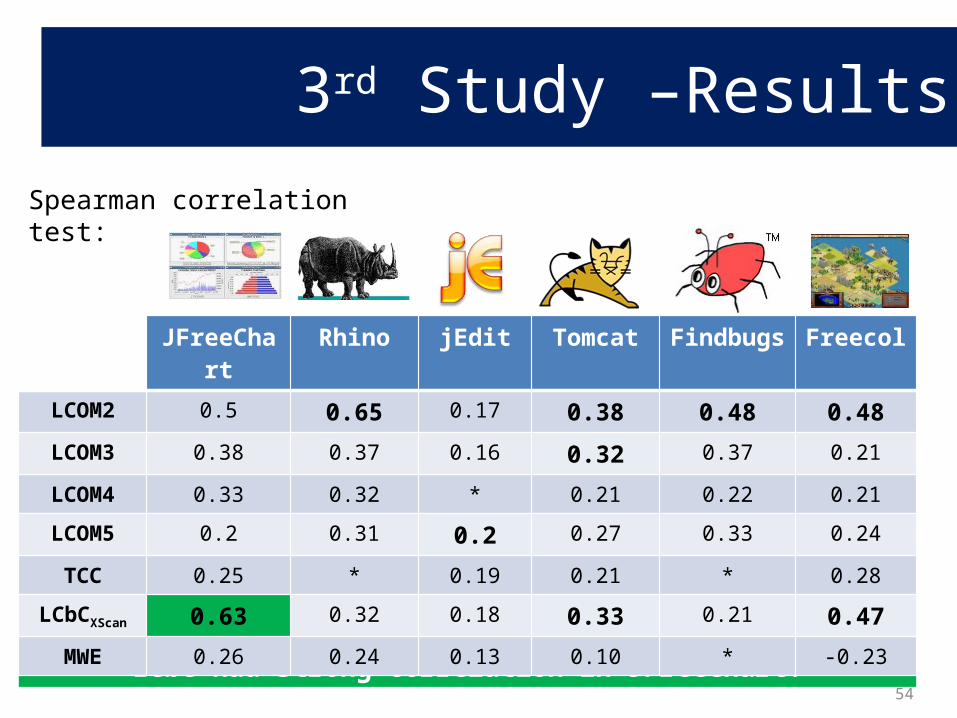
LCbC had strong correlation in JFreeChart.54
JFreeChart Rhino jEdit Tomcat Findbugs Freecol
LCOM2 0.5 0.65 0.17 0.38 0.48 0.48
LCOM3 0.38 0.37 0.16 0.32 0.37 0.21
LCOM4 0.33 0.32 * 0.21 0.22 0.21
LCOM5 0.2 0.31 0.2 0.27 0.33 0.24
TCC 0.25 * 0.19 0.21 * 0.28
LCbCXScan 0.63 0.32 0.18 0.33 0.21 0.47
MWE 0.26 0.24 0.13 0.10 * -0.23
Spearman correlation test:
3rd Study –Results
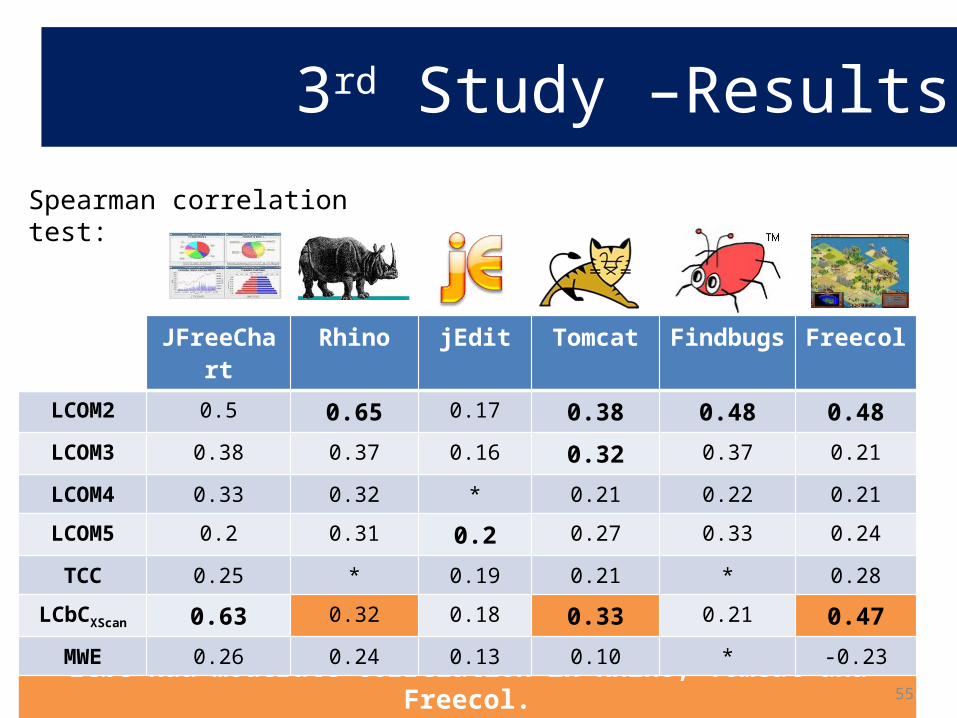
LCbC had moderate correlation in Rhino, Tomcat and Freecol.55
JFreeChart Rhino jEdit Tomcat Findbugs Freecol
LCOM2 0.5 0.65 0.17 0.38 0.48 0.48
LCOM3 0.38 0.37 0.16 0.32 0.37 0.21
LCOM4 0.33 0.32 * 0.21 0.22 0.21
LCOM5 0.2 0.31 0.2 0.27 0.33 0.24
TCC 0.25 * 0.19 0.21 * 0.28
LCbCXScan 0.63 0.32 0.18 0.33 0.21 0.47
MWE 0.26 0.24 0.13 0.10 * -0.23
Spearman correlation test:
3rd Study –Results
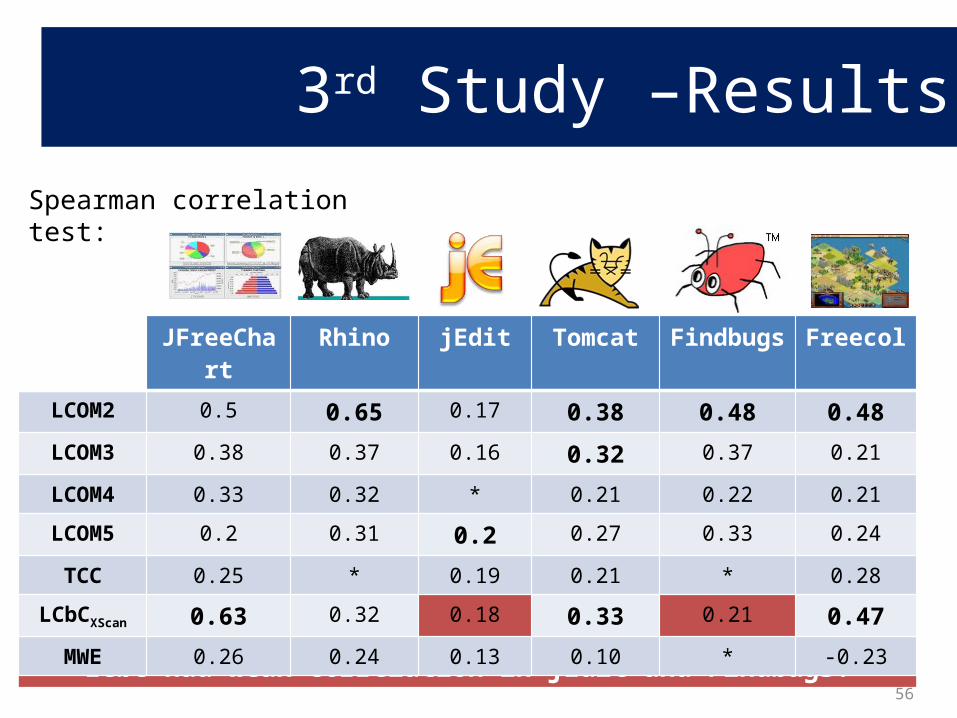
LCbC had weak correlation in jEdit and Findbugs.56
JFreeChart Rhino jEdit Tomcat Findbugs Freecol
LCOM2 0.5 0.65 0.17 0.38 0.48 0.48
LCOM3 0.38 0.37 0.16 0.32 0.37 0.21
LCOM4 0.33 0.32 * 0.21 0.22 0.21
LCOM5 0.2 0.31 0.2 0.27 0.33 0.24
TCC 0.25 * 0.19 0.21 * 0.28
LCbCXScan 0.63 0.32 0.18 0.33 0.21 0.47
MWE 0.26 0.24 0.13 0.10 * -0.23
Spearman correlation test:
3rd Study –Results
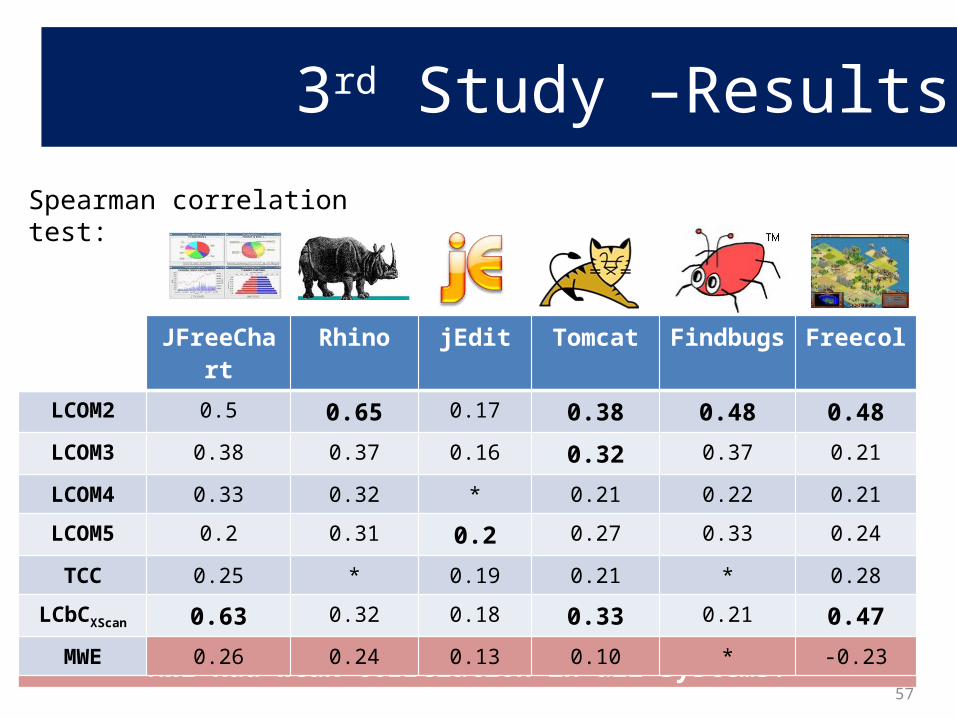
MWE had weak correlation in all systems.57
JFreeChart Rhino jEdit Tomcat Findbugs Freecol
LCOM2 0.5 0.65 0.17 0.38 0.48 0.48
LCOM3 0.38 0.37 0.16 0.32 0.37 0.21
LCOM4 0.33 0.32 * 0.21 0.22 0.21
LCOM5 0.2 0.31 0.2 0.27 0.33 0.24
TCC 0.25 * 0.19 0.21 * 0.28
LCbCXScan 0.63 0.32 0.18 0.33 0.21 0.47
MWE 0.26 0.24 0.13 0.10 * -0.23
Spearman correlation test:
3rd Study –Results
58
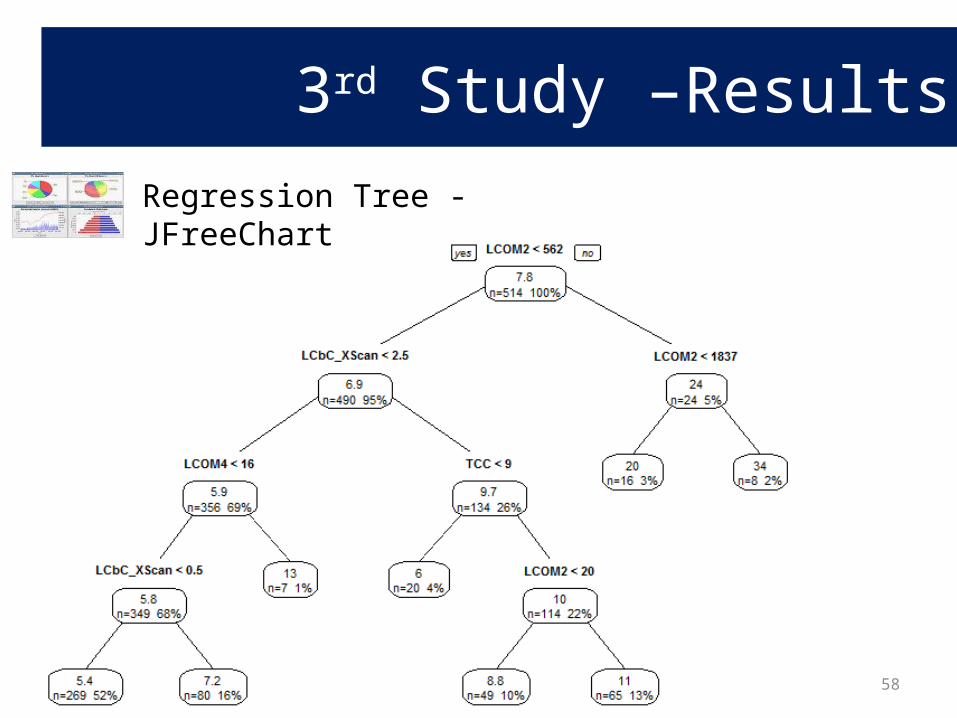
Regression Tree - JFreeChart
3rd Study –Results
59
LCbC outperformed MWE.
It is possible to have a conceptual cohesion metric moderately or strongly associated to change-proneness.
LCbC and LCOM2 are the most promising indicators of change-proneness from the cohesion perspective.
In summary, conceptual cohesion can leverage the association between cohesion and change-proneness.
3rd Study –Results
60
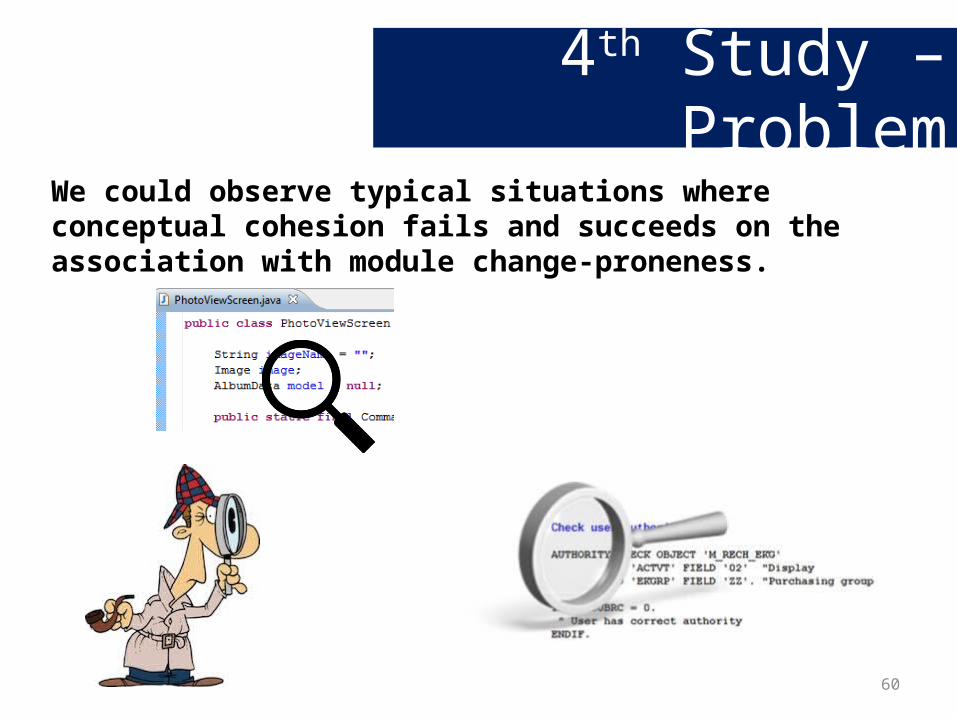
4th Study – ProblemWe could observe typical situations where conceptual cohesion fails and succeeds on the association with module change-proneness.
61
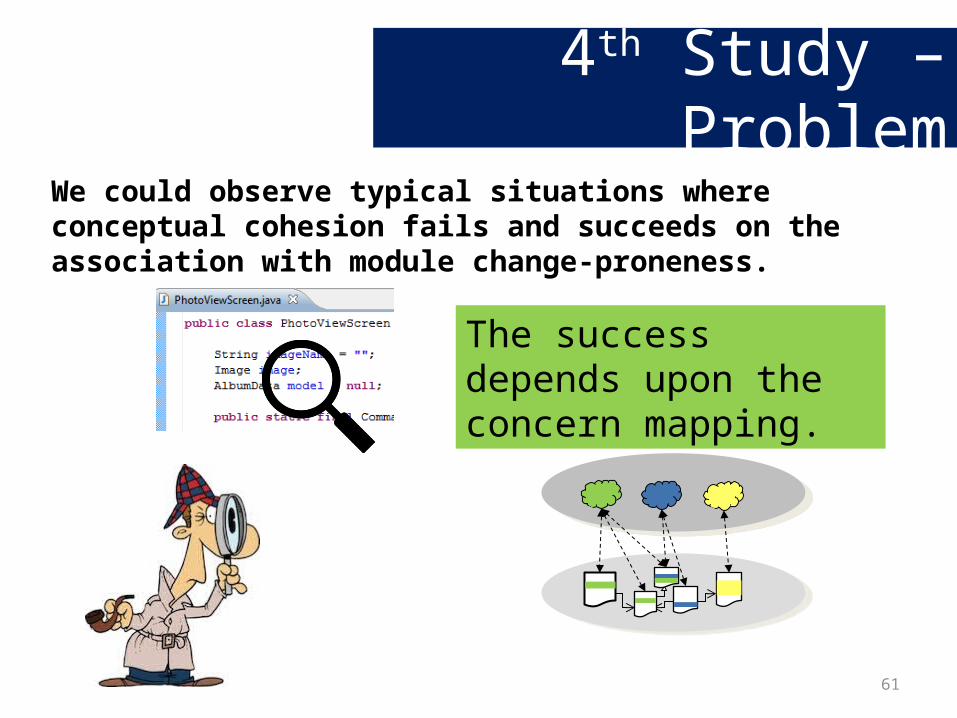
4th Study – ProblemWe could observe typical situations where conceptual cohesion fails and succeeds on the association with module change-proneness.
The success depends upon the concern mapping.
62
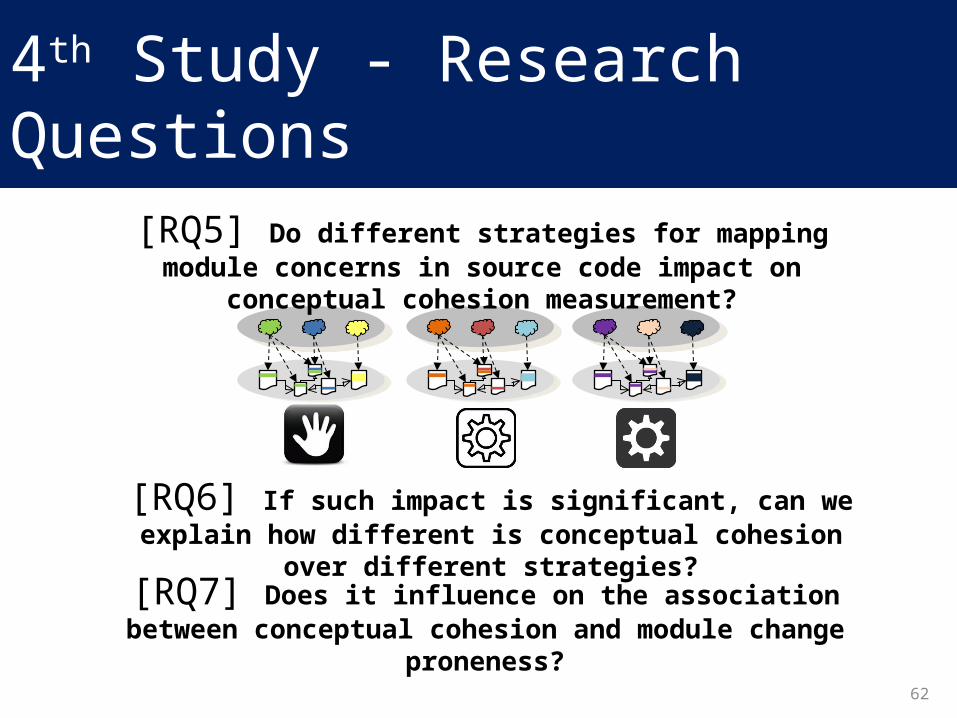
[RQ5] Do different strategies for mapping module concerns in source code impact on conceptual cohesion measurement?
[RQ6] If such impact is significant, can we explain how different is conceptual cohesion over different strategies?
[RQ7] Does it influence on the association between conceptual cohesion and module change proneness?
4th Study - Research Questions

63
4th Study –Systems, Metrics and Concern Mapping Strategies
64
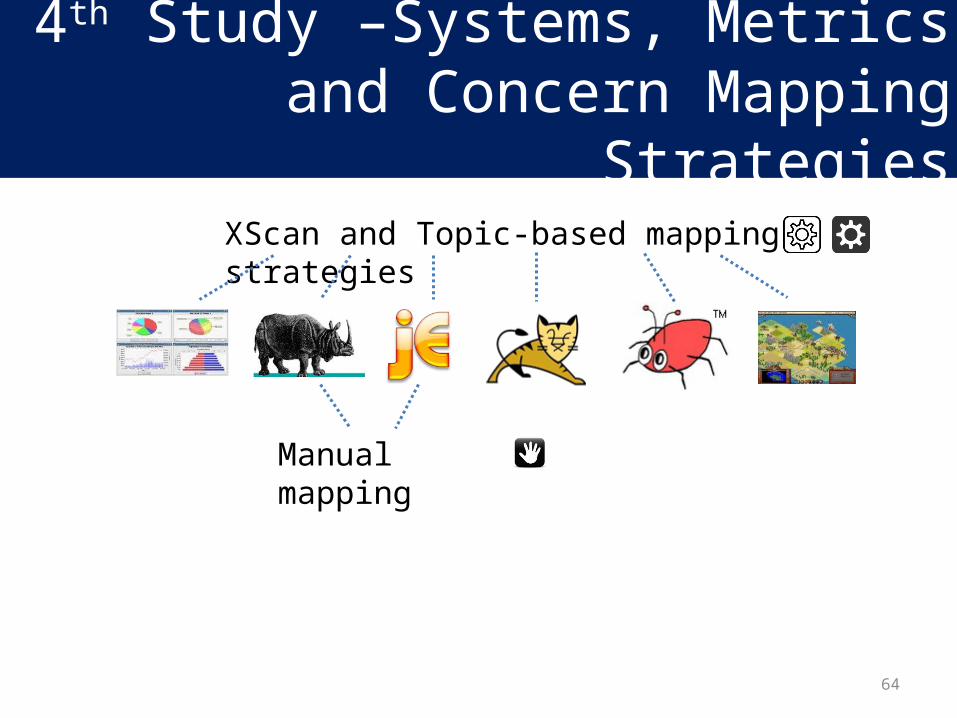
XScan and Topic-based mapping strategies
Manual mapping
4th Study –Systems, Metrics and Concern Mapping Strategies
65
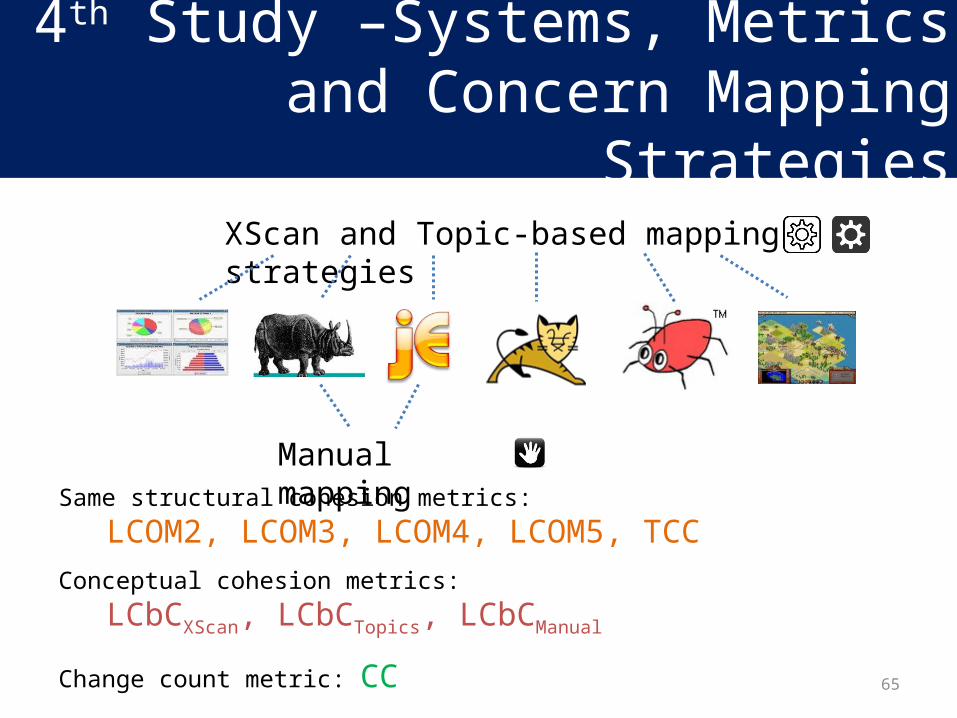
XScan and Topic-based mapping strategies
Manual mappingSame structural cohesion metrics:
LCOM2, LCOM3, LCOM4, LCOM5, TCCConceptual cohesion metrics:
LCbCXScan, LCbCTopics, LCbCManual
Change count metric: CC
4th Study –Systems, Metrics and Concern Mapping Strategies
66
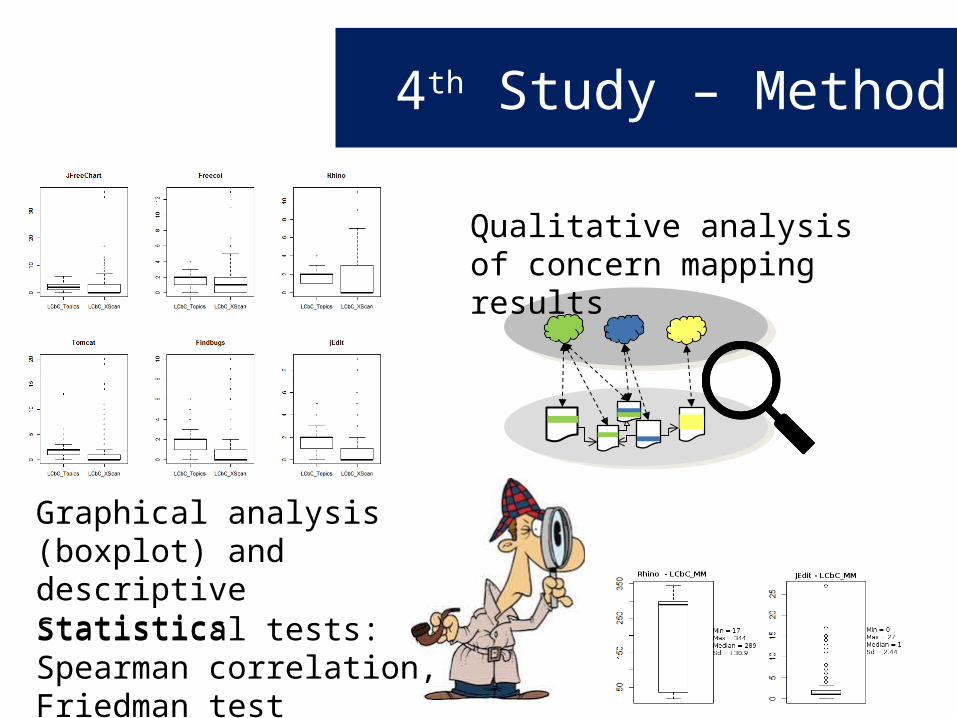
4th Study – Method
Qualitative analysis of concern mapping results
Graphical analysis (boxplot) and descriptive statistics
Statistical tests: Spearman correlation, Friedman test
67
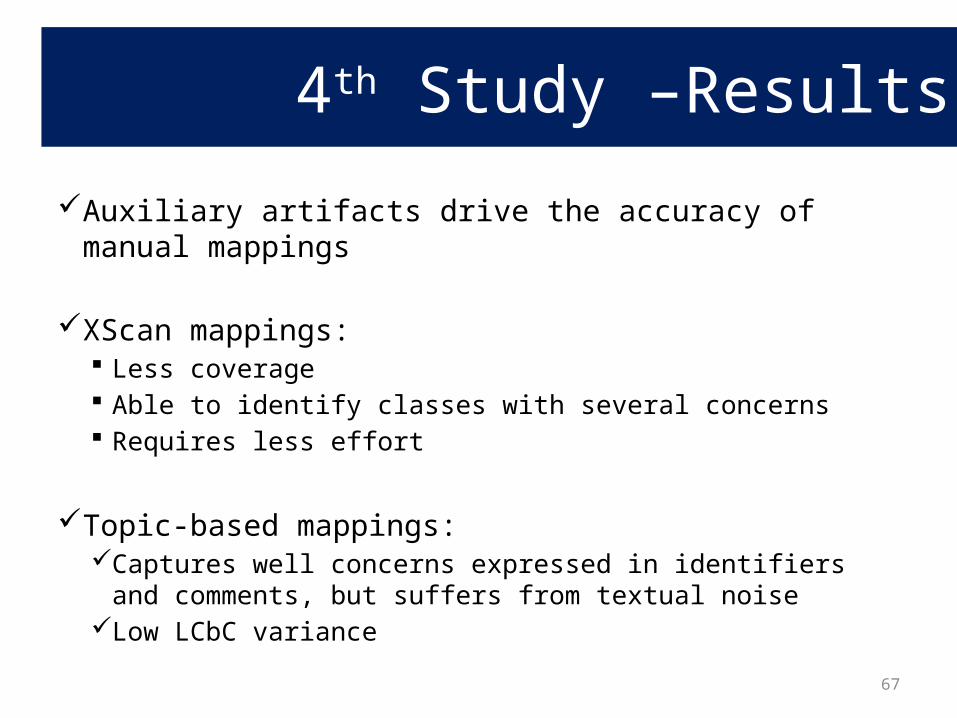
4th Study –Results
Auxiliary artifacts drive the accuracy of manual mappings
XScan mappings: Less coverage Able to identify classes with several concerns Requires less effort
Topic-based mappings:Captures well concerns expressed in identifiers and comments,
but suffers from textual noiseLow LCbC variance
68
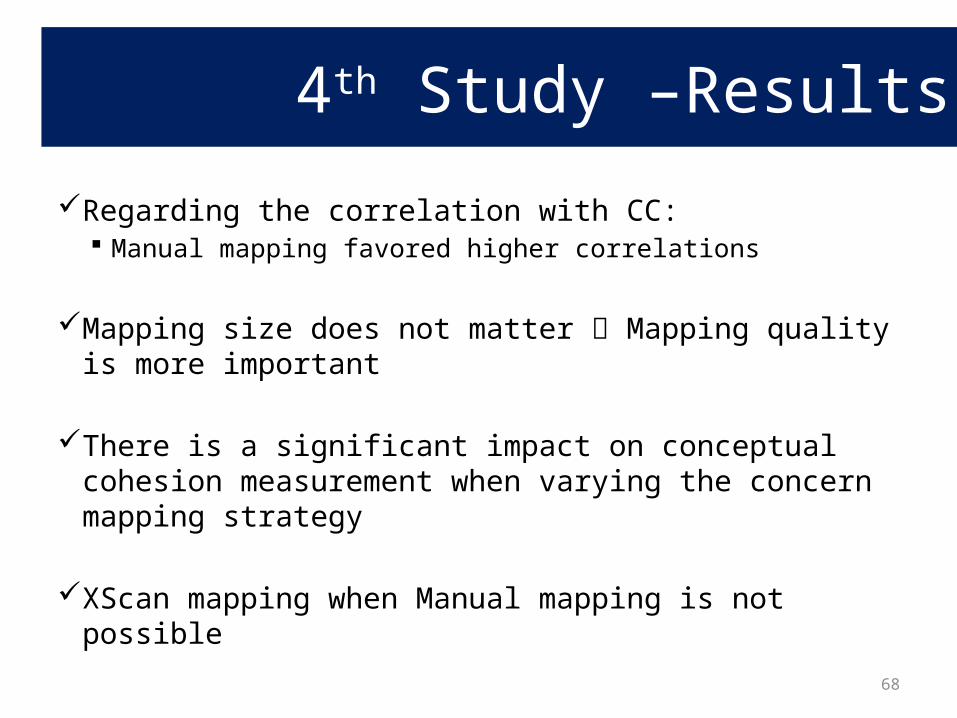
4th Study –Results
Regarding the correlation with CC: Manual mapping favored higher correlations
Mapping size does not matter Mapping quality is more important
There is a significant impact on conceptual cohesion measurement when varying the concern mapping strategy
XScan mapping when Manual mapping is not possible
69
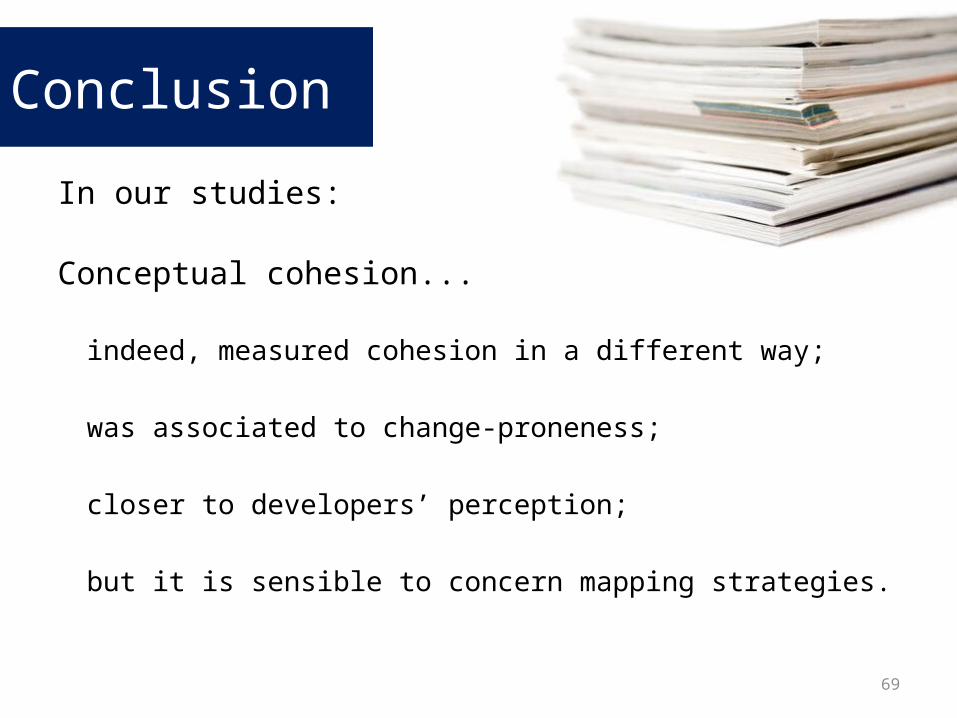
In our studies:
Conceptual cohesion...
indeed, measured cohesion in a different way;
was associated to change-proneness;
closer to developers’ perception;
but it is sensible to concern mapping strategies.
Conclusion
70
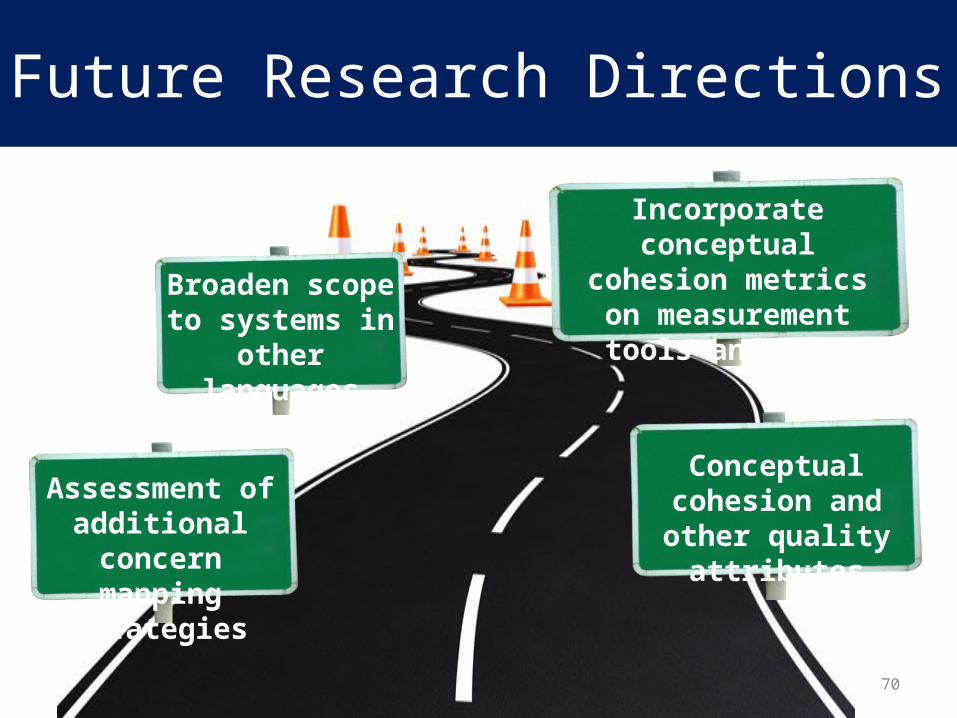
Future Research Directions
Conceptual cohesion and other quality
attributes
Broaden scope to systems in other
languages
Assessment of additional concern mapping strategies
Incorporate conceptual cohesion metrics on
measurement tools and IDEs
71
Publications
WETSoM 2011 (Workshop on Emerging Trends on Software Metrics) – Co-located with
ICPC 2012 (IEEE International Conference on Program Comprehension)
MODULARITY 2014 (13th International Conference on Modularity)
IST 2015 (Information and Software Technology Journal) Submitted
72
Online material1st study
2nd study http://goo.gl/AVrtLf
http://goo.gl/DmE6Is
http://goo.gl/LBcMsP
3rd study
4th study

Tese de Doutorado
Bruno Carreiro da Silva
03 de Agosto de 2015, Sala 12, Instituto de Matemática - UFBA
Orientador: Prof. Dr. Cláudio Sant’AnnaCo-orientadora: Prof. Dra. Christina Chavez
Understanding Software Cohesion Metrics:Experimental Assessment of Conceptual Cohesion
Programa Multiinstitucional de Pós-Graduação em Ciência da Computação