understanding process of availing subsidy, toilet
TRANSCRIPT

SANITATION SURVEY IN SINNARUnderstanding Process of availing subsidy, toilet construction and
usage in Sinnar
Submitted on: 7/11/2017
PRESENTATION OF FINDINGS

2
STUDY BACKGROUND
Sanitation Survey in Sinnar

750 million people across India, constituting 60% of the nation’s population, do
not have access to adequate sanitation facilities.
Swachh Bharat Mission was launched in 2014 to eliminate open defecation, to
eradicate manual scavenging and to convert insanitary toilets into pour flush
toilets among other such objectives.
Swachh Bharat Mission aims to encourage households to construct toilets by
providing partial incentive subsidy to non-owners of toilet.
The mission seeks to achieve the goal of Clean India in next five years by 2019
so that the 150th birth anniversary of Gandhi can be celebrated as an
accomplishment of this duty.
Out of a total of 1,08,13,928 households, 29% of households were without toilet
facility within premises and 27% of them resorted to open defecation. (Census
2011)
Till April 2017, 382,444 household toilets have been constructed in Maharashtra
Sanitation Survey in Sinnar
BACKGROUND
3

Sanitation survey in Sinnar
RESEARCH OBJECTIVES
4
• To understand the process through which the households have availed the subsidy and constructed their household toilets.
• To understand the toilet usage pattern of the household members.
• To understand the source of financing of toilet construction and the credit profile of respondents.

5
RESEARCH DESIGN
Sanitation Survey in Sinnar

RESEARCH DESIGN- TARGET GROUP & GEOGRAPHICAL COVERAGE
Sanitation Survey in Sinnar 6
PUNE Target Group: Quantitative
Main Category of Households
• Category 1 : Applicant for SBM subsidy, approved and toilet
successfully built or building
• Interviews were conducted with Household decision makers
Sanitation Survey
Quantitative Household
Survey
STATE COVERED - MAHARASHTRA
SINNAR

Sinnar is a city and municipal council in Nashik district.
Its total population was 65,299 in 2011.
The average literacy rate of Sinnar is 71%.
As per the Census 2011, out of 13,112 households in Sinnar, 8,243 households had individual household-level toilets, 3,211
households relied on community toilets and 1,658 households practiced open defecation.
4,869 households in Sinnar lacked access to own toilets and 1,658 households of them practiced open defecation.
Till April 2017, 1253 toilets have been constructed in Sinnar.
Demand Assessment for Sanitation Credit
Sinnar
7

SAMPLE SIZE – QUANTITATIVE HOUSEHOLD SURVEY
Sanitation Survey in Sinnar 8
PUNE
PSU
PRIMARY TG
TOILET OWNERS
Category 1: Applied for subsidy and
constructed toilet
Sample Planned Sample Achieved
SINNAR (NASHIK) 800 805
TOTAL 800 805
Selection ofDistrict and PSU :The District and ULBwas purposivelyselected.
SAMPLING METHODOLOGY

9
KEY FINDINGS
Sanitation Survey in Sinnar

10
EXECUTIVE SUMMARY
Sanitation Survey in Sinnar

Target Group Profile
Demographic Profile
Demand Assessment for Sanitation Credit 11
Households have Literate HH
heads
78%(78%)
Households have an avg. family
size of 4-5 members
~50%(50%)
Households had either a pucca
(17%) or a semi-pucca (80%)
structure
97%(87%)
Came from the lowest Socio-
Economic Class- E
~40%(42%)
Reported Avg. Household income
INR
8587(INR
8751)
The demographic profile of
Households in Sinnar is very
similar to the demographic
profile of such households at
the state level.
HHs have moderate levels of
literacy and most of them
belong to fairly low Socio-
Economic Groups with Avg. HH
income also similar to that at
the state level.
One distinguishing factor is the
significantly low percentage
of kutcha houses in Sinnar
(only 3%) as compared to the
state level figure (13%).* Figures from the state level study have been presented to draw comparisons and help in data
analysis.

Target Group Profile
Credit Profile
Demand Assessment for Sanitation Credit 12
Households which save 16%*(46%)
HHs which have availed loan20%*(10%)
Top source of loans: Friends42%*(50%)
Households with Bank accounts 99%*(94%)
While the demographic profile
is not very different, the credit
profile of HHs in Sinnar is
significantly different from such
HHs in the state level study.
The savings in these HHs is
significantly lower than the
state level avg. for this
category. The savings drop with
lower Socio-Economic groups.
Despite most HHs having all
official documents in place, the
HHs in Sinnar have been
hesitant to reach out to formal
institutions for loans.
* Significant difference between profile of HHs in Sinnar vs. HHs across state level at 95% CI.
HHs availed loans from formal
institutions like Banks & MFIs
4%*(28%)

Toilet Construction Process
Demand Assessment for sanitation credit 13
TOILET CONSTRUCTION
All HHs in Sinnar have reported to install Septic Tanks.TYPE OF TOILET
AVERAGE COST
OF
CONSTRUCTION
INR 48,685
FINANCING Mostly from Swachh Bharat Mission subsidy and
Savings.
Every individual shared that extra funds, over and
above the subsidy amount, had to be arranged as
the subsidy amount was not sufficient to
completely cover the expenses.
These expenses were drawn out of the pool of
savings (67%) or taken as loan from informal
networks (50%).
Less than 5% reported to have taken loans from
formal institutions like banks, SHGs and MFIs.
TIME TAKEN FOR
CONSTRUCTIONOver 65% reported that it took
them more than 30 days to
construct toilet
Though the Households have somehow managed to
overcome all challenges, the BIGGEST CHALLENGE
stated by them was LACK OF FINANCES.
There was a clear inhibition in reaching out to formal
financial institutions as also seen by the extremely low
percentage of loans taken from these institutions.
Considering that the perceived accessibility to loans is
low despite having all documents in place, there is dire
need to generate awareness around loan availability.
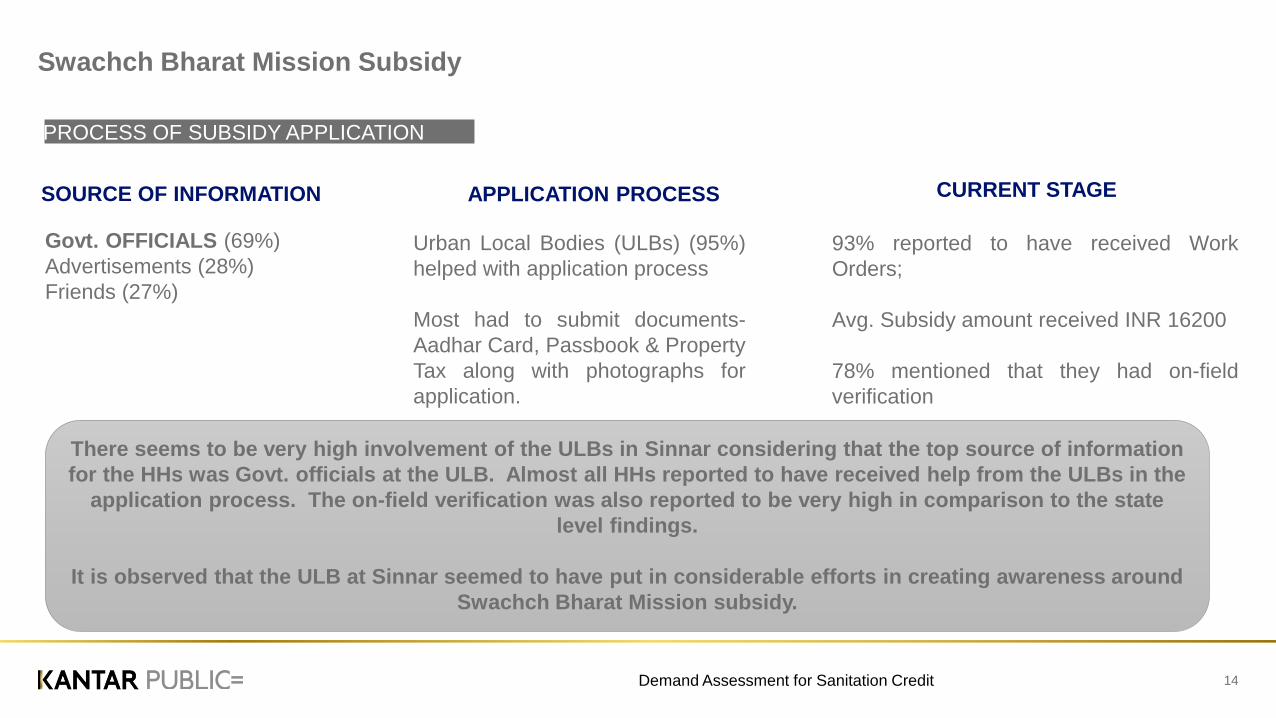
Swachch Bharat Mission Subsidy
Demand Assessment for Sanitation Credit 14
PROCESS OF SUBSIDY APPLICATION
SOURCE OF INFORMATION APPLICATION PROCESS CURRENT STAGE
Govt. OFFICIALS (69%)
Advertisements (28%)
Friends (27%)
Urban Local Bodies (ULBs) (95%)
helped with application process
Most had to submit documents-
Aadhar Card, Passbook & Property
Tax along with photographs for
application.
93% reported to have received Work
Orders;
Avg. Subsidy amount received INR 16200
78% mentioned that they had on-field
verification
There seems to be very high involvement of the ULBs in Sinnar considering that the top source of information
for the HHs was Govt. officials at the ULB. Almost all HHs reported to have received help from the ULBs in the
application process. The on-field verification was also reported to be very high in comparison to the state
level findings.
It is observed that the ULB at Sinnar seemed to have put in considerable efforts in creating awareness around
Swachch Bharat Mission subsidy.

15
CATEGORY 1: APPLIED TO SBM, BUILT OR BUILDING TOILET
Sanitation Survey in Sinnar
16
PROFILE OF HOUSEHOLDS | DEMOGRAPHIC
Sanitation Survey in Sinnar

Sanitation Survey in Sinnar 19
HOUSEHOLD STRUCTURE
17%
80%
Pucca house Semi-Pucca house
3%
Kutcha house
2%
2%
5%
23%
30%
18%
20%
A2
B1
B2
C
D
E1
E2
SOCIO ECONOMIC CLASSIFICATION (SEC)
More than three-fourth of the households have Semi-Pucca
houses who have successfully constructed toilets at home.
Half of the households come from fairly low SECs.
All respondents were residing in their own house.
DEMOGRAPHIC PROFILE OF CATEGORY 1 HOUSEHOLDS
Base: 805
97%
3%
Yes
No
ACCESS TO WATER WITHIN HOUSEHOLD PREMISES

Approximately 99% reported to have a bank account.
Only 3% stated that they own an account in post office.
Around 48% worry about not having enough resources to
get a meal.
Average household income per month – INR 8,587
Medicines/Hospitalization, Food/Groceries and Education
emerged as top expenditures.
Sanitation Survey in Sinnar 20
15
68
16
10
20
40
60
80
100
0-5000 5000-10000 10000-20000 21000-30000
%
AVERAGE HOUSEHOLD INCOME
DEMOGRAPHIC PROFILE OF CATEGORY 1 HOUSEHOLDS
Base: 805

21
PROFILE OF HOUSEHOLDS | CREDIT
Sanitation Survey in Sinnar

CREDIT PROFILE OF CATEGORY 1 HOUSEHOLDS
Sanitation Survey in Sinnar 22
Base: 805
100% households had Aadhar card, and almost
everyone had a voter ID, Passbook and Electricity bills.
Only 30% had a BPL card.
Households reported to mostly rely on their friends and
relatives for borrowings
Aadhar Card 100
Voter Id 99
BPL Card 30
Property Tax Bill 99
Passbook 99
Electricity Bill 10062
23
3 1 2 1
8
0
20
40
60
80
100
Friends/relatives Self help group Bank micro financeinstitution
moneylender/zamindar
Communitybased
organisation
Others (specify)
Sources of credit accessible
%

CREDIT PROFILE OF CATEGORY 1 HOUSEHOLDS
Sanitation Survey in Sinnar 23
16%
84%
SAVINGS
Yes
No
62%
households
invest their savings and
do not keep the savings in
the form of cash
Base: 805
Base: 130
83%
18%
1%
Bank(RD/FD/PPF)
Self help group
Post office
INVESTMENTS DONE FROM SAVINGS
Base: 80; Multiple responses
Base: 805
Savings is not very common with less than 20% households saying that they have savings in their names. This is
less than the percentage reported in the state level survey.
Savings are mostly invested in the form of FDs and RDs in banks.

Respondents in the higher SEC who have any form of savings is slightly higher than those in the lower SEC brackets. But the number of
respondents falling in the higher SEC brackets are less than those falling in the lower SEC bracket.
Demand Assessment for Sanitation Credit 24
47%
27%
10%
21%16%
12%16%
53%
73%
90%
79%84%
88%84%
0%
10%
20%
30%
40%
50%
60%
70%
80%
90%
100%
A2 B1 B2 C D E1 E2
Yes No
Do you have any form of savings?
SEC
SAVINGS ACROSS SEC CLASSIFICATION

CREDIT PROFILE OF CATEGORY 1 HOUSEHOLDS
Sanitation Survey in Sinnar 25
20
80
Yes
No
0 20 40 60 80 100
EVER AVAILED LOAN
Base: 805Base: 244
Majority of the households had never availed any loan from any source.
Of the ones who had, loan from trusted source such as friends and relatives was the most common. This is
in line with the sources of credit accessible to the respondents mentioned by them.
%
%
10
1
1
4
13
30
41
0 20 40 60 80 100
Others (specify)
Micro Finance Institution
Money Lender
Co-operative Society Banks
Bank
Self Help Group
Friends/relatives
SOURCE OF LOAN

Respondents across income levels have taken loans. Also, respondents who have savings and do not have savings have availed loans.
Since higher percentage of respondents had mentioned that friends and relatives were the sources of credit accessible to them so it may be
possible that they resorted to taking loan from them. It may be the case that they are not aware of other sources of credit available.
Demand Assessment for Sanitation Credit
Credit Profile of respondents
26
21%19%
22%20%
79%81%
78%80%
100%
0%
20%
40%
60%
80%
100%
Upto 5000 5001-10000 10001-20000 20001-30000 30001-50000
Yes No
Have you ever availed any loan?
23%19%
77%81%
0%
20%
40%
60%
80%
100%
Yes No
Yes, availed No, did not avail
Have you ever availed any loan?
SavingsAverage monthly income

27
ATTITUDE TOWARDS SANITATION
Sanitation Survey in Sinnar

Sanitation Survey in Sinnar
ATTITUDE TOWARDS SANITATION
28
Base – 805
I think it is shameful to defecate in the open
I think the money I spend on toilets is worth it
Toilets provide convenience especially during odd hours
and monsoons
Toilet usage can prevent diseases like diarrhoea, cholera
I believe investing in toilet at home is the same as
investing in health
Using toilet ensures privacy
57%
58%
63%
67%
63%
61%
22%
24%
21%
22%
20%
25%
Agree
Strongly Agree
Base: 805
Toilet Owners seem to have a positive disposition towards sanitation as many of them
see value in having toilets at home.

Sanitation Survey in Sinnar 29
96
4
Yes
No
0 20 40 60 80 100
Have you experienced benefits of owning a toilet?
71%
55%
51%
50%
44%
Safety
Good Health
Convenience
Prevention of disease
Clean Surroundings
TOP BENEFITS EXPERIENCED
Base: 805Base- 773;Multiple response
Base: 805
BENEFITS OF OWNING A TOILET
An overwhelming proportion of households affirmed that there were benefits of owning a toilet with safety
and good health emerging as the top most benefits experienced, followed by convenience, prevention
of diseases and clean surroundings.
%
30
UNDERSTANDING THE TOILET CONSTRUCTION PROCESS
Sanitation Survey in Sinnar

Sanitation Survey in Survey 31
Base: 805
PROCESS OF TOILET CONSTRUCTION
Base: 805
Septic Tank is the most common toilet facility being installed in households
in Sinnar.
WHO HELPED WITH CONSTRUCTION
Execution
MASON
94%
SELF/RELATIVES
1%
CONTRACTOR
5%
EXECUTION
Households mostly rely on the masons’
for help with construction of toilets
Septic Tank
100%
TYPE OF TOILET

Sanitation Survey in Sinnar 32
62
92
11
36
0
20
40
60
80
100
Arranging therequired amount
Finding workers tobuild
Finalising location Unavailability ofrequired toiletcomponents
None
%
CHALLENGES FACED WHILE CONSTRUCTING TOILET
PROCESS OF TOILET CONSTRUCTION
Base: 805
.
Arranging the required amount was the most stated challenge faced while constructing toilets, followed by
unavailability of required toilet components.
Multiple responses

Sanitation Survey in Sinnar 33
67%
77%
50%
4%
1%
Savings
SBM
Loan fromrelatives/friends
Loan from bank
Loan from moneylenders
SOURCE OF FINANCING
Multiple response
INR 48685* REPORTED AVERAGE TOTAL COST OF
CONSTRUCTION
Followed by loan from friends/relatives.
FEW TOILET OWNERS
Managed finances through any formal financing institution
MOST OF TOILET CONSTRUCTIONS WERE SELF-FINANCED AND/ OR WERE PAID WITH THE HELP OF SWACHH BHARAT SUBSIDY
Base: 805
FINANCING OF TOILET CONSTRUCTION – CREDIT PROFILE
*includes the cost of septic tank, superstructure, overhead water tank, bathroom and other installations
Names of Financial Institutions mentioned by respondents: Sinnar Mahilaa Nagri Sahkari Patsonstaa, Bajaj Finance, GraminKota, Bachat GST, Alen T, Maharthy bank, Sahkari Path Sanstha, Janlakshmi bank, Garam Shakti bank, Nagri Pdhsoshta, StMahamandal Co.Opp.bank, Maharashtra bank, Shankarao Valagi Raje Patsanstha, Nagarpalika Society, ThoraleBajirao,Savkarkadun, Bhairavnath Nagari bank, Nashik Merchant bank, Vandematar Sunsta, Shriram Patsanshtha, Unionbank,Sosayti Sanstha, Bharat finance, Andhra bank, S K S Finance Company, Union bank, Bank of Baroda, Corporation bank,Canara bank, etc.

Demand Assessment for Sanitation Credit
AVERAGE COST OF CONSTRUCTION
34
1
10
29 29
16
74 3
0
20
40
60
80
100
10000-20000 21000-30000 31000-40000 41000-50000 51000-60000 61000-70000 71000-80000 Above 80000
%
INR 24486 - Average cost of installation of
septic tank / digester / pit
More than 50% of the respondents spent in the range of Rs 30,000-50,000
for toilet construction.
INR 9780 – Average amount spent on
superstructure
INR 48685 - Average total cost of the
construction of the toilet

PROCESS OF TOILET CONSTRUCTION
Sanitation Survey in Sinnar 35
1
53
36
10
0
20
40
60
80
100
<1 month 1- 6 month 6 month - 1year
1-2 years
TIME ELAPSED SINCE CONSTRUCTION
(Months/Years)
1%
7%
27%65%
TIME TAKEN FOR TOILET CONSTRUCTION(Days)
0-10 days
10-15 days
15-30 days
More than 30days
More than half of the households had constructed toilets recently in last 12 months. .
Base: 805
%

36
TOILET USAGE PATTERN
Sanitation Survey in Sinnar

Majority respondents consistently use household toilets.
Sanitation Survey in Sinnar
Toilet Usage
37
91
82 2
0
20
40
60
80
100
Household Toilets Community/PublicToilets
Open Defecation Relatives/friends
Toilet Facilities
%
Base: 805; Multiple responses
Toilet Usage Pattern
ALWAYS USE THE HOUSEHOLD
TOILET
93 %Base:727
90 %Base:698
93 %Base:512
96 %Base:730
Self
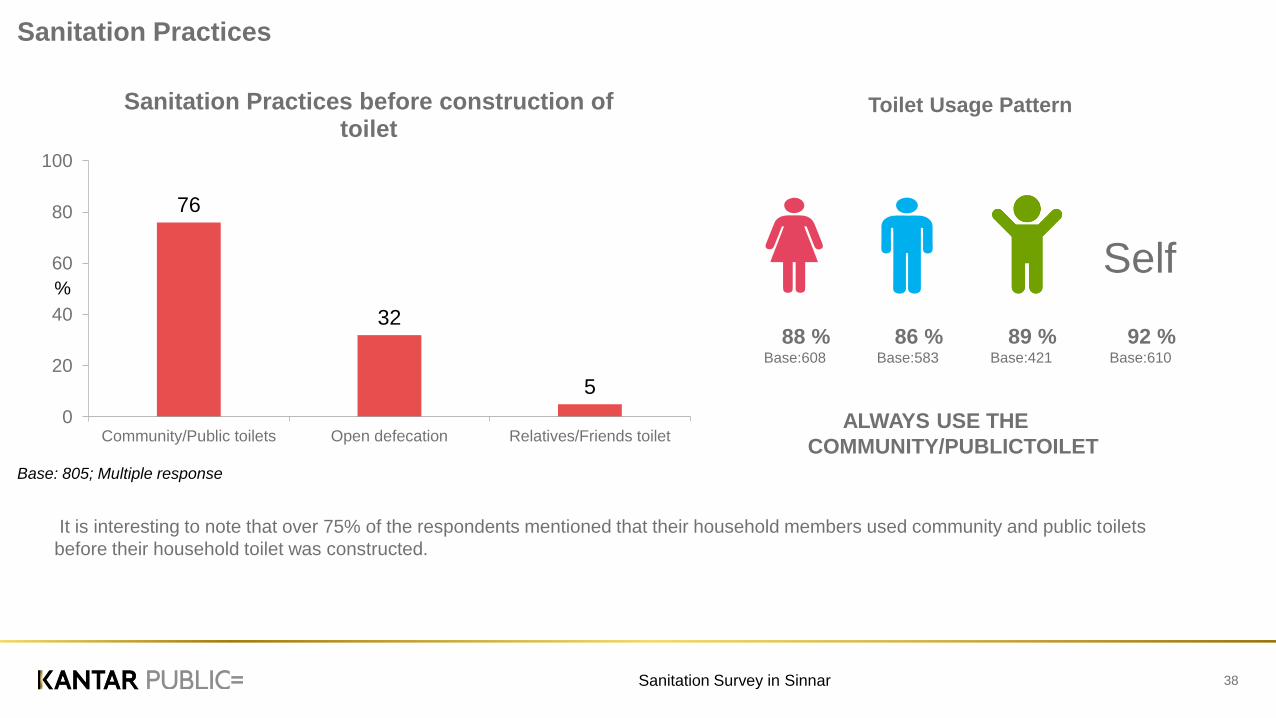
It is interesting to note that over 75% of the respondents mentioned that their household members used community and public toilets
before their household toilet was constructed.
Sanitation Survey in Sinnar
Sanitation Practices
38
76
32
5
0
20
40
60
80
100
Community/Public toilets Open defecation Relatives/Friends toilet
Sanitation Practices before construction of toilet
%
Base: 805; Multiple response
Toilet Usage Pattern
Self
88 %Base:608
86 %Base:583
89 %Base:421
92 %Base:610
ALWAYS USE THE
COMMUNITY/PUBLICTOILET

39
STATUS OF SWACHH BHARAT MISSION SUBSIDY
Sanitation Survey in Sinnar

Sanitation Survey in Sinnar
PROCESS OF AVAILING SBM SUBSIDY
40
69
28 27 23
40
20
40
60
80
100
Governmentofficials
Advertisement Relatives/friends Neighbour Urban LocalBody
SOURCE OF INFORMATION
%
Multiple response
Base: 805
Government officials and advertisements serve as the
most common source of information regarding the SBM
subsidy followed by relatives/friends..
95
2 2 10
20
40
60
80
100
Directlyapproached the
ULB
Relatives/ friends Local leader Neighbours
WHO HELPED WITH THE APPLICATION
It is interesting to note that government officials are not only
the key source of information but also serve as the key help
points for the application process.
%

REQUIREMENTS FOR AVAILING THE SUBSIDY
Sanitation survey in Sinnar 41
67%
33%
Yes
No
0% 20% 40% 60% 80%
SUBMISSION OF PHOTOGRAPHS
Yes
No
Most respondents mentioned that they were required to submit
documents to avail Swachh Bharat subsidy.
Documents included ration card, voter Id, Aadhar card,
passbook and property tax bill.
Surprisingly, not all had submitted photographs of the toilet
construction.
78%
respondents
mentioned that on-field
verification was
undertaken for the
application
72%
25%
3%
SanitaryInspector
Safai worker
Junior Engineer
VERIFICATION IN-CHARGE
Base: 805 Base: 629

PROCESS OF SWACHH BHARAT MISSION SUBSIDY APPLICATION
Sanitation Survey in Sinnar 42
Majority respondents got to know about the
approval of the application directly through the
urban local body or got a SMS.
Around 72% of the respondents got the toilet
design specifications from the Urban Local Body.
93% of
householdsreceived work order for
construction
4% 6%
90%
0%
20%
40%
60%
80%
100%
Only at theconstruction of septic
tank
Only after completionof toilet construction
Both times
STAGE OF MONITORING
Base: 774Base: 805
96% of
householdsReported that their toilet
construction had been monitored

SUBSIDY DISBURSEMENT
Sanitation Survey in Sinnar 43
95%
households
received INR 6,000 as first
instalment of the subsidy
69%
households
feel that the amount given as
first instalment should have
been more
99%
households
had received first
instalment of the subsidy
87%
households
had received final instalment
of the subsidy
INR 8,577average final instalment amount
received under SBM
62%
households
feel that final instalment amount
insufficient to cover the expenses
of the construction of toilet
Base: 805
16,200
Average amount of subsidy received
Sanitation Survey in Sinnar 44
Thank You