understanding performance and impact of producer companies
TRANSCRIPT

Final Report
Understanding Performance and
Impact of Producer Companies:
Cases studies across
States and Promoters in India
Sukhpal Singh
CMA
IIM
Ahmedabad
March, 2021

ii
Contents
Foreword iii
Acknowledgements v
List of tables vii
List of Appendix tables xx
List of photos xxi
List of abbreviations xxii
Executive Summary I
Chapter Title Page
1 Introduction 1
2 Performance and Impact of PCs in Uttar Pradesh
25
3 Performance and Impact of PCs in Rajasthan 62
4 Performance and Impact of PCs in Madhya Pradesh 104
5 Performance and Impact of PCs in West Bengal 166
6 Performance and Impact of PCs in Tamilnadu 222
7 Overview, Conclusions and Recommendations 308
References 337
Appendix: Reviewer Comments and Author response

iii
Foreword
The Centre for Management in Agriculture (CMA), IIMA has been actively engaged
in research on the management of the agriculture, food, agribusiness and rural sectors
of the Indian economy since its inception in 1971. The Centre regularly undertakes
research studies for the Ministry of Agriculture as well as other agencies, on policies
and institutions related to technology, resources, inputs, production, procurement,
processing, marketing, development and regulation in these sectors. It gives me great
pleasure to present to the readers another important work of CMA carried out by Prof.
Sukhpal Singh.
Linking of small producers with markets is an issue of great academic and policy
interest in the developing world for improving livelihoods of farmers and the poor.
Difficulties in integrating small producers with modern markets include high
transaction costs in dealing with smallholders having small volumes to sell, and lack
of collectivisation of small producers. A very small proportion of Indian farmers are a
part of any collective action for market buying or selling. The traditional co-operative
route to small producer collectivisation has frequently not worked in India, for various
reasons. Further, agribusiness markets are changing constantly.
In 2002, India amended the Companies Act to provide legal space for a new form of
producer collectivisation called the Producer Company (PC), which is identified as a
business entity of small producers registered under the Companies Act, and is
relatively free from political or administrative control and regulations unlike co-
operatives which suffered from these as well as free rider and horizon problems due to
their design. Since then, there has been substantial practical and policy interest in PCs,
and stakeholders in agricultural and rural sectors have promoted thousands of PCs
across different commodity/crop/enterprise sectors in various states of India. PCs are
being seen as an important institutional breakthrough in improving the market linkage
and promotion of the interests of small producer in the global marketplace. Prof.
Sukhpal Singh carried out the first field based academic study during the early years
of last decade published in 2014 (Allied Publishers) under the title of ‘Producer
Companies in India: Organisation and Performance’ co-authored with late Dr.
Tarunvir Singh,
Since that study, which was still during the early years of evolution and growth of the
PCs in India, Professor Singh strongly felt the need for more extensive and updated
examination of this set of entities given that the Government of India has decided to
support the promotion of 10,000 new FPOs (mainly PCs) over the next five years and
the fact that there are more than 7000 such PCs in India now. This study by Prof.
Sukhpal Singh on PCs is particularly important since there is still scant evidence on
this domain in India. The study examines the performance and impact of 35 PCs in
farm/allied production based businesses across five states of India i.e. U.P. M.P.,
Rajasthan, Tamilnadu and West Bengal. The PCs covered are promoted by different
stakeholders such as the state agencies, NGOs, private sector, and the CSR agencies
under different national level promoting agencies like SFAC and NABARD and
including some all women member PCs.
The study has examined the performance (physical and financial) and impact on
farmer members in a comparative manner across states and promoters within each

iv
state and even within PCs of a given promoter to identify factors in differential
performance and impact. It has used ‘with and without’ (members and non-members)
and ‘before and after’ (before they became members and after the membership and/or
atleast over last three years from the study year) methodology to measure and assess
this impact. Through this, it has identified major factors important for success, and the
policies and business management aspects for improving the performance and
sustainability of such innovative institutions. It finds that the performance differs
across states, and promoters and even individual PCs in each location. In many cases,
they are still dealing in only farm inputs and services and have not been able to help
member producers realise better prices for their produce due to various reasons or
have only benefitted a part of the membership by buying on behalf of government
procurement agencies like NAFED or SFAC. The reasons for poor performance vary
across PCs and promoters but there are also PCs which have made innovations at the
local level to achieve better performance and impact. The study documents such best
practices and recommends a number of policy and management measures to make
PCs more robust in their performance in creating better livelihoods as well as more
effective and sustainable agribusiness value chains in India. I am sure the study will
be found useful by policy makers, researchers, development agencies and farmer
agencies interested in understanding and implementing PCs for improving and
managing the linkages of smallholders with modern markets in India and abroad.
Poornima Varma
Chairperson
Centre for Management in Agriculture
Indian Institute of Management, Ahmedabad

v
Acknowledgements
Field based research involving multiple stakeholders needs co-operation from so
many people and institutions. Given the nature of this study, it was no different and it
is the result of positive role played by many people, more so those in the producer
collectives sector. It would not have been possible to put it together without their co-
operation. Though it may not possible to name them all here, a modest attempt is
made below:
I express my sincere thanks to the MD of NDS Mr. Omvir Singh and his colleague
and my former student at IIMA and now senior executive at NDS Ms. Sumitra
Choudhary at Agra HO of Saahaj and Shri Bijendra Singh at Etawah; the CEO of
Payaas milk PC at Jaipur Mr. R K Singh; who facilitated the field work with the
members and non-members in the operational areas of these two milk PCs besides
offering their hospitality during our visit to Rajasthan. I am also thankful to Shri B S
Chowdhary of ISAP and Mr. Sudarshan CEO of ISAP for supporting our field work
in Rajasthan. In Jaipur, we were provided accommodation by NIAM Jaipur and I am
thankful to NIAM Director Dr. P Chandra Sekhara. From IGS, Shri B S Baghel and
Shri Parasram CEO of Molasar PC in Rajasthan were very helpful.
I am thankful to Mr. Ashis Mondal, CEO of ASA, Bhopal for facilitating our field
work in MP including with support for accommodation by his colleagues. Ms. Gouri
of Basix Hyderabad was very kind to brief us on the various wings of the BASIX
group and facilitating field work with IGS especially Ms. Bharati Joshi in Kolkata,
Mr. Suman Biswas in Bankura and Mr. Nazim Ali in Indore; with BKSL Shri Tapas
Pati in Kolkata, Mr. Maharaj in Lucknow and Mr. Jasinuddin in Birbhum; and Mr.
Rajnikant in Lucknow from BCTS. I am particularly thankful to Mr. Bhattacharya and
Shri Narendanath of PRADAN who not only gave us support for field visit but also
hosted us at their campus for a week.
For U.P. field support I am thankful to Dr. Kameshwar Choudhary of Ambedkar
(central) University, Lucknow for arranging accommodation and providing two
research investigators i.e. Mr. Dheeraj Pandey and Dr. Kuldeep Kumar. I would like
to thank Ms. Aishwarya Prakash from CDS, Trivandrum and Ms. Kalpana from JNU
for support with data collection in U.P. and MP respectively. In MP. We also had the
support of Dr. Daya Suvagiya, and Mr. Kushal Pancholi in M.P. and Rajasthan and
Ms. Rohini Vilhekar in M.P.
For fieldwork in West Bengal, I am indebted to Profs. Zakir Hussain and Saikat Sinha
Roy for providing us research support in the form of student investigators i.e. Rishav
Mukherjee, Ramen Mondal, Santosh Pal, Tandra Karmakar, Rahul Saha and Anandita
Pramanik; and Dr. Zakir Hussain also for fixing our accommodation in Kolkata.
I am also grateful to Vijay Shankar of SPS and Rajat Tomar CEO of RRPPC and Mr.
Balakrishnan and Mr. Baskar of Vrutti for giving access to PCs promoted by them for
study and facilitating the field work in MP. Mr. Anil Bosari and Mr. Yashwant of
Vrutti facilitated our interviews at Betul PC.

vi
In Tamilnadu, the openness and amount of support provided by Dhan Foundation by
Mr. Vasimalai and Mr. A Gurunathan, Director of The Dhan Academy and Mr.
Dhanbalan of KTL in terms of accommodation for a week was very touching.
In Tamilnadu, I also received excellent support from Mr. S D Pandian Secretary of
SEEDS NGO and also ESAF especially Mr. Jayasheelan and Mr. Shaktikumaran for
reaching their PC location and interviewing the member and non-member farmers. I
am thankful to all the chairpersons, board members and chief executives and
managers of all PCs for sparing time and providing information about the working of
the PCs. Our field work was made easy by Prof. Jothi Sivagananam, Director, AERC
Chennai who provided excellent research support with his research students i.e Ashraf
Pulikkamath, Muhammed Safwan, Muhammad Navas, G Mooventhan, R Mani and
Vishalan S who knew local language.
Finally I would like to thank my colleagues at IIMA who made it possible for this
study to be completed despite all the odds including covid-19. These include: Ms.
Disha Shah, Research Associate at CMA who accompanied me for field visits for data
collection along with other team members besides helping with planning the study
and processing the data and tabulating it; Mr. Harshad Parmar who caried out the final
formatting of the report; Dr. Nikhil Pratap Singh, Academic Associate, CMA who
stepped in towards the end to help with some analysis and proofreading. Ms. Nikita
Pandey, former Academic Associate at CMA also helped with some data entry.
I am thankful to CMA and MoAFW for providing necessary logistical and financial
support respectively to carry out this study. Thanks are also due to Prof. CSC Sekhar
for detailed comments on the draft report. I hope that the report will be helpful for
developing policy and research perspectives on PCs in particular and producer
collectives in general from the perspective of smallholders and for action research to
improve the organisation and functioning of the FPOs, including PCs.
Sukhpal Singh

vii
List of Tables
Table No. Title Page No
1.1 Major cluster and crop wise number and proportion of
active FPOs.
15
1.2 State wise and RI (SFAC) and POPI (NABARD) wise
number of FPOs.
22
1.3 RIs, POPIs and FPOs in different study states as %age of
total in India
23
1.4 Average FPOs promoted by RIs/POPIs 23
1.5 State wise and Resource institution wise tentative list of PCs
for sampling
24
1.6 State wise and Promoter wise number of PCs/FPOs
Studied
24
2.1 Profile and performance of various PCs in U.P. 27
2.2 Distribution of Milk PC members and non-member
farmers by Education
28
2.3 Distribution of Milk PC members and non-member
farmersby Owned Land
28
2.4 Distribution of Milk PC members and non-member
farmers by Operated Land
29
2.5 Distribution of Milk PC members and non-member
farmers by Livestock ownership
29
2.6 Distribution Milk PC of members and non-member
farmers by source of Cattlefeed
30
2.7 Distribution of Milk PC members and non-member
farmers by Kharif cropping pattern (area in acres)
31
2.8 Distribution of Milk PC members and non-member
farmers by Rabi cropping pattern (area in acres)
31
2.9 Distribution of Milk PC members and non-member
farmers by Summer cropping pattern (area in acres)
32
2.10 Distribution of Milk PC members and non-member
farmers by source of general agricultural information
33
2.11 Distribution of Milk PC members and non-member
farmers by information regarding PC
33
2.12 Distribution of Milk PC members and non-member
farmers by knowledge about PC Owner
34
2.13 Distribution of UP PC members and Non member
farmers by Education
35
2.14 Distribution of UP PC Members and Non Member
farmers by Secondary Occupation
35
2.15 Average land holding across UP PC Member and Non
Member farmers
36
2.16 Category-wise Distribution of UP PC Members and Non
Member farmers by Owned Land
36
2.17 Category-wise Distribution of UP PC Members and Non
Member farmers by Operated Land
36

viii
2.18 Distribution of UP PC Members and Non Member
farmers by Livestock owned
37
2.19 Distribution of UP PC Members and Non Member
farmers by Source of Irrigation
37
2.20 Distribution of UP PC Members and Non Member
farmers by Kharif cropping pattern
39
2.21 Distribution of UP PC Members and Non Member
farmers by Cropping Pattern by Rabi cropping pattern
39
2.22 Distribution of UP PC Members and Non Member
farmers by Summer cropping pattern
39
2.23 Distribution of UP PC Members and Non Member
farmers by Source of Seeds
40
2.24 Distribution of UP PC Members and Non member
farmers by Source of Chemical inputs
41
2.25 Distribution of UP PC Members and Non member
farmers by source of Bio inputs
41
2.26 Distribution of BKSL and BCTS PC member farmers by
Education
43
2.27 Distribution of BKSL and BCTS PC member farmers by
Secondary Occupation
43
2.28 Average land holding of BKSL and BCTS PC member
farmers
43
2.29 Category-wise Distribution of BKSL and BCTS PC
member farmers by Owned land
45
2.30 Category-wise Distribution of BKSL and BCTS PC
member farmers by Operated Land
45
2.31 Distribution of BKSL and BCTS PC member farmers by
Livestock owned
46
2.32 Distribution of BKSL and BCTS PC members by Source
of Irrigation
46
2.33 Distribution of BKSL and BCTS PC member farmers by
Kharif cropping pattern
46
2.34 Distribution of BKSL and BCTS PC member farmers by
Rabi cropping pattern
47
2.35 Distribution of BKSL and BCTS PC members by
Summer cropping pattern
47
2.36 Distribution of BKSL and BCTS PC member farmers by
Source of Seeds
47
2.37 Distribution of BKSL and BCTS PC member farmers by
Source of Chemical Inputs
48
2.38 Distribution of BKSL and BCTS PC member farmers by
Source of Bio inputs
48
2.39 Distribution of BKSL and BCTS PC member farmers by
knowledge of PC name
48
2.40 Distribution of BKSL and BCTS PC member farmers by
knowledge of PC owner
49
3.1 Profile and performance of various PCs in Rajasthan 63
3.2 Distribution of Milk PC member and non-member
farmers by Education
64

ix
3.3 Distribution of Milk PC member and non-member
farmers by Primary Occupation
64
3.4 Distribution of Milk PC member and non-member
farmers by Secondary Occupation
64
3.5 Average Owned and Operational Land of Milk PC
Members and Non-members
65
3.6 Distribution of Milk PC member and non-member
farmers by Owned Land
65
3.7 Distribution of Milk PC member and non-member
farmers by Operated Land
65
3.8 Distribution of Milk PC member and non-member
farmers by livestock Owned
66
3.9 Distribution of Milk PC member and non-member
farmers by Source of Seeds
66
3.10 Distribution of Milk PC member and non-member
farmers by Source of Chemical inputs
67
3.11 Kharif Cropping Pattern of Milk PC members and non-
members (acres)
67
3.12 Rabi Cropping Pattern of Milk PC members and non-
members (in acres)
68
3.13 Summer Cropping Pattern of Milk PC members and
non-members (in acres)
68
3.14 Distribution of member and non-member farmer by sales
channel for milk
70
3.15 Distribution of Non-milk PC member and non-member
farmers by Education
71
3.16 Distribution of Non-milk PC member and non-member
farmers by Primary Occupation
72
3.17 Distribution of Non-milk PC member and non-member
farmers by Secondary Occupation
72
3.18 Distribution of Non-milk PC member and non-member
farmers by Owned Land
73
3.19 Distribution of Non-milk PC member and non-member
farmers by Operated Land
73
3.20 Distribution of non-milk PC member and non-member
farmers by Livestock owned
73
3.21 Distribution of non-milk PC member and non-member
farmers by Source of Chemical inputs
74
3.21A Type of Input wise Reasons for purchase of inputs from
PC by members
75
3.22 Season wise Average Cropped Area (acres) for non-milk
PC members and non-members
76
3.23 Kharif Cropping Pattern of non-milk PC members and
non-members
76
3.24 Rabi Cropping Pattern of non-milk PC members and
non-members
77
3.25 Summer Cropping Pattern of non-milk PC members and
non-members
77
3.26 Distribution of ISAP and IGS PC members by Education 79

x
3.27 Distribution of ISAP and IGS PC members by
Secondary Occupation
79
3.28 Distribution of ISAP and IGS PC members by Owned
Land
79
3.29 Distribution of ISAP and IGS PC members by Operated
Land
79
3.30 Distribution of ISAP and IGS PC member farmers by
livestock ownership
80
3.31 Distribution of ISAP and IGS PC members by Source of
Irrigation
80
3.32 Distribution of ISAP and IGS PC farmers by source of
energy for irrigation
80
3.33 Kharif cropping pattern of ISAP and IGS PC member
farmers
81
3.34 Rabi cropping pattern of ISAP and IGS PC member
farmers
82
3.35 Distribution of ISAP and IGS PC member farmers by
Source of general agricultural information
82
3.36 Distribution of ISAP and IGS PC members by
knowledge of PC owner
83
3.37 Distribution of ISAP and IGS PC members by influencer
for membership
83
3.38 Distribution of ISAP PC members by Education 84
3.39 Distribution of ISAP PC members by Secondary
Occupation
84
3.40 Distribution of ISAP PC members by Owned Land 85
3.41 Distribution of ISAP PC members by Operated Land 85
3.42 Distribution of ISAP PC members by livestock Owned 85
3.43 Distribution of ISAP PC members by Source of general
agricultural knowledge
86
3.44 Distribution of ISAP PC members by Kharif Cropping
Pattern
87
3.45 Distribution of ISAP PC members by Rabi Cropping
Pattern
88
3.46 Distribution of ISAP PC members by Source of Seeds 89
3.47 Distribution of ISAP PC members by Source of
Chemical inputs
89
3.48 Distribution of ISAP PC members by Knowledge of PC
Owner
90
3.49 Distribution of ISAP PC members by PC influencer 90
3.50 Distribution of IGS PC members by Education 90
3.51 Distribution of IGS PC members by type of farmer by
Owned Land
91
3.52 Category-wise Distribution of IGS PC members by type
of farmer by Operated Land
91
3.53 Category-wise Distribution of IGS PC members by
Livestock owned
92
3.54 Distribution of IGS PC members by Kharif Cropping
Pattern
93

xi
3.55 Distribution of IGS PC members by Rabi Cropping
Pattern
93
3.56 Distribution of IGS PC members by source of General
agricultural knowledge
94
3.57 Distribution of IGS PC members by Knowledge about
PC Owner
94
3.58 Distribution of IGS PC members by PC influencer 95
4.1 Profile and performance of various PCs in MP 106-107
4.2 Distribution of PC member and non-member farmers by
Gender
108
4.3 Distribution of PC member and non-member farmers by
Education
108
4.4 Distribution of PC member and non-member farmers by
Secondary Occupation
108
4.5 Average Owned and Operated Land by PC Members and
Non- Members
109
4.6 Distribution of PC member and non-member farmers by
Owned Land
109
4.7 Distribution of PC member and non-member farmers by
Operated Land
110
4.8 Distribution of PC member and non-member farmers by
Livestock Owned
110
4.9 Distribution of PC member and non-member farmers by
Source of Irrigation
113
4.10 Distribution of PC member and non-member farmers by
Kharif cropping pattern
114
4.11 Distribution of PC member and non-member farmers by
Rabi cropping pattern
114
4.12 Distribution of PC member and non-member farmers by
Summer cropping pattern
115
4.13 Distribution of PC member and non-member farmers by
Source of Seeds
116
4.14 Distribution of PC member and non-member farmers by
Source of Chemical Inputs
116
4.15 Distribution of PC member and non-member farmers by
Source of Bio inputs
117
4.15A Input wise reasons for buying Inputs from PC by
members
117
4.16 Distribution of PC member farmers by crop wise
channel of sale (exc goat PC)
119-120
4.17 Distribution of non-member farmers by crop wise
channel of sale (exc goat PC)
120-121
4.18 Distribution of Women PC Members and Non-member
farmers by Education
122
4.19 Distribution of Women PC Members and Non-member
farmers by Primary Occupation
122

xii
4.20 Distribution of Women PC Members and Non-member
farmers by Secondary Occupation
122
4.21 Average owned and operated land holding of Women
PC Members and Non-members
123
4.22 Distribution of Women PC Members and Non-member
farmers by livestock ownership
123
4.23 Distribution of Women PC Members and Non-member
farmers by Source of irrigation
124
4.24 Distribution of Women PC Members and Non-member
farmers by Source of seeds
124
4.25 Distribution of Women PC Members and Non-member
farmers by source of Chemical Inputs
124
4.26 Distribution of Women PC Members and Non-member
farmers by source of Bio inputs
125
4.27 Kharif cropping pattern of Women PC Members and
Non-member farmers
126
4.28 Rabi cropping pattern of Women PC Members and Non-
member farmers
127
4.29 Distribution of Women PC member farmers by crop
wise channel of sale
131
4.30 Distribution of Women PC non-member farmers by crop
wise channel of sale
131
4.31 Distribution of AKRSP and ASA PC member farmers by
Education
136
4.32 Distribution of AKRSP and ASA PC member farmers by
Secondary Occupation
136
4.33 Average Owned and Operational land of AKRSP and
ASA PC member farmers
136
4.34 Distribution of AKRSP and ASA PC member farmers by
Owned Land
136
4.35 Distribution of AKRSP and ASA PC member farmers by
Operated Land
137
4.36 Distribution of AKRSP and ASA PC member farmers by
livestock Owned
137
4.37 Distribution of AKRSP and ASA PC member farmers by
Source of Irrigation
137
4.38 Distribution of AKRSP and ASA PC member farmers by
Kharif cropping pattern
138
4.39 Distribution of AKRSP and ASA PC member farmers by
Rabi cropping pattern
139
4.40 Distribution of AKRSP and ASA PC member farmers by
Source of Seeds
139
4.41 Distribution of AKRSP and ASA PC member farmers by
Source of Chemical Inputs
139
4.42 Distribution of Vrutti, IGS and PRADAN PC member
farmers by Education
141
4.43 Distribution of Vrutti, IGS and PRADAN PC member
farmers by Secondary Occupation
142

xiii
4.44 Average owned and operated land holding of Vrutti, IGS
and PRADAN PC member farmers
142
4.45 Category-wise Distribution of Vrutti, IGS and PRADAN
PC member farmers by Owned land
142
4.46 Category-wise Distribution of Vrutti, IGS and PRADAN
PC member farmers by Operated Land
143
4.47 Distribution of Vrutti, IGS and PRADAN PC member
farmers by livestock ownership
143
4.48 Distribution of Distribution of Vrutti, IGS and PRADAN
PC member farmers Source of Irrigation
143
4.49 Distribution of Vrutti, IGS and PRADAN PC member
farmers by Kharif cropping pattern
144
4.50 Distribution of Vrutti, IGS and PRADAN PC member
farmers by Rabi cropping pattern
145
4.51 Distribution of Vrutti, IGS and PRADAN PC member
farmers by Summer cropping pattern
145
4.52 Distribution of Vrutti, IGS and PRADAN PC member
farmers by Source of Seeds
146
4.53 Distribution of Vrutti, IGS and PRADAN PC member
farmers by Source of Chemical Inputs
146
5.1 Profile and Performance of various PCs in WB 168
5.2 Distribution of PC member and non-member farmers by
Education
169
5.3 Distribution of PC member and non-member farmers by
Primary Occupation
169
5.4 Distribution of PC member and non-member farmers by
Secondary Occupation
170
5.5 Average Owned and Operated Land of PC Members and
Non-members (acres)
170
5.6 Distribution of PC member and non-member farmers by
Owned Land
171
5.7 Distribution of PC member and non-member farmers by
Operated Land
171
5.8 Distribution of PC member and non-member farmers by
livestock Owned
171
5.9 Distribution of PC Member and Non-member farmers by
Kharif cropping pattern
173
5.10 Distribution of PC member and non-member farmers by
Rabi cropping pattern
173
5.11 Distribution of PC member and non-member farmers by
Summer cropping pattern
174
5.12 Distribution of PC member and non-member farmers by
Source of agricultural knowledge
177
5.13 Distribution of PC member and non-member farmers by
Source of Seeds
177
5.14 Distribution of PC member and non-member farmers by
Source of Chemical Inputs
178
5.15 Distribution of PC member and non-member farmers by
Source of Bio Inputs
178

xiv
5.15A Input wise Reasons for purchase of inputs by member
farmers from PCs
179
5.16 Distribution of PC member and non-member farmers by
their Knowledge of initiatives taken by PC
180
5.17 Distribution of PC member and non-member farmers by
Knowledge of PC Name
180
5.18 Distribution of PC Member and non-member farmers by
Knowledge of PC Owner
180
5.19 Distribution of IGS and BKSL PC member farmers by
Education
182
5.20 Distribution of IGS and BKSL PC member farmers by
Primary Occupation
182
5.21 Distribution of IGS and BKSL PC member farmers by
Secondary Occupation
182
5.22 Average owned and operated land holding of members
of IGS and BKSL PC members
183
5.23 Category wise distribution of IGS and BKSL PC
member farmers by owned land
183
5.24 Category wise distribution of IGS and BKSL PC
member farmers by operated land
183
5.25 Distribution of IGS and BKSL PC member farmers by
Livestock ownership
184
5.26 Distribution of IGS and BKSL PC member farmers by
Source of Seeds
184
5.27 Distribution of IGS and BKSL PC member farmers by
Source of Chemical Inputs
185
5.28 Distribution of IGS and BKSL PC member farmers by
source of Bio-inputs
185
5.29 Season wise Average Cropped Area of members of IGS
and BKSL PCs
186
5.30 Distribution of IGS and BKSL PC member farmers by
Source of Irrigation
186
5.31 Kharif cropping pattern of IGS and BKSL PC members 187
5.32 Rabi cropping pattern of IGS and BKSL PC members 187
5.33 Summer cropping pattern of IGS and BKSL PC
members
188
5.34 Distribution of IGS and BKSL PC member farmers by
Knowledge of PC Name
189
5.35 Distribution of IGS and BKSL PC member farmers by
Knowledge of PC Owner
189
5.36 Distribution of IGS and BKSL PC member farmers by
PC Influencer
189
5.37 Distribution of IGS PC members s by Education 192
5.38 Distribution of IGS PC members by Secondary
Occupation
192
5.39 Average Owned and Operated Land of IGS PC members 193
5.40 Category-wise Distribution of IGS PC members by
Owned Land
194

xv
5.41 Category-wise Distribution of IGS PC members by
Operated Land
194
5.42 Distribution of IGS PC members by livestock Owned 195
5.43 Distribution of IGS PC members by source of general
agricultural knowledge
195
5.44 Distribution of IGS PCs members by Kharif Cropping
Pattern
197
5.45 Distribution of IGS PCs members by Rabi Cropping
Pattern
197
5.46 Distribution of IGS PCs members by Summer Cropping
Pattern
198
5.47 Distribution of IGS PCs members by Source of Seeds 199
5.48 Distribution of IGS PCs members by Source of
Chemical inputs
200
5.49 Distribution of IGS PCs members by Source of Bio
inputs
200
5.50 Distribution of IGS PCs by Knowledge about PC Name 200
5.51 Distribution of IGS PC members by Knowledge about
PC Owner
201
5.52 Distribution of IGS PC members by PC influencer 201
6.1 Profile and performance of various PCs in TN 224-225
6.2 Distribution of PC member and non-member farmers by
Education
226
6.3 Distribution of PC member and non-member farmers by
Primary Occupation
226
6.4 Distribution of PC member and non-member farmers by
Secondary Occupation
227
6.5 Average Owned and Operational Land of PC Members
and Non- Members
228
6.6 Category-wise Distribution of PC member and non-
member farmers by Owned Land
228
6.7 Category-wise Distribution of PC member and non-
member farmers by Operated Land
228
6.8 Distribution of PC member and non-member farmers by
livestock Owned
229
6.9 Distribution of PC member and non-member farmers by
Source of general agricultural knowledge
229
6.10 Kharif Cropping Pattern of PC members 231
6.11 Rabi Cropping Pattern of PC members 232
6.12 Summer Cropping Pattern of PC members 232
6.13 Kharif Cropping Pattern of Non-Members 233
6.14 Rabi Cropping Pattern of Non-Members 234
6.15 Distribution of TN member and non-member by
Knowledge of PC Name
234
6.16 Distribution of TN member and non-member by
Knowledge of PC Owner
234
6.17 Distribution of member and non-member farmers by
Source of Seeds
235

xvi
6.18 Distribution of member and non-member farmers by
Source of Chemical Inputs
236
6.19 Distribution of member and non-member farmers by
Source of Bio Inputs
236
6.19A Distribution of PC members by reasons for purchase of
inputs from PC
237
6.20 Distribution of member and non-member farmers by
their Knowledge of initiatives take by PC
238
6.21 Crop wise distribution of farmer member and produce by
channel of sale
240-241
6.22 Promoter and gender wise distribution of PC members 242
6.23 Promoter wise distribution of PC members by Education 242
6.24 Promoter wise distribution of PC members by Primary
Occupation
243
6.25 Promoter wise distribution of PC members by Secondary
Occupation
243
6.26 Distribution of PC members by Promoters and source of
general agricultural knowledge
244
6.27 Promoter wise average owned and operated land of PC
members
245
6.28 Category-wise Distribution of PC members by Promoter
and Owned land holding
245
6.29 Category wise Distribution of PC members by Promoter
and Operational land holding
246
6.30 Distribution of PC members by Promoter and livestock
owned
247
6.31 Distribution of PC members by Promoters and Source of
Seeds
248
6.32 Distribution of PC members by promoter and Source of
Chemical Inputs
249
6.33 Distribution of PC members by Promoter and source of
Bio inputs
250
6.34 Promoter wise Kharif Cropping Pattern of PC members 251-253
6.35 Promoter wise Rabi Cropping Pattern of PC members 254
6.36 Promoter wise Summer Cropping Pattern of PC
members
255
6.37 Distribution of PC Promoter members by Knowledge of
PC Name
256
6.38 Distribution of PC members by Promoter and
Knowledge of PC Owner
257
6.39 Distribution of SEEDS PC members by Education 257
6.40 Distribution of SEEDS PC members by Primary
Occupation
258
6.41 Distribution of SEEDS PC members by Secondary
Occupation
258
6.42 Distribution of SEEDS PC members by Source of
general agriculture knowledge
259
6.43 Average Owned and Operated Land of PC members 259

xvii
6.44 Category wise Distribution of SEEDS PC members by
Owned Land
259
6.45 Category wise Distribution of SEEDS PC members by
Operated Land
260
6.46 Distribution of SEEDS PC members by Livestock
ownership
260
6.47 Distribution of SEEDS PC members by Knowledge of
PC Name
261
6.48 Distribution of SEEDS PC members by Knowledge of
PC Owner
261
6.49 Distribution of SEEDS PC members by source of seed 262
6.50 Distribution of SEEDS PC members by source of
chemical inputs
262
6.51 Distribution of SEEDS PC members by source of Bio
inputs
263
6.52 Distribution of SEEDS members by Knowledge of PC
Name
263
6.53 Distribution of SEEDS members by Knowledge of PC
Owner
263
6.54 Kharif Cropping Pattern of SEEDS PC members 264
6.55 Rabi Cropping Pattern of SEEDS PC members 265
6.56 Distribution of Dhan/KTL PC members by Gender 266
6.57 Distribution of Dhan/KTL PC members by Education 267
6.58 Distribution of Dhan/KTL PC members by Secondary
Occupation
267
6.59 Distribution of Dhan/KTL PC members by source of
general agricultural knowledge
268
6.60 Average owned and operated land of Dhan/KTL PC
members
268
6.61 Category-wise Distribution of Dhan/KTL PC members
by Owned land holding
269
6.62 Category-wise Distribution of Dhan/KTL PC members
by Operated land holding
270
6.63 Distribution of Dhan/KTL PC members by livestock
owned
270
6.64 Distribution of Dhan/KTL PC members by Source of
Seeds
271
6.65 Distribution of Dhan/KTL PC members by Source of
Chemical inputs
272
6.66 Distribution of Dhan/KTL PC members by Source of
Bio inputs
272
6.67 Kharif Cropping Pattern of Dhan/KTL PC members 273
6.68 Rabi Cropping Pattern of Dhan/KTL PC members 274
6.69 Distribution of KTL/Dhan PC members by Knowledge
of PC Name
274
6.70 Distribution of KTL/Dhan PC members by Knowledge
of PC Owner
275
6.71 Distribution of ESAF PC members by Gender 275

xviii
6.72 Distribution of ESAF PC members by Primary
Occupation
276
6.73 Distribution of ESAF PC members by Secondary
Occupation
276
6.74 Distribution of ESAF PC members by Education 277
6.75 Average owned and operational land of ESAF PC
members
277
6.76 Distribution of ESAF PC members by Owned land
holding
278
6.77 Distribution of ESAF PC members by Operational land
holding
278
6.78 Distribution of ESAF PC members by livestock owned 279
6.79 Distribution of ESAF members by source of general
agricultural knowledge
279
6.80 Distribution of ESAF PC members by Source of Seeds 280
6.81 Distribution of ESAF PC members by Source of
Chemical inputs
281
6.82 Distribution of ESAF PC members by Source of Bio
inputs
282
6.83 Distribution of ESAF PC members by Knowledge of PC
Name
282
6.84 Distribution of ESAF PC members by Knowledge of PC
Owner
282
6.85 Distribution of Goat PC members by Primary
Occupation
283
6.86 Distribution of Goat PC members by Secondary
Occupation
284
6.87 Category-wise Distribution of Goat PC members by
Owned land holding
284
6.88 Category-wise Distribution of Goat PC members by
Operated land holding
284
6.89 Distribution of Goat PC members by livestock owned 285
6.90 Distribution of Goat PC members by Knowledge of PC
Name
285
6.91 Distribution of Goat PC members by Knowledge of PC
owner
285
7.1 State-wise Average owned and operated land of PC
members and non-members
308
7.2 Distribution of member and non-member farmers by
awareness of PC name
309
7.3 State-wise distribution of PC members and non-
members by Knowledge of ownership of PC
311
7.4 State-wise distribution of PC members by influencer for
joining PC
312
7.5 Distribution of PC members and non-members by source
of Seeds
312
7.6 Distribution of PC members and non-members by source
of chemical inputs
313

xix
7.7 Distribution of PC members and non-members by source
of bio-inputs
313
7.8 Crop and channel wise sale of output by all PC members
across five states (2019 v/s 3 years before)
321-322
7.9 State wise distribution of PC members by schemes and
subsidies information provided by PCs
323
7.9A State-wise composition of membership of PCs
(excluding all women PCs) by gender
323
7.10 State-wise Distribution of PC members by subsidy
availed
324
7.11 State-wise Distribution of members of PCs for dislike of
services offered by the PC
325
7.12 State –wise Distribution of PC members by their
perception of frequency of meetings of the PC
324
7.13 State –wise Distribution of PC members by their
frequency of attendance in meetings of the PC
326
7.14 State wise Distribution of PC members by intention to
continue as members
326
7.15 State-wise distribution of members by intention to
encourage others to become members of the PC
326
7.16 State-wise Distribution of PC members by suggestions
for new products/services
327
7.17 State-wise Distribution of PC members by their
suggestions for improvement of governance of PC
328
7.18 State-wise Distribution of PC members by suggestions
for better management of PC
328

xx
List of Appendix tables
2.1 Profile and Performance of Saahaj MPC 53
2.1 Profile and Performance of the GDPC 54
2.3 Profile and Performance of Naveen Kisan PC 57
2.4 Profile Performance of NJ Kisan PC 59
2.5 Profile and Performance of Krishi Vikas PC 60
3.1 Profile and Performance of Payaas PC 98
3.2 Profile and Performance of Shree Dev Mahila PC 100
3.3 Profile and Performance of Khandar Agro PC 101
3.4 Profile and Performance of Shekhawati FPC 102
3.5 Profile and Performance of Molasar SKS PC 103
4.1 Profile and Performance of Ranapur Mahila Tribal PC 153
4.2 Profile and Performance of Alirajpur PC 154
4.3 Profile and Performance of Newali PC 156
4.4 Profile and Performance of Pandhana PC 158
4.5 Profile and Performance of Chirayu Women PC 159
4.6 Profile and Performance of Mhow Agri PC 162
4.7 Profile and Performance of Betul PC 163
4.8 Profile and Performance of RR Pragati PC 165
5.1 Profile and Performance of Hooghly Veg growers PC 205
5.2 Profile and Performance of Shimlapal Agro PC 207
5.3 Profile and Performance of Chhatna Agro PC 209
5.4 Profile and Performance of Birbhum PC 215
5.5 Profile and Performance of Shantiniketan PC 218
5.6 Profile and Performance of Saptarishi FPO 220
5.7 Profile and Performance of Gram Saathi PC 221
6.1 Profile and Performance of SEEDS PC 290
6.2 Profile and Performance of VAF PC 293
6.3 Profile and Performance of Thuthukudi pulses PC 294
6.4 Profile and Performance of Illupur PC 299
6.5 Profile and Performance of Kotampatti PC 301
6.6 Profile and Performance of Usilampatti PC 302
6.7 Profile and Performance of Periyakulum PC 303
6.8 Profile and Performance of Koda Hills PC 304
6.9 Profile and Performance of Theni Goat PC 307
7.1 Paired t-test for means of owned and operated land
holdings of members and non-members
336

xxi
List of photos
2.1 Office of Naveen Kissan PC & Banana crop in a member’s farm 55
2.2 NPM promotion and documentation by the PC 56
3.1 A milk collection centre of Paayas and details of membership and
procurement
97
3.2 Office cum godown of Shree Dev Mahila KPC 99
3.3 Molasar SKS PC office and a share certificate of a shareholder 103
4.1 Small farmers in MP 153
4.2 Office cum retail outlet of Nevali FPC 155
4.3 Maize being dried in MP after harvesting and threshing 160
4.4 Office cum farm input sales of Mhow APC 161
4.5 Newly constructed modern warehouse of RRPPC 164
5.1 Paddy being threshed (semi-mechanically) in a village in West Bengal 204
5.2 Exterior of a PC run Sufal Bangla supermarket in Bankura 208
5.3 Interior of Sufal Bangla and Price list 208
5.4 Vegetable being sold from a Sufal Bangla supermarket 210
5.5 Sufal Bangla supermarket in Birbhum 212
5.6 Office-cum-godown-cum retail outlet of Birbhum FAPC 214
5.7 Office-cum- retail outlet of Shantiniketan KUPC 217
5.8 Sarojini brand of spices of Gram Saathi PC 221
6.1 TNSCM provided office, warehouse and cold room at Vizuthugal
AFPC
291
6.2 A spice processing facility and a retail outlet of Vizuthugal AFPC 292
6.3 Dry chilies at the local APMC market yard 292
6.4 A drying yard/ warehouse and grading and processing machines at
Illupur PC
298
6.5 A poultry farm and free-range birds at Illupur PC complex 299
6.6 A view of the office and storage complex provided by TNSCM
project of GoTN
300
6.7 A locked milk collection center of PMPVC in a village 303
6.8 Coffee plantation and wet and dry coffee beans in the PC area 304
6.9 Theni goat and goat pens in a village in PC area 306
6.10 A retail outlet of PC at its office complex 306

xxii
List of Abbreviations
ABPU Agri Business Promotion Unit
ACF Ambuja Cement Foundation
ADO Agricultural Development office
AGM Annual General Meeting
AIF Agricultural Infrastructure Fund
AKRSPI Aga Khan Rural Support Programme India
AEZ Agri Export Zone
APF Azim Premji Foundation
AGDP Agricultural Gross Domestic Product
AI Artificial insemination
AIC Agriculture Insurance Company
APG Agricultural Produce Group
APMC Agricultural Produce Market Committee
ASA Action for Social Advancement
ATMA Agricultural Technology Management Agency
BAIF Bharatia Agro-Industries Foundation
BBY Bhavantar Bhugtaan Yojana (deficiency price payment scheme)
BC Backward class
BCI Better Cotton Initiative
BCKV Bidhan Chandra Krishi Vishwavidyalaya
BCTS Basix consulting and technical services
BIRD Bankers Institute of Rural Development
BKS Bhartiya Kissan Sangh
BMC Bulk Milk Coolers
BoD Board of Directors
BPL Below Poverty Line
BRLF Bharat Rural Livelihood Foundation
BSKL Basix Krishi samruddhi limited
CA Chartered Accountant
CBBO Cluster based business organization
CCD Centre for Collective Development
C-DAC Centre for Development of Advanced Computing
CDO Community Development Officer
CEO Chief Executive Officer
CHC Custom hiring centre
CIG Common Interest Group
CIKS Centre for Indian Knowledge Systems
CMAP Centre for Medicinal and Aromatic Plants
CoL Commonwealth of Learning
CSR Corporate Social Responsibility
DAC&FW Department of Agriculture, co-operatives and farmer welfare
DADF Department of Animal Husbandry, Dairying and Fisheries
DCCB District Central Co-operative Bank
DCS Dairy Co-op Society
DIN Director Identification Number

xxiii
DOC De-Oiled Cake
DPIP District Poverty Initiative Project
ECA Essential Commodities Act
E-NAM Electronic National Agriculture Market
FBG Farmer Business Group
FC Farmers Club
FIG Farmer Interest Group
FPC Farmer Producer Company
FPO Farmer Producer Organization
FSC Farmer Specialized Cooperatives
FSSAI Food Safety Standards Authority of India
FWWB Friends of Women’s World Banking
GCA Gross cropped area
GCMMF Gujarat co-op milk marketing federation
GDP Gross Domestic Product
GDPC Gram Development PC
GFI Global Fairness Initiative
GPRS General Packet Radio service
GSDP Gross state domestic product
GST Goods and Services Tax
ICS Internal Control Systems
IFFCO Indian Farmers Fertiliser Cooperative
IFFDC Indian Farm Forestry Development Co-operative
IGS Indian Gramin Services
IIP Indian Institute of Packaging
IOPCL Indian Organic Producer Company Limited
ISAP Indian society for agribusiness professionals
ITC Indian Tobacco Company
JLG Joint Liability Group
KCC Kissan Credit Card
KTL Kalanjium Thozhilagam Limited
KVK Krishi Vigyan Kendra
LIC Life Insurance Corporation
LRP Local resource person
LSP Livelihood support professional
MARKFED State Agricultural Co-operative Marketing Federation
MBCFPCL M.P. Consortium of Farmer Producer Companies Limited
MBT Mutual Benefit Trust
MCA Ministry of Corporate Affairs
MCC Milk Chilling Centre
MCX Multi Commodity Exchange
MDM Mid-Day Meal
MFI Micro-Finance institution
MKSP Mahila Kisan Sasaktikaran Pariyojana
MoAFW Ministry of Agriculture and Farmers' Welfare
MPDPIP Madhya Pradesh District Poverty Initiative Project
MGNREGS Mahatma Gandhi National Rural Employment Guarantee Scheme
MGNREGA Mahatma Gandhi National Rural Employment Guarantee Act
MIDH Mission on Integrated Development of Horticulture
MIS Management information system

xxiv
M.P. Madhya Pradesh
MPC Milk Producer Company
MRG Member Relation Group
MRP Maximum Retail Price
MRL Maximum Residue Limit
MSDA Mission on Sustainable Development of Agriculture
MSP Minimum Support Price
NAFED National Agricultural Cooperative Marketing Federation of India Ltd
NABARD National Bank for Agriculture and Rural Development
NABCONS NABARD Consultancy Services
NADP National Agricultural development Project
NBFC Non-Banking Financial Company
NCDC National Cooperative Development Corporation
NCDEX National Commodities and Derivatives Exchange
NCR National Capital Region
NDDB National Dairy Development Board
NeML Nationale E-market Limited
NFSM National Food Security Mission
NGC New Generation Co-operative
NGO Non Government Organization
NIAM National Institute of Agricultural Marketing
NIPHM National Institute of Plant Health management
NKPCL Navin Kisan PCL
NJPCL NavJoyti PCL
NPM Non-Pesticidal Management (of crops)
NRLM National Rural Livelihoods Mission
NSC National Seeds Corporation
OBC Other Backward Classes
OGCF Onion Growers Co-operative Federation
OPG Organic Producer Group
PACS Primary Agricultural Credit Society
PAN Permanent Account Number
PC Producer Company
PO Producer Organisation
PODF Producers Organization Development Fund
POPI Producer organisation promoting institution
PPC Primary Processing Centre
PRADAN Professional Assistance for Development Action
PUC Paid Up Capital
RBI Reserve Bank of India
RCDF Rajasthan co-op dairy federation
RF Reliance Foundation
RI Resource institution
RKVY Rashtriya Krishi Vikas Yojana
RoC Registrar of Companies
RSETI Rural Self-Employment Training Institute
SAU State Agricultural University
SAIC State Agro-industries Corporation
SAPCO Sahaja Aharam PC
SC Schedule Caste

xxv
SCM Supply Chain Management
SEBI Securities and Exchange Board of India
SEWA Self-Employed Women Association
SGDP State Gross Domestic Product
SHG Self Help Group
SHPL Safe Harvest Private Ltd.
SFAC Small Farmers Agri-Business Consortium
SLCC State Level Consultative Committee
SMS Short Messaging Service
SRLM State rural Livelihoods Mission
SRTT Sir Ratan Tata Trust
SSC State Seeds Corporation
ST Schedule Tribe
TFA Tank Farmers’ Association
T.N. Tamilnadu
TNAU Tamil Nadu Agricultural University
TNSFAC Tamilnadu Small farmers Agribusiness Consortium
TTGB Tata Tea Global Beverages
TV Television
UMB Urea Molasses Block
U.P. Uttar Pradesh
UPBSN U.P. Bhumi Sudhar Nigam
VCG Village Cotton Group
W.B. West Bengal
WUA Water Users’ Association
WFGP Women Farmers with Global Potential

I
Executive Summary
Introduction
Primary Producers’ organizations or collectivities are being argued to be the only institutions
which can protect small farmers from globalization by helping farmers buy or sell better due
to scale benefits, lower transaction cost, technical help in production, and creating social
capital. Producers’ Organisations (POs) can also help appropriate a part of the value created in
the chain by private sector, for their members. But, POs still struggle to become successful,
and even a successful PO runs the risk of facing the various challenges from factors like, socio-
economic-environmental context, group characteristics, externalities, level of PO, relationship
with higher level collective and performance framework for the collective which may prevent
it to remain effective and competitive in the local system in the long run. But, the factors
affecting the POs are dynamic, and the POs need to continuously innovate to counter those
challenges.
POs in India can be registered as either Cooperative Societies Act, Autonomous or Mutually
Aided Cooperative Societies Act, Multi-State Cooperative Society Act, Producer Company
(PC) or Public Trusts. Until recently, in India and many other developing countries, collectives
were mostly organised under the co-operative structure. However, cooperative structure in
India doesn’t give the needed freedom to operate in complex environment for large scale
cooperatives and due to political interference, corruption, elite capture, and similar issues, the
cooperatives soon lost their vibrancy and became known for their poor efficiency and loss-
making ways. Also, they face higher competition due to privatisation and liberalisation
policies. The major problems of traditional cooperatives have been capital constraint due to the
withdrawal of financial support by the government, high competition from other players in the
market, and access to credit (capital) and technology, besides free riding by members. In fact,
internal and external free riding problems originate in the very nature of the co-operative as an
institution as it distributes profits based on patronage and not investment. The horizon problem
occurs as members can’t trade shares at market price, and thus, they can’t capitalise their gains
when they leave the co-operative. Non-tradability of equity shares at market prices also creates
portfolio problem as members can’t diversify their portfolio to reflect their risk preferences.
Additionally, influence problem distances investors from control as there is only one member
one vote.
In order to escape from this difficulty of co-operative enterprise, NGCs had emerged in many
parts of the world during the 1990s. This arrangement by cooperatives helps them become
economically efficient, financially viable, and obtain member loyalty. In practice, though the
NGCs have been able to raise 30-50% of their total capital through delivery rights issues, the
problems include: (i) off market purchases to meet contract terms by the growers; (ii) leasing
of delivery rights by members; and (iii) dependence on non-producer member equity and non-
member business.
An amendment was made to the Companies Act, 1956 in 2003 in India, to include Producer
Companies (PCs). India is the second Asian country after Sri Lanka (where they mostly failed)
to try this form of PO (Singh, 2016). A similar entity called Farmer Professional Co-operatives-
in China were granted clear legal status as independent and democratically administered
organisations in 2007 registered under the State Administration of Industry and Commerce
(SAIC). PCs try to establish principles of profit-oriented contemporary business organizations
within farming communities, to connect them with corporate buyers from the rapidly

II
transforming Indian retail landscape. It gives more freedom to cooperatives as companies to
operate as business entities in a competitive market. For details of PC features and structure
and their departure from or similarity with cooperatives, see Singh and Singh, 2014.
The Union Government and certain promoting agencies have now started promoting PCs by
creating financial and non-financial aids for them. In 2012, the Ministry of Agriculture had
advised all the state governments to treat PCs at par with the co-operatives for various policy
incentives. The Department of Animal Husbandry, Dairying and Fisheries (DADF) had
declared that in addition to cooperatives, PCs shall also be eligible for assistance under
National Dairy Plan (Anonymous, 2018). The Reserve Bank of India had put PCs under priority
sector lending upto Rs. 50 million per PC. The Union Budget for 2013-14, had major initiatives
to support PCs including the equity grant support of Rs 10.00 lakh per PC, with a provision of
Rs. 50 crore and a credit guarantee fund for PCs through Small Farmers’ Agribusiness
Consortium (SFAC) with allocation of Rs. 100 crore (refer Singh and Singh, 2014 for details).
NABARD had been given a mandate to promote 2000 PCs in two years with Rs. 200 crore
funds in 2014-15. This led to the State government involvement in direct promotion of PCs
e.g. in Karnataka. Development agencies like Friends of Women's World Banking (FWWB)
and ICCO have been helping PCs with loans and capacity building grants. In the Union budget
2018-19, Operation Greens with an allocation of Rs. 500 crore to address price fluctuation in
three vegetables– Tomato, Onion and Potato (TOP) crops for the benefit of farmers and
consumers was announced. It aims at promotion of, agri-logistics, processing facilities and
professional management through the FPOs/PCs. Also, 100% income tax exemption for PCs
upto annual turnover of Rs. 100 crore was made available for five years in 2018-19.
The SFAC strategy paper (2019) on promoting 10,000 new FPOs lists various challenges in
promotion of FPOs and proposes to support 250 new FPOs in the first year and 1000 in second
year followed by 2500 in the third and 4500 in the fourth year with 1750 in the 5th year with
25% funds going for FPO formation and incubation with Rs. 25 lakh per FPO for five years
and another 30% for FPO management @ Rs. 18 lakh per FPO over three years. Beside, 25%
would go for equity grant of Rs. 15 lakh each. It also brings in the concept of cluster based
business organisations (CBBOs) for FPO promotion instead of depending on NGOs. This is
important departure from the past as in the past majority of FPOs were promoted by local and
national NGOs. Therefore, it is important to examine the promotion strategies of the NGO and
professional promoters which this study takes into account and therefore focusses on the
performance of PCs promoted by different type of promoting agencies like NGOS, professional
Agencies like ISAP and IGS.
Only some states of India seem to have a conducive policy environment for PCs which include:
Madhya Pradesh, Karnataka, Maharashtra West Bengal and Rajasthan. The states of
Karnataka, Orissa and Telangana have state specific FPO policies. Tamil Nadu government
allocated Rs.100 crore for the current year to support 200 FPOs. The Doubling of Farmer
Income (DFI) committee recommends a minimum of 7000 FPOs by 2020-23. In seven states
of Maharashtra, Madhya Pradesh, Uttar Pradesh, Rajasthan, Gujarat, Karnataka, Telangana,
80% of the FPOs were registered as PCs as of 2018. 60% of the PCs were in the states of
Maharashtra, Uttar Pradesh, Tamil Nadu, Madhya Pradesh, Rajasthan and Karnataka. In fact,
West Bengal and Maharashtra are among those states which have added 50% or more of their
PCs during the last three years only. The seven-state study also showed that 92% of the member
farmers were marginal or small, 16% women and 12% were tribal farmers. Unlike in Sri Lanka,
member farmers in India were sensitized to the need of larger legal entities and then brought
on board. Scale and scope of market linkages were important factors in performance. And so,

III
multi-product based PCs and the ones in high value business were more successful than others.
However, there are not many serious academic studies on PCs in India considering the fact that
PC Act has existed since 2003, with a few exceptions like Trebbin, 2012, and Singh and Singh,
2014.
There are many types of promoting agencies in India which include: SFAC and NABARD as
national level public bodies, State Governments and their agencies leveraging RKVY or the
World Bank funds, NRLM Programme (MoRD), Other NGOs/Trust/Foundations like Bill &
Melinda Gates Foundation, TATA Trust, Reliance Foundation, Ambuja Cement Foundation,
HDFC Foundation, C&A Foundation, HSBC CSR, Axis Bank Foundation, Jindal Steel
&Power Ltd. and Syngenta foundation. Each one has its own model of organising and
promoting the FPCs. It is important to examine the models of major players especially those
supported by SFAC, NABARD and state government agencies and some large independent
NGOs like AKRSPI.
There has not been adequate academic and professional examination of the issues facing the
PC domain which are practice and policy relevant. Some of these research issues are: How far
PCs are an improvement over the existing co-operative or other models of producer
organization? How relevant and appropriate are the PCs in the context of globalised markets?
Is there a design aspect of the PC which matters and should be provided as an intervention? Is
there any specificity about the crop or enterprise which matters e.g. commodities or high value
crops? Who is more relevant promoter for a PC– state or civil society or private sector? What
conditions are necessary for business and economic viability of PCs? Are PCs with higher
levels of skills and capabilities more successful in working with modern markets as scale and
scope become important to do viable business? Which model of promotion is more robust and
viable? What kind of policy treatment do the PCs need to grow as vibrant producer entities
and to make an impact on the livelihoods of small producers? How do innovations in PC take
place and what makes them scale up- inclusive or sustainable?
The study examines the performance and impact of PCs across resource institutions and states
by-
i. Assessing physical and financial performance of PCs over the years
ii. Understanding the factors that influence the performance of PCs and document the best
practices followed by successful PCs and reasons behind those that failed
iii. Comparing and contracting different models of PC organisation and promotion for
identifying more robust models for scale up
iv. Comparing the performance of specialised PCs like all women or special domain PC
with rest of the PCs and analysing the factors in differential performance
v. Examining economic impact on member farmers, and
vi. Inferring on policy and practice mechanism for improving performance of PCs.
Infact, in 2018, 50% of the members of FPOs were in four states of Karnataka, MP, Tamilnadu
and WB. The highest number of RIs/POPIs was in Karnataka (85) which was 9% of all
promoting agencies in India. The five study states had 39% of SFAC supported FPOs and 35%
of NABARD supported FPOs and in total they accounted for 36% of all FPOS in India
supported by these two agencies. These states had 28% of NABARD POPIs and 39% of SFAC
RIs and altogether they had 28% of all promoting agencies in India.

IV
These PCs were evaluated in terms of their physical and financial performance by analysing
and comparing their net worth, net profit, the ratio of equity capital mobilized to authorised
equity capital, payment of dividends, external facilitator support and corporate linkages from
annual reports and business plans of past few years, and interviews of CEOs, managers, board
members and key person of promoting agency for the respective PC.
In each case study PC and other FPO in neighbourhood (if there), 10 member farmers and 10
non-member farmers were interviewed. This was to compare impact of PC in terms of both,
before and after the intervention of PC, and with and without the intervention of PC and even
with non-FPC format organisation. The total sample for farmers was 333 member farmers and
332 non-member farmers, totalling to 665 across 33 PCs and 2 non-PC FPOs across U.P. (5
PCs), M.P. (9), Rajasthan (5), WB (7), and Tamilnadu (9) which included four all women PCs,
two goatery PCs (all women) and two non-PC FPOs. They were interviewed to assess the
involvement of members in PC and if PCs had substantially impacted the economic activity of
members and their income based on parameters like proportion of produce sold through PCs,
inputs bought from PCs, difference in yield and price of their produce after the intervention of
PCs, and significant increase in income due to crop diversification.
PCs in U.P.
The state is a laggard in co-operative performance and even in the setting up the PCs until
recently. In U.P., of the PCs promoted by NGO/professional development agencies, the
authorized capital was modest (from Rs. 5-15 lakh) and most of them except one (Navjyoti)
had mobilised that. Their turnover was significant enough (Rs. 50-88 lakh) except in case of
one (Naveen Kisan) which could not go beyond Rs. 16 lakh. Most of them except one (GDPC)
had small profits and most of them (except Navjyoti) had reserves as well (table 2.1). These
PCs showed average performance on various parameters of input and output business. But,
they suffered from lack of scale as all of them had only 1000 members each despite the fact
that they had been in existence for more than five years each.
In case of one PC, the equity shares remained confined to a large extent with the promoters and
a few members only until recently. 48% of the shares were held by just eight members in 2016-
17 which is not a desirable thing for a PC though it may be needed initially but continuing with
it for years is not a positive approach.
On the other hand, Saahaj of NDS of NDDB was a class apart in many ways as it had scale in
terms of membership, equity base and level of business turnover besides the fact that it dealt
with a high value produce- milk. It had profits of the order of Rs. 13 core and had mobilised
most of its authorised capital which was of the order of Rs. 30 crore and earlier Rs. 20 crore.
50% members supply milk exclusively to Saahaj. Another reason for Sahaaj’s better
performance was the governance and business models which were very tight and fool-proof. It
relied on low -asset -high turnover model and strictly enforced member discipline besides the
professional input it had from the NDDB team which is known for their expertise in promoting
milk producer co-operatives. This is one of the 6 PC promoted by the NDS across six states
and was one of the first ones.
Seven farmer reported selling milk to PC in case of buffalo milk and 4 farmers selling to PC
cow milk where the quantity of milk supplied had increased over the last three years. Four
member of buffalo milk and three members of cow milk were still selling to the other FPOs as

V
the same time. And other channels like local dairy had declined completely as were other co-
operatives in the area in the case of members. As against this, in case of non-members, only
four farmers out of eight buffalo milk famers reported selling to other milk FPO even now in
case of buffalo milk and other 3 continuing with local dairy out of 4 such cow milk producers.
There was significant increase (29%) in the number of buffaloes owned by farmer member and
also increase in milk yield by 25-50% and therefore, marketed surplus increased by 62-110%
in case of buffalo and cow milk respectively. The sale price also had gone up by 16% and 12%
over the last few years.
The average owned land for non-milk PC members was only 2.28 acres and operated land 2.91
acres. 90% of the farmers were marginal or small by owned land and 88% by operated land.
The small and marginal categories had 64% of the owned land and only 71% of the operated
land while there were no medium farmers by ownership or operation. Even semi medium, and
medium categories which had more than 35% of the owned land, cultivated only 29%. The
average owned land for members was only 2.28 acres and operated land 2.91 acres. 90% of the
farmers were marginal or small by owned land and 88% by operated land. The small and
marginal categories had 64% of the owned land and only 71% of the operated land while there
were no medium farmers by ownership or operation. Even semi medium, and medium
categories which had more than 35% of the owned land, cultivated only 29%.
Interestingly, 88% members knew the name of the PC and some others knowing it by some
other name (6%). Only 6% did not know the name of the PC. 57% members knew that the PC
is owned by the farmer members with others reporting BOD (14%), PC employees (10%) and
promoting agency (4%) as the owners. Even 77% non-member farmers knew about the PC but
only 13% of them thought it is owned by farmers. 50% of them had learnt about it from the
PC and its employees and promoters. 48% also wanted to become a members of the PC but
had not become mainly because they were not aware whether they could become member and
no one had approached them. Similarly, those who expressed no desire to become members
said so because they had no information or they were not interested for various reasons.
56% member farmers purchased seeds from the PC and 27% from both PC and dealers. For
chemical fertilisers and chemical pesticides 70% of the members got it from the PC and 15%
from dealers and 7% from both. On the other hand, bio-fertilisers and bio-pesticides was used
by few farmers, though here too, 2/3rd of them bought from the PC. The seed purchase by non-
member farmers was mostly from dealers (33%) or both dealers and PC (31%) with only 12%
buying exclusively from the PC. For chemical fertiliser and pesticides, the dealers were the
major sources for 54% of farmers each. The PC accounted for 25% and 20% of the farmers for
both of these chemical inputs. Bio fertiliser and bio pesticides being used by the small
proportionate of the farmers had PC as the important source with 50% or more farmers
reporting it as the source of purchase.
Before the intervention of the PC, only some farmers had sold wheat through the PC and one
farmer each sold banana and potato. After the PC intervention, the number of potato farmers
selling through the PC had increased to two. In terms of proportion of output sold, the PC
accounted for 10% of wheat and potato and 9% of banana before the intervention and it had
gone up only in case of potato at 13%.
The input services were reported by even non-members to have improved after the intervention
of PC to some extent and the area under crops like paddy, wheat, mustard, millets and potato
and even maize and garlic had increased in the last few years. The sale price realised had

VI
significantly increased in paddy, potato, millets and garlic after the PC intervention. However,
the payments were delayed even further in wheat and paddy and menthe after the intervention.
More than 50% PC members had problems with services of the PCs which included inadequate
input supply and lack of timely availability, low procurement, low price realisation and not
procuring at all. 80% received no information about govt schemes or subsides while others
mentioned knowing new schemes, subsidies on farm inputs like seeds and fertilisers and the
like. Only 4% had received nay subsidy benefit as a member. 71% had no knowledge about
activities of the PCs while others mentioned input supply, knowledge sharing, custom rentals
of farm machinery and warehousing facility besides NPM and new crops.
Only 36% members attended meetings regularly with another 56% only sometime and 50%
reported monthly meetings being held and 20% only quarterly. Interestingly, 98% waned to
continue as members due to benefits like good input supply, benefits of membership, timely
supply of inputs, and good quantity of supplies, besides knowledge about farming and markets.
74% also wanted to encourage others to join the PC due to its various benefits while others
who were not excited mentioned that already most farmers were members of the PCs, or others
were not interested and they did not have time for such activity. 66% had suggestions for
improvement which included: procurement of output, farm machinery rentals, better price
realisation and warehousing and weighing facilities.
BKSL PC farmers were somewhat larger owners of land but they did not lease in as much as
the BCTS PC members and, therefore, the latter were larger operators of land. 57% of the
BKSL PC members purchased seeds from PC against 55% of the BCTS PC members. PC and
Dealers (19%) and agricultural department & dealers (10%) were other major sources for
BKSL PC member farmers while PC & dealers (35%) and PC & local farmers (10%) for BCTS
PC member farmer. Just one member farmer each reported selling banana, potato and mint
through one of the PCs each in case of each promoter during the last three years.
The PCs were male dominated in their members in all cases and both the promoters worked
with mostly marginal and small land owners and operators with average being around 2 or 3
acres of land owned or operated. This is the most comforting aspect of the PCs is that they
really represent the marginalised sections of the farming community. Also, the awareness of
members regarding PC and its ownership was significant in case of both the promoters who
were from the same group of promoters i.e. BASIX. All of them were in loss or made
negligible profits. It was only the milk PC which stood apart in every which way in terms of
membership, revenue and profits and mobilised capital. It was mostly due to the nature f its
business i.e. milk and its governance model which included asset light high turnover strategy
and professional management and tight governance of the PC.
PCs in Rajasthan
Rajasthan had 224 FPOs in early 2017 with 1.1 lakh farmer members mostly under NABARD
support (63%), SFAC (18%) and RKVY (17% ) and a few by private sector CSR(2%) (GoR,
2017). Most of the case study PCs other than Paayas and Molasar could not mobilise enough
equity capital from their members. It was not even 70% even after a few years of the existence
of the PCs. Two of them were stuck at just 20% and 32% each of the authorised capital which
itself was small i.e. Rs. 5 lakh each in case of each of the PCs promoted by ISAP. Further, all
of the non-Paayas PCs made losses throughout their existence. Consequently, they had nil or
negative reserves and surpluses and minimal assets. The main reason for this was their low
turnover which was a few lakh rupees each except one (Shekhawati).

VII
Compared with this, the milk PC had turnover which ran into more than Rs. 100 crore per year
and it had generated profits of the order of more than Rs. 10 lakh per year and surplus of Rs.
29-61 crore per year. The low turnover in case of the ISAP PCs was for the reason that they
had not undertaken much output side business so far and were mainly supplying farm inputs to
members and non-members. Even IGS promoted PCs had undertaken only some procurement
for the SFAC at MSP which helped them stay afloat for some time as they received some
commission and service charges for it. This helped one of them to receive matching equity
grant and another a capacity building grant from SFAC though they had no business plans of
any significance.
Average land owned by a member milk producer was 1.3 acres with all of them being marginal
or landless farmers. In terms of operated land which was on average 1.4 acres, the distribution
of farmers remained the same. The average owned land among non-members was 2 acres with
83% marginal and 17% semi-medium. Due to some leasing in and leasing out, average
operated land was of the order of 2.3 acres with 67% operators being marginal scale, 23% small
and 8% semi-medium. The latter 8% farmers accounted for 21% of the operated area.
Interestingly there was no farmer in the category of medium or large farmer in terms of
ownership and operation of land. Most of the members (90%) had buffaloes, and 40% and 30%
each respectively had cows and goats with average holding of two buffaloes and one cow or
goat each. In fact, buffaloes accounted for 70% of livestock and cows and goats 1% and 13%
each respectively. Non -member farmers had large livestock holdings of four buffaloes or cows
each and three goats. But buffaloes accounted for only 50% of total livestock and cows and
goats 45% and 5% each respectively, all farmers had buffaloes and most had cows but only
15% had goats.
Cattle feed was reported be bought from PC by 90% member farmers as it was door delivered
and had better quality, lower price and no other reliable source. On the other hand, only 17%
non-members reported buying from PC/DCS and others (33%) buying from dealers and 25%
not using it at all. Some others (17%) bought it from other FPOs and 8% from both dealers and
DCS. So far as purchase of various crop seeds was concerned, non-members were mostly
dependent on dealers and in some cases PACS. Only in case of barley and guar, they reported
buying seeds from milk PC in 20% cases were reasons of better quality. Most of the other
inputs were also largely bought from dealers with only 36% reporting exclusive purchase of
chemical fertilisers from PACS. Only in the case of cattle feed 23% farmers reported buying
from the PC because of better quality and timely availability with other important sources
besides dealer being other cooperatives like PACS and farmer groups.
All the farmers reported receiving dividends on their share capital and 80% didn’t have any
complaint against the functioning of the PC. They reported better satisfaction level on the
availability, quantity, cost, quality and accessibility of cattle feed, moving from good to very
good or excellent on most parameters after the intervention of the PC.
40% farmers also reported PC making them aware of various government schemes and 30%
about receiving special subsidy due to the PC. 80% attended the meetings every month and all
of them wanted to continue as members of the PC because of its responsiveness, transparency
and profitable interface besides quick payment and good service delivery. All of them also
wanted others to join the PC because they were getting good benefits including good price and
profits on their produce.

VIII
There was 60% increase in buffalo milk sale because of the PC intervention though the price
came down more recently compared with the alternative channels of sale. Whereas only 60%
sold to the PC a few years ago, 100% started selling to it after a few years of it coming in. In
terms of channels, earlier they dealt with traditional cooperative and the PC and have since
moved over to PC completely.
25% non-member farmers reported membership of another FPO which was the local milk
cooperative society (DCS of RCDF) and they had been the members of the same for last many
years. None of them reported receiving any information about agriculture or animal husbandry
from the PC and depended mostly on private companies, agri department office and the
combination of non-personal and personal extension sources. In fact, 83% of them were aware
of the milk PC and 42% reported that it was owned by farmers. A significant proportion of
them (25% of the total) had learnt about it from PC employees or promoters. Only 33% showed
interest in becoming the member of the milk PC. They were not members yet due to reasons
like location, presence of other channels and availability of other benefits from those sources
and the fact that some of them could not meet the quality standards of the PC.
The milk PC members were really marginal or landless land operators and livestock rearers.
The PC made good impact on their livelihoods with various interventions like input supply and
milk procurement besides supply of fodder seed and other services.
In case of non-milk PCs the average land ownership was 8.2 acres with 5% being landless and
24% each being small or medium land owners and 29% semi medium farmers. Only 2% were
in the large farmer category. Due to the leasing in and leasing out by 15-20% farmers, the
operated land was of the order of 10.3 acres. Marginal and small farmers who were 34% of the
14% land whereas 7% large farmers operated 34% of the total land.
Member mostly bought chemical fertilisers form PACS (22%), PC (10%) and dealers (7%). In
fact, more of non-members bought more from PC (29%) followed by dealers (33%) and PACS
16%. In chemical pesticides, 51% members from PC and 20% from dealers and very few from
PACS and combination of PC and Dealers. As against this, non-members mostly bought from
dealers (48%) and from PC (23%). 12% members used biofertilser and bought it from PC and
only 2% non-members did so but in biopesticide, it was 12% members and 14% non-members
using it and buying from PC and 10% non-members buying it from dealers. 93% of the farmers
were not the members of any other FPO and majority of them accessed information from
friends and neighbours. Only 7% reported seeking it from the PC and 19% from a combination
of PC, Dealers and other Shopkeepers. 51% of members had received share certificates but
none of them had ever received dividend on their share capital. 34% members also happened
to be members of other FPOs mostly cooperatives and in some cases, self-help groups.
Only 37% were aware that the PC was owned by farmer members with other reporting
promoting NGO, PC employees, government as the owners with 29% not being aware at all.
In 42% cases each, PC promoters or PC employees had persuaded them to become members
of the PC. All of them still wanted to continue as members of the PC due to supply of the inputs
especially seeds, benefit of transacting with the PC, and price benefits. 98% of them also
wanted to encourage others to become members because it is profitable to be member of the
PC.
Most of the farmers (85%) did not have any dislike for the PC services but 8% were unhappy
about procurement, price realisation and payment aspects of the transaction. Only in mustard,

IX
sesame, soyabean, and urad one member farmer each in case of ISAP PCs reported selling to
PC and in wheat it was six farmers who sold to PC. Thus, 10% farmers reported selling to PC
and the number increased only in wheat by 600% after three years mainly due to MSP
procurement for SFAC. Among non-members, one farmer sold moong to the PC. In case of
IGS PCs, there were no farmer members or non-members selling any produce to the PCs.
The IGS PC members were relatively larger land owners with none of them being marginal
and only 20% being small owners compared with 57% of ISAP PC members being small or
marginal (table 3.28) and 47% by operated land holders as against only 15% of IGS PC
members (table 3.29). The average cultivated area of IGS PC members was higher across all
seasons and average cropping intensity was lower than ISAP PC members. Average owned
land was only 5.84 acres for ISAP farmers while it was 11.02 acres for IGS farmers. However,
operated land was less divergent between the two with ISAP farmers having 9.31 aces and IGS
members 11.8 acres. 43% of ISAP farmers were members of other FPOs compared with only
20% in case of IGS and that was mainly co-ops and SHGs whereas it was only Co-ops in case
of IGS. More of ISAP members knew that farmers owned the PC (43%) compared with IGS
farmers (30%). In case of one PC of ASAP, it was claimed by employees and promoters that
70% members knew that PC belonged to farmer members but our survey showed only 30%
were aware.
About 10% members in both promoters’ PCs did not like the working of the PCs as they could
not procure or offered lower price or delayed payments. Only 20-24% acknowledge PC helping
them with information or subsidy or availing of any government schemes. 15% of ISAP PCs
reported special subsidy for PC members as against nil in case of IGS PCs. ISAP PC meeting
frequency (more of monthly meetings) and participation of members in them (76%) was in
general higher than in case of IGS PCs (40% and 45% respectively). All members of all PCs
of both promoters wanted to continue as members due to seed supply, profits, and price benefits
.All of them in ISAP PCS were keen to encourage others and in IGS with the exception of one
member (out of 20) for the same reasons as those for continuing as members.
In the case of ISAP PCs, one farmer in mustard, urad, sesame and soyabean each and six
farmers in wheat reported selling to the PC. There was no increase in four crops in number of
famers over last three years but the number of member farmers in wheat increased six times.
On the other hand, IGS PCs did not undertake any output transactions.
In Rajasthan, except the milk PC which was very vibrant displaying high level of physical and
financial performance and impact on marginal producer livelihoods, the other four PCs
promoted by so called professional agencies did not show any promise and some were non-
starters even after a few years of working. They could not neither mobilise enough resources
nor undertake any output activity to make any impact on farmers members. Other than being
reliant on government for buying for it from its members and non-members, they could not
undertake any other significant activity on the output side and did not have any business plans.
They were more like projects undertaken for a fixed period and then abandoned. This is a
typical case of external promoters undertaking such activity of FPO promotion without any
local base unlike a local NGO which has local presence and reputation and good will which
makes all the difference. On the other hand, a lot can be learnt from milk PC in terms of
governance and business model which leads to sustainable member relations and business
activity besides scale up and viability. But, it also involved public funding in initial
mobilisation and handholding which makes a major difference.

X
PCs in MP
A comparative analysis of the various PCs in MP by various promoters shows that ASA PCs
had small size of membership though thy had registered with good amount of authorised capital
of Rs. 15 lakh each but one of them could not even 50% of it even after 6 years of working
(table 4.1). But their turnover was significant enough (Rs. 45-81 lakh) given the small size of
membership. However, they also seem to have passed on the profits to the members as revealed
by the small profits and reserves they had. On the other hand, AKRSP promoted PCs which
were of more recent origin had really small authorised capital (Rs. 5-10 lakh) and small
mobilised equity (only 20-34% of authorised). But, they were able to achieve good level of
revenue/turnover (Rs. 24 and 80 lakhs each) and remained in profit almost throughout the
period. The performance of goat PC was even more impressive as it was all women member
PC and was in an unusual and unorganised sector of meat and animal trade.
PRADAN promoted PC had good start and mobilised a significant amount of equity form
members (60% of authorised i.e. of Rs. 25 lakh in 2017-18 raised from earlier Rs. 10 lakh). In
fact it had reached 75% of its earlier authorised capital of Rs. 10 lakh. It had high level of
revenue (> one crore in 2017-18) and profits throughout and created some small reserve as well
(> one lakh).
However, the Mhow PC of IGS had a poor start and working and it was even delisted by the
Registrar of Companies (ROC) as it did not file returns. It was defunct for some time and could
not even mobile 10% of its authorised equity of Rs. 10 lakh and had conducted no business in
2018-19 and had only Rs. four lakh revenue in previous year. Vrutti promoted PC (Betul) was
even in worse condition as it also could not go beyond mobilising 10% of its authorised capital
of Rs. 10 lakh and had no business in 2018-19 and therefore no revenue. It showed large
revenue in 2017-18 mainly due to the opportunity given by SFAC to procure some procure on
it behalf which alsot did not buy from tis members but from a mandi.
A major departure in performance among PCs was that of the RRPPC, promoted by SPS which
was all women member PC and had equity of a large order i.e. authorised equity of Rs. 40 lakh
in 15-16 which was raised to Rs. one crore in 2017-18 and it had mobilised 100% of it in 16-
17 and 60% of the enhanced limit. It had very large turnover (Rs . 2-5 crore) and decent profits
(Rs. 1-2 lakh) and surplus of above Rs. 20 lakh. It had also created assets worth Rs. 12 lakh.
The recent build up of its warehouse and other facilities shows that it son the path to
sustainability.
Of the 71 member farmers interviewed across the state from 8 PCs where 42% per male and
58% female members for the reason that four of the PCs were predominantly women member
based or exclusively women PCs. Among the non-members there were 55% female and 45%
male farmer respondents. Average size of owned land of members was 5.3 acres and operated
land was of the order of 6 acres with the very small amount of leasing as most of the farmers
were marginal or small farmers or even landless. 62% of the farmers were marginal or small
and another 25% semi medium with only 10% and 3% being medium and large farmers
respectively. Interestingly, though 62% of the member farmers were small or marginal, they
cultivated only 25% of the total cultivated area. The medium and large farmers which were
very tiny percentage of household (10% and 3% respectively) had 26 % and 18% of the
cultivated land respectively totalling 44%.

XI
The non-member farmers on an average owned 4.5 acres of land and operated 5.4 acres each
with almost 1/3rd of the land being unirrigated. The maximum land ownership was 30 acres
and minimum zero. The operated land ranged between 0.5 acres and 33 acres because of leasing
in of land. The distribution of land was such that 68% of the total farmers were marginal or
small but they operated only 29% of the total operated land. The medium and large farmers
which were just 5 and 4 percent of the total had 16% and 21% of the total operated land.
Interestingly, a significant proportion of the members (44%) did not know the number of shares
held or owned by them with others reporting 100 or lower number of shares (53%). In only
37% cases, the share certificates were issued by the PCs. A very large proportion of members
were also members of self help groups (SHGs) (49%) simply for the reason that many of the
PCs specially women focussed had their base in the SHGs. Only 11% farmers reported
membership of cooperative society and 5% of another PC.
43% of the members knew that they own the company whereas 27% had no idea about the
ownership of the PC. Others ended up reporting promoting agency, PC employees, board of
director or govt. as the owners of the PCs. The biggest influence in their becoming member of
the PC were the PC promoter (75%) followed by friends and PC employees (15% and 9%
respectively). In 94% cases, they had not received any dividend on their shares so far.
Surprisingly, very vast majority (73%) did not have any complaint about the services provided
by the PC. Most of the members reported an improvement in the quality of inputs compared to
the pre-membership days when it was 45% reporting very good or excellent and 70% post PC
membership reporting it so. Most of the member farmers still bought their various inputs from
dealers which were high in seeds and chemical pesticides but PC accounted for 45%, 44% and
34% of farmers in their source of seeds, chemical fertilizers and chemical pesticides
respectively. The farmer mostly bought from the PC for the reason of better quality, easy
accessibility and lower price. On the other hand, dealers were preferred for similar reasons by
other farmers. Most of the non-member farmers depended on dealers mainly for seeds, fertilizer
and chemical pesticides. Some of them did purchase seeds from the PC and a very small
percentage also chemical and biofertilizer and cattlefeed. The major reasons for buying seeds
from dealers included: easy access and lower cost or a combination of such factors. On the
other hand, PC or other cooperatives were used due to lower cost and easy access besides lack
of any alternative. The chemical pesticides were bought from dealers for easy availability.
However, from the output side, there was not much improvement as most PC did not deal with
output in a significant way and 90% of the members not reporting any output transaction before
or after the PC. The price of output was reported to be better only by 8% members as against
nil earlier. Similarly, the market availability for output of the members was also reported to be
better by only 7% members.
45% of the non-members were aware of the PC and 15% of them were member of a
cooperative, PACS or a SHG. Only 20% of them were interested in becoming members of the
PC. However, 63% of them did not know who owned the PC with only 5% seeing it as farmers’
company and 13% as of the promoting agency or the NGO.
78% of the non-members in case of four women PCs were female and 67% of the total members
were illiterate and 22% middle standard literate. The average operated land holding of members
was 2.71 acres and owned land 2.55 acres. The average operated land of non-members was 3.9
acres and average owned land 3.7 acres. Only 39% of the all -women PC members had received
share certificates and 87% also were members of SHGs with some being members of other

XII
PCs. Interestingly, a majority of the members 53% knew that PC belongs to farmers, the others
seeing it as employee owned, promoting agency owned, government owned. 90% of them had
no dislike about the services being offered by the PC and 20% even reported the PC helping
them in availing of government schemes and subsidies and in some cases 10% it was mainly
for PC members. 71% reported attending meeting frequency to be monthly and 17% annual
and 10% quarterly. 58% participated in all the meetings and 20% sometimes and another 20%
had never participated in any meeting.
All of them wanted to continue as members and also wanted others to join the PC. The only
crop in which the area had expanded after the PC intervention was cotton as most of them were
focused on cotton. The price realisation in cotton had also gone up at 21% after the PC
intervention as was the case in fruits and goat meat. There was also reduced cost of
transportation in the case of goats, maize and pulses besides meat. However, the payment term
had gone up substantially in cotton and pulses. The farmer member also appreciated the
improvement in input quality which move from poor and good to very good and excellent after
the intervention of PC. Similarly, the cost rating as well as availability and accessibility besides
quantity of inputs had also improved in a similar manner. There was no effect of the presence
of PC on the non-member farmers in terms of the sale of their produce or the crops grown.
The average operated land in case of members of non-women PCs was 8.42 acres and owned
land 7.27 acres with significant leasing in of land. However, marginal and small farmers who
were 60% of the total cultivated only 42% of the area and large farmers being only 8% of the
total cultivated 42% of the operated area. Most farmers (78-85%) had cows and bullocks and
32% buffaloes and 53% had goats. But, goats accounted for 32% of all livestock heads and
cows and bullocks another 28% each. Average holding was 2 cows, buffaloes or bullocks and
4 goats per household.
There was increase in area reported under wheat due to the PC presence and higher yields in
cotton besides higher price realisation in groundnut, pulses and soybean to some extent. There
is also significant decline reported in transport cost. In terms of quality of input services, there
was a movement from good and very good to very good and excellent in terms of cost, quality,
availability and adequacy besides accessibility which moved from good, very good to very
good and excellent. On the output services, similarly there was improvement from good to very
good in price and market availability in terms of change of channels for sales of farm produce,
there was a growth of more than 200 members selling through the PC within three years and
direct sales had come down after the PC intervention. The bank payment channel had extended
considerably after PC intervention. However, there was literally no change in the sales channel
of the non-member farmers after the coming into existence of the PC.
In case of ASA PC members, the average size of land holding of member farmers was 3.4 in
terms of operated area and 3.0 in terms of owned land. However, marginal farmers which was
46% of the total, operated only 24% land and semi medium farmers being 23% had 41% of the
operated area. In terms of livestock, 82% of the farmer owned goats, 68% cows, 50% buffaloes
and 77% bullocks with goats accounting 50% of the total livestock heads followed by oxen
22% and buffalos and cows at 15% and 13% each.
The average size of non-member owned land was 4.43 acres and that of operated land 4.61
acres. 44% each of the farmers were marginal and semi medium farmers with remaining being
small farmers. However, in terms of land operated semi medium farmers had 72% of the area
and marginal farmers only 16%. The largest ownership was of bullocks (74%) followed by

XIII
cows and goats (61% each) and only 35% who had any livestock had buffaloes. In fact, 47%
of the livestock was goats, 25% bullocks and 19% cows with buffaloes accounting for 10% of
the total livestock. The tube wells were mostly run with an electricity (66%) and diesel engine
(25%) with 89% of the electric connections owned or shared.
There were significant price gains reported in cotton, paddy and groundnut due to PC
intervention and higher time to receive payment in case of cotton and pulses. Although
transaction cost in cotton, pluses and wheat had come down. On the other hand, output price
realisation also moved from good to very good as well as in the availability of market. The
number of members selling through the PC had tripled over the three years and bank payment
became more common.
There was no change in the sales channel used by non-member farmers before and after the
intervention of the PC where most of them sold in wholesale with only one reporting sales
through the PC. There was also no change in area yield, output or cost of marketing and sales
price realisation before and after the introduction of PC.
45% of the members had received share certificates and 2/3rd of the members were members
of the SHGs. All of the members had joined these PC during the last 10 years. 23% reported
receiving agricultural information from the PC with another 27% each from friends and friends
and PC each.
Only 18% members knew that PC was owned by members with 50% having no idea about the
ownership of the PC. Rest of the members mentioned promoting agency, BOD or PC
employees as the owners.
In case of AKRSP PC members, average operated land for member farmers was 5.31 acres and
owned land 5.41 acres (table 4.29). 63% of the members were marginal or small but they
operated only 35% of the area compared with semi medium and medium farmers (18% each)
accounted for 24 and 50% of the operated area.The livestock ownership varied from 100% in
goat and oxen to 22% in buffaloes and 88% in case of cow and bullocks. The share of goats
was the highest in the total number of livestock which was almost 44% followed by cow and
bullock at 23% and 28% respectively. In general, there were two cows or bullocks per
household and six goats per household.
The average operated land by non-member farmers was 3 acres of which 2.86 acres was owned.
47% of the farmers were marginal land owners and 29% small farmers with another 12% each
being semi-medium and medium farmers each. There were no large farmers among them. In
terms of area, marginal and small had 46% and medium farmers 30% leaving 34% for the semi
medium category. There was some amount of leasing in of land and very nominal leasing out
reported. The livestock owned by farmers included 66% goat, 10% cows and 16% bullocks by
numbers with 40% of the farmers owning goat, 34% bullocks and 21% cows. Buffaloes were
owned by only 13% of the farmers with average ownership of one buffalo, two cows or
bullocks and seven goats per household. 48% members had received share certificates and 73%
were members of SHGs and 26% of other FPOs mainly PCs.
91% of the non-members did not have any problem with the services of the PC but 57% also
had no knowledge of it with 38% being aware of the initiative of the PC. None of them reported
any negative experience with the PC as none of them had transacted with the PC.

XIV
The members did not report any major changes in the cropping pattern yields or output due to
the intervention of the PC other than the fact that the cotton and soybean prices were appreciate
significantly during the last three years. The transaction cost had also come down in both cotton
and goat marketing. All of the members wanted to continue with the PC and 19% of them also
wanted to encourage other non-members to join the PC.
Only two non-members farmers reported selling through the PC compared to the pre-PC
situation of one farmer selling to it. On the other hand, there was 15% increase in selling
through the APMC Mandi and this was the shift from direct wholesale selling to traders.
Except one member of PRADAN PC who reported labour as main occupation, all members of
all three PCs reported primary occupation as farming. The cropping intensity of IGS and Vrutti
PC member farmers was high (2.08 and 1.99) and low for PRADAN PC member (1.63). 70%
of non-member had not even heard of the existence of the PC and 33% did not know who
owned it with another 1/3rd each thinking that it is government owned or promoting agency
owned.
In case of Betul Krishak PC, none of the farmers bought any inputs from the PC and depended
on dealers and PACS for the same and bought fertilisers from the PACS. There was no change
in any crop area or yield or output or even sales price realisation as the PC had not intervened
in the output market. This PC was almost defunct as it had neither mobilised enough equity nor
undertaken any business thus far despite existing for four years. None of the farmers bought
any inputs from the PC and depended on dealers and PACS for the same and bought fertilisers
from the PACS. There was no change in any crop area or yield or output or even sales price
realisation as the PC had not intervened at all.
PRADAN promoted PC had good interface with women members for input supply who all
bought from the PC. On the output side, it aggregates crops like soya bean, maize, wheat and
gram and had its own brand – Dharti Natural. In terms of livelihood diversification, it
introduced soya bean as a cash crop and a new variety of wheat in the last few years. In 2015-
16 it bought gram on behalf of SAFC at MSP for 1% commission. It also facilitates sale of its
members produce to wholesale traders in various markets in M.P. and Gujarat.
In case of members of Mhow PC, the average owned land was 13 acres and operated land 16.9
acres. This was a PC which had mostly large and semi-medium and medium famer as member
and this was the largest average farm size of any PC membership. 75% of the farmers had cows
and 50% bullocks with cows accounting for 72% of the total livestock and bullocks another
26%. There were 4 cows and 2 bullocks per household. Most of the farmers bought seeds from
dealers and majority of them buying chemical fertilisers from PC and the rest from PACs.
In general, most of the member farmers still bought their various inputs from dealers which
were high in seeds and chemical pesticides. The farmer mostly bought from the PC for the
reason of better quality, easy accessibility and lower price. On the other hand, dealers were
preferred for similar reasons by other farmers.
The best case was that of Ram Rahim Pragati -an all women PC -which had very large capital
base and large revenue running in a few hundred million rupees annually beside being in profit
all the time and creating some assets including a warehouse with imported technology and a
processing facility. On the output side it aggregated various crops like wheat gram and maize
from 2600 members. It also makes use of warehouse receipt-based loans for storing its produce

XV
in its own warehouses. It is mainly into NPM produce and link and sells 90% wheat and gram
procurement to Safe Harvest Pvt. Ltd which has equity in this PC. The farmers members have
been into NPM practices for the last 10 years. It had also done job work for private players like
Big Basket. The PC promoted red gram in the area and also reverse selling of pulses to the
member farmers by processing it into dal. It is the one of the very few PCs which have
participated in futures markets and made profits in maize but lost money in soya in 2016-17.
PCs in WB
In WB, most of the studied PCs had mobilised high %age of authorised capital except
Shantiniketan though authorised capital itself was small or modest in most cases (Rs. 10 lakh)
except one PC (Hooghly) which had Rs. 25 lakh authorised capital. Further, their revenue
remained low (< Rs. 50 lakh) except one case (Chhattna) which was mainly due to the fact it
had a franchise of Sufal Bangla and therefore, its turnover could go up to Rs. 3 crore per
annum. Therefore, they made negligible profit or net losses except the Chhatna PC which made
a small profit after taking franchise of sufal bangla. Except Hooghly PC, most of them had a
small size of membership which is problematic given the small size of land holdings in the
state. This kind of small membership can’t generate large equity capital and large volumes for
viability.
84% of the PC members reported farming as primary occupation followed by petty business
and salaried job with 5% each with only 3% reporting animal husbandry as the primary
occupation and another 3% casual labour being their main source of livelihood. On the other
hand, 56% did not report any secondary occupation and 16% reported it as farming, 9%
handicrafts and 8% skilled labour. Only 3% reported animal husbandry and 6% casual labour
(table 5.3 and 5.4). 77% of the non-members reported farming as primary occupation with 11%
reporting business as the primary occupation and 10% casual labour.
56% of the members had received share certificates and 88% of them did not report
membership of any other group or collective except a few being members of the PACS. 48%
of the members relied exclusively on PC for agricultural information with 27% depending on
other farmers and friends. PC also figured along with friends and relatives and mobile groups
besides ADO and dealer in another 19% cases.
The members were mostly marginal (72%) and small (20%) in their land ownership with
average size of owned land being 1.99 acres and operated just 2.32 acres. The operated land
was also distributed similarly with 91% farmers operating marginal or small farms accounting
for 73% of the cultivated area and 9% semi medium farmers operating 27% of the land. But,
members were larger landholders than their non-member counterparts who had average owned
land of 1.29 acres and operated farm of 1.61 acres. The average cropping intensity of non-
member was 2.09 which was slightly lower than in the case of members (2.2).
The member farmers reported buying seeds from dealer in 36% cases, from PC in 19% cases
and dealer and PC both in 16% cases. Only 5% farmers bought seeds from PACS and others
reported various combinations of dealer and PACs or dealer and local farmer or PACs and
local farmers. Similarly, 45% of them bought chemical fertilisers from dealers and 28% from
PC and only 2% from dealer and PACs and 6% from both dealer and PC. Similarly, 42% bought
chemical pesticides from dealer with 13% reported it from the PC. In fact, 42% reported buying
no chemical pesticides. Bio fertilisers were bought only by 28% farmers and mostly from
dealers, other farmers and the PC. There were even lesser number of farmer buying bio

XVI
pesticides (23%) again mostly from dealers and PC (table 5.15). Most of the non-member
farmers (60%) bought seeds from the dealers and local farmers (16%) with PACS and PC
accounting for only 3% and 2% of the total and in some cases being another source along with
dealers and local farmers. 73% of them bought chemical fertiliser from dealers with PACs
accounting for 5% and the PC 8% of the total.
59% members could not mention the name of the PC with the other either not knowing or not
being able to mention it correctly. 45% of the members did not know the owner of the PC and
another 38% reported PC employees as the owners and 8% BoD besides 3% reporting it as
promoting agency and 6% government as being the owner of the PC. In 52% cases, it was PC
employees who influenced them to become members. 84% of the members were not fully
aware of the various activities being carried out by PCs.
96% of the non-member farmers were not member of any other collective with only 3%
reporting membership of PACS. 41% of the non-members had no knowledge about the PC and
74% did not know who owned it with only 6% thinking it is owned by farmers and the other
7% reporting promoters or employees as the owners besides 4% thinking it was owned by
promoting agency.
89% wanted to continue as member of the PC due to good services and facilities subsidising
inputs, availability and such other reasons with only 5% not being satisfied with the services
and therefore, not sure they would continue as members. Farmers mostly suggested
procurement of their farm produce (9%), timely availability of inputs (9%), irrigation (3%),
and agriculture machinery and irrigation another 5% for better functioning of the PC.
The farmers reported significant improvements in moving from good to very good in terms of
quality, cost and availability of inputs after the membership of the PC. In terms of cropping
pattern shift, there were significant increases in area under vegetables, and fruits and a decline
in area under paddy and sesame. Farmers also reported yield increases in vegetables and fruit
including chillies and potato besides gram. The output sold had increased significantly in
vegetables especially pumpkin and even paddy due to yield increase especially Kharif paddy.
There was higher use of PC channel in vegetables both in terms of number of farmers as well
as volume of output sold. But still most of the farmers sold in wholesale ranging from 50% in
wheat to as high as 100% in case of vegetables and fruits. This APMC channel was reported to
be used only in case of paddy and wheat. 16 (25%) members had sold to PC vegetables and 2
each paddy and fruits (3% each) . This had increased from just three farmers selling to it three
years before (5%) to 20 (31%) now. Only one non-member had sold paddy and two potato in
the past to the PCs. 77% of PC members had no dislike of any of services offered by the PCs.
BKSL PC member farmers were relatively large in both owned and operated land than their
IGS PC counterparts. The members of BKSL PCs had higher cropping intensity than that of
IGS PC members, The most trusted source of seed was found to be dealers & PCs- in both
types of PCs (IGS and BKSL). Other major sources were dealers and PCs (15%) and dealer
and PACS (12 %) for IGS and dealers (23%), PCs (29 %) and dealers and PCs (19%) in case
of BKSL.
36% of IGS member farmers either did not know or gave wrong name of the PCs they were
members of. This count was higher for BKSL PC members where 48% of the members were
not able to provide the information. Farmers were not able to specify the PC owners also. In

XVII
case of IGS, more than half of the farmers were not able to identify the owner of the PC. BKSL
members have comparatively higher identification of PC owner.
50% of IGS PC members started selling their products through PCs in. fruits, paddy, tomato,
and mainly vegetables. In case of IGS PCs, three farmers reported selling fruits to the PC and
two paddy and 15 selling vegetables compared with three years before. The vegetable output
was important as Sufal Bangla was buying it from the PC or the PC was running the Sufal
Bangla store and buying from its members and non-members directly. This was almost 50%
of all members in vegetables and 10% in fruits and about 7% in paddy. On the other hand, in
case of BKSL PCs there was no output side interface of PCs with the farmers.
PCs in Tamilnadu
The state has a consortium of FPCs registered as a PC like nine more states of India, with 35
FPCs as members with 100 shares worth Rs. 10,000 each since 2015 with paid up capital of
Rs. 2.2 lakh and authorised capital of Rs. 10 lakh. This consortium PC members runs shops
and retail outlets called farmer supermarket network (Unnatham Uzhavar Angadi) by its
member PCs in different places in the state for collectively selling value added products in
partnership with the state department of agri marketing and agribusiness. But, none of the study
PCs were members of this consortium. The Pudukkottai district website mentions one of the
study PCs (Illupur agri PC) as one of the three successfully functioning PCs the district.
One of the three ESAP promoted PCs had not undertaken any business activity in one case
even after 4 years of existence, and therefore was into losses technically. Kodai Hills of ESAF
was one PC which made small profits every year as its revenue was from high value crops like
pepper and coffee. But, still it could also not mobilise more than 61% of its authorised equity
from its members. The Theni goat PC which was unique in many ways i.e. all women PC, into
goatery and only PC promoted by an NGO achieved one of the largest equity mobilisation by
reaching 100% of its authorised capital and revenue of the order of Rs. 54 lakh per year with
small profits. This was mainly because it was into high value low cost business of rearing goats
and selling meat and live animals locally.
Kottampatti PC by Dhan was a big failure throughout with only coconut trading giving it much
needed respite recently. It could not mobilise even 50% of its authorised equity despite being
a landowning farmer PC. Both the PCs promoted by KTL of Dhan Foundation had mobilised
most of their authorised capital (Rs. 10 lakh and Rs. 25 lakh) and very high levels of revenue
in each case which was more than Rs. one crore. But, even their profits were negligible which
is more due to the fact that PCs until recently have behaved like the co-operatives passing on
the surplus generated as price and other benefits to members to avoid paying income tax on
their profits. It is only since last year that their profits have been exempted from income tax for
next five years and it remains to be seen whether profits would go up and reserves and surplus
would be used more for capacity creation by the PCs.
The SEEDS NGO promoted PCs were the most vibrant and successful as they not only
mobilised most of the authorised equity capital (77-90%) which itself was of the order of Rs.20
and Rs. 40 lakh but also had revenue in crores (> 4 crore) in case of SEEDS PC. But, even then
its profits were very modest (Rs. 8 lakh). However, the second PC had small revenue and no
profits from its operations.

XVIII
Of the 105 members interviewed in Tamilnadu across 9 PCs, 46% were women farmers with
17% of them being illiterate with most others having school level literacy. 76% of them
reported farming as the primary occupation and 60% animal husbandry. 47% of the 91 non-
member farmers were women and. 74% of them reported farming as their primary occupation
followed by farm labour by 14% and animal husbandry by 10%.
The average owned land of members was 5.12 acres and operated land 6 acres per household.
The average owned land of non-members was 3.7 acres and operated land 4.12 acres. The
average cropping intensity of the members was 1.16.
The members were more aware of PC name than the non-members (57% versus 24%). Further,
only 15% farmers thought or knew the PC belongs to farmers with others mentioning PC
employees (24%) or promoting agency (22%) as the owners. There was hardly any awareness
of PC ownership among non-members. 76% of the non-member farmers had no knowledge of
the PC and 88% did not know who owned the PC
Among the members, dealers emerged as the major source of seed purchase with 35% buying
from there. Only 17% farmers bought it from the PC with another 11% from both PC as well
as dealers. 9% even reported buying it from other farmers and 5% using home based seed. The
reliance on dealers was even higher in case of chemical inputs at more than 60% with only 22-
30% farmers buying it from the PC. In fact, even PACs did not figure as a major source or even
fertiliser purchase. Seeds were mostly bought by non-members from dealers and local farmers
with only 8% farmers reporting buying it from the PC. Similarly, chemical pesticides were
largely bought by member farmers from dealers (76%) and local farmers with only 7% of those
reporting buying it from the PC. Since most of the PCs did not deal with machinery rentals an
equal percentage of farmers accessed it from dealers or local farmers.
83% wanted to continue being members as it was beneficial in various ways like information,
loans and subsidies, procurement and timely and lower cost input supply by PC. Those who
(17%) did not want to continue said so as they did not find it useful or had not availed any
service from the PC. 77% also were keen to encourage others to join the PC as members as it
brought benefits.
The only major expansion in crop area was groundnut due to the intervention of PC and yields
had improved in cotton and many other pulses, cereals, grams. Major price benefits were
realised in pulses, groundnut, cotton and maize.
In terms of channels of sale 29% of the farmers sold 39% of their produce through the PCs,
mainly in the crops of black gram, coffee, cotton, green gram and maize. After the intervention
of a few years of the PC, many more crops being handed by the PC in both number of the
farmers and quantity sold through the PC increased substantially.
So far as effect of PCs on the member business was concerned, there were a few produces like
cow milk, black gram, cotton, flat gram, green gram, groundnut, maize, paddy and red gram
where the number of farmers selling through the PC increased significantly as well as output
sold over 3 years. This was in sharp contrast to the non-member impact where only in one crop
green gram. There were some sales by the non-members through the PCs.
In terms of area shift due to the intervention of PCs there was significant increase reported in
groundnut, black gram, and to some extent coffee. In terms of marketing channels before and

XIX
after the interventions of PC, the number of farmers selling through the PC increase
significantly in black gram, flat gram, green gram, groundnut, maize and millets besides paddy.
In fact, paddy, pulses, ragi, red gram, and sesame besides sunflower were being sold first time
through the PCs. In terms of volume sold, besides these crops, coffee also have substantially
increased as did red gram. This was mainly a shift from wholesale channel to the PC channel
in most cases. Only two and three farmers each of the 91 reported selling black gram and green
gram to the PCs where it was none and only one each three years before respectively.
58% of the Seeds PC members were male which was lower than Dhan/KTL PC members (60%)
and ESAF PC members (65%).This meant that the share of female members was the highest
for Seeds promoted PC (42%) not very different from Dhan/KTL (40%) PC membership but
much higher than in case of ESAF promoted PC (35%). Farming was reported to be the
primary occupation of most of the PC members. 91% of Dhan/KTL PC members had
agriculture as the primary occupation followed by Seeds PC members (83%) and ESAF PC
members (74%).
Average land ownership was the highest in the case of Seeds PC members (8.78 acres) followed
by Dhan/KTL PC members (6 acres) and ESAF PC members (3 acres). Similarly, the average
operational landholding was also highest for Seeds PC members (12 acres) followed by
Dhan/KTL PC members (6 acres) and ESAF PC members (3 acres). ESAF PCs were really
those composed of marginal and landless farmer groups compared with those of other two
promoters. Goats were owned by member farmers of all PCs. 79% of Seeds PC members
owned goats followed by Dhan/KTL (29%) and ESAF PC members (21%). The average
number of goats were highest for Dhan/KTL promoted PC (8) followed by Seeds promoted PC
(7) and ESAF promoted PC (4).
The cropping intensity was highest for ESAF PC members (1.48) followed by Dhan/KTL PC
members (1.09) and Seeds PC members (1.08). 46 % of the Seeds’ PC members purchased
seeds form dealers followed by ESAF PC members (35%) and Dhan/KTL PC members (23%).
PC was identified as another major source for the purchase of seeds. Dhan/KTL PC members
(31%) had the highest number of member farmers who were purchasing seeds form PC
followed by Seeds PC members (21%). Dealers were identified as major source for chemical
fertilizers for member farmers. The highest dependence was reported by Seeds PC members
(54%) followed by ESAF PC members (47%) and Dhan/KTL PC members (31%). PC was
another major source for purchasing chemical fertilizers. 29% of Seeds PC members were
purchasing chemical fertilizers from PC. 23% and 12 % of Dhan/KTL PC members and ESAF
PC members had purchased chemical fertilizers form PC. The highest dependence on dealers
for seeds was reported by Seeds PC members (54%) followed by ESAF PC members (47%)
and Dhan/KTL PC members (31%).
Whereas in case of SEED PCs, 2/3 members could specify the name of the PC they were
members of it was only 53% and 46% in case of ESAF and Dhan/KTL. Further, only 11-17%
farmers across three promoters PCs knew that PC belonged to them or farmers with others
mentioning PC employees (1-29%), promoting agency (8-29%) and BoD (5-6%) (tables 6.37&
6.38). Sadly, the lowest awareness of PC name was in case of NGO Dhan/KTL which is well
known NGO in the state. But, in general, the awareness of ownership was very low across all
PCs of all promoters.
In case of goat PC, the number of goats per households for Theni member was large at 20 goats
with 92% owning goats and goats being 87% of livestock owned by the households. This was

XX
in sharp contract to the MP goat PC where average ownership size was 10 goats though 90%
hhs owned them and they were 88% all livestock owned by such hhs. Infact, the MP PC
members also reported buying some inputs like biofertilisers through the PC.
The awareness of PC was lower among Theni PC members with 58% not knowing the name
of the PC as they were perhaps more familiar with SHGs of women they were first members
of and only 25% thought PC was owned by farmers, another 25% thinking PC employees
owned it and yet another 17% thought it was owned by promoting agency. This was in sharp
contrast to the 90% members knowing the name of PC in MP and 80% knowing it is owned by
farmer members. This despite the fact that the MP PC was younger by many years compared
with the Theni goat PC.
On the output side, whereas in case of Theni PC in Tamilnadu, the number of farmers selling
goats to PC increased from nil to 5 over last three years i.e. 40% farmers were selling through
the PC now (sold 112 goats in all) with some of them reporting selling maize and millet crops
also through the PC. In case of MP goat PC (Pandhana), it was 30% farmers who were selling
through the PC (total of 14 goats) and one of them also reported selling soyabean to the PC.
Overall Summary
The PC performance and impact varies widely depending on the PC, the promoter, and the
location. The PC members were generally larger land holders unlike their non-member
counterparts both in owned and operated land. In fact, the gap widened in operated land
compared with owned land. However, this is not to say that PCs exclude small farmers as still
most of the members were owners and operators of around five acres of land. However, non-
members were more close to marginal ownership and operation.
The average land ownership was low in WB and UP as expected both among members and
non-members and very high in Rajasthan and very different from those of non-members (1.5
times larger for members). The members everywhere had higher average land holding both
owned and operated across all states with large difference only in Rajasthan and Tamilandu,
both of which also had the highest average size of holding across all states. It was goat owning
households which were landless or marginal landowners or operators which moderated the
average size in Tamilandu and MP to some extent.
Though more of members knew the name of the PC (62%) compared with non-members
(44%), it was still not very high and 27% did not know it at all and another 11% reported it
wrong. At the state level, overall awareness of PC name among members hovered around
60% with the exception of U.P. where it was high at 85%. This was much higher than the
knowledge of non-members where only 24% in Tamilnadu to as high as 71% of non-members
in U.P knew it but it was between 40-60% across the three states of Rajasthan, M P and West
Bengal and only 24% in Tamilnadu. Further, whereas 27% farmers knew PC was owned by
farmers compared with only 6% of non-members thinking so, the more worrying part was the
large proportion of members saying it was owned by PC employees (18% ) and BoD (8%)
besides the fact that 31% did not have any awareness of this aspect. 80% of non-members were
in this category which is not very surprising.
At the state level, with the exception of UP, about 30% members in all states except WB did
not know who owned the PC whereas in WB, 45% did not know it. The farmer members in
UP, MP and Rajasthan knew that farmers owned it with %age going from 36% in Rajasthan to

XXI
as high as 43% in MP and 56% in U.P. In WB, 38% thought it was owned by PC employees
and that was stated by 24% farmers in Tamilnadu as well. Promoting agency came next in
Tamilnadu (22%) and Rajasthan (15%) and MP (11%). On the other hand, 70-80% non-
members had no knowledge of PC ownership. In general, mostly farmer members joined PC
due to encouragement and persuasion by PC promoters and PC employees (78%) with some
others due to their friends advice.
On the input side, 33% members were buying seeds from the PC compared with only 8% non-
members doing so. Also, a few other members (20%) combined buying from PC with other
sources like dealers, PACS and other farmers or government outlets. Only 6% non-members
reported such a purchase behaviour. Across states, the seed purchase from PCs varied from a
low of 18% in Tamilnadu and WB to a high of 40-56% across MP, Rajasthan and U.P. or a
combination of dealers and PCs in about 11-26% cases. Non-members mostly relied on dealers
in all states especially MP, WB, and Rajasthan (57-59%) with some non-members buying from
PCs as well. The reliance on PCs for chemical inputs like fertilisers and pesticides was very
high with 31% and 27% buying exclusively from PCs and another 4% and 3% respectively
combining it with other sources like dealers and PACS and government outlet. Reliance of
members for chemical fertilisers on PCs was high in MP and U.P. (38% and 71% respectively)
and very low in Rajasthan, Tamilandu and WB (10, 20 and 28% respectively). PACS wee
important source in MP and Rajasthan for about 23% farmers.
The number of farmers selling through the PCs increased from 3 to 15 in black gram and from
5 to 13 in cotton and even in black gram come to 2 to 5 besides red gram from 1 to 4. There
was also substantial increase in numbers in green gram and ground nut from 2 to 8 and 3 to 7
respectively. In fact, the biggest increase in numbers was in maize which increase from 6 to 19
farmers and in millets from 1 to 4 farmers over 3 years. Paddy also had a big jump in farmers
selling through the PC from 1 to 9 as was the case in soyabean where it increased from 6 to 11
and in wheat from 7 to 18. Among the members, there were also cases of contract farming in
avocado, coconut, drumstick, and in the case of non-members, there was contract farming in
chilli, and vegetables besides potato contract farming through the PC by two farmers. On the
value placed by members on various services offered by PCs, about 22% members disliked
them ranging from poor access to some services, lack of timely and adequate availability and
no or poor procurement of farm produce. The problem of poor procurement was particularly
reported in U.P. (10%).
However, most of the members across states (87% ranging from 70-100%) wanted to continue
as members. The lowest was in MP (70%) and the highest in Rajasthan (100%). Further, 80%
also were willing to encourage others to become member of the PC ranging from 71% in WB
and UP to as high as 98% in Rajasthan.
A majority of members (53%) across states (47-66%) suggested interventions in procurement,
(11%), better, timely, and lower cost input supply and procurement (9%) and rentals of farm
machinery and equipment (3%). Tamilnadu members were keen to get loans and input
subsidies (11%) and see procurement happening (11%) while those in WB, wanted more of
better input supply (6%) and their timely availability (8%) and farm improvements support
(6%) besides procurement (8%). The UP PC members were particularly keen on better
procurement (14%) and farm machinery rentals (14%) and storage and warehousing facility
(6%) besides lower cost and timely input supply and procurement at the same time (18%). The
MP PC members also emphasised better inputs and extension advice, (14%), procurement (9%)
and lower cost and timely input supply along with better procurement (7%). Similarly,

XXII
Rajasthan farmers were keen on procurement (16%) better price realisation (6%), value
addition (6%), new crops (4%), crop insurance (4%) and lower cost inputs and procurement
(4%). This clearly shows output interventions were lacking in most cases and that is what
matters the most for farmers as even if they produce at lower cost or higher output from same
piece of land, if they are not able to sell it well, the farmer benefit goes missing.
The members suggested various ways to improve governance of the PCs which included more
members, more professional resources, better governance at the BoD level and better trust
among members about PC and more funding especially in the case of Rajasthan. On the
management of the PC, in general, farmer members suggested expansion of membership, better
communication among members and PC, and trained and professional staff for business
management. The accountability to members came up as a big suggestion in TN along with
membership expansion while in WB, it was more about better communication and in UP more
employee support for PC and more frequent meetings. In MP too, membership expansion was
the main suggestion while some members also mentioned better business plans for making the
PCs viable, while in Rajasthan, it was all about better professional management of the PCs.
It is also important to understand what makes some farmers join the PC while others don’t.
Literacy, ownership of livestock, and being a member of any other farmer collectives like
PACS, SHG, or another PC had a significant association with the membership of a PC/FPO.
Interestingly, there was not much variation across promoters and PCs so far as their organising
levels and forms were concerned. In U.P. and WB, it was FIGs, WUGs and in one case farmer
clubs which were the smallest levels of a PC membership. Since both IGS and BKSL in WB
and BCTS and BKSL in U.P. as promoters were a part of the same family of BASIX, they both
followed the same approach. In M.P. too, it was all about SHGs, and FIGs, across PCs
organised by different promoters which led to evolution of the PC structures. In Tamilnadu
too, it was JLGs, FIGs, APGs across various promoters and nine PCs. This happened as
government agencies like SFAC and NABARD also recommended and supported such
evolution and local NGOS anyway followed such local level mobilisation strategies for their
work besides the fact that PCs based on such structures seemed more stable and sustainable.
An assessment of the best practices of PCs across states revealed a varied picture and not so
many PCs being confident about calling their practices best practices. In WB, major best
practices across PCs were contract farming, value addition, bidding for Sufal Bangla, crop
insurance new crops, and market linkages. In Rajasthan and U.P. a few innovative best practice
were: no credit sales, new crops, and contract farming.
In Tamilnadu, in case of PCs promoted by SEEDS NGO, some of the best practices followed
by its PCs included: direct procurement from farmers and payment at farm gate, no
involvement of intermediaries in the transactions, and supply of quality inputs. In the case of
Thoothukudi PC, the PC considered contract seed production by 20 farmers for NSC and bio-
input business as the best practices. It believed that the best way to help farmers is to intervene
in the open market for better realization of price. Kottampatti PC also believed in eliminating
intermediate on the output side ass one of its major best practices leading to better price
realization for farmers. It also brought new hybrid variety of coconut to the member farmers
and had corporate linkage for sale of nuts. Seeds PCs also provided crop and livestock
insurance which was innovative as it reduced risk. They also sold to institutions and even
arranged loans for members. Theni goat PC trading in goat markets and also franchising meat
shop were important innovative best practices.

XXIII
In M.P., ASA promoted Ranapur Mahila PC stated that its seed production intervention was
very successful. Its other innovations included: scaling up and branding of produce. The
AKRSPI promoted Nevali PC saw its own brand in bio-inputs and focus on output marketing
as best practices. The other innovations included: decentralized procurement and quality seed
production. On the process innovations, organic farming practices in cotton and other crops in
the same farms including facilitation of market with private market linkages for 7000 of its
12000 farmers in M.P. out of whom 3000 were fully organic across PCs was important
innovation.
The Pandhana goat PC treated own production and marketing of some of the inputs as best
practice. Besides that, it also considered weight based purchase of goats and other animals as
process innovation. Similarly, Theni goat PC using franchisees for meat selling was also an
innovation. On the other hand, Chirayu Women Crop PC had best practice innovations which
included: seed contract farming, distant market trading, and introduction of mechanical
grading. The ram Rahim PPC making use of warehouse receipt based loans for storing its
produce in its own warehouses and participation in futures markets were its innovations and
best practices.
NDDB’s model of promoting milk PCs is based on certain rules of governance to enhance
patronise cohesiveness and governance and operating effectiveness which are: one, they will do
business with only members, new members can join only during specific windows in each year
and only those with minimum supplies of milk can vote. They have to maintain a ratio of 3:1
flush to lean milk supply and they have to increase their shareholding after one year; two, there
are classes of membership and face value of the share is revalued periodically and old members
can leave the company and retire their equity capital at present valuation besides 20% of the
directors being co-opted experts. This is reflected also in the scale of the milk PCs which are
state level with membership ranging from 23000 to 87000, women being 12 to 100% of the
membership and smallholder 43 to 75% of the membership. The paid up share capital ranged
from 13.8 million to 262 million, milk procurement from 1.7 lac litres to 5.36 lac litres and
business turnover from Rs.868 million to Rs.5968 million in 2014-15. The elected board
members were forbidden from holding any political office and have staggered terms where one
third retire every year/two year.
State specific and common problems of PCs
The PCs in U.P. other than the milk PC were modest in their profile and performance with one
still making small losses. Though most of them had moved out of loss making but that
happened after 5-6 years of existence. Still they were small in membership numbers hovering
around 1000 each. In case of at least one of the four, revenue was also very small even after 5
years. But, they had good portfolio of contract farming and banana as new crop in at least two
cases and other one had tried contract farming unsuccessfully.
Most of the PCs in U.P suffered shortage of working and some of them even shortage of
qualified human resources to manage the PCs besides issues of internal governance which
included poor member awareness and poor BoD capability to oversee and guide the affairs of
the PC. The poor working and fixed capital led to poor coverage of members for farm services
and problems in engaging with produce markets.

XXIV
In Rajasthan, besides the typical problem of shortage of working capital and professional
human across PCs, the governance of the PCs was a major concern in terms of inactive BoD
or some members dominating the PC. For example, in one PC, multiple members from same
households (250) had membership in PC (500 members). This was further accentuated due to
the fact that most promoters were not locally based and had promoted the PCs as projects for
SFAC for limited period. Therefore, constant oversight and hand holding from local promoter
was missing.
There were also other reported problems in Rajasthan for PCs like high interest loans (13-15%)
and lack of storage space as there are only 540 godowns in the state and cold storage exists
only in 9% markets, many of which are not covered under warehouse receipts system.
MP PCs also reported working capital shortage and high interest rate for loans in most cases
besides the poor member awareness of their stakes and role in making the PC work. This was
reflected in poor awareness of the farmer ownership of PC and poor market orientation of
members which are more about internal governance. The poor handling of PC busines like
unsold stocks, competition from private sector and PACS, lack of availability of organic seeds
were other reported challenges. In one case, large farmers and their lack of involvement in PC
affairs and political affiliation and interference by large farmers also led to decline of the PC.
The PCs in WB faced lack of staff, and working capital, besides poor governance especially at
BoD level and lack of awareness among members emerged as major issues. Most of these were
internal challenges, though there were also external challenges like spurious seed potato supply
in one case, local competition, and lack of government support for engaging in procurement at
MSP in some cases.
Tamilnadu was no different on many of these aspects of PC governance and management and
problems included: Shortage of working capital and lack of professional staff, poor BoD
governance (manipulation and lack of engagement), poor member awareness, poor govt.
support for bio inputs, lack of infrastructure like storage space, local competition and even
locational disadvantage in one case.
Policy Recommendations
Given the relatively large size of land holdings of the PC members compared with those of
non-members, there is need to seek membership of marginal and landless categories
proactively to make the FPC journey more inclusive and impactful. This does not deny the
fact that mixed membership still retains its rationale to gain scale and scope. This is only to
highlight that those already excluded from other networks like institutional credit and produce
market or traditional co-operatives need to be roped in as they need the FPCs much more than
any other category of land owner or rural producer.
One of the most important findings of the study is that the output linkages still remain poor
across most PCs and therefore, the impact on farmers is limited. This was also one of the
important suggestions by the farmers when asked about how PC performance could be
improved and PCs made more useful for them. There were many cases of PCs procuring for
the government in pulses and oilseeds and in cereals in some cases but that was more to avail
of the MSP and to earn some revenue for the PC and was limited in coverage and volumes. On
the other hand, some PCs engaged in contract farming with private agencies like in potato or
drumsticks or even seeds and that benefited farmers in terms of growing a new high value crop
as well as realising assured and better prices especially because these crops did not have MSP

XXV
protection. This becomes important in the recent context of the new contract farming Act 2020
implemented by the Union Government which provides a freer environment for contracting
agencies to work with farmers and it is here that PCs can play an important role as
intermediaries or facilitators between the farmer members and contracting agencies to make
smallholders attractive to such agencies because PC intervention can lower the transaction cost
for the PC and bring large number of producers into the contract farming net which is much
needed. In fact, PCs should pro-actively engage in contract farming with their members for
their own procurement as well as for supplying to processors and exporters until they have
those capacities. This can help build more robust supply chains to earn buyer confidence and
also earn farmer goodwill by bringing stable and assured prices to farmer members.
It was also observed that some promoters are too small to make any difference in terms of scale
of farmer organization under the PC structure. For example in Uttar Pradesh there were dozens
of promoting agencies which had organized only one or two PCs each. Further, many of the
promoters not belonging to the local areas, unlike the traditional NGOs, did create large number
of PCs but since they were not organically linked with local communities and organized these
PCs more as projects, the viability and sustainability of such PCs was in question as seen in
many cases in Rajasthan, Uttar Pradesh and Madhya Pradesh. The recent guidelines on
promotion of FPOs with the help of cluster based business organization (CBBOs) can lead to
multiplication of such PCs which may not have any one to look after them after the project
duration and funding ends though the provision of longer term for support provided in the
guidelines can help prevent such a phenomenon.
Though most of the PCs were composed of very small and marginal landholders and even
landless in some cases, there were a few in Madhya Pradesh and in Rajasthan which had
medium and large farmers as members and that was one of the reasons that one of them was a
non-starter from the beginning and the other one also could not undertaken any major business
activity as there was no felt need for such collectivisation.
The experience of West Bengal and Tamil Nadu also shows that public support in the form of
infrastructure and marketing opportunity can also help PCs scale up and turn profitable sooner
or later. This was the case with PCs in West Bengal which had franchise rights of Sufal Bangla
supermarkets as operational entities which led to many farmers selling vegetables and fruits to
these outlets which had very high number of footfalls and turnover. Similarly, in Tamil Nadu,
the handing over of Tamil Nadu supply chain management (TNSCM) owned processing and
warehouse infrastructure facilities gave a jump start to the PCs. In both cases, this was given
on competitive bidding bases.
The new market Acts of the Union Government provide many new opportunities for FPOs like
stocking exemption for food products from the ECA which they can use if they have
warehousing facilities. Further, the Farmer Produce Trade and Commerce Act, 2020 provides
for e-markets by FPOs. This was earlier allowed in the APMC Acts where private wholesale
markets could be set up by such collectives and there a few dozen such markets set up by FPC
in Maharashtra already operating under the APMC Act. But, the Trade and Commerce Act,
2020 and the contract farming Act, 2020 both include the FPO under the definition of a farmer.
But, no FPO is involved in production as most of them are into pre- and post-production
aggregation, trading and value addition. This needs to be changed to make FPOs buyers of
farm produce in their own right and even contracting agencies which many of them are as they
undertake seed contact farming with their members.

XXVI
Innovations in warehousing close to growing areas like by starts ups like Ergos and Arya
Collateral Warehousing and even NCML can help PCs help farmers realise better prices and
get out of the compulsion of selling immediately after harvest due to the interlocked
transactions with local traders and moneylenders. The warehouse receipts Act provides for this
facility of loans against farm produce, but physical infrastructure was missing earlier though it
is still inadequate. The PCs should proactively hire or lease in such warehouses or make locals
invest in them as managed by Ergos and PC then can manage them for their members and non-
members benefit. Also, the new Trade and Commerce Act, 2020 also frees FPOs/PCs from any
permission and payment of market fee to the local APMCs and they can buy directly from
farmers in the new trade area (non-APMC yard/sub-yard) and even undertake/facilitate
contract farming activity to compete and collaborate with private entities.
To deal with working capital and investment capital problems of the PCs, working capital
provision under priority sector needs to be activated to give loans w/o collateral for a limited
period. The banks should be asked to give collateral free loans to FPCs as they do to the SMEs.
The interest charged to FPOs should be priority sector interest rate as applicable to farmer and
it should be collateral free upto Rs. 25 lakh. The RBI mandate of extending upto Rs. two crore
loans to PCs under priority sector lending as direct agricultural credit and upto Rs. five crore
under indirect agricultural finance needs to be enforced. Infact, there could be even sub-targets
for FPOs under the PSL norms for indirect finance.
Since FPOs are like MSMEs, it is possible to mandate a pat of all government purchases of
food and fibre through FPOs and even food supermarkets required to buy atleast 25% from
FPOs like there is a provision in FDI in retail policy for MSMEs.
The NABARD proposal to set up infrastructure fund guarantee subsidiary for FPOs is welcome
and it should also cover crop FPOs, not just those in animal husbandry and fisheries.
More training and capacity building for members and BoD required to create awareness and
engagement and more equity. Professional training for staff is also required. Infact, there could
be tie ups with rural management and agribusiness management colleges to train professionals
for such roles which is more than simple agribusiness management. The co-operative training
colleges at the state level should move to include FPCs under their mandate and train their BoD
and executives as now NCDC is also involved in promoting FPOs.
The state government need to step in as they are located close to these entities and should frame
definite policies and programs for organising and supporting FPCs no just implement central
schemes about it. Some states like Punjab, Kerala and Odisha have moved in this direction
with policy and this needs to be encouraged and supported and Odisha policy which is very
comprehensive needs to be emulated elsewhere.
Some states have started supporting FPOs in a big way even without a policy. For example,
Tamilandu provided Rs. 266.7 crore for financing FPOs thru TN SFAC which would have
three components- mezzanine capital assistance (Rs. 50 crore), credit guarantee (Rs. 50 crore)
and revolving fund (Rs. 166.7 crore). This is to support more than 500 PCs in the state of which
130 are promoted by the state department of agricultural marketing and agribusiness itself. The
credit guarantee fund would provide easy access to bank credit for FPCs with 50% guarantee
against default by the PCs which would be written off eventually by the lending agency. This
would be available for first 3-5 years of a PC. The mezzanine capital would be a margin fund
corpus with a lending agency which would invest in the FPCs in the form of cumulative

XXVII
redeemable long term preferential capital or debentures at nominal rates, redeemable after five
years. Similarly, Karnataka allocated Rs. 630 lakh in 2017-18 for FPO promotion thru the state
SFAC which was Rs. 936.89 crore in 2016-17 but there is no separate policy on FPOs in the
state which has directly promoted 73 PCs across the state.
The Government of Bihar provided for 25% of the project cost as capital subsidy for FPOs as
against 15% for individuals, partnerships firms and LLPs provided the project cost is at least
Rs. 25 lakh, and it is credit linked. Further, under the PMFMFPES, there is grant of 35% of the
project cost linked with credit as long as it is ODOP produce and has been into it for at least
three years and has turnover of Rs. one crore but they need to put in margin money (10% of
the project cost) for working capital and the scheme is also available for common infrastructure
creation. Upto Rs. five lakh can be availed for preparing a branding and marketing DPR with
a ceiling of 50% of the total cost. Under the AIF, there is interest subvention of 3% up to loans
of Rs. two crore and a credit guarantee upto this amount under CGTMSE scheme.
The state governments need to proactively offer APMC licenses to FPOs for commission
agency or trading of agricultural produce as well as engage them in setting up farmer consumer
market yards (FCMY) as provided in the model APLM Act, 2017. The state governments can
also provide initial seed capital in the form of grants to FPOs for undertaking initial business
activities and allocate funds for CHCs under ATMA and other schemes based on need and
merit.
Further, the government can incentivise private sector to work with PCs when it undertakes
procurement through contract farming or direct purchase which are now legal. Rather, state
governments can incentivise it by not insisting on bank guarantees or the like or not linking
contract price in any way to the MSP.

1
Chapter 1
Introduction
1.1 Background
Primary Producers’ organizations or collectivities are being argued to be the only institutions
which can protect small farmers from globalization by helping farmers buy or sell better due
to scale benefits, lower transaction cost, technical help in production, and creating social
capital. In Mozambique, where 80% farmers were small holders and only 7.3% were members
of any farmer organization in 2005, the membership in a farmers’ organization led to 50%
increase in profits (Bachke, n.d.). In China too, there was a coexistence of smallholder
exclusion and favourable impact on co-operative member smallholders (Ito et al, 2012; Ma
and Abdulai, 2016). Various farmer organizations in China emerged as farmers needed
specialized in production technology and access to markets, and thus Farmer Specialized
Cooperatives (FSCs), were set up which provided, both information and direct subsidies for
the development of these cooperatives. Cooperative unions, both product and geography based,
were developed from FSCs to overcome the problems of scale, finance and competitiveness
(Huang et al, 2015). Indeed, such collectivities are needed for small farmers as they help realize
better output prices (Roy and Thorat, 2008), improve technology adoption, and get credit terms
and thus can help eliminate interlocking of factor and product markets into which small farmers
are stuck (Patibandla and Sastry, 2004; Kumar et al, 2013; Kumar et al, 2018; Verma et al,
2019). Producers Organisations (POs) can also help appropriate a part of the value created in
the chain by private sector, for their members (Gersch, 2018). In Uttarakhand, the Organic
Producer Groups (OPGs) negotiated with buyers for a better price and so, even with decline in
crop yields, farmers continued because of the premium price, while, in Kerala, Indian Organic
Producer Company Limited (IOPCL) provided support to member producers in the form of
subsidised seeds, micro-irrigation equipment and organic certification (Cherukuri, 2014). A
field study of Self-Employed Women’s Association (SEWA) and Global Fairness Initiative
(GFI) launched Women Farmers with Global Potential (WFGP) project involving 2000 women
farmers in four districts of Gujarat in terms of its impact on farm and off-farm income, credit
uptake, and access to output markets through village producer associations based on a
treatment group (n=732) and a control group of farmers (n=743) revealed an increase in total
income as statistically significant for members older than six months. But, increase in output
for SEWA members had no effect on quantum of output marketed and farmer’s knowledge of
output prices. The analysis suggested 45% greater likelihood of knowledge of credit options
among members and 10-14% more credit offtake and heterogeneity in income effects with
regard to SEWA membership with poorer women reporting greater increase in income and
output. Overall, the initiatives like rural producer associations in general had a substantial effect
on the awareness of members and modest effect on income and output, at least in the short term
(Desai et al, 2014).

2
POs still struggle to become successful, and even a successful PO runs the risk of facing the
various challenges from factors like, socio-economic-environmental context, group
characteristics, externalities, level of PO, relationship with higher level collective and
performance framework for the collective which may prevent it to remain effective and
competitive in the local system in the long run. But, the factors affecting the POs are dynamic,
and the POs need to continuously innovate to counter those challenges (Jain and Narnaware,
2018).
POs in India can be registered as either Cooperative Societies Act, Autonomous or Mutually
Aided Cooperative Societies Act, Multi-State Cooperative Society Act, Producer Company
(PC) or Public Trusts. Until recently, in India and many other developing countries, collectives
were mostly organised under the co-operative structure. However, cooperative structure in
India doesn’t give the needed freedom to operate in complex environment for large scale
cooperatives and due to political interference, corruption, elite capture, and similar issues, the
cooperatives soon lost their vibrancy and became known for their poor efficiency and loss-
making ways. Also, they face higher competition due to privatisation and liberalisation
policies. The major problems of traditional cooperatives have been capital constraint due to the
withdrawal of financial support by the government, high competition from other players in the
market, and access to credit (capital) and technology, besides free riding by members (Singh,
2008). In fact, internal and external free riding problems originate in the very nature of the co-
operative as an institution as it distributes profits based on patronage and not investment
(Giannakas et al, 2016). The horizon problem occurs as members can’t trade shares at market
price, and thus, they can’t capitalise their gains when they leave the co-operative. Non-
tradability of equity shares at market prices also creates portfolio problem as members can’t
diversify their portfolio to reflect their risk preferences. Additionally, influence problem
distances investors from control as there is only one member one vote (Rosairo, 2012).
In order to escape from this difficulty of co-operative enterprise, NGCs had emerged in many
parts of the world during the 1990s. This arrangement by cooperatives helps them become
economically efficient, financially viable, and obtain member loyalty. In practice, though the
NGCs have been able to raise 30-50% of their total capital through delivery rights issues, the
problems include: (i) off market purchases to meet contract terms by the growers; (ii) leasing
of delivery rights by members; and (iii) dependence on non-producer member equity and non-
member business (Singh, 2008).
An amendment was made to the Companies Act, 1956 in 2003 in India, to include Producer
Companies (PCs). India is the second Asian country after Sri Lanka (where they mostly failed)
to try this form of PO (Singh, 2016). A similar entity called Farmer Professional Co-operatives-
in China were granted clear legal status as independent and democratically administered
organisations in 2007 registered under the State Administration of Industry and Commerce
(SAIC) (Vorley, et al, 2012). PCs try to establish principles of profit-oriented contemporary
business organizations within farming communities, to connect them with corporate buyers
from the rapidly transforming Indian retail landscape. It gives more freedom to cooperatives as
companies to operate as business entities in a competitive market (Trebbin and Hassler, 2012).

3
For details of PC features and structure and their departure from or similarity with cooperatives,
see Singh and Singh, 2014.
The main parameters of distinction within the PCs are (1) who promotes these PCs (for profit
or not for profit agencies), (2) whether they are inward or outward oriented. Most of the PCs
existing in India today are promoted by NGOs, and only a few of them are only concerned with
community internal issues. PCs with outward orientation (which are NGO promoted)
concentrate on internal group organization with less capital intensive activities like trading and
supplying inputs during initial stage and later evolve into developing market linkages. In a very
few cases, corporate promoters (for profits- supermarkets, input suppliers or food processing
companies) set up these PCs which they are not intending to do business with (inward
orientation). These are, in most cases, in early or experimental stages or failed attempts from
the corporate sector of organizing farmers into a PC for business purposes. Generally, the
challenge for all types of PCs is the balance between inward and outward orientation. While
the PCs promoted by NGOs often lack the business skills to develop effective market linkages,
in the PCs promoted by corporates, the promoter might be too aggressive in building market
linkages that it fails to understand social dynamics within the group or develop long-term
welfare effects (Trebbin, 2014).
In India, first set of PCs were promoted and supported by a state government (Madhya Pradesh)
under a World Bank Poverty Reduction project (DPIP) in 2005. In the case of PCs in MP, the
state government which was also the promoting body provided a one-time grant of Rs. 25 lakh
to each PC as fixed deposit revolving fund for obtaining bank loan against it, and also another
annual grant of maximum Rs. 7 lakh per year for 5 years for administrative and other expenses.
Further, interest subsidy upto a limit of Rs. two lakh was provided on any term loan taken by
the PC and a grant of upto 75% of the cost up to a maximum of Rs. 2 lakh was given for any
certification expenses (NABCONS, 2011). The membership/shareholding of PCs in India
ranges from individual producers to informal self-help groups and individual producers,
registered SHGs and individual members, and only institutional members. By September 2015,
the number of PCs had gone upto 2090 (Singh, 2015), and as of 2018, there are 3200 registered
PCs in India (Anonymous, 2018).
The Union Government and certain promoting agencies have now started promoting PCs by
creating financial and non-financial aids for them. In 2012, the Ministry of Agriculture had
advised all the state governments to treat PCs at par with the co-operatives for various policy
incentives. The Department of Animal Husbandry, Dairying and Fisheries (DADF) had
declared that in addition to cooperatives, PCs shall also be eligible for assistance under National
Dairy Plan (Anonymous, 2018). The Reserve Bank of India had put PCs under priority sector
lending upto Rs. 50 million per PC. The Union Budget for 2013-14, had major initiatives to
support PCs including the equity grant support of Rs 10.00 lakh per PC, with a provision of
Rs. 50 crore and a credit guarantee fund for PCs through Small Farmers’ Agribusiness
Consortium (SFAC) with allocation of Rs. 100 crore (refer Singh and Singh, 2014 for details).
NABARD created Producers Organization Development Fund (PODF) with initial corpus of
Rs. 50 crores during 2011-12, for supporting the existing POs to create innovative financing
models. It provided support to POs for facilitating improved credit access; capacity building,

4
market linkages and need based handholding services to meet their ‘end to end’ requirements.
NABARD created its own subsidiary (NABKISAN Finance Ltd.) for meeting the credit
requirements of POs by adopting a flexible approach based on life cycle needs, while it
continued to provide promotional support towards capacity building, market linkages and other
incubation services to POs through a new fund called Produce Fund. NABARD had been given
a mandate to promote 2000 PCs in two years with Rs. 200 crore funds in 2014-15. This led to
the State government involvement in direct promotion of PCs e.g. in Karnataka. Development
agencies like Friends of Women's World Banking (FWWB) and ICCO are helping PCs with
loans and capacity building grants. In the Union budget 2018-19, Operation Greens with an
allocation of Rs. 500 crore to address price fluctuation in three vegetables– Tomato, Onion and
Potato (TOP) crops for the benefit of farmers and consumers was announced. It aims at
promotion of, agri-logistics, processing facilities and professional management through the
PCs. Also, 100% income tax exemption for PCs upto annual turnover of Rs. 100 crore was
announced (Anonymous, 2018).
This chapter reviews the previous evidence, though limited, on performance and impacts of
PCs and other FPOs in section two, states its major objectives in section three and methodology
in section four besides brief about the organisation of the report in section five.
1.2 Review of previous studies
There are not many serious academic studies on PCs in India with a few exceptions like
Trebbin, 2012, and Singh and Singh, 2014, considering the fact that the PC Act has existed
since 2003. Of the 17 PCs promoted by District Poverty Initiative Project (DPIP), eight were
financially successful, seven at breakeven point and two were into losses. Of the five studied,
two were successful, two at breakeven point and one was into losses. The membership of these
PCs ranged from 1059 to 3260 and median size of holdings of the members was 1.1 hac. The
member awareness index was low at 34% and knowledge level index was at 30%. 63% of the
member farmers were not satisfied with the prices offered by PCs. Savings on input purchase
through the PCs were very modest at Rs. 453 as reported by 31% members. The additional sale
proceeds realization due to PC was 7.6% of their household income. Thus, compared with
members who did not transact with the PC, the members were better off to the extent of Rs.
4193 in their total income. In terms of patronage, only 5% members had sold 100% of their
produce through the PC, another 32% only less than 25% of their total produce and 56% did
not transact with the PC for the sale of their produce. Only 5% were aware that PC was owned
by them (Purushotham, 2012). Areas of specialization of agricultural PCs in India in 2014
showed that about 20% of PCs worked with fruits and vegetables, 14% with seed production,
12% with spices (primarily chilli), and 11% with dairy (Trebbin, 2014).
The performance of PCs in MP differed not so much across promoters as across businesses
undertaken and linkages established besides equity mobilization. The PRADAN PC was in
profit most of the time, while those promoted by Srijan and Action for Social Advancement
(ASA) and MP DPIP made losses, except one PC promoted by ASA which was in profits
continuously for two years of its existence. Since most of the DPIP PCs were in similar business
(production and sale of certified seeds), their performance was largely dependent on this

5
business, but some of them were able to make profit due to scale, other businesses and better
and professional business and market management. In Gujarat, NGO promoted PCs were not
able to raise authorised capital and shareholding was restricted to a few groups and farmers.
They did not have many professional managers. They sold mostly inputs and facilitated
producer selling. On the other hand, the farmer organisation {(Bhartiya Kissan Sangh (BKS)}
and Onion Growers Co-operative Federation (OGCF)} promoted PCs were doing better in
terms of business volumes as well as profits. The PCs in Rajasthan were relatively very new
and had modest farmer base (300-1200) with mostly individual shareholders (100-500) but had
large number of farmer groups associated with them. They had fairly good professional support
from the promoter Access Development Services (ADS- an NGO). In some of the PCs, non-
member dependence was high (20-60%) though farmer base was really made up of marginal
and small farmers, that too, in tribal areas. Though most of them were also into input supply,
two of them also ventured into facilitation of seed contract farming and ginger production and
marketing. All of them were into modest profits. The PCs in Maharashtra presented a mixed
bag with some being extremely genuine and other completely fake. Of the two NGO promoted
PCs, capital base was small, number of shareholders was small and professional help was
missing. Similar was the case of one farmer group promoted PC which had similar profile. In
one case, non-member dependence was very high (70% of business). All of them made losses
and suffered from capital shortage. The PCs in India, in general, appeared to be product focused
rather than producer/farmer focused (Singh and Singh, 2014). Most PCs were not able to
benefit producer members on any significant scale in terms of gross monthly turnover per
member per month (Nayak, 2013).
Most of the MP DPIP PCs were into seed production business, which involved a small number
of members and a high cost business. Therefore, it did not create member centrality and large
patronage needed for the PC to scale up. The viability of the PCs is dependent on different
factors. In case of Maha Gujarat Agri cotton PC, it was more of scale, type of farmers, and
crops handled. In case of Nimad and Khargone PCs, it was again the high value crop-cotton,
which was sustainable because of support from ASA. Another explanation for most PCs being
in loss could be that as PC income was taxable, the PCs tended to pass on the surplus generated
to members as price benefit to avoid taxation (Singh and Singh, 2014). The Luvkush Crop
Producer Company under the MPDPIP in the Raisen district of Madhya Pradesh which engaged
its farmer members in seed production from 2007 had, in 2014, 2001 shareholders with the
share capital of nearly Rs. 2 lakh, and authorized capital of Rs. 5 lakh. The net profit of the
company increased from Rs. 19,000 to Rs. 3,85,000 and the turnover from Rs. 1,25,000 to Rs.
68,25,000 in seven years. The average income of member farmers increased from Rs. 35,000
to Rs. 1,75,000 per season. The company collaborated with several institutions as a contract
procurer, with research institutes to provide better agricultural practices to members and with
financial institutions for facilitating capital requirements of the farmers. The company has its
own brand named Ajeevika and sells whole wheat flour and gram flour under it (Chauhan,
2016).
The health of a farmer organization depends on financial and nonfinancial performance and
thus, member, domain and patronise centrality become important. Economic viability depends

6
on group attributes, leadership, institutional arrangement, business and financing decision and
the policy environment. On the other hand, governance and management are crucial
determinants of nonfinancial performance which includes shareholding pattern, appointment
of Board of Directors, capital mobilization and allocation, leadership style, rules, norms, and
decision making processes. The organizational viability and sustainability also depends on the
nature of community, its agro ecological and demographic profile and socio economic and
behavioural factors which includes the attitude of farming communities towards agribusiness
(Dey, 2018).
One of the PCs in Rajasthan promoted by BASIX achieved a marginal net profit within three
years. A Reliance Foundation (RF) promoted PC in Maharashtra had share capital of Rs. 28
lakh after five years of set up, and it was able to set up a pulses mill and a godown. Another
RF promoted PC with share capital of Rs. 9.1 lakh and 25 members made losses in all four
years since its inception, except for one year where it made 1.5% net profits. The farmers had
been able to get inputs at 10% lower price and yield improvement of 20% to 30% due to
vermicomposting. The PC had a dal mill and small godown. In Tamil Nadu, one of the two
PCs was in a tribal area and promoted organic agriculture and marketing of that produce,
besides animal insurance. It was able to achieve net profits over the last seven years except
once and had assets at the order of Rs.11.95 lakh in 2015 and ROI of the order of 28%. The
other PC had 1000 farmers as members of 75 FIGs and it was in the business of procurement,
processing and value addition of local paddy, millets, pulses and oilseeds. In 2015-16 it had a
turnover of Rs. 36 lakh. It sold its 70% of produce to whole sellers in various cities and 30%
in processed form in retail (Bhamra, 2016).
In case of silk, Union Ministry of Rural Development, Central Silk Board and PRADAN
collaborated by bringing finance, technology and implementation support respectively to
enable over 10,000 families below the poverty line (BPL) to gain robust livelihoods in Tasar
sericulture. MASUTA women producer’s company was promoted by 60 Mutual Benefit Trusts
(MBTs) of women reelers. Scientific rearing practices were promoted to reduce diseases and
mortality among silkworms, which improved productivity and resulted in the increase of
average annual income to Rs 16,000 per weaver. Eco Taser Silk Pvt Ltd, a subsidiary was
established to manufacture and sell value-added products. Members received 75% of consumer
price, leading to empowerment of women as well as financially weaker sections of the society
besides promoting gender equity (Gupta, 2015).
All women PCs promoted under JEEViKA project of the government of Bihar in maize (2) and
multi-commodities (2- vegetables and one even handling litchi) and two of which even
registered at the NCDEX and NeML platforms were found to be doing well. In case of one
maize PC, members realised 15-20% higher price due to direct marketing by PC and off-season
sale at higher prices owing to linkages with warehouses, on time electronic payments and fair
weighing practices and the PC made a profit of Rs. 6.3 million in its first two years of active
operation and distributed patronage bonuses up to 70% from year one, benefiting nearly 6,000
farmers. The PC was able to leverage institutional credit to the tune of US$ 780,000 from
formal financial institutions like State Bank of India and Friends of Women’s World Banking
(FWWB). The major factors in the performance of the Jeevika PCs included: initial

7
handholding with high quality technical assistance and on ground extension to compete with
prevailing market forces, cohesive social base, following practices to gain trust from formal
financial sector and tackling market systems with simple and innovative technological
solutions (Vutukuru et at, n.d.).
In Sri Lanka, it was observed that PCs were more likely to attract capital and make investments
in value-adding assets when they alleviated the free riding problem by making benefits directly
proportional to investment. Indicators such as equity appreciation, viable operations, payment
of dividends, low external facilitator support, voluntary development of corporate linkages and
growth in the number of shareholders were used to measure performance. Unlike in Sri Lanka,
member farmers in India were sensitized to the need of larger legal entities and then brought
on board. Scale and scope of market linkages were important factors in performance. And so,
multi-product based PCs and the ones in high value business were more successful than others
(Singh, 2016).
SAPCO PC consisting of 21 cooperatives whose role was to meet the five conditions needed
to set up a successful marketing system: cost effective production; larger volumes; good quality
produce; uniform production on individual holdings and across the small farms; and, finally,
production through organic, certified methods, created new supply chains by promoting its own
shops, online sales, franchises, mobile retail vans, food hubs and brand names. All these
marketing initiatives depended critically on CSA (promoter) and SAPCO helping members
certify their produce as organic under the PGS. Even though SAPCO generated an annual
turnover of Rs 25 million, 90% of its members’ produce was sold in local markets at
conventional prices. Resistance by the majority of farmers to membership of SAPCO and
organic farming was driven by the time it took for organic farming to deliver results, financial
constraints on infrastructure for scaling up production and sales, and lack of speedy payments
and cash transfers (Vicziany et al, 2017).
A set of two case studies promoted by CIKS in Tamil Nadu showed that one of the companies
had membership which was in the range of 4000 members and the other one had 700 members
and equity capital of 20-22 lakhs. These companies had 13-16% of their members who were
landless and mixed membership of men and women. They were mostly engaged in seed supply,
bio-inputs, credit and insurance including 1 PC setting up farm mechanisation centres. One of
the companies even owned a combined harvester costing Rs. 20 lakhs. One of the companies
was also able to get matching equity grant and credit guarantee from SFAC. It had also obtained
loans from FWWD, NABFINS and Ananya Finance (CIKS, 2017).
A study of PCs and their sustainability under agricultural value networks in Punjab and Gujarat
showed a more successful case scenario of PCs in Gujarat as compared to Punjab, as lack of
trust among farmer members as well as the promoting agencies was quite prominent in Punjab.
Apart from that, PCs in Punjab failed to find potential buyers for the produce and matching
grant was not utilized properly. Some of the PCs in Gujarat, on other hand, were involved in
processing as well as branding of the produce which was a very important factor in their success
(Singh et al, 2018).

8
Membership in PCs (Karnataka) was quite biased towards male (about 87%). Women
participation in PCs with animal husbandry as secondary activity was quite prominent
compared to others, which reflects the nature of women preferences, who place more emphasis
on food self-sufficiency compared to cash crops (Gowda et al, 2018).
PCs emerged as an alternative to the traditional legal entity of co-operatives which were high
on social but low on economic performance. The PCs, on the other hand, are high on profits
motive but low on social objective due to their limited coverage of producers due to absence
of scale and scope which is the manifestation of shortage of working and investment capital.
So far as problems and challenges facing PCs are concerned, one of the core problems is in the
outlook of the members as they are not sensitized with the concept of PC. There is no loyalty
towards the company. They tend to have an opportunistic behaviour and there exists a problem
of free riding. Other challenges include social capital formation, governance and management
capabilities, scope and scale of PC business, market landscape and ownership issues of such
agencies besides the institutional context and conversion of resources (Mahajan, 2015). The
producer organization that achieve economies of scale and scope enter the growth and glory
stage, but the maturity stage has issues of member differences and risk-taking abilities which
helps separate risk but also leads to problems of free riding on the organization by some
members. The membership growth can also lead to member anonymity and the erosion of
social capital which leads to cost of monitoring and member incentives and enforcing sanctions
which erode profits (Dey, 2018).
Neti et al (2019) examine the number of producer companies in India, their geographic spread,
the current status of their registration, their authorized and paid-up capital besides
characterising such companies in selected sectors as well as all-women shareholder PCs. It uses
spreadsheets published by MCA on their website to compile a dataset of all companies
registered between Jan 1, 2003 and March 31, 2019 and selected only those companies with
the words ‘producer company’ or ‘producers company’ in their name, as the Companies Act
requires producer companies to have the words “Producer Company Limited” in their name. A
list of 7374 producer companies registered between Jan 1, 2003 and Mar 31, 2019 revealed
that 80% of the companies were registered in just last four years (2016 to 2019). This was
largely due to many government schemes coming into effect from the middle of the decade and
a sudden decline during 2018 seems to go with the conclusion of NABARD’s PRODUCE
FUND for the promotion of PCs. Further, during the five years from 2015 to 2019, 1/3rd of the
companies were registered in the last quarter of the financial year. The PCs are spread across
most states and union territories by now with Maharashtra accounting for 26% of the total and
Uttar Pradesh, Tamil Nadu, Madhya Pradesh, Telangana, Rajasthan, Karnataka and Orissa
accounting for more than 5% of the total each. In fact, Maharashtra along with Uttar Pradesh,
Tamil Nadu and Madhya Pradesh accounted for half of the registered companies. However,
Madhya Pradesh had the highest percentage of 5 year or older companies as it was also a
pioneer in setting up these entities immediately after the coming into the effect of the Producer
Company Act. On the other hand, Uttar Pradesh has very few companies which are older than
10 years, though it is the second largest in terms of number of companies with 10% share in
the total. By now, 6% of the PCs have also been struck off by the MCA. Most of them were 5

9
to 10 years old and accounted for 38% of total in that age group while 15% were more than 10
years old accounting for 46% in that age group. This mostly shows that 80% of those struck
off were in these two older age groups.
The number of shareholders ranged from a minimum of mandatory 10 to as many as more than
Rs. one lakh. Most of the NABARD PCs (86%) had 500 or less shareholders and all of them
together (2075) had 7,65,000 shareholders. Only 1% of them had more than 1000 members.
The average shareholders per PC was 369 in case of NABRD and 997 in case of SFAC
promoted PCs. SFAC had 819 FPOs with 8,20,000 members. The average membership across
altogether worked out to be 582 shareholders per company and the total membership was 43
lakh farmers. The average paid up capital per PC worked out to be Rs. 11.7 lakh for all
registered PCs and Rs. 12.2 lakh for those with active status. This meant that the average share
holding was Rs. 2000 per PC. The paid up capital was very high in Tamil Nadu and very small
in Telangana. Only 1% PCs each had paid up capital of Rs. 25-50 lakh and >Rs. 50 lakhs with
86% being in the category of those with <Rs. 10 lakhs each. Further, 39% of these 86% had
paid up capital of just Rs. One lakh. Kerala and Maharashtra had large number of PCs with
very high paid up capital and Maharashtra figured as the largest with those <Rs. 10 lakhs paid
up capital which was almost 90% of the total in that category in Maharashtra. Among the top
20 PCs with the paid up capital, dairy was the biggest sector across the states followed by
coconut and one each in fruits and vegetables, poultry, and tea. Interestingly, two of them were
all-women PCs. Of the 6926 active PCs, majority had very low paid up capital even after 2-3
years of being in existence (Neti et al, 2019).
Neti et al (2020) find that there exists a disparity in number of PCs spread across districts
ranging from 0 to 185. Further, sectorally, there are 210 Milk Producing Companies (MPCs)
with active status where more than half of them are concentrated in 4 states of Maharashtra
(17%), Rajasthan (13%), Madhya Pradesh (13%) and Uttar Pradesh (12%). Most of MPCs are
young as registered less than 5 years ago. About 10% of milk producer companies have Paid
Up Capital (PUC) greater than Rs. 50 lakh. Dairies have larger Paid up capital (median PUC
is Rs. 2.36L) because of large number of shareholders. While 92% of registered PCs are
engaged in agriculture and allied activities, only 1% PCs (75 companies) are working in
nonfarm activities like weaving and apparel-making (30), handicraft production (9), food
processing (6), agarbatti, footwear, etc. About 68% of active non-farm companies are less than
five years in age. Only 4% have PUC greater than Rs.50 lakh. Majority (85%) active non-farm
companies have PUC less than 10lakh.
It was observed that while only 3% of PCs were in dairy sector, there were 7% of women-only
producer companies (almost double) Milk PCs. Further, 82% of the women-only PCs were
engaged in farm-related activities and 4% in non-farm activities. Maharashtra (20%), Madhya
Pradesh (18%) and Odisha (13%) were three states with more than half the women-only PCs.
Only 4% of women owned PCs had Paid up capital (PuC)of > Rs.50 lakh; majority of them
(85%) have PUC less than Rs.10 lakh. Five of the top ten women-only PCs were in the dairy
sector and also half of the top 10 women-only PCs in India had PUC of more than Rs. one crore
each.

10
Several women board members were SHG leaders. Though they were trained in basic financial
literacy and book-keeping but still their understanding of business decisions is limited.
Findings from 100 in-depth interviews of stakeholders in producer companies, such as
producers, board members, funders, promoting institutions and others reveal that the purpose
served by producer companies and their way of functioning is different in mind of each
stakeholder. Such normative imagination of PCs has varied implications. The study reveals that
small farmers view themselves as only suppliers and producer companies as non-exploitative
buyers. Producer-owners thought of the PC as a service provider of seeds, fertilizers, market
linkage services, etc. Some view PCs as government project and thus don’t see the need to
contribute financially. Many farmers lack clarity regarding their role as owners and view their
financial contribution as membership fee rather than share capital. Well to do farmers view
Producer companies as business enterprises with main focus on revenue generation.
Some NGO promoters were forming producer companies by inducting already existing SHGs
as shareholders in them. In such cases, business decisions were made by viewing producers as
‘beneficiaries’. Even farmers viewed themselves as ‘beneficiaries’ i.e. rather than viewing it as
their own business enterprise, they assumed that PCs were part of welfare initiatives taken by
NGO. It was observed that in many cases farmers didn’t see the need to get involved in decision
making and thus were dependent on NGOs without demanding transparency or accountability
from them. It was found that having a financial stake in PCs did not necessarily induce sense
of ownership in them; rather it was influenced by ‘the frequency of transactions and
interactions with the producer companies’. Such lack of sense of collective ownership could
pose a threat to organizational sustainability of the PCs in the long run.
Because of high dependency of PC on promoters for governance, decision making, raising
capital etc, success of PC depended on business competence of promoters and board members.
Many promoters established PCs without prior cost benefit and risk analysis. They
experimented with different strategies like encouraging farmers to undertake untested
activities, thus exposing small and marginal farmers to high risk. The two tier model is
proposed as a solution whereby the market facing company can provide surrogate management
support to PCs. It is argued that a two tier model can help in procurement of multiple
commodities which in turn ensures better utilization of resources. It enables more frequent
transactions with members and thus by building familiarity, it leads to reduction of risk arising
from moral hazard. Market facing companies provide financial stability to supplier PCs by
acting as their assured buyers. They can help establish sales relationship and negotiate
favorable prices. Also they can contribute to building strong internal governance and
compliance in supplier PCs via training. This model offers exit path for NGOs in their role as
mentors and supporters of supplier PCs which will be overtaken by top tier PCs. But, a
limitation of the ‘two-tier model’ is that decisions may be made by the top tier company without
consulting suppliers or without them being informed about the same. Therefore, supplier PCs
should own a significant stake in market facing companies which will also ensure that their
interests are aligned.
11
There was limited success of PCs which were trying to get benefits from government schemes.
It was because of lack of awareness by both government and bank officials and their limited
understanding of PCs. They lacked clarity regarding eligibility of PCs for schemes available to
cooperatives. PCs required not only government ecosystem but also local business network for
achieving efficiency, scale and profitability.
The study reveals that many PCs have weak internal governance. It is because of lack of sense
of ownership and lack of understanding about the functioning of the company. Many board
members did not know if they had a CEO or if the CEO was accountable to them even if
appointed by promoter NGO. Also it is observed that PC shareholders don’t have SEBI
protection or first-hand knowledge of business, thus raising regulatory concerns related to
them. There were also cases where some SHG members were PC shareholders. Though PCs
can’t borrow from SHG federation, there were many instances where large lending was done
to ‘sister’ PCs by SHG federation due to overlap in membership. Thus, such overlap in
membership could have ramifications in terms of risky financial transactions like the misuse
of SHG savings.
The compliance requirements was an obstacle that many PCs struggled to meet like GST
returns due to lack of expertise, lack of awareness or lack of funds. There was compliance
related financial burden imposed on PC shareholders. Various rules and regulations like geo-
tagging the location of offices of PCs were important to weed out shell companies or deter
fraud. But they also created burden on small producers like geo-tagging requires technological
expertise. Even companies with well-educated CEOs found it difficult. Thus, the importance
of doing away with burdensome statutory compliance requirements for PCs in initial stage,
without diluting them in the long run was highlighted and it was emphasised that PCs need to
be recognized as businesses of small producers and not just some ‘beneficiaries’. Finally, it is
recommended that external investment in PCs should be allowed to address the issue of
undercapitalization in them (Neti et al, 2020).
A study of Producer Companies and other FPOs in the states of Punjab and Madhya Pradesh
revealed that most of them were still in the incubation stage in Punjab, included those promoted
by NABARD under Produce Fund and those by SFAC. Only two were found to be in the
emerging and growing stage in Punjab and both of there were more than 5 years old and in
vegetables with membership of 1500-2000 each. On the other hand, all the 3 non-PC FPOs
were found to be in the matured or business expansion stage as 2 of them were more than 5
years old with membership ranging from 40 to 400 and the other one almost 100 years old with
more than 1400 members. In Punjab, most of the FPOs were non-PC structures and those which
were registered as PCs were of recent origin and had very small number of members (50-60).
Only one PC promoted by ACF had more than 1000 members and was found to be in the
emerging stage. On the other hand, in Madhya Pradesh all the 3 PCs were in matured stage
with membership ranging from 700-2872 and were engaged in produce aggregation,
processing, and marketing unlike the Punjab PCs which were mostly dealing with agri inputs.
The study also surveyed 285 farmer members across 19 FPOs of which 45 were from 3 PCs in
MP and rest in Punjab mostly from non-PC FPOs. The two vegetable PCs had membership
mostly made up of marginal and small farmers unlike the ACF promoted PC which was mostly

12
medium and large farmer based. The MP PCs were engaged in selling to government through
SFAC procurement or direct sale in the market with only one doing FPO to FPO sales of 1/4th
of its produce. Majority of the marginal and small farmers in Madhya Pradesh had sold their
produce through the PCs and none of the SFAC companies in Punjab had their members selling
through the PCs. In Madhya Pradesh, it was mostly pulses growers, the significant proportions
of whom had sold through the PCs. In general, across the two states, farmers selling through
the FPOs accounted for only 31% of the total and they sold fully or partly through the FPO.
However, in mature FPOs, this was especially high (42%) in Madhya Pradesh and more of the
produce by more farmers was sold through this channel in Rabi season rather than in Kharif
season. In Madhya Pradesh, across the three PCs farmers, mostly sold through the PCs, wheat,
Arhar and gram and hardly any crop other than urad and moong in Kharif season. In Punjab,
none of the farmers in any PCs or even other FPOs sold any produce through the FPOs except
in case of vegetable co-operative where a significant numbers of farmers sold green peas
through the FPO. There was an area expansion under sugarcane and paddy after the formation
of PCs in MP. There was price increase reported by selling through the PCs in wheat, gram and
Urad as they were procured mostly by the state agencies at MSP. There was also improvement
in yield in wheat, gram and Urad after the formation of the PCs. In general, there was an
increase in the yield from 17% in Rabi to 55% in Kharif in Madhya Pradesh by PC members
whereas these increases were very small or even negative in some seasons in case of some
FPOs. Overall, only 13% of the total produce of the member farmers was sold through PCs in
MP and 15% in case of matured FPOs in Punjab. The net earnings were reported to be 34%
higher in MP and 80% in Punjab. In MP 50% of the farmers reported adoption of new
technology, diversification of crops, and access to better market linkage in more than 50%
cases and even value addition but better price realisation and reduction cost of production and
freedom from commission agents was reported by 40% farmers. This was somewhat lower in
Punjab being around 40% on most parameters. So far as access to new inputs and crops was
concerned this was so in the case of 80% farmers in MP besides 70% reporting access to new
crops and 50% new cropping practices. 1/3rd also reported improved access to farm machinery.
This was even better in Punjab in case of matured FPOs going up to 90% in seeds, other inputs
and farm machineries but only 50% in new crops and practices.
So far as marketing and processing aspects were concerned in Madhya Pradesh, 30-70%
reported improvement in market connectivity, transport of produce, reduced exploitation by
middlemen, better access to storage and warehousing and testing facilities. This was similar
for mature FPOs in Punjab and no improvement was recorded in the case of SFAC promoted
FPOs as well as produce fund FPOs in emerging and growing stage with the exception of
market connectivity and reduced exploitation besides availability of inputs in the case the latter.
The MP PCs also reported improved access to training, extension and government scheme
awareness besides better procurement and reduced dependence on money lenders by majority
of farmers. This was even better in the case of mature FPOs in Punjab and SFAC promoted
FPOs in the emerging state performed well only on training and extension services as did the
produce fund FPOs at that state. The MP PCs had also 1/3rd to 58% farmers reporting better
price, more regular payment and even bonus and more employment opportunities. Similar was
the improvement in the case of matured FPOs in Punjab whereas all other FPOs fared poorly

13
in this. In most cases in both the states farmers reported much improved awareness levels about
various aspects of farming and working of collective agencies including the problem of stubble
burning. The MP farmers were satisfied with collection of produce and its pavement and
grading and payment by cheque. This was similar in the case of matured FPOs in Punjab except
the payment for the produce by cheque. They were also satisfied on production practices, use
of chemical pesticides, processing storage and diversification of crops besides dissemination
of new technologies by the PCs in MP as well as in Punjab. In the case of Madhya Pradesh,
majority of the farmers bought their inputs from the PCs for reasons of economies of scale. A
majority of the members attended the general body meeting regularly and another 1/3rd
sometimes.
The MP PCs had sales turnover of the order of a million rupees or above and net income in
tens of thousands and being only 1-5% of their turnover in 2016. Their equity ranged from 2.9
lakhs to 9.2 lakhs. 75-100% small and marginal farmers sold through the producer companies
and 40-80% of the members did so in MP. In crops like wheat and mustard and Arhar and
Moong the farmers sold as much as 50-80% through the FPOs and this was 10-30% of the total
sales revenue of the farmers. The two SFAC promoted by ACTech agro under NVIUC were
found to be defunct and did not undertake any business activities. These producer companies
were being provided Rs. 9.06 lakh over 3 years mostly for the salary of the CEO, office
expenses and the salaries of the POPI resource person besides training and exposure visits for
the farmers and the training for the directors of the company. Almost 50% of the assistance
was provided in the 1st year and the remaining in the next 2 years (Verma, 2017).
A study of the Madhya Pradesh Women Poultry farmer PC which had more than 2000 members
found that the member growers had somewhat better farming experience, education and income
besides memberships in other groups than their non-member counterparts. The company works
with 10,000 members and has its retail brand of Sukhtawa chicken present 12 cities of the state.
It had a turnover of 290 crores and profit of 60-70 crores starting from turnover of 15 lakhs in
2007. It has 10 producer co-operative as its members. The company was found to be very
effective and the political, social, human and economic capital of the members was found to
be much higher than those of the non-members. In the case of Tamil Nadu, where the average
size of the land holding is 0.8 hectors and 91% of the farmers are marginal or small operators,
cultivating 62% of the total area (Mukherjee et al, 2019).
A study of two PCs dealing with vegetables revealed that one of them had a shop in the farmers’
markets where the company procured from the farmer members and sold them directly to the
consumers at the price fixed by the state agency. The members received prices which were
almost double compared with what non-members received and therefore had very high (2.5
times) net income compared with non-members. The company had an agri-input shop as well
(Pandian and Ganesan, 2019). Another study of FPCs in organic chilli in Telangana also found
the gross returns of FPO members 13.85% compared with those of non-members besides
23.4% higher yields and 9% lower cost of production (Manaswi et al, 2020). A study of all
women Mahila Umang PC in Uttarakhand with 1464 members, setup in 2009 showed that the

14
knowledge levels of women members were high or medium in case of 63% members and very
high in case of 20% members (Mukherjee et al, 2019a).
Another study of 10 producer companies in Maharashtra found that 67% of the members joined
the companies due to the suggestions from ATMA and other extension personnel mostly for
agri-input services and for better marketing of their produce. The companies provide support
to the farmers in the selection of crops, availability of good quality inputs, farm mechanisation,
training and demonstration and post-harvest facilities and access to the market which were the
problems faced by the farmers. However, 30% PCs were involved in agri-input serviced and
11% in farm mechanisation and 15% in seed production. On the other hand, 31% engaged in
procurement and 15% in further sales activity in agri-produce, whereas more than 100 farmers
each participated in various activities procurement for the most participated activity and
forward marketing the least. It was found that all the PCs were able to deliver much higher
procurement price than the APMC price. There was a lack of feeling of ownership among the
farmer members. Another case study of 5 PCs across 5 states showed that they were at different
stages of growth and also promoted by different agencies though mostly by NGOs (Shankar,
2019).
In another recent large scanning survey of FPOs across 49 clusters to identify potential for
FPOs, of the 1883 FPOs surveyed, 750 were found to be active and they had 3.6 lakh farmer
as members with average land holding of 1.02 hectares. The average number of members per
FPO was 491 and the average turnover Rs. 20 lakh in 2017. Of the active FPOs, 47% had some
business revenues. This sample was drawn from 4723 PCs and 103 other FPO types across 12
states which had at least 20 FPOs per district and 7 other states which had at least 8 FPOs per
district or cluster (table 1.1).
A comparative study of FPOs in Bihar and Maharashtra based on primary data showed that in
Bihar the membership of the studied FPOs varied from 300 to 3001. It is also found that the
focus on increasing the number of members leads the chances of adverse selection which
affects performance. The FPOs in the state had not scaled up lacked product differentiation and
new markets due to policy induced adverse selection of members. In fact, the average monthly
income of FPO members was lower than that of non-members (14%). On the other hand,
Maharashtra, a survey of 400 members and 175 non-members showed that the FPOs have
evolved more organically and mostly promoted by NGOs besides some private CSR outfits.
However, there was not much FPO activity in the traditionally cooperative dominated areas in
both the states upper castes and OBCs were more likely to become members of FPO. In terms
of literacy, FPO members were less illiterate (18%) compared with non-members (33%). 70%
of the farmers in Bihar and 82% in Maharashtra reported receiving new information about
crops, seeds, and technologies and 25% and 68% respectively also reported receiving inputs at
right time and at lower cost. However, on the output side only 13% farmer members in Bihar
and 29% in Maharashtra reported receiving better prices or access to new markets. The access
to better credit and government schemes was even lower reported by only 3% in Bihar and
19% in Maharashtra. Also very small percentage of them saw post-harvest operations

15
becoming easier after joining the FPO. In Bihar, 32% farmers reported improvement in post-
harvest operations after the entry of FPO. 1/3rd of the member farmers in Bihar also wanted to
Table 1.1: Major cluster and crop wise number and proportion of active FPOs Cluster Major Crops Total No. of PCs
and (surveyed)
No. of Active PCs
(%age of surveyed)
Amravati Cotton, Tuar, soybean and orange 56 (40) 16 (40)
Chittoor Mango, tomato, vegetables 20 (20) 7 (35)
Nagpur Orange, paddy, cotton, soybean 28 (15) 2 (13)
Tehri Potato, Pease, cabbage, capsicum 28 11 (39)
Agra Potato, wheat, paddy 19(5) 2 (40)
Alwar Wheat, pearl millets, muster 14(7) 3(43)
Delhi Wheat 42 10(24)
Fazilka Kinnow 0 0
Gwalior Wheat, paddy, muster, sesame 16(5) 4(80)
Jaipur Wheat, millet, cluster bean, muster 36(24) 4(17)
Kanpur (rural) Wheat, paddy, red gram 25(10) 9(90)
Kanpur (Urban) Wheat, paddy, potato 24(5) 5(100)
Karnal Wheat, paddy, vegetables 10 4(40)
Lucknow Wheat, paddy, muster, mango 63(21) 3(14)
Ludhiana Wheat, paddy 9(7 non-existent) 0
Mandla Wheat, paddy, gram 18(15) 10(66)
Nagaur Mung, pearl millet, cluster beans 22(8) 5(63)
Palanpur Potato, maize, cucurbits 0 0
Ahmednagar Onion, pomegranate, Tur 50(40) 32(80)
Akola Cotton, soybean, gram 29(20) 12(60)
Aurangabad Cotton, maize, Tovar, Mousambi 69(36) 26(72)
Bhandara Paddy 19(13) 3(23)
Buldana Cotton, soybean, tur 48(16) 13(81)
Dhule Cotton, soybean, maize 25(13) 6(46)
Jalna Cotton, soybean, maize 41(21) 12(57)
Thane Paddy, Okra, Cucurbits, Brinjal 34(16) 6(46)
Nanded Cotton, soybean, tur, Gram 28(24) 7(29)
Nasik Onions, grapes, pomegranate, tomatoes 74(19) 5(26)
Sangli Grapes, maize, soybean, tomato 28(13) -
Satara Strawberry, Jowar, pomegranate 29(12) 5(42)
Solapur Pomegranate, maize, Tur 42(28) 20(71)
Wardha Cotton, tur, soybean, orange 35(29) 7(24)
Washin Cotton, tur, soybean, wheat 23(19) 11(58)
Yavatmal Cotton, soybean, tuar, orange 41(37) 8(22)
Ahmedabad Wheat, paddy, cotton 9(2) 1(50)
Dahod Wheat, maize, vegetables, soybean 14 2(14)
Dhalai (Tripura) Pineapple, orange, jackfruit 2 2(100)
East Singbhum Cauliflower, tomato, Okra 7(2) 0
Ganjam Green gram, maize, b. gram, tomato 16(16) 13(81)
Kamrup (Assam) Pineapple, banana, orange 6(4) 0
Mayurbhanj Paddy, mango, guava, cashew 19(17) 2(12)
Ranchi Paddy, cauliflower, brinjal 23(23) 4(17)
Anantpur Groundnut, red gram, pomegranate 26(26) 22(85)
Kolar Mango, tomato, maize, French beans 21(14) 12(86)
Krishna Paddy, mango, turmeric, banana 20(20) 9(45)
Mehboobnagar Red gram, paddy, cotton 22(16) 4(25)
Medak Onion, cotton, red gram 11(11) 2(18)
Pirambalur (TN) Maize, cotton, small onion 4 4(100)
Tumkur Coconut, Arecanut, banana, tomato,
ragi
20(17) 12(71)
Source: Arya CWS and Tata Trusts (2018).

16
diversify into vegetables. The technology adoption in Bihar was also simple and low cost. In
terms of determination of members of FPO, education farming as primary occupation and
interaction with extension agencies seem to matter. In Bihar, the FPOs were able to reduce
input cost but were not able to make a difference in bridging the gap between farm and market
prices. The farmers still reported market price fluctuations more commonly as a major risk
compared with production risk like fraud or famine, high input price or pest attack. There was
no performance based incentive for members. The study highlights yield for better mechanism
for member selection and right size of the FPO in terms of membership besides greater product
differentiation. The only value added activity being undertaken to create product differentiation
by some of them was online sales.
Interestingly, though the PCs were categorised into promoted PCs, promoted FPOs and Other
FPOs, it was found that FPO members were relatively large in terms of landholding and had
14% higher average monthly expenditure than that of their non-member counterparts. The
results also showed experience in farming, prior experience in cooperative membership, and
higher reliance on private sources of information as important determinants of FPO
membership. In fact, non-promoted PCs had most commonly reported increase in gross income
(98% members) as well as increase in productivity. On the other hand, only 32% of the non PC
members reported increase in gross income. The members attributed the change in income due
to better prices and access to new markets. The Other FPOs (non-promoted) also outperformed
FPOs in strengthening small holder position in value chains as 94% of OFPO members reported
cost reduction compared with only 27% of PFPO members. As against this, only 29% of non-
FPC members reported any improvement in productivity with 40% actually reporting a drop in
the same. The FPC members with higher irrigated areas showed even further improvement in
their income. The use of mobile phones by information was the significant factors in improving
productivity for both members as well as non-members besides only the OFPO membership
being critical in the case of members. The FPOs in general performed better than those in Bihar
on most counts like better prices, better negotiation capacity, reduction in transaction cost and
lower market rejection of produce. Whereas farmers in Bihar attributed increased income to
new markets in Maharashtra, it was more about better prices and quality based purchase of
produce, the rejection was lower. The heterogeneity of the group in which different skills
combined also seems to matter in delivering better results. Also the FPOs in which farmers and
managers’ incentives are relatively better aligned were more successful in adopting new
technology and better risk management. This kind of alignment of objectives and incentives
can also reduce intermediation cost. For this leadership and managerial resources matter
significantly. Therefore, the performance based system which addresses problems of adverse
selection and moral hazard and leave to active member participation can help better
performance (Roy et al. 2020).
Another review of literature based assessment of the FPO performance revealed that Andhra
Pradesh had an FPO policy. There was not adequate evidence on the participation of small and
marginal farmers. The NGO promoted FPOs were found to be operating on a small scale with
limited reach when compared with large PC like those promoted by the NDDB. Further, it was
found that business model of a majority of the FPOs focused on procuring farm inputs with

17
limited focus on establishing market linkages for selling the farm produce. Lack of business
orientation and limited knowledge of agri value chains nor other important deterrents for FPOs
from operating as business entities. The NCDX provides for farmers to store their produce for
a free warehouse after taking the sell position on the exchange platform. There is also a lack of
agreement whether capacity building should focus on farmer members or employees of such
entities. It was also suggested that the assessment of performance of FPOs should be done by
themselves and should include besides efficiency and equity, other contextual parameters like
environmental indicators to judge their adoption of sustainable agriculture practices which is
missing from the existing tools of performance assessment. The rating tools are also bias
towards quantitative indicators e.g. membership, size is the only indicator which misses the
dynamics of participation. Similarly, financial ratios lack standardisation and therefore do not
permit any useful comparison besides affecting the capability of the FPOs to raise resource of
financial institutions. (IIIE, 2019).
Only some states of India seem to have a conducive policy environment for PCs which include:
Madhya Pradesh, Karnataka, Maharashtra West Bengal and Rajasthan (Dey, 2018). The states
of Karnataka, Orissa and Telangana have state specific FPO policies. Tamil Nadu government
has allocated Rs.100 crore for the current year to support 200 FPOs. The Doubling of Farmer
Income (DFI) committee recommends a minimum of 7000 FPOs by 2020-23. In seven states
of Maharashtra, Madhya Pradesh, Uttar Pradesh, Rajasthan, Gujarat, Karnataka, Telangana,
80% of the FPOs were registered as producer companies as of 2018. 60% of the PCs are in the
states of Maharashtra, Uttar Pradesh, Tamil Nadu, Madhya Pradesh, Rajasthan and Karnataka.
In fact, West Bengal and Maharashtra are among those states which have added 50% or more
of their PCs during the last three years only. The seven state study also showed that 92% of the
member farmers were marginal or small, 16% women and 12% were tribal farmers (Prasad,
2019).
The seven-state study also showed that 48% of the FPOs had membership below 500. It is
pointed out that most FPOs are either too involved in input supply or busy aggregating produce
for public procurement or sale to a buyer. It is only some NBFCs like Nav Kissan, Ananya
Finance, Samunathi which lend without collateral. Further, more than 50% of the FPO boards
had no external experts or independent directors and 68 percent had no female directors
(Prasad, 2019).
Almost all of the PCs have suffered from lack of working capital support (NABCONS, 2011),
difficulty in access to loans, lack of finance in formative years (Singh and Singh, 2014) and
limited access to credit (Raju, et al, 2017). In most cases, vision and direction from the Board
of Directors are missing in PCs. Paucity of experts due to lack of resources does not keep the
governance and management in place. Lack of experience has led to non-sustainable business
plans. Most of the PCs have high operational costs due to high overhead costs and high
transactional costs (NABCONS, 2011). Thus, there is a need of major change in the way PCs
are made to work. But then, the reality of cooperatives has changed and successful cooperatives
can only selectively follow principles of cooperation, seek member centrality, can have large
scale with mixed membership, can evolve top down with proper incubation and design, need

18
not have fertile grounds to begin with, and successful cooperatives can create their own policy
engagement and manage it to their advantage (Mahajan, 2015).
1.3 Major research questions and rationale for the study
The above review shows that there has not been adequate academic and professional
examination of the issues facing the PC domain which are practice and policy relevant. Some
of these research issues are:
i. How far PCs are an improvement over the existing co-operative or other models of
producer organization?
ii. How relevant and appropriate are the PCs in the context of globalised markets?
iii. Is there a design aspect of the PC which matters and should be provided as an
intervention?
iv. Is there any specificity about the crop or enterprise which matters e.g. commodities or
high value crops?
v. Who is more relevant promoter for a PC– state or civil society or private sector?
vi. What conditions are necessary for business and economic viability of PCs?
vii. Are PCs with higher levels of skills and capabilities more successful in working with
modern markets as scale and scope become important to do viable business?
viii. Which model of promotion is more robust and viable?
ix. What kind of policy treatment do the PCs need to grow as vibrant producer entities and
to make an impact on the livelihoods of small producers?
x. How do innovations in PC take place and what makes them scale up- inclusive or
sustainable?
1.3.1 Rationale for the study
There are many types of promoting agencies in India which include: SFAC and NABARD as
national level public bodies, State Governments and their agencies leveraging RKVY or the
World Bank funds, NRLM Programme (MoRD), Other NGOs/Trust/Foundations like Bill &
Melinda Gates Foundation, TATA Trust, Reliance Foundation, Ambuja Cement Foundation,
HDFC Foundation, C&A Foundation, HSBC CSR, Axis Bank Foundation, Jindal Steel
&Power Ltd. and Syngenta foundation. Each one has its own model of organising and
promoting the FPCs. It is important to examine the models of major players especially those
supported by SFAC, NABARD and state government agencies and some large independent
NGOs like AKRSPI.
The SFAC strategy paper (2019) on promoting 10,000 new FPOs lists various challenges in
promotion of FPOs and proposes to support 250 new FPOs in the first year and 1000 in second

19
year followed by 2500 in the third and 4500 in the fourth year with 1750 in the 5th year with
25% funds going for FPO formation and incubation with Rs. 25 lakh per FPO for five years
and another 30% for FPO management @ Rs. 18 lakh per FPO over three years. Beside, 25%
would go for equity grant of Rs. 15 lakh each. It also brings in the concept of cluster based
business organisations (CBBOs) for FPO promotion instead of depending on NGOs. This is
important departure from the past as in the past majority of FPOs were promoted by local and
national NGOs. Therefore, it is important to examine the promotion strategies of the NGO and
professional promoters which this study takes into account and therefore focusses on the
performance f PCs promoted by different type of promoting agencies like NGOS, professional
Agencies like ISAP and IGS.
The operational guidelines on Formation and Promotion of 10,000 Farmer Producer
Organizations (FPOs) by MoAFW (2020) also aim to provide holistic and broad based
supportive ecosystem to form new 10,000 FPOs to facilitate development of vibrant and
sustainable income oriented farming and for overall socio-economic development and
wellbeing of agrarian communities; to enhance productivity through efficient, cost-effective
and sustainable resource use and realize higher returns through better liquidity and market
linkages for their produce and become sustainable through collective action; and to provide
handholding and support to new FPOs up to 5 years from the year of creation in all aspects of
management of FPO, inputs, production, processing and value addition, market linkages, credit
linkages and use of technology etc. besides providing effective capacity building to FPOs to
develop agriculture entrepreneurship skills to become economically viable and self-sustaining
beyond the period of support from government.
It defines FPO as a generic term, which means and includes farmer- producers’ organization
incorporated/ registered either under Part IXA of Companies Act or under Co-operative
Societies Act of the concerned States and formed for the purpose of leveraging collectives
through economies of scale in production and marketing of agricultural and allied sector.
However, FPOs registered under Cooperative Societies Act of the State (including Mutually
Aided or Self-reliant Cooperative Societies Act by whatever name it is called) for the purpose
of this Scheme, is to be insulated from all kinds of interference including in election process
and day today management through suitable provisioning in their Memorandum of Association
and Bye-laws with a view to encourage healthy growth and development of FPO.
The formation and promotion of FPO would be based on Produce Cluster Area, which is
broadly defined as: “Produce Cluster Monitoring Committee (D-MC), State Level Consultative
Committee (SLCC), other Ministries/Departments of Government of India and the States as
well as with recommendations of Implementing Agencies (NABARD, NCDC and SFAC) with
input from Cluster- Based Business Organization Area” for purpose of FPO formation and
management herein means a geographical area wherein agricultural and allied produce such as
horticultural produce of similar or of almost similar nature is grown / cultivated; therefore, an
FPO can be formed for leveraging economies of scale in production and marketing. This will
also cover Organic Produce and Natural Farming. The Produce cluster area is to be identified
with the input of District Level (CBBO) and suggestions of relevant Government of India

20
Organizations. The CBBOs will undertake Feasibility Study in assigned clusters including a
prospective Business Plan in order to establish a fit case for formation of an economically
sustainable FPO.
FPO with a minimum farmer-member size of 300 shall be eligible under the scheme in plains,
while in North-Eastern and Hilly areas (at a height of 1000 metre or above MSL and including
such other areas of UTs), size of 100 shall be eligible. Farmer-members cohesively located
with almost same interest are to be mobilized to form a group of 15-20 Members, calling the
group as Farmer Interest Group (FIG) or Self Help Group (SHG), Farmers Club (FC), Joint
Liability Group (JLG), and Rythu Mitra Group. Such 20 or more groups from a produce cluster
area or a village/ cluster of neighbouring villages based on certain commonalities are to be put
together to form an FPO. It may provide special focus to include small, marginal and women
farmers/women SHGs, SC/ST farmers and other economically weaker categories etc. as
members to make FPOs more effective and inclusive.
It states that while adopting cluster-based approach for produce or produce mix, formation of
FPOs will also focus on “One District One Product” approach for development of product
specialization, in case the focused agriculture produce has been declared for that district,
whereby FPOs will be encouraged for promoting processing, branding, marketing and export
of the product for better value realization. There may be more than one cluster for one product
in one district and a cluster also may extend beyond a district.
The scheme on formation and promotion of 10,000 FPOs is to be implemented till 2023-24
with budgetary support of Rs. 4496.00 crore. Since financial support excepting management
cost is to be extended for five years, therefore, FPOs formed will be required to be financially
supported till 2027-28, with the additional committed liability for period from 2024-25 till
2027-28 of Rs. 2369.00 crore say Rs. 2370.00 crore. Thus, the total budgetary requirement up
to 2027-28 would be Rs. 6866.00 crore. The budget requirement is to be met from overall
allocations of DAC&FW.
There is a need to do more case studies that can give insights into creating new theories or
models for both researchers and practitioners (Prasad, 2019).
1.4 Research objectives and Methodology
The study examines performance and impact of PCs across resource institutions and states by-
i. Assessing physical and financial performance of PCs over the years
ii. Understanding the factors that influence the performance of PCs and document the best
practices followed by successful PCs and reasons behind those that failed
iii. Comparing and contracting different models of PC organisation and promotion for
identifying more robust models for scale up
iv. Comparing the performance of specialised PCs like all women or special domain PC
with rest of the PCs and analysing the factors in differential performance
v. Examining economic impact on member farmers, and
vi. Inferring on policy and practice mechanism for improving performance of PCs.

21
1.4.1 Methodology
As of December 2014, there were total 462 PCs in India, out of which 15% were in MP, 14%
in Maharashtra, 11% in Tamil Nadu and about 9% in Gujarat. (Trebbin, 2014). By 2018, there
were 3200 registered PCs and NABARD (48%) and SFAC (38%) had promoted 86% of them.
In all major states of India, only less than 2% farmers were members of FPOs ranging from
low of 0.5% in AP to high of 2% in West Bengal and 2.3% in Karnataka, with the Indian
average being 1.7%. Only hill states like UK, Sikkim and Manipur had high %age of 6.6%,
25% and 5% respectively. Infact, 12 states had less than 1% farmers as members of FPOs, in
another 6 states, 1-7% were members. In our study states i.e. MP it was 1.9%, Rajasthan 1.3%
and U.P it was 0.18%, WB- 2% and TN it was 1.5% (Rani et al, 2018).
Out of 2294 registered PCs under the NABARD, SFAC and non-SFAC lists, 935 PCs are at
least 3 years old (registered before 2016) and are considered for this study frame. Further, only
those states which had at least 30 PCs were considered.
Infact, in 2018, 50% of the members of FPOs were in four states of Karnataka, MP, Tamilnadu
and WB. The highest number of RIs/POPIs was in Karnataka (85) which was 9% of all
promoting agencies in India. The five study states had 39% of SFAC supported FPOs and 35%
of NABARD supported FPOs and in total they accounted for 36% of all FPOS in India
supported by these two agencies. These states had 28% of NABARD POPIs and 39% of SFAC
RIs and altogether they had 28% of all promoting agencies in India (table 1.2 and 1.3). Infact,
in terms of FPOs per agri GDP value, TN and MP were at high level (0.54 and 0.74), while
WB and Rajathan were at medium level (0.38 and 0.37) and U.P,. was at the bottom (0.16 FPOs
per billion rupees of AGDP (Manaswi et al, 2018).
These PCs are classified by different Resource Institutions (RIs) and typically, one RI works
across PCs across a state/s. RIs which have promoted at least 20 PCs, with at 10 PCs in at least
one state, and those who are either crop based, or in allied sector were considered (table 1.4).
Some of these PCs are also supported by special agencies, which are large NGOs without state
support, or state agencies like NDDB, or have participated in futures markets (through
NCDEX) or availed loans from FWWB, and which are into specific and innovative domains
like better cotton, or fair trade or organic. Some of the PCs are cases of failures, and some are
cases with restructuring of PCs after initial failure. From each promoter in each state, we would
study 2-3 PCs, and one or two other FPOs in their local area. Since some of the promoters are
across more than one state like IGS, we may take only 1-2 PCs in the second or third state in
case the promotion and business model is same/similar across states. The case study PCs /FPOs
were picked up from across states and the total PCs/FPOs studied is 35 including two non-PC
FPOs (table 1.6).
These PCs were evaluated in terms of their physical and financial performance by analysing
and comparing their net worth, net profit, the ratio of equity capital mobilized to authorised
equity capital, payment of dividends, external facilitator support and corporate linkages from
annual reports and business plans of past few years, and interviews of CEOs, managers, board
members and key person of promoting agency for the respective PC.

22
In each case study PC and other FPO in neighbourhood (if there), 10 member farmers and 10
non-member farmers were interviewed. This was to compare impact of PC in terms of both,
before and after the intervention of PC, and with and without the intervention of PC and even
with non-FPC format organisation. The total sample for farmers was 333 member farmers and
332 non-member farmers, totalling to 665. They were interviewed to assess the involvement
of members in PC and if PCs had substantially impacted the economic activity of members and
their income based on parameters like proportion of produce sold through PCs, inputs bought
from PCs, difference in yield and price of their produce after the intervention of PCs, and
significant increase in income due to crop diversification.
Table 1.2: State wise and RI (SFAC) and POPI (NABARD) wise number of FPOs
State No. of RIs FPOs by RIs No of POPIs FPOs by POPIs
Andaman & Nicobar 1 2
Andhra Pradesh 8 7 57 106
Arunachal Pradesh 2 1 1
Assam 6 12 27 40
Bihar 9 27 51 105
Chhattisgarh 7 26 35 570
Delhi 2 4 4
Goa 1 2 0 2
Gujarat 8 20 32 115
Haryana 3 23 13 50
Himachal Pradesh 2 5 18 54
Jammu Kashmir 1 2 7 12
Jharkhand 6 8 37 65
Karnataka 7 119 76 187
Kerala 3 69 105
Madhya Pradesh 15 141 37 160
Maharashtra 16 91 15 118
Manipur 2 4 4 5
Meghalaya 3 3 4 9
Mizoram 2 1 7 15
Nagaland 2 2
Orissa 7 41 26 100
Punjab 2 7 12 67
Rajasthan 7 40 59 143
Sikkim 3 30 4 4
Tamil Nadu 11 11 21 170
Telangana 3 20 37 74
Tripura 3 4 1
Uttar Pradesh 9 35 76 113
Uttarakhand 4 7 37 52
West Bengal 4 75 22 150
Total 156 769 789 2595
Average FPOs per RI/POPI 4.9 3.3
Source: Wadkar, 2018.

23
Table 1.3: RIs, POPIs and FPOs in different study states as %age of total in India
State
No. of
RIs
FPOs by
RIs
No of
POPIs
FPOs by
POPIs
Madhya Pradesh 9.62 18.34 4.69 6.17
Rajasthan 4.49 5.20 7.48 5.51
Tamil Nadu 7.05 1.43 2.66 6.55
Uttar Pradesh 5.77 4.55 9.63 4.35
West Bengal 2.56 9.75 2.79 5.78
ALL 29.49 39.27 27.25 28.36
Source: Wadkar, 2018
Table 1.4: Average FPOs promoted by RIs/POPIs
Source: based on Wadkar, 2018
1.5 Chapterisation
The report is organised into 6 chapters besides introductory chapter 1. Chapters 2, 3,4, 5 and 6
analyses the profile, performance and impact of PCs in the states of U.P., Rajasthan, M.P., W.B
and Tamilnadu respectively They not only assess physical and financial performance of the
PCs but also examine their input and output interface with members as compared with non-
member and as three years before. This is done for member and non-members and also
promoter wise and for each PC in case of each promoter. The final chapter (7) summaries the
findings for the five states altogether and 35 PCs and other FPOs and makes suggestions for
policy and practice to improve the performance and impact of PCs on small farmer livelihoods.
State
FPOs per
RI
FPOs per
POPI
Madhya Pradesh 9.40 4.32
Rajasthan 5.71 2.42
Tamil Nadu 1.00 8.10
Uttar Pradesh 3.89 1.49
West Bengal 18.75 6.82
All States 4.93 3.29

24
Table 1.5: State wise and Resource institution wise list of PCs for sampling
State Resource Institution PCs
Uttar Pradesh Indian Farm Forestry Development Co- operative Ltd (All defunct) 10
(Non-SFAC) (1 NCDEX)
132 UP Bhumi Sudhar Nigam under World Bank supported project thru BASIX Consulting and
Technology Services Ltd (BCTS) -100; 7 by Basix Krishi Samruddhi and others
NDDB 1
Madhya Pradesh Vrutti Livelihood Resource Centre (VLRC) (1 FWWB) 15 Action for Social Advancement (ASA) (4 FWWB) 15
Action for Social Advancement (ASA) (All Women PC) (1 FWWB) 3
Indian Grameen Services (IGS) (1 NCDEX) (2 Cooperatives) 17
Professional Assistance For Development Action (PRADAN) (All Women PC) 3
AKRSP 2
Tamil Nadu Non-SFAC (1 FWWB) 48
Non- SFAC - All women PC (1 FWWB) 2
Rajasthan Indian Society of Agribusiness Professionals 10
Indian Grameen Services (IGS) (1 NCDEX) 12
NDDB 1
West Bengal BASIX Krishi Samruddhi Ltd (BKSL) 20
Indian Grameen Services (IGS) 22
Non PCs in districts common with BASIX and IGS 40
Total 353
Source:https://nabfpo.in/images/staticFPO.html, http://sfacindia.com/List-of-FPO-Statewise.aspx,
https://www.ncdex.com/Downloads/NCDEXImpact/PDF/NCDEX_Group_Connecting_Farmers_to_Mark
et_November2018.pdf, http://gujpro.co.in/fpos/
Table 1.6: State wise and Promoter wise number of PCs/FPOs Studied
State >
Promoter
MP Rajasthan UP TN WB Total
SPS 1 (women PC)
1
AKRSPI 2 (one women, goatery PC)
2
ASA 2 (both women)
2
Vrutti 1
1
IGS (Basix) 1 2
3 6
PRADAN 1 (and one co-op)
2
NDDB
1 (milk) 1(milk)
2
ISAP
2
2
BKSL (Basix)
2
2 4
BCTS (Basix)
2
2
SEEDS
2
2
Dhan/ KTL
3
3
Vidiyal
1 Women goat PC)
1
ESAF
3
3
Srijoni
1 1
Chaltaberia Trust 1 (trust) 1
Total 8 5 5 9 6 35

25
Chapter 2 Performance and Impact of PCs in Uttar Pradesh
Introduction
Uttar Pradesh is the largest agricultural producer state of India with 17% of all food grain
production and ranks first in production of wheat, and sugarcane and potato. The state accounts
for 32% of potato acreage and 42% of potato production in India with the second highest yields
of potato after Gujarat (GoUP, 2009). It also had one of the largest cold storage capacities (40%
of India’s total) used mostly for potatoes. The agricultural sector accounted for 59% of the state
workforce and 24% of the GDP in 2015-16. Every fourth Indian farmer is placed in U.P. 83%
of the net cropped area is irrigated and it has cropping intensity of 155. However, the
landholdings are extremely small with 92% holdings being marginal or small in 2010-11 with
average size of holding of 0.76 hectares. Further, the three crops of wheat, paddy and sugarcane
account for 70% of GCA of the state, and average monthly income of the farming household
was only Rs. 4900 in 2012-13 (Tripathi, 2018). Further, the state is a laggard in co-operative
performance and even in the setting up the farmer producer companies until recently. In fact,
the recent surge in PC numbers in UP was a surprise for the authors and happened mainly
because of one state agency i.e. UPBSN. It has promoted 101 PCs by end of 2016 with 44585
shareholders with 445 members per PC. One of our study PCs is the PC with the highest share
capital in the state in 2016 at Rs. 10.88 lakh. Most of the PCs had fam input sale licenses and
10 had mandi licenses also in 2016 with 30 others having applied for the same. The average
turnover of inputs was Rs. 16 lakh per PC and output turnover Rs. 13 lakh per PC totaling to
Rs. 29 lakh per pc (UPBSN). On the other hand, only for NABARD POPIs, which numbered
74, 60% had promoted one PC each, 28% two each and only 12% had promoted 3 or 4 PCs
each. On average, one promoter had promoted 1.5 PC each. All our study PCs in U.P. were
those supported by SFAC.
The next section of this chapter analyses the profile of all PCs in terms of their physical and
financial parameters for at least last three years. The second section focuses on performance
and impact of the milk PC on members vis-a-vis non-members and the third section examines
the other non-milk PCs in the state promoted by two different but somewhat similar agencies
and their impact on farmer members. Section four of the chapter makes a comparison between
those two promoters for assessing the differential impact, if any. Section five compares the
individual PCs of each promoter. The chapter then concludes in section six with major
observations on the performance of the PCs in the state.
2.1 Physical and Financial Performance of PCs
In U.P., of the PCs promoted by NGO/professional development agencies, the authorized
capital was modest (from Rs. 5-15 lakh) and most of them except one (Navjyoti) had mobilised
that. Their turnover was significant enough (Rs. 50-88 lakh) except in case of one (Naveen
Kisan) which could not go beyond Rs. 16 lakh. Most of them except one (GDPC) had small
profits and most of them (except Navjyoti) had reserves as well (Table 2.1). These PCs showed
average performance on various parameters of input and output business. But, they suffered
from lack of scale as all of them had only 1000 members each despite the fact that they had
been in existence for more than five years each.
In case of one PC, the equity shares remained confined to a large extent with the promoters and
a few members only until recently. 48% of the shares were held by just eight members in 2016-

26
17 which is not a desirable thing for a PC though it may be needed initially but continuing with
it for years is not a positive approach.
On the other hand, Saahaj of NDS of NDDB was a class apart in many ways as it had scale in
terms of membership, equity base and level of business turnover besides the fact that it dealt
with a high value produce- milk. It had profits of the order of Rs. 13 core and had mobilized
most of its authorized capital which was of the order of Rs. 30 crore and earlier Rs. 20 crore.
50% members supply milk exclusively to Saahaj. Another reason for Sahaaj’s better
performance was the governance and business models which were very tight and food-proof. It
relied on low -asset -high turnover model and strictly enforced member discipline besides the
professional input it had from the NDDB team. This is one of the six and one of the first PC
promoted by the NDS across six states.
Basix- the parent body of BCTS, BKSL, and IGS has promoted 317 FPOs in 17 states as of
2018 (Rani, et al, 2018). There were 10 cases of failure of FPCs promoted by BCTS in U. P.
and they mainly failed because some traders create problems which leads to infighting within
the Board. Some FPCs were organized just to meet the targets and there was no member
involvement and, in some others, there were outright frauds committed by BoDs. Thus, it was
more of governance failure. Further, all FPCs in the state had poor staff capacity and there was
no money for professional staffing in the project supported by World Bank. In fact, one person
was looking after 15 producing FPCs. The BCTS had deployed one project manager in each
district. The BCTS had 29 staff under the UPVSN for six years which now number only 5 of
whom 4 are in the field.
2.2 Milk PC (Saahaj): member and non-member profile
The members, including only one female, were more literate on an average compared to their
non-member counterparts with 70% of them being high and higher secondary school literate.
As against this, 30% of the non-members (all male) were graduate though 50% of them were
illiterate or middle school pass (Table 2.2). The average years of education were 11.4 in case
of members and 8.6 in case of non-members. 50% each of the members had farming and animal
husbandry as primary occupations and only 40% of the non-members had farming as primary
occupation, 50% were animal rearers and 10% had other businesses. 50% each of the members
had animal husbandry and farming as secondary occupation as these were Saahaj members.
Average owned land was 4.82 acres for members and 1.92 for non-members. This means the
FPC milk producers were larger landholders relatively and their operated average land area
even higher being 10.11 acres where in the case of non-members, it was same as owned land
average. The reason for very high operational holding was the fact that one member had 60
acres, mostly leased in. By owned land, though 60% of the members were marginal owners but
they owned only 17% of total area and 30% were semi-medium and 10% medium by ownership
accounting for 58%, and 26% of all owned land respectively (Table 2.3). By operated land,
among members, 50% were marginal and had 8% of all operated land, 10% small with 3% of
land, 20% semi-medium with 18% land and 10% each medium and large with 12% and 59%
land. The non-members were much small operators with 60% being marginal and operating
27% land with 30% small and 10% semi-medium and medium each operating 47% and 26% of
operated land (Table 2.4).

27
Table 2.1: Profile and performance of various PCs in U.P.
PC> Gram Development (2013) Naveen Kisan (2014) Navjyoti (2014) Krishi Vikas (2015) Sahaaj (2014)
Year>
Parame
ters
2014-
2015
2015-
2016
2016-
2017
2017-
2018
2015-
2016
2016-
2017
2017-
2018
2018-
2019
2016-
2017
2017-
2018
2018-
2019
2015-
2016
2016-
2017
2017-
2018
2018-
2019
2015-
2016
2016-
2017
2017-
2018
2018-
2019
Membe
rs
1034 502 1010 1010 195 352 1139 1139 77568 80952 60901 76540
Authori
zed
Capital
(Rs.
Lakh)
5 5 5 10 10 10 10 10 10 15 15 5 5 5 5 2000 2000 2000 3000
Paid up
Capital
(Rs.
Lakh)
1.42
(28.0
0) h
*
1.67
(33.
40)
1.67
(33.
40)
8.71
(87.
10)
1.1
(11.
0)
1.1
(11.0
)
3.18
(31.
80)
3.18
(31.
80)
10
(100.
00)
15
(100.
00)
15
(100.
00)
1.36
(27.
20)
2.33
(46.
60)
5
(100.
00)
5
(100.
00)
897
(44.85
)
1533
(76.65
)
1856
(92.80)
2303
(76.77)
% of
shares
with
>5%
share
each (5)
64
(9)
48%
(8)
48%
(8)
20% 20%
(150
-250
shar
es
each
)
20%
(150-
250
share
s)
20%
(150-
250
share
s
each)
Revenu
e (Rs.
Lakh)
12.7 18.0
8
63.4
9
50 6.9 5.51 7.59 16.0
5
52.44 50.33 70.49 15.3
4
77.39 87.96 48944 49799 77319 84185
Profit
(Loss)
2746 3214 6932 (304
6)
3130
90
(693
09)
7145 9087 (1921
42)
(8042
2)
47262 1320 2575
0
2003
1
99600
000
17900
000
121500
000
134900
000
Reserve
s &
Surplus
(107
82)
(756
8)
4493
63
3130
90
2437
80
2600
66
2691
53
(4023
46)
(4827
69)
(4355
06)
0 1152 4770
00
4980
00
Assets
(Rs.
Lakh)
4.23 5.87 8.44 10.6
2
22.51 20.73 24.21
Note: * These figures in brackets are the %age of authorised equity mobilized; Source: PC balance sheets and records

28
More importantly, the livestock ownership among members was predominantly made up of
buffalo (90% farmers having them) and cows with average of three such livestock and making
up 46% of all animals. Cows were owned by 80% and average 3 each and were 39% of the
total livestock owned by members. The average of three goats per household led to their share
of 16% in total livestock though only 30% farmers owned them. The livestock ownership of
non-members was more towards goats with 20% owning 21 goats accounting for 43% of all
livestock owned by non-members and buffaloes another 41% and cows only 12% with only
50% farmers owning cows and all farmers owning buffaloes. However, the average size of
livestock per household was lower here with 2 buffaloes, one cow and 11 goats per household
(Table 2.5). 80% members had electric tube wells for irrigation and 20% diesel engines for
the same but only 20% each of the non-members had such facilities and 60% did not report
assured irrigation.
Table 2.2: Distribution of Milk PC member and non-member farmers by education
Category> Members Non-Members
Parameter>
Education
Farmers (No.) % in total Farmers (No.) % in total
Illiterate 1 10 2 20
Middle School 0 0 3 30
Primary School 1 10 0 0
High School 3 30 2 20
Higher Secondary 4 40 0 0
Graduate 0 0 3 30
Postgraduate 1 10 0 0
Total 10 100 10 100
Table 2.3: Distribution of Milk PC member and non-member farmers by Owned Land
Category> Members Non- Members
Parameter>
Owned Land
Farmer
s (No.)
% in
total
Land
(Acres)
% in
total
Farmers
(No.)
% in
total
Land
(Acres)
% in
total
Marginal 6 60 8.2 17.01 6 60 5.2 27.08
Small 0 0 0 0 3 30 9 46.88
Semi-M 3 30 28 58.09 1 10 5 26.04
Medium 1 10 12 24.90 0 0 0 0
Total 10 100 48.2 100.00 10 100 19.2 100.00
Chemical fertilisers were reported being bought by two farmers each among members and non-
members from dealers, and chemical pesticides were bought by one member (10%) and three
non-member farmers (30%) from dealers only and one more member (10%) from both dealers
and agricultural university. Only one farmer reported use of biofertiliser among non-members
who bought it from dealers. No farmer reported use of biopesticides. One member farmer
bought seeds from PC and two (20%) from dealers as compared with three non-member buying
seeds from dealers and one from PACS and PC. The most relevant input for the members and
non-member milk producers was cattle feed which was bought by 70% members from PC and
10% non-members also buying it from the PC with other non-members buying it from dealers,
or PC and dealers both, and dealer and other local farmers or a combination of dealers and

29
other FPOs. But, 30% and 40% did not report use of cattle feed (Table 2.6). The major reasons
among members for purchase of cattle feed from PC included: better and more reliable quality
(29% each) and timely availability (15%) in that order.
The cropping intensity of members (1.2) was lower than that of non-members (2). The cropping
pattern was dominated by paddy (100% farmers with % 33% of kharif area ND 29% OF GCA)
in case of members as well as non-members (60% of farmers with 43% of kharif area and 16%
of GCA during the year.
Table 2.4: Distribution of Milk PC member and non-member farmers by Operated Land
Table 2.5: Distribution of Milk PC member and non-member farmers by Livestock
Owned
Category> Members Non-Members
Parameter>
Animal
Farmers No. of
animals
Average
Animals
% Total
Animals
Farmers No. of
animals
Average
Animals
% Total
Animals
Buffalo 9 26 2.89 45.61 10 20 2.00 40.82
Cow 8 22 2.75 38.60 5 6 1.20 12.24
Goat 3 9 3.00 15.79 2 21 10.50 42.86
Oxen 0 0 0 0 1 2 2.00 4.08
Total 57 100.00 49 100.00
The other major kharif crop was bajra grown by 60% member farmers with 30% of kharif area
and 12% of GCA compared with similar %age of farmers growing bajra on 50% of kharif area
and 18% of GCA (Tables 2.7, 2.8 and 2.9). The non-members also reported 7% of season’s
area under maize grown by 10% farmers. In Rabi, it was wheat which dominated the cropping
pattern with all farmers members growing it on 78% of kharif season area which was 32% of
total GCA with other crops being potato (by 40% farmers with 13% of rabi area and 5% of
Category> Members Non- Members
Parameter>
Operated Land
Farmers
(No.)
% in
total
Land
(Acres)
% in
total
Farmers
(No.)
% in
total
Land
(Acres)
% in total
Marginal 5 50 7.6 7.52 6 60 5.2 27.08
Small 1 10 3.5 3.46 3 30 9 46.88
Semi-M 2 20 18 17.80 1 10 5 26.04
Medium 1 10 12 11.87 0 0 0 0
Large 1 10 60 59.35 0 0 0 0
Total 10 100 101.1 100.00 10 100 19.2 100.00

30
GCA) and mustard by 10% farmers on 8% of kharif area and 4% of GCA. Among non-
members, it was again wheat grown by 80% farmers on 62% kharif acreage and 29% of GCA
followed by gram with 20% farmers growing in in 8% of rabi area and 4% of GCA. Potato and
mustard were other important crops grown by 20% and 40% on 11% and 18% of rabi area and
it was 5% and 8% of GCS respectively. In summer season, it was moong for 30% member
farmers and 31% of summer area and 5% of GCA and urad with 20% of farmers, 47% of
summer area and 8% of GCA. The non-member farmers mainly grew moong in 30% case and
48% of summer area and 8% of GCA. Other crops in summer by non-member farmers were
bajra, maize and potato on 15 of season’s area by 10% farmers each and 3% of GCA each.
Paddy, mustard and wheat had 3-4 acres per ha in the season while bajra and potato had 1-2
acres each for member farmers. The average crop acreage for non-members was one acre for
wheat. Paddy, bajra, moong, maize, and potato each per farmer per season (Tables 2.7, 2.8 and
2.9).
Table 2.6: Distribution of Milk PC member and non-member farmers by source of Cattle
Feed
Category> Members Non-members
Parameter>
Source
No. of
farmers
% in
total
No. of
farmers
% in total
PC 7 70 1 10
Dealers 0 0 2 20
Dealers, PC 0 0 1 10
Dealers, Other FPOs 0 0 1 10
Dealers, Local Farmers 0 0 1 10
None 3 30 4 40
Total 10 100 10 100

31
Table 2.7: Kharif cropping pattern of Milk PC member and non-member farmers (area in acres)
Category> Members Non- Members Parameter>
Crop
Farmer
s
% of
total
Kharif
Area
% Kharif
Area
% total
area
Average
Area
Farmer
s
%
Farmers
Kharif
Area
% Kharif
Area
% total
area
Average
Area
Bajra 6 60 14 29.47 12.14 2.33 6 60 7 50.00 18.28 1.17
Paddy 10 100 33.5 70.53 29.05 3.35 6 60 6 42.86 15.67 1.00
Maize 0 0 0 0 0 0 1 10 1 7.14 2.61 1.00
Total
47.5 100.00 41.20
14 100.00 36.55
Table 2.8: Rabi cropping pattern of Milk PC member and non-member farmers (area in acres)
Category> Members Non- Members Parameter>
Crop
Farmers % Farmers Rabi Area % Rabi Area % total area Average Area Farmers % Farmers Rabi Area % Rabi Area % total area Average Area
Fodder 2 20 0.5 1.03 0.43 0.25 0 0 0 0 0 0
Garlic 1 10 1 2.06 0.87 1.00 0 0 0 0 0 0
Gram 0 0 0 0 0 0 2 20 1.5 8.47 3.92 0.75
Mustard 1 10 4 8.25 3.47 4.00 4 40 3.2 18.08 8.36 0.8
Potato 4 40 6.1 12.58 5.29 1.53 2 20 2 11.30 5.22 1
Wheat 10 100 36.9 76.08 32.00 3.69 8 80 11 62.15 28.72 1.375
Total 48.5 100.00 42.06 17.7 100.00 46.21

32
Table 2.9: Summer cropping pattern of Milk PC member and non-member farmers (area in acres)
Category> Members Non- Members
Parameter>
Crop
Farmers % Farmers Summer
Area
% Summer
Area
% total area Average Area Farmers % Farmers Summer
Area
% Summer
Area
% total area Average Area
Bajra 1 10 1 5.18 0.87 1 1 10 1 15.15 2.61 1.00
Fodder 1 10 0.8 4.15 0.69 0.8 1 10 0.4 6.06 1.04 0.40
Moong 3 30 6 31.09 5.20 2 3 30 3.2 48.48 8.36 1.07
Mustard 1 10 2.5 12.95 2.17 2.5 0 0 0 0 0 0
Maize 0 0 0 0 0 0 1 10 1 15.15 2.61 1.00
Potato 0 0 0 0 0 0 1 10 1 15.15 2.61 1.00
Urad 2 20 9 46.63 7.81 4.5 0 0 0 0 0 0
Total 19.3 100.00 16.74 6.6 100.00 17.23

33
Information regarding general extension about farming came from PC (30%), friends (30%),
PC and friends (20%) PC, mobile and Agri dev officer (10%). On the other hand, non-members
received their extension from friends (30%), dealers (20%), PC (10%), veterinary worker
(10%) and a combination of various sources in case of 10 each (Table 2.10). Where most of
the members received information about PC from PC employees (70%), promoters (10%) and
friends (20%), the non-members mostly relied on PC employees (40%) and dairy sahayak
(local milk collection centre operator) in 10% cases with 50% having no source of information
(Table 2.11). Still, only 60% members knew that PC is owned by member famers and 20%
and 10% though it was owned by PC employees or promoting agency (NDS/NDDB). 10% had
no idea about its ownership. Among non-members, awareness was even poorer expectedly as
only 20% thought it belongs to farmers, 40% reporting it to be PC employee owned and 4-%
not knowing about it at all (Table 2.12).
Table 2.10: Distribution of Milk PC member and non-member farmers by source of
general agricultural information
Category> Members Non-members
Parameter>
Source
No. of
farmers
% of total No. of farmers % of total
Friends 3 30 3 30
PC 3 30 1 10
PC, Mobile, ADO 1 10 0 0
PC, Friends 2 20 0 0
Friends, Media 0 0 1 10
Friends, FPO, ADO 0 0 1 10
Friends, Point of purchase 0 0 2 20
Friends, ADO 0 0 1 10
Vet 0 0 1 10
PC, Vet 1 10
Total 10 100 10 100
Table 2.11: Distribution of Milk PC member and non-member farmers by source of
information regarding PC
Category> Members Non-members
Parameter>
Source
No. of
farmers
% of total No. of farmers % of total
Friends 2 20 0 0
PC Employees 7 70 4 40
PC Promoters 1 10 0 0
No One 0 0 5 50
Sahayak 0 0 1 10
Total 10 100 10 100

34
Table 2.12: Distribution of Milk PC member and non-member farmers by knowledge about PC
Owner
Category> Members Non-member Parameter>
PC Owner
No. of
farmers
% of total No. of
farmers
% of total
Farmers 6 60 2 20
PC Employees 2 20 4 40
Promoting Agency 1 10 0 0
Don’t Know 1 10 4 40
Total 10 100 10 100
2.2.1 Output impact of Milk PC:
Seven farmer reported selling milk to PC in case of buffalo milk and four farmers selling to PC
cow milk where the quantity of milk supplied had increased over the last three years. Four
members in case of buffalo milk and three members of cow milk sold to the other FPOs earlier
and were still selling in those channels as well. And other channels like local dairy had declined
completely as were other co-operatives in the area in the case of members. The members
reported ap rice increase of 16-20% over the previous channel price. As against this, in case of
non-members, only four farmers out of eight buffalo milk famers reported selling to other milk
FPO even now in case of buffalo milk and other three out of four cow milk producer continuing
with local dairy. There was significant increase (29%) in the number of buffaloes owned by
farmer member and also increase in milk yield by 25-50% and therefore, marketed surplus
increased by 50-60% in case of cow and buffalo milk respectively.
2.3 Non-Milk PCs: Member and non-member profile and farming
All of the PC members were male and only one among the non-members was a female. Average
age of member and non-member farmers was 46 and 43 years respectively.
Most of the members had some level of literacy with only 17% being illiterate and 12% even
being graduate and postgraduate. 98% reported farming as a primary occupation and other 2%
skilled labour. For 44% of the total who reported any secondary occupation, it was animal
husbandry for 22% and agriculture for 2%. The others being grocers, skilled labour, or
unskilled labour (Tables 2.13 & 2.14).

35
Table 2.13: Distribution of UP PC Members and Non-Member farmers by education
Category> Members Non-Members
Parameter>
Education
No. of
farmers
% of total No. of
farmers
% of total
Graduate 4 9.76 1 2.38
High School 11 26.83 10 23.81
Higher
Secondary
5 12.20 6 14.29
Illiterate 7 17.07 12 28.57
Middle 8 19.51 8 19.05
Post Grad 1 2.44 0 0
Primary 5 12.20 5 11.90
Total 41 100.00 42 100.00
27% of the non-members were illiterate and only 8% were graduates. 98% of them reported
farming as a primary occupation with other 2% reporting as labour. Of the 50% who had any
secondary occupation, 24% were into animal husbandry and 14% worked as labour (Table 2.13
& 2.14).
Table 2.14: Distribution of UP PC Members and Non-Member farmers by Secondary
Occupation
Category> Members Non-Members
Parameter>
Secondary Occupation
No. of
members
% of total No. of
farmers
% of total
Agriculture 1 2.44 0 0
Animal Husbandry 9 21.95 10 23.81
Business 3 7.32 2 4.76
Labor 2 4.88 6 14.29
Retired 1 2.44 0 0
Skilled Labor 2 4.88 3 7.14
None 23 56.10 21 50.00
Total 41 100.00 42 100.00
The average owned land for members was only 2.28 acres and operated land 2.91 acres (Table
2.15). 90% of the farmers were marginal or small by owned land and 88% by operated land.
The small and marginal categories had 64% of the owned land and only 71% of the operated
land while there were no medium farmers by ownership or operation. Even semi medium, and
medium categories which had more than 35% of the owned land, cultivated only 29% (Tables
2.16 & 2.17).

36
Table 2.15: Average owned and operated land holding of UP PC Member and Non-
Member farmers
Category>
Average (acres)
Members Non-Members
Owned Land 2.28 1.53
Operational Land 2.91 2.55
Table 2.16: Category-wise Distribution of UP PC Members and Non-Member farmers
by owned land
Category> Members Non-Members
Parameter>
Category
Farmers
(No.)
% in
total
Land
(Acres)
% in
total
Farmers
(No.)
% in
total
Land
(Acre)
% in
total
Marginal 30 73.17 40.45 43.12 35 83.33 35.23 54.68
Small 7 17.07 20.35 21.70 5 11.90 15.2 23.59
Semi
Medium
3 7.32 22 23.45 2 4.76 14 21.73
Medium 1 2.44 11 11.73 0 0 0 0
Total 41 100.00 93.8 100.00 42 100.00 64.43 100.00
Table 2.17: Category-wise Distribution of UP PC Members and Non-Member farmers
by Operated Land
Category> Members Non-Members
Parameter>
Category
Farmers
(No.)
% in total Land
(Acres)
% in
total
Farmers
(No.)
% in
total
Land
(Acres)
% in
total
Marginal 20 48.78 31.35 26.19 31 73.81 37.71 35.10
Small 16 39.02 53.75 44.90 6 14.29 18.52 17.24
Semi
Medium
5 12.20 34.6 28.91 3 7.14 19 17.69
Medium 0 0 0 0 2 4.76 32.2 29.97
Total 41 100.00 119.7 100.00 42 100.00 107.43 100.00
95% of the non-member farmers were marginal or small in terms of owned land and 88% in
terms of operational holdings. Though there was no medium farmer by ownership but due to
the leasing in and leasing out, just two farmers came in this category as operated cultivator.
5% of the farmers were medium who cultivate 30% of the operated land. Whereas small and
marginal farmers owned 50% of the total owned land, they operated 56% of the area.
56% of the member farmers owned buffaloes and 39% cow besides 12% owning goats.
Buffaloes was 44% of the total livestock and cows 39%. On an average a household had two
cows, one buffalo and three goats. On the other hand, non-member farmers had buffalo in 48%
cases, cow in 24% and goat in 17% cases. In this group, buffaloes were 53% of all livestock,

37
cows 21% and goats 26%. The average ownership of various types of livestock was however
similar (Table 2.18).
Table 2.18: Distribution of UP PC Members and Non-Member farmers by Livestock
owned
Category> Members Non-Members Parameter>
Animals
Farmer
s (No.)
% in
total
Animal
s (No.)
% in
total
Averag
e
Farmer
s (No.)
% in
total
Animal
s (No.)
% in
total
Averag
e
Buffalo 23 56.1
0
35 44.30 1.52 20 47.6
2
40 52.63 2.00
Cow 16 39.0
2
31 39.24 1.94 10 23.8
1
16 21.05 1.60
Goat 5 12.2
0
13 16.46 2.60 7 16.6
7
20 26.32 2.86
Total 79 100.0
0
76 100.0
0
Most of the member farmers had access to ground water-based irrigation with only 15%
reporting lack of access to irrigation. 46% had owned tube wells and 17% shared with another
22% buying irrigation water.
Tube wells were the major source of irrigation with 46% of members and 52% of non-members
owning the tube wells and 17% and 47% respectively sharing them. Others bought water for
irrigation. Only 15% member farmers reported no source of irrigation. The tube wells were
both electric motor based and diesel engine operated and both owned and shared (Table 2.19).
Table 2.19: Distribution of UP PC Members and Non-Member farmers by Source of
Irrigation
Irrigation
Source
Energy Source
Ownership
Member
s (No.)
% in
total
Non-
Members
(No.)
% in
total
Tube well Diesel Engine Owned 18 43.90 11 26.19
Rented 4 9.76 0 0
Shared 5 12.20 8 19.05
Electric Motor Owned 1 2.44 10 23.81
Rented 5 12.20 0 0
Shared 2 4.88 11 26.19
Well Diesel Engine Owned 0 0 1 2.38
Shared 0 0 1 2.38
Rainfed
6 14.63 0 0
98% of the members grew paddy and 25% and 20% each maize and bajra with 10% cultivating
banana and 6% lady finger. Paddy accounted for 76% of the Kharif area followed by bajra at
10% and maize at 9%. Paddy area worked out be 38% area of the gross cropped area (GCA)
during the year while it was 4-5% of the total in case of maize and bajra each. In the Rabi
season, 96% farmer grew wheat, 55% potato, 35% mustard and 10% garlic. Wheat accounted
for 69% of the season’s area followed by potato at 17% and mustard at 12%. Wheat took 31%
of the GCA followed by potato at 7% and mustard at 5%. Even summer seasons one of the
important crop seasons with 51% of the farmer growing crops like Mentha (21%) of the
members and urad 10% and mung and lady finger at 8%. However, Mentha alone accounted

38
for 51% of the seasons’ crop area followed by urad at 25% and mung at 20%. In the gross crop
area annually, mentha took 6% and urad 3% of the total.
Banana a new crop in the area especially introduced by one of the PCs was grown by 12%
farmers and in 4% of the cropped area.
Paddy was grown by 81`% of the non-member farmers accounting for 57% of the Kharif area.
The other major crops in the season were bajra grown by 21% farmers taking 11% of the Kharif
area and maize and vegetables grown by 21% and 29% farmers taking up 10% and 15% of the
Kharif area. In Rabi, wheat was grown by 90% farmers and potato and mustard 43% and 38%
respectively. Garlic was the only other important crop grown by 17% farmers in 8% of rabi
area. The crops of wheat, potato, mustard, and garlic accounted for 59%, 13% and 13% of the
season’s area. In summer, it was mainly mentha and vegetables which was grown by a
significant number of farmers and these crops accounted for 29%, and 22% of the summer area.
Overall, wheat accounted for 26%, paddy 22%, and bajra and mustard 6% each of the GCA
during the year maize and menthe accounting for 6% and 5% each respectively. The average
cropping intensity of these non-member farmer was 2.26 as against 2.13 for member farmers
(Table 2.20,2.21 and 2.22).
Interestingly, 88% members knew the name of the PC and some others knowing it by some
other name (6%). Only 6% did not know the name of the PC. 57% members knew that the PC
is owned by the farmer members with others reporting BOD (14%), PC employees (10%) and
promoting agency (4%) as the owners.
41% of them relied on PC to get the agricultural information another 16% on PC and friends
and 12% on friends who were other farmers. PC employees and promotors had been the biggest
influence on the members for joining the PC with 35% and 29% respectively reporting that the
other major influences were Board of Directors (18%) and friends (16%).
The major source of information about agriculture for non-members was the friends and other
farmers in case of 38% and these combined with dealer in 13% cases with PC and dealer
exclusively accounting for only 12% each. Rest of the farmers used various combination of
sources of information.
Even 77% non-member farmers knew about the PC but only 13% of them thought it is owned
by farmers. 50% of them had learnt about it from the PC and its employees and promotors.
48% also wanted to become a member of the PC but had not become mainly because they were
not aware whether they could become member and no one had approached them. Similarly,
those who expressed no desire to become members said so because they had no information,
or they were not interested because of various reasons.

39
Table 2.20: Kharif cropping pattern of UP PC Member and Non-Member farmers
Table 2.21: Rabi cropping pattern UP PC Member and Non-Member farmers
Table 2.22: Summer cropping pattern UP PC Member and Non-Member farmers
Category Members Non-Members
Parameter>
Crop
Farmer
(No.)
% in
total
Summer
Area
%
Summer
Area
%
Total
Area
Farmer
(No.)
% in
total
Summer
Area
%
Summer
Area
%
Total
Area Fruits 3 7.32 1.05 3.54 0.41 3 7.14 2.6 5.85 1.07
Moong Dal 1 2.44 2 6.75 0.79 0 0 0 0 0
Peppermint 12 29.27 23.3 78.58 9.15 11 26.19 12.91 29.07 5.32
Urad 3 7.32 1.3 4.38 0.51 0 0 0 0 0
Vegetables 5 12.20 2 6.75 0.79 19.05 9.6 21.62 3.96
Bajra 0 0 0 0 0 2 4.76 1.2 2.70 0.49
Maize 0 0 0 0 0 3 7.14 14.8 33.33 6.10
Mustard 0 0 0 0 0 3 7.14 1.3 2.93 0.54
Others 0 0 0 0 0 1 2.38 2 4.50 0.82
Total 100 29.65 100.00 11.65 100 44.41 100.00 18.31
Category> Members Non-Members
Parameter>
Crop
Farmer
(No.)
% in
total
Kharif
Area
%
Kharif
Area
%
Total
Area
Farmer
(No.)
% in
total
Kharif
Area
%
Kharif
Area
%
Total
Area
Maize 13 31.71 14.6 13.08 5.73 9 21.43 9.6 10.22 3.96
Mustard 1 2.44 1 0.90 0.39 0 0 0 0 0
Vegetables 6 14.63 2.7 2.42 1.06 12 28.57 14.25 15.18 5.88
Bajra 4 9.76 2.4 2.15 0.94 9 21.43 10.3 10.97 4.25
Banana 5 12.20 5.2 4.66 2.04 0 0 0 0 0
Paddy 40 97.56 85.75 76.80 33.68 34 80.95 53.74 57.24 22.16
Others 0 0 0 0 0 6 14.29 6 6.39 2.47
Total 100 111.65 100.00 43.85 100 93.89 100.00 38.71
Category> Members Non-Members
Parameter>
Crop
Farmer
(No.)
% in
total
Rabi
Area
%
Rabi
Area
%
Total
Area
Farmer
(No.)
% in
total
Rabi
Area
% Rabi
Area
% Total
Area
Fruits 3 7.32 0.9 0.79 0.35 0 0 0 0 0
Garlic 4 9.76 1.8 1.59 0.71 7 16.67 7.9 7.58 3.26
Maize 1 2.44 0.3 0.26 0.12 0 0 0 0 0
Mustard 16 39.02 13.4 11.83 5.26 16 38.10 13.29 12.75 5.48
Potato 24 58.54 20.75 18.31 8.15 18 42.86 13.46 12.91 5.55
Ramdana 2 4.88 1 0.88 0.39 0 0 0 0 0
Vegetables 3 7.32 1.1 0.97 0.43 4 9.52 2.2 2.11 0.91
Wheat 39 95.12 74.05 65.36 29.08 38 90.48 61.48 58.98 25.35
Others 0 0 0 0 0 4 9.52 5.91 5.67 2.44
Total 100 113.3 100.00 44.50 100 104.24 100.00 42.98

40
PC interface for inputs
56% of member farmers purchased seeds from the PC and 27% from both PC and dealers
(Table 2.23). For chemical fertilisers and chemical pesticides 70% of the members got it from
the PC and 15% from dealers and 7% from both. On the other hand, bio-fertilisers and bio-
pesticides was used by few farmers, though here too, 2/3rd of them bought from the PC (Tables
2.24 and 2.25).
The seed purchase by non-member farmers was mostly from dealers (33%) or both dealers and
PC (31%) with only 12% buying exclusively from the PC (Table 2.23). For chemical fertiliser
and pesticides, the dealers were the major sources for 54% of farmers each (Table 23). The PC
accounted for 25% and 20% of the farmers for both of these chemical inputs. Bio fertiliser and
bio pesticides being used by the small proportionate of the farmers had PC as the important
source with 50% or more farmers reporting it as the source of purchase (Table 24). Most of the
agriculture machinery and equipment were rented from other farmers or dealers as PC really
did not deal with it. Cattle feed was also bought from dealers by 76% of non-member farmers.
23% non-members farmers were aware of various initiatives being undertaken by the PC and
1/3rd of them had also attended some meetings organized by the PC but 90% of them had no
experience of dealing with the PC.
Table 2.23: Distribution of UP PC Members and Non-Member farmers by Source of
Seeds
Category> Members Non-Members
Parameter>
Source
Farmer
(No.)
% in total Farmer
(No.)
% in total
Agri Dept, Dealers 2 4.88 1 2.38
Dealers 0 0 14 33.33
Dealers, PACS, PC 1 2.44 0 0
PC 23 56.10 5 11.90
PC, Dealers 11 26.83 13 30.95
PC, Horticulture Dept 1 2.44 0 0
PC, Local Farmers 3 7.32 0 0
Dealers, Local Farmers 0 0 4 9.52
Dealers, Local Farmers, Agri Dept 0 0 1 2.38
Dealers, Local Farmers, PC 0 0 1 2.38
None 0 0 3 7.14
Total 41 100.00 42 100.00
The reasons for purchase of seed from PC included among others: better quality, lower cost,
fair dealing, and easy access. Easy access and lower cost was also reported for purchase of
biofertilisers from PC. For chemical fertilisers it was again better quality, fair deal, more
reliable source, easy access, and lower cost in that order while for chemical pesticides, it was
access, lower cost and better quality and lack of any other source in that order.

41
Table 2.24: Distribution of UP PC Members and Non-Member farmers by Source of
chemical inputs
Table 2.25: Distribution of UP PC Members and Non-Member farmers by source of Bio
inputs
Type of
Bio input>
Biofertilizer Biopesticide
Category> Members Non-Members Members Non-Members
Parameter>
Source
Farme
r (No.)
% in
total
Farme
r (No.)
% in total Farme
r (No.)
% in
total
Farme
r (No.)
% in total
Dealers 1 2.44 0 0 0 0 2 4.76
Dealers,
PACS, PC
1 2.44 0 0 0 0 0 0
Local
farmers
1 2.44 2 4.76 0 0 0 0
PC 6 14.6
3
5 11.90 1 2.44 2 4.76
Dealers,
PC
0 0 1 2.38 0 0 0 0
None 32 78.0
5
34 80.95 40 97.56 38 90.48
Total 41 100 42 100.00 41 100.0
0
42 100.00
Type of
agrochemical>
Fertilizer Pesticide
Category> Members Non-Members Members Non-Members
Parameter>
Source
Farmer
(No.)
% in
total
Farmer
(No.)
% in
total
Farmer
(No.)
% in
total
Farmer
(No.)
% in
total
Dealers 6 14.63 23 54.76 5 12.20 23 54.76
Dealers,
PACS, PC
1 2.44 0 0 1 2.44 0 0
Dealers, PCs 3 7.32 4 9.52 3 7.32 1 2.38
PACS/DCS,
Dealers
1 2.44 0 0 0 0 0 0
PC 29 70.73 10 23.81 26 63.41 8 19.05
Agri Dept 0 0 0 0 1 2.44 0 0
PC, Other
farmer groups
0 0 1 2.38 0 0 0 0
None 1 2.44 0 0 5 12.20 10 23.81
Total
41 100.0
0
42 100.0
0
41 100.0
0
42 100.0
0

42
76% of the members had received share certificates but 50% of them had various complaints
about the services provided by PCs which included lack of timely availability of services, low
procurement, low price realisation and the like.
In terms of satisfaction of various input services, there was slight improvement in case of
members on quality, cost, availability and quantity after the intervention of the PC, but the
output side remained more or less unaffected especially the price realisation. There was
significant increase in area under bajra, and banana besides lady finger and potato after the
intervention of the PC. Price realisation were reported to be 11-13% higher in bajra, maize and
paddy. But the time taken for receiving payment had gone up with most of these crops. The
payment was particularly delayed in banana. The yield and price gains were reported only in
case of banana to the extent of 33% and 60% respectively by the member who sold it through
the PC.
Before the intervention of the PC, only one farmer had sold wheat through the PC and one
farmer each sold banana and potato. Two wheat farmers had sold through wholesale markets
earlier who later sold through the PC. After the PC intervention, the number of potato farmers
selling through the PC had increased to two. In terms of proportion of output sold, the PC
accounted for 10% of wheat and potato and 9% of banana before the intervention and it had
gone up only in case of potato at 13%.
The input services were reported by even non-members to have improved after the intervention
of PC to some extent and the area under crops like paddy, wheat, mustard, millets and potato
and even maize and garlic had increased in the last few years. The sale price realised had
significantly increased in paddy, potato, millets and garlic after the PC intervention. However,
the payments were delayed even further in wheat and paddy and menthe after the intervention.
More than 50% PC members had problems with services of the PCs which included inadequate
input supply and lack of timely availability, low procurement, low price realisation and not
procuring at all. 80% received no information about govt schemes or subsides while others
mentioned knowing new schemes, subsidies on farm inputs like seeds and fertilisers and the
like. Only 4% had received nay subsidy benefit as a member. 71% has no knowledge about
activities of the PCs while others mentioned input supply, knowledge sharing, custom rentals
of farm machinery and warehousing facility besides NPM and new crops.
Only 36% members attended meetings regularly with another 56% only sometime and 50%
reported monthly meetings being held and 20% only quarterly. Interestingly, 98% waned to
continue as members due to benefits like good input supply, benefits of membership, timely
supply of inputs, and good quantity of supplies, besides knowledge about farming and markets.
74% also wanted to encourage others to join the PC due to its various benefits while others
who were not excited mentioned that already most farmers were members of the PCs, or others
were not interested and they did not have time for such activity. 66% had suggestions for
improvement which included: procurement of output, farm machinery rentals, better price
realisation and warehousing and weighing facilities.
2.4 Promoter wise comparison of member profile and services
All famers – both of BKSL and BCTS were male and had farming as primary occupation with
just one in case of BCTS being skilled worker (Table 2.26). The average age was 49 and 43
years for BKSL and BCTS farmers respectively.

43
Table 2.26: Distribution of BKSL and BCTS PC member farmers by Education
Table 2.27: Distribution of BKSL and BCTS PC member farmers by Secondary
Occupation
Promoter> BKSL BCTS
Parameter>
Secondary Occupation
Members
(No.)
% in
total
Members
(No.)
% in total
Animal Husbandry 4 19.05 5 25.00
Skilled Labour 2 9.52 0 0
Labour 1 4.76 1 5.00
Retired 0 0 1 5.00
Agriculture 0 0 1 5.00
Business 0 0 3 15.00
None 14 66.67 9 45.00
Only 33% had some secondary occupation in case of BKSL farmers and that was mostly animal
husbandry and skilled labour or jus labour. As against this 55% of the BCTS farmers had
secondary occupation which includes animal husbandry in 25% cases, and business in 15%
cases besides labour and skilled labour in 5% cases and even 5% reporting agriculture as
secondary occupation (Table 2.27). BKSL PC farmers were somewhat larger owners of land
but they did not lease in as much as the BCTS PC members and therefore the latter were larger
operators of land (Table 2.28).
Table 2.28: Average owned and operated land holding of BKSL and BCTS PC member
farmers
Category>
Average (in acres)
BKSL BCTS
Owned Land 2.52 2.03
Operational Land 2.81 3.02
Promoter> BKSL BCTS
Parameter>
Education
Members
(No.)
% in total Members
(No.)
% in total
Graduate 2 9.52 2 10.00
High School 7 33.33 4 20.00
Higher Secondary 2 9.52 3 15.00
Illiterate 2 9.52 5 25.00
Middle 3 14.29 5 25.00
Post Grad 1 4.76 0 0
Primary 4 19.05 1 5.00
Total 21 100.00 20 100.00

44
Whereas 90% of the BKSL and BCTS farmers and small and marginal but the former had 60%
of owned area, while it was 70% in case of BCTS farmers. However, in operated land terms,
BKSL had 86% farmers as small or marginal with 62% operated area as against 80% of BCTS
farmers having 79% of area (Table 2.29 and 2.30).
In terms of livestock holding, whereas there was no difference in the percentage of farmers
owning buffalo and cows, there was more of goat ownership in case of BKSL (Table 2.31).
The members farmers of BKSL and BCTS PC’s owned three livestock animals viz. buffalo,
cow and goats. In case of BKSL PC members, buffalo was owned by 48% member farmers
followed by cow (43%) and goat (19%). Buffalo (43%) had the highest share in livestock
holdings followed by cow (33%) and goat (24%). 55 % of BCTS PC members owned buffalo,
followed by cow (7%) and goat (5%). In terms of total livestock, buffalo had the highest share
46%, followed by cow (46%) and goat (8%). Average goat holding per farmer/household for
both BKSL PC members (2.5) and BCTS PC members (3) was the highest (Table 2.31).
10 % of BKSL PC member farmers reported no source of irrigation. In the case of BCTS PC
members, this was 5%. 48% of BKSL PC members had owned diesel engine. Usage of owned
diesel engine for irrigation was 45% in case of BCTS PC members. The share of rented diesel
engine was 14 % and 15 % for BKSL and BCTS PC members, respectively. 15% of BKSL PC
members were using rented electric engine. None of the BCTS PC members used owned or
rented electric engines while 30 % were using shared electric motors (Table 2.32).
95% of the members were growing paddy followed by maize (43%), banana (24%) and okra
(14%) in the case of BKSL PC members. For BCTS PC members, paddy was grown by all the
farmers followed by maize (20%) and bajra (15%). Similarly, paddy had the highest share in
the total kharif acreage (66%) of BKSL PC members followed by maize (19%) and banana
(9%) while paddy has 88% share followed by maize (7%) and banana (3%). Paddy had 30%
and 37% share in in case of BKSL and BCTS farmers in kharif area respectively. Though
banana was grown by considerable number of farmers, but its share was only 4% in the total
kharif cultivated land (Table 2.33).
Wheat was the most common crop grown in rabi season grown by 90% of the BKSL PC
members followed by potato (76%), mustard (14%) and peas (10%). Wheat also had the largest
share in the total rabi area (68%), followed by potato (24%). In case of BCTS PC members,
four crops were grown viz. wheat, mustard, potato and ramdana. Wheat (63%) had the highest
rabi area followed by mustard (20%) and potato (12%). Wheat accounted for 33% and 26% of
the total rabi cultivated area in case of BKSL and BCTS farmers respectively. (Table 2.34).
Peppermint was the most important crop of Zaid (Summer) season grown by 55% farmers in
case of BCTS PC farmers and just 5% in case of BKSL farmers, and occupied 91% of the Zaid
acreage which was 15.55% of the total cultivated land by BCTS PC members. The cropping
pattern was not similar for BKSL PC members where many crops had a considerable share in
Zaid acreage. Peppermint had the highest share (36.5%) followed by okra (26%), urad (19%)
and banana (12%) (Table 2.35).
Member farmers purchased seed either form a single source or from a combination of sources.
57% of the BKSL PC members purchased seeds from PC against 55% of the BCTS PC
members. PC and Dealers (19%) and agricultural department & dealers (10%) were other major

45
sources for BKSL PC member farmers while PC & dealers (35%) and PC & local farmers
(10%) for BCTS PC member farmers (Table 2.36).
Like seeds, chemical fertilizers and pesticides were also purchased from a single source or a
combination of sources. PC was the largest source of chemical fertilizers with 52 % of BKSL
PC members purchasing fertilizers from there. It was followed by dealers (24%), and dealers
and PCs (10%). BCTS PC members preferred buying from PC (90%) followed by dealers (5%)
and dealers & PCs (5%). 24% of BCTS PC members had not purchased any pesticide while
remaining purchased from PC (38%), dealers (19%), dealers & PCs (10%). 90% BCTS PC
members were buying pesticides from the PC (Table 2.37).
Most of the member farmers didn’t purchase any bio inputs. In case of bio-fertilizer, 71% of
BKSL PC members and 85% of BCTS PC members did not purchase any biofertilizers.
Similarly, most of the BKSL PC members (95%) and no BCTS PC members purchased any
biopesticides (Table 2.38)
Table 2.29: Category-wise Distribution of BKSL and BCTS PC member farmers by land
owned
Category> BKSL BCTS
Member
and Area>
Category
Members
(No.)
% in
total
Land
(Area)
% in
total
Members
(No.)
% in
total
Land
(Area)
% in total
Marginal 14 66.67 17.55 33.08 16 80.00 22.9 56.20
Small 5 23.81 14.5 27.33 2 10.00 5.85 14.36
Semi
Medium
0 0 0 0 2 10.00 12 29.45
Medium 2 9.52 21 39.59 0 0 0 0
Total 21 100.00 53.05 100.00 20 100.00 40.75 100.00
Table 2.30: Distribution of BKSL and BCTS member farmers by Operated Land
Category> BKSL BCTS
Member
and area>
Category
Members
(No.)
% in
total
Land
(Area)
% in
total
Members
(No.)
% in
total
Land
(Area)
% in
total
Marginal 13 61.90 20.95 35.42 7 35.00 10.4 17.18
Small 5 23.81 16.2 27.39 11 55.00 37.55 62.01
Semi
Medium
3 14.29 22 37.19 2 10.00 12.6 20.81
Total 21 100.00 59.15 100.00 20 100.00 60.55 100.00

46
Table 2.31: Distribution of BKSL and BCTSPC member farmers by livestock owned
Table 2.32: Distribution of BKSL and BCTS PC member farmers by Source of Irrigation
Promoter> BKSL BCTS Total
Energy
source>
Diesel
engine
Electric
motor
Diesel
engine
Electric
motor
Diesel engine Electric
motor
Ownership No
.
% of
total No.
% of
total
No
.
% of
total No.
% of
total No.
% of
total No.
% of
total
Owned 10 47.62 1 4.76 9 45 0 0 19 67.86 1 10
Rented 3 14.29 3 14.29 3 15 0 0 6 21.43 3 30
Shared 2 9.52 0 0 1 5 6 30.00 3 10.71 6 60
No
irrigation
source 2 9.52 0 0 1 5 0 0 0 0 0 0
All 17 4 14 6 28 100 10 100
The cropping intensity of BCTS farmers was somewhat higher at 2.21 compared with 2.04 in
case of BKSL farmers.
Table 2.33: Kharif cropping pattern of BKSL and BCTS PC member farmers
Promoter BKSL BCTS
Parameter>
Crop
Farmers %
Farmers
Land %
Kharif
Land
%
Total
Land
Farmers %
Farmers
Land %
Kharif
Land
%
Total
Land
Bajra 1 4.76 0.4 0.71 0.33 3 15.00 2 3.59 1.50
Banana 5 23.81 5.2 9.29 4.30 0 0 0 0 0
Cabbage 1 4.76 0.3 0.54 0.25 0 0 0 0 0
Garlic 0 0 0 0 0 1 5.00 0.8 1.44 0.60
Guard 1 4.76 0.4 0.71 0.33 0 0 0 0 0
Maize 9 42.86 10.8 19.29 8.94 4 20.00 3.8 6.83 2.84
Mustard 1 4.76 1 1.79 0.83 0 0 0 0 0
Okra 3 14.29 1.2 2.14 0.99 0 0 0 0 0
Paddy 20 95.24 36.7 65.54 30.37 20 100.00 49.05 88.14 36.67
Total 56 46.34 55.65 41.61
Promoter BKSL BCTS Members and
livestock>
Type of livestock
Members
(No.)
% in
total
Animals
(No.)
% in
total
Members
(No.)
% in
total
Animals
(No.)
% in
total
Buffalo 12 48.14 18 42.86 11 55.00 17 45.95
Cow 9 42.86 14 33.33 7 35.00 17 45.95
Goat 4 19.05 10 23.81 1 5.00 3 8.11
Total 42 100.00 37 100.00

47
Table 2.34: Rabi cropping pattern of BKSL and BCTS PC member farmers
Promoter> BKSL BCTS
Parameter>
Crop
Farmers %
Farmers
Land %
Rabi
Land
% Total
Land
Farmers %
Farmers
Land % Rabi
Land
%
Total
Land
Banana 1 4.76 0.2 0.34 0.17 0 0 0 0 0
Garlic 0 0 0 0 0 4 20.00 1.8 3.25 1.35
Gladiolus 1 4.76 0.2 0.34 0.17 0 0 0 0 0
Maize 1 4.76 0.3 0.52 0.25 0 0 0 0 0
Mustard 3 14.29 2.2 3.79 1.82 13 65.00 11.2 20.25 8.37
Okra 1 4.76 0.4 0.69 0.33 0 0 0 0 0
Peas 2 9.52 0.7 1.21 0.58 0 0 0 0 0
Potato 16 76.19 14.1 24.31 11.67 8 40.00 6.65 12.03 4.97
Pumpkin 1 4.76 0.5 0.86 0.41 0 0 0 0 0
Wheat 19 90.48 39.4 67.93 32.60 20 100.00 34.65 62.66 25.91
Ramdana 0 0 0 0 0 2 10.00 1 1.81 0.75
Total 58 100.00 47.99 55.3 100.00 41.35
Table 2.35: Summer cropping pattern of BKSL and BCTS PC member farmers
Promoter> BKSL BCTS
Parameter>
Crop
Farmers %
Farmers
Land %
Zaid
Land
%
Total
Land
Farmers %
Farmers
Land %
Zaid
Land
%
Total
Land
Banana 2 9.52 0.8 11.68 0.66 0 0 0 0 0
Guard 1 4.76 0.2 2.92 0.17 0 0 0 0 0
Okra 4 19.05 1.8 26.28 1.49 0 0 0 0 0
Peppermint 1 4.76 2.5 36.50 2.07 11 55.00 20.8 91.23 15.55
Urad 3 14.29 1.3 18.98 1.08 0 0 0 0 0
Watermelon 1 4.76 0.25 3.65 0.21 0 0 0 0 0
Moong Dal 0 0 0 0 0 1 5.00 2 8.77 1.50
Total 6.85 100.00 5.67 22.8 100.00 17.05
Table 2.36: Distribution of BKSL and BCTS PC member farmers by Source of Seeds
Promoter> BKSL BCTS
Parameter>
Source
Members
(No.)
% in total Members
(No.)
% in total
Agri Dept, Dealers 2 9.52 0 0
Dealers, PACS, PC 1 4.76 0 0
PC 12 57.14 11 55.00
PC, Agri Dept 1 4.76 0 0
PC, Dealer 4 19.05 7 35.00
PC, Local Farmers 1 4.76 2 10.00

48
Table 2.37: Distribution of BKSL and BCTS PC member farmers by Source of Chemical Inputs
Type of
agrochemical>
Fertilizer Pesticide
Category> BKSL BCTS BKSL BCTS
Parameter>
Source
Members
(No.)
% in
total
Members
(No.)
% in
total
Members
(No.)
% in
total
Members
(No.)
% in total
Dealers 5 23.81 1 5.00 4 19.05 1 5.00
Dealers, PACS,
PC 1 4.76 0 0 1 4.76 0 0
Dealers, PCs 2 9.52 1 5.00 2 9.52 1 5.00
PACS/DCS,
Dealers 1 4.76 0 0 0 0 0 0
PC 11 52.38 18 90.00 8 38.10 18 90.00
Agri Dept 0 0 0 0 1 4.76 0 0
Doesn’t buy 1 4.76 0 0 5 23.81 0 0
Table 2.38: Distribution of BKSL and BCTS PC member farmers by Source of Bio inputs
Type of Bio
input>
Fertilizer Pesticide
Category> BKSL BCTS BKSL BCTS
Parameter>
Source
Members
(No.)
% in
total
Members
(No.)
% in
total
Members
(No.)
% in
total
Members
(No.)
% in
total
Dealers 1 4.76 0 0 0 0 0 0
Dealers,
PACS, PC 1 4.76 0 0 0 0 0 0
Local farmers 1 4.76 0 0 0 0 0 0
PC 3 14.29 3 15.00 1 4.76 0 0
Doesn’t buy 15 71.43 17 85.00 20 95.24 20 100.00
Whereas most of the farmer members of the PCs promoted by the two promoters knew the
names of the PC it was the ownership aspects which though quite good at 52-60% farmers
across two promoter PCs saying it was owned by farmers left more awareness at farmer level
desired.
Table 2.39: Distribution of BKSL and BCTS PC members by knowledge of PC name
Promoter> BKSL BCTS
Parameter>
Knowledge of PC Name
Members
(No.)
% in total Members
(No.)
% in total
Don’t know 1 4.76 2 10.00
Wrong Name 0 0.00 2 10.00
Correct Name 20 95.24 16 80.00
Total 21 100.00 20 100.00

49
Table 2.40: Distribution of BKSL and BCTS PC members by knowledge of PC owner
Output sales through PC
Just one member famer each reported selling banana and potato mint through one of the PCs
each in case of each promoter during the last three years.
2.5 Within Promoter PC comparison
2.5.1 BCTS PCs
Further within the two PCs of BCTS, there was no major difference in average age of members
(42 and 43 years) but more of Krishi Vikas PC members were illiterate (44% versus 9% for
Navjyoti). But, primary and secondary occupational profile of members of the two PCs was
similar with large proportion (56% and 35% not having any secondary occupation. Though
Navjyoti members had higher owned land but the operated land of Krishi Vikas was higher on
average due to leasing in of land by members but in both cases, there was no medium or large
farmer even after leasing in. NJ also had only diesel engine based and mostly owned irrigation
tools while most of KV members had electric tube well ownership or access. There was more
of buffalo ownership in case of KV members as against more of cows in case of NJ. But
cropping intensity of Navjyoti was much higher than that of Krishi Vikas members (2.68 versus
1.8) because of cultivation of peppermint as additional crop in summer by most farmers.
Cropping patterns differed significantly with only paddy in kharif in case of Navjyoti and maize
and bajra in case of Krishi Vikas and only wheat and garlic in vas of NJ and mustard and potato
besides these two crops in case of KV.
NJ members also showed higher member awareness of PC name (90% against 67% in case of
KV) and somewhat higher number (63% knowing it is owned by famers) whereas only 55% in
case of KV knew it. KV was more reliant on PC for general awareness about farming practices
and issues and also bought more of inputs than the case with NJ whether seeds or bio fertilisers.
Promoter> BKSL BCTS
Parameter>
PC Owner
Members
(No.)
% in total Members
(No.)
% in total
Promoting agency 1 4.76 0 0
BOD 4 19.05 3 15.00
Farmers 11 52.38 12 60.00
Government 0 0 2 10.00
PC Employees 1 4.76 2 10.00
Don’t know 4 19.05 1 5.00
Total 21
20

50
2.5.2 BKSL PCs
Both PC member respondents were all men though NK members were more literate on an
average with majority being high school or above which was only 20% in case of GD. All of
them in both PCs had farming as primary occupation but 80% in GD did not have any
secondary occupation as against only 50% in case of NK. Also, GD PC members were larger
landowners and operators with 3.4 and 3.2 acres compared with only 1.5 and 2.4 acres in case
of NK. In fact, NK had no members who were not small or marginal but all of the members of
both the PCs were only marginal, small or semi-medium in operated land.
Most of the farmers in both PCs had access to groundwater irrigation owned or rented or shared
though it was diesel engine based in majority cases. Both significant ownership of livestock
especially buffalo and cows and even goat in case of GD with average ownership of 1-2 cows
or buffalo and 3 goat per household.
GD PC members also had higher cropping intensity and a cropping pattern dominated by paddy
wheat, maize and potato compared with that by paddy, wheat, potato, and banana. More
significantly, NK members had peppermint as a summer crop while GD members had more of
only watermelon and urad.
Both the PC members were highly aware of the PC name and its ownership with 50-55% in
both knowing that it was owned by farmer members and only 20% in both cases being unaware
of who owned the PC. C employees and promoters/ BoD were source of influence for members
to join the PCs in both cases. More than 50% of the members in both cases were reliant on CP
for agriculture related information. 45% of GD and 70% of NK also bought seeds from PC and
more of GD members bought chemical fertilisers and pesticides from PC (73% and 63%
respectively) than those by NK members (30% and 10% only).
2.6. Summary
The overall physical and financial performance of the PCs with the exception of the milk PC
shows that they have small authorised capital base of Rs. 5-15 lakh only even after a few years
of existence and paid up capital was still not mobilised up to the authorised level of just Rs. 5
and 10 lakh each in two cases. Their revenue base was small ranging from 50-88 lakh in three
cases out of four and only Rs. 16.5 lakh in one case. All of them were in loss or had made
negligible profits. It was only the milk PC which stood apart in every which way in terms of
membership, revenue and profits and mobilised capital. It was mostly due to the nature of its
business i.e. milk and its governance model which included asset light high turnover strategy
and professional management and tight governance of the PC.
The members of the four non-milk PCs were really smallholders but much larger than their
non-member counterparts in same villages at least in owned land. They were all marginal
landowners and just marginally above that for operated land on an average. The awareness
about the PCs and its ownership was very high among members and non-members compared
with other study states perhaps due to the fact that it was part of a larger project funded by the
World bank which has been around for many years in the state. Also, reported high influence
of PC employees and promoters seemed to have played a role in this.
The input side interface of the PCs was high but there was not much impact on the output side
so far as farmer income impact was concerned as only a few farmers had sold to the PCs some

51
their output for various reasons like delayed payments. One PC was facilitating contract
farming of potato among its members and another had promoted banana cultivation in the local
area which was significant activity in terms of crop diversification.
The PCs were male dominated in their members in all cases and both the promoters worked
with mostly marginal and small landowners and operators with average being around 2 or 3
acres of land owned or operated. This is the most comforting aspect of the PCs is that they
really represent the marginalised sections of the farming community. Also, the awareness of
members regarding PC and its ownership was significant in case of both the promoters who
were from the same group of promoters i.e. BASIX.
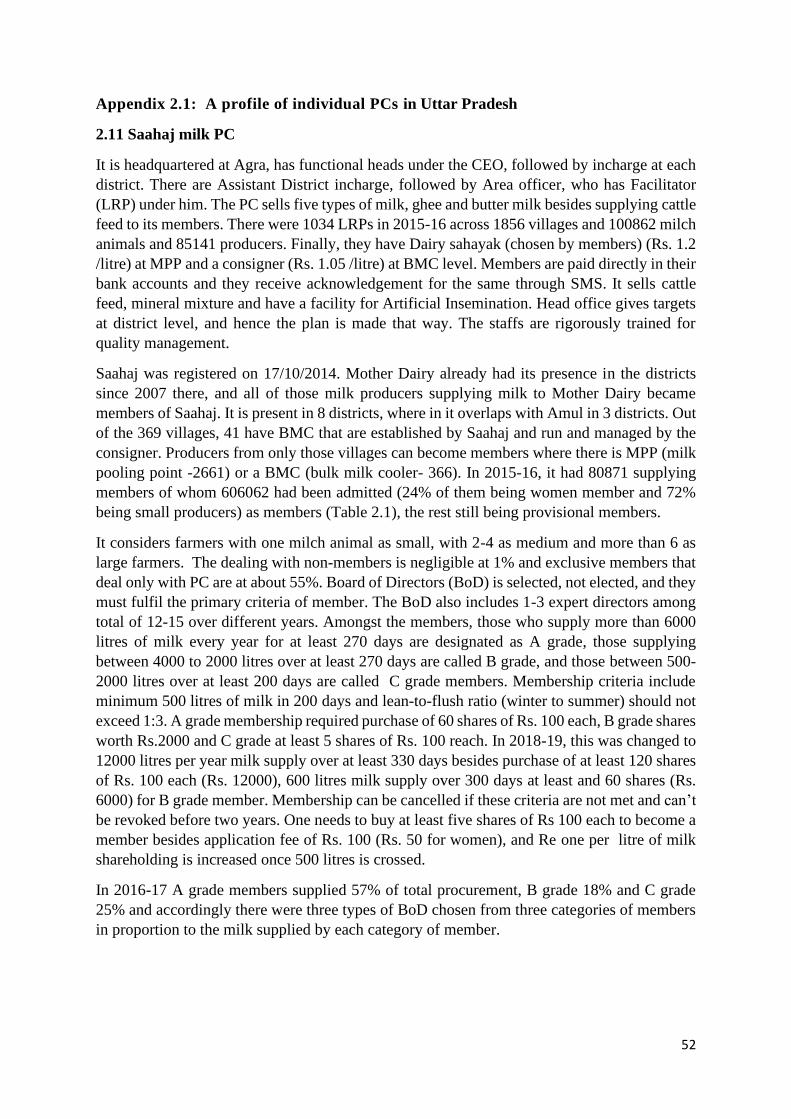
52
Appendix 2.1: A profile of individual PCs in Uttar Pradesh
2.11 Saahaj milk PC
It is headquartered at Agra, has functional heads under the CEO, followed by incharge at each
district. There are Assistant District incharge, followed by Area officer, who has Facilitator
(LRP) under him. The PC sells five types of milk, ghee and butter milk besides supplying cattle
feed to its members. There were 1034 LRPs in 2015-16 across 1856 villages and 100862 milch
animals and 85141 producers. Finally, they have Dairy sahayak (chosen by members) (Rs. 1.2
/litre) at MPP and a consigner (Rs. 1.05 /litre) at BMC level. Members are paid directly in their
bank accounts and they receive acknowledgement for the same through SMS. It sells cattle
feed, mineral mixture and have a facility for Artificial Insemination. Head office gives targets
at district level, and hence the plan is made that way. The staffs are rigorously trained for
quality management.
Saahaj was registered on 17/10/2014. Mother Dairy already had its presence in the districts
since 2007 there, and all of those milk producers supplying milk to Mother Dairy became
members of Saahaj. It is present in 8 districts, where in it overlaps with Amul in 3 districts. Out
of the 369 villages, 41 have BMC that are established by Saahaj and run and managed by the
consigner. Producers from only those villages can become members where there is MPP (milk
pooling point -2661) or a BMC (bulk milk cooler- 366). In 2015-16, it had 80871 supplying
members of whom 606062 had been admitted (24% of them being women member and 72%
being small producers) as members (Table 2.1), the rest still being provisional members.
It considers farmers with one milch animal as small, with 2-4 as medium and more than 6 as
large farmers. The dealing with non-members is negligible at 1% and exclusive members that
deal only with PC are at about 55%. Board of Directors (BoD) is selected, not elected, and they
must fulfil the primary criteria of member. The BoD also includes 1-3 expert directors among
total of 12-15 over different years. Amongst the members, those who supply more than 6000
litres of milk every year for at least 270 days are designated as A grade, those supplying
between 4000 to 2000 litres over at least 270 days are called B grade, and those between 500-
2000 litres over at least 200 days are called C grade members. Membership criteria include
minimum 500 litres of milk in 200 days and lean-to-flush ratio (winter to summer) should not
exceed 1:3. A grade membership required purchase of 60 shares of Rs. 100 each, B grade shares
worth Rs.2000 and C grade at least 5 shares of Rs. 100 reach. In 2018-19, this was changed to
12000 litres per year milk supply over at least 330 days besides purchase of at least 120 shares
of Rs. 100 each (Rs. 12000), 600 litres milk supply over 300 days at least and 60 shares (Rs.
6000) for B grade member. Membership can be cancelled if these criteria are not met and can’t
be revoked before two years. One needs to buy at least five shares of Rs 100 each to become a
member besides application fee of Rs. 100 (Rs. 50 for women), and Re one per litre of milk
shareholding is increased once 500 litres is crossed.
In 2016-17 A grade members supplied 57% of total procurement, B grade 18% and C grade
25% and accordingly there were three types of BoD chosen from three categories of members
in proportion to the milk supplied by each category of member.
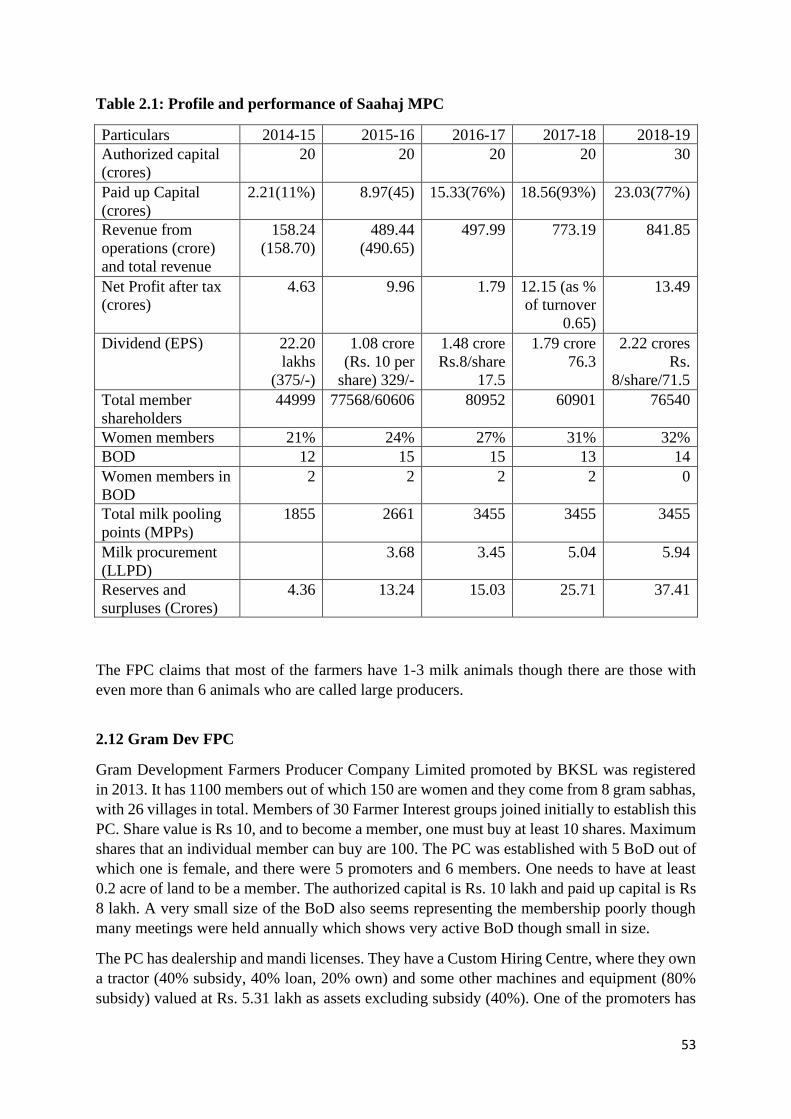
53
Table 2.1: Profile and performance of Saahaj MPC
Particulars 2014-15 2015-16 2016-17 2017-18 2018-19
Authorized capital
(crores)
20 20 20 20 30
Paid up Capital
(crores)
2.21(11%) 8.97(45) 15.33(76%) 18.56(93%) 23.03(77%)
Revenue from
operations (crore)
and total revenue
158.24
(158.70)
489.44
(490.65)
497.99 773.19 841.85
Net Profit after tax
(crores)
4.63 9.96 1.79 12.15 (as %
of turnover
0.65)
13.49
Dividend (EPS) 22.20
lakhs
(375/-)
1.08 crore
(Rs. 10 per
share) 329/-
1.48 crore
Rs.8/share
17.5
1.79 crore
76.3
2.22 crores
Rs.
8/share/71.5
Total member
shareholders
44999 77568/60606 80952 60901 76540
Women members 21% 24% 27% 31% 32%
BOD 12 15 15 13 14
Women members in
BOD
2 2 2 2 0
Total milk pooling
points (MPPs)
1855 2661 3455 3455 3455
Milk procurement
(LLPD)
3.68 3.45 5.04 5.94
Reserves and
surpluses (Crores)
4.36 13.24 15.03 25.71 37.41
The FPC claims that most of the farmers have 1-3 milk animals though there are those with
even more than 6 animals who are called large producers.
2.12 Gram Dev FPC
Gram Development Farmers Producer Company Limited promoted by BKSL was registered
in 2013. It has 1100 members out of which 150 are women and they come from 8 gram sabhas,
with 26 villages in total. Members of 30 Farmer Interest groups joined initially to establish this
PC. Share value is Rs 10, and to become a member, one must buy at least 10 shares. Maximum
shares that an individual member can buy are 100. The PC was established with 5 BoD out of
which one is female, and there were 5 promoters and 6 members. One needs to have at least
0.2 acre of land to be a member. The authorized capital is Rs. 10 lakh and paid up capital is Rs
8 lakh. A very small size of the BoD also seems representing the membership poorly though
many meetings were held annually which shows very active BoD though small in size.
The PC has dealership and mandi licenses. They have a Custom Hiring Centre, where they own
a tractor (40% subsidy, 40% loan, 20% own) and some other machines and equipment (80%
subsidy) valued at Rs. 5.31 lakh as assets excluding subsidy (40%). One of the promoters has

54
been appointed as CEO, because of financial issues. One driver and one sales boy are the only
2 employees of the PC and get Rs. 5,000 as salary per person per month.
The main crops of the region are wheat and paddy. Some 3-4 years ago, the PC encouraged the
production of lemongrass oil. About 5-10 members cultivated lemon grass in 7 Acres of land,
but it wasn’t successful. The plants for cultivating lemon grass were given for free to the
participating members. But the yield was low, and so they couldn’t get the right price.
Almost 50 percent of the members buy inputs only from the PC. It procured wheat from farmers
at MSP under government procurement programme. In the same village, there is a co-operative
society (PACS) which caters to 48 villages for crop loans. It is also a procurement centre for
wheat for the government for MSP implementation.
It transacted through NCDEX once, earned a profit of Rs. 800 but later on incurred losses hence
stopped, as the market prices were comparatively high. Turnover has become 10-fold from
about Rs. 5 lakh at its inception. Though, the PC has been suffering losses since last two years,
they received grant of Rs 3,70,000 from SFAC with per farmer limit for the grant at Rs. 1,000.
A business plan regarding wheat and paddy seed production was made. Training for BOD was
arranged once in the year 2013-14 for three days by Basix and Agri Department. The training
for members, however, has never been arranged. Animal Husbandry training was arranged by
Rural Self-Employment Training Institute (RSETI).
As the Table 2.2 below shows though the company has moved towards raising equity capital
and has reached 87% of that authorised, the shares remain confined to a large extent with the
promoters and a few members only. For example, 48% of the shares were held by just eight
members in 2016-17 which is not a desirable thing for a PC though it may be needed initially
but continuing with it for years is not a positive development.
Table 2.2: Profile and performance of the GDPC
Year>
Particulars
2013-2014 2014-2015 2015-2016 2016-2017 2017-2018
Authorized Capital
(Rs. lakh)
5 5 5 5 10
Paid up Capital
(Rs. lakh)
1(20%) 1.42(28%) 1.67(33%) 1.67(33%) 8.71 (87%)
No. of shares 10000 14720 16780 16780 87100
Shares (> 5% of total)
held by number of
members / promoters
as % of total and no. of
those who owned them
64 (9) 48% (8) 48% (8)
Total Sales/turnover
(Rs.)
1447140 1270731 1808204 6349874 5000588
Reserves/surpluses
(Rs.)
(10782) (7568) 449363
Profit (Loss) (Rs.) (13528) 2746 3214 6932 (3046)
BOD 5 5 5 6
Meeting of BoD held
(% of BoD attended
in no. of meetings)
12 (80% in 5
meetings)
13 (80% in 5
meetings)
7

55
Further, though the PC has moved to larger turnover after three years (three times of that in the
third year) and was able to receive loans from an MFI (Ananya Finance) and public sector bank
(Bank of India), the financial performance remains week with very negligible profits in the
three years after first year and then loss in the fifth year. This is again worrying as despite
having loans and subsidies for the farm machinery bank, it was not able to earn enough.
The biggest problem that the PC faces is shortage of manpower and working capital, while
externally; it is difficult to get permissions for renewals and licenses. It has been in loss for the
last two years. It plans to focus on seed production for viability though it faces lack of working
capital and human resources.
2.13 Naveen Kisan PC
The promoter BKSL was involved in a World Bank Funded project in 29 districts across 3-4
states as its technical support agency as well as implementing agency. It carried out value chain
study and also organized farmer interest groups which later on ended up as 20 registered FPCs.
It was a bottom up approach and 100 FPCs were to be set up in three years in production surplus
areas, in mostly sodic lands. Later on, the approach was changed to top down where BoDs were
mandated to mobilize members and groups. All the FPCs registered in 2014 were based on
bottom up approach and had business plans.
Naveen Kisan Producer Company Limited was registered in 2014 in Etaunjha, Lucknow. It
operates in 18 villages. It is promoted by BKSL, with technical support from BASIX and also
received grants from SFAC but not yet received matching equity grant. The FPC registered in
2015 has 631 shareholders across 32 villages.
Major crops in the area included paddy, both high yielding and hybrid, and banana in Kharif
and wheat, tomato, cabbage, potato and onion in Rabi season besides mentha in summer
season. The introduction of banana crop in the villages has led to decline in the area under
bottle gourd.
Photo 2.1: Office of Navin Kisan PC and banana crop in a member’s farm

56
Initially, out of the 200 members registered, 60% were already members of FIGs. It doesn’t
have any membership criteria other than that the member must be a farmer. A farmer can buy
minimum of 10 and maximum of 100 shares with each share valued at Rs. 10, while a Director
has to buy 100 shares. A share certificate is issued for the same. The board had formerly 11
members, which is now at 8, amongst whom one is a female. The FPC has 1034 members, a
board of director has to organize FIG of 20 members each to be eligible for applying for
membership of the board. There is no expert on the BOD and has one CEO (B.A.) and an
assistant to the CEO, both of them paid their salaries by SFAC. Now, the FPC has no CEO and
only a chartered accountant is taking care of it. The members of Naveen Kisan FPC had land
ranging from 0.5 acre to 4 acres.
As of 2019, there are 1034 members (35 female and 999 male), with target set at 2000. No
members have more than 4 acres of land with most of them having 0.5 acre each, making them
all either marginal or small farmers. 80% of the members are active who do at least some
transactions with the company. Authorized capital initially was Rs. 5 lakh, which has now been
increased to Rs. 10 lakh (Table 2.3), whereas the paid-up capital is at Rs 4,37,000.
The PC is majorly into input dealership and sells seeds, fertilizers and pesticides (10% on
credit). The PC owns 2 sprayer pumps for pesticide valued at Rs. 2800 each, which are lent to
farmers when they buy pesticides. The input sales are restricted to members. 80% of the
members buy okra seeds from the PC with about 2% lower than market price. More than 60%
of members were into vegetable cultivation like lady finger and bottle gourd, but many of them
are now cultivating banana due to high returns. 40% members do banana cultivation, where the
banana tissue cultured plants of G9 variety was bought from Jalgaon and sold at Rs. 17.5/plant
totalling 20700 plants last year and 35000 plants last year. The entire banana produce is sold
through the PC. It has also promoted flower cultivation in the area for which they have an
APMC license. A couple of farmers in two villages are into floriculture and are growing
Gladiolas and marigold flowers in a total of 5 acres of land.
The PC has received various trainings through KVK and CMAP in floriculture and for NPM
in Orissa. NPM of crops is practiced in Okra, Banana and Tomato. The NPM input sales is
done by one member farmer, and 50 farmers have participated in NPM crop growing. The fees
for this are Rs 500 per season per farmer for 0.5 acre of land, which includes providing inputs
(biofertilizers and biopesticides) and supervision (Rs. 100- PC, Rs. 100- BKSL, Rs. 50-
entrepreneur, and 250- input cost). An exposure visit was made to Kevali to understand the
working of Navjyoti Farmer PC promoted by BASIX (BCTS).
Photo 2.2: NPM promotion and documentation by the PC

57
The FPC intervention in wheat and paddy was made because farmers were not getting good
quality inputs and also wheat farmers were not able to realize MSP. It also registered with
MCX for futures trading in mentha oil wherein the futures commodity price was displayed by
the FPC at the village level. Even zinc fortified wheat was also attempted to be produced in
case of three FPCs. Similarly, kala namak basmati rice and organic farming of paddy and potato
was also attempted.
The FPC also undertook contract farming with Pepsi and there were large scale defaults from
both sides and the arrangement ended after 3 years. This project had brought for the first-time
processing varieties of the potatoes in the local area. The FPC used to get Rs. 1 per kg vendor
commission on seed potato and Rs 0.4 per kg commission on output sales. The contract price
was broadly communicated to the FPC by Pepsi but actual procurement price was decided only
a week before sowing when the actual contract was signed.
The company got into contract farming with Siddhivinayak Agri Processing Pvt Ltd. (SAPPL),
where it bought seed potato from them, but it did not deliver them the produce because market
prices were higher than the contract price. Also, 20% of the potato produce and Okra (50%
member farmers cultivate) is sold in E-NAM and PC is registered on e-NAM. Bottle guard
which was cultivated by 70% farmers before pc intervention has now come down due to its
replacement with banana. A couple of years back, 24 tonnes of produce was sold to Pune based
company- Pick and Serve, which was then discontinued because the price was not good
enough.
The PC had a four-year business plan under which it has projected the revenue from different
crops being handled by it which included paddy, banana and brinjal in Kharif and potato in
rabi and sales of fertilisers during all the three seasons. The PC don’t have enough working
capital and suffers from staff crunch.
Table 2.3: Profile and performance of Naveen Kisan PC
Year>
Particulars
2015-2016 2016-2017 2017-2018
Authorized share capital (Rs. Lakh) 10 10 10
Paid up Share Capital (Rs. Lakh) and
(%) of authorised
1.1(11%) 1.1(11%) 3.18(31%)
No. of shares 1100 1100 3181
Total revenue (Rs.) 690090 551280 759589
Profit (Loss) (Rs.) 313090 (69309) 7145
Assets (Rs.) 423090 587804 844868
Reserves & Surplus (Rs.) 313090 243780 260066
The BCTS was of the view that of all the farmer members 30% understand that the FPC belongs
to them, another 50% only looked for benefits and rest 20% have no involvement with the FPC.
The PC undertook wheat seed contract farming in 20 acres from 18 farmers for state seeds
corporation. The SFAC has made matching equity grant to 5 out of 7 FPCs. Of the total FPCs
promoted by BCTS, 86 which are more than 3-year-old have received the equity grant. Each
FPC had Rs. 100 share value which has been increased to Rs. 500 now and a member has to
buy minimum of 5 and can buy maximum of 10 shares.

58
The FPC has been doing collective selling of banana, bottle gourd and lady finger. It also sold
vegetables in E-NAM. The tissue cultured banana has been introduced in the area by this FPC
where 40% of the members cultivate this crop and sell it to the FPC. The FPC also supports
the production of non-pesticidal farm inputs by some of its members. 50 farmers buy these
products.
The FPC faces the problem of shortage of working capital and staff besides issues of
governance within the company.
It had a five-year plan (2017-2022) which aimed at expanding the membership to 1400 and
share capital to Rs. 7 lakh. The business plan mainly focused on input supply, aggregation and
sale of farm produce and value chain interventions. It intended to increase the farmer income
by 4-5% by building better market linkages for farmer produce. The FPC has never brought
any produce from non-members though it sells farm inputs to them.
2.14 Navjyoti Kisan PC
Navjyoti Kisan Producer Company Limited, promoted by BCTS was registered at Gosaiganj,
Lucknow in January 2014. It was formed by the members of 62 Farmer Interest Groups (FIGs)
and operates in 12 villages of Gosaiganj block. It is promoted by BCTS. The membership is
restricted to farmers that own land and have subscribed to the membership with shares for Rs.
200. The share value is Rs.10 and share certificates have been issued to the members. Out of
total of 1010 members, 32 are female. One of the 7 BOD is woman and there are no experts on
the BoD. 96% members of the PC are marginal or small landowners and more than 80% are
active members who do some or the other transaction with the PC. Besides CEO, it has one
marketing officer, one finance and accounts officer besides a service provider and one Kisan
Mitra.
The PC have an authorized Capital of Rs. 15 lakh which is same as the paid-up capital (Table
2.4). Promoting agency UPBSN had given Rs 4.5 lakh as Community Investment Fund to meet
the initial working capital. The PC also received a matching equity grant of Rs 5 lakh in 2016-
17 from SFAC and a loan of Rs.12 lakh at 13.5% interest for working capital was sourced from
Ananya Finance Ltd in 2016.
Upto 2019, NKPCL had done total business of Rs.3.36 crore, with input sales turnover at Rs.
2.20 crore and sale facilitation of agricultural produce at Rs.1.16 crore in the last three years,
mainly wheat. NKPCL also has registration with e-NAM and NCDEX. There are plans of
participating in futures market for mentha and Mustard by 2020-21. NKPCL has recently
obtained dealership of UP Beej Vikas Nigam, along with LIC micro insurance agency license
and APMC mandi license. NKPCL has multiple channels for input procurement like IFFCO
(Urea with MRP of Rs 326 was sold at Rs 400 in black market prior to this), many seed and
fertiliser companies and bio fertiliser companies. This has helped farmer members in timely
availability, reliable price and adequate quantity.
Activities carried out by NJPCL include Input Sales, Agri produce Sale Facilitation, Farm
Machinery Bank, IFFCO Kisan Sanchar Limited, Micro-finance Agency of LIC and Zn
fortified wheat seed production.

59
Table 2.4: Profile and performance of NJ kisan PC
Year>
Particulars (all in Rs.)
2016-17 2017-18 2018-19
Members 502 1010 1010
Authorized share capital (Rs. Lakh) 1000000 15000000 1500000
Paid up Capital (Rs. Lakh) & (%) of authorised 1000000 (100) 1500000 (100) 1500000 (100)
Revenue 5244080 5033851 7049085
Profit (Loss) (192142) (80422) 47262
Reserves & Surplus (402346) (482769) (435506)
Assets 2251199 2073409 2421006
The PC sold inputs to both members and non-members but procured only from members. 80%
members bought seeds, fertilisers and pesticides from PC and it was sold lower than market
price and about 45-60% bought exclusively these inputs from PC. Custom rental of machinery
and equipment was used by 15-85% members depending on the machine or the equipment with
cultivator and rotavator being used by 85% and seed drill and land levellers only by 15% and
30% each. Over the years, more and more members used input services growing from 600 in
16/17 to 830 in 2018/19.
On the output side, it procured wheat at MSP from only 47 members as an agency for govt.
procurement and received 2.5% commission for this.
It has only conducted training and exposure programmes for its BoD, staff, and about 100
members on mentha oil market and futures trade with the collaboration of MCX and kisan
goshthi in kharif and rabi season for all the above stakeholders with the help of KVK.
2.15 Krishi Vikas FPC
Krishi Vikas Farmers Producer Company Limited promoted by BCTS was established in July
2015. Water user groups mobilized by UPBSNL were already present in the area of operations.
About 300-350 members, from 40 such groups, thus, joined the PC as members. All the farmers
are registered as individual members and can only be a part of this PC if they own land.
This FPC originated from water user groups numbering 40. It had membership of 300. 80% of
the members are active. The FPC had 80 members to begin with which number 1139 now
including 100 female members. Most of the farmers had land holding lower than 5 acres each.
The input stores have been running since beginning. The two outlets cover 80% of members
across 10 villages. Rest of the members are from remaining 16 villages. The FPC claims that
its input intervention had led to end of black marketing in inputs and improvement in quality.
It claims that 50% of its members buy exclusively from FPC. It had 79 farmers with 87.5 acres
in contract farming of processing variety potato for the last three years.
The FPC business is managed by Board Members with each one of them looking into a cluster
of farmers and the board member gets commission for the same. The contracting company
rejected 20% produce due to the small size of the potatoes. It also plans to get into maize
procurement for supplying to field companies.
PC started with mere 80 members and had 1139 members by 2018-19 out of which 100 were
female, and all of these members were either marginal, or small farmers. With 10 board

60
members when initially registered, they are 8 now, and one of them is a woman. To be a part
of BOD, one needs to have 10 shares. Chairman looks after this BOD, which in turn has a CEO
under them.
The paid-up capital has increased from Rs. 1.36 lakh to Rs. 5 lakh (Table 2.5). Each share is
priced at Rs 100, with a cap of 10 shares per member. This is in accordance to SFAC rules,
where no member is allowed to invest more than Rs 1000 if the PC wants to avail the grants.
Krishi Vikas is yet to avail the grant. Two of these directors manages the input store, whose
license is owned by the company, and in turn the profit is shared equally between the two.
Even though 80% members are active, PC faces last mile problem, as there are only two outlets
(for agri inputs) which can cater only to 10 villages out of the 26, in which Krishi Vikas is
present. It does not have trading license yet, but has dealership of Zortex, IFFCO, Bij Vikas
Nigam, Nirmal and Sabri for seeds, fertilizers and pesticides. Zinc fortified seeds were
provided to the members. 50% of the members exclusively deal with PC. These service
activities have helped in catering to local supply by providing them with good quality products
on MRP, which were sold at higher rates before. Potato Contract farming with Pepsico was
started 3 years ago (see agreement between PC and farmer members in appendix 2.15A), with
79 farmers working in 35 hectares of land. Out of the 250 packets that are produced from one
acre of land, roughly 80% is fit for Pepsico. PC does soil testing and 3 visits are done for
inspection while potatoes are sown. PC takes a facilitation fee of Rs 40 per quintal for the same.
Net sown area for potatoes has increased because of this.
It received a capital subsidy of Rs. 4.5 lakh each in 2016-17 and 2017-18. PC availed a loan
for 5 lakhs at an interest of 23.75% for seeds from Sanmunati in 2017-18. While the company
faces problems of funds and is waiting for SFAC matching equity grant, there are also problems
in that licenses are not issued timely and IFFCO was unable to meet timely delivery. The area
of operations of PC was divided into clusters, where each cluster is managed by one of the BoD
on commission basis. This innovation in business model helped them in increase sales.
For future plans, Krishi Vikas wants to set up its own processing plant for potatoes (costs
around Rs.1-1.25 lakhs, 40% potatoes can be used). Apart from that, they want to aggregate
corn which in turn can be sold to cattle feed plants. They also plan to establish seed processing
plants for groundnut and wheat to get better margins for the member farmers.
Table 2.5: Profile and performance of Krishi Vikas PC
Year>
Particulars
2015-16 2016-17 2017-18 2018-19
No. of shareholders 195 352 1139 1139
Authorised capital 5 5 5 5
Paid up capital (Rs. lakh) 1.36(27%) 2.33(47%) 5(100%) 5(100%)
Revenue (Rs. lakh) - 15.34 77.39 87.96
Net profit (Rs.) - 1320 25750 20031
Reserves & surplus (Rs.) - 1152 4.77 4.98
% of shares with
Shareholders holding
with >5% share each (5)
20% 20% (150-250
shares each)
20% (150-250
shares)
20% (150-250
shares each)
Source: PC records

61
Appendix 2.15A
Contract farming agreement Letter with member farmers
I, __________ son of ___________ resident of ___________ certify that I have ________
quintal of potato seeds. I will buy _________ quintal of new potato seeds. I will sow my seeds
for kachha potato crop and new seed for pakka Potato crop. I will plant these seeds in almost
________ bigha land and will provide Krishi Vikas Farmer Producer Company with
__________ Quintal Potato.
Conditions to sell Potato through Company
1. Sowing of Kachha crops must be done between 1-10 October and digging between 20
December and 10 January. Sale price will be decided on the day the produce is weighed
and loaded in truck, while the final price will be decided after the produce is accepted by
the plant.
2. Sowing of Pakka crops must be done between 15-25 October and digging any time after
5th February. Sale Price will be decided on 30th September.
3. Potatoes will be graded and potatoes of sizes between 40 mm and 85 mm will be bought.
Company won’t buy green, cut and diseased potatoes.
4. Netted Plastic bags must be used for packing. Produce will be weighed on the scale of one
quintal 400 grams.
5. Producers will be fully responsible if potatoes are rejected due to reasons like grading,
agricultural chemicals, etc. Company will not pay any kind of compensation for this.
6. Loading in the trucks will be done by the producers themselves, and company will not pay
for any kind of labour charges.
7. Pakka Produce is supposed to be sent to Agra and Hathras by farmer at their own expense.
All Mandi charges will be paid by the Producer. Mandi charges will be returned once the
produce in vehicle is accepted.
8. Payment will be done through bank account once the PC receives the payment from the
Company.
9. No urea should be used after 60 days of sowing as it can lead to higher sugar content at
the time of testing.
10. If a producer sells seeds to any other person without the consent of the PC, the produce
will not be bought by the PC.
11. PC will provide the producer with crop safety kit, which needs to be used by the producer.
Producer will need to pay for such a kit.
Witness Farmer Sign Sign
Farmer
Mobile Number ______________

62
Chapter 3
Performance and Impact of PCs in Rajasthan
Introduction
Rajasthan is the largest state of India, occupying 10.41% of geographic area is an agrarian state
where a large part of the population lives in rural areas. More than 70 % of the population is
dependent on Agriculture and its allied sector for their livelihood. It is the fourth largest
producer of food grains in India after Uttar Pradesh, Punjab, and Andhra Pradesh.
Agriculture contributes 19.88% of Gross Domestic Product of the state. Nearly 65% of the total
cultivated area is sown in Kharif season (Goyal, 2017). Rajasthan is India’s largest producer
of mustard (45%), pearl millet (31%), cluster beans (61%), and isabgol (16%), and the second
largest producer of pulses and the third largest producer of soyabean (9%) (Sharma and
Sharma, 2013). The state has first rank in the production of cumin, coriander, and fenugreek
and ranks second in the production of livestock contributing 10% of India’s milk and 30% of
mutton production. Farming and livestock production take place in many parts of Rajasthan
often in extreme agroclimatic conditions. Of the total cultivated area (20 million hectares),
irrigated area is only 20% (Goyal, 2017). Rajasthan had 224 FPOs in early 2017 with 1.1 lakh
farmer members mostly under NABARD support (63%), SFAC (18%) and RKVY (17%) and
a few by private sector CSR (2%) (GoR, 2017). In this context of high production and market
risks, it is important to examine the role and potential of FPCs in the state.
The first section of this chapter analyses the physical and financial performance of the PCs.
The second section examines the profile and impact of milk PC on members vis-a-vis non-
members. The third section examines the other non-milk PCs in the state promoted by two
different professional agencies and their impact on farmer members. Section 4 of the chapter
also makes a comparison between those two promoters for assessing the differential impact, if
any. Section 5 compares PCs of each promoter between themselves. The chapter then
concludes with major observations on the performance of the PCs in the state.
3.1 Physical and financial performance of PCs
Most of the PCs other than Paayas and Molasar could not mobilise enough equity capital from
their members. It was not even 70% even after a few years of the existence of the PCs. Two of
them were stuck at just 20% and 32% each of the authorised capital which itself was small i.e.
Rs. 5 lakh each in case of each of the PCs promoted by ISAP. Further, all of the non-Paayas
PCs made losses throughout their existence. Consequently, they had nil or negative reserves
and surpluses and minimal assets. The main reason for this was their low turnover which was
a few lakh rupees each except one (Shekhawati) (Table 3.1).
Compared with this, the milk PC has turnover which ran into more than Rs, 100 crore per year
and it had generated profits of the order of more than Rs. 10 lakh per year and surplus of Rs.
29-61 crore per year. The low turnover in case of the ISAP PCs was for the reason that they
had not undertaken much output side business so far and were mainly supplying farm inputs to
members and non-members. Even IGS promoted PCs had undertaken only some procurement
for the SFAC at MSP which helped them stay afloat for some time as they received some
commission and service charges for it. This helped one of them to receive matching equity

63
grant and another a capacity building grant from SFAC though they had no business plans of
any significance.
Rajasthan is the second largest milk producer state in the country despite being dryland region.
The major competitor of PAAYAS include RCDF – a state milk cooperative procuring 28 lakhs
litre annually with 40 percent coming from non-members and the largest player in buying and
selling milk in this state: GCMMF (Amul) 11 lakhs litres procurement, mainly sourcing from
neighbouring milk unions in Gujarat: private players which include Modi Dairy with lotus
brand, procuring five lakh litres annually through a mix of direct procurement and through
intermediaries and Dharampal Satyapal with Ksheer brand handling one lakh litres mainly
procured through intermediaries and Patanjali foods procuring 1.5 lakh litres through a mix of
direct buying and through intermediaries. The latter two players are of recent origin whereas
lotus has been there for more than 25 years and even before Amul entered this market. Reliance
and Kwality dairies have shut down their operations while Heritage, Rufil and Dev Milk Foods
are new entrants in the state milk market.
However, due to the state government patronage, RCDF offers a subsidy of Rs.2/- per litre
which has been increased to Rs.5/- now which leads to unfair competition for the PC. The other
private dairies in Rajasthan include: Modi with Lotus brand which has been there for 25 years
and sells 5 lakh litres per day. Amul has been selling for the last 15 years about 11 lakh litres
per day mostly from neighbouring plants of Mehsana and Sabarkantha in Gujarat. The other
significant private player is DS Group from Catch Masala brand which has been around for 7
years and sells one lakh litre per day. Patanjali has also been selling for two years mainly cow
milk and is venturing into buffalo milk now.
Table 3.1: Profile and Performance of PCs in Rajasthan
3.2 Milk PC (Paayas): Member and Non-Member Profile
All the ten respondent members were women farmers and mostly literate or middle standard
pass with only one each being high school literate and postgraduate each (Table 3.2). 70% of
them reported farming as the primary occupation and the remaining animal husbandry. The
Particulars
Year
2015-16 2016-17 2017-18 2018-19 2016-17 2017-18 2018-19 2016-17 2017-18 2016-17 2017-18 2018-19 2019-20 2013-14 2015-16 2016-17 2017-18 2018-19
Members (Women)
312 518 518 265 265 690 37800
(.1%)
112000 97816
(38224)
104000
(38%)
BOD
Authorized Capital
(Lakhs)
10 10 10 10 10 10 10 5 5 5 5 5 5 3000 3500 3500 5000
Paid up Capital (Lakhs)
1(10%) 2.63
(26%)
7.26
(73%)
1(10%) 6.22
(62%)
6.22
(62%)
1 (20%) 1 (20%) 1.7
(32%)
1.7
(32%)
1.7
(32%)
1.7
(32%)
2280
(76%)
3072
(88%)
3389
(97%)
3740
(75%)
No of Shares
% of Shares held by
promoters
3 3 100 100
% of Shares held by
Directors
50 50
Revenue (Lakhs) 2.78 8.14 8.24 14.8 21.4 32.7 56.6 0.96 6.95 3.12 0.86 84500 106200 128200 142950
Profit (Loss) (Lakhs) 0.75 -0.62 0.4 0.61 -0.1 -0.02 -0.51 0.21 1289 1115 1684 1303
Reserves & Surplus
(Lakhs)
-0.01 0.17 -0.44 0.49 0.11 0 -0.02 -0.53 1.8 2923 4754.1 6119
Assests (Lakhs) 0.04 0.03 0.02 44.26 4511.6 3479.2 2587.5
Loans received (Lakhs)
Loans given
Milk Procurement (litres
in lakhs)
3.39 4.91 6.5 6.45 8.6
Molasar PC Shekhawati PC Khandar Agro PC Shreedev Mahila PC Paayas PC

64
animal husbandry and dairying was the secondary occupation for 70% of them and farming for
another 20% (Tables 3.3 and 3.4). Among the non-members who were all men, only one was
illiterate and rest middle high or higher secondary literate with one being graduate. 75% of
them reported farming as primary occupation followed by animal husbandry. 17% or a
combination of the two. Animal Husbandry was major secondary occupation with 66%
followed by farming (8%), and salaried job or self-employment in 25% cases.
Table 3.2: Distribution of Milk PC member and non-member farmers by education
Farmer Category> Members Non- Members
Parameter>
Education
Farmers
(No.)
% in total Farmers (No.) % in total
Illiterate 4 40 1 8.3
Middle School 4 40 5 41.6
High School 1 10 3 25
Higher Secondary 0 0 2 16.6
Graduate 0 0 1 8.3
Postgraduate 1 10 0 0
Total 10 100 12 100
Table 3.3: Distribution of Milk PC member and non-member farmers by Primary
Occupation
Farmer category> Members Non- Members
Parameter>
Primary Occupation
Farmers (No.) % in total Farmers (No.) % in total
Agriculture 7 70 9 75
Animal Husbandry 3 30 3 25
Total 10 100 12 100
Table 3.4: Distribution of Milk PC member and non-member farmers by Secondary
Occupation
Farmer category> Members Non- Members
Parameter>
Secondary Occupation
Farmers (No.) % in total Farmers (No.) % in total
Animal Husbandry 7 70 8 66.6
Agriculture 1 10 1 8.3
Skilled Labour 1 10 3 25
None 1 10 0 0
Total 10 100 12 100
Average land owned by a member milk producer was 1.3 acres with all of them being marginal
or landless farmers. In terms of operated land which was on average 1.4 acres (Table 3.5), the
distribution of farmers remained the same. However due to some leasing in and leasing out, all

65
the farmers became operated landowners but all of them remained marginal in size (Tables 3.6
& 3.7).
The average owned land among non-members was 2 acres with 83% marginal and 17% semi-
medium. Due to some leasing in and leasing out, average operated land was of the order of 2.3
acres with 67% operators being marginal scale, 23% small and 8% semi-medium. The latter
8% farmers accounted for 21% of the operated area. Interestingly there was no farmer in the
category of medium or large farmer in terms of ownership and operation of land.
Table 3.5: Average Owned and Operated Land of Milk PC Members and Non-
Members
Farmer category>
Average land (Acres)
Members Non- Members
Owned Land 1.33 2.04
Operated Land 1.43 2.29
Table 3.6: Distribution of Milk PC member and non-member farmers by Owned Land
Farmer
category>
Members Non- Members
Parameter>
Land
category
Farmer
s (No.)
% in total Land
(Acres)
% in
total
Farmer
s (No.)
% in
total
Land
(Acres)
% in
total
Marginal 10 100 13.37 100 10 83.33 12.75 52.04
Small 0 0 0 0 0 0 0 0
Semi-
medium
0 0 0 0 2 16.67 11.75 47.96
Total 10 100 13.37 100 12 100.0
0
24.5 100.00
Table 3.7: Distribution of Milk PC members and non-members by Operated Land
Farmers> Members Non- Members
Parameter>
Land
category
Farmers
(No.)
% in
total
Land
(Acres)
% in
total
Farmers
(No.)
% in
total
Land
(Acres)
% in total
Marginal 10 100 14.37 100 8 66.67 10.62 39.72
Small 0 0 0 0 3 25.00 10.62 39.72
Semi-
medium
0 0 0 0 1 8.33 5.5 20.57
Total 10 100 14.37 100 12 100.00 26.74 100.00
Most of the members (90%) had buffaloes, and 40% and 30% each respectively had cows and
goats with average holding of two buffaloes and one cow or goat each. In fact, buffaloes
accounted for 70% of livestock and cows and goats 1% and 13% each respectively (Table 3.8).
Non -member farmers had large livestock holdings of four buffaloes or cows each and three
goats. But buffaloes accounted for only 50% of total livestock and cows and goats 45% and
5% each respectively, all farmers had buffaloes and most had cows but only 15% had goats.

66
Table 3.8: Distribution of Milk PC member and non-member farmers by livestock
Owned
Farmer
category> Members
Non-Members
Parameter>
Livestock
Farme
rs
No. of
animals
Average
Animals
% Total
Animals
Farmers No. of
animals
Average
Animals
% Total
Animals
Buffalo 9 21 2.33 70.00 12 47 3.92 50.00
Cow 4 5 1.25 16.67 11 42 3.82 44.68
Goat 3 4 1.33 13.33 2 5 2.50 5.32
Total 30 94
Most of the member farmers still depended on dealers for buying seeds of various crops or used
home based seeds. Only in case of fodder 17% farmers reported buying seeds from the PC
(Table 3.9). About 43% farmers reported PACS as a source of chemical fertilizers and 33% of
those who used chemical pesticides reported the PACs as the main source (Table 3.10). Only
one member bought biofertilisers from a dealer and others and non-members did not use it.
Similarly, in case of biopesticides, only 3 non-members bought them with two buying from
dealer and one from the PACS.
Cattle feed was reported be bought from PC by 90% member farmers as it was door delivered
and had better quality, lower price, available in time, and no other reliable source. On the other
hand, only 17% non-members reported buying from PC/DCS and others (33%) buying from
dealers and 25% not using it at all. Some others (17%) bought it from other FPOs and 8% from
both dealers and DCS. So far as purchase of various crop seeds was concerned, non-members
were mostly dependent on dealers and in some cases PACS. Only in case of barley and guar,
they reported buying seeds from milk PC in 20% cases were reasons of better quality (Table
3.9). Most of the other inputs were also largely bought from dealers with only 36% reporting
exclusive purchase of chemical fertilisers from PACS (Table 3.10). Only in the case of cattle
feed 23% farmers reported buying from the PC because of better quality and timely availability
with other important sources besides dealer being other cooperatives like PACS and farmer
groups.
Table 3.9: Distribution of Milk PC member and non-member farmers by Source of
Seeds
Farmer category> Members Non-members Parameter>
Source
No. of
farmers
% of total No. of
farmers
% of total
Dealers 5 50 9 75.00
Dealers, PACS 1 10 1 8.33
PACS, PC 0 0 1 8.33
PACS, Other FGs 0 0 1 8.33
PC 1 10 0 0.00
Dealers, PACS, PC 1 10 0 0.00
Total 10 100 12 100.00

67
Table 3.10: Distribution of Milk PC member and non-member farmers by Source of
Chemical Inputs
Type of
Agrochemical>
Fertilizer Pesticide
Farmer
category>
Members Non-members Members Non-members
Parameter>
Source
No. of
Farmer
s
% of
total
No. of
Farmers
% of
total
No. of
Farmers
% of
total
No. of
Farmers
% of
total
Dealer 4 40 4 33.33 2 20 9 75.00
PACS 3 30 4 33.33 0
Dealers, PACS 0 3 25.00 1 10 0
None 3 30 1 8.33 7 70 3 25.00
Total 10 100 12 100.0
0
10 100 12 100.0
0
The cropping intensity of member farmers was 1.89 and the major crops grown in kharif
included bajra groundnut and cluster beans and those in Rabi included wheat, mustard and
barley besides vegetables and bajra in summer. Overall, wheat, bajra, Barley, groundnut,
cluster beans and mustard accounted for 93% of the gross crop area. 90% of the farmers had
electric motor based tube wells.
The cropping intensity of non-members was 2.00. Major crops grown in Kharif by members
and non-members were bajra, groundnut and guar. In Rabi, wheat, barley, mustard and fodder
and in summer season it was mostly bajra or vegetables ad fodder (Tables 3.11-3.13). In
general, wheat and bajra accounted for 15% each of the gross cropped area for members and
non-members followed by barley (10%), groundnut (12%), guar (6%) and mustard (6%), and
in case of non-members, fodder (3%). All the farmers had groundwater based tube wells run
with electric motors.
Table 3.11: Kharif Cropping Pattern of Milk PC members and non- members (acres)
Category> Members Non-Members
Parameter>
Crops
Farm
ers
Croppe
d area
Avg
croppe
d area
%
Khari
f
Area
%
Total
Area
Farm
ers
Croppe
d area
Avg
croppe
d area
%
Khari
f
Area
%
Total
Area
Bajra 6 4.43 0.74 33.16 16.33 8 7.625 0.95 30.51 14.2
9
Groundnut 3 3.5 1.17 26.20 12.91 5 6.87 1.37 27.49 12.8
8
Guar 4 1.68 0.42 12.57 6.19 3 3 1.00 12.00 5.62
Bajra, Gnut,
Guar
1 2 2.00 14.97 7.37 3 5.5 1.83 22.01 10.3
1
Bajra,
Vegetables
0
0.00 1 2 2.00 8.00 3.75
Barley 1 0.5 0.50 3.74 1.84 0
Bajra, Gnut,
Guar, Sesame
1 1.25 1.25 9.36 4.61 0
Total 16 13.36 100 49.26 2
0
24.99 100 46.8
4

68
Table3.12: Rabi Cropping Pattern for Milk PC members and non- members (in acres)
Farmer
category>
Members Non-Members
Parameter>
Crops
Far
mers
Crop
ped
area
Avg
cropped
area
%
Rabi
Area
%
Total
Area
Far
mer
s
Cropp
ed
area
Avg
cropp
ed
area
%
Rabi
Area
%
Total
Area
Barley 4 2.65 0.66 20.17 9.77 5 5.25 1.05 20.20 9.84
Fodder 2 0.25 0.13 1.90 0.92 4 1.87 0.47 7.20 3.51
Mustard 3 1.62 0.54 12.33 5.97 2 1.12 0.56 4.31 2.10
Wheat 7 5.37 0.77 40.87 19.80 8 7.5 0.94 28.86 14.06
Barley,
Mustard
0 0 0 0 0.00 1 2.75 2.75 10.58 5.15
Barley,
Mustard,
Wheat
2 3.25 1.63 24.73 11.98 1 2 2.00 7.70 3.75
Wheat,
Methi
0 0 0 0 0 1 1 1.00 3.85 1.87
Wheat,
Mustard
0 0 0 0 0 1 2 2.00 7.70 3.75
Wheat,
Mustard,
Onion
0 0 0 0 0 1 2.5 2.50 9.62 4.69
Total 13.1
4
100 48.45 25.99 100 48.72
Table 3.13: Summer Cropping Pattern for Milk PC members and non- members (in
acres)
Farmer category> Member Non-member
Parameter>
Crops
Farm
ers
Crop
ped
area
Avg
crop
ped
area
%
Sum
mer
Area
%
Total
Area
Farm
ers
Crop
ped
area
Avg
crop
ped
area
%
Sum
mer
Area
%
Total
Area
Fodder 0 0 0 0 0 2 2 1.00 84.39 3.75
Onion 0 0 0 0 0 1 0.37 0.37 15.61 0.69
Bajra 1 0.37 0.37 59.68 1.36 0 0 0 0 0
Vegetables 2 0.25 0.13 40.32 0.92 0 0 0 0 0
Total 3 0.62 0.20 100 2.29 3 2.37 0.79 100 4.44
Most of the members of the PC had received share certificates (90%). Only one member
reported the membership of another FPO which she joined in 2012. In majority cases, they had
become aware of various aspect of livestock and milk production through the PC or a
combination of PC and FPO and in other cases even friends and relatives besides formal
collective structures. 80% knew that the PCs belongs to the farmers. In 40% cases, it was PC
employees who made them join the PC. Another 10% were influenced by promoters, and PC
employees and others each and 30% by friends and other farmers.

69
All the farmers reported receiving dividends on their share capital and 80% didn’t have any
complaint against the functioning of the PC. They reported better satisfaction level on the
availability, quantity, cost, quality and accessibility of cattle feed, moving from good to very
good or excellent on most parameters after the intervention of the PC.
40% farmers also reported PC making them aware of various government schemes and 30%
about receiving special subsidy due to the PC. 80% attended the meetings every month and all
of them wanted to continue as members of the PC because of its responsiveness, transparency
and profitable interface besides quick payment and good service delivery. All of them also
wanted others to join the PC because they were getting good benefits including good price and
profits on their produce.
Before the PC intervention, all farmers sold milk either to other FPOs or did not sell at all.
There was 60% increase in buffalo milk sale because of the PC intervention though the price
came down more recently compared with the alternative channels of sale. Whereas only 60%
sold to the PC a few years ago, 100% started selling to it after a few years of it coming in. In
terms of channels, earlier they dealt with traditional cooperative and the PC and have since
moved over to PC completely. The member farmers reported a price increase of 13% over the
previous channel prices.
25% non-member farmers reported membership of another FPO which was the local milk
cooperative society (DCS of RCDF) and they had been the members of the same for last many
years. None of them reported receiving any information about agriculture or animal husbandry
from the PC and depended mostly on private companies, agri department office and the
combination of non-personal and personal extension sources. In fact, 83% of them were aware
of the milk PC and 42% reported that it was owned by farmers. A significant proportion of
them (25% of the total) had learnt about it from PC employees or promotors. Only 33% showed
interest in becoming the member of the milk PC. They were not members yet due to reasons
like location, presence of other channels and availability of other benefits from those sources
and the fact that some of them could not meet the quality standards of the PC.
33% non-members had no dislike for the services offered by the PC while others reported lack
of access or high-quality standard as the barrier. In general, they rated various aspects of input
service better after the coming in of the PC except availability and inadequate amount. 92% of
them had no bad experience with the PC and some of them even attended the meetings of the
PC. They expected doorstep procurement, improve access and other benefits for them to re-
stimulate to become members of the milk PC. There were significant increases in cow milk
production and marketed surplus even price appreciation besides faster payment after the
intervention of the PC. More of them had started supplying milk to the PC than was the case
earlier.
The above analysis of member profile shows that the milk PC members were really marginal
or landless land operators and livestock rearers. The PC made good impact on their livelihoods
with various interventions like input supply and milk procurement besides supply of fodder
seed and other services.

70
Table 3.14: Distribution of Milk PC member and non-member farmers by sales channel for milk
Channel
(members) Total Cooperative PC
Parameter>
Type of
Milk
Farmers Produce Farmers Produce Farmers Produce
Befo
re
Aft
er
%
Differen
ce
Befo
re
Aft
er
%
Differen
ce
Befo
re
Aft
er
%
differen
ce
Befo
re
Aft
er
%
differen
ce
Befo
re
Aft
er
%
differen
ce
Befo
re
Aft
er
%
differen
ce
Milk 5 8 60 70 91 30 1 0 -100 11 0 -100 4 8 100.00 59 91 54.24
Cow Milk 2 2 0 32 32 0 1 0 -100 12 0 -100 1 2 100.00 20 32 60.00
Buffalo
Milk
2 2 0 28 52 85.71 1 0 -100 24 0 -100 1 2 100.00 4 52 1200.0
0
Channel>
(non-member) Total Other FPO Wholesale
Parameter> Type of Milk
Farmers Produce Farmers Produce Farmers Produce
Befo
re
Aft
er
%
Differen
ce
Befo
re
Afte
r
%
Differen
ce
Befo
re
Aft
er
%
differen
ce
Befo
re
Afte
r
%
differen
ce
Befo
re
Aft
er
%
differen
ce
Befo
re
Aft
er
%
differen
ce
Milk 10 10 0 310.
5
305.
5
-1.61 7 6 -14.29 221.
5
197.
5
-10.84 3 4 33.33 89 108 21.35
Cow Milk 2 2 0 97.5 177.
5
82.05 1 2 100.00 57.5 177.
5
208.70 1 0 -100.00 40 0 -100.00
Buffalo Milk 1 1 0 40 40 0 0 1 0 0 40 0 1 0 -100.00 40 0 -100.00

71
3.3 Non-Milk PC member and non-member farmers: profile and impact
Of the total 41 member respondents across 4 PCs 24% were female. There were only 7%
illiterates and 17% each primary literate or graduate degree holders. The largest chunk (29%)
were middle standard literate and the rest higher secondary pass (Table 3.15). 95% reported
farming as the primary occupation and 5% petty business. 15% reported animal husbandry as
secondary occupation and most others rural nonfarm or farm skilled jobs with 49% being
dependent only on farming (Tables 3.16 & 3.17).
The average land ownership was 8.2 acres with 5% being landless and 24% each being small
or medium landowners and 29% semi medium farmers. Only 2% were in the large farmer
category. Due to the leasing in and leasing out by 15-20% farmers, the operated land was of
the order of 10.3 acres. Operationally, there were 1/3rd farmers in semi medium categories,
25% in medium categories and 7% were large farmers. On the other hand, marginal and small
farmers who were 34% of the total operated only 14% land whereas 7% large farmers operated
34% of the total land (Tables 3.18&3.19).
80% of the non-members were male and 24% illiterate. 90% were high school and 17% middle
standard and 12% graduates (Table 3.15). 88% of them reported farming as their primary
occupation. The others were mostly into some skilled non-farm occupation (Table 3.16). As
usual, animal husbandry emerged as the largest secondary occupation with 40% followed by
farming in case of another 12%, 52% did not report and secondary occupation (Table 3.17).
Average land ownership was 6 acres with 43% of the farmers being marginal of small and 58%
being semi-medium. Only 10% farmers were medium category. The average operated land did
not differ from average owned land. The distribution of operational holdings in various farmer
categories also remained the same. But marginal and small categories (43%) cultivated only
15% whereas medium category farmers who were only 10% of the total cultivated 24% with
61% of the land being cultivated by semi-medium farmers. Importantly, there were no large
farmers among non-member farmers (Tables 3.18 & 3.19).
Table 3.15: Distribution of Non-milk PC member and non-member farmers by
education
Farmer category> Members Non-members
Parameter>
Education
Farmers (No.) % in total Farmers (No.) % in total
Illiterate 3 7 10 24
Primary 7 17 2 5
Middle 12 29 7 17
High School 6 15 8 19
Higher Secondary 5 12 5 12
Under Grad 0 0 4 10
Graduate 7 17 5 12
Post Grad 1 3 1 2
Total 41 100 42 100

72
Table 3.16: Distribution of Non-milk PC member and non-member farmers by Primary
Occupation
Farmer category> Members Non-members
Parameter>
Primary Occupation
Farmers (No.) % in total Farmers (No.) % in total
Farming 39 95 37 88
Business 2 5 1 2
Skilled Labour 0 0 3 7
Student 0 0 1 2
Total 41 100 42 100
Table 3.17: Distribution of Non-milk PC member and non-member farmers by
Secondary Occupation
Farmer category> Members Non-members
Parameter>
Secondary Occupation
Farmers (No.) % in total Farmers (No.) % in total
Business 2 4.88 3 7.14
Animal Husbandry 6 14.63 6 14.29
Skilled Labour 9 21.95 4 9.52
Labourer 2 4.88 2 4.76
Farming 1 2.44 5 11.90
FPO 1 2.44 0 0.00
None 20 48.78 22 52.38
Total 41 100.00 42 100.00
Table 3.18: Distribution of non-milk PC member and non-member farmers by Land
owned
Farmer
category>
Members Non- Members
Parameter>
Land
category
Farmers
(No.)
% in
total
Land
(Acres)
% in
total
Farmers
(No.)
% in
total
Land
(Acres)
% in
total
Marginal 8 19.51 8.025 2.38 10 23.81 11.3 4.49
Small 10 24.39 37.84 11.22 8 19.05 26.7 10.60
Semi-M 12 29.27 88.31 26.19 20 47.62 153.3 60.88
Medium 10 24.39 167.29 49.62 4 9.52 60.5 24.03
Large 1 2.44 35.71 10.59 0 0 0 00
Total 41 100 337.17 100.00 42 100 251.8 100.00

73
Table 3.19: Distribution of Non -milk PC member and non-member farmers by Land
operated
Farmer
category>
Members Non- Members
Parameter>
Land
category
Farmers
(No.)
% in
total
Land
(Acres)
% in
total
Farmers
(No.)
% in
total
Land
(Acres)
% in
total
Marginal 8 19.51 9.425 2 10 23.81 10.1 4.03
Small 6 14.63 20.42 5 8 19.05 26.7 10.65
Semi-M 14 34.15 106.26 25 20 47.62 153.3 61.17
Medium 10 24.39 142.54 34 4 9.52 60.5 24.14
Large 3 7.32 143.57 34 0 0 0 0
Total 41 100 422.21 100 42 100 250.6 100
88% PC members had electric tube well connections and 5% diesel engine based with 7% no
source of irrigation as compared with 98% non-members having electric tube wells and only
2% non-members not having irrigation.
Table 3.20: Distribution of non-milk PC member and non-member farmers by
Livestock Owned
Farmer
category>
Members Non-Members
Parameter>
Type of
livestock
Farmers
(No.)
% in
total
Animals
(No.)
%
in
total
Average Farmers
(No.)
% in
total
Animals
(no and
% of
total)
Average
Cow 28 68.29 88 35 3.14 26 61.90 63 34 2.42
Buffalo 30 73.17 83 33 2.77 30 71.43 74 39 2.47
Sheep 2 4.88 4 2 2.00 0 0.00 0 0 0
Goat 16 39.02 80 31 5.00 15 35.71 51 27 3.40
Total 41 100 255 100 42 100 188 100
68% and 73% of the members had cows and buffaloes respectively, with 40% having goat and
5% sheep. Cows and Buffaloes were 35% and 33% of the member livestock with 31% being
goats. The average number of large livestock was 3 cows and /or buffaloes per household and
5 goats and two sheep per household (Table 3.20).
Among the non-members, 62% and 71% had cows and buffaloes respectively and 36% had
goats. Cows and buffaloes were 34% and 39% of the total livestock of non-members and goats
accounted for 27%. Average ownership per household was 2 cows or buffaloes and 3 goats.
No non-member owned any sheep.

74
Member mostly bought chemical fertilisers form PACS (22%), PC (10%) and dealers (7%). In
fact, more of non-members bought more from PC (29%) followed by dealers (33%) and PACS
16%. In chemical pesticides, 51% members from PC and 20% from dealers and very few from
PACS and combination of PC and Dealers. As against this, non-members mostly bought from
dealers (48%) and from PC (23%). 12% members used biofertilser and bought it from PC and
only 2% non-members did so but in biopesticide, it was 12% members and 14% non-members
using it and buying from PC and 10% non-members buying it from dealers (Table 3.21).
Table 3.21: Distribution of non-milk PC member and non-member farmers by Source
of Chemical Inputs
Type of
Agrochemical>
Fertilizer Pesticide
Farmer category> Members Non-members Members Non-members
Parameter>
Source Farmer
s (No.)
% in total Farmer
s (No.)
% in
total
Farmers
(No.)
% in
total
Farmers
(No.)
% in
total
Dealers 3 7.32 14 33.33 8 19.51 20 47.62
PACS/DCS 9 21.95 7 16.67 2 4.88
PC 4 9.76 12 28.57 21 51.22 10 23.81
Dealers &
PACS/DCS
1 2.44 0 0 0 0 0 0
Dealers & PC 1 2.44 0 0 1 2.44 00 0
Total 18 43.90 33 78.57 32 78.05 30 71.43
The members cultivated large acreage on an average in each season except summer that that
by non-members (Table 3.22). The cropping intensity was 1.7 and major crops grown in Kharif
included bajra (25%of kharif area), guar (24%), oilseeds (11%), moong (9%) and paddy (9%)
in that order. Tomato accounted for 5% of the gross cropped area in Kharif. In Rabi, the major
crops were wheat (42%), mustard (23%), gram (14%), and onion (11%). The only crop grown
in summer in very small way were Vegetables (Table 3.23, 3.24 and 3.25).
For non-members, average cropping intensity was 1.68 and major crops grown in Kharif
included bajra, guar, moong and paddy. In Rabi, major crops were wheat, gram, onion,
mustard, and isabgul. Vegetables were the only set of crops cultivated in summer and they also
accounted for 5% each of the Kharif and Rabi area. In general, Wheat accounted for 27% of
the gross cropped area followed by bajra at 22%, guar and Mung at 7% and Vegetables 6%.
(Tables 3.23, 3.24 and 3.25).
93% of the farmers were not the members of any other FPO and majority of them accessed
information from friends and neighbours. Only 7% reported seeking it from the PC and 19%
from a combination of Pc, Dealers and other shopkeepers.
51% of members had received share certificates but none of them had ever received dividend
on their share capital. 34% members also happened to be members of other FPOs mostly
cooperatives and in some cases, self-help groups. They had mostly received information on
agricultural activities from the PC, other cooperatives and the agricultural department besides
1/3rd relying only on friends and neighbours and others on distant media like radio or mobile
phone. Only 15% reported getting it from the PC. Only 37% were aware that the PC was owned
by farmer members with other reporting promoting NGO, PC employees, government as the
owners with 29% not being aware at all. In 42% cases each, PC promoters or PC employees
had persuaded them to become members of the PC.

75
Input purchase
21% of the member farmers bought bajra seeds, 28% other cereals, 40% fodder seeds, 35%
guar Seeds, 14% isabgul seeds and moong seeds, 20% mustard seeds, and 43% onion seeds
from the PC for reasons of easy availability, better quality, and lower price besides the fact
that as members they had to buy from CP as reported by 32% of the members who bought from
the PCs. On the other hand, PCs had major role in chemical fertiliser and bio-pesticides where
36% and 55% of the farmers respectively bought chemical fertilisers and bio-pesticides from
the PC. 33% reported buying chemical pesticides from the PC for reasons of better quality,
easy availability, lower price and timely availability while 45% bought it from PC as it was an
obligation as being members. Easy access along with lower cost was major factor for 60% of
those who bought biopesticides from the PCs while in biofertilisers, it was more about better
quality and lower cost and easy access in that order or a combination thereof (Table 3.21A).
In 25% cases, where agricultural machines were used on rental basis by farmers, PC was the
source of that due to the timely availability.
Table 3.21A: Type of Input wise Reasons for purchase of inputs from PC by members
Reasons Seeds Chemical fertilisers
Chemical pesticides
Biofertilizers Biopesticides
Seeds Number Percentage No. % of
total No. % of
total No. % of
total No. % of
total
Better Quality 12 30.00 4 16.0 2 9.0 2 40.0 1 20.0
Better Quality, Lower Price 1 2.50
1 4.6 1 20.0
Compulsory to buy 13 32.50 10 40.0 10 45.6 1 20.0
Easy Accessibility, Lower Cost 6 15.00
4 16.0 4 18.1 1 20.0 3 60.0
Easy Accessibility, Lower Cost and membership 0
1 4.0 1 4.6 0
Easy Accessibility, Lower Cost, Better Quality 2 5.00
1 4.0 1 4.6 1 20.0 0
Fair Deal, More Reliable, Timely Availability, Easy Accessibility, Lower Cost 1 2.50
1 4.0 1 4.6 0 0
Other Benefits 1 2.50 1 4.0 1 4.6 0 0
Lower Price 4 10.00 3 12.0 1 4.6 0 0
Total 40 100.00 25 100 22 100 5 100 5 100
In general, non-member farmers reported an improvement on various parameters of input
supply after the intervention of the PC where it moved from good to very good. They were
keen to join the PC as a member provided it supply good quality inputs at lower price and made
them aware about it services. On the output side, there is no changes reported by the non-
members in terms of the effect of the producer company.

76
Most of the farmers (85%) did not have any dislike for the PC services but 8% were unhappy
about procurement, price realisation and payment aspects of the transaction. The input services
provided by the PC were rated improved after the PC intervention from good to very good. On
the other hand, no farmer reported any improvement on the output side of their transactions.
71% also did not report receiving any information about government subsidy and schemes and
88% did not receive any special benefit being members of the PC. 74% reported that meetings
of the company were held monthly and quarterly and 56% attended that every time with others
occasionally or sometimes and 15% never attending them. They still wanted to continue as
members of the PC due to supply of the inputs especially seeds, benefit of transacting with the
PC, and price benefits. 98% of them also wanted to encourage others to become members
because it is profitable to be member of the PC.
Table 3.22: Season wise Average Cropped Area (acres) for non-milk PC members and
non- members
Category>
Season Members Non-Members Kharif 8.8 5.29
Rabi 8.77 4.64
Summer 0.04 0.1
Table 3.23: Kharif Cropping Pattern of non-milk PC members and non- members
Category> Members Non-Members
Parameter>
Crop
Cropped
area
(acres)
% Kharif
Area
% Total
Area
Cropped
area (acres)
% Kharif
Area
% Total
Area
Bajra 92.67 25.68 12.83 92.67 41.64 21.97
Fodder 21.28 5.90 2.95 4 1.80 0.95
Guar 50.06 13.87 6.93 30.4 13.66 7.21
Moong 30.96 8.58 4.29 29 13.03 6.87
Oilseeds 38.05 10.54 5.27 12.91 5.80 3.06
Other Cereals 23.49 6.51 3.25 9 4.04 2.13
Onion 1.43 0.40 0.20 0 0 0
Pulses 6.88 1.91 0.95 0 0 0
Tomato 17.61 4.88 2.44 0 0 0
Paddy 31.6 8.76 4.38 17.81 8.00 4.22
Urad 27.5 7.62 3.81 15 6.74 3.56
Vegetables 19.38 5.37 2.68 11.76 5.28 2.79
Total 360.91 100 49.97 222.55 100.00 52.75

77
Table 3.24: Rabi Cropping Pattern of non-milk PC members and non- members
Category> Members Non-Members
Parameter>
Crop
Cropped
area (In
acres)
% Rabi
Area
% Total
Area
Cropped
area
(acres)
% Rabi
Area
% Total
Area
Fodder 4 1.11 0.55 4.03 2.07 0.96
Gram 50.21 13.96 6.95 17.05 8.75 4.04
Isabgul 5.2 1.45 0.72 13.1 6.72 3.11
Mustard 81.76 22.73 11.32 13.9 7.13 3.29
Onion 37.91 10.54 5.25 16.5 8.46 3.91
Other Cereals 8.56 2.38 1.19 4.4 2.26 1.04
Vegetables 22.43 6.24 3.11 10.44 5.35 2.47
Wheat 148.15 41.19 20.51 113.54 58.24 26.91
Fruit 1 0.28 0.14 0 0 0
Tomato 0.47 0.13 0.07 0 0 0
Total 359.69 100 49.80 194.96 100.00 46.21
Table 3.25: Summer Cropping Pattern of non-milk PC members and non- members
Category> Members Non-Members
Parameter>
Crop
Cropped
area in
acres
%
Summer
Area
% Total
Area
Cropped
area in
acres
%
Summer
Area
% Total
Area
Vegetables 1.65 100 0.23 4.35 100 1.03
Total 1.65 100 0.23 4.35 100 1.03
The area under moong, and paddy has increased significantly after the PC intervention with
yields being reported significantly high in case of paddy. However, there was hardly any
improvement on the total production, market surplus with only transaction cost coming down
in soybean, wheat, mustard and price realised in onion and maize besides wheat significantly.
The time to receive the payment had also come down significantly in soybean, tomato and
paddy.
The Kharif crops of bajra, guar, paddy and moong which were grown by significant proportion
had 30% of the total area under urad followed by bajra at 22%. Similarly, in Rabi, wheat was
grown by 40% by the farmers followed by mustard by 20%, onion by 17%, gram by 17% had
50% of the area under wheat and 25% mustard. Overall, it was wheat, urad, bajra, mustard
which accounted for more than 60% of the GCA. Two major crops which were handled by PC
in comparison with the past included mustard, and wheat.
In case of non-members, the crops grown by more than 10% of the farmers included bajra,
guar, moong, paddy and urad in Kharif and wheat, mustard, barley and onion in Rabi. In Kharif,
bajra was the major crop followed by moong, guar and paddy besides urad and in Rabi, it was
wheat followed by onion, isabgul, barley and mustard, and gram in that order. Overall, wheat
and bajra accounted for 47% of the GCA and guar and onion and moong 7% each. The other
crops shared ranged between 2-5%.

78
50% of the non-members were aware of the presence of PC in their area but 52% did not know
who owned it with the others reporting 10% each that it is owned by farmers, PC employees,
PC Board of Directors and farmer groups. 14% and 10% learnt about the PC from its employees
and promoters respectively. 69% of them had never thought of becoming a member of this PC
for the reasons of not being aware. The others waiting for an invite from the PC or did not have
time for the same.
Output impact:
Three years before, only one farmer each reported selling to PC in case of sesame, soyabean,
and wheat. Only in mustard, sesame, soyabean, and urad one member farmer each in case of
ISAP PCs reported selling to PC and in wheat it was six farmers who sold to PC. Thus, 10%
farmers reported selling to PC and the number increased only in wheat by 600% after three
years mainly due to MSP procurement for SFAC. Among non-members, one farmer sold
moong to the PC. In case of IGS PCs, there were no farmer members or non-members selling
any produce to the PCs. Since thee was not much intervention by PCs on the output front,
average price realised compared with three years before was higher only in mustard and wheat
by 15-20% which was more about farmers being supported to get MSP through the PCs.
3.4 Promoter wise comparison
The IGS has promoted 12 PCs out of which eight are functional. In this area, there was no PC
before the intervention. Most of the failed PCs had to be shut down because either they could
not mobilise share capital or had no business plan. One of the PCs in Sikar dealing with
vegetable was struck off by the RoC for failure to comply with the requirement. The promoter
also had five PCs under the NFSM programme in Rajasthan.
The ISAP which is a POPI of NABARD had set up 11 PCs in the state of which only three
were functioning. Under the OCPF (funded by a Morocco based Foundation) project, all sic
PCs were functional, but the project ended in 2019.
Whereas 48% of ISAP PC members were women, it was all men in case of IGS PCs. In both
cases, major occupation for almost all members was farming with only 2 members (10%) in
case of ISAP being non-fam workers in business and skilled labour work. But, IGS PC
members were somewhat more literate in terms of level of education (Table 3.26). The
secondary occupation was not there in case of 45-52% of IGS and ISAP members but other
secondary occupations included animal husbandry and skilled labour (Table 3.27). Average
years of schooling of IGS and ISAP farmer did not differ much being 8. 45 and 9.33 years
respectively.
The IGS PC members were relatively larger land owners with none of them being marginal
and only 20% being small owners compared with 57% of ISAP PC members being small or
marginal (Table 3.28) and 47% by operated land holders as against only 15% of IGS PC
members (Table 3.29). The average cultivated area of IGS PC members was higher across all
seasons and average cropping intensity was lower than ISAP PC members. Average owned
land was only 5.84 acres for ISAP farmers while it was 11.02 acres for IGS farmers. However,
operated land was less divergent between the two with ISAP farmers having 9.31 aces and IGS
members 11.8 acres.

79
Table 3.26: Distribution of ISAP and IGS members by Education
Category> ISAP IGS
Parameter>
Education
Members (No.) % in total Members (No.) % in total
Illiterate 1 4.76 2 10
Primary (1-4) 3 14.29 4 20
Middle (5-8) 8 38.1 4 20
High (9-10) 2 9.52 4 20
HS (11-12) 2 9.52 3 15
Undergraduate 1 4.76 0 0
Graduate 3 14.29 3 15
Others (Postgraduate) 1 4.76 0 0
Total 21 100 20 100.00
Table 3.27: Distribution of ISAP and IGS members by Secondary Occupation
Category> ISAP IGS
Parameter>
Secondary Occupation
Members (No.) % in total Members (No.) % in total
Animal Husbandry 2 9.52 4 20
Skilled Labour 6 28.57 6 30
Agriculture 1 4.76 0 0
Business 1 4.76 1 5
None 11 52.38 9 45
Total 21 100 20 100.00
Table 3.28: Distribution of ISAP and IGS members by Owned Land
Category> ISAP IGS
Parameter>
Land Category
Members (No.) % in total Members (No.) % in total
Landless 2 9.52 0 0
Marginal 6 28.57 0 0
Small 6 28.57 4 20
Semi-Medium 4 19.05 8 40
Medium 3 14.29 6 30
Large 0 0 2 10
Total 21 100 20 100
The livestock ownership of the two PC members was very different with ISAP PC members
having mostly buffalo (57%) and cows (52%) and 10% also both cows and buffaloes (Table
3.30). Further, 15% had no livestock. But IGS PC members had more of cows (68%) and
buffaloes (43%) and even goat (55%) and both buffalo and goat (10%).
Table 3.29: Distribution of ISAP and IGS members by Operated Land
Category> ISAP IGS Parameter>
Land Category
Members
(No.)
% in
total
Area in
Acres
% in
total
Members
(No.)
% in
total
Area in
Acres
% in
total
Landless 1 4.76 0 0 0 0 0 0
Marginal 7 33.33 9.425 5.06 0 0 0 0
Small 3 14.29 11.4 6.12 3 15 9.03 4
Semi-Medium 5 23.81 34.375 18.46 9 45 71.89 30
Medium 3 14.29 46 24.7 7 35 96.54 41
Large 2 9.52 85 45.65 1 5 58.57 25

80
Table 3.30: Distribution of ISAP and IGS member farmers by livestock owned
Promoter> ISAP IGS
Parameter>
Type of
Livestock
Member
s
%
Member
s
No. of
Animal
s
% Total
Animal
s
Average
Animals
/
Member
Member
s
%
Member
s
No. of
Animal
s
% Total
Animal
s
Average
Animals
/
Member
Buffalo 12 57.14 40 50.00 3.33 18 90.00 43 19.03 2.39
Cow 11 52.38 20 25.00 1.82 17 85.00 68 30.09 4.00
Goat 5 23.81 16 20.00 3.20 11 55.00 64 28.32 5.82
Oxen 1 4.76 1 1.25 1.00 1 5.00 1 0.44 1.00
Sheep 1 4.76 3 3.75 3.00 1 5.00 50 22.12 50.00
Total 80 226
The average cropped area of IGS farmers was higher across seasons of Kharif and Rabi (10
and 9 acres) as against 7.6 and 8.5 acres in case of ISAP famers except in summer. Therefore,
average cropping intensity for ISAP farmers was 1.82 and in case of IGS farmers 1.62. There
was only a minor difference in terms of source of irrigation of the two promoters’ farmers and
sources of energy for extracting water (table3.31&3.32).
Table 3.31: Distribution of ISAP and IGS member farmers by source of irrigation
Category> ISAP IGS
Parameter>
Source
Members (No.) % in total Members (No.) % in total
Tube well 10 47.62 9 45
Well 3 14.29 4 20
Well & Tube well 7 33.33 5 25
None 1 4.76 2 10
Table 3.32: Distribution of ISAP and IGS PC farmers by source of energy for irrigation
Category> ISAP IGS
Parameter>
Source
Members (No.) % in total Members (No.) % in total
Electric Motor 18 85.71 18 90
Diesel Engine 2 9.52 0 0
None 1 4.76 2 10
The cropping patterns differed significantly with IGS farmers more into bajra, vegetables and
gram and ISAP farmers growing more acreage under paddy, sesame, maize soybeans and urad
and tomato in kharif. In rabi, it was wheat and mustard for ISAP and wheat gram and onion for
IGS farmers. Vegetables were more common among ISAP farmers compared with IGS farmers
(Table 3.33 and 3.34) In summer, only some vegetables were grown by a few farmers in a small
area in both promoter PC members.

81
Table 3.33: Kharif cropping pattern of ISAP and IGS PC member farmers
Category> ISAP Members IGS Members
Parameter>
Crops
Area (in
acres)
% Kharif
Area
% Total
Area
Area %
Kharif
Area
%
Total
Area
Bajra 11.67 7.29 3.44 81 40.33 21.16
Fodder 0.63 0.39 0.19 20.66 10.29 5.40
Maize 17.77 11.1 5.24 0 0 0
Chilly 7.61 4.75 2.24 0 0 0
Oilseeds 1.21 0.76 0.36 0 0 0
Other Cereals 5.73 3.58 1.69 0 0 0
Paddy 31.6 19.74 9.31 0 0 0
Pulses 6.72 4.2 1.98 5 2.49 1.31
Sesame 11.44 7.15 3.37 0 0 0
Soyabean 17.4 10.87 5.13 0 0 0
Tomato 17.61 11 5.19 0 0 0
Urad 27.5 17.18 8.10 0 0 0
Vegetables 3.2 2 0.94 50.35 25.07 13.15
Groundnut 0 0 0 8 3.98 2.09
Onion 0 0 0 1.43 0.71 0.37
Gram 0 0 0 34.4 17.13 8.99
Total 160.09 100 47.16 200.84 100 52.46
43% of ISAP farmers were members of other FPOs compared with only 20% in case of IGS
and that was mainly co-ops and SHGs whereas it was only Co-ops in case of IGS. ISAP
farmers had more reliance on PC/FPO for extension than in case of IGS farmers who relied
more on traditional sources like govt. dept or FPOs (Table 3.35). More of ISAP members knew
that farmers owned the PC (43%) compared with IGS farmers (30%) (Table 3.36). In case of
one PC of ASAP, it was claimed by employees and promoters that 70% members knew that
PC belonged to farmer members, but our survey showed only 30% were aware.
Also, more of the PC employees (15%) and promoters were the source (10%) for info on PC
while in case of IGS, promoters (20%) and govt. agency (15%) were major source (Table 3.37).
In both ISAP and IGS, promoters, and PC employees (90% and 75% respectively) and friends
and other farmers influenced the farmers (10% and 15%) to become members of the PC (Table
3.37).

82
Table 3.34: Rabi crop pattern among ISAP and IGS PC member farmers
Category> ISAP Members IGS Members
Parameter>
Crop
Area % Rabi
Area
% Total
Area
Area % Rabi
Area
% Total
Area
Fodder 0.63 0.35 0.19 3.37 1.86 0.88
Fruits 1 0.56 0.29 0 0 0
Chilli 0.47 0.26 0.14 0 0 0
Mustard 66.18 37.16 19.50 15.58 8.58 04.07
Other Cereals 2.35 1.32 0.69 0 0 0
Tomato 0.47 0.26 0.14 0 0 0
Vegetables 10.8 6.07 3.18 0.4 0.22 0.10
Wheat 96.19 54.02 28.34 51.96 28.61 13.57
Fenugreek 0 0 0 14.1 7.76 3.68
Onion 0 0 0 34.57 19.04 9.03
Gram 0 0 0 47.86 26.35 12.50
Barley 0 0 0 8.56 4.71 2.24
Isabagol 0 0 0 5.2 2.86 1.36
Total 178.09 100 52.47 181.6 100.00 47.43
Table 3.35: Distribution of ISAP and IGS PC member farmers by source of general
agricultural knowledge
Promoter> ISAP IGS
Parameter>
Source
Members
(No.)
% in total Members
(No.)
% in
total
Friends/Neighbours/Relatives 8 38.10 8 40
Friends/Neighbours/Relatives & PC/FPO 1 4.76 0 0
Friends/Neighbours/Relatives, PC/FPO &
Extension workers
1 4.76 0 0
Friends/Neighbours/Relatives & Extension
workers
1 4.76 0 0
Agriculture Department Office, PC/FPO &
Mobile/Mobile groups
1 4.76 0 0
Agriculture Department Office, PC/FPO 2 9.52 6 30
Others (Dealers) 1 4.76 0 0
Newspapers/Radio & Mobile/Mobile groups 1 4.76 0 0
PC/FPO 5 23.81 1 5
Agriculture Department Office 0 0 2 10
Others (KVK) 0 0 1 5
Newspapers/Radio 0 0 2 10
Total 21 100.00 20 100
About 10% members in both promoters’ PCs did not like the working of the PCs as they could
not procure or offered lower price or delayed payments. Only 20-24% acknowledge PC helping
them with information or subsidy or availing of any government schemes. 15% of ISAP PCs
reported special subsidy for PC members as against nil in case of IGS PCs. ISAP PC meeting
frequency (more of monthly meetings) and participation of members in them (76%) was in
general higher than in case of IGS PCs (40% and 45% respectively). All members of all PCs

83
of both promoters wanted to continue as members due to seed supply, profits, and price
benefits. All of them in ISAP PCS were keen to encourage others and in IGS with the exception
of one member (out of 20) for the same reasons as those for continuing as members.
Table 3.36: Distribution of ISAP and IGS member farmers by knowledge of PC owner
Promoter> ISAP IGS
Parameter>
Owner
Members
(No.)
% in total Members
(No.)
% in total
PC Employees 3 14.29 1 5
Promoting agency 2 9.52 4 20
BOD 1 4.76 0 0
Farmers 9 42.86 6 30
Government 0 0 3 15
Don’t know 6 28.57 6 30
Total 21 100.00 20 100
Table 3.37: Distribution of ISAP and IGS PC member farmers by influencer for
Membership
Promoter> ISAP IGS
Parameter>
Influencer
Members
(No.)
% in total Members
(No.)
% in total
PC Promoters 9 42.86 8 40
PC Employees 10 47.62 7 35
Friends/ Neighbours/ Relatives 2 9.52 3 15
PC Promoters & PC Employees 0 0 1 5
PC Employees & Friends/
Neighbours/ Relatives
0 0 1 5
Total 21 100.00 20 100
3.5 Within Promoter PC comparison
This section compares and contrasts two PCs by the same promoter in terms of their member
profile and member interface besides member engagement in PCs.
3.51 ISAP PCs
All the member farmer respondents of Shridev PC were female while all members farmers in
the case of Khandar PC were male. Member farmers with education upto middle school were
higher for Shridev PC (70%) than that in case of Khandar PC (64%). Educational profile of
Khandar PC members (55% with high school or above) was higher than that of Shridev PC
(30%). (Table 3.38)
All Khandar PC members had agriculture as primary occupation while in case of Shridev PC
members, 80% had agriculture as secondary occupation and 20% had business as primary
occupation. Most of the Khandar PC members (73%) did not have any secondary occupation
while only 30% Shridev PC members didn’t have any secondary occupation. 10% and 18% of
member farmers of Shridev and Khandar respectively were involved in animal husbandry.
Skilled labour was an important secondary occupation for Shridev PC (30%) as compared to
Khandar PC (9%). Similarly, business was also an important secondary occupation for Shridev

84
PC with 20% member farmers involved in it and no member farmer of Khandar PC was
reported to be engaged in it. (Table 3.39)
Table 3.38: Distribution of ISAP PC members by Education
PC Shridev Khandar
Parameter >
Education No of Farmers % of total No of Farmers % of total
Illiterate 1 10.00 0 0
Primary 1 10.00 2 18.18
Middle 5 50.00 3 27.27
High School 0 0 2 18.18
Higher Secondary 1 10.00 1 9.09
Undergrad 0 0.00 1 9.09
Graduate 1 10.00 2 18.18
PG 1 10.00 0 0
Total 10 100.00 11 100.00
Table 3.39: Distribution of ISAP PC members by Secondary Occupation
PC Shridev Khandar
Parameter >
Secondary Occupation
No of Farmers % of total No of Farmers % of total
Agriculture 1 10.00 0 0
Animal Husbandry 1 10.00 2 18.18
Skilled Labour 3 30.00 1 9.09
Business 2 20.00 0.00
None 3 30.00 8 72.73
Total 10 100.00 11 100.00
Both the average owned, and operated land was higher for Khandar PC members (7 & 14 acres)
than that in case of Shridev PC (3.5 & 3 acres). There was a huge difference in the number of
marginal landowners for Shridev PC (70%) and Khandar PC (9%). Landownership was also
highly different with marginal farmers of Shridev PC owned 21% of land against 1% land
owned by Khandar PC marginal farmers. Semi- medium farmers were in the range of 18-20%
in the number but the landownership was in the range of 9-22%. Majority of the Khandar PC
members were medium farmers owing 43% of the total land. Though, the number of large
farmers were in the range of only 10-18% for both PCs but the landownership was 47-57%,
largest for both PCs (Table 3.40).

85
Table 3.40: Distribution of ISAP PC members by Owned Land
PC Shridev Khandar
Parameter >
Land category
No of
Farmers
% of
total
Area in
Acres
% of
total
No of
Farmers
% of
total
Area in
Acres
% of
total
Marginal 7 70.00 7.4 21.14 1 9.09 0.62 0.76
Small 2 20.00 7.6 21.71 2 18.18 7.5 9.16
Semi-M 0 0 0 0 6 54.55 35 42.75
Medium 1 10.00 20 57.14 2 18.18 38.75 47.33
Total 10 100 35 100 11 100 81.87 100
In terms of operational handholding also, marginal farmers (70%) had 28% of land in case of
Shridev PC while it was 18% large farmers who had 55% of land in case of Khandar PC and
there were hardly any marginal or small farmers among the members (Table 3.41). Buffalo
(40%), cow (40%) and goat (30%) were three important animals owned by Shridev PC
members. Goats (41%) had the largest in number followed by buffalo (26%) and cow (21%).
In the case of Khandar PC members, buffalo and cows (73% and 64%) were more commonly
owned by farmers and accounted for 67% and 28% of the total livestock respectively (Table
3.42).
Table 3.41: Distribution of ISAP PC members by Operated Land
PC Shridev Khandar
Parameter>
Land
category
No of
Farmers
% of
total
Area in
Acres
% of
total
No of
Farmers
% of
total
Area in
Acres
% of
total
Marginal 7 70.00 8.8 28.21 1 9.09 0.625 0.40
Small 2 20.00 6.4 20.51 0 0 0 0
Semi-M 0 0 0 0 6 54.55 39.37 25.40
Medium 1 10.00 16 51.28 2 18.18 30 19.35
Large 0 0 0 0 2 18.18 85 54.84
Total 10 100 31.2 100 11 100 155 100
Table 3.42: Distribution of ISAP PC members by livestock Owned PC> Shridev Khandar
Parameter >
Livestock
No of
Farmers
% of
total
No of
Anim
als
% total
Animals
Ave
rage
No of
Farmer
s
% of
total
No of
Animal
s
% total
Animals
Ave
rage
Buffalo 4 40.00 9 26.47 2.25 8 72.7
3
31 67.39 3.88
Cow 4 40.00 7 20.59 1.75 7 63.6
4
13 28.26 1.86
Goat 3 30.00 14 41.18 4.67 2 18.1
8
2 4.35 1.00
Oxen 1 10.00 1 2.94 1.00 0 0 0 0 0
Sheep 1 10.00 3 8.82 3.00 0 0 0 0 0
Total 10 100 34 11 100 46
Friends/ neighbors/ relatives was the most important source of general agricultural information
for Shridev PC members with 50 % members using it as a source of information. In case of
Khandar PC, friends/ neighbors/ relatives and PC were equally important sources of
agricultural knowledge for 27% of the member farmers each (Table 3.43).

86
The cropping intensity was higher (1.94) for Shridev as they were small farmers than that of
the Khandar farmer members (1.77). Maize (70%), jowar (40%), black gram (30%) and
vegetables (30%) were major crops grown by member farmers of Shridev PC occupying 54%,
14%, 3% and 11% of the kharif area. In case of Khandar PC, paddy (55%), soybean (55%),
black gram (36%) and vegetables (36%) were major crops grown by member farmers
occupying 16%, 17%, 9% and 8% of the kharif area (Table 3.44).
Table 3.43: Distribution of ISAP PC members by source of general Agri knowledge
PC Shridev Khandar
Parameter >
Source
No of
Farmers
% of
total
No of
Farmers
% of
total
friends/ neighbours/ relatives 5 50.00 3 27.27
friends/ neighbours/ relatives, PC 1 10.00 0 0
friends/ neighbours/ relatives, PC, Extension
Workers 0 0 1 9.09
friends/ neighbours/ relatives, extension
workers 0 0 1 9.09
Newspapers/ Radio, Mobile groups 0 0 1 9.09
PC 2 20.00 3 27.27
PC, Mobile groups, Agri Dept 0 0 1 9.09
PC, Agri Dept 1 10.00 1 9.09
Dealers 1 10.00 0 0
Total 10 100 11 100
Wheat and vegetables were two major crops in the case of Shridev PC members grown by 70%
and 20% of member farmers, respectively. But, the acreage under vegetables was only 2.65%
of the rabi area. In case of Khandar PC, wheat (73%) and mustard (64%) were the major crops
grown by most of the farmers. Vegetable was another major crop grown by 18% of the Khandar
PC members with 4% of rabi area. Other crops were taken by 9-10 % of the member farmers
of both the PCs (Table 3.45). No member farmer of Shridev PC was growing any crop in
summer season while in case of Khandar PC, only 9% of member farmers growing vegetables
crops in summer season on just 1.25 acres.

87
Table 3.44: Kharif Cropping Pattern of ISAP PC members
PC Shridev Khandar
Parameter >
Crops
No of
Farmers
% of
total
Kharif
Area
%
kharif
Area
% total
area
Avg
Area
No of
Farmers
% of
total
Kharif Area
in Acres
%
kharif
Area
% total
area
Avg
Area
Bajra 0 0 0 0 0 0 2 18.18 1.56 1.20 0.57 0.78
Bajra, Sesame 0 0 0 0 0 0 1 9.09 2.18 1.68 0.79 2.18
Black gram 3 30 1 3.29 1.65 0.33 4 36.36 11.25 8.68 4.09 2.81
Fodder 0 0 0 0 0 0 1 9.09 0.625 0.48 0.23 0.63
Green Gram 1 10 0.4 1.32 0.66 0.40 0 0 0 0 0 0
Groundnut 0 0 0 0 0 0 1 9.09 0.31 0.24 0.11 0.31
Jowar 4 40 4.4 14.47 7.26 1.10 0 0 0 0 0 0
Maize 7 70 16.4 53.95 27.06 2.34 0 0 0 0 0 0
Maize, Gram, Soyabean 1 10 1.4 4.61 2.31 1.40 0 0 0 0 0 0
Maize, Groundnut, Gram 1 10 3.6 11.84 5.94 3.60 0 0 0 0 0 0
Paddy 0 0 0 0 0 0 6 54.55 21.25 16.39 7.73 3.54
Paddy, Gram, Sesame, Jowar 0 0 0 0 0 0 1 9.09 5.31 4.10 1.93 5.31
Paddy/Sesame/Soyabean/
Gram/ Bajra/Vegetables 0 0 0 0 0 0
1 9.09 50 38.56 18.20 50.00
Sesame, Gram 0 0 0 0 0 0 1 9.09 3.75 2.89 1.36 3.75
Soyabean 0 0 0 0 0 0 6 54.55 22.5 17.35 8.19 3.75
Vegetable 3 30.00 3.2 10.53 5.28 1.07 4 36.36 10.93 8.43 3.98 2.73
Total 10 30.4 100 50.17 11 129.66 100 47.19

88
Table 3.45: Rabi Cropping Pattern of ISAP PC members
PC Shridev Khandar
Parameter>
Crops
No of
Farmers
% of
total
Rabi
Area
% Rabi
Area
% total
area
Average
Area
No of
Farmers
% of
total
Rabi
Area
% Rabi
Area
% total
area
Average
Area
Banana 0 0 0 0 0 0 1 9.09 1 0.70 0.36 1.00
Fodder 0 0 0 0 0 0 1 9.09 0.625 0.43 0.23 0.63
Gram 1 10.00 0.4 1.32 0.66 0.40 1 9.09 1.25 0.87 0.45 1.25
Mustard 0 0 0 0 0 0 7 63.64 61.87 43.01 22.52 8.84
Mustard+
Wheat
1 10.00 3.6 11.92 5.94 3.60 1 9.09 1 0.70 0.36 1.00
Vegetables 2 20.00 0.8 2.65 1.32 0.40 2 18.18 10.93 7.60 3.98 5.47
Wheat 7 70.00 24 79.47 39.60 3.43 8 72.73 67.18 46.70 24.45 8.40
Wheat+Gr
am
1 10.00 1.4 4.64 2.31 1.40 0 0 0 0 0 0
Total 30.2 100 49.83 143.85 100 52.35

89
Dealer (40%) was the largest source for seed procurement for Shridev PC members. While, in
the case of Khandar PC members it was PC (45%). 9-10% of member farmers were purchasing
from dealers & PACS while 18-20% were purchasing from dealers & PCs. (Table 3.46)
Table 3.46: Distribution of ISAP PC members by Source of Seeds
PC > Shridev Khandar
Parameter >
Seeds Source
No of Farmers % of total No of Farmers % of total
Dealers 4 40.00 3 27.27
PC 3 30.00 5 45.45
Dealers, PACS 1 10.00 1 9.09
Dealers, PCs 2 20.00 2 18.18
Total 10 100 11 100
PACS was a major source of chemical fertilizers for Khandar PC members (73%) while in the
case of Shridev PC members, PCs (60%) was the most important source of fertilizers. Other
sources were in the range of 9-10% for both the PCs. In case of chemical pesticides, dealers
(55%) and PCs (60%) was the most important source for Khandar and Shridev PC members,
respectively. (Table 3.47)
Table 3.47: Distribution of ISAP PC members by Source of Chemical inputs
Chemical input > Fertilizers Pesticides
PC Name > Shridev Khandar Shridev Khandar
Parameters >
Source
No of
Farmers
% of
total
No of
Farmers
% of
total
No of
Farmers
% of
total
No of
Farmers
% of
total
Dealers 1 10.00 1 9.09 2 20.00 6 54.55
PACS 1 10.00 8 72.73 0 0 2 18.18
PCs 6 60.00 0 0 6 60.00 1 9.09
Dealers, PACS 0 0 1 9.09 0 0 0 0
Dealers, PC 1 10.00 0 0 0 0 1 9.09
Doesn’t Buy 1 10.00 1 9.09 2 20.00 1 9.09
Total 10 100 11 100 10 100 11 100
Majority of the member farmers of Shridev PC (80%) and Khandar PC (91%) did not purchase
any biofertilizers. The remaining member farmers purchased from only one source viz. PC. In
case of pesticides, no member farmer of both the PCs did not purchase any biopesticides.
A large majority of the member farmers of Shridev PC (80%) and majority of Khandar (55%)
provided the correct name of PC. 18-20% of the members farmers of both the PCs did not know
the PC name and 27% in Khandar gave incorrect name each. 27-30 % of the member farmers
did not know the name of PC owner. 30 and 10% of Shridev PC members gave the name of
PC employees and BOD for PC owner while no Khandar PC member gave the name of PC

90
employees and BOD. Member farmers who knew that farmer were PC owners were higher in
the case of Khandar PC (55%) and only 30% in case of Shridev mahila PC (30%). (Table 3.48).
Table 3.48: Distribution of ISAP PC members by Knowledge about PC Owner
PC Shridev Khandar
Parameter >
PC Owner No of Farmers % of total No of Farmers % of total
Don’t Know 3 30.00 3 27.27
Promoting Agency 0 2 18.18
PC Employees 3 30.00 0 0
BOD 1 10.00 0 0
Farmers 3 30.00 6 54.55
Total 10 100 11 100
64% Khandar PC member farmers were influenced by PC promoter while in the case of Shridev
PC, this percentage was 20%. 70% Shridev PC members and 27% Khandar PC members were
influenced by PC employees. 9-10% of member farmers of both the PCs were influenced by
friends/ neighbours/ relatives to join the PCs. (Table 3.49)
Table 3.49: Distribution of ISAP PC members by PC influencer
PC Shridev Khandar
Parameter >
PC Influencer
No of Farmers % of total No of Farmers % of total
PC Promoters 2 20.00 7 63.64
PC Employees 7 70.00 3 27.27
Friends/ neighbours/ relatives 1 10.00 1 9.09
Total 10 100.00 11 100.00
3.52 IGS PCs
All the respondent member farmers of both the PCs were male. 60% Molasar PC members
were educated up to higher secondary or graduation while no member farmer of Shekhawati
PC was in this category. Rather, 60% of Shekhawati PC members were middle or high school
literate while in case of Molasar PC members, this share was only 20%. (Table 3.50)
Table 3.50: Distribution of IGS PC members by Education
PC Shekhawati Molasar
Parameter >
Education No of Farmers % of total No of Farmers % of total
Illiterate 2 20.00 0
Primary 2 20.00 2 20.00
Middle 3 30.00 1 10.00
High School 3 30.00 1 10.00
Higher Secondary 0 3 30.00
Graduate 0 3 30.00
Total 10 100.00 10 100

91
All member farmers of both the PCs had agriculture as the primary occupation. 40% and 50%
of Shekhawati and Molasar PC members respectively, didn’t have any secondary occupation.
30% of Shekhawati PC members, each had animal husbandry and skilled labour as secondary
occupation. In case of Molasar PC, 30% of member farmers were working as skilled labour as
secondary occupation and only 10% were into animal husbandry as secondary engagement.
The average owned land was similar in case of Molasar PC (11.3 acres) than Shekhawati PC
(10.8 acres) while the average operated land holding was higher for Shekhawati PC (14 acres)
than that in case of Molasar PC (10 acres). 90% of the Shekhawati PC members were in the
category of small, semi-medium and medium category while in the case of Molasar PC, all the
member were in the category of small, semi-medium and medium farmers though latter with
50% share had 73% share in land. No large farmers was present for Molasar PC while 10% of
Shekhawati PC members were large farmers which owned 36% of the total land. There were
no marginal category members in any of the two PCs. (Table 3.51)
Table 3.51: Category wise Distribution of IGS PC members by Owned Land
PC Shekhawati Molasar
Parameter >
Land category
No of
Farmers
% of
total
Area in
Acres
% of
total
No of
Farmers
% of
total
Area in
Acres
% of
total
Small 3 30.00 9.14 8.49 1 10.00 3.6 3.20
Semi-Medium 2 20.00 15.71 14.59 4 40.00 27.6 24.51
Medium 4 40.00 47.14 43.77 5 50.00 81.4 72.29
Large 1 10.00 35.71 33.16 0 0
Total 10 100 107.7 100 10 100 112.6 100
On the other hand, 40% of the Shekhawati and Molasar PC members were semi-medium
farmers by operated land holding with share of 27% in total member land. Medium farmers
were dominant in both the PCs with 50% of Molasar PC members operating 69% of the land
and 30% of Shekhawati PC with 27% of the land. 10% of the Shekhawati PC members were
large farmers but operated 43% of the operational land. (Table 3.52)
Table 3.52: Category wise Distribution of IGS PC members by Operated Land
PC Shekhawati Molasar
Parameter >
Land category
No of
Farmers
% of
total
Area in
Acres
% of
total
No of
Farmers
% of
total
Area in
Acres
% of
total
Marginal 0 0 0 0 0 0 0 0
Small 2 20.00 5.43 4.01 1 10.00 3.6 3.58
Semi-Medium 4 40.00 34.29 25.32 4 40.00 27.6 27.44
Medium 3 30.00 37.14 27.42 5 50.00 69.4 68.99
Large 1 10.00 58.57 43.25 0 0 0 0
Total 10 100 135.43 100 10 100 100.6 100

92
All the member farmers of Shekhawati PC owned buffalo and cow which were 17% and 32%
of the total animals owned. In case of Molasar PC 90%,80% and 70% of the member farmers
owned goat, buffalo and cow. The average number of animals owned was higher for all the
animals. (Table 3.53).
Table 3.53: Distribution of IGS PC members by livestock Owned
PC Shekhawati Molasar
Parameter
>
Livestock
No of
Farme
rs
% of
total
No of
Anima
ls
%
total
Anima
ls
Avera
ge
No of
Farme
rs
% of
total
No of
Anima
ls
%
total
Anima
ls
Avera
ge
Buffalo 10 100.00 26 16.88 2.60 8 80.00 17 23.61 2.13
Cow 10 100.00 50 32.47 5.00 7 70.00 18 25.00 2.57
Goat 2 20.00 27 17.53 13.50 9 90.00 37 51.39 4.11
Oxen 1 10.00 1 0.65 1.00 0 0 0 0 0
Sheep 1 10.00 50 32.47 50.00 0 0 0 0 0
Total 10 100 154 100 10 100 72 100
The cropping intensity was higher for Shekhawati PC (1.71) than Molasar PC (1.5). Bajra was
grown by all the member farmers of both the PCs. But in case of Shekhawati PC members
(34%) kharif area under it was lower than that in case of Molasar PC members (44%).
Vegetables was grown by 80-90% of member farmers with the kharif acreage in the range of
22-31%. 50% Shekhawati PC members cultivated gram while in case of Molasar PC, 60%
member farmers were cultivating gram in similar area (16%). Fodder was grown by 40%
member farmers of both the PCs but the share of kharif acreage much higher for Molasar PC
(19%) than Shekhawati PC (3%). (Table 3.54). The number of crops grown in rabi season were
higher than kharif season. Wheat (60%), onion (40%), fodder (40%) and gram (30%) was
grown by large number of Shekhawati PC members. But the rabi acreage was the highest for
gram (32%). In case of Molasar PC, 70% of the member farmers were growing wheat followed
by vegetables, mustard and fodder (20% for each crop). The highest rabi acreage was occupied
by wheat (45%) followed by inter-and mixed crops. (Table 3.55). Only 20% of only Molasar
PC members cultivated summer vegetables in a small area.

93
Table 3.54 Kharif Cropping Pattern of IGS PC members
PC Shekhawati Molasar
Parameter >
Crops
No of
Farmers
% of
total
Kharif
Area
% kharif
Area
% total
area
Avg
Area
No of
Farmers
% of
total
Kharif Area in
Acres
% kharif
Area
% total
area
Avg
Area
Bajra 10 100.00 46.85 44.37 20.23 4.69 10 100.00 32 33.54 21.14 3.20
Bajra, Tur, Moong, Gram 1 10.00 8.75 8.29 3.78 8.75 0 0 0 0 0 0
Fodder 4 40.00 2.86 2.71 1.23 0.72 4 40.00 17.8 18.66 11.76 4.45
Gram 5 50.00 16.57 15.69 7.15 3.31 6 60.00 16.4 17.19 10.83 2.73
Groundnut 0 0 0 0 0 0 1 10.00 8 8.39 5.28 8.00
Vegetables 9 90.00 30.57 28.95 13.20 3.40 8 80.00 21.2 22.22 14.00 2.65
Total 105.6 45.60 95.4 63.01
Table 3.55: Rabi Cropping Pattern of IGS PC members
PC Shekhawati Molasar
Parameter >
Crops
No. of
Farmers
% of
total
Rabi
Area
% Rabi
Area
% total
area
Average
Area
No. of
Farmers
% of
total
Rabi
Area
% Rabi
Area
% total
area
Average
Area
Barley, Onion 0 0 0 0 0 0 1 10.00 3.6 6.47 2.38 3.60
Barley, Onion, Wheat 2 20.00 20.29 16.10 8.76 10.15 0 0 0 0 0 0
Fodder 4 40.00 2 1.59 0.86 0.50 2 20.00 0.8 1.44 0.53 0.40
Gram 3 30.00 40.57 32.20 17.52 13.52 0 0 0 0 0 0
Gram, Methi, Mustard 1 10.00 5.14 4.08 2.22 5.14 0 0 0 0 0 0
Gram, Onion 2 20.00 11.14 8.84 4.81 5.57 0 0 0 0 0 0
Isabgol 0 0 0 0 0 0 2 20.00 5.2 9.35 3.43 2.60
Methi 2 20.00 6.29 4.99 2.72 3.15 0 0 0 0 0 0
Methi, Mustard 1 10.00 2.86 2.27 1.23 2.86 0 0 0 0 0 0
Methi, Mustard, Onion 0 0 0 0 0 0 1 10.00 8 14.39 5.28 8.00
Methi, Wheat 1 10.00 4 3.17 1.73 4.00 0 0 0 0 0 0
Mustard 1 10.00 1.71 1.36 0.74 1.71 2 20.00 3.2 5.76 2.11 1.60
Mustard, Onion, Wheat 1 10.00 8.57 6.80 3.70 8.57 1 10.00 6 10.79 3.96 6.00
Onion 4 40.00 9.71 7.71 4.19 2.43 0 0 0 0 0 0
Vegetables 0 0 0 0 0 0 2 20.00 3.6 6.47 2.38 1.80
Wheat 6 60.00 13.71 10.88 5.92 2.29 7 70.00 25.2 45.32 16.64 3.60
Total 126 54.40 55.6 36.72

94
Friends, PC and PC & ADO were important sources for Shekhawati PC members providing
information for 80% member farmers. While friends and PC & ADO were source of general
awareness for 80% member farmers of Molasar PC. (Table 3.56)
Table 3.56: Distribution of IGS PC members by source of general agricultural
knowledge
PC> Shekhawati Molasar
Parameter >
Source
No of Farmers % of total No of Farmers % of total
Friends 4 40.00 4 40.00
Newspaper/ Radio 1 10.00 1 10.00
PC 2 20.00 0 0
PC, ADO 2 20.00 4 40.00
ADO 1 10.00 1 10.00
Total 10 100 10 100
Majority of the Shekhawati PC members (90%) and Molasar PC members (60%) purchased
seeds from PC. Dealers & PC was another important source for seed purchase for Molasar PC
members (30%). All the member farmers of Shekhawati and Molasar PC purchased chemical
fertilizer from PC (90%) followed by dealers (10%). In case of chemical pesticides, 40%
Shekhawati and 10% Molasar PC members did not buy pesticides. PC supplied to the
remaining 60% Shekhawati member farmers and 80% Molasar PC members. 90% of members
farmers of both the PCs didn’t purchase any biofertilizers. In case of biopesticides, 90%
Shekhawati PC members and 70% Molasar PC members did not purchase any biopesticides.
The remaining 30% Molasar PC members bought biopesticides from PC.
60% of Shekhawati didn’t know the name of PC while the remaining 40% member farmers
knew the correct PC name. In the case of Molasar PC, 80% member farmers were aware of the
correct PC name while remaining 20% could not give the exact name of the PC.
Half of the Molasar PC members knew that PC was owned by farmers while 20% did not know.
10% each thought it was owned by PC employees or PC promoting agency. 30% and 20%
Shekhawati PC members mentioned promoting agency and government respectively as the PC
owner. A large number of member farmers didn’t know the PC owner. (Table 3.57)
Table 3.57: Distribution of IGS PC members by Knowledge about PC Owner
PC Shekhawati Molasar
Parameter >
PC Owner
No. of Farmers % of total No. of Farmers % of total
PC employees 0 0 1 20.00
Promoting Agency 3 30.00 1 10.00
Don’t know 4 40.00 2 10.00
Farmers 1 10.00 5 50.00
Government 2 20.00 1 10.00
Total 10 100 10 100

95
30% Shekhawati PC members each were influenced by PC promoters, employees and friends
while in case of Molasar PC members, major influencers were PC promoters (50%) and PC
employees (40%) or both of them (10%). (Table 3.58)
Table 3.58: Distribution of IGS PC members by PC influencer
PC Shekhawati Molasar
Parameter >
PC Influencer
No of Farmers % of total No of Farmers % of total
PC Promoters 3 30.00 5 50.00
Friends 3 30.00 1 10.00
PC Employees 3 30.00 4 40.00
PC Employees, Friends 1 10.00 0 0
PC Promoters, PC Employees 0 0 1 10.00
Total 10 100 10 100
Output Impact-Promoter wise
In the case of ISAP PCs, one farmer in mustard, urad, sesame and soyabean each and six
farmers in wheat reported selling to the PC. There was no increase in four crops in number of
famers over last three years but the number of member farmers in wheat increased six times.
On the other hand, IGS PCs did not undertake any output transactions.
3.6 Summary
The analysis of case study PCs in Rajasthan shows that except milk PC which was very vibrant
displaying high level of physical and financial performance and impact on marginal producer
livelihoods, the other four PCs promoted by so called professional agencies did not show any
promise and some were non-starters even after a few years of working. They could neither
mobilise enough resources nor undertake any output activity to make any impact on farmer
members. Other than being reliant on government for buying for it from its members and non-
members, they could not undertake any other significant activity on the output side and did not
have any business plans. They were more like projects undertaken for a fixed period and then
abandoned. This is a typical case of external promoters undertaking such activity of FPO
promotion without any local base unlike a local NGO which has local presence and reputation
and good will which makes all the difference. On the other hand, much can be learnt from milk
PC in terms of governance and business model which leads to sustainable member relations
and business activity besides scale up and viability. But it also involved public funding in initial
mobilisation and handholding which makes a major difference.

96
Appendix 3.1
PAAYAS Milk PC
The Paayas Milk PC has its origins in the Mother Dairy (NDDB) project started in 2009 in
Rajasthan. However, Mother Dairy didn’t have a formal structure of cooperative membership
of milk producers. The Paayas was set up in 2012. By 2016, it had covered 2400 villages in 8
districts with a membership of 74533 of whom 39% were small holders and 41%were women.
It was procuring 4.91 lakh litres of milk per day (Table 3.1). It had, by then, 2571 milk pooling
points and had employed 1228 LRPs and covered 1.44 lakh animals and had covered 2985
villages with Artificial Insemination (AI). For example, one of the villages which was 32 kms
from chilling centre (MCC) had 65 registered members and 60 were delivering milk totalling
to 570 litres per day. It was supported by a sahayak (assistant) and one facilitator from the PC.
It was run by a local farmer.
The mission of PAAYAS includes increasing the income of shareholders by reducing the cost
of milk production and enhancing their milk business. There are informal groups of local
community – village contact group and member relation group which act as a bridge between
the members and the PC as the procurement at the village level is now undertaken by private
individual. The VCG has 3 to 5 members at the milk procurements point level whereas MRG
has 10 to 12 members at the milk route level. Whereas VCG encourages farmers to become
members and make the members adhere to the rules of the PC, the MRG is more about
supporting MPC in organizing various campaigns, meetings and workshops.
Paayas is a single tier structure with 1.2 lakh members. At the local level, there are villages
contact groups (VCG) and member relation groups (MRL) which are informal structures
between the PC and the members. The shareholding is as per quantity of milk delivered and
one share gives the right to deliver 100 litres of milk in a year and a member has to buy 5 shares
of Rs.100 each (Re 1 per litre of milk) plus pay a membership of Rs.100. The maximum shares
which can be held by one member is 1000. A member has to supply a minimum of 500 litres
of milk for a minimum of 200 days per year with a flush to lean ratio 3:1. The members who
supply for higher number of days in a month/ year are given loyalty incentives.
The PC has three types of members, A, B and C depending on the number of shares held and
milk delivered. Most of the turnover of the PC came from raw milk, poly pack, and cattle feed.
A C-category member has to buy five shares of Rs.100 each and supply at least 500 litres of
milk for at least 200 days. A B-category member should buy at least 40 shares and supply at
least 4000 litre of milk for 270 days in a year. An A-category member has to buy 100 shares
and supply at least 10,000 litres of milk for 330 days in a year at least. All of them have to
maintain a flush lean ratio of 3:1.
The elected board of directors has 10 farmer shareholders based on their category of
membership which itself is based on patronize, three expert directors, who are subject matter
specialists and CEO. Of the ten elected farmer members, there is a ratio of 7:3 of male female
and 3, 2 and 5 each are elected from A, B and C categories. The PC has annually carried out
eight programmes for the board and eight exposure visits for them. It also does organize
monthly and annual programmes for producer awareness on quality, leadership and business
orientation among them. The PC also provides medical insurance, life insurance, child
education scholarships and incentives on cattle feeds to offset low milk prices.

97
The BoD has 15 members composed of 11 elected farmer shareholders, 3 expert directors, and
one chief executive. It has village contact group and member relations groups at the village
level.
The PC has presence in 3300 villages which covers 38 percent of milch animal owning
households in these villages. 40% of the milk in case of Paayas comes from non-members. Its
sales are 85% institutional 15% retail. The institutional sales are mainly to mother dairy and a
small quantity also goes to RCDF.
Photo 3.1: A milk collection centre of Paayas and details of membership and procurement
The organizational structure includes: procurement head with 5 cluster managers across eight
districts and 21 area managers at the chilling centre level and 120 facilitators at the village level
(MPP). Overall, there are 400 staff working with the PC. PC makes annual plans for its
business. The business models include payment through the bank and GPRS for mobile
communication with the members. The major product innovations include: state specific
mineral mixture and urea free cattle feed besides a two-litre ghee pack.
As of now it has outsourced facility for processing and packing upto 1.5 lakh litres a day and
cold storage capacity of one lakh litres and ghee making capacity of 4.5 metric tonnes per day.
The PC has 125 distributors and 4000 retailers. Over the years, it has been gaining market
share while RCDF is losing its market share. The PC provides four types of cattle feed which
includes mineral mixture and ration balancer besides plain and bold versions of its mudrika
animal feed.
The PC supplies cattle feed and various other inputs and services like mineral mixture, fodder
seeds, group medical insurance and AI facility, which are availed by 90% of the members. It
is also supplying milking machine for large dairy animal holders. It also supplies fodder seed
and ration like UMB and other specific types of feed and nutrients for animals. Many of its
services are provided to both members and non-members because non-members are potential
members which can help expand procurement and turnover of the company. The PC also
provides bunkers for biomass and fodder storage at the household level which are provided
free or at 50% cost to women dairy farmers.
It claims that the ration balancing intervention has led to 0.22 kg. increase in average milk
yield, 0.08 percent increase in milk fat and Rs.2.25 reduction in cost of feeding leading to
reduction of Rs.19 per animal per day. This has led to Rs.28 per animal increase in daily income

98
of farmers and 10 percent reduction in feed cost per kg of milk. The PC has also set up 14
model dairy farms in three districts and more than 800 farmers have been trained in model
dairy farming.
Major problems the PC experiences as per promoter’s opinion is that the mindset of the Board
of Directors is still of the traditional cooperative type which it is trying to change with training
and orientation. Further, it has been working on an asset light high turnover business model
which would have to change as the scale increases as that would require more reliable systems
of handling raw material as well as finished products. More importantly the state does not
provide a level playing field for the PC as it subsidises only cooperatives.
Table 3.1: Profile and Performance of Payaas PC
Year >
Parameter
2012-13 2013-14 2015-16 2016-17 2017-18 2018-19
Authorised
capital
(Rs. crore)
30 30 35 35 50
Share capital
(Rs. crore)
16(53%) 22.8(76%) 30.72(88%) 33.89(97%) 37.4(75%)
Turnover
(Rs. crore)
845 1062 1282 1429.5
Profit
(Rs. crore)
12.89 11.15 16.84 13.03
Reserves and
Surplus
(Rs. lakh)
1.80 2923 4754.1 6119.0
Assets
(Rs. Lakhs)
44.26 4511.6 3479.2 2587.5
Number of
shareholders
(lakhs)
(women)
0.378
(0.10%)
1.12 97816
(38224)
1.04
(38%)
Milk
Procurement
(litres in
lakhs)
3.39 4.91 6.5 645 8.6
Shreedev Mahila Kisan PC
This PC was registered in 2016 and deals with procurement of milk and sale of cattle feed. It
has 800 members and authorised capital of Rs.5 lakhs. So far, it has issued share for Rs.1 lakh
but has mobilised a total of Rs.1.7 lakh share capital (Table 3.2). The PC works 350 self-help
groups of women with a monthly contribution of Rs.100 besides Rs.200 membership fee which
were organised in 2013. At present, there are 50 such active groups across 80 villages with
each member holding 10 to 100 shares.
It has seed licence since 2017 as well as FSSAI licence. It has also been involved in selling tea,
maize seed, urea and DAP and weedicide. Its total turnover in 2017-18 was Rs.3.12 lakh with
a profit margin of Rs.0.21 lakh. The promoters and BoD have 100 shares each. The major crops

99
grown in the area include maize, soybean, pulses, mustard, wheat, barley, and vegetables. The
PC has still not issued share certificates.
Of the 265 members, most are marginal or small landowners and 10% even landless. 80% of
the members of the PC are active it had five BoD members all of whom are women. The PC
believes that 70% members know that PC belongs to them. Of the 200 shareholders, 144 had
bought 100 shares each, 34 had 50 shares each, two had 20 shares each, and rest had only 10
shares each amounting to Rs.100 each. Though it had 800 members by the 4th year but only
270 shareholders had paid up total capital of Rs.1.7 lakh. The PC had been supported by
NABARD for the salary of the CEO and it has no other staff.
Photo 3.2: Office cum godown of Shreedev Mahila KPC
On the input side, 50 to 60% of the sales are to the members and 80% of the tea sales are to
non-members. Only 10% of the members buy exclusively from PC. Even cattle feed sales, are
equally divided between members and non-members. The PC earns 5% commission on the sale
of various inputs. The PC has not yet dealt with any produce on the output side in terms
of buying from member farmers. The PC has no business plans through it has been able to
receive capacity building grants from NABARD for three years and has been supported by the
promoting agency to the tune of Rs.50000. It has also not done any training of the BoD other
than the use of farm inputs with the help of KVK and NABARD. The PC had taken the
members for exposure to other milk PCs promoted by another NGO and another exposure visit
to KVK Kota in which 10 members each participated.
In terms of its problems, it faces working capital constraint as well an inactive Board. It is
planning to target membership of 1000 and focus on seed production and its sale with a brand
name. The CEO of the PC is a commerce graduate and a former employee of the promoter with
one of its PCs in Bundi. The PC could hold only three meetings of BoD in the first year but
held 12 and 5 meetings in the next two years.

100
Table 3.2: Profile and Performance of Shree Dev Mahila PC
Year >
Parameter
2015-16 2016-17 2017-18 2018-19 2019-20
Authorised capital (Rs. lakh) 5 5 5 5 5
Share capital (Rs. lakh) 1.7(32%) 1.7(32%) 1.7(32%) 1.7(32%)
Turnover (Rs. lakh) 3.12 0.86
Profit (Rs. lakh) 0.21
Number of shareholders 265 265 690
KHANDAR AGRO PC
The PC was registered in 2016 and promoted by ISAP. It was organized from 70 FIGs, from
25 of which and another 5 SHGs, 500 members across 30 villages joined the PC with each
member holding 50 to 100 shares. There are mostly male members with only 20 being women
and 350 of all are active. It has authorised capital of Rs.5 lakh and paid up capital of Rs.3.5
lakh besides reserves of Rs.2 lakh. It had a turnover of Rs.3.19 lakh in 2018-19 and made some
profits. The promoter which started it is a part of the project has now wound up its engagement.
The PC has 5 Directors on the Board of whom 4 are women. Among the ten promoters, there
was one woman. The chairperson of the PC is a village council head and a political party local
leader. The PC has only a CEO who belongs to the promoting agency and worked as block
coordinator.
The 10 seed producers have 40 shares in the PC, and they all operate 10 to 12 acres each. On
the other hand, 50%of the members have an average land holding of two acres. But, only 130
households deal with PC in any way. In fact, all 500 members come from only 250 households
with multiple membership from the same household in different names. Therefore, more than
50% of the members household have no dealing with the PC. The PC mostly deals with inputs
and major inputs provided include: biofertilizers, seeds, and irrigation equipment, 80% of
which is bought by the members with 10% exclusively relying on it. It also runs an OCPF
funded custom hiring centre (CHC) which has three tractors and many other equipment which
are used mostly by members.
On the output side, it promotes market linkages, undertakes warehousing, and processing of
spices and their retailing and marketing. It claims that it has introduced new fruit and other
high value crops among local farmers. It has only once facilitated government procurement
of pulses and sold 60 member farmers’ wheat in wholesale to private traders. It owns the
warehouse and has sold banana to Jaipur traders and organic products to an online buyer. On
the output side, it has not yet attempted contract farming but planning to undertake it in spice
crops.
It had also undertaken contract production of seed with 15 growers who number 50 now mainly
for production of wheat, mustard, pulses, soybean, paddy seeds. Mostly members buy seeds
from the PC for lower price for members and for better quality in case of non-members. Only
50 farmers buy exclusively from the PC. It was into losses up to 2017-18 (Table 3.3) and made
a small profit in 2018-19 with a turnover of Rs.10.5 lakh. It also treats seed contract farming
as a good practice. Its other good practice included: sale to farmer members only on cash

101
payment. It believes that its warehousing activity also as a good practice which it started in
2017-18. It has not received any support from NABARD or SFAC. It has only taken some
progressive farmers for some exposure with the KVK and local agricultural university once.
Table 3.3: Profile and Performance of Khandar Agro PC
Year >
Parameters
2016-17 2017-18 2018-19
Authorised capital (Rs. lakh) 5 5
Share capital (Rs. lakh) 1(20%) 1(20%)
% of Shares held by promoters 100 100
Turnover (Rs. lakh) 0.96 6.95
Profit (Rs.) -0.02 -0.51
Reserves and Surplus
(Rs. lakh)
-0.02 -0.53
Shekhawati Farmer PC
The PC originated in 2015 from 60 FIGs across 30 villages. Each member buys 100 shares of
Rs.10 each and there are 311 shareholders, most of whom being marginal, small or semi-
medium farmers. There are no landless members and by 2019 the membership had increased
to 936. Only 40 members are women. The PC had authorised capital of Rs.10 lakh and paid up
capital of Rs.9.36 lakh in 2018-19 and reserves of Rs.2.5 lakh (Table 3.4). The PC had never
made any loss and its turnover in 2018-19 was Rs.65 lakh.
Among the 12 Board of Directors, four are promoters and only one is a woman. The BOD
members are elected by PC members; they have to be active in PC work to get elected. The PC
has only a CEO now though earlier, it had five Local Resource Persons (LRPs).
The PC has input selling license as well as output trading licences. On the input side, it mostly
deals with seeds, fertilizer, pesticides, besides cattle feed and most of the members buy
exclusively from the PC. Only 30% of the sales of inputs are to non-members. The sales of
inputs are carried from the office-cum-shop of the PC. There is also a PACS in the village from
which farmers buy inputs.
On the output side, of the total turnover, 30% comes from non-members. It has not
undertaken any contract farming or output business so far. The PC claims that it has
promoted isabagul and fennel crops among its farmer members. 50% of the PC members are
active. There is PACS in the area which undertakes input supply for its members as well as
procurement from the government at MSP.
The PC has received capacity building grant from SFAC. It did not pay any dividends to the
members in order to mobilise money for being eligible for matching equity grant. The business
plan is made by the promoter and the BOD annually. It has also been able to avail of loan from
Sammunathi Finance in 2016-17 for Rs.1.75 lakh at the rate of 18% for undertaking input
activities. The CEO had been provided exposure to another PC promoted by another agency
(ISAP). However, the Board has not been exposed to much training. The PC believes that it
has not undertaken any initiative or activity which can be called a best practice. It plans to focus
on pulses and millets for its supply to the government under SFAC procurement mechanism.

102
Major problems faced by the PC includes: shortage of working capital as there is no bank cash
credit limit as of now, absence of output business, lack of professional leadership, especially
by BOD and CEO, and lack of state government support. The PC plans to set up a pulse
processing unit and also get into onion storage and processing. Unfortunately, it is also selling
to farmers on credit up to Rs.one lakh for short period which involves 100 such farmers. There
is also absence of local warehouses which does not let the PC make use of the warehouse
receipt system.
Table 3.4: Profile and Performance of Shekhawati FPC
Year >
Parameters
2016-17 2017-18 2018-19
Authorised capital (Rs. lakh) 10 10 10
Share capital (Rs. lakh) 1(10%) 6.22(62%) 6.22(62%)
Turnover (Rs. lakh) 21.40 32.7 56.6
Profit (Rs.) 0.4 0.61 -0.1
Reserves and Surplus (Rs. lakh) 0.49 0.11 0.00
Assets (Rs. Lakh) 0.04 0.03 0.02
Molasar SKS PC
The PC was registered in 2015 and promoted by IGS. The authorised capital of the PC was
Rs.10 lakh and the paid-up capital Rs. 7.26 lakh (Table 3.5).
The PC originated from FIGs (65) which had 1005 members including 106 women members
which come from some 40% FIGs only. It has 518 members all of whom were landowners and
13 among them were women, and come from 35 villages. 60% of the shareholders are small
or marginal and owners with 40% being medium or large farmers. However, only 350 of the
shareholders are active members and only about 400 out of 1005 FIG members are active. It
had 10 promoters and had 6 members of the Board of Directors including one woman from
201617 due to SFAC mandate, all of whom are also promoters. They all have 1000 shares each
worth Rs.10000 each. The BoD are selected from among the heads of FIGs (22) including
chairperson and vice-chairperson. But, those with political positions or elected body positions
like Sarpanch are not eligible to be on the BoD as it requires devoting time for PC work. It has
all the input sale licenses as well as APMC license as a buyer. It has CEO and one LSP while
earlier there were two LSPs. The CEO is a former LRP of the promoter and has worked with
MGNREGS as a mate earlier. The administrative cost of the PC including CEO and other staff
salary were borne by SFAC for three years some of which is still pending and being used now
to sustain the CEO salary.
It sells farm inputs like seed and fertilisers as well as cattle feed. It has no warehouse and runs
from a rented shop cum office and have total three rented shops. It had not undertaken any
processing even by 2019.
The PC had an agreement with SFAC for procuring pulses under price stabilization fund
wherein the PC was to procure at MSP at the procurement centre and pay farmers within three
days through electronic bank transfers. The PC was paid 1.5% of the value of pulses procured
as administrative charges. All the mandatory charges like Mandi fee, cess, handling charges,

103
cost of gunny bags and transportation charges were to be either paid or reimbursed by the
SFAC. The quality standards for various pulses were specified in terms of foreign matter,
admixture, other grains, damage grains, broken split or unhusked grains, pest infected pulses
and immature and shrivelled grains which was of the order of 1 to 3% maximum and moisture
level of 12% maximum. Further, the FSSAI standards were to be followed for uric acid and
aflatoxin. The damaged grain and pest infected pulses exemption level was higher in case of
moong i.e. 4%. The farmers were given MSP for three crops of moong, urad and arhar in 2016-
17 plus a bonus of Rs.425 per quintal.
This PC participated in procurement of green gram worth Rs.1.68 crore from 186 members. In
the next year, it jointly procured 312 tonnes of pulses along with Aman KSPCL and earned
1.5% commission totalling Rs.6.34 lakh. It claims that the average additional benefit worked
out to be Rs.17149 per farmer because MSP was Rs.400 per quintal higher than the market
price. The government provided a bonus of Rs.425 per quintal to the farmers. Because of this,
the share capital of the PC doubled as more farmers joined as members.
The PC earned commission on SFAC driven procurement of moong dal and also availed of
matching equity grant of Rs.3.63 lakh from SFAC. The PC was running into loses earlier and
has made a small profit of Rs.75000 in 2017-18.
Photo 3.3: Molasar SKS PC office and a share certificate of a shareholder
Table 3.5: Profile and Performance of Molasar SKS PC
Year >
Parameter
2015-16 2016-17 2017-18 2018-19
Authorised capital (Rs. lakh) 10 10 10 10
Share capital (Rs. lakh) 1(10%) - 2.63(26%) 7.26(73%)
Turnover (Rs. lakh) 2.78 8.14 8.24 14.8
Profit (Rs. lakh) 0.75 -0.62
Reserves and Surplus
(Rs. lakh)
-0.01 - 0.17 -0.44
Number of shareholders 312 518 518

104
Chapter 4
Performance and Impact of PCs in MP
Introduction
In Madhya Pradesh, agriculture contributes 22% of State Gross Domestic Product (SGDP) and
provides employment to around 54.6% of its workforce. 48.91% of the total area of the state is
cultivated. The cropping intensity of Madhya Pradesh is 146%. 32% of the GCA is irrigated
with large parts of the state being dry (Sharma et al, 2013). M.P. is primarily a food grain
growing state with around 62% of its gross cropped area (GCA) devoted to food grains and
32% to oilseeds in 2014-15. Within food grains, cereals are 39.4% of GCA and pulses 23%. In
MP, food grains (cereals and pulses) is the largest segment constituting around 27.3% of gross
value of output followed by livestock (18%), fruits and vegetables (17.4%) and oilseeds
(14.3%) (Gulati et al, 2017). The cropping pattern consists of soyabean accounting for 27% of
GCA, wheat 22%, gram 14%, paddy 8%, mustard and maize 4% each, urad, masur, tuar and
cotton 3% each, jowar and sesame -2% each and bajra, peanut and peas 1% each (Sharma, et
al, 2013). Wheat is the major crop grown during the rabi season and it is intercropped with
gram. In the Kharif, MP mostly grows oilseeds, specifically soybean (Gulati et al, 2017). In
2010-11, 44% operated land holders were marginal and 28% small with 12% and 22% of area
respectively and semi-medium holders were 19% of total with 28% area and only 9% were
medium with 29% are and 1% being large with 9% area (Sharma et al, 2013).
There are 4,530 primary agriculture credit societies (PACS) operational in the state. The state
has been also a pioneer in the setting up of new form of co-operatives- producer companies-
since 2005 (Singh and Singh, 2014). The state was also the first to set up a state level PC as a
consortium of farmer producer companies which has 90 members (Rani et al, 2018). The state
has put in place a set of incentives to strengthen FPOs through financial support, infrastructure
building and relaxation of the provisions of the APMC Act (Gulati et al, 2017).
This chapter examines physical and financial performance of PCs across promoters in section
1, analyses the member and non-member differential impact across all PCs together in section
2, Section 3 focusses women specific PCs and section 4 on other PCs. Section 5 examines
promoter specific performance and section 6 the PCs within each promoter and section 7
concludes the chapter.
4.1 Profile and performance of PCs
A comparative analysis of the various PCs in MP by various promoters shows that ASA PCs
had small size of membership though thy had registered with good amount of authorised capital
of Rs. 15 lakh each but one of them could not even 50% of it even after 6 years of working
(Table 4.1). But their turnover was significant enough (Rs. 45-81 lakh) given the small size of
membership. However, they also seem to have passed on the profits to the members as revealed
by the small profits and reserves they had. On the other hand, AKRSP promoted PCs which
were of more recent origin had really small authorised capital (Rs. 5-10 lakh) and small
mobilised equity (only 20-34% of authorised). But they were able to achieve good level of
revenue/turnover (Rs. 24 and 80 lakhs each) and remained in profit almost throughout the
period. The performance of goat PC was even more impressive as it was all women member
PC and was in an unusual and unorganised sector of meat and animal trade.

105
PRADAN promoted PC has good start and mobilised a significant amount of equity form
members (60% of authorised i.e. of Rs. 25 lakh in 2017-18 raised from earlier Rs. 10 lakh). In
fact, it had reached 75% of its earlier authorised capital of Rs. 10 lakh. It had high level of
revenue (> one crore in 2017-18) and profits throughout and created some small reserve as well
(> one lakh).
However, the Mhow PC of IGS had a poor start and working and it was even delisted by the
Registrar of Companies (ROC) as it did not file returns. It was defunct for some time and could
not even mobile 10% of its authorised equity of Rs. 10 lakh and had conducted no business in
2018-19 and had only Rs. four lakh revenue in previous year. Vrutti promoted PC (Betul) was
even in worse condition as it also could not go beyond mobilising 10% of its authorised capital
of Rs.10 lakh and had no business in 2018-19 and therefore no revenue. It showed large revenue
in 2017-18 mainly due to the opportunity given by SFAC to procure on its behalf which also it
did not buy from its members but from a mandi.
A major departure in performance among PCs was that of the RRPPC, promoted by SPS which
was all women member PC and had equity of a large order i.e. authorised equity of Rs. 40 lakhs
in 15-16 which was raised to Rs. one crore in 2017-18 and it had mobilised 100% of it in 16-
17 and 60% of the enhanced limit. It had very large turnover (Rs. 5 crore) and decent profits
(Rs. 1-2 lakh) and surplus of above Rs. 20 lakhs. It had also created assets worth Rs. 12 lakhs.
The recent build up of its warehouse and other facilities shows that it was on the path to
sustainability.

106
Table 4.1: Profile and performance various PCs in M.P.
PC Ranapur women tribal Alirajpur PC Nevali PC Pandhana PC
Year
Parameter 2
015
-16
20
16
-17
20
17
-18
20
18
-19
20
13
-14
20
14
-15
20
15
-16
20
16
-17
20
17
-18
20
18
-19
20
15
-16
20
16
-17
20
17
-18
20
18
-19
20
15
-16
20
16
-17
20
17
-18
20
18-1
9
Members 700 980 1000 1200 1000
Authorized
Capital (Rs.
Lakh)
15 15 15 15 15 15 15 15 15 15 10 10 10 10 5 5 5
Paid up
Capital (Rs.
Lakh)
12.4
(83%)
12.4
(83%)
14.11
(94%)
14.11
(94%)
1
(6%)
4.44
(30%)
7.22(48%) 7.22(48%) 7.22(48%) 7.22(48%) 1
(10%)
1
(10%)
3.38
(34%)
5.38
(54%)
1
(20%)
1
(20%)
2.99 (60%)
No of Shares 124046 12406
Revenue
(Rs. Lakh)
27.54 28.02 64.15 45.22 5.65 24.6 16.4 25 13 81 5.86 50.95 80.4 133 2.78 14.7 23.9
Profit (Loss)
(Rs. Lakh)
(2.68) (2.97) (1.58) 0.41 0.03 0.49 (1.23) (1.35) (1.36) 0.3 (0.026) 0.28 0.21 6.82 0.017 1.79 1.09
Reserves &
Surplus (Rs.
Lakh)
(3.82) (6.79) (8.38) (7.97) (0.1) (0.09) 6.94 0.017 0.25 0.31
Assets (Rs.
Lakh)
26.58 50.24 6.41 6.22
Continued...

107
Table 4.1: Profile and performance of various PCs in M.P.
PC Chirayu Women PC Mhow Agri Pc Betul PC profile RR Pragati PC
Year
Parameter
20
16-
17
20
17-
18
20
18-
19
20
14-
15
20
15-
16
20
16-
17
20
17-
18
20
18-
19
20
15-
16
20
16-
17
20
17-
18
20
18-
19
20
15-
16
20
16-
17
20
17-
18
20
18-
19
Members 980 1000 1200
Authorized
Capital (Rs.
Lakh)
10 25 25 10 10 10 10 10 10 10 40 40 100 100
Paid up Capital
(Rs. Lakh)
7.5 (75%)
15(60%) 15(60%) 1 (10%)
(6.73)
1 (10%)
1 (10%)
(5.86)
1(10%) 1(10%) 1(10%) 1(10%) 20(50%) 39.02 (98%)
58.8(59%) 58.8(59%)
Revenue (Rs.
Lakh)
60.83 139.5 133.23 4.61 7.46 20.46 4.12 0 0 117.82 0 148.47 177.71 268.23 518.12
Profit (Loss)
(Rs. Lakh)
0.39 0.31 0.70 0.12 0.207 0.012 0.96 (0.28) (8.17) 8.65 (0.36) 0.24 2.53 12.01 1.2
Reserves &
Surplus (Rs.
Lakh)
1.37 1.83 2.61 (0.28) (8.45) 0.2 (0.16) (38.91) (36.37) 24.36 23.15
Assets (Rs.
Lakh)
33.18 63.47 0.59 0.79 6.26 12.18

108
4.2 All PC member and non-member comparison: Profile and impact
Of the 71 member farmers interviewed across the state from 8 PCs where 42% per male and
58% female members (Table 4.2) for the reason that four of the PCs were predominantly
women member based or exclusively women PCs. Most of them (47%) were either illiterate,
or middle/high school passed (12% each). Only 7% happened to be graduates (Table 4.3). 99%
of the members had farming as primary occupation. Among the secondary occupation reported
by 30% members, labour again emerged as the largest followed by shop keeping business,
anganwadi (rural mother and child care centre) workers and other such secondary livelihoods
(Table 4.4). Average age of members was 39 and that of non-members 40 years.
Table 4.2: Distribution of PC member and non-member farmers by Gender
Category> Members Non-Members
Parameter>
Gender
Farmers (No.) % in total Farmers (No.) % in total
Female 41 57.75 41 54.67
Male 30 42.25 34 45.33
Total 71 100 75 100
Table 4.3: Distribution of PC member and non-member farmers by education
Category> Members Non-Members
Parameter>
Education
Farmers (No.) % in total Farmers (No.) % in total
Illiterate 33 46.48 45 60
Primary 6 8.45 6 8
Middle School 10 14.08 14 18.67
High School 9 12.68 7 9.33
Higher Secondary 4 5.63 2 2.67
Undergrad 3 4.23 0 0
Graduate 6 8.45 1 1.33
Total 71 100 75 100
Table 4.4: Distribution of PC member and non-member farmers by Secondary
Occupation
Category> Members Non-Members
Parameter>
Secondary Occupation
Farmers (No.) % in total Farmers (No.) % in total
Agriculture 1 1.41 0 0
Animal Husbandry 3 4.23 4 5.33
Business 4 5.63 4 5.33
Labour 6 8.45 18 24.00
Skilled Labour 7 9.86 1 1.33
None 50 70.42 48 64.00
Total 71 100 75 100

109
Among the non-members there were 55% female and 45% male farmer respondents with most
of them (58%) being illiterate and another 21% only middle standard educated (Table 4.3).
94% of them reported agriculture as the primary occupation with 3% as labour with another
1% each reporting dairy and animal husbandry each. Among the secondary occupations, which
was reported by less than 50% of the total, daily wage labour was the most predominant (26%)
followed by animal husbandry & dairying (9%) and petty grocery shops and agriculture (3%
each) (Table 4.4).
Average size of owned land of members was 5.3 acres and operated land was of the order of 6
acres with the very small amount of leasing as most of the farmers were marginal or small
farmers or even landless. 62% of the farmers were marginal or small and another 25% semi
medium with only 10% and 3% being medium and large farmers respectively (Table 4.5).
Interestingly, though 62% of the member farmers were small or marginal, they cultivated only
25% of the total cultivated area. The medium and large farmers which were very tiny
percentage of household (10% and 3% respectively) had 26 % and 18% of the cultivated land
respectively totalling 44%. (tables 4.6 and 4.7)
Table 4.5: Average Owned and Operated Land of PC Members and Non- Members
Category>
Average (in aces)
Members Non-Members
Owned Land 5.38 4.84
Operated Land 6.09 5.43
Table 4.6: Distribution of PC member and non-member farmers by Owned Land
Category> Members Non-Members
Parameter>
Farmer
Category
No. of
Farmers
%
Farmers
Land
(in
acres)
% Total
Land
No. of
Farmers
%
Farmers
Land
(in
acres)
%
Total
Land
Marginal 28 39.44 46 12.03 33 44.00 42.04 4.82
Small 16 22.54 51.8 13.54 15 20.00 560.25 64.18
Semi medium 18 25.35 114.4 29.91 17 22.67 106.36 12.18
Medium 7 9.86 100.3 26.22 8 10.67 107.67 12.33
Large 2 2.82 70 18.30 2 2.67 56.67 6.49
Total 71 100 382.5 100 75 100 872.99 100

110
Table 4.7: Distribution of PC member and non-member farmers by Operated Land
Table 4.8: Distribution of PC member and non-member farmers by livestock Owned
Category> Members Non-Members
Parameter>
Type of
livestock
No. of
Farmers
%
Farmers
Animals % Total
livestock
No. of
Farmers
%
Farmers
Animals % Total
livestock
Buffalo 25 35.21 42 9.31 23 30.67 56 16.00
Cow 53 74.65 130 28.82 38 50.67 74 21.14
Goat 40 56.34 162 35.92 36 48.00 131 37.43
Oxen 57 80.28 117 25.94 45 60.00 89 25.43
Total 71 100 451 100 75 100 350 100
The non-member farmers on an average owned 4.5 acres of land and operated 5.4 acres each
with almost 1/3rd of the land being unirrigated. The maximum land ownership was 30 acres
and minimum zero. The operated land ranged between 0.5 acres and 33 acres because of leasing
in of land. The distribution of land was such that 68% of the total farmers were marginal or
small but they operated only 29% of the total operated land. The medium and large farmers
which were just 5 and 4 percent of the total had 16% and 21% of the total operated land (tables
4.6&4.7).
The major livestock type owned by members was bullocks, cows and goats with 51-80%
owning them and buffaloes were owned by just 35% households. Goats were 36% all livestock
and bullocks and cows 26% and 29% each and buffaloes only 9% of total (Table 4.8). Average
holding per household was 2 cows or bollocks or buffaloes and 5 goats per household.
A significant proportion of non-members had cows, goats and bullocks with average ownership
of 2 cows or bullocks and 5 goats each. Only 15% owned buffaloes with average ownership of
3. In terms of numbers, goats accounted for 42% of the total livestock followed by cows and
bullocks at 20% and 23% each and the buffaloes accounting only for 14% of the total (Table
4.8).
54% member farmers reported well as the major source of irrigation and 7% tubewell with
others reporting combination of well and canal, well tube and canal, well and tube well (4%,
4% and 7% each respectively). Most of these tubewell owners had electric motors (78%)
followed by diesel engine (14%). Only 6% didn’t have a source for energy for extracting
ground water. The avg. cropping intensity of these farmers was found to be 1.9 (Table 4.9).
Category> Members Non-Members Parameter>
Farmer
Category
No. of
Farmers
%
Farmers
Land
(in
acres)
% Total
Land
No. of
Farmers
%
Farmers
Land
(in
acres)
%
Total
Land
Marginal 23 32.39 39.3 9.09 32 42.67 46.03 11.29
Small 21 29.58 71 16.42 16 21.33 54.68 13.41
Semi medium 20 28.17 125.9 29.11 16 21.33 107.33 26.33
Medium 4 5.63 56.3 13.02 8 10.67 107.6 26.40
Large 3 4.23 140 32.37 3 4.00 92 22.57
Total 71 100 432.5 100 75 100 407.64 100

111
The major irrigation sources reported by non-members were wells (39%), tubewell (11%) and
a combination of well or tubewell along with another source like canal or pond (9%) and both
well and tubewell another 7%. 12% respondents were completely rain fed farmers. Further, of
those who reported ownership of any well or tube well, it was mostly electric operated
tubewells (85%) followed by diesel (11%) and a combination of the two (4%) (Table 4.9). The
major sources of the information of the non-member farmers were friends, neighbours,
relatives (32%) followed by only friends and the producer company along with other sources
accounted for 9% and exclusively only for 4% of the total. This was as poor as agricultural
department office or dealer.
Interestingly, a significant proportion of the members (44%) did not know the number of shares
held or owned by them with others reporting 100 or lower no. of shares (53%). In only 37%
cases, the share certificates were issued by the PCs. A very large proportion of members were
also members of self- help groups (SHGs) (49%) simply for the reason that many of the PCs
specially women focussed had their base in the SHGs. Only 11% farmers reported membership
of cooperative society and 5% of another producer company. A significant proportion of them
had been member of such collectives that (61%) anytime between 1998 and 2015. 30% reported
receiving information from the PC for their occupation whether agriculture or animal
husbandry and anther 17% from both friends and PC and another 20% from their friends alone.
The extension worker and agricultural development officer figured only 1 to 2% cases each
exclusively and in another few cases along with friends, PC and non-personal media like
mobile and newspaper. 43% of the members knew that they own the company whereas 27%
had no idea about the ownership of the PC. Others ended up reporting promoting agency, PC
employees, board of director or govt. as the owners of the PCs. The biggest influence in their
becoming member of the PC were the PC promoter (75%) followed by friends and PC
employees (15% and 9% respectively). In 94% cases, they had not received any dividend on
their shares so far.
Surprisingly, very vast majority (73%) did not have any complaint about the services provided
by the PC. On the other hand, 80% of them also stated that PC did not bring any information
about the govt. schemes and subsidies and 91% did not report any special subsidy or other
benefits due to the PC. Most members reported monthly, quarterly and annual frequency of
meetings of the PC and a majority of them (52%) taking part every time and 25% sometimes
and others (9%) occasionally. Only 15% never participated in any meeting. However, 95%
wanted to continue being member of the PC with only 2% reporting intention to withdraw from
membership. Further 85% also stated that they will encourage others to become members. Only
9% stating they would not.
Major crops grown by the member farmer in kharif season were soyabean (41%), maize (17%),
herbs (7%) and cotton (8%) with average area across most crops in 1 to 2 acres. In Rabi, the
major crops grown were potato (29%), wheat (26%), pulses (13%) and spices (10%) besides
onion (4%) and other vegetables (11%). In the summer season, it was mostly jowar with 55%
(Table 9, 10 and 11). Overall, across seasons, it was soybean, potato, wheat, maize and cotton
which were the major crops grown by the farmers.
The average cropping intensity of the non-member farmers was 1.68. Major crops grown by
the non-members farmers in terms of the areas sown included: wheat (41%), potato and onion
(15% each), gram (9%) and garlic (6%) besides combination of some of these crops as

112
intercrops in Rabi: soyabean (42%), maize (26%), paddy (5%) and cotton (11%) besides
intercropping of cotton and soyabean, and cotton and maize in 3% area each in Kharif season
and mostly onion (39%), ladyfinger and fenugreek (18 %each) followed by moong and
coriander (9% each) in summer season. In the total crop area for the entire year, wheat
accounted for 17%, soyabean 24%, maize 15% and cotton 6%. Other than soyabean which was
grown in 6 acres on an average, other crop mostly had 2-3 acres average area per farmer per
year (tables 4.10 to 4.12).

113
Table 4.9: Distribution of PC member and non-member farmers by Source of Irrigation
Category > Members Non-Members
Source of Energy > Diesel Engine Electric Motor Diesel Engine Electric Motor
Ownership of system > Owned Rented Owned Shared Rented Owned Owned Shared
Parameters >
Source
Farmers (No.) % in total Farmers (No.) % in total Farmers (No.) % in total Farmers (No.) % in total Farmers (No.) % in total Farmers (No.) % in total Farmers (No.) % in total Farmers (No.) % in total
Well 1 1.41 3 4.23 34 47.89 2 2.82 1 1.41 0 0 24 32.00 0 0
Tubewell 0 0 0 0 4 5.63 2 2.82 0 0 1 1.33 7 9.33 1 1.33
Well, Tubewell 0 0 0 0 6 8.45 0 0 0 0 0 0 5 6.67 0 0
Well, Tubewell, Canal 0 0 0 0 2 2.82 0 0 0 0 0 0 0 0 0 0
Well, Canal 1 1.41 0 0 1 1.41 0 0 0 0 0 0 6 8.00 0 0
Well, Tubewell, Lake 0 0 0 0 1 1.41 0 0 0 0 0 0 0 0 0 0
River/ Lake/ Canal 6 8.45 0 0 4 5.63 0 0 0 0 6 8.00 9 12.00 0 0
3 members and 16 non-members are Rainfed farmers with no Source of Irrigation.

114
Table 4.10: Kharif cropping pattern of PC member and non-member farmers
Category> Members Non-Members
Farmer and
land
parameter>
Crop
No. of
Farmers
%
Farmers
area
under
crop
%
Kharif
area
%
Total
area
No. of
Farmers
%
Farmers
area
under
crop
%
Kharif
area
%
Total
area
Cotton 22 30.99 34.2 8.14 4.17 17 22.67 40.4 10.16 5.88
Maize 36 50.70 71 16.91 8.66 48 64.00 106.33 26.75 15.49
Soyabean 33 46.48 171.8 40.91 20.96 27 36.00 160.1 40.27 23.32
Paddy 9 12.68 8 1.91 0.98 12 16.00 18.8 4.73 2.74
Tuvar 9 12.68 14.9 3.55 1.82 3 4.00 2.21 0.56 0.32
Vegetables 5 7.04 9.3 2.21 1.13 1 1.33 2.5 0.63 0.36
White Musli 2 2.82 31 7.38 3.78 1 1.33 2.5 0.63 0.36
Jowar 6 8.45 6.9 1.64 0.84 1 1.33 2 0.50 0.29
Cotton, Maize 5 7.04 9.6 2.29 1.17 6 8.00 16 4.02 2.33
Soyabean,
Maize
8 11.27 22.6 5.38 2.76 2 2.67 5.45 1.37 0.79
Groundnut 4 5.63 4.4 1.05 0.54 5 6.67 8 2.01 1.17
Maize mixed
cropping
5 7.04 9.6 2.29 1.17 4 5.33 10.68 2.69 1.56
Sesame 3 4.23 3 0.71 0.37 0 0 0 0 0
Soyabean
Intercropping
4 5.63 7.1 1.69 0.87 1 1.33 7.5 1.89 1.09
Urad 4 5.63 9 2.14 1.10 3 4.00 1.4 0.35 0.20
Groundnut
intercropping 0 0 0 0 0
4 5.33 3.9 0.98 0.57
Others 6 8.45 7.5 1.79 0.91 7 9.33 9.78 2.46 1.42
Total 71 100 419.9 100.00 51.22 75 100 397.55 100.00 57.91
Table 4.11: Rabi cropping pattern of PC member and non-member farmers
Category> Members Non-Members
Farmer and land
parameter>
Crop
No. of
Farmer
s
%
Farmers
Area
under
crop
%
Rabi
area
%
Total
area
No. of
Farmers
%
Farmers
Ara
under
crop
%
Rabi
area
%
Total
area
Gram 36 50.70 43.5 11.90 5.31 30 40.00 24.34 8.76 3.55
Wheat 50 70.42 91.7 25.09 11.19 47 62.67 110.38 39.71 16.08
Garlic 7 9.86 33.6 9.19 4.10 4 5.33 17.83 6.41 2.60
Potato 9 12.68 119.1 32.59 14.53 8 10.67 44.26 15.92 6.45
Vegetables 10 14.08 39.8 10.89 4.85 4 5.33 2.7 0.97 0.39
Maize 4 5.63 1.8 0.49 0.22 1 1.33 0.8 0.29 0.12
Onion 3 4.23 14 3.83 1.71 5 6.67 44.11 15.87 6.43
Wheat
Intercropping
5 7.04 11 3.01 1.34 6 8.00 20.35 7.32 2.96
Garlic, Gram 0 0 0 0 0 2 2.67 10.6 3.81 1.54
Others 4 5.63 11 3.01 1.34 2 2.67 2.6 0.94 0.38
Total 71 100 365.5 100.00 44.58 75 100 277.97 100.00 40.49

115
Table 4.12: Summer cropping pattern of PC member and non-member farmers
Category> Members Non-Members
Farmer and
area
parameter>
Crop
No. of
Farmers
%
Farmers
Area
under
crop
%
Summer
area
% of
Total
area
No. of
Farmers
%
Farmers
Area
under
crop
% of
Summer
area
% of
Total
area
Onion 3 4.23 12 34.88 1.46 2 2.67 4.3 39.09 0.63
Wheat 3 4.23 9 26.16 1.10 0 0 0 0 0
Gram 2 2.82 7 20.35 0.85 0 0 0 0 0
Jowar 1 1.41 2.4 6.98 0.29 0 0 0 0 0
Vegetables 1 1.41 4 11.63 0.49 5 6.67 5.7 51.82 0.83
Green Gram 0 0 0 0 0 1 1.33 1 9.09 0.15
Total 71 100 34.4 100.00 4.20 75 100 11 100.00 1.60
Most of the members reported an improvement in the quality of inputs compared to the pre-
membership days when it was 45% reporting very good or excellent and 70% post PC
membership reporting it so. Similarly, in input cost and availability, very significant gains were
reported by more than 45% saying very good and excellent for the pre PC phase moving to
68% saying so for input cost and 70% as against 47% in the availability of inputs after and
before the PC membership respectively. The input accessibility and quantity had also improved
significantly after the intervention of PC.
However, from the output side, there was not much improvement as most PCs did not deal with
output in a significant way and 90% of the members not reporting any output transaction before
or after the PC. The price of output was reported to be better only by 8% members as against
nil earlier mainly in crops of soyabeans, maize and cotton by 10-25%. Similarly, the market
availability for output of the members was also reported to be better by only 7% members.
Only wheat and maize experienced area expansion over the last few years, and yields had
improved significantly in cotton, gram, and soyabean (18,41 and even more than 100%
respectively) after PC intervention.
Before the intervention of the PC, 55% farmers sold directly to traders and 31% through the
APMC with only 12% reporting selling through PC. Of the farmer member selling through the
PC now, only 40% in wheat, 36% in soyabeans, 45% in maize, 25% in gram and 44% in cotton
had sold though the PC. Then the PC and the wholesale channels were getting almost equal
patronage by farmer members in these crops. This proportion of APMC and direct sales
reduced to 28% and 44% and the PC channel accounting for 26%. There was also improvement
in the payment mode with 6% more farmers reporting bank payment though the mode still
accounted for only 25% for all the farmers. So far as the diversification of crop area due to the
PC intervention is concerned the area increased marginally (2%) under maize and soyabean
(3%) and decreased under cotton by 3%. Not only the area, but also the number of farmers
growing these crops increased due to the PC intervention by a small percentage.
Similarly, significant increase in yield was reported only in cotton, soyabean wheat and gram.
The marketed surplus went up in cotton (5%) and soyabean (6%) and wheat (4%) and the price
realized improved in maize, cotton, soyabean and wheat besides gram. (6-17%). However, the
time taken to receive payments became longer for maize and garlic. The average transaction
cost increased in potato and maize significantly.

116
Most of the member farmers still bought their various inputs from dealers which were high in
seeds (Table 4.13) and chemical pesticides (Table 4.14) but PC accounted for 45%, 44% and
34% of farmers in their source of seeds, chemical fertilizers and chemical pesticides
respectively. The farmer mostly bought from the PC for the reason of better quality, easy
accessibility and lower price (Table 4.15A). On the other hand, dealers were preferred for
similar reasons by other farmers. Bioinputs (biofertilizers and biopesticides) were not used by
most of the members (95% and 85%) and non-members (83% and 87%) and only 1-3%
members bought them from the PC (Table 4.15).
So far as the purchase of farm inputs was concerned, most of the non-member farmers
depended on dealers mainly for seeds, fertilizer and chemical pesticides. Some of them did
purchase seeds from the PC and a very small percentage also chemical and biofertilizer and
cattlefeed. The major reasons for buying seeds from dealers included: easy access and lower
cost or a combination of such factors. On the other hand, PC or other cooperatives were used
due to lower cost and easy access besides lack of any alternative. The chemical pesticides were
bought from dealers for easy availability.
Table 4.13: Distribution of PC member and non-member farmers by Source of Seeds
Category> Members Non-Members
Parameter>
Source
Farmers (No.) % in total Farmers (No.) % in total
PC, Agri Uni 1 1.41 0 0
PC 32 45.07 6 8.00
PACS 1 1.41 0 0
Dealers, PACS 1 1.41 2 2.67
Dealers, Local Farmers 1 1.41 3 4.00
Dealers 16 22.54 46 61.33
Dealer, PC 15 21.13 3 4.00
Agriculture Department 3 4.23 1 1.33
Agri Dept, PACS 0 0 1 1.33
Dealers, Agri Dept 0 0 1 1.33
Local Farmers 0 0 1 1.33
PC, Other FPO 0 0 1 1.33
None 1 1.41 10 13.33
Total 71 100 75 100
Table 4.14: Distribution of PC member and non-member farmers by Source of Agrochemicals
Chemical Input Fertilizers Pesticides
Category> Members Non-Members Members Non-Members
Parameter> Source
Farmers (No.)
% in total
Farmers (No.)
% in total Farmers (No.)
% in total
Farmers (No.)
% in total
Dealers 7 9.86 31 41.33 22 30.99 40 53.33
PACS 18 25.35 13 17.33 0 0 2 2.67
PC 31 43.66 4 5.33 24 33.80 2 2.67
PC, PACS 1 1.41 0.00 0 0 0 0
Agriculture Department 0 0 3 4.00 1 1.41 0 0
Dealers, Local farmers, PACS
0 0 1 1.33 0 0 0 0
Dealers, PC 0 0 1 1.33 0 0 0 0
Local farmers 0 0 1 1.33 0 0 1 1.33
None 14 19.72 21 28.00 24 33.80 30 40.00
Total 71 100
75 100 71 100 75 100

117
Table 4.15: Distribution of member and non-member farmers by Source of Bio inputs
Input type Biofertilizers Bio-Pesticides
Category> Members Non-Members Members Non-Members
Parameter>
Source
Farmers
(No.)
% in
total
Farmers
(No.)
% in
total
Farmers
(No.)
% in
total
Farmers
(No.)
% in total
Local Farmers 0 0 1 1.33 0 0 0 0
Dealers 0 0 7 9.33 0 0 8 10.67
PACS 1 1.41 2 2.67 2 2.82 0 0
PC 3 4.23 3 4.00 9 12.68 2 2.67
None 67 94.37 62 82.67 60 84.51 65 86.67
Total 71 100 75 100 71 100 75 100
Table 4.15A: Input wise reasons for buying Inputs from PC by members
Reason Seeds Chem fertilisers Chem
pesticides Biofert biopesti
Seeds No. of farmers % of total No. of farmers
% of total
No. of farmers
% of total
No. of farmers
% of total
No. of farmers
% of total
Better Quality 12 21.05 8 25 6 20 0 1 50
Better Quality,Easy Accessibility, Lower Cost 1 1.75
0 0
Better Quality,Easy Accessibility, Lower Cost,Lower Price 1 1.75
1 3.1 1 3.3 1 11.1 0
Better Quality,Easy Accessibility, Lower Cost,Lower Price,Timely Availability 1 1.75
2 6.2 1 3.3 0 0
Better Quality,Easy Accessibility, Lower Cost,Timely Availability 6 10.53
0 0 0
Better Quality,Lower Price 1 1.75
3 9 4 13.4 2 22.2 0
Better Quality,Lower Price,Timely Availability 2 3.51
1 3.1 1 3.3 0 0
Better Quality,Timely Availability,Lower Price 1 1.75
1 3.1 0 0 0
Easy Accessibility, Lower Cost 11 19.30
8 25 8 26.7 4 44.4 0
Easy Accessibility, Lower Cost,Lower Price 1 1.75
0 2 6.7 1 11.1 0
Easy Accessibility, Lower Cost, Lower Price,Timely Availability 1 1.75
3 9.4 3 10 0 0
Fair Deal/ More Reliable 1 1.75
0 0 0 0
Lower Price 6 10.53 4 12.5 3 10 1 11.1 1 50
Timely availability 0 1 3.1 0 0 0
No other Source 11 19.30 0 1 3.3 0 0
Timely Availability, Lower Price 1 1.75
0 0 0 0
Total 57 100.00 32 100 30 100 9 100 2 100

118
45% of the non-members were aware of the PC and 15% of them were member of a
cooperative, PACS or a SHG. Only 20% of them were interested in becoming members of the
PC. However, 63% of them did not know who owned the PC with only 5% seeing it as farmers’
company and 13% as of the promoting agency or the NGO. Most of them had become members
of the non-PC group or collective after 2001. 60% did not receive any information about the
PC from anyone, with another 10% receiving it from the promoters and PC employees, and
promoters each and 15% receiving it from the PC meetings. They really didn’t have much to
say about the services provided by the PC and 28% of them had attended some meeting
convened by the PC. 80% of them had no idea of any activities undertaken by the PC in the
local area. Only 4% respondents had some negative experience with the PC or heard about it
as 97% had not dealt with it.
There was no major change in the cropping pattern after the organization of the PC in case of
non-members. Only in potato, they reported lower transaction cost as well as transport cost.
They also reported some improvement in time taken to receive payment in cotton and maize
besides wheat and soyabean. Most of them still reported cash transactions.
So far as sale of the sale of produce by non-members was concerned, of the total transactions,
it was mostly direct sales which accounted for 70% of the transactions followed by wholesale
market transactions (20%). The PC transactions were less than 10% of the total (Table 4.16
and 4.17).
4.3 Women PC Member and Non-member profile and impact
Of the 41 all-female members of five PCs across three promotors 2/3rd of the members were
illiterate and rest with various school level literacy level (Table 4.18). 80% reported agriculture
as the primary occupation followed by goatry and labour respectively. Average age of members
was 41 years and that of non-members 45 years. The major secondary occupation was animal
husbandry and farming besides labour. Majority of the members had wells as source of
irrigation with 9% having tube wells while others depended on rivers, lakes and rainfall. The
well and tube well owners had mostly electric source of energy and in some other cases diesel
engines.

119
Table 4.16: Distribution of member famers by crop and channel of sale (excluding goat PC)
Channel
Total APMC Wholesale PC Retail
Para
meter
>
Farmers Produce Farmers Produce Farmers Produce Farmers Produce Farmers Produce
Crop Be
fo
re
A
ft
er
%
Diffe
rence
Be
fo
re
Af
ter
%
Diffe
rence
Be
fo
re
A
ft
er
%
diffe
rence
Be
fo
re
A
ft
er
%
diffe
rence
Be
fo
re
A
ft
er
%
diffe
rence
Be
fo
re
A
ft
er
%
diffe
rence
Be
fo
re
A
ft
er
%
diffe
rence
Be
fo
re
A
ft
er
%
diffe
rence
Be
fo
re
A
ft
er
%
diffe
rence
Be
fo
re
A
ft
er
%
diffe
rence
Cotto
n
23 2
4
4.35 18
2.
75
20
8
13.82 2 2 32 3
2
16 1
3
-
18.7
5
10
1.
75
8
5
-
16.4
6
5 9 80.0
0
49 9
1
85.7
1
Garlic 7 7 10
87
83
2
-
23.46
7 7 10
87
8
3
2
-
23.4
6
Gram 20 2
1
5.00 10
0.
2
10
3.
2
2.99 2 2 17 1
7
17 1
5
-
11.7
6
81
.7
6
6.
7
-
18.3
6
1 4 300.
00
1.
5
1
9.
5
1200
.00
Groundnut
5 5 32 32.5
1.56 1 1 10 10
4 4 22 22.
5
2.27
Maize 29 34
17.24 756
837
10.71 5 6 20.00
115
15
5
34.78
18 15
-16.6
7
483
43
1
-10.7
7
6 13
116.67
158
25
1
58.86
Onion 6 6 25
81
25
81
5 5 25
70
2
57
0
1 1 11 1
1
Organic
Cotto
n
3 21 3 21
Potato 11 12
9.09 4998
5348
7.00 8 9 12.50
4448
47
9
8
7.87 3 3 550
55
0
Pump
kin
4 4 48
7
48
7
4 4 48
7
4
8
7
Red Tuar
2 2 6 6 2 2 6 6
Soyab
ean
41 4
2
2.44 11
58.5
11
82.5
2.07 13 1
3
46
5
4
77
2.58 22 1
8
-
18.18
59
5.5
5
49.
5
-7.72 5 1
0
100.
00
78 1
36
74.3
6
1 1 20 2
0

120
Urad 4 4 24.5
24.5
3 3 22.5
22.
5
1 1 2 2
vegetables
7 7 2665
.5
2665
.5
5 5 2165
21
6
5
1 1 500
50
0
1 1 0.5
0.5
Wheat
28 30
7.14 543.
5
593.
5
9.20 6 6 155
15
5
17 12
-29.4
1
277
22
7
-18.0
5
5 12
140.00
111.
5
21
1.
5
89.69
White
Musli
2 2 0.00 57 57 2 2 57 5
7
Table 4.17: Distribution of non-member farmers by crop and channel of sale (excluding goat PC).
Channel
Total APMC Wholesale PC Retail
Parameter>
Farmers Produce Farmers Produce Farmers Produce Farmers Produce Farmers Produce
Crop Befor
e
Afte
r
% Differenc
e
Befor
e
Afte
r
% Differenc
e
Befor
e
Afte
r
% differenc
e
Befor
e
Afte
r
% differenc
e
Befor
e
Afte
r
% differenc
e
Befor
e
Afte
r
% differenc
e
Befor
e
Afte
r
% differenc
e
Befor
e
Afte
r
% differenc
e
Befor
e
Afte
r
% differenc
e
Befor
e
Afte
r
% differenc
e
Cotton
25 25
318.5
31
8.5
2 2 66 66
23 23
252.5
25
2.5
Garlic
5 5 434
434
3 3 224
224
2 2 210
210
Gram
14 14
142.5
14
2.5
1 1 30 30
9 9 71 71
3 3 41 41
1 1 0.5
0.5
Groundnut
9 8 -11.1
1
33.9
31.4
-7.37 1 1 10 10
8 7 -12.5
0
23.9
21.4
-10.4
6
Maize
31 31
657
657
5 5 150
150
22 22
457
457
3 3 47 47
1 1 3 3

121
Onion
5 5 669
669
4 4 561
561
1 1 108
108
Paddy
2 17
1 1 7 7 1 1 10 10
Potato
8 7 -12.5
0
1838.4
1836
-0.13 2 2 850
850
6 5 -16.6
7
988.4
986
-0.24
Pumpkin
2 2 100
100
1 1 50 50
1 1 50 50
Soyabean
29 29
672
672
8 8 475
475
20 20
187
187
1 1 10 10
Urad 4 4 11.3
11.3
1 1 2.5
2.5
3 3 8.8
8.8
vegetables
3 3 555.5
55
5.5
2 2 55.5
55.5
1 1 500
500
Wheat
26 26
1145
1145
2 2 500
500
18 18
404
404
5 5 121
121
1 1 120
120

122
78% of the non-members in case of four women PCs were female and 67% of the total members
were illiterate and 22% middle standard literate. There was only one member who was
graduate. 81% of the farmers reported farming as primary occupation, 12% animal husbandry
and 7% labour. On the other hand, 65% reported no secondary occupation with 12% being into
farming and poultry and 7% reporting wage labour as the major secondary occupation .(tables
4.19 and 4.20) There was not much difference in occupational pattens of non-members and
even their literacy levels but 24% had labour engagement as secondary occupation and only
4% labour.
Table 4.18: Distribution of Women PC Members and Non-member farmers by
education
Category> Members Non-Members
Parameter>
Level of Education
Farmers
(No.) % in total
Farmers
(No.) % in total
Illiterate 27 65.85 30 66.67
Primary 4 9.76 2 4.44
Middle School 6 14.63 10 22.22
High School 3 7.32 2 4.44
Higher Secondary 0 0 0 0
Undergrad 1 2.44 0 0
Graduate 0 0 1 2.22
Grand Total 41 100 45 100
Table 4.19: Distribution of Women PC Members and Non-member farmers by Primary
Occupation
Category> Members Non-Members
Parameter>
Primary Occupation
Farmers
(No.) % in total
Farmers
(No.) % in total
Agriculture 33 80.49 40 88.89
Animal Husbandry 5 12.20 2 4.44
Labour 3 7.32 3 6.67
Grand Total 41 100.00 45 100.00
Table 4.20: Distribution of Women PC Members and Non-member farmers by
Secondary Occupation
Category> Members Non-Members
Parameter>
Secondary Occupation Farmers (No.) % in total Farmers (No.) % in total
Agriculture 3 7.32 2 4.44
Skilled Labour 2 4.88 1 2.22
Labour 3 7.32 12 26.67
Animal Husbandry 5 12.20 2 4.44
Business 1 2.44 1 2.22
None 27 65.85 27 60.00
Total 41 100.00 45 100.00

123
The average operated land holding of members was 2.71 acres and owned land 2.55 acres
(Table 4.21). 53% of the members were marginal farmers and 32% small with the rest 15%
being semi medium farmers. However, this 15% accounted for 35% of the cultivated area and
marginal category only 26% of the total area. 1/3rd to 3/4th of the farmer members owned
buffaloes, goats, cow and bullocks each with goats accounting for 35% of the total livestock
followed by cows and oxen. On an average each household has two cows or bullocks and six
goats (Table 4.22).
Table 4.21: Average owned and operated land holding of Women PC Members and
Non-members
Category>
Average (acres)
Members Non-Members
Owned Land 2.55 3.72
Operational Land 2.71 3.92
Table 4.22: Distribution of Women PC Members and Non-member farmers by livestock
owned
Category> Members Non-Members Parameter>
Type of
livestock
Farm
ers
%farm
ers
Anim
als
%
Anim
als
Avera
ge
Farm
ers
%farm
ers
Anim
als
%
Anim
als
Avera
ge
Buffalo 12 29.27 15 5.02 1.25 9 20.00 19 9.50 2.11
Cow 26 63.41 61 20.40 2.35 16 35.56 28 14.00 1.75
Goat 30 73.17 175 58.53 5.83 22 48.89 112 56.00 5.09
Oxen 25 60.98 48 16.05 1.92 20 44.44 41 20.50 2.05
Total 41 100 299 100 45 100 200 100
The average operated land of non-members was 3.9 acres and average owned land 3.7 acres.
79% of the non-member farmers were marginal or small and only 2.5% were medium category
farmers. However, small and marginal farmers had only 55% of the cultivated area and medium
farmers had 9% of total. The non-member farmers had mostly goats which was 55% of the
total livestock followed by bullocks at 20%, cows 14%, and buffaloes 9%. 49% of the farmers
had goats with average of 5 goats per household and 45%, 35% and 20% each had two bullocks,
cows or buffaloes (Table 4.22).
47% of the non-member farmers reported well as the source of irrigation and another 42% were
rainfed farmers. Only 3% had tube wells (Table 4.23). 44% received information of agricultural
activities from friends and neighbours with only 7% accessing it from the PC. 45% did not
know about the PC and 66% did not know who owned it with others reporting promoting
agency or the farmers as the owners of the same. 60% of them had not received any information
about the PC and the other source for 21% of the farmers was the meetings of the PC and in
some cases promoters (13%). Only 13% of them had aspiration to become a member of the PC
as they had some awareness about the activities of the PC.
54% bought seeds from PC while 58% non-members bought it from dealers and majority also
bought chemical fertilisers (and 20% from PACS) and pesticides from PCs among member and

124
mostly dealers among non-members. Bio inputs were not bought by 83-100% of members and
93% of non-members with only 15% member buying biofertilisers from PCs and 3% from
PACS (tables 4.23-4.25).
Table 4.23: Distribution of Women PC Members and Non-member farmers by Source
of irrigation
Category> Members Non-Members
Parameter>
Source
Farmers
(No.)
% in total Farmers
(No.)
% in total
Canal 1 2.44 1 2.22
Lake 5 12.20 1 2.22
Pond, Tubewell 0 0 1 2.22
River 4 9.76 6 13.33
Tubewell 3 7.32 1 2.22
Well 19 46.34 16 35.56
Dam 1 2.44 0 0
Rainfed 8 19.51 19 42.22
Total 41 100.00 45 100.00
Table 4.24: Distribution of Women Members and Non-members by Source of Seeds
Category> Members Non-Members
Parameter>
Source
Farmers
(No.)
% in total Farmers
(No.)
% in total
Dealers 4 9.76 26 57.78
PC 22 53.66 7 15.56
Other PC 5 12.20 2 4.44
Dealer, PC 6 14.63 0 0
None 4 9.76 10 22.22
Table 4.25: Distribution of Women Members and Non-member farmers by source of
Chemical Inputs
Type of
Agrochemical> Fertilizers Pesticides
Category> Members Non-Members Members Non-Members
Parameter>
Source
Farmers
(No.)
% in
total
Farmers
(No.)
% in
total
Farmers
(No.)
% in
total
Farmers
(No.)
% in
total
PC 21 51.22 2 4.44 21 51.22 1 2.22
PACS 8 19.51 3 6.67 0 0 1 2.22
Other PC 1 2.44 0 0 1 2.44 0 0
Dealers 2 4.88 24 53.33 9 21.95 22 48.89
Agri Dept. 0 0.00 1 2.22 0 0 0 0
None 9 21.95 15 33.33 10 24.39 21 46.67

125
Table 4.26: Distribution of Women Members and Non-member farmers by source of
Bio inputs
Type of Bio
input>
Fertilizers Pesticides
Category> Members Non-Members Members Non-Members
Parameter>
Source
Farmers
(No.)
% in
total
Farmers
(No.)
% in
total
Farmers
(No.)
% in
total
Farmers
(No.)
% in
total
Dealers 0 0 2 4.44 0 0 3 6.67
PC 6 14.63 0 0 0 0 0 0
PACS 1 2.44 1 2.22 0 0 0 0
None 34 82.93 42 93.33 41 100.00 42 93.33
Major kharif crops grown by a significant part of member farmers included maize, soybean,
pulses and cotton accounting for 33%, 19%, 13% and 11% of the cropped area respectively. In
the Rabi season, major crops grown included wheat and pulses which accounted for 50% and
28% of the crop area (Table 4.27 and 4.28). Only one member famer grew Jowar in summer.
Overall, it was maize and wheat accounting for 20% of the gross cropped area each followed
by pulses at 19%, soybean at 11% and cotton at 6%. The cropping intensity of these farmers
was 1.86.
Overall, 42% of the Kharif area of non-members was under maize, 20% under soybean and
25% under cotton. Similarly, in Rabi season wheat had 22% area and wheat and gram together
another 28%, with another 22% being under gram. Thus, maize, soybean, cotton and gram were
the crops which accounted more than 10% of the gross cropped area. The average cropping
intensity was 2.0.
Only 39% of the all -women PC members had received share certificates and 87% also were
members of SHGs with some being members of other PCs. Most of the members had joined
the PCs in the last 10 years. They obtained agriculture information from PC in 48% and from
a combination of friends and PCs in 20% and only friends in another 22% cases. Interestingly,
a majority of the members 53% knew that PC belongs to farmers, the others seeing it as
employee owned, promoting agency owe, government owned. 90% of them had no dislike
about the services being offered by the PC and 20% even reported the PC helping them in
availing of government schemes and subsidies and in some cases 10% it was mainly for PC
members. 71% reported attending meeting frequency to be monthly and 17% annual and 10%
quarterly. 58% participated in all the meetings and 20% sometimes and another 20% had never
participated in any meeting.
All of them wanted to continue as members and also wanted others to join the PC. The only
crop in which the area had expanded after the PC intervention was cotton as most of them were
focused on cotton. The price realisation in cotton had also gone up at 21% after the PC
intervention as was the case in fruits and goat meat. There was also reduced cost of
transportation in the case of goats, maize and pulses besides meat. However, the payment term
had gone up substantially in cotton and pulses. The farmer member also appreciated the
improvement in input quality which move from poor and good to very good and excellent after
the intervention of PC. Similarly, the cost rating as well as availability and accessibility besides
quantity of inputs had also improved in a similar manner.
On the output side also, there was movement from good to very good in majority of the cases
especially on market availability. The number of members selling to the PCs had almost

126
doubled over the three years which had declined in the other channel i.e. direct wholesale.
Similar was the change in mode of payment which moved to bank and cheque instead of cash
(Table 4.29).
There is no effect of the presence of PC on the non-member farmers in terms of the sale of their
produce or the crops grown (Table 4.30).
Table 4.27: Kharif cropping pattern of Women PC Members and Non-members
Categor
y>
Members Non- Members
Paramet
er>
Crop
Farme
rs
%
Farme
rs
Area
unde
crop
%
khar
if
Are
a
%
tota
l
area
Avera
ge
Area
Farme
rs
%
Farme
rs
Area
under
crop
%
khar
if
Are
a
%
tota
l
area
Avera
ge
Area
Cotton 13 31.71 15.2 12.7
4
7.36 1.17 10 22.22 19.4 17.0
3
10.4
3
1.94
Fruit 2 4.88 2 1.68 0.97 1.00 0 0 0 0 0 0
Groundn
ut
1 2.44 0.4 0.34 0.19 0.40 3 6.67 3.8 3.34 2.04 1.27
Jowar 3 7.32 2.4 2.01 1.16 0.80 0 0 0 0 0 0
Maize 23 56.10 46.2 38.7
1
22.3
7
2.01 28 62.22 48.47 42.5
5
26.0
6
1.73
Paddy 5 12.20 4 3.35 1.94 0.80 4 8.89 3.80 3.34 2.04 0.95
Pulses 9 21.95 15.9 13.3
2
7.70 1.77 2 4.44 1.71 1.50 0.92 0.86
Sesame 3 7.32 3 2.51 1.45 1.00 1 2.22 2.00 1.76 1.08 2.00
Soyabea
n
19 46.34 30.0
5
25.1
8
14.5
5
1.58 10 22.22 22.50 19.7
5
12.1
0
2.25
Urad 1 2.44 0.2 0.17 0.10 0.20 1 2.22 0.40 0.35 0.22 0.40
Cotton,
Maize
0 0 0 0 0 0 1 2.22 1.20 1.05 0.65 1.20
Cotton,
Soyabea
n
0 0 0 0 0 0 2 4.44 4.00 3.51 2.15 2.00
Cotton,
Toor
0 0 0 0 0 0 1 2.22 1.50 1.32 0.81 1.50
Maize,
Soyabea
n
0 0 0 0 0 0 1 2.22 2.86 2.51 1.54 2.86
Maize,
Toor
0 0 0 0 0 0 1 2.22 2.29 2.01 1.23 2.29
Grand
Total
119.
35
57.7
8
113.9
3
61.2
6

127
Table 4.28: Rabi cropping pattern of Women PC Members and Non-members
Categor
y>
Members Non- Members
Paramet
er>
Crop
Farm
ers
%
Farm
ers
area
und
er
cro
p
%
Rab
i
Are
a
%
tota
l
area
Avera
ge
Area
Farm
ers
%
Farm
ers
area
und
er
cro
p
%
Rab
i
Are
a
%
tota
l
area
Avera
ge
Area
Maize 5 12.20 2.3 2.7
1
1.1
1
0.46 0 0 0 0 0 0
Mustard 1 2.44 1 1.1
8
0.4
8
1.00 0 0 0 0 0 0
Pulses 18 43.90 23.
5
27.
71
11.
38
1.31 0 0 0 0 0 0
Vegetab
les
2 4.88 3.2 3.7
7
1.5
5
1.60 0 0 0 0 0 0
Wheat 33 80.49 54.
8
64.
62
26.
53
1.66 25 55.56 37.
85
52.
54
20.
35
1.51
Gram 0 0 0 0 0 0 19 42.22 15.
84
21.
99
8.5
2
0.83
Wheat,
Gram
0 0 0 0 0 0 6 13.33 18.
35
25.
47
9.8
7
3.06
Grand
Total
84.
8
41.
06
72.
04
38.
74
4.3.1: Ram Rahim PPC: member and non-member profile and impact
All the 8 female members of the PC were mostly (75%) illiterate and others high school or
middle school literate. All the members were into farming with no one reporting any other
occupation. All of them had wells as source of irrigation and mostly electric motor based. None
of them knew the number of shares they had owned and none of them reported that share
certificates were issued. They were all members of the SHGs of women which had been
aggregated into PC. 63% of them had joined the PC during 2009-2013 and 12% even before
that and others after 2014. 88% of them knew that PC is owned by the farmers and they had
become members due to the influence of promoters and friends.
Of the eleven women non-member farmers, 72% were illiterate, 18% middle standard literate
and all of them reported farming as primary occupation with 50% reporting some secondary
occupation. It happened to be wage labour. 63% had well based irrigation with others
depending on rains or rivers for access to irrigation water. 55% of these farmers knew about
the existence of the PC but none of the them knew who owned it as most of them had not been
informed about it. Only 22% wanted to become its member as 27% knew about some of the
initiatives of the PC.
A majority of the members received agricultural information from other farmers with 13% each
receiving it from the PC or the promoting NGO. Others used a combination of various sources.
Most of them did not receive any benefit of government scheme or subsidy due to the PC. The
only special subsidy they reported was availability of loan for maize crop @ 1% which was
reported by 25% of the members. They reported the frequency of meeting to be monthly,
quarterly or twice a year and 50% participated in every meeting with others never (37%) or
occasionally. They all wanted to continue the membership of PC and also wanted others to
join.

128
63% of the member farmers were small and 25% marginal operating 73% of the land. There
was only one semi medium farmer operating 27% of land. The average size of owned land was
2.9 acres and operated land 3 acres per farmer which was one of the lowest among MP PC
members. Almost all the members had buffaloes, cows, bullocks with goats accounting for
39% of the total livestock, cows 24%, bullocks 20% and buffaloes 17%. On an average, there
was one cow or buffalo or bullock per household and three goats per household. All of the
farmers had received the seeds from the PC and fertilisers from the PACS.
All of the non-member farmers were either marginal (64%) or small (36%) operating 44% and
56% of the total area. The average land ownership was 1.6 acres and operated land 2.31 acres
because of some leasing in. But this was half of member average land holding size. Further,
cultivated land was much lower at 1.7 acres and irrigated only 0.9 acres. Wheat and maize were
the major crops grown by most of the farmers with a few also taking up gram cultivation. 73%
farms had goats and 63% bullocks and 54% cows with only 36% having buffaloes but goats
were 38% of all livestock heads and bullocks 26% and cows and buffaloes 18% each.
50% of the Kharif area of members was under maize and 30% under pulses and remaining 17%
under soybean. In Rabi season it was 57% area under wheat and 43% under pulses. Overall,
pulses took 36% of area, maize 31%, soybean 10% and wheat 24%. The cropping intensity of
member farming was 2.49. The members reported 4% increase in wheat yield and 6% increase
in wheat output. The time taken to receive payment had gone down substantially in maize and
pulses.
Major kharif crops for non-members was maize which accounted for 72% of the area followed
by maize and soybean (11%), maize and tuar 9% with 7% being under tuar alone. In Rabi,
wheat took 64% of the cropped area, gram 22% and wheat and gram 12%. There were no crops
grown in summer season. During the year, maize accounted for 38% of the gross cropped area,
wheat 38%, gram 11% and wheat and gram 6% besides maize and soybean taking up 6% and
maize and Tuar 5% of the GCA. The cropping intensity of these farmers was 1.91.
4.4: All other (non-women) PC members
Of the 40 members of 4 different PCs across four promoters, 75% members were male and
32% were illiterate. Most others had school level or undergraduate level of literacy. All of the
members reported agriculture as a primary occupation and 27% wage work and another 40%
petty business.
2/3rd of the farmers had ground water- based irrigation with others have access to a combination
of wells, tube wells, canals and none of them reported completely rainfed farming. Almost
everyone had pump sets with electric and diesel energy.
Only 1/3rd of the members reported having received share certificates and 59% were member
of SHGs and another 41% of other cooperatives in the area. They had received the information
about agriculture activities from PC in 25% cases, friends and PC in 15%, promoting agency
in 10% and from friends in 17% cases. Only 35% knew at farmers are owners of the PC with
others thinking it is owned by the Bard, promoting agency or PC employees and 28% had no
idea about it. Only 15% reported PC providing information about various government schemes
and subsidies and 55% reported monthly meeting being held with other 18% and 23% reporting
quarterly and annual meeting respectively. However only 45% attended regularly and 35%
sometimes, 10% never attended any meeting. 95% members wanted to continue as members
and 80% also wanted others to join.

129
The average operated land was 8.42 acres and owned land 7.27 acres with significant leasing
in of land. However, marginal and small farmers who were 60% of the total cultivated only
42% of the area and large farmers being only 8% of the total cultivated 42% of the operated
area. Most farmers (78-85%) had cows and bullocks and 32% buffaloes and 53% had goats.
But goats accounted for 32% of all livestock heads and cows and bullocks another 28% each.
Average holding was 2 cows, buffaloes or bullocks and 4 goats per household.
Major Kharif crops were soybean at 50%, maize at 10% and cotton at 8% of the season area.
Surprisingly herb crops accounted for 10% of the seasons area and soybean had another 6%
area as inter or mixed crop with other crops. In the Rabi season, potato was the largest crop
occupying 37% of the area followed by wheat at 20% and spices and onion at 10% and 8%
respectively. Overall, it was soybean which accounted 25% of the gross crop area followed by
wheat at 10% and potato at 19%. The other significant crops in terms of area were cotton,
maize, onion and pulses, and spices accounting for 4%-6% of the gross crop area. Average
cropping intensity of the farmers was 1.96.
There was increase in area reported under wheat due to the PC presence and higher yields in
cotton besides higher price realisation in groundnut, pulses and soybean to some extent. There
is also significant decline reported in transport cost. In terms of quality of input services, there
was a movement from good and very good to very good and excellent in terms of cost, quality,
availability and adequacy besides accessibility which moved from good, very good to very
good and excellent. On the output services, similarly there was improvement from good to very
good in price and market availability in terms of change of channels for sales of farm produce,
there was a growth of more than 200 members selling through the PC within three years and
direct sales had come down after the PC intervention. The bank payment channel had extended
considerably after PC intervention.
4.4.1 All other (non-women) PC non-members
Of the 41 non-members across 4 PCs, 71% were male and 49% illiterate with 20% each being
higher secondary and middle standard literate. All of them had agriculture as a primary
occupation with 54% non-reporting any secondary occupation. 12% had daily wage labour and
12% each animal husbandry and casual labour besides paddy business in the case of some
others.
91% of the farmers reporting irrigation and electric motors and others diesel engine- based
wells and tube wells which were owned or shared in case of 89% farmers. The farmers mostly
relied on friends and other farmers for access to agriculture information (66%).
65% of the farmers had not heard about the PC and 62% did not know who owned it with others
mostly suggesting promoting agency as the owner (70%). In 60% cases, nobody had given the
information about the PC and others had mostly picked it up from PC, promoter and employees
besides PC meetings. Only 28% wanted to become members of the PC and 25% has some
awareness about the initiatives of the PC with 29% even having attended some meeting of the
same.
32% each of the farmers were marginal and semi-medium and 22% were small farmers. There
were 7% large farmers and medium farmers each and they operated 30% and 19% of the total
area respectively. Of the rest, 33% area was with semi medium category of farmers and
marginal and small farmers despite being 54% of the total operated only 19% of the total land.
The average size of operated land holding was 4.4 acres and owned land 4.33 acres which was

130
half of that of the PC member average landholding size. Majority of farmers (60-70%) had
cows and bullocks and 36% buffaloes and 46% had goats. But goats accounted for 34% of all
livestock heads and cows another 23% each. Buffaloes were only 16% of all livestock. Average
holding was 2 cows, buffaloes or bullocks and 4 goats per household.
15% of the farmers grew wheat and maize each and 14% cotton. Other major crops i.e. soybean
and potato that are grown by 19% and 7% of the total farmers. In the Kharif season, soybean
is accounted for 15% of the crop area and maize 19% followed by cotton at 9% and cotton and
maize together 5%. Onion was the major summer crop grown by two farmers accounting for
39% of the area with another three farmers growing vegetables which accounted for 45% of
the total summer area. Only 20% of the farmers undertook summer crops. In Rabi season, it
was wheat which were grown by 86 farmers with 38% area, potato and onion by 44% farmers
with 19% of the total area each and garlic by 18% farmers devoting 8% of the gross crop area
of the season. The other significant crops in Rabi were garlic and gram grown by 10% farmers
being 4% of the total area of the season each. Therefore, across the year, it was 28% under
soybean, 16% area under wheat, 11% under maize, 9% under onion and 8% under potato. The
cropping intensity of these farmers worked out to be 5.2.
There was literally no change in the sales channel of these farmers after the coming into
existence of the PC.

131
Table 4.29: Distribution of women PC member farmers by crop and channel wise produce sales
Chann
el
Total Wholesale PC APMC
Param
eter>
Farmers Produce Farmers Produce Farmers Produce Farmers Produce
Crop Before
After
% Differe
nce
Before
After
% Differe
nce
Before
After
% differen
ce
Before
After
% differen
ce
Before
After
% differen
ce
Before
After
% differen
ce
Before
After
% differen
ce
Before
After
% differen
ce
Cotton 9 9 59.25
62 4.64 8 9 12.50 50.25
62 23.38 1 -100.00 9 -100.00
Gram 12 12 51.
2
51.
2
11 9 -18.18 49.
7
35.
7
-28.17 1 3 200.00 1.5 15.
5
933.33
Maize 15 19 26.67 345 412
19.42 9 6 -33.33 187 133
-28.88 6 12 100.00 158 239
51.27 1 40
Red
Tuar
2 2 6 6 2 2 6 6
Soyabean
13 13 249 247
-0.80 6 6 130 116
-10.77 6 6 113 126
11.50 1 1 6 5 -16.67
Wheat 13 14 7.69 269
.5
29
9.5
11.13 7 4 -42.86 87 72 -17.2 3 7 133.3 26.
5
71.
5
169.8 3 3 156 15
6
Table 4.30: Distribution of women PC non-member farmers by crop and channel wise produce sales
Channel Total Wholesale PC APMC Retail
Paramet
ers>
Farmers Produce Farmers Produce Farmers Produce Farmers Produce Farmers Produce
Crop Be
fo
re
Aft
er
%
Diff
Be
fo
re
Afte
r
%
Di
ff
Be
fo
re
A
ft
er
%
diff
Be
for
e
After %
dif
Be
for
e
Af
ter
%
di
ff
Be
fo
re
Afte
r
%
di
ff
Be
fo
re
A
ft
er
%
diff
Be
fo
re
Aft
er
%
diff
Be
for
e
Aft
er
%
d
iff
Be
fo
re
A
ft
er
%
diff
Cotton 14 14 14
9.5
149.
5
13 1
2
-7.69 13
4.5
129.
5
-
3.72
1 2 100 15 20 33.3
3
Gram 9 9 89
.5
89.5 6 6 48.
5
48.5 3 3 41 41
G’nut 3 2 -33.
3
8.5
6 -29
.4
3 2 -33.3 8.5 6 -29.
4
Maize 14 14 263.
5
263.5
8 8 133.5
133.5
3 3 47 47 2 2 80 80 1 1 3 3
Soyabean 12 12 12
5
125 10 9 -10 10
5
100 -
4.7
1 1 10 10 1 2 100 10 15 50
Wheat 13 13 36
6
366 7 6 -14.3 22
0
205 -
6.8
5 5 12
1
121 1 2 100 25 40 60

132
4.5.1 ASA and AKRSP promoted PCs: Members and non-member profile and impact
ASA which had 53 PCs across four states of M.P, Jharkhand, Bihar and Chhattisgarh including
37 PC in M.P has an organisational structure which includes seven managers at the
headquarters, 15 Area and HUB managers and 42 business facilitators. ASA has 37 PCs in
different parts of Madhya Pradesh with membership of more than 53000 farmers, with nine of
them in Shahdol hub. On the other hand, in Bhudelkhand and Betul hubs, there were only one
or two PCs promoted by it. In western MP, there were 4 PCs each in Nimmad and Ratlam and
two to three each in Petlavad, Ranakpur and Jobat hubs. Some of these PCs had BCI cotton
and organic cotton projects supported by global buyers like C&A Foundation. ASA promoted
PCs have also worked with BioRe India limited, Carrefour and Welspun. ASA has 22 PCs
engaged in organic cotton cultivation involving 12,000 farmers.
The major crops grown in the area included wheat and gram in Rabi season and Soyabean,
maize, urad and cotton in kharif season besides vegetable in summer.
In case of AKRSPI, in the area, major crops grown are maize, cotton, urad, soya bean,
groundnut, moong, and chana. It has promoted 8 PCs in M.P. besides its presence with many
PCs in Gujarat earlier and in Bihar more recently.
4.5.1.1. ASA PCs
95% of the members of these two PCs were women and 73% illiterate with all of them reporting
agriculture as a primary occupation. 62% were dependent on wells and another 14% on tube
wells for irrigation with the rest using lakes and canals for irrigation. 19% of the well owners
had electric or diesel operated pump sets. ASA PC members were on an average 35 years old
compared with AKRSP promoted PC which had average member age of 40 years. In both
Promoter PCs, primary occupation of all members was farming.
70% of the non-member farmers interviewed in the two PC areas were female and 83% of them
did not report any secondary occupation whereas all of them reported agriculture as a primary
occupation. 74% of them were illiterate and 9% were engaged in labour as threshold work.
32% of them had heard about the PC and 10% wanted to become members. The farmers were
depended for irrigation mainly on wells (28%), lakes and canals (11%) each and tube well
(6%). A very large proportion were also rain fed. Their major sources of information were
friends and other farmers besides the government office and the dealer in few cases (10%). A
majority of them (56%) did not know who owned the PC with 12% reporting it as promoting
agency. They had hardly any knowledge about the initiatives undertaken by the PC and 81%
had never attended any meeting. In 71% cases, no one had given any information to them about
the PC and others had picked it from PC meetings and promotors.
The average size of land holding of member farmers was 3.4 in terms of operated area and 3.0
in terms of owned land. However, marginal farmers which was 46% of the total, operated only
24% land and semi medium farmers being 23% had 41% of the operated area. In terms of
livestock, 82% of the farmer owned goats, 68% cows, 50% buffaloes and 77% bullocks with
goats accounting 50% of the total livestock heads followed by oxen 22% and buffalos and cows
at 15% and 13% each.
The average size of non-member owned land was 4.43 acres and that of operated land 4.61
acres. 44% each of the farmers were marginal and semi medium farmers with remaining being
small farmers. However, in terms of land operated semi medium farmers had 72% of the area
and marginal farmers only 16%. The largest ownership was of bullocks (74%) followed by

133
cows and goats (61% each) and only 35% who had any livestock had buffaloes. In fact, 47%
of the livestock was goats, 25% bullocks and 19% cows with buffaloes accounting for 10% of
the total livestock. The tube wells were mostly run with an electricity (66%) and diesel engine
(25%) with 89% of the electric connections owned or shared.
The major crops cultivated by the member farmers included cotton (28% of the GCA), soybean
(16%), soybean with intercrop (14%) and with mixed cropping (9%) and cotton with intercrop
(11%) of the kharif area. Other significant area occupying crops were maize and pulses at 6%
and 7% each. In the rabi season, it was wheat accounting of 54% of the area followed by pulses
at 25% and wheat and other crops 13% and maize 4% of the crop area. Over the year, it was
wheat with 20%, GCA followed by cotton at 17% and pulses at 14% besides soybean at 10%
of the area. The cropping intensity of the two promoters’ PCs did not differ much being 1.5 for
AKRSP and 1.6 for ASA PC members.
Cotton was the crop grown by largest number of non-member farmers (52%) followed by
soyaben (21%) and groundnut (11%). Other crops grown by some other farmers included:
gram, wheat, maize and urad. Major kharif crops were: cotton (27%), soybean (17%), maize
(21%) and cotton and maize together (16%). On the other hand, wheat accounted for 56% of
the Rabi area followed by gram (28%) with the other crops being jawar, bajra and vegetables.
In general, during the year, cotton took up 20% of the GCA, maize 17%, and soybean and
wheat 13% each. The cropping intensity of these farmers was 1.1 which was much lower than
that of the member farmers.
The members perceived the input service of the PC improving its quality from poor, average
or good to very good, good and even excellent mainly in terms of cost availability, accessibility
and adequate quantity. All the women wanted to continue as members and wanted to bring
other farmers as new members. There were significant price gains reported in cotton, paddy
and groundnut due to PC intervention and higher time to receive payment in case of cotton and
pulses. Although transaction cost in cotton, pluses and wheat had come down. On the other
hand, output price realisation also moved from good to very good as well as in the availability
of market. The number of members selling through the PC had tripled over the three years and
bank payment became more common.
There was no change in the sales channel used by non-member farmers before and after the
intervention of the PC where most of them sold in wholesale with only one reporting sales
through the PC. There was also no change in area yield, output or cost of marketing and sales
price realisation before and after the introduction of PC.
45% of the members had received share certificates and 2/3rd of the members were members
of the SHGs. All of the members had joined these PC during the last 10 years. 23% reported
receiving agricultural information from the PC with another 27% each from friends and friends
and PC each.
Only 18% members knew that PC is owned by members with 50% having no idea about the
ownership of the PC. Rest of the members mentioned promoting agency, BOD or PC
employees as the owners. 18% acknowledge PC providing information about government
schemes and subsidies and 80% reported the frequency of meeting to be monthly and 10% each
quarterly and annual. 55% participated in the meetings every time and the rest only sometimes
or never.

134
4.5.1.2 AKRSP PC members and non-members
The members of the AKRSP promoted PC were mostly men with only one being a woman,
45% illiterate and another 27% only primary literate (Table 4.27). All of them reported farming
as a primary occupation. For 45% of them who had a secondary livelihood, 36% it was labour
and for 9% carpentry as the secondary source of livelihood (Table 4.28). All of them had well
or tubewell based irrigation. All of the tube well owners had electric motors.
Of the 21 non-members interviewed across two PCs, 2/3rd were men and the rest women with
57% being illiterate and 24% middle standard literate (Table 4.27). There were only 5% who
were graduate. 76% reported their primary occupation as farming and 9% allied activities like
dairy, poultry, and goatery besides 14% being primarily casual labour. The major secondary
occupation reported by 21% of the total was daily wage labour followed by farming and goatery
by 10% each. Interestingly, 42% did not report any secondary occupation (Table 4.28).
Average operated land for member farmers was 5.31 acres and owned land 5.41 acres (Table
4.29). 63% of the members were marginal or small but they operated only 35% of the area
compared with semi medium and medium farmers (18% each) accounted for 24 and 50% of
the operated area (tables 4.30 and 4.31). The livestock ownership varied from 100% in goat
and oxen to 22% in buffaloes and 88% in case of cow and bullocks (Table 4.32). The share of
goats was the highest in the total number of livestock which was almost 44% followed by cow
and bullock at 23% and 28% respectively. In general, there were two cows or bullocks per
household and six goats per household.
The average operated land by non-member farmers was 3 acres of which 2.86 acres was owned
(Table 4.29). 47% of the farmers were marginal land owners and 29% small farmers with
another 12% each being semi-medium and medium farmers each. There were no large farmers
among them (Table 4.30). In terms of area, marginal and small had 46% and medium farmers
30% leaving 34% for the semi medium category. There was some amount of leasing in of land
and very nominal leasing out reported (Table 4.31). The livestock owned by farmers included
66% goat, 10% cows and 16% bullocks by numbers with 40% of the farmers owning goat, 34%
bullocks and 21% cows (Table 4.32). Buffaloes were owned by only 13% of the farmers with
average ownership of one buffalo, two cows or bullocks and seven goats per household.
48% members had received share certificates and 73% were members of SHGs and 26% of
other FPOs mainly PCs. All of the members had joined PC in the last 10 years.
48% of the members received their agriculture related information from the PC. 10% from the
promoting agency and friends each with the rest using multiple sources for receiving. 15% of
the member knew that the PC owned by the farmer members with other 35% feeling it was
owned by promoting agency, PC employee, or Board of Directors. The member generally had
no problem with the services offered by the PC and 45% also acknowledged PC bringing
government schemes and subsidies.
92% of the non-member farmers who had access to irrigation (66%) relied on wells and tube-
wells with only 7% reporting access to canal water. 92% of the tube well and well owners had
electric motor and the rest diesel based pump sets.
Major kharif crops grown by members included cotton with 28% share, soybean with 21%
share, maize 14% and jowar 7% of the season’s cropped area. There were many cases of inter-
and mixed- cropping especially in maize, soybean and cotton. In Rabi, it was mainly wheat
which accounted for 2/3rd of the season’s area followed by vegetables (11%) and pulses (10%).
There were no crops grown in the summer season. Overall, it was mainly wheat, soybean and

135
cotton which accounted for 16% of the GCA with other significant crops being maize and leafy
vegetables besides jowar which accounted for another 17% of the GCA. There were many
cases of intercropping in maize, cotton, potato, soybean and urad besides wheat and also cases
of mixed cropping in cotton, groundnut, maize, potato and wheat. The average cropping
intensity of the farmer members is 1.65. Only one farmer each (10% of all) reported growing
spices in case of AKRSP promoted PCs in 4% of GCA of all members and in ASA PCs jowar
which took only 2% of GCA of all of its PC members.
In terms of cropping pattern of non-member farmers, soybean emerged as the largest crop
grown by 23% of the farmers followed by cotton (19%) and wheat (16%). The next important
crop was maize. It was grown by 14% farmers and 12% farmers reported goat rearing. In terms
of area, soybean accounted for 44%, cotton 15% and cotton and soybean together as intercrops
8% of the total area with the other major crop being groundnut with 6% area as was the case
with maize. The rest of the area was under intercrops in Kharif season. On the other hand, in
Rabi, grown by 25% of the farmers, it was wheat mainly which took 72% of the area followed
by wheat and gram together at 21%. There were hardly any crops grown in summer season.
Overall, wheat accounted for 31%, soybean 21% and wheat and gram 9% besides cotton
accounting for 8% of the total area cultivated during the year. The cropping intensity turned
out to be 1.4%. The sales price had increased by 11% in the case of only goat.
91% of the non-members did not have any problem with the services of the PC but 57% also
had no knowledge of it with 38% being aware of the initiative of the PC. None of them reported
any negative experience with the PC as none of them had transacted with the PC. For the access
to information about agriculture and allied activities, majority of them relied on friends and
relatives and other farmers besides the agricultural department office. Only 10% reported
receiving this information from the PC directly and 5% each indirectly through the promoter
or as a combination of friends, neighbouring farmers and the PC. 79% knew about the existence
of the PC in their area but 59% did not know who owns it with only 12% being aware that it is
owned by farmers. 18% thought it is owned by the promoting agency and other 6% seeing it
as owned by Board of Directors and employees of the PC. This was so because in 39% cases,
nobody had provided them any information with the rest picking it at from PC meetings and
from their interaction with the promoters. Only 19% desired to become a member of the PC.
57% members reported monthly meetings of the PC members and 24% and 19% each annual
and quarterly meeting respectively. Majority of them (52%) attended every meeting. Another
20% sometimes only. 5% members had never attended the meeting.
The quality of inputs delivered by the PC and other channels had improved from good to very
good and excellent and the cost had also moved to the same direction as was availability and
to some extent quantity. On the output side, in general there was an improvement in prices and
availability of the market for the output in terms of sales channels there was tripling of sell
transaction through the PC and some reduction in the APMC channel sales.
The members did not report any major changes in the cropping pattern yields or output due to
the intervention of the PC other than the fact that the cotton and soybean prices were appreciate
significantly during the last three years. The transaction cost had also come down in both cotton
and goat marketing. All of the members wanted to continue with the PC and 19% of them also
wanted to encourage other non-members to join the PC.
Only two non-members farmers reported selling through the PC compared to the pre-PC
situation of one farmer selling to it. On the other hand, there was 15% increase in selling
through the APMC Mandi and this was the shift from direct wholesale selling to traders.

136
Table 4.31: Distribution AKRSP and ASA PC members by Education
PC Promoter AKRSP ASA
Parameter>
Education
Members (No.) % in total Members (No.) % in total
High School 1 9.09 1 4.55
Higher Secondary 1 9.09 0 0.00
Illiterate 5 45.45 16 72.73
Middle School 1 9.09 2 9.09
Primary 3 27.27 2 9.09
Undergrad 0 0.00 1 4.55
Total 11 100.00 22 100.00
Table 4.32: Distribution of AKRSP and ASA PC members by Secondary Occupation
PC Promoter> AKRSP ASA
Parameter>
Secondary Occupation
Members (No.) % in total Members
(No.)
% in total
Carpenter 1 9.09 0 0
Labour 4 36.36 0 0
Anganwadi Worker 0 0 2 9.09
Shopkeeper 0 0 1 4.55
None 6 54.55 19 86.36
Total 11 100.00 22 100.00
Table 4.33: Average Owned and Operational Land of AKRSP and ASA PC member
farmers
PC Promoter>
Average Land (Acres)
AKRSP ASA
Owned 5.31 3.01
Operated 5.45 3.42
Table 4.34: Distribution of AKRSP and ASA PC member farmers by Owned Land
PC Promoter> AKRSP ASA
Parameter>
Farmer
category
Farmers %
Farmers
Land % Total
Land
Farmers %
Farmers
Land % Total
Land
Marginal 3 27.27 4.5 7.69 13 59.09 21.8 32.83
Small 4 36.36 11 18.80 4 18.18 14.6 21.99
Semi Medium 2 18.18 14 23.93 5 22.73 30 45.18
Medium 2 18.18 29 49.57 0 0 0 0
Total 11 100.00 58.5 100.00 22 100.00 66.4 100.00

137
Table 4.35: Distribution AKRSP and ASA PC member farmers by Operated Land
PC Promoter> AKRSP ASA
Farmer
category
Farmers %
Farmers
Land % Total
Land
Farmers %
Farmers
Land % Total
Land
Marginal 2 18.18 3.5 5.83 10 45.45 18.2 24.14
Small 5 45.45 16.5 27.50 6 27.27 21.2 28.12
Semi Medium 2 18.18 17 28.33 6 27.27 36 47.75
Medium 2 18.18 23 38.33 0 0 0 0
Total 11 100.00 60 100.00 22 100.00 75.4 100.00
Table 4.36: Distribution of AKRSP and ASA PC member farmers by livestock Owned
PC Promoter> AKRSP ASA
Parameter>
Type of
livestock
Farmers %
farmers
Animals %total
animals
Farmers %
farmers
Animals %total
animals
Buffalo 3 27.27 5 5.43 11 50.00 23 14.94
Goat 11 100.00 40 43.48 18 81.82 77 50.00
Oxen 11 100.00 26 28.26 17 77.27 34 22.08
Cow 9 81.82 21 22.83 15 68.18 20 12.99
Table 4.37: Distribution of AKRSP and ASA PC member farmers by Source of
Irrigation
Ownership Source Energy AKRSP ASA
Farmers % farmers Farmers % farmers
Shared Well Electric Motor 1 9.09 0 0
Owned Well Electric Motor 9 81.82 11 50.00
Owned Tubewell Electric Motor 1 9.09 2 9.09
Shared Tubewell Electric Motor 0 0 1 4.55
Shared Lake Diesel Engine 0 0 2 9.09
Owned Lake Diesel Engine 0 0 2 9.09
Owned Lake Electric Motor 0 0 1 4.55
Owned Well Diesel Engine 0 0 1 4.55
None 0 0 2 9.09

138
Table 4.38: Kharif cropping pattern of AKRSP and ASA PC members
PC
Promoter>
AKRSP ASA
Parameter>
Crop
Farmers %
Farmers
Land %
Kharif
Land
%
Total
Land
Farmers %
Farmers
Land %
Kharif
Land
%
Total
Land
Bajra 1 9.09 1.5 2.80 1.66 0
Maize, Jowar 1 9.09 2 3.74 2.21
Cotton 7 63.64 13.5 25.23 14.92 14 63.64 20.2 27.90 16.75
Groundnut 2 18.18 2 3.74 2.21 1 4.55 0.4 0.55 0.33
Groundnut,
French Beans,
Jowar
1 9.09 2 3.74 2.21 0 0.00
Jowar 3 27.27 4.5 8.41 4.97 1 4.55 0.4 0.55 0.33
Maize 7 63.64 8.5 15.89 9.39 5 22.73 4 5.52 3.32
Organic
Cotton
1 9.09 0.5 0.93 0.55 0 0.00
Soyabean 4 36.36 9.5 17.76 10.50 10 45.45 11.6 16.02 9.62
Soyabean,
Corn
1 9.09 2.5 4.67 2.76 0 0.00
Soyabean,
Juvar
1 9.09 0.5 0.93 0.55 0 0.00
Soyabean,
Maize, Juvar
1 9.09 1.5 2.80 1.66 0 0.00
Toordal 1 9.09 1 1.87 1.10 0 0.00
Urad, Jowar 1 9.09 4 7.48 4.42 0 0.00
Cotton, Maize 4 18.18 7.6 10.50 6.30
Cotton,
Maize,
Moong
0 1 4.55 2 2.76 1.66
Maize, Tuvar 0 1 4.55 0.4 0.55 0.33
Paddy 0 4 18.18 3 4.14 2.49
Soyabean,
Maize
0 3 13.64 7.2 9.94 5.97
Soyabean,
Maize,
Cotton, Jowar
0 1 4.55 4.8 6.63 3.98
Soyabean,
Maize,
groundnut
0 1 4.55 1.6 2.21 1.33
Soyabean,
Tuver
0 2 9.09 3 4.14 2.49
Sugarcane 0 1 4.55 1 1.38 0.83
Tuver 0 1 4.55 2 2.76 1.66
Urad 0 2 9.09 3 4.14 2.49
Urad, Maize,
Thura
0 1 4.55 0.2 0.28 0.17
Total 53.5 59.12 72.4 100.00 60.03

139
Table 4.39: Rabi cropping pattern of AKRSP and ASA PC members
PC
Promoter> AKRSP ASA
Parameter>
Crop
Farmers %
Farmers
Land %
Rabi
Land
%
Total
Land
Farmers %
Farmers
Land %
Rabi
Land
%
Total
Land
Gram 6 54.55 4.5 13.64 4.97 13 59.09 11.3 24.67 9.37
Maize,
Wheat
1 9.09 2 6.06 2.21 0 0.00 0.00
Vegetables 3 27.27 2 6.06 2.21 2 9.09 1.2 2.62 1.00
Wheat 11 100.00 24.5 74.24 27.07 19 86.36 24.5 53.49 20.32
Wheat,
Gram
0 0.00 2 9.09 6 13.10 4.98
Maize 0 0.00 4 18.18 1.8 3.93 1.49
Sugarcane 0 0.00 1 4.55 1 2.18 0.83
Total 11 100 33 100.00 36.46 22 100 45.8 100.00 37.98
Further, only 18% of AKRSP and 5% of ASA PC members used biofertilisers which was
bought from the PC. Only 18% of AKRSP members used biopesticides and had bought from
the PC.
Table 4.40: Distribution of AKRSP and ASA PC member farmers by Source of Seeds
PC promoter> AKRSP ASA
Parameter>
Source Farmers (No.) % in total Farmers (No.) % in total
Agri University, PC 1 9.09 0 0
Dealers 3 27.27 5 22.73
Dealers, PC 2 18.18 8 36.36
PC 5 45.45 9 40.91
Table 4.41: Distribution of AKRSP and ASA PC members by Source of Chemical
Inputs
Input> Fertilizer Pesticide
PC
promoter>
AKRSP ASA AKRSP ASA
Parameter>
Source
Farmers
(No.)
% in
total
Farmers
(No.)
% in
total
Farmers
(No.)
% in
total
Farmers
(No.)
% in
total
PC 2 18.18 13 59.09 0 0 8 36.36
PACS 2 18.18 0 0 0 0 0 0
Dealers 1 9.09 4 18.18 2 18.18 8 36.36
Doesn’t use 6 54.55 5 22.73 9 81.82 6 27.27
4.52: Vrutti, PRADAN and IGS Promoted PCs- A comparison
All respondent members of Vrutti promoted PC Betual Krishak (7) and IGS promoted PC
Mhow (12) were male while all of the Pradan promoted Chirayu Women PC members (11)
were female.

140
4.521 Chirayu members and non-members
All the 11 members of the PC were women and 45% of them being literate. 36% had milled
school literacy and 9% each were primary and high school literate (Table 4.38). 91% of them
reported farming as a primary occupation and 9% labour. Farming, animal husbandry and
labour were three equally important secondary occupation reported by one member each (Table
4.39). 44% of the members depended on river for irrigation and 22% each on wells and tube
wells with 78% of the tube wells being electric operated (Table 4.44).
All the non-members were women farmers with 82% being literate and 62% reporting daily
wage labour as secondary occupation besides agriculture being reported as primary occupation
by all of them. Most of the farmers reported dependence on rain and rivers for irrigation and
only a few had electric or diesel operated wells. They mostly learnt about agricultural issues
from their neighbouring farmers or friends.
64% members had received share certificates and 100% of them were members of SHGs. 50%
of the members had joined only in the last 5 years. 1/3rd of them did not know the owner of the
PC and 36% reported farmers as the owners with 9% each mentioning government, promoting
agency or the employees as the owners. They had mostly learnt about the PC from promoters
(45%), friends (36%) and employees (18%). None of them had received any information or
availed of any subsidy or scheme because of the PC. However, 55% of them reported PC as a
source of agricultural information with 37% mentioning a combination of PC and friends and
another 9% various other sources including PC. The meetings were reported to be monthly by
82% members and annual by the rest. 2/3rd of them reported attending it every time, 27%
sometimes and 9% never. All of them wanted to remain members as well as encourage others
to become members of the PC.
64% of the members were marginal and 9% small with rest 27% being semi medium farmers.
But, marginal farmers had only 37% of the area and semi medium farmers had 54% of the total
operated area of the members (Table 4.41 and 4.42). Average owned land was 2.95 acres and
operated land 3.2 acres per farmer (Table 4.40). 91% of them had bullocks and 45% and 27%
each had cow and goats. Cows accounted for 42% of the livestock with average ownership of
6 cows per household followed by goats accounting for 31% with average ownership of 8 goats
per household. The rest of the livestock were bullocks with average ownership of two bullocks
per household.
In terms of landholding, all of the non-member farmers were either marginal (82%) or small
(18%) and all of the land was operated equally between these two categories with 18% small
farmers accounting for 51% of operated area. Accordingly, operated land was 1.6 acres on an
average which was not very different from owned land (1.5) acres. This was in fact the lowest
average fam size among all PC non-members and was half of the member average land holding
size. Only 10% farmers each owned any livestock and this was mostly bullocks in case of 36%
households and accounted for 53% of all livestock with cows only 27% owned by just 10% of
households.
54% of the kharif area of members was under maize and another 18% maize inter-cropped with
other crops. Fruits, jowar and sesame accounted for 6% each of the kharif area and pulses and
paddy 4% and 3% respectively. In the Rabi season, it was mostly wheat (60%), followed by
pulses (23%), vegetables (13%) and mustard (4%). During the year, maize had 42% of the
GCA, wheat 20%, pulses 12% and vegetables 5% of the GCA. The average cropping intensity
of the farmer was 1.63.

141
The cropping intensity of IGS and Vrutti PC member farmers was high (2.08 and 1.99) and
low for PRADAN PC member (1.63).
38% non-member farmers grew maize and 8% each wheat or gram. In Kharif, 88% area was
under maize and the rest under sesame and other such crops and in Rabi, it was only wheat
(32%), gram (22%) and wheat and gram (44%). There was no summer crop reported by any
farmer. On an average, during the year, maize accounted for 44% of the area, gram 12%, wheat
16% and gram and wheat together 22%.(tables 4.45, 4.46 and 4.47) The cropping intensity
turned out to be 1.9% which was higher than that of the members.
All the member farmers bought seeds as well as fertiliser from the PC (Table 4.48). The
members reported significant increase in area under pulses and maize due to the intervention
of the PC and improvement in yields of pulses as well besides wheat. There was also price
benefit in pulses, maize and wheat ranging from 10%-400% before and after the PC
intervention.
70% of non-member had not even heard of the existence of the PC and 33% did not know who
owned it with another 1/3rd each thinking that it is government owned or promoting agency
owned. This information was reported by only three farmers. 2/3rd of the farmers also reported
nobody making them aware of the activities of PC most of them (88%) had no desire to become
member of such an entity though they had knowledge about the initiatives of the PC.
Table 4.42: Distribution of Vrutti, IGS and PRADAN PC member farmers by
Education
PC promoter> Vrutti IGS PRADAN
Parameter>
Education
Farmers
(No.)
% in
total
Farmers
(No.)
% in
total
Farmers
(No.)
% in
total
Illiterate 0 0 1 8.33 5 45.45
Primary 0 0 0 0 1 9.09
Middle School 1 14.29 1 8.33 4 36.36
High School 3 42.86 2 16.67 1 9.09
Higher Secondary 1 14.29 2 16.67 0 0
Undergrad 1 14.29 1 8.33 0 0
Graduate 1 14.29 5 41.67 0 0
Grand Total 7 100 12 100 11 100
Except one member of Pradan PC who reported labour as main occupation, all members of all
three PCs reported primary occupation as farming.

142
Table 4.43 Distribution of Vrutti, IGS and PRADAN PC member farmers by Secondary
Occupation
PC Promoter> Vrutti ( IGS PRADAN
Parameter>
Occupation
Farmers
(No.)
% in total Farmers
(No.)
% in total Farmers
(No.)
% in total
Skilled Labour 3 42.86 1 8.33 0 0
Labour 0 0 0 0 1 9.09
Animal
Husbandary 0 0 2 16.67 1 9.09
Business 0 0 4 33.33 0 0
Agriculture 0 0 0 0 1 9.09
None 4 57.14 5 41.67 8 72.73
Table 4.44: Average owned and operated land holding of Vrutti, IGS and PRADAN PC
member farmers
PC Promoter>
Average land (acres)
Vrutti IGS Pradan
Owned Land 6.5 13.05 2.95
Operated Land 4.85 16.94 3.22
Table 4.45: Category wise Distribution of Vrutti, IGS and PRADAN PC members by
owned land
PC
Promoter
>
Vrutti IGS PRADAN
Paramete
r>
Category
Membe
rs
(No.)
%
in
total
Acr
es
%
in
total
Membe
rs
(No.)
%
in
total
Acr
es
%
in
total
Membe
rs
(No.)
%
in
total
Acr
es
%
in
total
Marginal 1 14.2
9
2 4.40 0 0 0 0 8 72.7
3
12.5 38.4
6
Small 1 14.2
9
3 6.59 3 25.0
0
11.7 7.49 0 0 0 0
Semi
Medium
4 57.1
4
25.5 56.0
4
3 25.0
0
18.3 11.7
1
3 27.2
7
20 61.5
4
Medium 1 14.2
9
15 32.9
7
4 33.3
3
56.3 36.0
2
0 0 0 0
Large 0 0 0 0.00 2 16.6
7
70 44.7
9
0 0 0 0
Total 7 0 45.5 0 12 0 156.
3
0 11 0 32.5 0

143
Table 4.46: Category-wise Distribution of Vrutti, IGS and PRADAN PC members by
Operated Land
PC> Vrutti IGS PRADAN
Paramete
r>
Category
Membe
rs (No.)
% in
total
Acre
s
% in
total
Membe
rs (No.)
% in
total
Acre
s
% in
total
Membe
rs (No.)
% in
total
Acre
s
% in
total
Marginal 1 14.2
9
2 5.88 1 8.33 0 0.00 7 63.6
4
13 36.6
2
Small 1 14.2
9
3 8.82 3 25.0
0
11.7 5.76 1 9.09 3.5 9.86
Semi
Medium
5 71.4
3
29 85.2
9
3 25.0
0
18.3 9.00 3 27.2
7
19 53.5
2
Medium 0 0 0 0 2 16.6
7
33.3 16.3
8
0 0 0 0
Large 0 0 0 0 3 25.0
0
140 68.8
6
0 0 0 0
Total 7 100 34 100 12 100 203.
3
100 11 100 35.5 100
Table 4.47: Distribution of Vrutti, IGS and PRADAN PC member farmers by livestock
ownership
PC
Promoter>
Vrutti IGS PRADAN
Parameter
>
Type of
livestock
No. % in
total
No. % in
total
No. % in
total
No. % in
total
No. % in
total
No. % in
total
Buffalo 4 57.14 5 15.63 1 8.33 1 2 0 0 0 0
Cow 7 100.00 10 31.25 9 75.00 36 72 5 45.45 32 41.56
Goat 1 14.29 3 9.38 0 0 0 0 3 27.27 24 31.17
Oxen 7 100.00 14 43.75 6 50.00 13 26 10 90.91 21 27.27
Table 4.48: Distribution of Vrutti, IGS and PRADAN PC member farmers by Source of
Irrigation
Ownership Source Energy Vrutti IGS PRADAN
Farmers
(No.)
% in
total
Farmers
(No.)
% in
total
Farmers
(No.)
% in
total
Owned Dam Diesel Engine 0 0 0 0 1 9.09
Rented River Diesel Engine 1 14.29 0 0 0.00
Owned River Diesel Engine 0 0 0 0 1 9.09
Owned River Electric Motor 0 0 0 0 1 9.09
Shared River Electric Motor 0 0 0 0 2 18.18
Shared Tubewell Electric Motor 0 0 0 0 1 9.09
Owned Tubewell Electric Motor 0 0 0 0 1 9.09
Shared Well Electric Motor 0 0 1 8.33 1 9.09
Owned Well Electric Motor 5 71.43 2 16.67 1 9.09
Owned Well Diesel Engine 1 14.29 0 0 0 0
Owned Well,
Tubewell
Electric Motor 0 0 9 75.00 0 0
Rainfed 0 0 0 0 2 18.18

144
Table 4.49: Kharif cropping pattern of Vrutti, IGS and PRADAN PC members
PC
Prom
oter>
Vrutti IGS PRADAN
Para
meter
>
Crop
Fa
rm
ers
%
Far
mer
s
L
a
n
d
%
Khar
if
Land
%
Tota
l
Lan
d
Fa
rm
ers
%
Far
mer
s
L
a
n
d
%
Khar
if
Land
%
Tota
l
Lan
d
Fa
rm
ers
%
Far
mer
s
L
a
n
d
%
Khar
if
Land
%
Tota
l
Lan
d
Maiz
e
6 85.
71
1
4
.
5
42.6
5
21.4
8
1 8.3
3
8 4.18 1.89 10 90.
91
1
8
.
5
54.4
1
31.9
0
Maiz
e,
Soya
bean
1 14.
29
5 14.7
1
7.41 0 0 0 0 0 0 0 0 0 0
Padd
y
4 57.
14
4 11.7
6
5.93 0 0 0 0 0 1 9.0
9
1 2.94 1.72
Soya
bean
5 71.
43
8
.
5
25.0
0
12.5
9
10 83.
33
1
3
6.
4
71.3
0
32.2
8
0 0 0 0 0
Urad 1 14.
29
2 5.88 2.96 0 0 0 0 0 0 0 0 0 0
White
Musli
0 0 0 0 0 2 16.
67
3
1
16.2
0
7.34 0 0 0 0 0
Guar
d
0 0 0 0 0 4 33.
33
8.
3
4.34 1.96 0 0 0 0 0
Other
s
0 0 0 0 0 4 33.
33
7.
6
3.97 1.80 4 36.
36
9
.
5
27.9
4
16.3
8
Jowar 0 0 0 0 0 0 0 0 0 0 2 18.
18
2 5.88 3.45
Cashe
wnut
0 0 0 0 0 0 0 0 0 0 1 9.0
9
1 2.94 1.72
Seasa
me
0 0 0 0 0 0 0 0 0 0 2 18.
18
2 5.88 3.45
Total 3
4
100.
00
50.3
7
1
9
1.
3
100.
00
45.2
7
3
4
100.
00
58.6
2

145
Table 4.50: Rabi cropping pattern of Vrutti, IGS and PRADAN PC members
PC
Promoter>
Vrutti IGS PRADAN
Parameter>
Crop
Farmer
s
%
Farmers
Lan
d
%
Rabi
Land
%
Total
Land
Farmer
s
%
Farmer
s
Land %
Rabi
Land
%
Total
Land
Farmer
s
%
Farmer
s
Lan
d
%
Rabi
Land
% Total
Land
Gram 7 100.00 10 35.09 14.81 1 8.33 2 0.95 0.47 5 45.45 5.5 25.00 9.48
Wheat 6 85.71 18.5 64.91 27.41 0.00 0.00 7 63.64 9.5 43.18 16.38
Potato 0 0 0 0 0.00 9 75.00 119.
1
56.63 28.18 0 0 0 0.00 0.00
Garlic 0 0 0 0 0.00 7 58.33 33.6 15.98 7.95 0 0 0 0.00 0.00
Onion 0 0 0 0 0.00 3 25.00 14 6.66 3.31 0 0 0 0.00 0.00
Others 0 0 0 0 0.00 5 41.67 41.6 19.78 9.84 4 36.36 7 31.82 12.07
Total 7 100 28.5 100.0
0
42.22 12 100 210.
3
100.00 49.76 11 100 22 100.00 37.93
Table 4.51: Summer cropping pattern of Vrutti, IGS and PRADAN PC members
PC
Promoter>
Vrutti IGS PRADAN
Parameter>
Crop
Farmers %
Farmers
Land % Summer
Land
%
Total
Land
Farmers %
Farmers
Land % Summer
Land
%
Total
Land
Farmers %
Farmers
Land % Summer
Land
%
Total
Land
Green
Gram
1 14.29 5 100.00 7.41 0 0 0 0 0 0 0 0 0 0
Onion 0 0 0 0 0.00 3 25.00 12 57.14 2.84 0 0 0 0 0
Gram 0 0 0 0 0.00 1 8.33 2 9.52 0.47 0 0 0 0 0
Wheat 0 0 0 0 0.00 1 8.33 5 23.81 1.18 1 9.09 2 100.00 3.45
Wheat,
Gram
0 0 0 0 0.00 1 8.33 2 9.52 0.47 0 0 0 0 0.00
Total 7 100 5 100.00 7.41 12 100 21 100.00 4.97 11 100 2 100.00 3.45

146
Table 4.52: Distribution of Vrutti, IGS and PRADAN PC members by Source of Seeds
PC> Vrutti IGS PRADAN
Parameter>
Source
Members
(No.)
% in total Members
(No.)
% in
total
Members
(No.)
% in
total
Agriculture Department 3 42.86 0 0 0 0
Dealers 1 14.29 7 58.33 0 0
Dealers, Local Farmers 1 14.29 0 0 0 0
Dealers, PACS 1 14.29 0 0 0 0
PACS 1 14.29 0 0 0 0
PC, Dealers 0 0 4 33.33 0 0
PC 0 0 0 0 11 100.00
All 7 100 12 100 11 100
Table 4.53: Distribution of Vrutti, IGS and PRADAN PC members by Source of
Chemical Inputs
Agrochem
ical input>
Fertilizer Pesticide
PC> Vrutti IGS PRADAN Vrutti IGS PRADAN
Parameter
>Source
Mem
bers
(No.)
%
in
tota
l
Mem
bers
(No.)
%
in
tota
l
Mem
bers
(No.)
%
in
tota
l
Mem
bers
(No.)
%
in
tota
l
Mem
bers
(No.)
%
in
tota
l
Mem
bers
(No.)
%
in
tota
l
PC
0 0 6 50.
00
10 90.
91
0 0 7 58.
33
9 81.
82
PACS
6 85.
71
3 25.
00
0 0 0 0 0 0 0 0
Dealers
0 0 1 8.3
3
0 0 4 57.
14
3 25.
00
0 0
Agri Dept
0 0 0 0 0 0 1 14.
29
0 0 0 0
PC, PACS
0 0 1 8.3
3
0 0 0 0 0 0 0 0
Doesn’t
use
1 14.
29
1 8.3
3
1 9.0
9
2 28.
57
2 16.
67
2 18.
18
Total
7 100
.00
12 100
.00
11 100
.00
7 100
.00
12 100
.00
11 100
.00
4.5.2.2: Betul Krishak members and non-members
All the 7 members of the PC were high school literate (43%) or higher secondary, middle
school, undergraduate or graduate each (14%) each. All of them were into farming as primary
activity and a few into small petty business or skilled occupation like tailoring. 71% of them
had well as the source of irrigation with others using a combination of canal and well and just
river. All the farmers had sources of energy for pumping water.
82% of the interviewed non-member farmers in the case of this PC were men. 1/3rd of them
were illiterate, 27% middle standard pass, and 11% primary literate. All of them reported
agriculture as the main occupation and 25% daily casual labour as the secondary occupation.
The major source of irrigation was tubewell in case of 36% and well in case of another 27%

147
and one farmer reporting both well and tubewell. Canal only and along with well was reported
as source of irrigation by 27% of farmers. Most of the tubewell and well owners had electric
motor connection. 73% had no knowledge of the PC and 33% did not know who owned it with
others reporting promoting agency and employees as its owners. 57% did not get any
information about the PC from anywhere and 29% reported receiving it from PC promoters
and 40% from PC employees. Only one farmer expressed interest in becoming member as he
had knowledge of its initiatives.
57% of the members had not received share certificates and 67% of them were not member of
any other group or collective. PC was one of the sources only in the case of one farmer
exclusively and another one along with other sources like mobile and agricultural essential
staff. One farmer also mentioned promoting agency as the source of information.
57% of the member farmers were aware that farmers own the PC with others mentioning Board
of Directors (29%) and the promoting agency as the owner. Most of them were encouraged to
become members by the promoters. None of them received any information about various
government scheme or subsidies with one farmer reporting availing of agricultural equipment
subsidy. All the members reported monthly meetings and 71% participating in them every time.
All of them wanted to continue member and encourage other to become members.
71% of the members were marginal or small farmers and the rest semi-medium farmers but
29% (semi medium farmers) operated 41% of total land. The average operated was 6.5 acres
and operated land 4.86 acres. This gap is due to the large amount of uncultivated land which
was of the order of 1.6 acres on an average. This was a semi-medium size of holding and one
of the largest among all MP PCs. All of the farmers had cows and bullocks with 57% having
buffalo and 15% goat and poultry each. Of the total livestock owned, 41% were bullocks, 29%
cows and 15% buffalos. On an average, a household had 2 bullocks and one buffalo and/or cow
each and 3 goats per household.
46% of the non-member farmers were small and 18% each marginal, semi medium and medium
category each. However, 18% (medium) farmers operated 50% of the land and marginal
farmers (18%) only 6% of land. Marginal and small farmers accounting for 63% of the total
operated 31% of total land. The average farm size was high at 6.3 acres which was lower than
owned land because some of the land was reported to be uncultivated. Only 27% to 55%
farmers had livestock and bullocks were the most prevalent with 34% of the total livestock
followed by 25% being goats and cows each and 20% buffaloes.
In Kharif season, maize accounted for 58% of the cropped area of members and soybean 25%
followed by paddy and pulses 26% each. In Rabi, it was just two crops of wheat and pulses
accounting for 55% and 45% respectively. Wheat emerged as the largest crop for these farmers
(27%) closely followed by pulses (25%) and maize (29%) including inter-crops. Soybean took
13% of the GCA and paddy 6%. The average cropping intensity was 1.98.
50% non-member farmers grew maize, 19% wheat and 15% soybean with only 10% reporting
paddy cultivation. In terms of Kharif cropping pattern, maize accounted 55% of the area, paddy
22% and soybean 20%. In summer, only small area was put largely under ladyfinger (66%)
and Moong (33%). On the other hand, in Rabi season, wheat took 55% of the area, gram 18%
and wheat and gram together 26%. Overall, cropping pattern across the year was marked by
maize 34%, wheat 20%, paddy 14%, soybean 12% and gram 6%. The average cropping
intensity for the farmer was 1.58 similar to that among the members.

148
None of the farmers bought any inputs from the PC and depended on dealers and PACS for the
same and bought fertilisers from the PACS. There was no change in any crop area or yield or
output or even sales price realisation as the PC had not intervened in the output market.
4.5.2.3 Mhow Members and non-members
Of the 12 male members 42% were graduates and only 8% literate with the rest being high or
higher secondary literate (17%) each or middle school or under grad literate (8%) each. All of
them were engaged in farming with 25% reporting business as secondary occupation and 15%
milk vending. 50% of the members had wells or tube wells and other 25% also canal irrigation.
All of them had electric operated tube wells.
50% had not received share certificate and 33% were not aware. Most of them were member
of the PACs. 50% of the farmers knew the PC is owned by members with other 8% each
mentioning government, IFFCO or promoting agency as the owner. 25% did not know who
owned the PC. 83% had become members due to the persuasion by the promoters and others
by PC employee and friends.
58% reported that meetings were held only once in a year and only 25% participated in them
regularly with others occasionally 33%, sometimes 23% and never 17%. 92% of them wanted
to remain as members and 83% wanted to encourage others to become members.
Of all the nine non-member male farmers interviewed, 44% were high school literate, 33%
middle standard literate and 11% being graduate. All of them reported agriculture as a main
occupation with 22% reported animal husbandry as a secondary occupation. 63% did not report
any secondary occupation. The irrigation access was mainly from wells and tubewells (44%),
wells (22%), canal and well (22%) and only canal (11%). All of the well owners had electric
connections. These farmers mostly relied on friends and dealers for information about
agricultural issues. 2/3rd of them did not know about the PC and 78% did not know who owned
it. In fact, in these cases, nobody had provided them any information. 44% of them wanted to
become members of the PC and 33% of all were aware of the initiatives undertaken by the PC.
1/3rd of the member farmers were small and 17% each semi medium or medium with 25%
being large farmers who operated 69% of the total land with small and marginal farmers
operating only 8%. The average owned land was 13 acres and operated land 16.9 acres. This
was a PC which had mostly large and semi-medium and medium famer as member and this
was the largest average farm size of any PC membership. 75% of the farmers had cows and
50% bullocks with cows accounting for 72% of the total livestock and bullocks another 26%.
There were 4 cows and 2 bullocks per household.
Average operated land for non-members turned out to be 17.2 acres with 3.9 acres being leased
in land. In terms of landholding, all of the farmers were semi-medium (56%), medium (11%)
or large farmers (33%). Further, in terms of area operated, large farmers had 59% of the total
semi medium 26% and medium farmers 25%. Major livestock was cows owned by 67%
households and buffaloes by 33% households with cows and buffaloes accounting for 42-44%
of the total livestock with average 3 cows and 5 buffaloes per household. 42% of the total
livestock owned was buffaloes and 44% cows with the rest being bullocks and goats.
Soybean was the predominant kharif crop for member farmers occupying 71% of the area
followed by herbs, maize and vegetables. In Rabi, it was potato accounting for 60% of the area
followed by spices at 15% and vegetables at 6%. Therefore, soybean and potato took away

149
32% each of the gross crop area during the year and spices another 16% followed by vegetables
at 6%. The cropping intensity of the farmers was 2.08.
19% of the non- member farmers grew potato, 11% each onion and wheat, 22% soybean and
14% garlic. In terms of Kharif area, 74% was under soybean, 9% each under cotton and maize
whereas in Rabi, potato and onion accounted for 29% each, wheat 25% and garlic 12%. In
general, during the year, soybean accounted for 38% of the area, onion 15%, potato 14% and
wheat 12% of the GCA. The other important crops were: cotton and maize at 5% each and
garlic exclusively and along with gram 9% of the GCA. The average cropping density is 2.1
and similar to that of the PC members.
Most of the farmers bought seeds from dealers and majority of them buying chemical fertilisers
from PC and the rest from PACs. The chemical pesticides were mostly bought from PC and
some other bought from dealers. Farmers reported very significant increase in vegetable area
during the last three years (four times) and significant increase in potato yields beside
vegetables. The sales price had also significantly improved in vegetables and spices.
4.6 Summary
A comparative analysis of the various PCs in MP by various promoters shows that ASA PCs
had small size of membership, but their turnover was significant enough given the small size
of membership. AKRSP promoted PCs had really small authorised capital and small mobilised
equity (only 20-34% of authorised). But they were able to achieve good level of
revenue/turnover and remained in profit almost throughout the period. The performance of goat
PC was even more impressive as it was all women member PC and was in an unusual and
unorganised sector of meat and animal trade.
Average size of owned land of members was 5.3 acres and operated land was of the order of 6
acres. The non-member farmers on an average owned 4.5 acres of land and operated 5.4 acres
each with almost 1/3rd of the land being unirrigated.
In only 37% cases, the share certificates were issued by the PCs. A very large proportion of
members were also members of self help groups (SHGs) (49%) simply for the reason that many
of the PCs specially women focussed had their base in the SHGs. Only 11% farmers reported
membership of cooperative society and 5% of another PC. Only 43% of the members knew
that they owned the PC. The biggest influence in their becoming member of the PC were the
PC promoters (75%). In 94% cases, they had not received any dividend on their shares so far.
Surprisingly, very vast majority (73%) did not have any complaint about the services provided
by the PC. 95% wanted to continue being member of the PC. Further 85% also stated that they
would encourage others to become members.
Before the intervention of the PC, 55% farmers sold directly to traders and 31% through the
APMC with only 12% reporting selling through PC. This proportion of APMC and direct sales
reduced to 28% and 44% and the PC channel accounting for 26%. So far as the diversification
of crop area due to the PC intervention is concerned the area increased marginally (2%) under
maize and soyabean (3%) and decreased under cotton by 3%. Not only the area, but also the
number of farmers growing these crops increased due to the PC intervention by a small
percentage.

150
Most of the member farmers still bought their various inputs from dealers which were high in
seeds and chemical pesticides. The farmer mostly bought from the PC for the reason of better
quality, easy accessibility and lower price. On the other hand, dealers were preferred for similar
reasons by other farmers.
Women PC member on the other hand, on an average operated land holding of 2.71 acres and
owned land 2.55 acres.
Only 39% of the all -women PC members had received share certificates and 87% also were
members of SHGs with some being members of other PCs. 53% knew that PC belonged to
farmers which was higher than those among all PC members. 90% of them had no dislike about
the services being offered by the PC and 20% even reported the PC helping them in availing
of government schemes and subsidies. 71% reported attending meetings. 58% participated in
all the meetings and 20% sometimes, and another 20% had never participated in any meeting.
All of them wanted to continue as members and also wanted others to join the PC. The only
crop in which the area had expanded after the PC intervention was cotton as most of the PCs
were focused on cotton. The price realisation in cotton had also gone up by 21% after the PC
intervention.
On the output side also, there was movement from good to very good in majority of the cases
especially on market availability. The number of members selling to the PCs had almost
doubled over the three years. There was no effect of the presence of PC on the non-member
farmers in terms of the sale of their produce or the crops grown.
65% of the non-women PC non-member farmers had not heard about the PC and 62% did not
know who owned it Only 28% wanted to become members of the PC and 25% has some
awareness about the initiatives of the PC with 29% even having attended some meeting of the
same. The ASA PC members perceived the input service of the PC improving its quality from
poor, average or good to very good, good and even excellent mainly in terms of cost
availability, accessibility and adequate quantity. There was no change in the sales channel used
by non-member farmers before and after the intervention of the PC where most of them sold
in wholesale with only one reporting sales through the PC. 45% of the members have received
share certificates and 2/3rd of the members were members of the SHGs. Only 18% members
knew that PC was owned by members with 50% having no ideal about the ownership of the
PC.
91% of the AKRSPI PC non-members did not have any problem with the services of the PC
but 57% also had no knowledge of it with 38% being aware of the initiative of the PC. None
of them reported any negative experience with the PC as none of them had transacted with the
PC. Only 10% reported receiving this information from the PC directly and 5% each indirectly
through the promoter or as a combination of various sources including the PC. 79% knew about
the existence of the PC in their area but 59% did not know who owned it with only 12% being
aware that it is owned by farmers. This was so because in 39% cases, nobody had provided
them any information with the rest picking it at from PC meetings and from their interaction
with the promoters. Only 19% desired to become a member of the PC.
The quality of inputs delivered by the PC and other channels had improved from good to very
good and excellent and the cost had also moved to the same direction as was availability and
to some extent quantity. On the output side, in general, there was an improvement in prices and
availability of the market for the output in terms of sales channels there was tripling of sale
transaction through the PC and some reduction in the APMC channel sales.

151
The members did not report any major changes in the cropping pattern yields or output due to
the intervention of the PC other than the fact that the cotton and soybean prices were appreciate
significantly during the last three years. The transaction cost had also come down in both cotton
and goat marketing. All of the members wanted to continue with the PC and 19% of them also
wanted to encourage other non-members to join the PC. Only two non-members farmers
reported selling through the PC compared to the pre-PC situation of one farmer selling to it.
The cropping intensity of IGS and Vrutti PC member farmers was high (2.08 and 1.99) and
low for PRADAN PC members (1.63) as some Pradan PC farmers were rainfed and other
dependent on rivers and shared wells. But, IGS PC farmers were medium land operators with
average being 16 acres compared with only 5 acres for Vrutti promoted PC members and 3
acres for Pradan PC. This was also one of the reasons for failure of the IGS promoted PC.
The Vrutti promoted Betul Krishak was almost defunct s it has neither mobilised enough equity
nor undertaken any business so far despite being there for 4 years. None of the farmers bought
any inputs from the PC and depended on dealers and PACS for the same and bought fertilisers
from the PACS. There was no change in any crop area or yield or output or even sales price
realisation as the PC had not intervened at all.
Pradan promoted PC had good interface with women members for input supply who all bought
from the PC. The PC mobilised Rs. 10 lakhs paid up capital within three years. The PC has
been undertaking seed contract farming in soya bean and wheat with 150 farmers and selling
it to the seed corporation or back to the farmer members for growing crops. It also sells maize,
cotton seed at lower than market price and claims that 75% of the members buy exclusively
from the PC. Major innovations of the PC included: seed contract farming, distant market
trading, and introduction of mechanical grading. On the external front, it faced problems of
lack of finance and high cost of loans. It also perceived competition from PACS and routing of
fertilizers through this mechanism by the Govt. as external competition.
On the output side, it aggregated crops like soya bean, maize, wheat and gram and had its own
brand – Dharti Natural. In terms of livelihood diversification, it introduced soya bean as a cash
crop and a new variety of wheat in the last few years. In 2015-16 it bought gram on behalf of
SAFC at MSP for 1% commission. It also facilitates sale of its members produce to wholesale
traders in various markets in M.P. and Gujarat.
The best case was that of Ram Rahim Pragati -an all women PC -which had very large capital
base and large revenue running in a few hundred million rupees annually beside being in profit
all the time and creating some assets including a warehouse with imported technology and a
processing facility. On the output side it aggregated various crops like wheat gram and maize
from 2600 members. It also makes use of warehouse receipt based loans for storing its produce
in its own warehouses. It is mainly into NPM produce and link and sells 90% wheat and gram
procurement to Safe Harvest Pvt. Ltd which has equity in this PC. The farmers members have
been into NPM practices for the last 10 years. It has also done job work for private players like
Big Basket. The PC has promoted red gram in the area and also reverse selling of pulses to the
member farmers by processing it into dal. It is the one of the very few PCs which have
participated in futures markets and made profits in maize but lost money in soya in 2016-17. It
plans to continue futures trading NCDEX in maize, out of the more 4000 members, 2600 sells
some produce to the PC. It has been able to get loans and grants from APF, Axis bank and
Nabkisan through promoting NGO though working capital and interest rates are still a
constraint.

152
Appendix 4.1
ASA PCs
ASA which had 53 PCs across four states of M.P, Jharkhand, Bihar and Chhattisgarh including
38 PC in M.P has an organisational structure which includes seven managers at the
headquarters, 15 area and Hub managers and 42 business facilitators. ASA has 38 PCs in
different parts of Madhya Pradesh with 9 of them in Shahdol hub. On the other hand, in
Bhudelkhand and Betul hubs, there were only one or two PCs promoted by it. In western MP,
there were 4 PCs each in Nimmad and Ratlam and two to three each in Petlavad, Ranakpur and
Jobat hubs. Some of these PCs had BCI cotton and organic cotton projects supported by global
buyers like C&A Foundation. ASA has 22 PCs engaged in organic cotton cultivation involving
12,000 farmers.
The major crops grown in the area included wheat and gram in Rabi season and Soyabean,
maize, urad and cotton in kharif season besides vegetable in summer.
Ranapur Mahila Tribal PC
The Ranapur PC promoted by ASA in Jhabua district was registered in 2012 and originated
from 125 SHGs existing since 2000 with 500 members who all became members of the PC.
Presently, the PC operates across 79 villages with 1442 members. The PC allows only land
owners to become members and average land holding was reported to be 1.25 acres. The shares
held by members range from 50 – 100 and all the members had been issued share certificates.
All the members are reported to be marginal and small landowners and women of whom 70%
were active members. The company had authorised capital of Rs. 20 lakh and paid up capital
of Rs. 14.11 lakh (Table 4.1). It also had reserves of Rs. 41,000. The PC had an APMC license
and most input sale licenses.
The BoD had five members (all women) to begin with and in 2017-18 had nine members of
whom six are women. It pays its CEO and the PC provides seeds of various crops to members
and also fertilizers and pesticides and mainly farmers buy from it because of lower price. The
company has a warehouse since 2014-15 which is used for aggregating and storing the produce.
It has a wholesale brand of its products called Dharti Natural. The PC has promoted larger
cultivation of soyabean and a new variety of wheat during the last four to five years. It
undertakes seed contract farming in soya and wheat seed for the state seed corporation which
involves 125 hectors and 500 tons of seeds. It has also been procuring gram for the SFAC at
MSP (50 tonnes) for which it received one percent commission. It also sells some of the
soyabean, chana and wheat produce procured from members in wholesale markets in M.P and
Gujarat like Devas, Dahod, Indore and Ujjain directly to traders.
Whereas all of the members transact with PC for input purchase, only about 70% of members
transacted with PC on the output side. 60% of its revenues come from output and 40% from
input sales. It agrees that 30% of members are not aware of the fact that they own the company.
The Company has had business plans since 2012 which are prepared by ASA and BOD
together. The PC has been able to receive the grants of the order of Rs. 7 lakhs in 3 instalments
in 2013-14 and has availed loans from NABkisan, FWWB, Ananya Finance and even ASA.
The BoD and SHGs have been provided training and exposure twice a year and the PC believes
that its seed production intervention is very successful. Its other innovations include: scaling
up and branding of produce. The PC faces shortage of working capital and therefore, not able

153
to meet all the demand for inputs from the members. It plans to focus on scaling up and tie ups
with govt. agencies for enhancing its revenues.
Table 4.1: Profile and performance of Ranapur Mahila Tribal PC
Year >
Parameter
2015-16 2016-17 2017-18 2018-19
Authorised Capital
(Rs. Lakh)
15 15 15 15
Paid up Capital 12.4 (83%) 12.4 (83%) 14.11 (94%) 14.11(94%)
Revenue (Rs. lakh) 27.54 28.02 64.15 l 45.22
Profit (Rs. Lakh) -2.68 -2.97 -1.58 .41 l
Reserve and Surplus
(Rs. lakh)
-6.79 -8.38 -7.97
Members (Nos.) 700 980 1000 1200
In 2017-18 the PC had receivables from many PCs as well as Samunati Finance, MBCFPCL
and revolving fund support from ASA of the order of Rs. 2 lakhs. In 2016-17 the company had
25 lakh loan from NABkisan and in 2015-16 it had Rs. 3.5 lakh loan from FWWB. The PC
reported inventories of the order of Rs.12.09 and Rs. 26 lakhs in each 2016 and 2017.
Photo 4.1: Small farmers in MP
Alirajpur Tribal PC
This PC was registered in 2013 from the existing self help groups (SHGs) of farmers and had
five board members. At present, the company has 808 members across 35 villages. Its
membership includes multiple members from the same household in some cases, and most of
the members are marginal or small landowners. 90% members are women, 70% members are
active. A board member needs to be a member self-help group, a farmer and should not hold
any Panchayat position. At present, the PC has no CEO.
It has authorised capital of Rs.15 lakh and paid up capital of Rs. 7.22 lakh (Table 4.2). It has
licenses for sale of seed, fertilizers and agrochemicals besides an APMC licence. The total area
of the members was 3800 hectares and these farmers are organized into groups of 25 to 500 for
organic group certification. There are 8 Internal Control System (ICS) teams for this project

154
being carried out for C&A Foundation. Besides input sales, it also runs a farm machinery
rental service for the last 1.5 years, which has been set up with 40% subsidy, but it has mainly
a thresher for various crops. It engages in seed contract farming besides trading of agricultural
produce.
The PC sells various bio inputs to members of which 25 to 60% buy these products mainly due
to lower price. Only about 25% input business comes from non-members. However, no
members exclusively buy any input from PC despite lower price, better quality, and easier
availability.
Table 4.2: Profile and performance of Alirajpur PC
Year >
Parameter
(Rs. Lakh)
2013-14 2014-15 2015-16 2016-17 2017-18 2018-19
Authorised
Capital
15 15 15 15 15 15
Share capital 1 (6%) 4.44 (30%) 7.22(48%) 7.22(48%) 7.22(48%) 7.22(48%)
Total Revenue 5.65 24.6 16.4 25.00 13.00 81.00
Profit 0.03 .49 (1.23) (1.35) (1.36) 0.3
The PC aggregates various crop produce and has rented a warehouse. 25% of its output
purchase comes from non-members. The PC claims that it has brought organic cotton to the
area. The PC has done only institutional sales specially selling of 80 tons of Urad to SFAC at
MSP in 2014-15. It has also sold in wholesale to ITC once and even sold in the APMC from
its members farmers under Bhavantar Bhugtaan Yojana (BBY) not only soya but also wheat
once. 40% of the members participated in inputs purchase as well as output sale to the PC.
The PC received matching equity grants from SFAC and loan of Rs 30 lakh from NABkisan
in 2017-18. It has also been able to receive financial assistance for the first few years under
DPIP and Mahila Kisan Sasaktikaran Plan (MKSP) projects. The BoD is trained every six
months. It is planning to limit input business and expand output purchase for larger impact on
the members. It is also planning ginning of cotton. The major problems faced by the PC
internally include: low awareness and literacy among the members, poor agricultural
infrastructure like irrigation and lack of finance. On the external front, competition from the
private sector traders who buy from Mandi level is an issue as PC incurs an additional cost of
farmer doorstep procurement.
AKRSP PCs
Nevali PC
This is the oldest PC in the state promoted by AKRSP. This PC was registered in 2014 and is
a block level PC covering 28 villages. It originated from 75 farmer interest groups organised
in 2013, 57 of whom are part of the PC. There are 1078 FIG members and 947 of them are
shareholders in the PC. Each group has 10 to 20 with average of 15 members. Originally, 10
promoters registered the company. All the shareholders are landowners owning 100 shares
valued at Rs. 10 each totalling Rs. 1000 per member. 150 of the shareholders have been given
share certificates and others are still pending. Of the total members, 200 are women who are in
most cases spouses of ex-members. The company has authorised capital of Rs. 10 lakhs, paid

155
up capital of Rs.5.38 lakh in 2018-19 and reserves of about Rs. 7 lakh (Table 4.3). At present,
the paid capital is Rs. 6.46 lakh. The PC has direct dealership only in bio-fertilizes from one
company and has APMC licence as a commission agent in the fruit and vegetable market as
there are no commission agents in the grain markets in M.P.
The PC has 5 board members elected for two terms of three years each right from the beginning
including one women member. The shareholders who intent to become directors need to be
motivators, and local influencers with no political background. The PC pays for its CEO who
is a Master’s degree holder but there is no other staff. The promoting NGO helps the PC in its
operations and office premises are also rented. The average land holding of the shareholder is
2.5 acres.
Photo 4.2: Office cum retail outlet of Nevali FPC
The PC is involved in the supply of various inputs like seed, biofertilizer, spray pumps and
irrigation equipment besides animal feed to member as well as non-member farmers. The
inputs business accounts for 45% of PC turnover and 20% of the input business comes from
the non-members. About 350 farmers buy inputs from the PC and 150 members buy their inputs
exclusively from the PC. Most of the cotton seed sold is non-BT and only a small percentage
of BT cotton seeds are sold to cater to the needs of farmers. 842 out of 947 farmers members
are also part of the organic cotton farming project which has 1500 farmers who are supplied
organic cotton seed. On the output side, the company gets processing of groundnut and cotton
done on job work basis which accounts for 60% of total turnover. Cotton accounts for 40% of
the output transactions and organic cotton 22% of it, with the rest being BT cotton. Some of
the farm inputs which are produced by the PC like bio-inputs account for 10% of the total input
sales. 30% of the total turnover of the company comes from the non-members. It is involved
in certification of organic farms on behalf of farmer groups. Even non-members contribute to
organic cotton procurement.
The PC has sold organic produce to global players like CARREFOUR and Non-Pesticidal
Management (NPM) pulses to domestic players like Safe Harvest India Pvt. Ltd., and BT cotton
to local players like Pratibha Syntex. The PC has promoted organic cotton cultivation among
both members and non-members and jowar and raagi (millets) among 150 farmers by not only
encouraging them to grow it but also buying this produce from the farmers. It has tried contract
farming of pulses with Green Gold Agri Biotech two years ago engaging 40 members. The
company did not buy as the produce did not meet the quality standards. But, most of the organic

156
cotton and organic chillies for Prathiba Syntex are under contract farming arrangements as
farms require conversion and certification over a number of years. The seed from organic
cotton is sold to local oil millers. The PC gets a facilitation fee of Rs. 50 per quintal after
meeting all expenses. 97 farmers produced and supplied organic cotton to CARREFOUR.
Similarly, NPM groundnut produced from 40 members was sold to Safe Harvest India at 5%
premium over market price and all the costs of purchase were met by the buyer. The PC has
also been selling organic produce of member farmers in retail in local markets. The PC gets a
premium of 10% on organic lint price compared with conventional lint price. In the retail
market, it has been selling sweet potato, beetroot and organic product.
The PC is registered on National commodities and derivatives Exchange (NCDEX) but has
never traded. It has received management support of two staff for three years, but not matching
equity grant as of now. However, it has been able to receive a Corporate Social Responsibility
(CSR) grant through the promoting agencies from Azim Premji Foundation. The business plan
of PC was prepared by another professional NGO-BASIX. In 2018-19, the PC also availed a
short term loan from Cotton Federation for Rs. 6 lakhs for cotton procurement and also similar
loans from other PCs promoted by AKRSP. One staff of the PC is funded by the promoter
who looked after another two PCs as well. The promoter had also given training to BoD on
leadership, business management and to CEO and the staff on accounts related matters. It also
organized exposure visits to other PC in M.P. and Gujarat. It saw its own brand in bio-inputs
and focus on output marketing as best practices which other PCs should follow. The other
innovations included: decentralized procurement and quality seed production. On the process
innovations, organic farming practices in cotton and other crops in the same farms including
facilitation of market with private market linkages for 7000 of its 12000 farmers in M.P. out of
whom 3000 are fully organic across PCs was an important innovation. It was also planning to
move from NPM to organic gradually as there is overlap between NPM and organic farmers.
In terms of challenges faced by PC major ones include: lack of availability of adequate organic
seeds and low risk capability of the PC besides unsold stocks of various inputs. On the output
side, limited market and poor bargaining powers besides poor govt. linkage is also problematic.
The local resource persons (LRPs) provided extension to the farmers on behalf of the
promoting NGO. It believes in having multiple channels for farmer produce in the local area.
it is also planning to open 6 retail outlets for selling input and output products.
Table 4.3: Profile and performance of Nevali PC
Year >
Parameter
2015-16 2016-17 2017-18 2018-19
Authorised Equity (Rs. Lakh) 10 10 10 10
Paid up capital (Rs. Lakh) 1 (10%) 1 (10%) 3.38 (34%) 5.38 (54%)
Revenue (Rs. Lakh) 5.86 50.95 80.4 133.1
Profit (Rs.) -2664 28272 21111 682979
Reserves and Surplus (Rs.) -10584 -9312 694778
% of shares held by Promoters 100 100 30
% of shares held by Directors 50 50 15
Total Assets (Rs. Lakh) 6.41 6.22

157
Pandhana PC
Pandhana Pashu Palik PC in Khandva district was registered in 2016. The NGO-AKRSPI had
organised women SHGs across 25 villages. Now there are 672 shareholders of the company
each contributing Rs. 1000. The authorised capital of the PC was Rs. 5 Lakh and paid up capital
Rs. 2.99 lakh in 2018-19 (Table 4.4). At present, the PC has membership across 46 villages
and 40% of the members have livestock. The members have been given only receipt of share
money and not a share certificate as of now. Most of the members (400) rear goats of local
breed for the purpose of meat, 200 also do poultry and others do both. Each member has 5-6
goats and in the case of poultry 15- 20 birds. 400 members are active. The animals are sold in
the Pashu Bazaars organised by the village panchayats.
In 2016, it had 250 SHGs of which 46 groups become members of the PC. The local area is
known for Barihi breed of goat. 80% of the households also have some land ownership. The
Pashu Sakhis keep an account of animals which can be sold to PC and bring in the buyers. 30%
of the goats and 50% chicken are sold through the PC. A shed costs Rs. 3000 to 4000, the
major cost being the cost of the jaali (fence). The member farmers also grow crops like soya
bean, maize, cotton, tuvar, onion, wheat, and green peas.
The PC has five Directors of the Board all of whom are original promoters of the PC. All of
them are also working as Pashu Sakhis. The PC has one CEO paid by it who is helped by
Pashu Sakhis.
The PC provides poultry birds, goats and feed. The day old chicks are sold @ Rs. 20 each.
15% of the poultry birds and 30% of the goats are bought from or through the PC. 30% of the
input business of the PC comes from the non-members. There is no animal insurance for the
members. However, vaccination and de-worming of the goats is done at regular intervals. The
PC does not directly buy output or animals but facilitates the sale while working with traders
after making an assessment of the supplies. A trader then either physically inspects the animals
or sees a photo before agreeing to buy. PC gets 5% commission on sales. The members also
received 40 goats under the fight hunger funds project. The meat is sold in wholesale @ Rs.
150 per/kg. The PC also started selling fresh meat at weekly heats where two goats meat is sold
@ Rs. 400 per/kg. The cost of rearing is about Rs. 90 per/kg. The goats are mostly feed
chaapad (wheat husk and bran) and mineral mixture- UMB. The Muskan Brand of Urea
Molasses Blocks (UMB) as well as mineral mixture and poultry feed are produced by the
members who are organized into Pashu Palak (livestock rears) groups of 20 to 25 each.
The PC buys only 10% of the output from non-members. During Eid, 30% of the total sales
are realised. Earlier, the animals were being sold by assessing their weight visually. An average
animal of 30 kg was sold @ Rs. 250 per/kg giving Rs. 7000 on weight basis compared with
only Rs. 6000 on visual assessment. 70% of the revenue of the PC comes from commission
received on wholesale transaction with the traders and 30% from the animals bought from the
members and sold by PC in retail for meat.
An average goat gives two cycles of delivery with 2 to 3 kids in each cycle of pregnancy and a
kid takes 8 months to become adult. A goat has an average age of 11 years. The cost of a kid
of 4 to 5 months is Rs. 2000 to 4000 and Rs. 5000 to 6000 after 8 months. The cost of rearing
a kid for sale on the occasion of Eid is Rs. 1500 to 2000 compared with general cost of Rs. 500
to 700. However, a kid specially raised for Eid is sold for Rs. 10000 to 15000 each. Major

158
disease of a goat includes foot and mouth and dart and in poultry it is in Ranikhet. The non-
members are offered Rs. 20 to 30 lower prices in the case of goat and Rs. 5 per/kg lower in
case of poultry bird compared to those offered to members.
The major components of its turnover include: sale of goats, mineral mixture, UMB, poultry
feed and chicken. In 2017-18, the company operated across 28 villages with 600 shareholders
and Rs. 2.9 lakh share capital. In 2018-19, its shareholders had gone upto 684 and share capital
to Rs. 3.45 lakh. In 2018-19, the PC also added new source of revenue which includes
buffaloes, maize, soya Deoiled Cake (DoC) but sale of goats still remains the most significant
activity in terms of revenue.
The PC had not made profit until last year (2019-20) because the goats bought for Eid could
not be sold locally and even in Indore which led to loss of Rs. 2 lakh. The PC had availed of a
bank loan of Rs. 5 lakhs for revolving fund and a grant of Rs. 3 lakh from a Foundation. The
company aims to reach a membership of 1000. Its Board has been given a five day training
and 100 members were taken for exposure trip once. The PC claimed that 50% of the members
were aware that the PC belonged to them. The PC treats own production and markets of some
of the inputs as best practices. Besides that, it also considers weight based purchase as
innovation and thinks that it can survive even after promoter support is withdrawn. The farmers
sell to PC on advance payment basis or a week’s credit. The major constraint faced by the PC
is lack of financial resources. The PC plans to scale up to achieve viability of its operations.
The company has so far not given dividend to members.
Table 4.4: Profile and performance of Pandhana PC
Year >
Parameter
2016-17 2017-18 2018-19
Authorised Equity (Rs. Lakh) 5 5 5
Paid up capital (Rs. Lakh) 1 (20%) 1 (20%) 2.99 (60%)
Revenue (Rs. Lakh) 2.78 14.7 23.9
Profit (Rs. lakh) 0.01719 1.79 1.09
Reserves and Surplus (Rs.) 1719 25369 31041
Chirayu Women Crop PC
This PC registered in 2015 has its origins in the self-help groups (SHGs) of women operating
since 2008 dealing with water sheds, poultry and other farm inputs. It operates across 32
villages of two blocs in Betul district and has 1000 members. Most of the members are from
marginalised categories like SC, ST, BC and small or marginal land owners. The board of
directors has 10 women members and they are representatives of farmer groups. The members
of the PC also have membership of Primary Agricultural Co-op Societies (PACS) in some
cases as most of the members are landowners. 75% women members are active. The authorised
capital of the PC has been raised from Rs. 10 lakh in 2017-18 (Table 4.5) to Rs. 25 lakh. The
PC paid up capital is Rs. 20 lakhs including 50% of it contributed by Small Farmer
Agribusiness Consortium (SFAC) as matching equity contribution. The PC also has reserves
of the orders of Rs. 25 lakhs. It has various licences for sale of farm inputs and purchase of

159
farm output though it has no warehouse facility. The PC mobilised Rs. 10 lakh paid up capital
within three years. The PC has seven field staff besides the CEO and their salaries are paid by
the PFC for the last two years thought initially for three years paid by SFAC and before that
by the promoting agency. The PC has been undertaking seed contract farming in soya bean
and wheat with 150 farmers and selling it to the seed corporation or back to the farmer members
for growing crops. It also sells maize, cotton seed at lower than market price and claims that
75% of the members buy exclusively from the PC.
On the output side, it aggregates crops like soya bean, maize, wheat and gram and has its own
brand – Dharti Natural which will be used to promote its wholesale business. In terms of
livelihood diversification, while introducing soya bean as a cash crop and a new variety of
wheat in the last few years. 7% of its input sale and 20% of output turnover comes from non-
members. In 2015-16 it bought gram on behalf of SAFC at MSP per 1% commission. It also
facilitates sale of its members produce to wholesale traders in various markets in M.P. and
Gujarat. Inputs supplies which are bought by all the members account for 40% of turnover
where 60% of this turnover comes from 70% of the membership. The PC has received loans
from Navkissan and Ananya Finance and ASADAS and most of the previous loans have been
repaid and new ones acquired from Navkissan and ASADAS. The promoting agency still
provided technical and financial support to the PC. The promoter has trained BoD twice every
year on issues of membership, ownership, legal aspects and business plan; and members have
been taken to other PCs in Maharashtra for exposure. It claims that the introduction of high-
quality maize seeds has led to quadrupling of the yields. It is of the view that the innovations
of the PC include: seed contract farming, distant market trading, and introduction of mechanical
grading. Major problems faced by the PC include: lack of awareness and market orientation
among the shareholders of whom only 75% think it is their company. On the external front, it
faces the problems of lack of finance and high cost of loans. It also perceives competition from
PACS and routing of fertilizers through this mechanism by the Govt. as external competition.
The company has not yet engaged in NPM and organic production, but it plans of expand seed
contract farming and build govt. linkage for sale of its seed besides expanding the membership
to 3000.
Table 4.5: Profile and performance of Chirayu Women Crop PC
Year >
Parameter
2015-16 2016-17 2017-18 2018-19
Authorised Equity (Rs. Lakh) 10 25 25
Paid up capital (Rs. Lakh) 7.5 (75%) 15(60%) 15 (60%)
Revenue (Rs. Lakh) 60.83 139.5 133.29
Profit (Rs.) 39850 31800 70000
Reserves and Surplus (Rs Lakh.) - 1.31 2.09
No. of shareholders 980 1000 1200
The PC has planned to provide inputs for various cereal and vegetable crops during 2015-20.
However, it was doing so only in wheat, maize, gram, onion and cauliflower. On the output
side, it did not plan to increase its purchase of wheat and gram due to working of the MSP
based procurement in the area and lack of storage facility with the PC. The PC plans to buy
about 100 tons of each of the paddy wheat and maize crop and 300 tons of gram and half ton
of onion in the first year of the plan. Overall, the PC plans to handle Rs. 217.75 lakh of produce

160
and earn a profit of Rs. 10.87 lakh. The PC would require Rs. 38 lakhs as working capital and
could provide for 25% from its own sources. It had budgeted for 10% income decline and still
hoped to earn profit every year. The business plan had profits of Rs. 7.6 lakh in the first year
going upto Rs. 23.7 lakh at the end of the five-year plan and the membership increasing from
1000 to 1500 over five years. It also planned to collect a service fee Rs. 200 per farmer per
year giving it Rs. 2 lakh in the first year and Rs. 3 lakhs by the fifth year totalling to Rs. 13.4
lakh over five years. It planned to capture 50- 70% of the input supply of the major crops like
tomato, chilly, brinjal, onion, maize and wheat. An equivalent amount of its revenues was
expected to come from output trading and from input supply each.
Photo 4.3: Maize being dried in MP after harvesting and threshing
Mhow Agri PC
The PC registered in 2014 emerged from SHGs and covers 20 villages. In 2017, the share
money was withdrawn by the members and 7 out of 10 board members resigned. There are 600
members with share capital of Rs. 6.8 lakh and authorised capital of Rs. 10 lakh but only Rs.
one lakh worth of shares had been issued (Table 4.6). By the time, it was made inoperative, it
had a turnover of Rs. 4.5 lakh in 2016-17. The PC was struck of by the MCA as it did not file
returns.
As per Grant Thompson report, 1000 farmers across 14 villages were organized into 50 FIGs
with 20 members each and an executive committee of FIG leaders selected first five directors
and promoters for the registration of the PC. The catchment area of the PC is 3250 households
and 13 889 hectares of farm land in a radius of 30 kilometres. The average land holding of the
members is 4.27 hectares.
It was revived in 2019-20 with 25% old and rest being new members. 75% of the members are
vegetable growers. Only 100 members are allotted share certificates of the 800 farmers. Most
are medium and large farmers and only 50% are active. 20% members are women. The PC
has APMC trading and machinery agency (CHC) licence. The Board members are politically
affiliated and become members depending on how many members they bring in. Now, there
are three women members of the board out of 10 which was two in 2018. The PC has a CEO
and a marketing officer. On the input side, it mostly deals with seeds fertilizers and pesticides
and the 75% of the sales are to the members. On the output side only in 2018-19 it undertook
procurement for the SFAC worth Rs. 20 lakhs. Earlier in 2017 it had also dealt with potato
and onions while facilitating their sale to the SFAC and last year it facilitated sale of garlic to

161
Mumbai traders and earned a commission of 2%. PC will be shut down if there is no transaction
continuously for two years. The SFAC which has given land for godown, has appointed Grant
Thompson as consultants, to the PC to develop market linkages. This agency has prepared and
submitted a report in 2019 which details of the profile of the PC. The authorised capital of the
PC was Rs. one lakh and as of 2018, the PC had collected Rs. 5.86 lakh share money from
farmers. It had proposed to increase the authorised capital to Rs. 10 lakh and was planning to
apply for matching equity grant from the SFAC. In 2019, PC had 686 farmers from 14 villages
with an average land holding of 4 hectares each. Major crops of interest of the PC include:
soya bean in kharif and onion, potato and garlic and rabi season. The engagement of Grant
Thompson (GT) India LLP was for a period of two years from July 2018 to May 2020 through
an agribusiness promotion unit (ABPU). The GT India analysed 332 PCs under SFAC in the
states of M.P. West Bengal and Karnataka and shortlisted 149 of them based on turnover and
current operations besides RI request. Finally, 10 promising PCs in each state were taken up
for support under ABPU.
Photo 4.4 Office cum farm input sales outlet of Mhow APC
Mhow agri farmers PC is one of the 11 shortlisted for support in M.P. The report states that PC
is operational only for one year and into input and output trading. The 14 villages which have
100 to 500 producers in the cluster has three to as many as 191 shareholders in the village
where PC is registered and an area of minimum of 1-4.5 hectares per share holder going upto
7 hectares in another village. The BoD has five members of whom one was a woman in 2018-
19, had landholdings ranging from 2 to 6 hectares. Each board member had different roles
ranging from overall responsibility of maintenance of PC and legal responsibility and executive
responsibility and maintaining day-to-day operations besides community mobilization.
Business Plan
GT made a five-year plan for the PC which included interventions on the input as well as output
side of the major crops identified for intervention. It was projected that by the end of 5 years
the PC would have 1499 members of whom 450 would be active members and PC would also
deal with 150 non-members starting with 137 active members and 34 non-members in the first

162
year of the plan. Based on the average land holding and seed rate and other inputs used for
various identified crops the projected revenue for different crop input over 5 years was
generated on the output side, with similar assumptions of active members and non-members
procurement led to revenues from procurement and sale of the agriculture produce. It was stated
the PC was aggregating only 5% of the marketable surplus of the targeted farmers. 80% of the
procured produce is targeted in the business plan to be sold to processing units and traders in
terminal markets. The company assumes employment of CEO and 3 supporting staff. It came
out with working capital requirement of Rs. 14.73 lakh in the first year going upto Rs. 103.56
lakh by the fifth year, most of which (80%) was to be met by loans. It had planned to generate
revenue of the order of Rs. 176.8 lakh in the first year going upto Rs. 1242.7 lakh by the fifth
year and this would generate profits of the order of Rs. 5.4 lakh in the first year and Rs. 37.2
lakh in the fifth year.
The equity of the company was assumed to be Rs. 12.35 lakh in the first year of the plan and
Rs. 146.2 lakh by the end of fifth year. The BoDs of the PC were given training by the promoter
on the management, and governance of the PC only once. The major problem identified by the
IGS representative was that since the farmers are medium and large land owners, they only
need market linkage and not many other services. This has become a hurdle in the progress of
the PC, but the area was picked up because of the production of the vegetables in the area under
the vegetable clusters programme of the SFAC.
Table 4.6: Profile and Performance of Mhow Agri PC
Year >
Parameter
2014-
15
2015-16 2016-17 2017-18 2018-19 2019-20
revived
Authorised Equity (Rs. Lakh) 10 10 10
Paid up capital (Rs. Lakh) 1 (10%)
(6.73)
1 (10%) 1 (10%)
(5.86)
Revenue (Rs. Lakh) 4.61 7.46 20.46 4.12 -
Profit (Rs.) 12576 20700 1297 96283 -
Reserves and Surplus (Rs.) 6576 27288 28585 124869
Betul KUPCL
BKUPCL promoted by Vrutti with the help of an international NGO -PACS- which was funded
by BFID during 2004-6. This NGO learnt about the PC concept in 2013 and roped in Vrutti to
promote the PC in the area which covered 20 villages across 7 panchayats. Originally the
Grameen Vikas Samsthan (GVS) which worked with UNICEF and Govt. of India on women
and children was handling the project.
In the case of Betul P.C promoted by Vrutti, there were 506 members with authorised capital
of Rs. 10 lakh and paid up to capital of Rs. one lakh (Table 4.7). All the members of the PC
are landowners and have minimum shares of Rs. 500 with the board members having between
100 to 10000 shares out of the 506 members now 18 are women and all of them are inactive
now. It had 9 board members including three women. It had never undertaken any transaction
on the input side and had only bought produce from 77 non-members only once. The PC has
also had an APMC licence. The procurement was for the SFAC and had to be met by procuring
from non-members from other mandis as none of the members were active. It also facilitated

163
once 197 farmers under BBY in 2018-19 to sell their pulses under this scheme. The PC had
only the CEO who is a graduate and had a week long training from BIRD in 2019. It had not
received any grants ever and had not paid any dividends though it had a business plan which
was prepared by Vrutti. It had received financial assistance of Rs. 5.04 lakhs from NABARD
through its POPI (Vrutti). The BOD members were provided training by the POPI and members
were taken to other PC, KVK and to Dahod for exposure visits. The PC is a member of MP
consortium of PCs.
Major problems faced by the PC from within included: lack of capital and farmer mindset
whereas on the external front it was still being not treated as a cooperative and a procurement
centre under MSP policy was not being allowed. The CEO was not sure about the survival of
PC until a conducive policy environment is created. The CEO could not name any Vrutti PC
in Madhya Pradesh which was working well and ended up naming ASA PCs in eastern MP
and was of the view of that they were working well because the farmer landholdings are larger
there. He was not aware of any other PCs which were doing well. The area grows mainly
wheat, soya bean, maize and chana which were planned to be targeted by PC but continuous
drought during the last few years led to decline in the production of these crops.
The authorised capital of the PC is Rs. 1 lakh and paid up capital of Rs. 50600. The PC was a
member M.P. Consortium of PCs. The PC intervened to purchase various pulses at MSP from
the farmers or the SFAC which gave working capital advance for the same. However, since
local farmers did not produce this crops the PC bought it from the market and supplied it to the
SFAC. It was given a loan by the Nabard of Rs. 5 lakh and the promoter agency had taken the
board members and other farmers members on exposure visit to other PCs and Krishi Vigyan
Kendras (KVKs).
Table 4.7: Profile and Performance of Betul PC
Year >
Parameter
2015-16 2016-17 2017-18 2018-19
Authorised Equity (Rs. Lakh) 10 10 10 10
Paid up capital (Rs. Lakh) 1(10%) 1(10%) 1(10%) 1(10%)
Revenue (Rs. Lakh) 0 0 117.82 0
Profit and Loss (Rs.) -0.28 -8.17 8.65 -0.36
Reserves and Surplus (Rs.) -0.28 -8.45 0.2 -0.16
% of shares held by Promoters 100 100
In 2016-17 it had purchase moong worth Rs. 17.82 lakh and received commission of Rs. 1.62
lakh for the same. Besides reimbursement of expenses from FSAC of the order of Rs. 3.9 lakh
besides NABARD loan it has also received a grant of Rs. 1.74 lakh from Vrutti. In 2018-19 it
once again received a grant of Rs. 2 lakh from Vrutti. It had an APMC licence as a wholesale
trader for which it had paid 10000 and the license was valid for five years.
The promoter made one year business plan for the PC which was mainly about sale of seeds
fertilizers and feticides besides spray pumps and the procurement of crops of moong gram soya
bean and wheat. It had projected monthly cash flows and capital costs of shop rent and working

164
capital cost for sale of various input for three months. By handling Rs. 1319.6 lakh of
purchasers was to sell for Rs. 1372.8 lakh earning very meagre profit of Rs. 53 lakh.
Ram Rahim Pragati PC
This PC promoted by SPS was registered in 2012. It had its origins in the all women self-help
groups which is 20-year-old which used to aggregate its produced and sell together. The PC
has 304 groups across 400 villages who are members of the PC with each paying Rs. 500 per
members. All the members are land owners and average land holding is 4 acres. 50 to 60% of
the members are tribal households. The authorised capital of the PC is Rs. one crore and paid
up capital Rs. 58.82 lakh (Table 4.8). The share certificates are in the names of SHGs and
directors of the board who have contributed Rs. 10000 each. The company made losses for the
first four years and now has been profits for three years. It has licenses for sale of seed and
trading of output. The board has 7 members including one male the members are elected by
the share holders, Besides the CEO there are 4 supports staff. The company has its own
warehouse and processing facility. The members and non-members are given the same price
on output purchase. On the input side, it sells seed to about 250 members on advanced booking
and payment of 30% of the price. On the output side it aggregated various crops like wheat
gram and maize from 2006 members. It also makes use of warehouse receipt based loans for
storing its produced in its own warehouses. It is mainly into NPM produce and link and sells
90% wheat and gram procurement to Safe Harvest Pvt. Ltd. The farmers members have been
into NPM practices for the last 10 years and so far, only wheat has been rejected once by safe
harvest based on sample tests for which the buyer pays.
Photo 4.5: Newly constructed modern warehouse of RRPPC
The PC has promoted crop of red gram in the area and also reverse selling pulses to the member
farmers by processing it into dal. It has also dealt with non-members in maize procurement
upto 10% of total procurement. It is the one of the very PCs which has participated in futures
markets and made profits in maize but lost money in soya in 2016-17. It plans to continue
futures trading NCDEX in maize, out of the more 4000 members, 2600 sells some produce to
the PC. It had also received match equity grant to Rs. 9.55 lakh in 2014 itself from the SFAC
besides it has been able to receive loans and grants from APF, Axis bank and NABkisan
through promoting NGO. The promoting agency has never given any exposure to the board of
directors and its promoters in the past. 250 groups purchase inputs from the PC and sale of
seeds to non-members is less than 5%. The PC had also dealt with 6000 quintals of sweet corn
to private buyers. It also undertook grading of gram last year for Big Basket. It is exploring

165
supply of wheat flour to local restaurants. The major problem it faced was availability of
working capital loan at very high rate of interest.
It also had Rs. 2.5 lakh equity investment from Safe harvest India pvt ltd which is a unique
arrangement as SHI is a private civil society promoted company and buys from RRP PC.
Table 4.8: Profile and Performance of RR Pragati PC
Year >
Parameter
2015-16 2016-17 2017-18 2018-19
Authorised Equity (Rs. Lakh) 40 40 100 100
Paid up capital (Rs. Lakh) 20(50%) 39.02
(98%)
58.8(59%) 58.8(59%)
Revenue (Rs. Lakh) 148.47 177.71 268.23 518.12
Profit and Loss (Rs.) 0.24 2.53 12.01 1.20
Reserves and Surplus (Rs.) -38.91 -36.37 24.36 23.15
Total Assets (Rs. Lakh) 0.59 0.79 6.26 12.18

166
Chapter 5
Performance and Impact of PCs in West Bengal
Introduction
West Bengal is one of the major agricultural states of India with the agricultural sector
accounting for 18% of its GDP and 45% of workforce. It is the 4th largest state economy in
India, the largest producer of paddy, jute, pineapple and brinjal and cabbage. It also has 14%
of India’s fish production and ranks second in its production in India. WB accounts for 20% of
India's paddy production and 33% of potato being the second largest producer (Rani et al,
2018). It is also the second largest producer of tea and has the second largest cold storage
capacity (Mondal et al, 2017). It has cropping intensity of 185 much above the national average
of 142. It has six agroclimatic zones.
70% of its food grains area is under rice of three different seasons of aman, boro and aus with
wheat and pulses taking only 4% and 3% of cropped area. The major non-food cereals include
oilseeds, jute and potato (9%, 7% and 5% share in GCA each) respectively and vegetables
account for 14% of India’s total production. In fact, its rice production is 16% of India’s total
and oilseeds 7% of total and jute and mesta as high as 75% of India’ total production. Potato
production of the state makes almost 20% of India’s total production. Rice and wheat have
grown at a very high rate during the last three decades and higher than that in U.P and Punjab
respectively. Potato too grew higher than that in Bihar and as high as in MP. The area under
fruits and vegetables has increased from 12% in the late 1980s to 16.7% in 2014-15. It has
irrigation intensity of 59% (Mondal et al, 2017) and mostly farmers use tubewells for irrigation
in kharif and rabi (32% and 45% of GCA respectively) followed by canals (10% in each season)
and tanks, rivers and wells (3-6%, 3-5% and 2-3% each) respectively.
As many as 97% holdings was marginal or small mostly marginal (90%) and there are no large
farmers with only 2% farmers being semi-medium and o.2% medium. The area operated by
S&M farmers is 85% and those by other categories only 15%. Therefore, land inequality
compared with India average is only half and very low (0.31 versus 0.56 Ginni for India). More
farmers lease in land than in India (14% compared with 10% in India) (GoI, 2010). The average
operated land size is 0.77 hacs and farmer income is one of the lowest (27th rank) in India,
below national average and above only that of Bihar. The farmers have rarely received MSP
and harvest prices of paddy have been even lower than the cost of production during the last
10 years (Mondal et al, 2017). It had 478 FPOs majority of which were promoted by NABARD
(296) and 182 by SFAC. Only 295 were farm produce based FPOs which is about 40% of all
FPOs (Rani et al, 2018).
In this context, it is crucial to examine the role and potential of farmer PCs in enhancing farmer
income or reducing production and marketing risk. The first section of this chapter profile and
analyses the physical and financial performance of the case study PCs in a comparative manner.
Section 2 examines member and non-member profile and the member impact from PC
intervention. Section three compared the profile and performance of PCs organised by different
promoters. Section four concludes the chapter.

167
5.1 Profile and Performance of PCs in West Bengal
It can be seen from Table 5.1 that in WB, most of the PCs had mobilised high %age of
authorised capital except Shantiniketan, though authorised capital itself was small or modest
in most cases (Rs. 10 lakh) except one PC (Hooghly) which had Rs. 25 lakh authorised capital.
Further, their revenue remained low (< Rs. 50 lakh) except one case (Chhatna) which was
mainly due to the fact it had a franchise of Sufal Bangla and therefore, its turnover could go up
to Rs. 3 crore per annum. Therefore, they made negligible profit or net losses except the
Chhatna PC which made a small profit after taking franchise of Sufal Bangla. Except Hooghly
PC, most of them had a small size of membership which is problematic given the small size of
land holdings in the state. This kind of small membership can’t generate large equity capital
and large volumes for viability.

168
Table 5.1: Profile and Performance of various PCs in WB
PC Shimplapal Agro (IGS) Chhatna Agro (IGS) Hooghly Vegetable Growers
(IGS)
Birbhum PCL (BKSL) Shantiniketan (BKSL)
Yea
r
2015
-16
2016
-17
2017
-18
2018
-19
2015
-16
2016
-17
2017
-18
2018
-19
2015
-16
2016
-17
2017
-18
2018
-19
2015
-16
2016
-17
2017
-18
2018
-19
2015
-16
2016
-17
2017
-18
2018
-19
Autho.
Cap
(Lakh)
10 10 10 10 10 10 10 20 25 25 25 25 10 10 10 10 10 10 10 10
Paid up
Cap
(Lakh)
2.53
(25%
)
3.17
(32%
)
7.19
(71%
)
9.71
(97%
)
3.36
(34%
)
3.36
(34%
)
7.36
(74%
)
13.36
(65%
)
10
(40%
)
20
(80%
)
20
(80%
)
20
(80%
)
4.07(41
%)
4.19(42
%)
4.19(42
%)
7.55(76
%)
2.08(21
%)
2.08(21
%)
2.97(30
%)
5.04(50
%)
Revenu
e
(Lakhs)
3.1 19.3
7
29.1
5
30.2 30.7
3
41 97.5
2
321.6
5
26.0
4
23.6 8.9 21.1 5.27 15.88 5.85 29.85 1.71 1.4 2.36 19.63
Profit
(Loss)
(Lakhs)
-0.46 1.04 0.65 1.46 -0.45 1.44 2.53 6.23 0.93 1.44 -1.27 0.16 0.88 0.57 0.34 1.04 2.58 -1.04 -4.37 3.99
Reserv
es &
Surplus
(Lakh)
1.43 1.31 4.16 0.76 2.6 3.95 9.65 2.25 3.7 2.42 2.54 0.88 1.46 1.8 2.85 2.58 1.53 -2.83
Assets
(Lakh)
0.77 0.58 1.72 8.26 0 0.28 0.19 3.4 1.09 0.88 1.49 1.49 0.76 0.58 0.8 0.75

169
5.2 Analysis of PC Member and Non-member Profile and Impact
83% of the members of the PCs in the state were male and the average age of the member
farmers was 46 years with only 13% of them being illiterate. There was significant proportion
(36%) which was middle standard literate followed by high school (27%). There were 5%
under graduates and the similar proportion were graduates with only 9% primary literate (Table
5.2). 86% of the non-member farmers were men with an average age for all famers including
women farmers being 44 years. 29% of the farmers were middle school literate. 23% high
school and 10% graduates. The others were either illiterate (21%) or higher secondary or
primary level literate (8% and 10%) respectively.
84% of them reported farming as primary occupation followed by petty business and salaried
job with 5% each with only 3% reporting animal husbandry as the primary occupation and
another 3% casual labour being their main source of livelihood. On the other hand, 56% did
not report any secondary occupation and 16% reported it as farming, 9% handicrafts and 8%
skilled labour. Only 3% reported animal husbandry and 6% casual labour (Table 5.3 and 5.4).
77% of the non-members reported farming as primary occupation with 11% reporting business
as the primary occupation and 10% casual labour. Amongst secondary occupation reported by
only 37% farmers farming again emerged as a major secondary occupation reported by 19%
followed by business and labour at 8% and 10%. Surprisingly, animal husbandry did not come
in as either primary or secondary occupation.
Table 5.2: Distribution of PC member and non-member farmers by education
Category Members Non-members
Parameter >
Level of Education
No. of
farmers
% of all No. of
farmers
% of all
Illiterate 8 12.5 13 20.97
Primary 6 9.38 6 9.68
Middle School 23 35.94 18 29.03
High School 17 26.56 14 22.58
Higher Secondary 4 6.25 5 8.06
Under Grad 3 4.69 0 0
Graduate 3 4.69 6 9.68
Total 64 100 62 100
Table 5.3: Distribution of PC member and non-member farmers by Primary
Occupation
Category Members Non-members
Parameter >
Primary Occupation
No. of
farmers
% of all No. of
farmers
% of all
Agriculture 54 84.38 48 77.42
Animal husbandry 2 3.13 0 0
Labourer 2 3.13 6 9.68
Skilled Worker 3 4.69 1 1.61
Business 3 4.69 7 11.29
Total 64 100 62 100

170
Table 5.4: Distribution of PC member and non-member farmers by Secondary
Occupation
Category Members Non-members
Parameter >
Secondary Occupation
No. of
farmers
% of all No. of
farmers
% of all
Agriculture 10 15.63 12 19.35
Animal husbandry 2 3.13 0 0
Handicraft 6 9.38 0 0
None 36 56.25 39 62.9
Service 1 1.56 0 0
Skilled Labour 5 7.81 0 0
Labourer 4 6.25 6 9.68
Business 0 0 5 8.06
Total 64 100 62 100
56% of the members had received share certificates and 88% of them did not report
membership of any other group or collective except a few being members of the PACS. 48%
of the members relied exclusively on PC for agricultural information with 27% depending on
other farmers and friends. PC also figured along with friends and relatives and mobile groups
besides ADO and dealer in another 19% cases.
The members were mostly marginal (72%) and small (20%) in their land ownership with
average size of owned land being 1.99 acres and operated just 2.32 acres (Table 5.5) with only
8% being semi medium landholders who accounted for 26% of land with the rest 75% being
with the small and marginal category farmers (Table 5.6). The operated land was also
distributed similarly with 91% farmers operating marginal or small farms accounting for 73%
of the cultivated area and 9% semi medium farmers operating 27% of the land (Table 5.7). But,
members were larger than their non-member counterparts who had average owned land of 1.29
acres and operated farm of 1.61 acres (tale 5.5).
Table 5.5: Average Owned and Operated Land of PC Members and Non- Members
Average Land
(acres) Members Non-Members
Owned 1.99 1.29
Operated 2.32 1.61

171
Table 5.6: Distribution of PC member and non-member farmers by Owned Land
Category Members Non-Members
Parameter >
Owned Land (Acres)
No. of
farmers
% of
all
Owned
Land
% of all No. of
farmers
% of
all
Owned
Land
% of all
Marginal 46 71.88 53.45 41.81 55 88.71 57.96 72.43
Small 13 20.31 41.72 32.63 6 9.68 17.06 21.32
Semi-medium 5 7.81 32.67 25.56 1 1.61 5 6.25
Total 64 100 127.84 100 62 100 80.02 100
Table 5.7: Distribution of PC member and non-member farmers by Operated Land
Category Members Non-Members
Parameter >
Operated Land
(Acres)
No. of
farmers
% of all Operate
d Land
% of
all
No. of
farmer
s
% of
all
Operate
d Land
% of
all
Marginal 41 64.06 55.46 37.3 50 80.65 61.34 61.35
Small 17 26.56 52.57 35.3
5
11 17.74 33.64 33.65
Semi-medium 6 9.38 40.67 27.3
5
1 1.61 5 5
Total 64 100 148.7 100 62 100 99.98 100
Table 5.8: Distribution of PC member and non-member farmers by livestock Owned
Category Members Non-Members
Parameter >
Livestock
No.
of
farme
rs
% of
all
No of
Anim
als
% of
anima
ls
Avera
ge
Anima
ls per
farmer
No.
of
farme
rs
% of
all
No of
Anima
ls
% of
anima
ls
Avera
ge
Anima
ls per
farmer
Buffalo 2 3.13 5 1.81 2.5 1 1.61 2 2 1.03
Cow 46 71.88 135 48.91 2.93 33 53.2
3
95 2.88 48.72
Goat 26 40.63 129 46.74 4.96 24 38.7
1
94 3.92 48.21
Sheep 1 1.56 4 1.45 4 0 0 0 0 0
Oxen 2 3.13 3 1.09 1.5 2 3.23 4 2 2.05
Total 276 195 100
The land holdings of non-members were marginal with an average own land of 1.29 acres for
farmer and operated land of 1.61 acres per household. There was significant leasing in land to
the extent of 0.30 acres on an average. In terms of owned land, 99% of the farmers were
marginal (89%) or small (10%) with the rest also being only semi medium owners. 94% of the
owned land was with these marginal and small holders and another 6% with the semi medium
farmers. There was not much change in the operated land distribution as well as 99% farmers
were in the category of marginal and small operating 95% of the land. Still there was only one

172
farmer to the semi medium category who operated 5% of the land of total operated of the
sample farmers.
69% of the member farmers had tube wells either owned or shared with electric connections or
diesel engine based with another 9% reporting ownership of wells and 11% reported buying of
water from other tube well owners. Only 6% had access to canal water and 3% to ponds. For
non-members, there were various sources of irrigation including canal, river, submersible tube
wells operated by electricity or diesel or just wells and many of them shared or rented in terms
of farmers buying water for irrigation. Most of the livestock comprised of cows, and goat
accounting for 50% each of the total besides poultry being an important source of livelihood.
Cows and goats were owned by 53% and 39% of the household on an average, there were 3
cows and 4 goats per household.
In terms of livestock ownership, 72% of the members had cows and 41% goat with only 3%
each having bullocks or buffaloes. Most of the livestock was equally divided with cows and
goats in terms of numbers of livestock (Table 5.8). However, 28% farmers also had poultry
birds with an average ownership of 10 birds. The average ownership of cows and goats per
household was 3 and 5 each. Only one member reported owning 4 sheep.
The Kharif cropping pattern was mostly dominated by paddy and vegetables with 95%
members growing paddy and 44% vegetables. These two crops accounted for 97% of the
seasons area. The only other Kharif crop reported was jute grown by 3% farmers accounting
for 2% of area. On the other hand, in Rabi season, it was mustard grown by 64% farmers and
potato grown by 70% farmers besides onion by 30% and vegetables by 48%. Mustard and
potato accounted for 26% each of the season’s area, followed by vegetables at 25% and onion
at 50%. Wheat grown by only 3% farmers accounted for 1% of the area and green and red gram
by another 6% farmers accounted for 3% of the area (Table 5.9, and 5.10).
The major summer crops grown by significant number of member farmers included paddy on
65% of the season’s area by 44% farmers, vegetables on 20% of the area by 45% of the farmers.
The other significant crops in the season are sesame grown on 8% of the area by 9% of the
farmers. Fruits and jute each grown by 8% farmers accounted for 2% and 7% of the cropped
area in summer (Table 5.11). Overall, paddy accounted for 59% of the GCA followed by
vegetables 15% of the area excluding potato and onion which accounted for another 7% and
4% of the gross cropped area. The gross cropped area was almost equally divided across three
seasons with Kharif accounting for 44%, summer 29%, and Rabi 27%.
The average cropping intensity of non-member was 2.09 which was slightly lower than in the
case of members (2.2). The Kharif cropping pattern of non-members was mostly dominated
with paddy with 83% of the area being this crop grown by 94% farmers. Another major crop
was vegetables accounting for 15% of the Kharif area. In Rabi, it was potato which took 20%
of the seasons area followed by vegetables at 31% and mustard at 8% of the total area. 40-50%
of the farmers had grown potato, vegetables or mustard each. The major summer crops were
paddy which took 42% of the area, and vegetables another 28% of the total cropped area in
summer season. The only other significant crop in this season was sesame accounting for 5%
of the total cropped area of the season. Overall, it was paddy with 48% share, potato at 11%
and vegetables at 22% of the gross cropped area. Interestingly, the gross cropped area was
almost equally divided between three seasons with Kharif at 43%, Rabi at 32% and summer
25% of the GCA.

173
Table 5.9: Kharif cropping pattern of PC Member and Non-Member Farmers
Category> Members Non- Members
Parameter>
Crop
Farmers %
Farmers
Kharif Area Avg Area %Kharif
Area
% Total
Area
Farmers %
Farmers
Kharif Area Avg
Area
% Kharif Area % Total
Area
Jute 2 3.13 2 1.00 1.40 0.61 2 3.23 1 0.50 1.07 0.48
Jute, Paddy 1 1.56 0.67 0.67 0.47 0.20 0
Maize 0 1 1.61 0.5 0.50 0.53 0.24
Paddy 61 95.31 126.12 2.07 88.05 38.48 58 93.55 77.73 1.34 82.97 37.26
Sesame 0 1 1.61 0.33 0.33 0.35 0.16
Vegetables 28 43.75 14.44 0.52 10.08 4.41 21 33.87 14.12 0.67 15.07 6.77
Total 64 100 143.23 2,23 100 43.70 62 100 93.68 1.51 100 44.91
Table 5.10: Rabi cropping pattern of PC Member and Non-Member Farmers
Category> Members Non-Members
Parameter>
Crop
Farmers %
Farmers
Rabi Area Avg
Area
% Rabi Area % Total
Area
Farmers %
Farmers
Rabi Area Avg
Area
% Rabi Area % Total
Area
Fruits 3 4.69 1.31 0.44 1.48 0.40
Gram 6 9.38 2.51 0.42 2.83 0.77
Jute 1 1.56 0.67 0.67 0.76 0.20 1 1.61 0.59 0.59 0.91 0.28
Mustard 41 64.06 23.46 0.57 26.49 7.16 33 53.23 17.01 0.52 26.23 8.15
Onion 19 29.69 13.49 0.71 15.23 4.12 5 8.06 3.17 0.63 4.89 1.52
Paddy 1 1.56 1 1.00 1.13 0.31 3 4.84 4.66 1.55 7.19 2.23
Potato 45 70.31 22.69 0.50 25.62 6.92 20 32.26 12.55 0.63 19.36 6.02
Potato/Pumpkin 1 1.61 3.3 3.30 5.09 1.58
Sesame 1 1.56 1 1.00 1.13 0.31
Sunflower 2 3.13 0.26 0.13 0.29 0.08
Vegetables 29 45.31 21.18 0.73 23.91 6.46 30 48.39 21.97 0.73 33.88 10.53
Wheat 2 3.13 1 0.50 1.13 0.31 4 6.45 1.59 0.40 2.45 0.76
Total 64 100 88.57 1.38 27.02 62 100 64.84 1.04 31.08

174
Table 5.11: Summer cropping pattern of PC Member and Non-Member Farmers
Category> Members Non-Members
Parameter> Farmers %
Farmers
Summer
Area
Avg
Area
%Summer
Area
% Total
Area
Farmers %
Farmers
Summer
Area
Avg
Area
%Summer
Area
% Total
Area Crop
Fruits 5 7.81 2.01 0.40 2.09 0.61 4 6.45 6.62 1.66 13.22 3.17
Jute 5 7.81 6.32 1.26 6.59 1.93 2 3.23 1 0.50 2.00 0.48
Jute,
Vegetables
1 1.56 0.67 0.67 0.70 0.20
Paddy 28 43.75 62.61 2.24 65.25 19.10 20 32.26 26.94 1.35 53.78 12.91
Sesame 12 18.75 8.02 0.67 8.36 2.45 5 8.06 3 0.60 5.99 1.44
Vegetables 29 45.31 16.32 0.56 17.01 4.98 18 29.03 12.53 0.70 25.01 6.01
Total 95.95 29.28 50.09 24.01

175
The member farmers reported buying seeds from dealer in 36% cases, from PC in 19% cases
and dealer and PC both in 16% cases. Only 5% farmers bought seeds from PACs and others
reported various combinations of dealer and PACs or dealer and local farmer or PACs and local
farmer (Table 5.13). Similarly, 45% of them bought chemical fertilisers from dealers and 28%
from PC and only 2% from dealer and PACs and 6% from both dealer and PC. Similarly, 42%
bought chemical pesticides from dealer with 13% reported it from the PC. In fact, 42% reported
buying no chemical pesticides (Table 5.14). Bio fertilisers were bought only by 28% farmers
and mostly from dealers, other farmers and the PC. There were even lesser number of farmers
buying biopesticides (23%) again mostly from dealers and PC (Table 5.15). The reasons for
members buying from the PCs are given in Table 5.15A.
Most of the non-member farmers (60%) bought seeds from the dealers and local farmers (16%)
with PACs and PC accounting for only 3% and 2% of the total and in some cases being another
source along with dealers and local farmers. 73% of them bought chemical fertiliser from
dealers with PACS accounting for 5% and the PC 8% of the total. 10% did not use chemical
fertilisers and 5% bought it from the agriculture department outlet. In chemical pesticides, 44%
farmers did not report using them with 48% buying it from the dealers and 8% from the PCs.
The bio-pesticides were used by only 24% of the farmers which mostly bought from the dealers
(18%) of the total and only 6% from the PCs.
59% members could not mention the name of the PC with the other either not knowing or not
being able to mention it correctly. Most of them (89%) could not report the number of shares
held and the value of shares. 45% of the members did not know the owner of the PC and
another 38% reported PC employees as the owners and 8% BOD besides 3% reporting it as
promoting agency and 6% government as being the owner of the PC. In 52% cases, it was PC
employees who had influenced them to become members. In other, 27% cases, it was other
farmers, and in 20% cases it was promoters of the PC who had persuaded them to become
members.
84% of the members were not fully aware of the various activities being carried out by PCs
with others mostly reporting about crop practices, input sales, and subsidies. 64% of them
reported that the meetings of the PCs are held every month with another 11% reported it to be
quarterly and 9% weekly. However, only 48% attended all the meetings and 31% only
sometimes and 13% occasionally. 5% never attended any meeting. The major topic of
discussion in these meetings were reported to be agricultural practices and technology in 61%
cases and seeds and crop procurement in another 5% cases with other reporting various
combinations of these another issues. 58% did not ask any questions and 16% mainly raised
questions and inquiries about farming and 5% about farm inputs. They were all satisfied with
the response received from the PC.
77% of the members had no complaint against the services provided by the PC with others
reporting an adequate availability of inputs and not at right time as the major problems. 70%
of them also did not report to have received any information about government schemes and
subsidies with others reporting various schemes about seeds, crop insurance, credit, and
agricultural machinery about which the information was provided. In only 6% cases, it was
only agricultural machinery and loans which were reported to be specific subsidies availed by
PC members.

176
89% wanted to continue as member of the PC due to good services and facilities subsidising
inputs, availability and such other reasons with only 5% not being satisfied with the services
and therefore, not sure they would continue as members.
So far as suggestions for improving the functioning of the PCs was concerned, farmers mostly
suggested procurement of their farm produce (9%), timely availability of inputs (9%), irrigation
(3%), and agriculture machinery and irrigation another 5%.
The farmers reported significant improvements in moving from good to very good in terms of
quality, cost and availability of inputs after the membership of the PC. In terms of cropping
pattern shift, there were significant increases in area under vegetables, and fruits and a decline
in area under paddy and sesame. Farmers also reported yield increases in vegetables and fruit
including chillies and potato besides gram. The output sold had increased significantly in
vegetables especially pumpkin and even paddy due to yield increase especially Kharif paddy.
However, they also reported higher transaction cost in the case of vegetables, and fruits. The
sale price realisation had gone up in most of the vegetables and to some extent in fruits as well.
Further, time taken to receive payment had come down across commodity with exception of
only potato. So far as use of different marketing channels are concerned, there was higher use
of PC channel in vegetables both in terms of number of farmers as well as volume of output
sold. But still most of the farmers sold in wholesale ranging from 50% in wheat to as high as
100% in case of vegetables and fruits. This APMC channel was reported to be used only in
case of paddy and wheat.
96% of the non-member farmers were not member of any other collective with only 3%
reporting membership of PACS. 2/3rd of them accessed agricultural information from friends,
relatives and other farmers with only 1% availing it from the PC. In fact, 10% access it from
the point of purchase i.e. dealers and 5% from the agricultural department office.
41% of the non-members had no knowledge about the PC and 74% did not know who owned
it with only 6% thinking it is owned by farmers and the other 7% reporting promoters or
employees as the owners besides 4% thinking it was owned by promoting agency. In fact, 59%
of them have not been provided the information by any source with 21% receiving it from the
employees of the PC. 11% from PC meetings and 6% from promoters. 80% of them were not
aware of the activities carried by it with only 14% knowing about the supply of inputs including
potato seeds. 67% of them had never participated in any meetings of the PC and 14% reported
these meetings related to the agriculture. 95% of them had no negative experience with the PC
with others thinking that timing and quality of inputs is not appropriate and there are no
subsidies be given. 29% of them desired to become members and 71% want to become
members because either they had no information or not enough land.
The farmers reported significant improvements in input quality, cost, and availability due to
the presence of PCs. On the output side, there was again good improvement on output price
being realised by the farmers. However, there were no cropping pattern change due to the
presence of PCs although farmers reported significant improvement in yield of sesame and
better price realisation in vegetables.
So far as farmers channel preferences were concerned, there was not much change where a few
farmers had used the PC to sell their paddy and potato crops but that was so even three years
before.

177
Table 5.12: Distribution of PC member and non-member farmers by Source of general
agricultural knowledge
Category Members Non-members
Parameter >
Source
No. of
farmers
% of all No. of
farmers
% of all
Friends/ Neighbours/ Relatives 17 26.56 43 69.35
Friends/ Neighbours/ Relatives, point of purchase 1 1.56 0 0
Friends/ Neighbours/ Relatives, PC 5 7.81 0 0
Friends/ Neighbours/ Relatives, ADO 1 1.56 1 1.61
Friends/ Neighbours/ Relatives, ADO, Krishi
college 1 1.56 0 0
PC 31 48.44 1 1.61
PC, Mobile Groups 2 3.13 0 0
PC, ADO 4 6.25 0 0
ADO, Point of Purchase 1 1.56 0 0
PC, Point of Purchase 1 1.56 0 0
Point of Purchase 0 0 5 8.06
Other FPO 0 0 4 6.45
Mobile/ Mobile Groups 0 0 2 3.23
ADO 0 0 3 4.84
ADO, Panchayat 0 0 1 1.61
Friends/ Neighbours/ Relatives, Other FPO 0 0 2 3.23
Total 64 100 62 100
Table 5.13: Distribution of PC member and non-member farmers by Source of Seeds
Category> Members Non-members
Parameter >
Source
No. of
farmers
% of all No. of
farmers
% of all
Dealers 23 35.94 37 59.68
Local Farmer 3 4.69 10 16.13
PACS 3 4.69 2 3.23
PC 12 18.75 1 1.61
Dealer, Local Farmer 2 3.13 2 3.23
Dealer, Local Farmer, ADO 1 1.56 0 0
Dealer, PACS 5 7.81 1 1.61
Dealer, PC 10 15.63 1 1.61
Dealer, ADO 2 3.13 1 1.61
Local Farmer, PACS 2 3.13 1 1.61
PC,ADO 1 1.56 0 0
Local Farmer, PC 0 0 1 1.61
ADO 0 0 6 9.68
Total 64 100 62 100

178
Table 5.14: Distribution of PC member and non-member farmers by Source of
Chemical Inputs
Type of Input>
Category>
Fertilizers Pesticides
Members Non-members Members Non-members
Parameter >
Source
No. of
farmers
% of
all
No. of
farmers
% of
all
No. of
farmers
% of
all
No. of
farmers
% of
all
Dealer 29 45.31 45 72.58 27 42.19 30 48.39
PACS 7 10.94 3 4.84 1 1.56
PC 18 28.13 5 8.06 8 12.5 5 8.06
Agri Dept 1 1.56 3 4.84 0 0 0 0
Dealer, PACS 1 1.56 0 0 0 0 0 0
Dealer, PC 4 6.25 0 0 1 1.56 0 0
Doesn’t buy 4 6.25 6 9.68 27 42.19 27 43.55
Total 64 100 62 100 64 100 62 100
Table 5.15: Distribution of PC member and non-member farmers by Source of Bio
Inputs
Type of Input>
Category
Biofertilizers Biopesticides
Members Non-members Members Non-members
Parameter >
Source
No. of
farmers
% of
all
No. of
farmers
% of
all
No. of
farmers
% of
all
No. of
farmers
% of
all
Dealers 8 12.5 10 16.13 9 14.06 11 17.74
Local Farmers 3 4.69 3 4.84 1 1.56 0 0
PACS 1 1.56 0 0 1 1.56 0 0
PC 5 7.81 1 1.61 3 4.69 4 6.45
ADO 1 1.56 0 0 1 1.56 0 0
Doesn’t Buy 46 71.88 48 77.42 49 76.56 47 75.81
Total 64 100 62 100 64 100 62 100

179
Table 5.15A: Input wise Reasons for purchase of inputs by member farmers from PCs
Input> Seeds Chem fert Chemical
pesti biofert biopesti
Parameter Reasons No. % in total
No.
% in total
No.
% in total
No.
% in total
No.
% in total
Better Quality 6 24.00 7 31.8 3 33.3 2 40 2 66.7
Better Quality, Easy Accessibility, Lower Cost 3 12.00
1 4.6 0 1 20 0
Better Quality, Easy Accessibility, Lower Cost,No other Source 1 4.00
0 0 0
Better Quality, Lower Price 2 8.00
0 0 0
Better Quality, Timely Availability 3 12.00
1 4.6 0 0 0
Compulsary 1 4.00
Easy Accessibility, Lower Cost 2 8.00
3 13.6 3 33.3 1 20 1 33.3
Easy Accessibility, Lower Cost,Lower Price 1 4.00
1 4.56 0 0 0
Fair Deal, More Reliable 1 4.00
0 0 0
Lower Price 3 12.00 7 31.8 2 22.2 1 20 0
Lower Price, No other Source 1 4.00
1 4.6 1 11.1 0 0
Timely Availability 1 4.00 1 4.6 9 100 0 0
Total 25 100.00 22 100 5 100 3 100

180
Table 5.16: Distribution of PC member and non-member farmers by their knowledge
of initiatives taken by PC
Category Members Non-members
Parameter >
PC Initiatives
No. of
farmers
% of all No. of
farmers
% of all
Agricultural Techniques 2 3.13 1 1.61
Don’t Know 1 1.56 50 80.65
HYV Seeds, Pesticide usage 1 1.56 0 0
Input Sales 2 3.13 5 8.06
Mustard Seeds 1 1.56 0 0
None 54 84.38 1 1.61
Seeds, Linkages with ADO 1 1.56 0 0
Subsidized Inputs 1 1.56 2 3.23
Vermicompost 1 1.56 0 0
Facility and accessibility 0 0 1 1.61
Increasing Yield 0 0 1 1.61
Pond wall 0 0 1 1.61
Total 64 100 62 100
Table 5.17: Distribution of PC members and non-member by knowledge of PC name
Category> Member Non-Member
Parameter> No of
Farmers
% of Total No of
Farmers
% of Total
Knowledge of PC Name
Correct Name 38 59.38 36 58.06
Wrong Name 7 10.94 0 0
Don’t Know 19 29.69 26 41.94
Total 64 100 62 100
Table 5.18: Distribution of PC members and non-members by knowledge of PC owner
Category> Member Non-Member
Parameter> No of
Farmers
% of Total No of
Farmers
% of Total
Knowledge of PC Owner
Don’t Know 29 45.31 45 72.58
BOD 5 7.81 5 8.06
PC Employees 24 37.50 5 8.06
Promoting Agency 2 3.13 3 4.84
Government 4 6.25 0 0
NGO 0 0 1 1.61
Farmers 0 0 3 4.84
Total 64 100 62 100

181
Output side impact of PCs
15 (25%) members had sold to PC vegetables and 2 paddy and 3 fruits each respectively (3%
each). Three years before, 11 out of 15 had sold in wholesale mandi and two did not sell at all.
This had increased from just two farmers selling to PCs three years before (5%) to 20 (31%).
Only one non-member had sold paddy and two potatoes in the past to the PCs.
After the PC intervention, the area under fruits and vegetables grew significantly (18 and 41%
respectively) and that under paddy declined and farmer members even realised 30-75% higher
prices in these crops including in paddy compared with pre-PC situation.
Member perceptions
77% of PC members had no dislike of any of services offered by the PCs with 6% only
mentioning inadequate quantity of supplies of purchases. 70% also said they did not receive
any information from PCs about government schemes or subsidies but 19% also received
information about subsidy schemes like farm equipment or seeds or crop insurance or other
inputs. But, there was no special subsidy for PC members in 94% cases. 84% members were
not aware of any PC initiatives while others knew about input supplies, bio-inputs and new
farming technologies and techniques.
About 30% farmers attended monthly meetings every time and another 27% sometimes only.
91% members wanted to continue as members of the PC for various reasons but mainly as it
offered good services and lower cost inputs. Only 9% were not keen to continue as they either
did not use its services. 67% also were keen to encourage others to become members with 30%
feeling that enough members had already joined the PC.
53% of them who suggested any improvements suggested better procurement, timely
availability of inputs and services and even loans besides irrigation facilities support.
5.3 Promoter wise comparison
IGS promoted 4 PCs in Bankura, 5 each in Purulia and Midnapur districts of West Bengal. All
were working and were registered in 2015. The Midnapur (Datun PC) was supposed to be the
best as it had fertiliser business. The Damodar PC in Bankura also runs Sufal Bangla
supermarkets like its counterpart - Chhatna PC. Simlapal PC was not doing well whereas the
other two in the district were doing well largely due to Sufal Bangla. All four PCs in Bankura
promoted by IGS had availed of matching equity grant partly (Rs.2.326 lakh each) from SFAC.
5.3.1 Profile of IGS and BKSL PC members
39% of the member farmers of IGS promoted PC’s were educated up to High school as against
14 % of those of BKSL PC’s. The member farmers of IGS had an educational level up to
Middle level in case of 33% whereas it was 52.18 % for BKSL PC member farmers. BKSL
member having education up to Higher secondary were 14 % but only 3% of IGS PC members
has such education (Table 5.19).
Agriculture was the primary occupation of almost all of IGS PC member farmers. But in case
of IGS, 62% of members reported agriculture as a primary occupation. The remaining were
engaged in skilled labour (14%), animal husbandry (9.5%), business (9.5 %), and labour (5 %).
(Table 5.20)

182
Most of the member farmers reported no secondary occupation. Only 10 % BKSL PC members
has animal husbandry as secondary occupation. Agriculture was the secondary occupation of
only 3% for IGS but as many as 38% for BKSL PC members. (Table 5.21).
Table 5.19: Distribution of IGS and BKSL PC member farmers by education
Category > IGS BKSL
Parameter > Level of
education
No. of
farmers
% of all No. of
farmers
% of all
Graduate 2 6.06 1 4.76
High School 13 39.39 3 14.29
Higher Secondary 1 3.03 3 14.29
Illiterate 5 15.15 1 4.76
Middle 10 30.3 9 42.86
Primary 1 3.03 2 9.52
Under Grad 1 3.03 2 9.52
Total 33 100 21 100
Table 5.20: Distribution of IGS and BKSL PC member farmers by Primary Occupation
Category IGS BKSL
Parameter > Primary
Occupation
No. of
farmers
% of all No. of
farmers
% of all
Agriculture 32 96.97 13 61.9
Animal Husbandry 0 0 2 9.52
Business 0 0 2 9.52
Skilled Labour 0 0 3 14.29
Labourer 1 3.03 1 4.76
Total 33 100 21 100
Table 5.21: Distribution of IGS and BKSL PC member farmers by Secondary
Occupation
Category IGS BKSL
Parameter >
Secondary Occupation
No. of
farmers
% of all No. of
farmers
% of all
Animal Husbandry 0 0 2 9.52
Skilled Labour 4 12.12 2 9.52
Labourer 3 9.09 1 4.76
Agriculture 1 3.03 8 38.1
None 25 75.76 8 38.1
Total 33 100 21 100

183
The average owned land and operational holding of IGS PC members was found to be 1.84
acre and 2.06 acre, respectively whereas it was 2.51 acres and 3.06 acres, for BKSL farmers.
This shows that BKSL PC member farmers were relatively large in both owned and operated
land (Table 5.22)
Most of the IGS member farmers fall in the category of marginal farmers (73%) as owners
followed by small (21%) and semi- medium farmers (6%). However, in case of BKSL farmers
62% members farmer were marginal farmers followed by small farmers (24%) & semi-medium
(14 %) (Table 5.22). As far as actual farm size was concerned, small (46%) & semi-medium
(39%) farmers for IGS & BKSL, respectively. Similarly, in the case of operated land holding,
70% were marginal farmers followed by small farmers (24 %) & semi- medium farmers (6%)
for IGS member farmers. Semi- medium farmers were the largest operated land group 45% of
the total land in case of BKSL member farmers (Table 5.23 and 5.24).
Table 5.22: Average owned and operated land holding of members of IGS and BKSL
PCs
Promoter>
Average Land
(acres)
IGS BKSL
Owned 1.84 2.51
Operated 2.06 3.06
Table 5.23: Category wise distribution of IGS and BKSL PC members by land owned
Category IGS BKSL
Parameter >
Land (Acres)
No. of
farmers
% of
all
Owned
Land
% of
all
No. of
farmers
% of
all
Owned
Land
% of all
Marginal 24 72.73 26.49 38.53 13 61.9 15.99 30.28
Small 7 21.21 29.93 43.53 5 23.81 16.46 31.18
Semi-Medium 2 6.06 12.33 17.93 3 14.29 20.34 38.53
Total 33 100 68.75 100 21 100 52.79 100
Table 5.24: Category wise distribution of IGS and BKSL PC members by operated land
Category IGS BKSL
Parameter >
Operated
Land (Acres)
No. of
farmers
% of
all
Operated
Land
% of
all
No. of
farmers
% of
all
Operated
Land
% of all
Marginal 23 69.7 31.11 45.58 10 47.62 14 21.79
Small 8 24.24 25.49 37.34 7 33.33 21.25 33.07
Semi-
Medium
2 6.06 11.66 17.08 4 19.05 29.01 45.14
Total 33 100 68.26 100 21 100 64.26 100

184
Table 5.25: Distribution of IGS and BKSL PC members by livestock ownership
Categor
y
IGS BKSL
Paramete
r>
Livestock
No.
of
farme
rs
% of
all
No of
Anima
ls
% of
anima
ls
Avera
ge
Anima
ls per
farmer
No.
of
farme
rs
% of
all
No of
Anima
ls
% of
anima
ls
Avera
ge
Anima
ls per
farmer
Cow 28 84.8
5
72 53.73 2.57 12 57.1
4
49 56.98 4.08
Buffalo 2 6.06 5 3.73 2.5 0 0 0 0 0
Goat 12 36.3
6
54 40.3 4.5 7 33.3
3
37 43.02 5.29
Oxen 2 6.06 3 2.24 1.5 0 0 0 0 0
Total 33 100 134 100 21 100 86 100
The highest share in the livestock population was of cattle followed by goat in both IGS &
BKSL PC members. The average number of cows & goats owned by each farm was 2.57 and
4.5 respectively, for IGS members. For BKSL, average number of cow and goat per household
was reported to be 4.08 and 5.29, respectively. It was observed that no members of BKSL PCs
owned buffalo or oxen (Table 5.25).
Member farmers exhibited a pattern in which seed was purchased from a single source or
through a combination of sources. The most trusted source was found to be dealers & PCs- in
both types of PCs (IGS and BKSL). Other major sources were dealers and PCs (15%) and
dealer and PACS (12 %) for IGS. In case of BKSL, major sources were dealers (23%), Producer
companies (29 %) and dealers and PCs (19%) (Table 5.26)
Table 5.26: Distribution of IGS and BKSL PC member farmers by Source of Seed
Promoter> IGS BKSL
Parameter >
Seed Source
No. of
farmers
% of all No. of
farmers
% of all
Dealers 10 30.3 5 23.81
PC 6 18.18 6 28.57
Local Farmers 2 6.06 0
PACS 2 6.06 1 4.76
Dealers, PACS 4 12.12 1 4.76
Dealers, PC 5 15.15 4 19.05
Local Farmers, PACS 2 6.06 0 0
Dealer, Other FG 1 3.03 0 0
Dealer, Local Farmers, DOA 1 3.03 0 0
Dealers, Local Farmers 0 0 1 4.76
Dealers, DOA 0 0 2 9.52
PC, DOA 0 0 1 4.76
Total 33 100 21 100

185
More than half of the member farmers of IGS purchased chemical fertilizers from dealers
followed by PACS (15%), PC (12%) and dealers & PC (12%). The member farmers of BKSL
preferred PC (67%) followed by dealers (14%) and PACS (10%). Dealers and PCs were equally
preferred sources for chemical pesticide with the rest being non- user of chemical pesticides.
(Table 5.27).
Table 5.27: Distribution of IGS and BKSL PC member farmers by Source of Chemical
Inputs
Input>
Promoter>
Fertilizers Pesticides
IGS BKSL IGS BKSL
Parameter >
Chemical Input Source
No. of
farmers
% of
all
No. of
farmers
% of
all
No. of
farmers
% of
all
No. of
farmers
% of
all
Dealers 17 51.52 3 14.29 16 48.48 7 33.33
PACS/DCS 5 15.15 2 9.52 1 3.03
PC 4 12.12 14 66.67 1 3.03 7 33.33
Dealers & PACS 1 3.03 0 0 0 0 0 0
Dealers & PC 4 12.12 0 0 1 3.03 0 0
Agri Dept 0 0 1 4.76 0 0 0 0
Doesn’t buy 2 6.06 1 4.76 14 42.42 7 33.33
Total 33 100 21 100 33 100 21 100
Bioinputs were used only by a handful of members. The use of biopesticides was more
prominent than biofertilizers. 82 % of IGS members were not using any of the bio-inputs
whereas in the case of BKSL the non-usage was 48% for Bio fertilizers and 67 % for
Biopesticide. The major sources for those who use these bio inputs were dealers, producer
companies, PACS and local farmers. (Table 5.28)
Table 5.28: Distribution of IGS and BKSL PC member farmers by Source of bio-input
Type of bioinput>
Category
Biofertilizers Biopesticides
IGS BKSL IGS BKSL
Parameter >
Source
No. of
farmers
% of
all
No. of
farmers
% of
all
No. of
farmers
% of
all
No. of
farmers
% of
all
PC 1 3.03 4 19.05 1 3.03 2 9.52
Dealers 3 9.09 4 19.05 3 9.09 4 19.05
Local Farmers 1 3.03 2 9.52 1 3.03 0 0
PACS 1 3.03 0 0 1 3.03 0 0
Agri Dept 0 0 1 4.76 0 0 1 4.76
Doesn’t Buy 27 81.82 10 47.62 27 81.82 14 66.67
Total 33 100 21 100 33 100 21 100

186
The average cropping intensity of BKSL member farmers (2.4) which was higher than IGS
member farmers (1.95)
The members of BKSL PCs had higher cropping intensity than that of IGS PCs members, so
the gross cropped area of BKSL member farmers exceeds that of IGS member farmers (Table
5.25). The average Kharif, Rabi and Zaid (Summer) was thus much higher of BKSL members
than that by IGS PC members. (Table 5.29)
In case of IGS farmers, the diesel & electric engine was used by 33% and 27% member farmers,
respectively. On the contrary, in case of BKSL PC members, 57% members were using
electrically powered tube wells followed by diesel operated tube wells (43%) (Table 5.30)
Table 5.29: Season wise Average Cropped Area of members of IGS and BKSL PCs
Category Parameter >
Season IGS BKSL
Kharif 1.91 3.04
Rabi 1.25 1.66
Summer 0.92 3.07
Table 5.30: Distribution of IGS and BKSL PC member farmers by source of Irrigation
Parameter >
Source of
irrigation
Source of
Energy
IGS BKSL
No. of
farmers
% of all No. of
farmers
% of all
Rented NA 3 9.09 0 0
Canal NA 2 6.06 0 0
Pond NA 2 6.06 0 0
Tube well Electric Motor 9 27.27 12 57.14
Tube well Diesel Engine 11 33.33 9 42.86
Well Diesel Engine 6 18.18 0 0
Total 33 100 21 100
The kharif cropping was dominated by paddy and vegetables crops. 94 % of the farmers were
reported to have cultivated paddy followed by vegetables (42 %) and cucumber (18%) for IGS
members. Paddy (79%) and vegetables (13%) were two major crops occupying large area in
total kharif acreage. Paddy was found to be significant crop in the cropping pattern of members
occupying 38 % of total acreage. Similar pattern was observed for BKSL members as well
where paddy (95%) was grown by most of the farmers followed by vegetables (14 %) and
chilly (14 %). Paddy is the most important crop occupying 95% of total kharif acreage and 39
% of total area (Table 5.31).
The number of crops grown in rabi season were higher than the kharif season. Crops taken by
most of the IGS farmers were potato (66%), mustard (58%), onion (36%) and vegetables
(33%). Cucumber and gram were two additional major crops grown by BKSL PC members
with the rabi acreage of 7 % and 6%, respectively. Though the acreage was low but 24 % of
the members reported to have cultivated these crops (Table 5.32).

187
Diversity in the crop grown during summer (zaid) season is higher for IGS PC member than
BKSL PC members. But in the case of BKSL, acreage is highly skewed towards two crops viz.
paddy and vegetable occupying 95 percent of total summer area (Table 5.33)
Table 5.31: Kharif cropping pattern of IGS and BKSL PC members
Categor
y
IGS BKSL
Paramet
er >
Kharif
Crops
Farm
ers
%
total
farme
rs
Cropp
ed
Area
%
Khar
if
Area
%
Tot
al
Are
a
Avera
ge
Area
Farm
ers
%
total
farme
rs
Cropp
ed
Area
%
Khar
if
Area
%
Tot
al
Are
a
Avera
ge
Area
Cucumb
er
6 18.18 1.99 3.15 1.5 0.33 0 0 0 0 0 0
Jute 2 6.06 1.99 3.15 1.5 1 0 0 0 0 0 0
Jute,
Paddy
1 3.03 0.67 1.06 0.5 0.67 0 0 0 0 0 0
Paddy 31 93.94 50.17 79.4
7
37.
76
1.62 20 95.24 60.76 95.1 39.
42
3.04
Vegetab
les
14 42.42 8.31 13.1
6
6.2
5
0.59 3 14.29 1.97 3.08 1.2
8
0.66
Chilli 0 0 0 0 0 0 3 14.29 1.16 1.82 0.7
5
0.39
Total 33 100 63.13 47.
51
1.91 21 100 63.89 41.
45
3.04
Table 5.32: Rabi cropping pattern of IGS and BKSL PC members
Categor
y
IGS BKSL
Paramet
er >
Rabi
Crops
Farme
rs
%
total
farme
rs
Cropp
ed
Area
%
Rab
i
Are
a
%
Tot
al
Are
a
Avera
ge
Area
Farme
rs
%
total
farme
rs
Cropp
ed
Area
%
Rab
i
Are
a
%
Tot
al
Are
a
Avera
ge
Area
Cucumb
er
5 15.15 1.37 3.33 1.03 0.27 2 9.52 2.43 6.96 1.58 1.22
Gram 3 9.09 0.35 0.85 0.26 0.12 3 14.29 2.16 6.19 1.4 0.72
Jute 1 3.03 0.67 1.63 0.5 0.67 0 0 0 0 0 0
Mustard 19 57.58 10.29 25.0
2
7.74 0.54 15 71.43 9.8 28.0
9
6.36 0.65
Onion 12 36.36 11.41 27.7
5
8.59 0.95 4 19.05 0.24 0.69 0.16 0.06
Potato 22 66.67 10.32 25.1 7.77 0.47 16 76.19 10.12 29.0
1
6.57 0.63
Sesame 1 3.03 1 2.43 0.75 1 0 0 0 0 0 0
Sunflow
er
2 6.06 0.26 0.63 0.2 0.13 0 0 0 0 0 0
Vegetab
les
11 33.33 5.45 13.2
5
4.1 0.5 9 42.86 10.14 29.0
6
6.58 1.13
Total 33 100 41.12 30.9
4
1.25 21 100 34.89 22.6
5
1.67

188
Table 5.33: Summer cropping pattern of IGS and BKSL members
Categ
ory
IGS BKSL
Param
eter >
Crop
Far
mers
%
total
far
mer
s
Crop
ped
Area
%
Sum
mer
Area
%
To
tal
Ar
ea
Aver
age
Area
Far
mers
%
total
far
mer
s
Crop
ped
Area
%
Sum
mer
Area
%
To
tal
Ar
ea
Aver
age
Area
Chilli 0 0 0 0 0 0 2 9.52 0.82 1.48 0.5
3
0.41
Cucu
mber
5 15.1
5
1.62 5.66 1.2
2
0.32 0 0 0 0 0 0
Fruits 1 3.03 0.17 0.59 0.1
3
0.17 3 14.2
9
1.76 3.18 1.1
4
0.59
Jute 5 15.1
5
6.32 22.0
9
4.7
6
1.26 0 0 0 0 0 0
Jute,
Veget
ables
1 3.03 0.67 2.34 0.5 0.67 0 0 0 0 0 0
Paddy 5 15.1
5
6.32 22.0
9
4.7
6
1.26 15 71.4
3
47.9
5
86.6
5
31.
11
3.2
Sesam
e
11 33.3
3
7.69 26.8
8
5.7
9
0.7 1 4.76 0.33 0.2
1
0.33
Tomat
o
3 9.09 1.1 3.84 0.8
3
0.37 0 0 0 0 0 0
Veget
ables
11 33.3
3
4.72 16.5 3.5
5
0.43 3 14.2
9
4.48 8.1 2.9
1
1.49
Total 33 100 28.6
1
21.
54
0.87 21 100 55.3
4
35.
9
2.63
36% of IGS member farmers either did not know or gave wrong name of the PCs they were
members of. This count was higher for BKSL PC members where 48% of the members were
not able to provide the information (Table 5.34). Farmers were not able to specify the PC
owners also. In case of IGS, more than half of the farmers were not able to provide the name
of owner (Table 5.35). Those who answered gave the names of PC employees (42%),
promoting agencies (3%) and BoD (3%). BKSL members have comparatively higher
awareness of the PC owner. 33% of the members were not able to provide the name of PC
owner. Similar pattern like that of IGS PC members was reported where 29 %. members
reported PC employees followed by government (14 %) and BoD (19%) (Table 5.35).

189
Table 5.34: Distribution of IGS and BKSL member farmers by knowledge of PC Name
Category IGS BKSL
Parameter >
PC Name Knowledge
No. of
farmers
% of all No. of
farmers
% of all
Correct Name 21 63.64 11 52.38
Don’t Know 9 27.27 8 38.1
Wrong Name 3 9.09 2 9.52
Total 33 100 21 100
Table 5.35: Distribution of IGS and BKSL PC member farmers by knowledge of PC
Owner
Category IGS BKSL
Parameter >
PC Owner Knowledge
No. of
farmers
% of all No. of
farmers
% of all
Don’t Know 17 51.52 7 33.33
Government 0 0 3 14.29
PC Employees 14 42.42 6 28.57
Promoting Agency 1 3.03 1 4.76
BOD 1 3.03 4 19.05
Total 33 100 21 100
Table 5.36: Distribution of IGS and BKSL PC member farmers by PC Influencer
Category IGS BKSL
Parameter >
PC Influencer
No. of
farmers
% of all No. of
farmers
% of all
Friends/ Neighbours/ Relatives 10 30.3 2 9.52
PC Employees 18 54.55 13 61.9
PC Promoters 5 15.15 6 28.57
Total 33 100 21 100
Members were encouraged by friends/ relatives/ neighbours, PC employees and promoters to
join the PCs. PC employees had been the major influencer for farmers (56%) followed by
friends/ relatives/ neighbours (30%) and PC promoters (15%) for IGS members. PC employees
(62 %) and PC promoters (29 %) were reported to be major influencers in the case of BKSL.
(Table 5.36).
17 additional members farmers (50% of total) of IGS started selling their products through PCs
dealing in four commodities viz. fruits, paddy, tomato, and vegetables. Vegetables has been a
major agriculture commodity sold through the channel of PC, showing exponential growth
followed by tomato.

190
Promoter-wise Output impact of PCs
In case of IGS PCs, three farmers reported selling fruits to the PC and two paddy and 15
vegetables compared with three years before. The vegetable output was important as Sufal
Bangla was buying it form the PC or the PC was running the Sufal Bangla store and buying
from its members and non-members directly. This was almost 50% of all members in
vegetables and 10% in fruits and about 7% in paddy. On the other hand, in case of BKSL PCs
there was no output side interface of PCs with the farmers.
Promoter -wise PC comparison
BKSL PCs
All the member farmers of Birbhum PC were male while in case of Shantiniketan PC, 10
member farmers were male and one was a female. Average age of Birbhum PC members (50
years) was higher than Shantiniketan PC members (44 years). The largest %age of member
farmers in the case of Birbhum PC was educated up to High school (30%) followed by Middle
school and Higher secondary level (20% each) while in the case of Shantiniketan PC, majority
of member farmers (64%) were educated up to middle school and 18% were even illiterate or
primary literate.
Agriculture was the primary occupation for the majority 55-70% of the member farmers in
both the PCs. In case of Birbhum PC, animal husbandry was another important occupation for
20% member farmers. In case of Shantiniketan PC, business and skilled jobs was the primary
occupation for 18% member farmers each. 55% of the Shantiniketan PC members didn’t have
any secondary occupation but in the case of Birbhum PC members, this share was only 20%.
Largest number of the member farmers for Shantiniketan PC (45%) and Birbhum PC (30%)
had agriculture as the secondary occupation. Animal husbandry (20%) and skilled job (20%)
were other major secondary occupation reported for Birbhum PC members.
The average owned and operational landholding was higher for Birbhum PC (3.69 and 3.67
acres respectively) than in case of Shantiniketan PC (1.43 and 2.5 acres). Most of the
Shantiniketan PC members (91%) were marginal farmers owning 64% of the total land. In the
case of Birbhum PC, the largest category in terms of number of farmers was of small farmers
(50%) followed by marginal farmers (30%) and semi-medium farmers (20%) owning 45%,
16% and 40% respectively, of the total land. Similarly, in terms of operated land holding,
Shantiniketan PC had largest share of marginal farmers (64%) followed by small and semi-
medium farmers (18% in each case). However, the largest proportion of operated land was with
semi-medium farmers (52%) followed by marginal farmers (30%) and small farmers (18%).
For Birbhum PC, small farmers (50%) were highest in number followed by marginal farmers
(30%) and medium farmers (20%). Small farmers had the largest share in land (44%) followed
by semi-medium farmers (40%) and marginal farmers (16%).
70% and 50% Birbhum PC member owned cows and goats which was 52% and 48% each of
total livestock owned respectively. In case of Shantiniketan PC, the number of member farmers
who owned cows was 45% and 18% had goats lower than Birbhum PC. Also, cows were 75%
of total livestock.
PCs were source of awareness on agricultural topics for 60% farmers and friends for another
20% in Birbhum PC members while in the case of Shantiniketan PC, 64% of the member

191
farmers obtained information through PC and rest from other multiple sources like ADO,
mobile, ad combinations of PC and other sources.
The cropping intensity was lower for Birbhum PC (2.26) than that in case of Shantiniketan PC
(2.58) though it was quite high in general in both cases. All the member farmers of Birbhum
PC grew paddy in kharif season which occupied 99% of the kharif area and 44% of the total
area. The remaining member farmers grew vegetables. In case of Shantiniketan PC, 91% of the
member farmers grew paddy followed by chilli (27%) and vegetables (18%). Paddy (90%) had
the highest share in kharif acreage. Mustard (80%), potato (70%), vegetables (50%) and onion
(40%) were grown by large number of Birbhum PC members occupying 38%, 15%, 31% and
2% respectively, of the rabi acreage. In case of Shantiniketan PC potato (82%), mustard (64%)
and vegetables (55%) were the major crops grown occupying 40% of the rabi acreage in case
of potato and other vegetables each and 20% in mustard.
Paddy (90%) was grown by most of the Birbhum PC members followed by vegetables while
in the case of Shantiniketan PC members, paddy (55%) was also the most important crop grown
in 79% of summer acreage by majority followed by fruits (18%) in 7% area and vegetables by
2% farmers in 19% summer area. Surprisingly, the summer acreage was 30-40% of GCA in
both cases which explains high cropping intensity.
PC was the most important source reported for Birbhum PC and Shantiniketan PC supplying
seeds for 40-45% member farmers. Dealers and PC was another major source of seed purchase
for 18-20% of member farmer of both PCs. 18% of Shantiniketan PC members also purchased
seeds from dealers alone.
50% of the Birbhum PC member farmers did not purchase any biofertilizer while this share
was 45% in the case of Shantiniketan PC member. PC and Dealers was the most importance
source of biofertilizers for 10-20% and 18-27% member farmers respectively in Birbhum and
Shantiniketan PC respectively. Most of the member farmers (60-73%) did not purchase any
biopesticide. However, majority of the remaining member farmers were purchasing
biopesticides from dealers (18-20%) and only 10% each from PC.
50% and 82% of the member farmers purchased chemical fertilizers from Birbhum and
Shantiniketan PCs respectively. In the case of Birbhum PC, dealers (20%) and PACS (20%)
were also important sources of chemical fertilizer purchase. 30% and 36% of the member
farmers did not purchase any chemical pesticides in Birbhum and Shantiniketan PCs. PC was
a source of chemical fertilizers for 30-36% of the member farmers respectively and dealers
were another major source for the purchase of chemical pesticides in case of 27-40% of the
member farmers.
30% of Birbhum and 45% of Shantiniketan PC members didn’t know the name of PC while
45% and 60% of the member farmers respectively provided the correct name of the PC.
40% Birbhum PC members and 27% Shantiniketan PC members didn’t know the name of PC
owner. 27% and 30% member farmers in case of birbhum and shantiniketan respectively
provided the name of PC employees while the Board of Directors were mentioned as owners
by 10% and 27% of the member farmers. 10% and 128% respectively thought PC was owned
by the government. 60% and 64% of the member farmers were influenced by PC employees
to become members in case of Birbhum and Shantiniketan respectively. Other major source of

192
influence were PC promoters (40%) for Birbhum PC and friends/family (18%) and PC
promoters (18%) in case of Shantiniketan PC.
IGS PCs
All members were male in all three cases. The average age of members was the highest for
Hooghly Vegetable PC members (55 years) followed by Chhatna PC members (50 years) and
Simlapal PC members (44 years).
Highest number of illiterates were reported for Chhatna PC (20%) followed by Simlapal PC
(17%) and Hooghly vegetables PC (9%). The members who were educated up to middle school
were highest for Simplapal PC (33%) followed by Chhatna PC (30%) and Hooghly vegetables
PC (27%). High school qualified members were highest in Hooghly vegetables PC (64%)
followed by Simlapal PC (33%) and Chhatna PC (20%). (Table 5.37)
Table 5.37: Distribution of IGS PC members by Education
PC Chhatna Hooghly Vegetable Simlapal
Parameter >
Education
No of
Farmers
% of
total
No of
Farmers
% of
total
No of
Farmers
% of
total
Illiterate 2 20.00 1 9.09 2 16.67
Primary 0 0 0 0 1 8.33
Middle 3 30.00 3 27.27 4 33.33
High School 2 20.00 7 63.64 4 33.33
Higher Secondary 1 10.00 0 0 0 0
Undergrad 0 0 0 0 1 8.33
Graduate 2 20.00 0 0 0 0
Total 10 100 11 100 12 100
Primary occupation was agriculture in all case in case of Chhatna and Hooghly and in case of
92% in case of Simlapal PC with one farmer reporting labour.
Most of the member farmers didn’t have any secondary occupation. However, for the
remaining labour and skilled jobs was reported as an important secondary occupation. (Table
5.38)
Table 5.38: Distribution of IGS PC members by Secondary Occupation
PC Chhatna Hooghly Vegetable Simlapal
Parameter > No of
Farmers
% of
total
No of
Farmers
% of
total
No of
Farmers
% of
total Secondary Occupation
Agriculture 0 0 0 0 1 8.33
Labour 0 0 2 18.18 1 8.33
Skilled Job 3 30.00 0 0 1 8.33
None 7 70.00 9 81.82 9 75.00
Total 10 100 11 100 12 100

193
The owned as well as operated land was the highest for Hooghly Vegetables PC (2.35 acres)
followed by Chhatna PC (2.14 acres) and Simlapal PC (1.1 acres). (Table 5.39)
Table 5.39: Average Owned and Operated land of IGS PC members
PC >
Chhatna Hooghly
Vegetable Simlapal Average Land
(acres)
Owned 2.14 2.35 1.1
Operated 2.14 2.59 1.52
All the member of Simlapal PC were marginal farmers followed by Chhatna PC (60%) and
Hooghly vegetables PC (55%). The share of small farmers was higher for Hooghly Vegetables
PC (36%) than Chhatna PC (30%). The share of land holding by small farmers was also higher
for Hooghly Vegetables PC members (50%) than Chhatna PC members (41%). (Table 5.40).
Most of the members of all the PCs were in the category of marginal farmers in terms of
operational land i.e. Simlapal PC members (83%), Hooghly vegetables PC members (64%) and
Chhatna PC members (21%). Land holding was also distributed in a similar pattern. But in case
of small operational landholding, Chhatna PC (40%) was highest followed by Hooghly
vegetables PC (27%) and Simlapal PC (17%) with a share of 53%, 40% and 29% respectively,
in the operational land holding (Table 5.41).
Cow was owned by the majority of the member farmers of all three PCs. All members of
Chhatna PC followed by Simlapal PC (92%) and Hooghly vegetables (64%) owned cows
which was 47%, 88% and 44% respectively, of the total animals owned by each PC members.
The second most important was goat which was owned by 58% Simlapal, PC members, 30%
Chhatna PC members and 18% Hooghly vegetables PC members with the share of 54%, 40%
and 12% respectively, of the total animals. Buffalo was owned by only 20% of Chhatna PC
members which was 9% of the total animals owned (Table 5.42).

194
Table 5.40: Category-wise Distribution of IGS PC members by Owned Land
PC Chhatna Hooghly Vegetable Simlapal
Parameter >
Owned Land
No of
Farmers
% of
total
Area in
Acres
% of
total
No of
Farmers
% of
total
Area in
Acres
% of
total
No of
Farmers
% of
total
Area in
Acres
% of
total
Marginal 6 60.00 6.33 29.46 6 54.55 6.85 26.40 12 100.00 13.31 100.00
Small 3 30.00 8.83 41.09 4 36.36 13.1 50.48 0 0 0 0
Semi-Medium 1 10.00 6.33 29.46 1 9.09 6 23.12 0 0 0 0
Total 10 100 21.49 100 11 100 25.95 100 12 100 13.31 100
Table 5.41: Category-wise Distribution of IGS PC members by Operated Land
PC Chhatna Hooghly Vegetable Simlapal
Parameter >
Operated Land
No of
Farmers
% of
total
Area in
Acres
% of
total
No of
Farmers
% of
total
Area in
Acres
% of
total
No of
Farmers
% of
total
Area in
Acres
% of
total
Marginal 5 50.00 4.49 20.90 7 63.64 11.19 39.24 10 83.33 12.93 70.81
Small 4 40.00 11.33 52.75 3 27.27 11.33 39.73 2 16.67 5.33 29.19
Semi-Medium 1 10.00 5.66 26.35 1 9.09 6 21.04 0 0 0 0
Total 10 100 21.48 100 11 100 28.52 100 12 100 18.26 100

195
Table 5.42: Distribution of IGS PC members by livestock Owned
PC Chhatna Hooghly Vegetable Simlapal
Para
mete
r >
Live
stoc
k
No
of
Far
mer
s
%
of
tot
al
No
of
Ani
mal
s
%
tota
l
Ani
mal
s
Av
era
ge
No
of
Far
mer
s
%
of
tot
al
No
of
Ani
mal
s
%
tota
l
Ani
mal
s
Av
era
ge
No
of
Far
mer
s
%
of
tot
al
No
of
Ani
mal
s
%
tota
l
Ani
mal
s
Av
era
ge
Buff
alo
2 20.
00
5 9.0
9
2.5
0 0 0 0 0 0 0 0 0 0 0
Cow 10 10
0.0
0
26 47.
27
2.6
0
7 63
.6
4
22 88.
00
3.1
4
11 91
.6
7
24 44.
44
2.1
8
Goat 3 30.
00
22 40.
00
7.3
3
2 18
.1
8
3 12.
00
1.5
0
7 58
.3
3
29 53.
70
4.1
4
Oxe
n
1 10.
00
2 3.6
4
2.0
0 0 0 0 0 0
1 8.
33
1 1.8
5
1.0
0
Tota
l
10 10
0
55 11 1
00
25 12 10
0
54
PC was the source of general awareness for 42% Simlapal PC members, 40% Chhatna PC
members and 27% Hooghly vegetables PC members. 42% Simlapal and 36% Chhatna PC
members obtained information through friends. Other major sources were PC & ADO
providing information to 27% Hooghly vegetables PC members and Friends & PC providing
information to 30% Chhatna PC members and 8% Simlapal PC members (Table 5.43).
Table 5.43: Distribution of IGS PC members by source of General agricultural
knowledge
PC Chhatna Hooghly Vegetable Simlapal
Parameter > No of
Farmers
% of
total
No of
Farmers
% of
total
No of
Farmers
% of
total General Awareness
Friends 0 0 4 36.36 5 41.67
PC 4 40.00 3 27.27 5 41.67
Friends, ADO 1 10.00 0 0 0 0
PC, ADO 0 0 3 27.27 0 0
Friends, PC 3 30.00 0 0 1 8.33
PC, Mobile 0 0 1 9.09 0 0
ADO, Point of
Purchase 1 10.00 0 0 0 0
PC, Point of Purchase 1 10.00 0 0 0 0
Friends, Point of
Purchase 0 0 0 0 1 8.33
Total 10 100 11 100 12 100

196
Highest cropping intensity was reported for Hooghly vegetables OC (2.08) closely followed
by Simlapal PC (2.05) and Chhatna PC (1.75).
Majority of the member farmers were reported to cultivating paddy. 100% Chhatna & Simlapal
PC member and 91% Hooghly vegetable PC members cultivating paddy crop. Kharif acreage
of paddy was highest for Simlapal PC (94%) followed by Chhatna PC (85%) and Hooghly
vegetables PC (67%). Vegetable was another major cop grown by member farmers with highest
kharif acreage was reported for Hooghly vegetables (22%) followed by Chhatna PC (15%) and
Simlapal PC (7%). Jute and jute & paddy were other two crops grown by 18% and 9% of the
Hooghly vegetables PC members. (Table 5.44)
80% Chhatna PC members, 58% Simlapal PC members and 36% Hooghly vegetables PC
members were reported to be growing mustard which occupied 3-4% of the rabi area. All
Hooghly vegetables PC members were reported to be growing onions which occupied 11% of
the rabi area. Potato was a major crop grown by member of IGS promoted PCs. Simlapal PC
(83%) had the highest number of onion growers followed by Hooghly vegetables PC (73%)
and Chhatna PC (40%) occupying 50%, 18% and 19% respectively, of the rabi acreage. The
number of vegetables growers were very high for Chhatna PC (70%) followed by Hooghly
vegetables PC (18%) and Simlapal PC (17%). Sunflower was a major crop for Chhatna PC
members only grown by 30% member farmers. (Table 5.45)
Vegetables were grown by all Chhatna PC members followed by 63% Hooghly vegetables PC
members and 25% Simlapal PC members occupying 89%, 22% and 6% of the summer acreage.
Sesame was an important crop for Chhatna PC and Simlapal PC grown by 20% and 67% of
the member farmers. 25% Simlapal and 18% Hooghly vegetables PC members cultivated
paddy which occupied 26% of the summer acreage in each case. Jute was a major crop for
Hooghly PC members only grown by 55% of the total members occupying 49% of the summer
acreage. (Table 5.46)

197
Table 5.44: Kharif Cropping Pattern of IGS PCs members PC Chhatna Hooghly Vegetable Simlapal
Parameter
>
Kharif
Crops
No of
Farmer
s
%
of
tota
l
Khari
f Area
%
khari
f
Area
%
total
area
Avg
Area
No of
Farmer
s
% of
total
Khari
f Area
in
Acres
%
kharif
Area
%
total
area
Avg
Area
No of
Farmer
s
% of
total
Khari
f Area
in
Acres
% kharif
Area
%
total
area
Avg
Are
a
Paddy 10 100 18.3 85.3 48.6 1.8 10 90.9 16.4 66.78
27.6
7 1.64 12 100 16.78 93.53
44.8
1 1.4
Vegetable
s 7 70 3.1 14.7 8.3 0.4 9 81.8 5.49 22.35 9.26 0.61 4 33.3 1.16 6.47 3.10 0.3
Jute 0 0 0 0 0 0 2 18.1 2 8.14 3.37 1 0 0 0 0 0 0
Jute,
Paddy 0 0 0 0 0 0 1 9.09 0.67 2.73 1.13 0.67 0 0 0 0 0 0
Total 10
100
21.47
56.9
6
2,15
11 100 24.56
41.4
4
2.23
12 100 17.94
47.9
0 1.5
Table 5.45: Rabi Cropping Pattern of IGS PC members
PC Chhatna Hooghly Vegetable Simlapal
Parameter
>
Rabi
Crops
No of
Farmer
s
%
of
tota
l
Rabi
Are
a
%
Rabi
Area
%
total
area
Averag
e Area
No of
Farmer
s
%
of
tota
l
Rabi
Area
%
Rabi
Area
%
total
area
Averag
e Area
No of
Farmer
s
%
of
tota
l
Rabi
Are
a
%
Rabi
Area
%
total
area
Averag
e Area
Gram 3 30 0.35 3.05 0.93 0.12 0 0 0 0 0 0 0 0 0 0 0 0
Mustard 8 80 3.7 31.9 9.71 0.46 4 36.3 3.98 19.38 6.72 1.00 7 58.3 2.65 29.09 7.08 0.38
Onion 0 0 11 100 11.2
5
54.8 19 1.02 0 0 0 0 0 0
Potato 4 40 2.13 18.6 5.6 0.53 8 72.7 3.6 17.82 6.18 0.46 10 83.3 4.53 49.73 12.1
0
0.45
Vegetable
s
7 70 5.1 44.2 13.5 0.73 2 18.1 0.8 4.0 1.40 0.42 2 16.7 0.26 2.85 0.69 0.13
Fruits 0 0 0 0 0 0 1 9.1 0.67 3.26 1.13 0.67 1 8.3 0.67 7.35 1.79 0.67
Jute 0 0 0 0 0 0 1 9.1 0.1 0.73 0.25 0.15 0 0 0 0 0 0
Sunflower 3 30 0.3 2.2 0.7 0.1 0 0 0 0 0 0 0 0 0 0 0 0
Sesame 0 0 0 0 0 0 0 0 0 0 0 0 1 8.3 1 10.9 2.67 1.0
Total 10 100 11.4 30.4 1.14 11 100 20.5 34.7 1.86 12 100 9.1 24.3 0,76

198
Table 5.46: Summer Cropping Pattern of IGS PCs members
PC Chhatna Hooghly Vegetable Simlapal
Paramete
r >
Summer
Crops
No of
Farme
rs
%
of
tota
l
Summ
er
Area
%
Summ
er
Area
%
tota
l
are
a
Averag
e Area
No of
Farme
rs
% of
total
Summ
er
Area
%
Summ
er
Area
%
total
area
Averag
e Area
No of
Farme
rs
%
of
tota
l
Summ
er
Area
%
Summ
er
Area
%
tota
l
are
a
Averag
e Area
Jute 0 0 0 0 0 0 6 54.5
5
7 49.44 11.8
1
1.17 0 0 0 0 0 0
Fruits 0 0 0 0 0 0 1 9.09 0.17 1.20 0.29 0.17 1 8.3 0.08 0.77 0.2
1
0.08
Paddy 0 0 0 0 0 0 2 18.1
8
3.66 25.85 6.18 1.83 3 25 2.66 25.58 7.1
0
0.89
Sesame 2 20 0.5 10.5 1.3 0.25 1 9.09 0.2 1.41 0.3 0.20 8 66.
7
7 67.31 18.
7
0.88
Vegetabl
es
10 100 4.24 89.4 11.
2
0.4 7 63.6 3.13 22.10 5.28 0.45 3 25 0.66 6.35 1.7
6
0.22
Total 10 10
0
4.74 12.
6
0.47 11 100 14.16 23.9 1.29 12 10
0
10.4 27.
7
0.87

199
Dealers was the most important source for the purchase of seeds supplying seeds to 42%
Simlapal PC members, 40% Chhatna PC members and 27% Hooghly vegetables PC members.
Other major sources reported were dealers & PACS and dealers & PC. PC was supplying seeds
to 36% Hooghly PC members followed by 10% Chhatna PC members and 8% Simlapal Pc
members. (Table 5.47).
Table 5.47: Distribution of IGS PC members by Source of Seeds
PC > Chhatna Hooghly Vegetable Simlapal
Parameter>
Seeds Source
No of
Farmers
% of
total
No of
Farmers
% of
total
No of
Farmers
% of
total
Dealers 4 40.00 3 27.27 5 41.67
Dealers, ADO 1 9.09
Dealers, PACS 2 20.00 2 18.18 2 16.67
Dealers, PC 3 30.00 1 9.09 2 16.67
PACS 2 16.67
PC 1 10.00 4 36.36 1 8.33
Total 10 100 11 100 12 100
Dealers was a major source of chemical fertilizers supplying to 75% Simlapal PC members,
40% Chhatna PC members and 36% Hooghly vegetables PC members. PACS were supplying
to 20% of the Chhatna PC members followed by 17% Simlapal PC members and 9%Hooghly
vegetables PC members. Dealers & PC was supplying to 30% Chhatna PC members and 9%
Hooghly vegetables PC members. Majority of the Hooghly vegetables PC members (55%) and
Chhatna PC members (50%) were not purchasing any chemical pesticides. For the members
buying pesticides, dealers were the most important source for 67% Simlapal PC members, 40%
Chhatna PC members and 36% Hooghly vegetables PC members (Table 5.48).
Most of the member farmers of IGS promoted PC didn’t purchased any bio inputs. 25% of
Simlapal PC members were reported to be purchasing biofertilizers from dealers. 10% of
Chattna PC members were purchasing each from local farmers and PACS. While dealers were
a major source for biopesticides supplying to 17% Simlapal PC members and 10% Chhatna PC
members. 9% of Hooghly vegetables PC members each purchasing from local farmers and
dealers (Table 5.49).
Majority of the member farmers of IGS promoted PC gave correct name of the PC. Highest
share was reported for Hooghly vegetables (82%) followed by Chhatna PC (60%) and Simlapal
PC (50%). While remaining 50% Simlapal PC members did not know the PC name followed
by Chhatna PC members (20%) and Hooghly vegetables PC members (9%) (Table 5.50). Large
number of member farmers did not know the name of the PC owner. Highest percentage was
reported in the case of Simlapal PC (58%) followed by Hooghly vegetables PC (55%) and
Chhatna PC (40%). 50% of the Chattna PC members gave the name of the PC employees for
PC owner followed by Simlapal PC (42%) and Hooghly vegetables PC (36%) (Table 5.51).
A large number of member farmers answered PC employees and friends/family when asked
about the PC influencer. 67% Simlapal PC members answered PC employees followed by
Hooghly vegetables PC members (45%) and Chhatna PC members (40%). Friends/family was
provided by 40% Chhatna, 27% Hooghly vegetables and 25% Simlapal PC members. Other
provided the name of PC promoters and PC employees and friends (Table 5.52).

200
Table 5.48: Distribution of IGS PC members by Source of Chemical inputs
Chemical based > Fertilizers Pesticides
PC Name > Chhatna Hooghly Vegetable Simlapal Chhatna Hooghly Vegetable Simlapal
Parameters >
Buying source
No of
Farmers
% of
total
No of
Farmers
% of
total
No of
Farmers
% of
total
No of
Farmers
% of
total
No of
Farmers
% of
total
No of
Farmers
% of
total
PC 0 0 4 36.36 0 0 0 0 1 9.09 0 0
Dealers 4 40.00 4 36.36 9 75.00 4 40.00 4 36.36 8 66.67
PACS 2 20.00 1 9.09 2 16.67 0 0 0 0 1 8.33
Dealers, PACS 1 10.00 0 0 0 0 0 0 0 0 0 0
Dealers, PC 3 30.00 1 9.09 0 0 1 10.00 0 0 0 0
Doesn’t Buy 0 0 1 9.09 1 8.33 5 50.00 6 54.55 3 25.00
Total 10 100 11 100 12 100 10 100 11 100 12 100
Table 5.49: Distribution of IGS PC members by Source of Bio inputs
Bio input > Biofertilizers Bio-pesticides
PC Name > Chhatna Hooghly Vegetable Simlapal Chhatna Hooghly Vegetable Simlapal
Parameters >
Buying source
No of
Farmers
% of
total
No of
Farmers
% of
total
No of
Farmers
% of
total
No of
Farmers
% of
total
No of
Farmers
% of
total
No of
Farmers
% of
total
Dealers 0 0 0 0 3 25.00 1 10.00 0 0 2 16.67
Local Farmers 1 10.00 0 0 0 0 0 0 1 9.09 0 0
PC 0 0 1 9.09 0 0 0 0 1 9.09 0 0
PACS 1 10.00 0 0 0 0 1 10.00 0 0 0 0
Doesn’t Buy 8 80.00 10 90.91 9 75.00 8 80.00 9 81.82 10 83.33
Total 10 100 11 100 12 100 10 100 11 100 12 100

201
Table 5.50: Distribution of IGS PC members by Knowledge about PC Name
PC Chhatna Hooghly Vegetable Simlapal
Parameter > No of
Farmers
% of
total
No of
Farmers
% of
total
No of
Farmers
% of
total Knowledge of PC Name
Don’t Know 2 20.00 1 9.09 6 50.00
Wrong Name 2 20.00 1 9.09 0 0
Correct Name 6 60.00 9 81.82 6 50.00
Total 10 100 11 100 12 100
Table 5.51: Distribution of IGS PC members by Knowledge about PC Owner
PC Chhatna Hooghly Vegetable Simlapal
Parameter > No of
Farmers
% of
total
No of
Farmers
% of
total
No of
Farmers
% of
total PC Owner
BOD 0 0 1 9.09 0 0
Don’t Know 4 40.00 6 54.55 7 58.33
PC Employees 5 50.00 4 36.36 5 41.67
Promoting
Agency 1 10.00 0 0 0 0
Total 10 100 11 100 12 100
Table 5.52: Distribution of IGS PC members by PC influencer
PC Chhatna Hooghly Vegetable Simlapal
Parameter > No of
Farmers
% of
total
No of
Farmers
% of
total
No of
Farmers
% of
total PC Influencer
Friends/ Family 4 40.00 3 27.27 3 25.00
PC Employees 4 40.00 5 45.45 8 66.67
PC Promoters 2 20.00 2 18.18 1 8.33
PC Employees,
Friends 0 0 1 9.09 0 0
Total 10 100 11 100 12 100
Summary
Most of the PCs had mobilised high %age of authorised capital except Shantiniketan, though
authorised capital itself was small or modest in most cases. Therefore, they made negligible
profit or net losses except the Chhatna PC which made a small profit after taking franchise of
Sufal Bangla. Except one, most of them had a small size of membership which is problematic
given the small size of land holdings in the state.
The members were mostly marginal (72%) and small (20%) in their landholdings with average
size of owned land being 1.99 acres and operated just 2.32 acres which was higher than that of
non-members. 88% of them did not report membership of any other group or collective except
a few being members of the PACS. They grew mostly paddy and vegetables with 95%
members growing paddy and 44% vegetables in Kharif and these two crops accounted for 97%

202
of the season’s area. On the other hand, in Rabi season, it was mustard grown by 64% farmers
and potato grown by 70% farmers besides onion by 30% and vegetables by 48%. Mustard and
potato accounted for 26% each of the season’s area, followed by vegetables at 25% and onion
at 50%. The average cropping intensity of non-member was 2.09 which was slightly lower than
in the case of members (2.2).
The PC interface with members for farm inputs was in general not very strong while on the
output ide it was even weaker reaching only a few farmers. 16 (25%) members had sold to PC
vegetables and 2 each paddy and fruits (3% each). This had increased from just three farmers
selling to it three years before (5%) to 20 (31%).
Only 9% were not keen to continue as they did not use its services. 67% also were keen to
encourage others to become members. A majority (53%) of them who suggested any
improvements suggested better procurement, timely availability of inputs and services and
even loans besides irrigation facilities support.
Farming was the primary occupation of almost all of IGS PC member farmers. But in case of
IGS, 62% of members reported agriculture as a primary occupation. Most of the member
farmers reported no secondary occupation. Only 10% BKSL PC members has animal
husbandry as secondary occupation. Agriculture was the secondary occupation of only 3% for
IGS but as many as 38% for BKSL PC members.
The BKSL PC member farmers were relatively large in both owned and operated land though
all were only marginal or small in both cases. The average number of cows & goats owned by
each farm was 2.57 and 4.5 respectively, for IGS members. For BKSL, average number of cow
and goat per household was 4.08 and 5.29, respectively. No member of BKSL PCs owned
buffalo or oxen. Within each Promoter’s PCs, there were significant variation of farmer profile
e.g. in case of IGS PCs, aall the member of Simlapal PC were marginal farmers but only 60%
in case of Chhatna PC and 55% in case of Hooghly PC.
The member farmers of BKSL preferred PCs much more than IGS PC member for purchase of
inputs. The average cropping intensity of BKSL PC member farmers (2.4) was higher than that
of IGS member farmers (1.95).
59% members did not know the name of the PC and 45% of the members did not know who
owned the PC 36% of IGS PC member farmers did not know name of the PCs they were
members of. This count was higher for BKSL PC members where 48% of the members were
not able to provide the correct name. In case of IGS, more than half of the farmers did not know
who owned the PC. Hooghly PC members were also aware of the name of the PC (in 82%
cases). BKSL PC members had comparatively higher recall of the PC owner.
In case of IGS PCs, three farmers reported selling fruits to the PC, two paddy and 15 vegetables
compared with three years before. The vegetable output was important as Sufal Bangla was
buying it from the PC or the PC was running the Sufal Bangla store and buying from its
members and non-members directly. This was almost 50% of all members in vegetables and
10% in fruits and about 7% in paddy. On the other hand, in case of BKSL PCs there was no
output side interface of PCs with the farmers.

203
Appendix 5.1
IGS promoted PCs
IGS believes that PC structure is culturally agonistic concept and for mor organisation and not
necessarily suited and relevant in all local situations. The promoter has organized 170 PCs in
India so far, mostly in UP, MP, West Bengal, Telangana and earlier in Karnataka, Rajasthan
also. It was expanding to north-east and eastern India. It claimed that for the last five years,
70% of the PCs were assigned to promoter by SFAC. The IGS has three levels of personnel
starting with local service providers, associates, and executives.
Hooghly Vegetable PC
The Hooghly PC promoted by IGS has its regions in the vegetable clusters promoted in 2010
by NABARD which also had promoted farmer clubs. The six farmer clubs had members
ranging from 15 to 100 within an average of 75 members. The PC covers 10 villages in four
blocks and has 1124 members since 2003 starting with 1000 members in 2012 at the time of
registration. IGS is an RI of SFAC only landowners can become members of the PC with the
payment of Rs.1000/- per 100 shares of Rs.10 each. 80% of the members were marginal
landowners and remaining small and semi medium landowners. At the farmer club level there
are about 15 percent members who are completely landless. In fact, the additional 121 members
of the PC are still not shareholders though they are members of the farmer clubs. Ninety-five
percent of the members are men but only 45% were active because the vegetable cluster subsidy
which was there for five years up to 2017 is over now. This subsidy was available for hybrid
and local vegetable production and one could avail up to a maximum of Rs.15400 per acre and
another Rs.8000 for the second time.
The PC has authorised capital of Rs.25 lakh which was Rs.10 lakh to begin with and paid up
capital of Rs. 20 lakh which was Rs.10 lakh in 2015-16 (Table 5.1).
The company has 10 members of the Board of whom one is female. It has no seed or fertilizer
licenses though it has been selling fertilizers and has no APMC licence. Still it bought standard
rice from 50 farmers to sell in Krishi Mela retail shop and also bought onions from 50 farmers
and sold to private companies. Besides the acting CEO who is one of the board members, the
company has no other staff. It had two staff from IGS in 2012 and had one staff until 2018. A
member to become a director on the board has to be matriculate.
Major inputs being sold by the PC include seeds, fertilizers, crops like paddy, onion, potato
and vegetables. Most of which are bought by the members for reasons of low price and assured
quality. 25% members bought exclusively from PC. PCs sold seeds worth Rs.10 lakh in 2018-
19 of which 25% was potato seed and 40% onion seed. It also bought potato seed from farmers
in 2014 to supply it to PC in Manipur. On the output side, it buys paddy from member and non-
member farmers and branded it as Hooghly PC rice. It has retail outlet at its office premises
besides a separate shop.

204
Photo 5.1: Paddy being threshed (semi-mechanically) in a village in West Bengal
The PC attempted to introduce Kharif onion to the areas in 2013 with 150 farmers for which
the horticulture department supplied free seed. Now there are 30 member and 20 non-member
farmers growing this crop in one block. The PC also supply onion seeds to other PCs and the
department of horticulture. It also introduced capsicum starting with few farmers in 2018 which
has expanded to 100 farmers including 30 non-members. It had also introduced apple cool to
ten farmers and Grand 9 banana variety in 2012 which has spread to 50 farmers now.
On the market linkage front, it tempted contract farming of potato for Pepsi with 200 farmer
members in 2015 on 400 bighas and 15 percent of the produce were rejected. This arrangement
had expanded to 500 farmers, but the company did not honour the contract. The PC has also
sold paddy, onion and potato in wholesale to 2 to 3 private companies and traders each from
its retail outlets. It sells aromatic rice which is bought from 50 farmers and processed before
being sold to its retail outlets and in Krishi Mela for the last few years. It has even attempted
in 2015 mango sales in Delhi Haat. In some of these transactions it lost money while in other
it made money.
Most of the turnover of the PC came from input sale where only 15% came from non-members.
The company has never paid dividends but it received matching equity grant of Rs.10 lakh in
2016. The business plan for the PC was made by the promoter only to avail the grant from the
SFAC. However, the annual plan is made by the BoD and members at the time of general body
meeting of the PC. The board of directors and members or staff have never been trained or
taken for any exposure visits and the PC is perhaps the only PC in the state to not get any
support from anywhere other than the SFAC. It thinks that provision of good quality seeds and
new crops are the best practices of the PC.
The major problem of the PC is absence of CEO, non-payment for honorarium for the acting
CEO, no other staff, no office space and no grants or loans. On the external front, the political
distribution of subsidy only to members because of which non-members bad mouth the PC and
lack of direction of the PC were major problems.

205
Table 5.1: Profile and Performance of Hooghly Veg growers PC
Year >
Parameters
2015-16 2016-17 2017-18 2018-19
Authorised capital (Rs. lakh) 25 25 25 25
Share capital (Rs. lakh) 10(40%) 20(80%) 20(80%) 20(80%)
Turnover (Rs. lakh) 26.04 23.6 8.9 21.1
Profit (Rs. lakh) 0.93 1.44 -1.27 0.16
Reserves and Surplus (Rs. lakh) 2.25 3.7 2.42 2.54
Assets (Rs. Lakh) 0 0.28 0.19 3.4
Number of shareholders 1000 2000 2000 2000
The PC registered in 2012 had nine directors. The PC had sold paddy and onion seeds to a large
number of farmers in 2018-19 amounting to Rs.19.6 lakh. It also had assets of the order of
Rs.7.8 lakh in the same year. It is also selling vermicompost, lubricant, seed and pesticide from
its retail store.
Shimlapal Agro PC
This PC registered in 2015 has its origins in the 60 FIGs of which 30 were members of the PC
with each one having 20 members and total membership of the PC being 650 across 25 villages
in one block of the district. The PC membership increased from 317 in 2016-17 to 654 in 2018-
19. Each village had a minimum of 15 and maximum of 50 members. Each member had to buy
100 shares of Rs.10 each. 85% percent members of the PC were marginal farmers and
remaining 15% small landowners. The PC had no landless farmers as members as land was a
must for membership. Due to the SFAC mandate, 30% of the members happened to be women.
85% of the members of the PC were active. The PC had authorised capital of Rs. 10 lakh and
paid capital of Rs. 9.71 lakh in 2018-19 (Table 5.2). It had reserves of Rs.1.5 lakh in fixed
deposits and Rs.4.5 lakh as working capital mainly for procuring seed potatoes for 100 farmers
across five FIGs. Among the five members of the Board, one was a woman and a farmer
member to become BOD had to be at least a matriculate. The number of BOD had been reduced
from 10 to 5 because of the non-involvement of the members in the PC. The present CEO of
the PC worked with the promoter (IGS) for three years as a marketing officer.
Major licenses the PC had were for seed dealership, seed certification and the APMC licence
for direct purchase from farmers. 99% of the seed sales in potato and paddy were to the
members who bought it from the PC because of better quality and lower price. 30% of the
members bought exclusively from the PC. The PC had a small storage space for the purpose of
storing seeds and agri produce temporarily. It had a retail outlet at its office premises. It had
also tried to promote new crops like Kharif onion and potato seed production in 2017 which
was later stopped due to losses it incurred.
On the output side, it attempted contract farming of seed potato for Alps Agri with 40 farmers
in 50 bighas as a facilitator but it didn’t succeed as the yield was very low.

206
Box- Contract Farming by PC
It was a tripartite agreement between Alps Agri, IGS, and the PC under which the Alps Agri
provided foundation seed to the PC for multiplication at the farmer level under the supervision
of IGS and the PC. It was mandated that neither the AA variety mother seed material nor the
seed potato multiplied from it shall be disposed of elsewhere by the two partners. In case the
seeds were used for any other purpose than the specified purpose, then the IGS would pay
Rs.600/- per bag. The AA had agreed to buy the multiplied produce as per the agreement and
the PC was to acquire a seed licence for undertaking seed production with its members. The
AA was to provide three bags of foundation seed of 25 to 35 mm or five bags of 35 to 45 mm
for sowing 33 decimals each. Cost of these seeds was assumed to be equivalent to that of a
reputed Punjab brand of foundation seeds and was to be paid in advance in the second week
of November. The AA also agreed to provide a crop card to be filled by the farmers and
followed up by the IGS and the PC failing which the company had the right to reject the
contracted fields of farmers. The PC was also not supposed to hold AA liable or responsible
for any failure in the crop or lower yield arising out of AA supplied foundation seeds unless it
was proven that the seeds had not germinated. At harvesting, all defected seed potatoes were
to be removed. Otherwise, it could be done by the buyer at the time of grading and sent back
to farmer.
The price of purchase of seed potato was based on average market price of potato in the first
two weeks of March in the local potato market with an addition of Rs.0.95 per kg. This price
was for seed potato of 25 to 35 mm size. The buyer was to pay a commission of Rs.10 per bag
to IGS. The larger size seeds were to be bought at the prevailing market price as the buyer had
agreed to buy back entire production. 50% of the payment was to be made within a week or
ten days after receiving the seeds at the cold storage and the rest by the end of March 2018.
The price included all charges until the truck was loaded at Simlapal after grading. The
grading of the seed potato was to be done by a grader provided free of cost on returnable basis
by the buyer at a location made available by the PC. The contracting company had also given
guidelines for production of seed potato including use of chemical and bio-fertilizers, field
preparation, seed treatment, weed control, disease control and pest attack and harvesting over
the cropping cycle of 85 days. The planting instructions were also given.
It had sold farmer produce of potato, bitter gourd, and cucumber to wholesalers but made losses
and therefore, discontinued. It has only once sold some oilseed in APMC markets but since
there was no auction based discovery of price, it ended up selling at lower than the MSP. The
PC was running the supermarket store of Sufal Bangla along with another PC under the same
promoter in 2016-17 but due to problems with the other PC, it moved out of its partnership.
70% of its turnover came from inputs. It received a matching equity grant of Rs.3.17 lakh in
2017-18 and availed another similar grant in 2018-19. It also engaged in palm jaggery purchase
from farmers and sold it to Sufal Bangla and another PC. It availed a loan of Rs.5 lakh under
LAMP fund from its promoter for engaging in seed potato business.
The Board of Directors and the PC management had been exposed to management and
governance of the PC and E-NAM through training at various places by BIRD, Lucknow and
NIAM, Jaipur supported by Government of West Bengal.

207
It thinks that contract farming of seed potato is a good practice though the PC could not manage
it well. It was also getting into paddy seed processing based on contract farming based paddy
seed production by the member farmers. The only problem it faced in its major activity of seed
potato supply was the local competition and spurious seed potato.
Table 5.2: Profile and Performance of Shimlapal Agro PC
Year>
Parameters
2015-16 2016-17 2017-18 2018-19
Authorised capital (Rs. lakh) 10 10 10 10
Share capital (Rs. lakh) 2.53(25%) 3.17(32%) 7.19(71%) 9.71(97%)
Turnover (Rs. lakh) 3.1 19.37 29.15 30.2
Profit (Rs.) -0.46 1.04 0.65 1.46
Reserves and Surplus (Rs. lakh) 1.43 1.31 4.16
Assets (Rs. Lakh) 0.77
Chhatna Agro PC
This PC registered in 2015 is based on farmer’s interest groups (FIGs) promoted by IGS since
2013 which number 69 now across 27 villages of the block. There are 1014 shareholders at
present starting with 336 members in 2015. Each member has to buy minimum of 100 shares
of Rs.10/- each. All of the farmers are marginal landowners or landless and 30% are women
members due to the SFAC mandate for matching equity grant, under which one third of the
BOD and the Chairperson also has to be a women/woman. The PC claims that all its members
are active. It has eight members of Board of Directors and various committees.
The PC had an authorised capital of Rs.20 lakh and paid capital of Rs.13.36 lakh (Table 5.3).
It has reserves of Rs.8 lakh and has already received a matching equity grant of Rs.3.36 lakh
based on number of shareholders in 2015. It has added new members and raised the paid up
capital to Rs.10 lakhs and therefore awaiting for a second instalment of equity grant of Rs. 6.64
lakh.
The PC has seed production licence from the Seeds Certification authority. It has input selling
licences from the local panchayat valid for one year. It has dealership of IFFCO and also runs
Sufal Bangla store. Out of the total turnover of Rs.3.5 crore of Sufal Bangla, 40% of the sales
are of farm produce. It receives 400 footfalls every day and pays 1.1% of the sales turnover to
the government (Sufal Bangla). The monthly turnover of Sufal Bangla store at the farmer’s
market is Rs.25 lakh per month. It also sells farm supplies which make 10% of its turnover. It
has 11-member Board of whom the only woman member is also the President. The only criteria
for membership of the BOD is that one has to be a farmer and 8th grade pass. Other than the
CEO, the PC has one marketing officer and nine salespersons.

208
Photo 5.2: Exterior of a PC run Sufal bangla supermarket in Bankura
The PC deals with various farm inputs, 90% of which is sold to member farmers who buy it
for lower price and better quality with 50% of the members buying exclusively from the PC. It
also runs a custom hiring centre (CHC) which received 80% subsidy and mostly serves member
farmers with relatively lower fee than that for non-members. It was one of the two PCs
promoted by IGS to have an CHC, the other being in Midnapur district. The turnover from
custom hiring entre (CHC) is Rs. six lakh. The PC proposed to expand CHCs and reported no
problem in its functioning. The PC also sells many bio inputs which are produced locally.
It has two retail outlets- one each for input and outputs and another wholesale outlet for buying
vegetable. It also buys vegetables from farmers and sells in wholesale charging a commission
of 5%. It has promoted new crop of black rice, gram and sweet corn besides some pulses in
2019-20 which are cultivated by about 100 farmers each. It is also doing PGS certification for
the last three years especially in black rice. It had a franchise from IFFDC for sale of fertilizers.
It also had input sale licence from the local agriculture office.
Photo 5.3: Interiors of Sufal Bangla Store and its price list
On the output side, it has facilitated contract farming of tomato last year for Simons with 40
farmers including 10 non-members where the contractor provided all the inputs. The contract
was oral and could not be continued because the farmers could not produce quality output. Its
direct retail sales of farmer produce are through Sufal Bangla.

209
Sufal Bangla has helped Chhatna PC in a big way as earlier it was in loss. The PC also
participated in monthly melas-22 in one year, for 5 days each and govt. subsidised it up to
Rs.27000/mela. The PC saved Rs. 22000 out of this as the real cost was only Rs. 5000. Govt.
fixes rate of produce and mostly grains and non-perishable are sold. Chhatna has no brand as
of now. Now, it sells under sufal bangla brand like in honey. The PC had a wholesale vegetable
business licence from the Chhatna Gram Panchayat since 2015.
It has also been selling some of the perishable produce like onion and potato from Sufal Bangla
at much lower than the market price due to provision of government subsidy for the same. It
also collects farmer produce from their doorsteps with only 20% bringing on their own to the
Sufal Bangla centres. The farmers are given local market prices and paid instantly. There are
142 Sufal Bangla stores in this state and 19 in Bankura district alone. In the district, only this
store is working because it has been handed over to the PC, all others are defunct. The PC has
a vegetable stall in Chhatna bazar from where vegetables are sold to traders. The daily turnover
is Rs. 20,000/- and margin is 5%. This outlet has been functioning since 2015.
20% of this turnover comes from farm inputs and services which are made up of 90% from
members and 10% from non-members. 80% of its turnover is on the output side where 50% of
the members transact with PC. It has not paid dividends so far and bought land for Rs.8 lakh.
The members of the BoD had been taken for an exposure visit to a few places by the
Department of agriculture. The PC claims that its best practices include: soil testing, facilitation
of crop insurance scheme and removal of intermediaries in farmer produce training. It plans to
set up pulses, paddy, oilseeds and spice processing units.
Table 5.3: Profile and Performance of Chhatna Agro PC
Year >
Parameters
2015-16 2016-17 2017-18 2018-19
Authorised capital (Rs. lakh) 10 10 10 20
Share capital (Rs. lakh) 3.36(34%) 3.36(34%) 7.36(74%) 13.36(65%)
Turnover (Rs. lakh) 30.73 41.00 97.52 321.65
Profit (Rs. lakhs) -0.45 1.44 2.53 6.23
Reserves and Surplus (Rs. lakh) 0.76 2.60 3.95 9.65
Assets (Rs. Lakh) 0.58 1.72 8.26
The Sufal Bangla sales from its store were of the order of Rs.1.57 lakh per day. On the day of
the visit to one of its large stores in district town of Bankura’s Krishak Bazaar, the sale of the
day was of the order of Rs. 43856/- from 8.30 am to 5.30 pm and it had 233 bills generated
representing footfalls. The grant from the SFAC permitted not only individual members with
a shareholding of Rs.1000 each but also groups of individual shareholders like SHG, FIG or
JLG subject to a maximum of Rs.20000 and institutional shareholders like farmer produce
companies with a limit of Rs.one lakh. The member equity contributed by grant is non-
convertible and has to be issued as additional shares to the existing members within 45 days.
The PC also conducted a value chain analysis of tomato crop and the requirements at the pre
harvest like CHCs and post-harvest facilities like pack house or a cold refer van till the value
additional stage which included processing plant.

210
Photo 5.4: vegetables being sold from a sufal bangla supermarket
Box: The Sufal Bangla Scheme
During a potato price hike way back in 2014, market intervention by the State Government
helped stabilize potato prices to the desired satisfaction of both producers and consumers.
Subsequently when there was a pre-puja hike in vegetable prices the Government was
committed to ensure a fair play in agricultural marketing practices whereby the interests of
both growers and consumers must be safeguarded, thus paving the way for the birth of Sufal
Bangla, with the assistance of Safal (NDDB, New Delhi), and financial support of RKVY
(Rashtriya Krishi Vikash Yojana), the implementing agency being Paschimbanga Agri
Marketing Corporation Ltd.
The venture started in 2014 with 14 mobile shops. According to the state agricultural marketing
department, which runs the Sufal Bangla chain, there are now 72 stalls in Kolkata and 32 in
the districts. In 2019, there were 104 stalls across the state including both permanent and
mobile. A major demand for affordable vegetables, grains and fruits of a number of big housing
complexes in Kolkata is fulfilled by Sufal Bangla. Currently there are 39 Sufal Bangla stalls in
housing complexes, 21 of which are in Rajarhat - the IT hub of Bengal. 141 products are sold
from these stores. The PCs are given these stores to run them as franchisees. There are 5 static
and 2 mobile outlets in Birbhum district and 2 static outlets in Bankura and Hooghly has 5
outlets (static).
Though the overall running of the Sufal Bangla stalls are monitored by the state agriculture
marketing department, but various farmers' producers' companies (FPCs) are involved in day-
to-day operations. The state government distributes the stalls to FPCs through a tendering
process.
The government also constructs the stalls and provide vehicles for bringing the goods from the
farmers’ places to the stalls. The state government said that the direct transport of the goods
without the involvement of middlemen being the key to the very reasonable prices offered to
customers (ET, Nov. 12, 2018).
It was quite a challenge to mobilize producers into collectives such as Farmer Producer
Company (FPC), Farmer Producers Organization (FPO), Farmers Interest Group (FIG),
Farmers Club and Self Help Groups (SHGS). It empowered the producers and gave them the
bargaining power. Assured market and assured payment were prioritized giving rise to a

211
robust procurement network across the districts of the state with Tapasi Malik Krishak Bazar
at Singur in the Hooghly District of West Bengal having emerged as a procurement hub,
modelled on the Hub & Spokes system, with an IT-enabled state-of-the-art laboratory for
grading and quality control.
As the tastes and preferences of consumers changed and diversified, it became imperative to
tie up with Mother Dairy, Kolkata and West Bengal Live Stock Development Corporation
Limited to make the range of products wide enough. State Fisheries Development Corporation
Ltd extends its services in some front end stores across the state.
In its bid at digitization, Sufal Bangla has entered into a partnership with C-DAC for finding
IT solutions for its problems. In order to address the issue, C-DAC, Kolkata, has launched a
drive to ensure optimum induction of IT and Electronics for improvement of services, quality
and transparency of agricultural products especially the exotic varieties of rice such as
Radhatilak, Gobindobhogh, Kalonunia, Kalabhat and Tulaipanji.
Sufal Bangla has made a tie-up with Indian Institute of Packaging for total solution to the
problems of loss, damage etc. IIP offered packaging solutions by installing machines and
offering commodity-specific consultancy.
Paschimbanga Agri Marketing Corporation Limited has also entered into an agreement with
BCKV (Bidhan Chandra Krishi Viswavidyalaya) to the effect that their exotic varieties of rice,
pulses, uni-floral honey, spices, mustard oil, wheat, flour etc will be marketed by
Paschimbanga Agri Marketing Corporation Limited under SUFAL BANGLA brand.
Sufal Bangla Static (brick & mortar) outlet at Shantiniketan in Bholpur appeared in the guise
of a full-fledged department store as part of a pilot scheme with a wide range of products
including fresh fruits, vegetables, potato, milk, ice-cream, paneer, ghee, edible oil, rice, pulses,
chicken, lamb and rabbit meat and processed food. It has weighing scale, crates and perforated
vehicles for transportation of vegetables. It is operated by the FPC which is determined
through bidding on this condition that a certain percentage of the sale proceeds would go to
the Government as royalty and the said percentage would be fixed by financial bidding. As this
business model proved successful, it was replicated elsewhere.
Sufal Bangla soon became popular among the consumers because it uploads the procurement
and retail prices of commodities on its website and mobile App in advance to enable the
consumers to take decisions as to their marketing on their own.
A unique experiment clicked as the FPC-operated retail sale of agricultural produce to the
residents of Uniworld city in New Town became very popular. It also got replicated
elsewhere. Sufal Bangla’s online presence through PC and mobile App turned marketing into
an interactive experience. As a pilot scheme one retail outlet for organic produces has been
opened at New Town.

212
Photo 5.5: Sufal Bangla supermarket Birbhm (Bholpur)
The Sufal Bangla agreement included the PC depositing 1.1% of the total sales as an
institutional overhead as determined during the bidding process. The Sufal Bangla agency was
to provide a covered space for the store and central space for aggregation, storage and grading
of products including decorating and furnishing the store at its own cost. It also provided crates,
weighing scales, visi coolers. The PC also had to give a security deposit of Rs. 25,000 to the
state livestock development corporation for deep freezers to be supplied by them. The work
force for the store was to be employed by the PC and it was to mainint the store and obtain all
licences from the local bodies. The franchisee is about to sell products from other agencies as
per written communication with the respective agencies. But sale and stocking of other than
notified products was not permitted without permission from the Sufal Bangla agency. It was
also mandated that the PC would procure vegetable and other agri produce from individual
farmers or groups or their collectives or from Sufal Bangla in other districts. The franchiser
also retains the right to direct the franchisee to sell any specific products or to procure farm
produce from any farmer or group facing distress. In fact, the first party also retain the right to
utilize the entire infrastructure or part of it for market intervention programme as directed by
the state government. The franchisee has to notify the minimum procurement price and
maximum retail price for the next day daily by 2 p.m. The franchisee would also submit a
consolidated statement of sales to the franchiser and also monthly statement. The PC had to
deposit Rs.20000/- in addition to the regular deposit. The franchisee will get the benefit of
whole sale price not less than 10 percent of the MRP for products procured from livestock
development corporation. These products will have to kept properly in deep freezer and
products once sold by the corporation to the franchisee could not be taken back and only at the
time of delivery any rejection can be pointed out and products return to the corporation. The
franchisee would also mention shelf life of these products and would sell it only during that
period. In the case of products supplied by the Mother Dairy Kolkata, a margin cum cost
sharing amount would be borne by the franchisee to the MDC. The agreement was signed by
project director of Sufal Bangla and the CEO of the producer PC.
The project aimed to directly procure fruits and vegetables from farmers and sell them to
consumers. The state government was committed to fair play in agricultural marketing
practices in order to safeguard the interests of both the growers and the consumers, thus paving

213
the way for Sufal Bangla, which is being run with the assistance of Safal ( National Dairy
Development Board, New Delhi), and the financial support of Rashtriya Krishi Vikash Yojana,
the implementing agency being Paschimbanga Agri Marketing Corporation Ltd.
At present, the state has 47 static counters and 97 mobile counters. Kolkata has the highest
concentration of these counters; the city has 24 static counters and 92 mobile counters out of
the total 144 counters. These counters are located all across the city.
A pricing committee, consisting of officials from the Directorate of Agricultural Marketing,
was set up to analyse daily market prices and declare the Procurement price and the Consumer
Price to be followed by Sufal Bangla.
To aggregate and store vegetables, Singur was designated as the main hub; now there are 20
such hubs. Alongside, more than sixty thousand farmers have been enrolled. The scheme has
also generated a lot of new jobs, for instance, in order to run the stalls. Moreover, there is
indirect employment as well.
By March,2020, the government was planning to open 56 more Sufal Bangla counters and in
the next two years, the total counters would reach 500. The plan was to expand the number of
products as well (IE, Jan 13, 2020).
BKSL PCs
Birbhum PC
The promoter BKSL has set up 8 PCs in the district since 2015. This PC registered in 2015 in
Dubrajpur block of the Bhirbhum district has its origins in FIGs which numbered 55 and were
spread across 25 villages promoted by BKSL since 2013. There were total 1011 members who
were contributing Rs.100 each per month and this money was transferred to the PC as shares
for 700 farmers when the PC was registered. Many other farmers joined later on taking the total
to 1025 members. The members mostly are marginal or small landowners. About 15% of the
members are women and 99% members are active, only one FIG of 20 members is not active
because it is located far away from the PC. PC has authorised capital of Rs.10 lakh and paid
capital of Rs.7.55 lakh (Table 5.4). The PC has reserves of Rs.2 lakh. Each BoD member had
bought shares of Rs. 10,000 each compared with only Rs. 1000 for each ordinary member. It
has 9 members of Board of directors including one woman. The criteria for being appointed on
the BOD is that a member should represent five FIGs totalling 100 farmers and should be
acceptable to all farmers. It has also various licences. for selling various inputs as well as
registration on E-NAM. The PC has a CEO and one lady marketing assistant.
70 % of its input turnover comes from members and 80% of the members buy exclusively from
PC for lower price and better quality. It has supplied paddy and wheat seeds, seed potato and
banana tissue cultured plant besides pulses and groundnut seeds. It has IFFCO dealership for
the last two years and it also sells bio fertilizers supplied by IFFCO and other companies. On
the output side which includes potato, mustard, and vegetables including onion, 75% of its
turnover comes from members. It has shop cum office cum godown and has supplied to local
schools and anganwadis vegetables for Mid-day meal (MDM) for two years.

214
Photo 5.6: Office- cum-godown-cum retail outlet of Birbhum FAPC
It claims that it has brought in new crops of Kharif onion, mushroom, tissue cultures banana
plants, Table potato and aromatic rice to its members as new crops. 200 households are
involved in mushroom production and 800 farmers in potato production and few dozen farmers
each in black rice and kharif onion production.
It had engaged a contract farming in fish and banana last year where fish was directly contracted
by BKSL. It had eight members for fish for BKSL and for bananas for Coventar Agro, five
farmers producing under contract. The PC received a commission of 20% of farmer’s price for
its facilitation service in banana. In the case of fish, besides, 20% of the consumer price retained
by the PC, the organizer of the programme i.e. BKSL also received 20% of it leaving 60%for
the farmer. It has also facilitated leasing of six ponds from individual farmers for the FIGs for
fishing at the rate of Rs.1 lakh per year for ten years. It has also supplied banana once to the
Sufal Bangla stores. It was produced by two members. Besides it has sold vegetables in local
Haat to recover loans after procuring from farmers.
Eighty per cent of the turnover of the PC (total Rs. 35 lakh) comes from input sales of which
members account for 70 per cent. The remaining 20% of the turnover comes from output
handling involving 200 members. The company has for the first time made a profit of Rs.2
lakhs last year and have received a matching equity grant of Rs.3.29 lakh from SFAC. The
business plan of the company was made for the first time in 2018-19 by the promoter, CEO
and the Board of Directors. The promoter has also supported the PC with the salary of the staff
for the first two years, and then supported by SFAC for next three years. At present, the PC
pays the salary of its staff.
The BoD had been exposed to business management and business linkage by the promoter as
well as NABARD. Similarly, the staff have been also trained in day to day business
management accounting and food safety regulations by the promoter and NABARD.
The PC claims that introduction of hybrid seeds, tissue culture banana and fisheries
intervention can be considered its best practices. It also thinks contract farming and its
introduction of Kharif onion as innovative practices. It feels that the tenure of BoD being five
years is a problem as every new batch of BoD need to be trained in their roles. The PC did not

215
report any internal problems. On the external front, it reported shortage of fixed capital and
local trader opposition to its activities as major problems.
Table 5.4: Profile and Performance of Birbhum PC
Year >
Parameter
2015-16 2016-17 2017-18 2018-19
Authorised capital (Rs. lakh) 10 10 10 10
Share capital (Rs. lakh) 4.07(41%) 4.19(42%) 4.19(42%) 7.55(76%)
Turnover (Rs. lakh) 5.27 15.88 5.85 29.85
Profit (Rs. lakhs) 0.88 0.57 0.34 1.04
Reserves and Surplus (Rs. lakh) 0.88 1.46 1.80 2.85
Assets (Rs. Lakh) 1.09 0.88 1.49 1.49
The PC also received a grant from the SFAC for infrastructure under MIDH for a pack house
costing Rs.2 lakhs and zero energy cool chamber costing Rs. 2,000.00. The PC had seed selling
licence and fertiliser licence. It had also received a mini dal mill with a moisture meter from
the State Agro Industries Corporation costing Rs.2.2 lakhs in 2017-18. It had a trade licence
for its two shops from the local panchayat. The PC had a business plan for the period 2017-22
submitted to SFAC.
The PC covered 26 villages and had 649 shareholders in 2017-18 which were to go up to 2000
by the end of the Plan and share capital of the order of Rs.10.9 lakhs. It was looking at roping
in a few hundred farmers every year reaching up to 844 with an average landholding of 1.5
acres. The plan had demand projections for various crop, seed, fertilizers and pesticides
including fish. The marketing plan included selling of inputs as well as output targeting four to
five percent higher income for the farmer from output sale. The Plan also mentions packaging,
promotion, and multi-channel strategy for availing better prices for farmer produce. The PC
had a marketing manager and a finance officer besides a CEO and service provider and Kissan
Mitra to help the marketing manager.
Box: Contract Farming by PC
The PC had a contract farming agreement for banana cultivation for BKSL under which it was
mandated that the PC would provide all the required inputs, supervise the farms and undertake
post-harvesting work besides recording the produce and marketing it. The contracting
company (PC) agreed to provide basic inputs i.e. banana plants – 400 plants per one bigha
and technical guidance to the farmer for two years. The cost of various inputs including leasing
of land at the rate of Rs. 16,000 per bigha (0.33 acre) for the farmer was Rs. 36,000 and Rs.
12,000 each for the contracting agency, and the PC. The contracting agency charges also
included Rs. 4,000 as service charge besides Rs.8000 for 400 plants. It was assumed that 400
plants with a mortality rate of five percent in the first phase of 14 months would provide a total
production of 7.60 tons and price that Rs. 8,000 per ton would give Rs. 60,800 grass income
to the farmer. The second phase of eight months the same number of plants plus two per cent
mortality would give 6.70 tons and gross income of Rs. 53,568. This total to Rs.1.14 lakh
income for the farmer for the full cropping cycle. The contracting agency and the PC made 20
per cent each of the total investments and shared similar percentages from the revenue which

216
came to Rs.10,874 each for company and the agency. The company agreed to facilitate only
the graded material and the under size inferior quality and damaged material was to be sold
in local market or any other market at prevailing price by mutual agreement among all parties.
Shantiniketan KUPC
This PC set up in 2015 originated from 58 FIGs organized by BKSL with 1028 members in
2013. At the time of registration 620 members which has now increased to 1012 shareholders
and 60 FIGs across 22 villages in three gram panchayats in the block of Shantiniketan in
Birbhum district. Anyone with own land or leased land cultivation can become member and
has to buy 50 shares of 10 rupees each. Now it has been increased to 100 shares per member.
The Board of Directors need to pay Rs. 10,000/- for 1000 shares. Majority of the farmers are
marginal and others small or semi medium and there are no landless members as of now. The
average landholding of the members is 3.3 acres. Most of the members are men with only 20
women farmers and only 40 percent of the members were active in 2017-18. But after the PC
started selling fertilizer, 90 percent of the farmers have started transacting with the PC.
The PC has authorised capital of Rs.10 lakh and paid up capital of Rs. 5.04 lakh in 2018-19. It
has reserves of Rs.75000/- and working capital of the order of 7.8 lakh. The PC has various
input licenses, panchayat level trading licence and supplier arrangement with Sufal Bangla.
There are six board members and one of them being woman since beginning, due to the SFAC
mandate. A member should also represent at least 100 farmers to be eligible to be appointed
as a board member. The PC has one CEO and one marketing assistant. The present CEO was
earlier NLRP with the promoting agency for organizing FIGs.
In the first year, the PC had 404 shareholders. It was planned to take this membership to 1200
shareholders and equity capital of Rs.8 lakhs by 2022. It planned to undertake three major
activities – input supply, aggregation and sale of produce and value chain intervention in major
crops of the local area like paddy, potato, onion, other vegetables, and fish. It planned to get
farmers, four to five percent higher price by its intervention on the output side. The company
had facilitated input output sale of the order of Rs.72.7 lakhs in the first of plan going up to
Rs.1.9 crore by 2021-22. Hope to make a profit of Rs.95700 in the first year and Rs.5.36 lakhs
by the end of five-year plan. Its business plan mainly focussed on Kharif paddy, banana and
more importantly potato which made the major chunk of the total business handling besides
fish which was very significant in itself. It had also prepared a month wise plan for each of the
crops and products.
The input business of the PC includes seeds, fertilizers and that too mainly potato and paddy
seeds besides onion and mustard. It also supplies banana and papaya plants. Fifty percent of
the inputs are bought by the members for reasons of lower price and better quality and
availability. 80 percent of the members buy exclusively from the PC. The PC delivers inputs
at the village level if pre-ordered by the grower from distant villages. Last year, PC sold inputs
worth Rs.4.5 lakhs out of which Rs.2 lakhs was potato seed.

217
Photo 5.7: Office-cum- retail outlet of Shantiniketan KUPC
On the output side, it has undertaken contract farming of potato and also uses its office premises
as warehouse in two places on rental basis. It has two such outlets for selling inputs. It has in
the last two years, promoted banana tissue culture cultivation, papaya cultivation and Kharif
onion with 24 farmers upto last year annually. The banana and papaya experiments are only
with two and one farmer each. Like the other BKSL PC it has also ventured into fisheries
contract farming with two fish farmers and banana contract farming with one farmer. In both
cases, the produce was not bought by the contracting agencies due to small quantities or low
quality. It has also helped farmers sell their produce at MSP after registering with the APMC
which numbered 35 last year and 10 this year. It has also facilitated wholesale transactions in
paddy and potato by bringing in wholesale buyers though it was more from non-members
especially in the case of paddy where out of the total transaction of Rs.7 lakhs, 80 percent was
from non-members. It also buys paddy at MSP and sells at higher price. In the case of potato,
it bought worth Rs.4 lakhs from 25 non-member farmers and sold to fresh produce retailers
earning a profit of Rs. 20,000. It has no direct retail presence though it plans to sell vegetables
directly.
Forty percent of the total turnover of the PC came from input business of which 85% was from
fertilizers and 60% from non-members. On the output side, again 60 to 80% of the transactions
were with non-members. The PC had received matching equity grant of Rs.2.07 lakhs last year.
It has also received some support under MIDH for a pack house and from West Bengal
agricultural department for setting up a fruit processing unit. The promoter prepared a five-
year plan in 2017 for the PC.
The PC has been supported first three years by the BKSL and SFAC with the latter extending
its support two more years and upto 2019-20. The board of directors and FIG leaders have been
trained at various places over the last three years in PC management by the promoter and
NABARD training centres. The CEO rather received training in plant health management at
NIPHM Hyderabad.
The PC used marketing linkage development, agricultural production season training, and
drum seeder and direct seeded paddy as its major best practices. It also looks at 100% coverage

218
of its members for input supply and complete integration of value chain in high value crop like
potato as the way forward viable business model for the PC.
In terms of problems, the PC management thinks that the BoD is still not confident of managing
RoC compliances and on the external front, it is still not able to get the benefit of MSP
procurement for all its members. All of its member farmers grow paddy and 20 to 25 percent
each growing mustard and vegetables. It is also planning to become a franchisee of Sufal
Bangla. At present, NABARD PC runs one such store in Bholpur.
Table 5.5: Profile and Performance of Shantinikatan PC
Year >
Parameter
2015-16 2016-17 2017-18 2018-19
Authorised capital (Rs. lakh) 10 10 10 10
Share capital (Rs. lakh) 2.08(21%) 2.08(21%) 2.97(30%) 5.04(50%)
Turnover (Rs. lakh) 1.71 1.40 2.36 19.63
Profit (Rs.) 2.58 -1.04 -4.37 3.99
Reserves and Surplus (Rs. lakh) 2.58 1.53 -2.83
Assets (Rs. Lakh) 0.76 0.58 0.80 0.75
The PC received a grant of Rs.2.11 lakhs towards FPO management cost under special project
during 2013 to 2016. The PC had seven directors at the time of registration, each one holding
1000 shares.
Non-PC FPOs
Saptarishi FPO
Saptarishi FPO is registered trust in 2015 originating from farmer clubs which numbered 5
with membership of 524. In 2015, it started with two farmer clubs and 145 members in one
block which has now expanded to five blocks of the district. These farmer clubs were promoted
by NABARD through the local PACS. The local NGO Chalta Beria has taken over these clubs
and the trust since 2017 as a POPI of NABARD. The NGO itself is 20-year-old. All the
members of the trust have to have land and need to buy equity share of 500 each. The members
are mostly marginal and small farmers and even include 60 landless members.
Ninety percent of the members were male, and 50 percent of the members are active. The FPO
has a paid up capital of Rs. 3.5 lakh and assets Rs. 76 lakh. It has seed potato licence and APMC
trader licence from Gram Panchayat. The Trust had earlier done business in seed potato worth
Rs.40 lakh under a NABARD project and sold these seeds to members of PACS. The PACS
has 2500 members, 60 percent of whom get the benefit of Paddy MSP through the PACS. The
overlap of members between PACS and Saptarishi is 50%. The Trust has nine members of the
board including two women. The farmer members of the Trust on the Board generally are
required to be land owning and formally educated. The FPO has a secretary who is 8th standard
pass, a treasurer, who is a graduate and homemaker and two assistant staff.
The input business of the PC includes seed potato, supply and fish links. Forty percent of the
potato is bought by the members with 10-20 of the members buying exclusively from the Trust.
It also supplies breeder and foundation seed to farmers to produce seed for sale to other farmers.
On the output side, it undertakes aggregation of potato and fish. Latter comes from fish ponds

219
lease from private owners at the rate of Rs.40000 per year. Forty percent of the potato supply
comes from member farmers. It has facilities for processing of groundnut and paddy seeds
which is used for supplying upto 60 percent to the member farmers. It has its own brand of
seed potato and plans to get into American sweet corn also.
The Trust doesn’t have permission to procure at MSP as the PACS do it in this state. It is only
in potato seed that it has been buying from 500 farmers for selling to private traders. It has
sold in the past brinjal in the whole vegetable market which came from 10 farmers and has also
sold potato in Kissan Mandi. The brinjal produce was aggregated and sold on behalf of famers.
However, more recently. Farmers have stopped growing it as it is not possible compared with
potato and groundnut.
Only about one third turnover of the FPO come from input sales of which only 40 percent is
sold to its members. Similarly, of the two third of total turnover coming from the output side,
only 40% comes from members.
The Trust has no business plan as of now. However, it has been receiving capacity building
support from NABARD for the last three years. It had also availed of a loan of Rs.76 lakh at
the rate of 12% interest from NABARD for engaging in seed potato business. This loan was
repaid after borrowing from the DCCB in the name of farmers through PACS at the rate of 7%
interest -an amount of Rs.82 lakh. Since the Trust is being converted into PCs structure now
due to PC being found being better business structure, it will also help it get SFAC matching
equity grant. The Chalta Beria NGO is an RI of SFAC and POPI of NABARD. The Trust has
been able to receive a grant Rs.3.8 lakh from NABARD in 2017-18 for setting up a groundnut
shelling unit.
The staff of FPO have been exposed to its management by NABARD and KVK including a
visit to Gujarat for the same. The FPO considers seed certification facilitation as its practice
the NGO which was registered in 2000 was involved in forming SHGs on the process
innovation side it considers leasing of its pond as an innovation by an FPO.
The major problem of the FPO include lack of awareness among members with forty percent
not being interested in the working of FPO at all. On the external front, it lacks financial support
to undertake new activities. It also plans to get into poultry farming on its own as a high value
business. In 2015-16, it had sold seed potato worth Rs.15.87 lakhs and had procured seeds
worth Rs.105.74 lakhs. It sold this produce for Rs.131.29 lakhs earning a net profit of Rs.16.74
lakhs. For this, it had a loan of Rs.114.55 lakh from NABARD with a repayment period of 10
months.

220
Table 5.6: Profile and Performance of Saptarishi FPO
Year>
Parameter
2014-15
2015-16
2016-17
2017-18
2018-19
2019-20
Turnover (Rs. lakh) .585 69.35 29.92 69.98 14.21 42.47
Profit (Rs. Lakhs) -- -- (-)
25.83
-- .51 3.1
Authorised capital (Rs.
lakh)
-- -- -- -- -- --
Share capital (Rs. lakh) 0.55 .55 .57 .85 2.5 3.5
Reserves and Surplus (Rs.
lakh)
0.02 0.02 -- 0.02
Assets (Rs. Lakh) .58 69.35 74.02 80.30 82 77.76
Number of shareholders 20 31 143 257 500 528
Gram Saathi
This PC was registered in 2019 with an authorised capital of Rs.10 lakh and paid up capital of
Rs.5 lakh. It had a turnover of Rs.12.51 lakh in 2018-19 and net profit of Rs.2.68 lakh. The PC
has been converted from a farmer club federation trust (Srijoni Uttaran) supported by
NABARD, since 2015-16 (Table 5.7) which included the payment of salary of the CEO and
other office expenses. The rationale for converting the Trust into a PC structure was to get into
a for-profit legal structure, get access to matching equity grant from the SAFC and the attraction
of the recent (2019-2020 budget) income tax exemption offered by the government to the PCs
for five years.
The company had a CEO and one more staff handling accounts. Over four years, it had received
total grant of Rs. 6.43 lakh including a revolving fund of Rs. 50,000. It had also received 50%
subsidy amounting to Rs.1.5 lakh from the District Department of Horticulture for the
construction of onion storage structure. The Trust which was registered in 2015 had 40 farmer
clubs which increased to 48 by 2017-18 covering 48 villages, 10 panchayats and four blocks
of the district of Hooghly. All the members of the clubs were now the PC members and mostly
women, numbering 624 in 2017-18. Each member had 50 to 150 shares of Rs.10 each. Most
of its members were marginal land owners and 10 percent even landless. More than 80% of its
members were active. The Srijoni NGO which promoted this Trust and now the PC was
registered in 1999 and is POPI of NABARD. It had earlier along with LWS – a missionary
organization based in Kolkata, promoted 1000 self-help groups (SHGs) in 175 villages across
five blocks of the district. In 2019, it started with 278 members and reached 920 members by
2020.
It had 1016 members of which 920 were already approved shareholders. About 45 of its farmers
were into onion cultivation and 100 farmers were into turmeric cultivation. It was also handling
cashew selling supplied by 100 women farmers who collected it from the forest. Some of its
farmers were also into SRI methods of paddy cultivation and some also grew other vegetables.
The PC was planning to get into goat rearing and duckery as these animals and birds were
already reared by 50% of its member households.
The PC had 10 members on the Board of Directors out of which four were women. The Board
members had to buy a minimum of 100 shares each (Rs. 1000 per member). The Directors and

221
the CEO have been exposed to PC management and governance by NABARD a few times at
the local centre of BIRD.
The PC has a business plan for the next three years which includes various activities like onion,
goat, input supply, turmeric and vegetable cultivation which would lead to a turnover of
Rs.42.5 lakh in 2019-20, going upto Rs.77 lakh in 2021-22.
The PC has not undertaken any input activities so far. On the output side, it claims that it has
encouraged cultivation of onion, groundnut and pulses. It has also helped a few dozen farmers
sell their onions for a commission. It had attempted some retailing of cashew and pulses in the
rural markets in the past.
’’
Photo 5.8: Sarojini brand of spices of Gram Saathi PC
It thinks that building of onion storage structure, processing of pulses and rural retailing of food
products were its best practices which other PCs should follow. The promoters claimed that
this was the weakest PC among all promoted by NABARD in the state.
Major problems faced by the PC included: lack of awareness among the members of whom
only 10% knew that the company belonged to them. Further women members couldn’t spare
much time attending to the affairs of the PC. Its staff also had poor exposure. Most of these
problems were internal, rather than external.
Table 5.7: Profile and Performance of Gram Saathi PC
Year >
Parameters
2016-17 2017-18 2018-19
Share capital (Rs. lakh) 0.29 1.41 1.72
Turnover (Rs. lakh) 0 1.73 8.65
Profit (Rs.) 1.35 0.30 2.68
Assets (Rs. Lakh) 0.47 0.47 0.47

222
Chapter 6
Performance and Impact of PCs in Tamilnadu
Introduction
Tamil Nadu is one of the relatively developed and fast growing states in India, with
considerable progress achieved in various facets of development. Although agriculture
accounts for only 15.7% of total GSDP and 44% of the total employment in Tamil Nadu. Farm
income accounts for about half of household income. 20.6% of the rural population is poor.
For the poorest rural quintile (approximately 1.5 million households), more than three-quarters
of income is derived from agriculture, with agricultural wage labour alone accounting for half
of household income
Of the total gross cropped area of 57.53 lakh hectares, the gross irrigated area was 56% and the
rest (44%) was under rainfed cultivation. Paddy accounts for about a third of the GCA of the
state and nearly 60% of irrigated area in Tamil Nadu (over 90% of paddy is irrigated). Pulses
(18% of GCA), millets (11%), and groundnut (10%) require less water than rice or sugarcane,
and millets and pulses are grown almost exclusively on non-irrigated land. About 5% of GCA
is devoted to sugarcane, all of it irrigated (accounting for almost 10% of irrigated land). Cotton
occupies about 3% of GCA, and about a third of the cotton crop is irrigated. The state accounts
for nearly 6% of the area under fruits and 4% of the area under vegetables in India. In terms of
production, the State’s share is nearly 10% in fruits and 6% in vegetables. The state is also a
leading producer of flowers.
In all, crop agriculture, livestock, and animal husbandry account for 92.2% of total value added
in agriculture and allied activities, with fishing accounting for 4.5% and forestry for 3.3%.
Cropping intensity was at 1.18 during 2011-12.
The average size of individually held farms is only 0.91 hectares, with over half the farms
smaller than 0.5 hectares Nearly three-quarters of farms are smaller than one hectare,
accounting for only 30.2% of total cultivable land. In comparison, the average farm size in
India is 1.41 hectares, with 62% of farmers holding being less than one hectare.
The marginal and small farmers who constituted 91% of the total farmers held 59% land,
whereas medium and large farmers (2.3% of the total farmers) possessed a larger chunk of 20%
of land (Sivagnanam, 2014).
The state has a consortium of FPCs registered as a PC like nine more states of India, with 35
FPCs as members with 100 shares worth Rs. 10,000 each since 2015 with paid up capital of
Rs. 2.2 lakh and authorised capital of Rs. 10 lakh. This consortium PC members run shops and
retail outlets called farmer supermarket network (Unnatham Uzhavar Angadi) by its member
PCs in different places in the state for collectively selling value added products in partnership
with the state department of agri marketing and agribusiness. But, none of the study PCs were
members of this consortium. The Pudukkottai district website mentions one of the study PCs
(Illupur agri PC) as one of the three successfully functioning PCs the district. The state
government is also setting up and handing over 64 primary processing centres (PPCs) costing
Rs. six crore each to PCs across 10 districts. These facilities are provided to PCs for three years

223
at concessional rentals and providing salary of the staff of PPCs of the order of Rs. 15-20 lakh
per annum each (ToI, October 24, 2019).
In this background and context, this chapter examines the physical and financial performance
of various case study PCs in section followed by member non-member comparison in profile
and impact across all PCs together. Section 3 then profiles the PCs across various promoters
and section 4 compares the performance of PCs of the same promoters. Section 5 compares the
goat PC in Tamilnadu with a similar PC in M.P. as they both belong to a unique business and
both are women owned. The chapter then concludes with a summary.
6.1 Profile and Performance of PCs in Tamilnadu
Table 6.1 for all PCs studied in the state shows that all the three ESAP promoted PCs which
had small mobilised equity base of Rs. 10 lakh, Rs. 6 lakh and Rs. one lakh against authorised
capital of Rs. 10 lakh in each case, had not undertaken any business activity in one case even
after 4 years of existence, and therefore was into losses technically. The other two had decent
turnover of Rs. 67 lakh and Rs. 17 lakhs but their profits were negligible.
Kodai Hills of ESAF was one PC which made small profits every year as its revenue was from
high value crops like pepper and coffee. But still it could also not mobilise more than 61% of
its authorised equity from its members. The Theni goat PC which was unique in many ways
i.e. all women PC, into goatery and only PC promoted by an NGO achieved one of the largest
equity mobilisation by reaching 100% of its authorised capital and revenue of the order of Rs.
54 lakh per year with small profits. This was mainly because it was into high value low cost
business of rearing goats and selling meat and live animals locally.
Kottampatti PC by Dhan was a big failure throughout with only coconut trading giving it much
needed respite recently. It could not mobilise even 50% of its authorised equity despite being
a landowning farmer PC. Both the PCs promoted by ITL of Dhan Foundation had mobilised
most of their authorised capital (Rs. 10 lakh and Rs. 25 lakh) and very high levels of revenue
in each case which was more than Rs. one crore. But even their profits were negligible which
is more due to the fact that PCs until recently have behaved like the co-operatives passing on
the surplus generated as price and other benefits to members to avoid paying income tax on
their profits. It is only since last year that their profits have been exempted from income tax for
next five years and it remains to be seen whether profits would go up and reserves and surplus
would be used more for capacity creation by the PCs.
The SEEDS NGO promoted PCs were the most vibrant and successful as they not only
mobilised most of the authorised equity capital (77-90%) which itself was of the order of Rs.20
and Rs. 40 lakh but also had revenue in crores (> 4 crore) in case of SEEDS PC. But, even then
its profits were very modest (Rs. 8 lakh). However, the second PC had small revenue and no
profits from its operations.

224
Table 6.1: Profile and performance of various PC in Tamilnadu
Continued…
Particular
s
Kodai Hills PC (ESAF) Perriyakulam PC (ESAF) Theni Goat (Vidyal) Usilampatti (ESAF) Kottampatti (DHAN)
Year 2016-
17
2017-
18
2018-
19
2016-
17
2017-
18
2018-
19
2015-
16
2016-
17
2017-
18
2018-
19
2015-
16
2016-
17
2017-
18
2018-
19
2016-
17
2017-
18
2018-
19
Authorize
d Capital
(Lakhs)
10 10 10 10 10 10 12 20.5 20.5 20.5 10 10 10 10 10 25 25
Paid up
Capital
(Lakhs)
1
(10%)
3
(30%)
6.11
(61%)
1
(10%)
10
(100%
)
10(10
0%)
10.5
(88%)
20.47
(100%
)
20.47
(100%
)
20.47
(100%
)
1
(10%)
1
(10%)
1
(10%)
1(10%
)
1(10%
)
10
(40%)
10(40
%)
% of
Shares
held by
promoter
100 33 20 100 100 100 1 1
Revenue
(Lakhs)
3.13 3.64 17.4 29.61 67.17 125.0
7
3.19 14.47 26.94 54.65 0 0 0 0.11 0.011 3.03 56.45
(50.72
-
cocon
ut)
Profit
(Loss)
(Lakhs)
0.09 0.18 0.28 0.07 0.25 0.13 0.01 0.18 0.43 0.84 (0.03) (0.05) (0.05) (1.51) 0.000
38
(0.39) 0.21
Reserves
&
Surplus
(Lakhs)
0.8 0.27
.57
0.07 0.2 0.34 0.01 0.19 0.62 1.47 (0.03) (0.08) (0.13) (1.64) 0.000
38
(0.29) (0.08)
Assets
(Lakhs)
0.83 1.24 0 0 0 0 0 0 0 0.072 0 0 2.44

225
Table 6.1: Profile and Performance of various PCs in Tamilnadu
Particul
ars
Illupur PC (KTL) Thotukkudi Pulses PC (KTL) V AFPC (SEEDS) Seeds PC (SEEDS)
Year 2015-
16
2016-
17
2017-
18
2018-
19
2015-
16
2016-
17
2017-
18
2018-
19
2015-16 2016-
17
2017-
18
2018-19 2015-16 2016-17 2017-18 2018-
19
Authori
zed
Capital
(Rs.
Lakh)
10 10 10 10 10 10 25 25 20 20 20 20 40 40 40 100
Paid up
capital
(Rs.
lakh)
10(100
%)
10(10
05)
10(100
%)
10(100
%)
10(100
%)
10(100
%)
20(80
%)
20(80
%)
13.94
(70%)
7.7
(38%)
10
(50%)
15.37(7
7%)
35.94(9
0%)
35.94(9
0%)
35.94(9
0%)
47.15
Revenu
e (Rs.
Lakh)
48.06 62.33 116.82 136.06 49.5 71.9 99.51 95.98 0 44 6.41 5.3 117.8 272.3 470.8
Profit
(Loss)
(Rs.
Lakh)
0.4 0.22 0.059 5.69 0.0977
2
0.4832 0.679
99
0.483
91
0 0.0093
2
0.0163
7
0.23 4.11 (4.8) 8.17
Reserve
s &
Surplus
(Rs.
Lakh)
0.33 0.55 0.72 116.92 0.0977
2
0.5809
2
1.14 1.52 0.27 3.11 14.47 22.64
Assets
(Rs.
Lakh)
19.07 40.82 43.55 164.5 0.59 0.47 0.2 4.67 0.7 52.7

226
6.2 PC member and non-member farmers: Profile and Impact
Of the 105 members interviewed in Tamilnadu across 9 PCs, 46% were women farmers with
17% of them being illiterate with most others having school level literacy. 76% of them
reported farming as the primary occupation and 60% animal husbandry (Tables 6,.2& 6.3).
Farming and animal husbandry (14% each) and labour (13%) happened to be major secondary
occupations among those 49% who reported any secondary occupation (Table 6.4).
47% of the 91 non-member farmers were women and 30% each of them were illiterate or
middle school literate with another 13% each being primary or high school literate. 74% of
them reported farming as their primary occupation followed by farm labour by 14% and animal
husbandry by 10%. More than half of them did not report any other occupation with 10% and
12% reporting farming and animal husbandry and another 18% farm labour as secondary
occupation. There were a few farmers each into petty business or skilled labour besides 5%
also being MGNREGA workers.
Table 6.2: Distribution of PC member and non-member farmers by education
Category> Members Non-members
Parameter>
Education
No. of
farmers
% of all No. of
farmers
% of all
Illiterate 18 17.14 27 29.67
Primary 7 6.67 12 13.19
Middle 30 28.57 27 29.67
High School 27 25.71 12 13.19
Higher Secondary 16 15.24 7 7.69
Undergrad 6 5.71 3 3.30
Graduate 1 0.95 0 0
Diploma 0 0 3 3.30
Total 105 100.00 91 100.00
Table 6.3: Distribution of PC member and non-member farmers by Primary
Occupation
Category> Members Non-members
Parameter>
Primary Occupation
No. of
farmers
% of all No. of
farmers
% of all
Agriculture 80 76.19 67 73.63
Animal Husbandry 17 16.19 9 9.89
Business 1 0.95 0 0
Cash collector in Bank 1 0.95 0 0
Labour 6 5.71 13 14.29
Skilled Labour 0 0 2 2.20
Total 105 100.00 91 100.00

227
Table 6.4: Distribution of PC member and non-member farmers by Secondary
Occupation
Category> Members Non-members
Parameter>
Secondary Occupation
No. of
farmers
% of all No. of
farmers
% of all
Agriculture 15 14.29 9 9.89%
Animal husbandry 15 14.29 11 12.09%
Business 1 0.95 2 2.20%
Construction Supervisor 1 0.95 0 0
Service/Govt Job (Revenue) 1 0.95 2 2.20%
Labour 14 13.33 17 18.68%
Medicinal Plant Dealer 1 0.95 0 0
None 54 51.43 47 51.65%
Retired Teacher 1 0.95 0 0
Skilled Labour/Tailor 2 1.90 3 3.30%
Total 105 100.00 91 100.00%
The average owned land of members was 5.12 acres and operated land 6 acres per household
(Table 6.5). The members were mostly marginal, small and semi medium farmers (90%) of the
total owning 53% of land. However, in terms of operated land, they accounted for only 82% of
all farmers and 43% of the operated land (Tables 6.6 and 6.7)). 48% had owned ground water
resource of irrigation and 50% were rain fed. Only 2% reported access to canal water these
farmer members mostly owned goat and cows with goats accounting for 68% of the total
animals, cows 20% and sheep another 7%.
The average owned land of non-members was 3.7 acres and operated land 4.12 acres. 73% of
non-member farmers were marginal or small farmers owning 30% land. There were no large
landowners with the rest 14% and 13% each being semi medium or medium category farmers
but they had 21% and 48% of total land. There was not much difference in the operated land
distribution with 73% still being marginal or small operators cultivating 31% land. On the other
hand, semi medium and medium farmers who were 26% of the total cultivated only 61% land
though they had owned 70%. This was due to the leasing in and out of land where one farmer
ended up being in the large farmer category operating 8% of total land. 58% of the farmers
were rainfed and only 4% had access to canal irrigation with the rest depending on wells and
tube wells for irrigation with some being shared and some also buying water from other
farmers. 39% and 37% of the farmers owned cows and goat respectively with 18% having
poultry with others owning bullocks and one farmer sheep. In terms of number of livestock,
goats accounted for 61% with an average of 10 goats per household and cows and poultry 18%
of the total.

228
Table 6.5: Average Owned and Operated Land of PC Members and Non- Members
Category>
Average Land (acres)
Members Non- Members
Owned 5.13 3.7
Operational 6.04 4.12
Table 6.6: Category-wise Distribution of PC member and non-member farmers by
Owned Land
Category> Members Non- Members
Parameter>
Farmer
category
No. of
farmers
% of
all
Land
in
acres
% of
total
No. of
farmers
% of all Land
in
acres
% of
total
Marginal 48 45.71 50.7 9.42 49 53.85 43.15 12.83
Small 29 27.62 107.5 19.96 17 18.68 58.25 17.32
Semi-med 17 16.19 126.25 23.45 13 14.29 72 21.40
Medium 8 7.62 124 23.03 12 13.19 163 48.45
Large 3 2.86 130 24.14 0 0.00 0 0.00
Total 105 100.00 538.45 100.00 91 100.00 336.4 100.00
Table 6.7: Category-wise Distribution of member and non-member farmers by
Operated Land
Category> Members Non- Members
Parameter>
Farmer
category
No. of
farmers
% of
all
Land
in
acres
% of
total
No. of
farmers
% of
all
Land
in
acres
% of
total
Marginal 46 43.81 56.2 8.27 46 50.55 48.35 12.89
Small 24 22.86 83.5 12.29 20 21.98 66.75 17.80
Semi-Med 16 15.24 150.75 22.19 13 14.29 76 20.26
Medium 14 13.33 178 26.20 11 12.09 154 41.06
Large 5 4.76 211 31.05 1 1.10 30 8.00
Total 105 100.00 679.45 100.00 91 100.00 375.1 100.00

229
Table 6.8: Distribution of member and non-member farmers by livestock Owned
Category> Members Non-Members
Parameter>
Livestock
type
No. of
farmers
% of
all
No. of
livestock
% of
all
Average No. of
farmers
% of
all
No. of
livestock
% of
all
Average
Cow 43 40.95 134 19.34 3 32 39.02 94 22.60 2.94
Cow(shared) 1 0.95 35 5.05 35 0 0 0 0 0
Goat 47 44.76 468 67.53 10 30 36.59 311 74.76 10.37
Oxen 3 2.86 6 0.87 2 4 4.88 6 1.44 1.5
Sheep 5 4.76 50 7.22 10 1 1.22 5 1.20 5
Total 105 100 693 100.00 91 100 416 100.00
64% of them relied on friends and other farmers for agricultural information with only 7%
relying exclusively on PC. As against this, non-members relied only on informal networks for
this (Table 6.9).
Table 6.9: Distribution of member and non-member farmers by Source of general
agricultural knowledge
Category> Members Non-Members
Farmers
Source of info
No. of
farmers
% of all No. of
farmers
% of all
Friends/ Neighbours/ Relatives 67 63.81 84 92.31
Newspapers/ Radio 1 0.95 0 0
PC 7 6.67 0 0
Friends/ Neighbours/ Relatives, PC 18 17.14 2 2.20
Friends/ Neighbours/ Relatives, Mobile groups 2 1.90 0 0
PC, Mobile/ Mobile Groups 2 1.90 0 0
ADO, Extension Workers 1 0.95 0 0
Friends/ Neighbours/ Relatives, Newspapers/
Radio, PC
1 0.95 0 0
Friends/ Neighbours/ Relatives, Newspapers/
Radio, PC, ADO
1 0.95 0 0
Friends/ Neighbours/ Relatives, Newspapers/
Radio, Mobile/ Mobile Groups, ADO
1 0.95 0 0
Friends/ Neighbours/ Relatives, PC, Mobile/
Mobile Groups
1 0.95 0 0
Friends/ Neighbours/ Relatives, PC, ADO 2 1.90 0 0
Coffee Board 1 0.95 0 0
Mobile/ Mobile Groups 0 0 1 1.10
Friends/ Neighbours/ Relatives, Newspaper/
Radio 0 0 1 1.10
Friends/ Neighbours/ Relatives, Newspaper/
Radio, ADO, exhibition 0 0 1 1.10
Friends/ Neighbours/ Relatives, ADO 0 0 1 1.10
Friends/ Neighbours/ Relatives, Newspaper/
Radio, ADO 0 0 1 1.10
Total 105 100.00 91 100.00

230
The average cropping intensity of the members was 1.16. Major crops grown in Rabi season
included coffee, coriander, maize and paddy in terms of share of cropped area but only about
35% of farmers took any crop in this season. There were even fewer crops grown in summer
season mostly maize, vegetables and coffee, sorghum and jasmine being grown in more than
10% of the area each but buy only about 10% of the farmers. The major cropping season was
Kharif were most of the farmers grew multiple crops with 15% farmer each growing chilli, and
green gram, 18% paddy, 23% vegetables and 13% black gram. The crops of maize, vegetables
and chilies and green gram accounted for 14%, 11% and 8% and 8% respectively of the Kharif
area. Paddy accounted for 9% and millets another 5% like sorghum (Tables 6.11- -6.12).
So far as the cropping pattern in Kharif was concerned, 21% of the member farmers grew
maize, 18% paddy, 24% vegetables, 15% chilli and 13% black gram and 15% green gram.
Cotton was planted by 10% of the farmers as where millets and sorghum many farmers had
various crops inter-cropped and mixed cropped. Vegetables accounted for 11% of the Kharif
area and maize 14% with paddy accounted for 9% (Table 6.13). The other significant crops in
terms of Kharif area were chilli and gram (8%) each, millets and sunflower and sorghum (5%
each). The Kharif crops which accounted for significant of the gross crop area during the area
were maize at 12%, paddy at 7%, vegetables 9%, and green gram and chilli at 7% of the total
area during the year. In Rabi season, large number of farmers planted paddy (5%), vegetables
(4%), and black gram 3%. In fact, only 30% farmers grew crops in Rabi. In terms of area, major
crops were maize and paddy at 12% and coffee at 11% besides chilli and ragi at 5%.
Surprisingly coriander accounted for 11% of the season area and cotton along with green and
red gram 12%. In terms of the gross crop area, this was only 13% of the total with coffee, maize
and paddy accounting for a major chunk besides coriander. Very few farmers took a summer
crop which was mainly the plantation crop of coffee accounting for 45% of the total area
followed by sorghum and vegetables at 10% and jasmine flowers another 10% besides ragi and
black gram along with some intercrops 9% each. Summer area were only 5% of the total
cropped area during the year with Kharif accounting for 83% of the total.
In terms of cropping pattern, in Rabi season, very few non-member farmers grew any crops,
and they were mostly pulses, cotton and oilseeds. Cotton accounted for 28% of the area
followed by sesame at 13% and black, green and red gram another 13%. Bitter guard also took
another 13% of the area and beans were another major crop with 9% of the area. Tamarind had
9% and paddy and cucumber accounted for 6% of the Kharif area each. Altogether this season
had only 4% of the GCA of the year and cotton was the only crop which had more than 1% of
the GCA. In Kharif, major crops grown by significant number of farmers included: black gram,
green gram, cotton, millets, paddy, banana and chilli. Pulses were the major group of crops
grown during the season accounting for 20% of the area followed by maize, cotton and sorghum
at 11% and banana and groundnut at 5% and 4% respectively. This season had 96% of the
GCA accounted for mostly by pulses crops, maize, cotton, paddy and sorghum besides banana,
chillies, and millets.

231
Table 6.10: Kharif Cropping Pattern of PC Members
Parameters>
Crop
Members %
members
Area % of Kharif
Area
% of total
area
Average
Area
Avocado 2 1.90 2.5 0.41 0.34 1.25
Banana 7 6.67 10 1.63 1.35 1.43
Black gram 14 13.33 25.5 4.17 3.45 1.82
Chilli 16 15.24 47.5 7.76 6.43 2.97
Coconut 7 6.67 11.55 1.89 1.56 1.65
Coffee 4 3.81 17.5 2.86 2.37 4.38
Cotton 11 10.48 25 4.08 3.38 2.27
Green Gram 16 15.24 48.2 7.88 6.53 3.01
Maize 22 20.95 85.45 13.96 11.57 3.88
Paddy 19 18.10 52.15 8.52 7.06 2.74
Groundnut 10 9.52 23 3.76 3.11 2.30
Millet 11 10.48 32.5 5.31 4.40 2.95
Sunflower 5 4.76 28 4.57 3.79 5.60
Sorghum 11 10.48 30.75 5.02 4.16 2.80
Red gram 3 2.86 5 0.82 0.68 1.67
Flat Gram 3 2.86 2.5 0.41 0.34 0.83
Jasmine 4 3.81 4.25 0.69 0.58 1.06
Mango 2 1.90 3 0.49 0.41 1.50
Orange 1 0.95 0.5 0.08 0.07 0.50
Vegetables 25 23.81 68.8 11.24 9.31 2.75
Black Gram, Bengal Gram 1 0.95 1 0.16 0.14 1.00
Brinjal, Sorghum 1 0.95 0.3 0.05 0.04 0.30
Coffee, Avocado 1 0.95 3 0.49 0.41 3.00
Coffee, Pepper, Orange, Banana 1 0.95 1 0.16 0.14 1.00
Coffee, Pepper 4 3.81 7.9 1.29 1.07 1.98
Coffee, Pepper, avocado, Orange 2 1.90 8.5 1.39 1.15 4.25
Coffee, Pepper, Banana 1 0.95 1.5 0.25 0.20 1.50
Coffee, Pepper, Orange 2 1.90 6 0.98 0.81 3.00
Coriander, Maize 1 0.95 4 0.65 0.54 4.00
Cotton, Groundnut, Black Gram 1 0.95 3 0.49 0.41 3.00
Cotton, Red Gram, black Gram,
Green Gram
1 0.95 2 0.33 0.27 2.00
Cotton, Red gram, Maize, Green
Gram, Black gram
1 0.95 6.5 1.06 0.88 6.50
Flat gram, Groundnut 3 2.86 3.9 0.64 0.53 1.30
Fodder 3 2.86 4 0.65 0.54 1.33
Green gram, Red Gram, Maize 1 0.95 2 0.33 0.27 2.00
Green Gram, Black Gram 1 0.95 2 0.33 0.27 2.00
Maize, Black Gram 1 0.95 4 0.65 0.54 4.00
Maize, Black gram, Red Gram 1 0.95 4 0.65 0.54 4.00
Maize, Green Gram 1 0.95 1 0.16 0.14 1.00
Maize, sorghum 1 0.95 1 0.16 0.14 1.00
Onion, Maize 2 1.90 12 1.96 1.62 6.00
Pepper, Orange 1 0.95 2 0.33 0.27 2.00
Red Gram, Sorghum 2 1.90 2.8 0.46 0.38 1.40
Sunflower, Chilli 1 0.95 3 0.49 0.41 3.00
Teak 1 0.95 2 0.33 0.27 2.00
Total
100 612.05 100 82.86

232
Table 6.11: Rabi cropping pattern of PC members
Parameter>
Crop
Members %
members
Area % rabi area % total
area
Average
Area
Banana 1 0.95 1 1.07 0.14 1.00
Black Gram 3 2.86 2.5 2.67 0.34 0.83
Chilli 2 1.90 4 4.28 0.54 2.00
Coffee 1 0.95 10 10.70 1.35 10.00
Coffee, Banana 1 0.95 5 5.35 0.68 5.00
Coriander 1 0.95 10 10.70 1.35 10.00
Cotton 3 2.86 3.5 3.74 0.47 1.17
Cotton, Green Gram 1 0.95 5 5.35 0.68 5.00
Cotton, Red Gram 1 0.95 6.5 6.95 0.88 6.50
Flat gram 1 0.95 1.5 1.60 0.20 1.50
Green Gram 2 1.90 1.5 1.60 0.20 0.75
Green/Red gram/maize 1 0.95 2 2.14 0.27 2.00
Groundnut 3 2.86 3.5 3.74 0.47 1.17
Jasmine 2 1.90 3.25 3.48 0.44 1.63
Maize 3 2.86 11 11.76 1.49 3.67
Vegetables 4 3.81 6.5 6.95 0.88 1.63
Paddy 5 4.76 11 11.76 1.49 2.20
Ragi 1 0.95 4.5 4.81 0.61 4.50
Red Tuar, Kova 1 0.95 0.8 0.86 0.11 0.80
Total
100 93.5 100 12.66
Table 6.12: Summer cropping pattern of PC members
Parameter>
Crop
Members %
members
Area % Summer
Area
% total
area
Average
Area
Banana 1 7.69 1 2.98 0.14 1.00
Black gram,
Groundnut
1 7.69 3 8.94 0.41 3.00
Coffee 1 7.69 12 35.77 1.62 12.00
Coffee, Pepper 1 7.69 3 8.94 0.41 3.00
Cotton 1 7.69 0.5 1.49 0.07 0.50
Jasmine 2 15.38 3.25 9.69 0.44 1.63
Ragi, Pearl gram 1 7.69 3 8.94 0.41 3.00
Red Tuar, Kova 1 7.69 0.8 2.38 0.11 0.80
Sorghum 1 7.69 3.5 10.43 0.47 3.50
Vegetables 3 23.08 3.5 10.43 0.47 1.17
Total 100 33.55 100 4.54
In the case of non-members, major kharif crops in terms of number of farmers growing them
an the area under them were: black gram (12% of kharif area), maize (11%), cotton, sorghum,
and paddy (7% each) green gram and millets (6% each) banana (5%), chillies (4%) and some
planation crops like coffee and pepper. In Rabi, which had only 4% of cropped area, cotton,
sesame, tamarind, various type of gram and vegetables were major corps. The summer season

233
crops were grown by only two farmers with tomato and beans and just 2.5 acres of GCA (Table
6.14).
Table 6.13: Kharif Cropping Pattern of Non-Members
Parameter>
Crop
Non-
member
farmers
% of non-
member
farmers
Total
Area
Average
Area
% Kharif
Area
% Total
Area
Avocado 1 1.10 0.5 0.50 0.13 0.13
Banana 7 7.69 20.5 2.93 5.39 5.14
Black Gram 15 16.48 44.5 2.97 11.71 11.17
Chilli 7 7.69 15.5 2.21 4.08 3.89
Coconut 2 2.20 4 2.00 1.05 1.00
Coffee 1 1.10 4 4.00 1.05 1.00
Coriander 4 4.40 11 2.75 2.89 2.76
Cotton 13 14.29 27.5 2.12 7.23 6.90
Flat Gram 4 4.40 3 0.75 0.79 0.75
Fodder 4 4.40 3 0.75 0.79 0.75
Green Gram 10 10.99 22.5 2.25 5.92 5.65
Groundnut 10 10.99 14 1.40 3.68 3.51
Horse Gram 3 3.30 2 0.67 0.53 0.50
Maize 11 12.09 41 3.73 10.79 10.29
Millets 7 7.69 23.5 3.36 6.18 5.90
Orange 1 1.10 0.5 0.50 0.13 0.13
Paddy 16 17.58 26.1 1.63 6.87 6.55
Pearl Millet 4 4.40 11 2.75 2.89 2.76
Pulses 1 1.10 1 1.00 0.26 0.25
Red Gram 1 1.10 2.5 2.50 0.66 0.63
Sesame 2 2.20 2.5 1.25 0.66 0.63
Sorghum 10 10.99 26 2.60 6.84 6.52
Sunflower 3 3.30 7.5 2.50 1.97 1.88
Urad 1 1.10 2 2.00 0.53 0.50
Vegetables 5 5.49 8.75 1.75 2.30 2.20
Watermelon 1 1.10 2 2.00 0.53 0.50
Coffee, Pepper 3 3.30 16.5 5.50 4.34 4.14
Banana, coconut 1 1.10 1 1.00 0.26 0.25
Chilli, Cotton 1 1.10 1 1.00 0.26 0.25
Chilli, Millet 1 1.10 2 2.00 0.53 0.50
Chilli, Onion 1 1.10 10 10.00 2.63 2.51
Coffee, orange 1 1.10 2 2.00 0.53 0.50
Groundnut, Flat gram 1 1.10 1 1.00 0.26 0.25
Pepper, Orange 1 1.10 2 2.00 0.53 0.50
Ragi, Black gram 1 1.10 1 1.00 0.26 0.25
Coffee, Pepper, Orange 2 2.20 12.25 6.13 3.22 3.07
Black gram, Green
gram, red gram
1 1.10 2 2.00 0.53 0.50
Coffee, Banana, Orange,
Avocado
1 1.10 3 3.00 0.79 0.75
Total 100 380.1 100 95.38

234
Table 6.14: Rabi cropping pattern of Non-Members
Parameter>
Crop
Non-
member
farmers
% of non-
member
farmers
Total
Area
Average
Area
% Rabi
Area
% Total
Area
Beans 1 1.10 1.5 1.5 9.43 0.38
Bitter Gourd 1 1.10 2 2 12.58 0.50
Black gram, Green
gram, red gram
1 1.10 2 2 12.58 0.50
Cotton 2 2.20 4.5 2.25 28.30 1.13
Cucumber 1 1.10 1 1 6.29 0.25
Paddy 1 1.10 1 1 6.29 0.25
Ragi 1 1.10 0.5 0.5 3.14 0.13
Sesame 1 1.10 2 2 12.58 0.50
Tamarind 1 1.10 1.4 1.4 8.81 0.35
Total 100 15.9 100 3.99
The members were more aware of PC name than the non-members (57% versus 24%). Further,
only 15% farmers thought or knew the PC belongs to farmers with others mentioning PC
employees (24%) or promoting agency (22%) as the owners. There was hardly any awareness
of PC ownership among non-members (Tables 6.15 and 6.16).
Table 6.15: Distribution of TN members and non-members by Knowledge of PC Name
Category> Members Non-Members
Parameter>
PC Name No. of farmers % of all
No. of farmers % of all
Don’t Know 37 35.24 77 76.24
Wrong Name 8 7.62 0 0
Correct Name 60 57.14 24 23.76
Total 105 100 101 100
Table 6.16: Distribution of TN members and non-members by Knowledge of PC Owner
Category> Members Non-Members
Parameter>
PC Owner
No. of
farmers
% of all No. of
farmers
% of all
Don't Know 33 31.43 89 88.12
BoD 7 6.67 0 0
Farmers 16 15.24 4 3.96
PC Employees 25 23.81 3 2.97
Private Company 1 0.95 0 0
Promoting Agency 23 21.90 5 4.95
Total 105 100 101 100

235
Among the members, dealers emerged as the major source of seed purchase with 35% buying
from there. Only 17% farmers bought it from the PC with another 11% from both PC as well
as dealers. 9% even reported buying it from other farmers and 5% using home based seed
(Table 6.17). The reliance on dealers was even higher in case of chemical inputs at more than
60% with only 22-30% farmers buying it from the PC. In fact, even PACs did not figure as a
major source or even fertiliser purchase (Table 6.18). The bio inputs which were used by the
very small percentage of farmers was bought more from the PC ranging from 75% in case of
bio pesticides and 31% in case of bio fertilisers (Table 6.19). Since the PCs were not into
machinery or equipment selling or renting out, it was mostly bought from dealers and renting
took place from dealers and local farmers with only 4% farmers reporting renting it from PC.
The PCs had higher presence in cattle feed with 1/3rd of the farmers who bought in reporting
as source of purchase was only 10% farmers reporting purchase of cattle feed. 91% farmers
had no complaint about the PC services with 70% even reporting that the PC did help get to
them government schemes and subsidies with 39% specifically reporting crop and other agri
and allied loans.
So far as purchase of inputs were concerned, the seeds were mostly bought by non-members
from dealers and local farmers with only 8% farmers reporting buying it from the PC. On the
other hand, bio-fertilisers and bio-pesticides were mostly bought from dealers and local
farmers. In case of chemical fertiliser, 79% bought it from the dealers and only 8% from the
PC and 2% each from PACs and department of agriculture (Tables 6.17-6.19). Similarly,
chemical pesticides were largely bought from dealers (76%) and local farmers with only 7% of
those reporting buying it from the PC. Since most of the PCs did not deal with machinery
rentals an equal percentage of farmers accessed it from dealers or local farmers. Members
bought form PC for different reasons as listed in table 6.19A.
Table 6.17: Distribution of member and non-member farmers by Source of Seeds
Category> Members Non-Members
Parameter>
Source
No. of
farmers
% of all No. of
farmers
% of all
Dealers 36 34.29 47 51.65
Local Farmers 9 8.57 19 20.88
PACS/ DCS 2 1.90 1 1.10
PC 18 17.14 7 7.69
Other FGs 1 0.95 1 1.10
Agri Dept 4 3.81 4 4.40
Dealers, Local Farmers 5 4.76 0 0
Dealers, PACS 1 0.95 0 0
Dealers, PC 12 11.43 0 0
Dealers, Agri Dept 2 1.90 0 0
Local Farmers, PC 2 1.90 0 0
Local Farmers, Agri Dept 1 0.95 0 0
PC, Agri Dept 1 0.95 0 0
None (Home based) 5 4.76 0 0
Don’t cultivate 6 5.71 12 13.19
Total 105 100.00 91 100.00

236
Table 6.18: Distribution of member and non-member farmers by Source of Chemical
Inputs
Type of Input Fertilizer Pesticide
Category> Members Non-Members Members Non-Members
Parameter>
Source
No. of
farmers
% of all No. of
farmers
% of all No. of
farmers
% of all No. of
farmers
% of all
Dealers 45 60.00 50 79.37 35 67.31 32 76.19
Local Farmers 2 2.67 5 7.94 1 1.92 6 14.29
PACS 2 2.67 1 1.59 0 0 0 0
PC 21 28.00 5 7.94 11 21.15 3 7.14
Agri Dept 1 1.33 1 1.59 1 1.92 0 0
Dealers, PC 3 4.00 0 0 3 5.77 0 0
PC, Agri Dept 1 1.33 0 0 1 1.92 0 0
Dealers, PACS 0 0 1 1.59 0 0 1 2.38
Total 75 100.00 63 100.00 52 100.00 42 100.00
Table 6.19: Distribution of member and non-member farmers by Source of Bio Inputs
Type of bioinput> Biofertilizer Biopesticide
Category> Members Non-members Members Non-members
Parameter>
Source
No. of
farmers
% of all No. of
farmers
% of all No. of
farmers
% of all No. of
farmers
% of all
Dealers 5 31.25 3 37.50 1 12.50 1 33.33
Local Farmers 6 37.50 4 50.00 1 12.50 1 33.33
PC 5 31.25 0 0 6 75.00 1 33.33
Agri Dept 0 0 1 12.50 0 0 0 0
Total 16 100.00 8 100.00 8 100.00 3 100.00
However, 85% could not report any initiatives undertaken by the PC (Table 6.20). Only 14%
were aware of any PC initiatives like agri equipment, loans, training for goat rearing and
procurement or new business, like poultry.
91% members has no dislike for any of the services of the PCs while a few others pointed out
poor access to some of the services like availability or high cost. 60% had not received any
subsidy or information about it from PC while 16% had received subsidised inputs and 6%
various farm equipments like MIS or implements. 2% also reported learning drumstick farming
and 4% reported received SMSs from the PC. 50% even reported receiving loans from/through
the PCs.
45% reported monthly meeting and 34% attended it every time with 17% mentioning quarterly
meeting and 9% attending it every time and another 8% only sometime. More than 2/3rd thought
that PC meeting are held monthly and quarterly and 49% attended them every time and 25%
never and other sometimes or occasionally. The major issues discussed at perceived by the
members came out to the agri related about the working of the PC and provisions of loans. 59%
had never asked any questions in the meetings with 36% were satisfied with the response.

237
Table 6.19A: Distribution of PC members by reasons for purchase of inputs from PC
Type of Input> Seeds Chem. Fert. Chem. Pesti Biofert Biopest
Parameter> Reason
No. of farmers
% of total
No. of farmers
% of total
No. of farmers
% of total
No. of farmers
% of total
No. of farmers
% of total
Better Quality 4 12.12 3 12 1 1 20 2 33.3
Better quality and lower price 1 4 0 0
Better Quality, Easy Accessibility, Lower Cost 1 3.03
2 8 3 0 0
Better Quality, Easy Accessibility, Lower Cost, Lower Price 5 15.15
2 8 0 0 1 16.7
Better Quality, Easy Accessibility/ Lower Cost, Lower Price, Fair Deal/ More Reliable 2 6.06
1 4 0 0 0
Better Quality, Easy Accessibility, Lower Cost, Lower Price, Timely Availability 3 9.09
2 8 0
0 0
Better Quality, Easy Accessibility, Lower Cost, Timely Availability 1 3.03
1 4 1 0 0
Better Quality, Fair Deal/ More Reliable, Timely Availability 2 6.06
1 4 0 0 0
Better Quality, Lower Price ,Fair Deal/,More Reliable, Timely Availability 1 3.03
0 0 0 1 16.7
Better Quality, Lower Price, Timely Availability 1 3.03
0 0 0 0
Better Quality, Timely Availability 1 3.03 0 0 1 20 0
Easy Accessibility/ Lower Cost 2 6.06 1 4 2 1 20 0
Easy Accessibility, Lower Cost and timely availability 0
3 12 1 6.7 1 0
Easy Accessibility, Lower Cost, Fair Deal, More Reliable 2 6.06
1 4 0 0
Easy Accessibility, Lower Cost, Lower Price, Timely Availability 1 3.03
1 4 0 1 20 1 16.7
Easy Accessibility, Lower Cost, Timely Availability 3 9.09
1 4 1 6.7 0 0
Fair Deal/ More Reliable 1 3.03 1 4 0 0 0
Fair Deal/ More Reliable, Timely Availability 1 3.03
2 8 2 13.3 0 0
Lower Price 1 3.03 1 4 0 1 20 1 16.7
Timely availability 0 0 1 6.7
Lower price and timely availability 0 0 1 6.7 0 0
Lower price and more reliable, fairdeal 0
1 4 0 0 0
No other Source 1 3.03 0 0 0 0
Total 33 100.00 25 100 15 100 5 100 6 100

238
Table 6.20: Distribution of member and non-member farmers by their knowledge of
initiatives taken by PC
Category> Members Non-members
Parameter>
PC initiative
No. of
farmers
% of all No. of farmers % of all
No 89 84.76 85 93.41
Goat rearing 2 1.90
Loan 2 1.90 1 1.10
Business Plans to avail Bank loans 1 0.95 0 0
Helping for Dairy and Poultry (financial and technical),
water harvesting, irrigation facilities
1 0.95 1 1.10
Procurement 1 0.95 1 1.10
Inputs 2 1.90 2 2.20
Cultivation ideas 1 0.95 1 1.10
Drip irrigation 1 0.95 0 0
Drip irrigation, Saplings, Motor engine loan 1 0.95 0 0
Loan and Procurement 1 0.95 0 0
Loan, Subsidy, Proper system, Livestock details, Advice
over Phones, New variety, Subsidized input
3 2.86 0 0
Total 105 100.00 91 100.00
83% wanted to continue being members as it was beneficial in various ways like information,
loans and subsidies, procurement and timely and lower cost input supply by PC. Those who
(17%) did not want to continue said so as they did not find it useful or had not availed any
service from the PC. 77% also were keen to encourage others to join the PC as members as it
brought benefits. While 53% did not suggest any new product or services, others suggested
loans and input supply, procurement and market linkage for farm produce, timely supply of
inputs and more training of farmers and value addition to farm produce. A few others also
suggested expanding the membership of the PC and making staff more accountable to
members.
The only major expansion in crop area was in black gram due to the intervention of PC and
yields had improved in cotton, groundnut, maize and many pulses and vegetables by 10-25%
compared with that before the PC intervention. Major price benefits (15-40%) were realised in
pulses, coffee, sunflower, millets and maize by members selling to or through the PC.
Three years before, only one or two farmers each had used the PC channel in flat gram, green
gram, maize, paddy or millets which increased to 5-8 farmers across all of these crops. The
highest jump was in case of black gram which increased to 16 farmers from just 3 farmers three
years earlier. In terms of channels of sale, 29% of the farmers sold 39% of their produce
through the PCs, mainly in the crops of black gram, coffee, cotton, green gram and maize
(Table 6.21). After the intervention of a few years of the PC, many more crops being handed
by the PC in both number of the farmers and quantity sold through the PC increased
substantially.
So far as effect of PCs on the member business was concerned, there were a few produces like
cow milk, black gram, cotton, flat gram, green gram, groundnut, maize, paddy and red gram
where the number of farmers selling through the PC increased significantly as well as output
sold compared with that three years earlier. This was in sharp contrast to the non-member
impact where only in one crop green gram. There were some sales by the non-members through
the PCs.

239
In terms of area shift due to the intervention of PCs there was significant increase reported in
groundnut, black gram, and to some extent coffee. In terms of marketing channels before and
after the interventions of PC, the number of farmers selling through the PC increase
significantly in black gram, flat gram, green gram, groundnut, maize and millets besides paddy.
In fact, paddy, pulses, ragi, red gram, and sesame besides sunflower were being sold first time
through the PCs. In terms of volume sold, besides these crops, coffee also have substantially
increased as did red gram. This was mainly a shift from wholesale channel to the PC channel
in most cases.
76% of the non-member farmers had no knowledge of the PC and 88% did not know who
owned the PC with others mentioning farmers promoting agency and employees in 3 to 4 cases
each. In fact, 81% reported that no one had informed them about the PC with only 6%-7%
mentioning PC employees, friends and meetings as the source. 77% farmers did not want to
become members of the PC and 57% of them were not sure that they wanted to become
members of the PC. 23% wanted to take membership of the PC and of this 11% wanted to
become members to avail of loans and subsidies. 93% had no idea about the activities of the
PC and others mentioned the supply of fertilisers, dairy animals, seeds and other inputs as its
services. 86% had not attended any of the meetings of the PC and others mentioned that it was
more about farming and input supply besides loans, data collection, and prices. 96% had no
experience with the PC and a few others talked about loans and high interest rates. 49% of them
expected only more inputs and subsidies. The non-member farmer accessed agricultural
information from farmers, farmer friends and relatives in 92% cases, and none of them reported
PC as the source with others depending on multiple sources with personal and non-personal
including radio, mobile and newspapers.
Non-member farmers reported improvement in input quality, cost, availability, and adequacy
and very significant improvement in price realise for the output besides small improvement in
output market availability and accessibility. In terms of marketing channels, there was no big
change in the channels used by these non-member farmers except in green gram where earlier,
only one farmer had sold through the PC which increased to three after three years. On the
other hand, in terms of amount of produce sold, it increased from 5% of the total to 64%
overtime. Further, in yellow gram, farmers had been selling through the PC for some time.
There were also cases of contract farming in case of chilli and vegetable where one farmer each
was undertaking contract farming.
In terms of cropping pattern impact of the PCs on non-member farmers, more area was being
grown with maize, millets, coriander and black gram. In terms of yield, significant
improvement was reported in black and green gram crops and in maize and millets besides
sorghum. In fact, the highest yield improvement was reported in vegetables. Due to this,
marketed surplus had gone up significantly in black gram, green gram, maize, red gram and
vegetables. So far as price realisation was concerned, after-PC prices were higher in chillies,
maize, onion, red gram, sorghum and vegetables. However, there was significant delay in
receiving payment in many of these crops compared to pre-PC situation.
Only two and three farmers each of the 91 reported selling black gram and green gram to the
PCs where it was none and only one each three years before respectively.

240
Table 6.21: Distribution of farmer members and produce by crop-wise channel of sales
Cha
nnel
Total Wholesale Retail CF APMC PC
Paramet
ers
Respondents Produce Respondents Produce Respondents Produce Respondents Produce Respondents Produce Respondents Produce
Cro
p
B
efor
e
A
fter
Diff
erence
Be
fore
Af
ter
%
Differenc
e
B
efor
e
A
fter
%
differenc
e
B
efor
e
Af
ter
%
differenc
e
B
efor
e
A
fter
%
differenc
e
B
efor
e
A
fter
%
differenc
e
B
efor
e
A
fter
%
differenc
e
B
efor
e
A
fter
%
differenc
e
B
efor
e
A
fter
%
differenc
e
B
efor
e
A
fter
%
differenc
e
B
efor
e
A
fter
%
differenc
e
B
efor
e
A
fter
%
differenc
e
Cow Mil
k
6 6 194
194
2 0 -100 84 -100 1 1 10 10
1 1 50 50
2 4 100 50 13
4
168
Goat
9 10
11.1
49 149
204 7 3 -57.1
33 21 -36.3
1 1 10 10
1 1 6 6 5 11
2
Avo
cado
4 4 32
5.5
31
5.5
-3.07 4 3 -25 32
5.5
15
.5
-
95.2
1 3
00
Blac
k gra
m
26 2
6
10
2.55
13
5.55
32 22 9 -59 92
.25
30 -
67.4
1 1 0.
75
0.
75
3 1
6
433 9.
55
1
04.
8
997
Brin
jal
4 4 61
8.6
61
8.6
4 4 61
8.6
61
8.6
Chil
li
17 1
8
5.8 20
0.3
21
1.5
5.5 17 1
6
-5.8 20
0.3
19
4.5
-2.9 2 1
7
Coc
onut
5 5 15
60
0
15
60
0
4 4 13
10
0
13
10
0
1 1 25
00
2
5
00
Coff
ee
14 1
4
97.
5
97.
75
0.26 13 1
3
92
.5
94
.75
2.4 1 1 5 3 -40
Cori
ander
7 7 83 89.
5
7.83 7 7 83 89
.5
7.8
Cott
on
19 1
8
-5.2 48
9
51
2.7
5
4.86 18 1
6
-
11.1
18
9
19
7.
75
4.6 1 2 100 30
0
3
1
5
5
Dru
msti
ck
3 3 65 85 30.7 1 1 25 25 2 2 40 6
0
50.0
0%
Flat Gra
m
7 11
57.1
22.8
24.28
6.5 6 6 21.3
16.2
-23.9
1 5 400 1.5
8.0
8
438.6

241
G. Gra
m
18 18
81.8
84.55
3.3 15 9 -40 73.5
60 -18.3
1 1 1.5
0.7
5
-50 2 8 300 6.8
23.
8
250.
Ground
Nut
13 13
99.1
121
22.1 10 6 -40 78.3
69.1
-11.7
3 7 133.3
20.8
51.
9
149.5
jasm
ine
4 4 4.8 5.3 10.4 2 2 3.
5
3.
1
-
11.4
2 2 1.
3
2.
2
69.2
Mai
ze
30 3
0
10
50.
75
11
48.
65
9.3 28 2
1
-25 95
2.
5
82
0.
5
-
13.8
1 1 0.
75
0.
7
5
1 8 700 97
.5
3
2
7.4
235.
8
Man
go
2 2 17 17 1 1 2 2 1 1 15 1
5
Millet
6 6 159.5
208.5
30.7 6 5 -16.6
159.
5
118.
5
-25.7
1 90
Okra
4 4 226
226
3 3 224.
5
224.
5
1 1 1.5
1.5
Oni
on
8 8 21
7
23
0
5.99 8 7 -
12.5
21
7
20
0
-7.8 1 3
0
Ora
nge
7 7 22
4
21
8
-2.68 6 6 20
9
20
8
-
0.48
1 1 15 1
0
-
33.3
Pad
dy
20 1
9
-5 90
1
98
7.75
9.63 19 1
2
-
36.8
85
3
60
2.75
-
29.3
1 7 600 48 3
85
702
P.
gram
6 6 11
7.5
12
1.42
3.34 4 4 11
3
11
5
1.7 2 2 4.
5
6.
42
42.6
Pep
per
10 1
0
90 98.
5
9.44 10 1
0
90 98
.5
9.4
Pulses
2 2 11 11 2 1 -50 11 3 -72.7
1 8
Ragi 2 2 42.
5
42.
5
2 1 -50 42
.5
20 -
52.9
1 2
2.
5
Red
Gra
m
8 8 26.
7
28.
5
6.7 6 4 -33 17
.2
13 -
24.4
2 4 100 9.
5
1
5.
5
63.1
Sunf
low
er
6 6 11
7.5
12
2.5
4.2 6 5 -
16.6
11
7.
5
11
5
-2.1 1 7.
5
Tomato
3 3 93.2
93.2
2 2 63.2
63.2
1 1 30 30
Sorg
hum
1 1 75 60 -20 1 1 75 6
0
-20
Vegetab
les
1 1 600
700
16.6 1 1 600
700
16.6

242
6.3 Comparison across Promoters
58% of the Seeds PC members were male which was lower than Dhan/KTL PC members (60%)
and ESAF PC members (65%). This meant that the share of female members was the highest
for Seeds promoted PC (42%) not very different from Dhan/KTL (40%) PC membership but
much higher than in case of ESAF promoted PC (35%). (Table 6.22). The average age of
Dhan/KTL’s PC members was highest (53 years), followed by ESAF PC members (46 years)
and Seeds PC members (45 years).
Table 6.22: Promoter and gender wise distribution of PC members
Promoter> Seeds Dhan/KTL ESAF
Parameter>
Gender
No. of
farmers
% of all No. of
farmers
% of all No. of
farmers
% of all
Male 14 58.33 21 60.00 22 64.71
Female 10 41.67 14 40.00 12 35.29
Total 24 100 35 100 34 100
18% of ESAF PC members were illiterate followed by Dhan/KTL PC members (17%) and
Seeds (17%) PC members. Most of the Seeds’ PC members were educated up to Middle school
(46%). This share was 29 % and 20 % for ESAF PC members and Dhan/KTL PC members,
respectively. The member farmers having the education up to High school were highest for
Dhan/KTL promoted PC (31 %) followed by Seeds promoted PC (25%) and ESAF promoted
PC (18%). Similar pattern was reported for High school educational level where Dhan/KTL
PC members had highest number (31.43%) followed by Seeds’ PC members (25%) and ESAF
PC members (18%). Dhan/KTL promoted PC also had highest number of member farmers
qualified up to higher secondary which was 17% of the total member farmers followed by
ESAF promoted PC (15%) and Seeds promoted PC (8%). No member farmer was reported to
have completed undergraduate and graduate degrees in the case of Seeds promoted PC while
12 % and 3 % of ESAF PC members had completed undergraduate and post graduate degrees.
In the case of Dhan/KTL PC members, 6% had completed undergraduate degree while no
member was reported to have completed graduate degree (Table 6.23).
Table 6.23: Promoter wise Distribution of PC members by Education
Promoter> Seeds Dhan/KTL ESAF
Parameter>
Education
No. of
farmers
% of all No. of
farmers
% of all No. of
farmers
% of all
Illiterate 4 16.67 6 17.14 6 17.65
Primary 1 4.17 3 8.57 2 5.88
Middle 11 45.83 7 20.00 10 29.41
High School 6 25.00 11 31.43 6 17.65
Higher Secondary 2 8.33 6 17.14 5 14.71
Undergrad 0 0 2 5.71 4 11.76
Graduate 0 0 0 0 1 2.94
Total 24 100 35 100 34 100

243
Farming was reported to be the primary occupation of most of the PC members. 91% of
Dhan/KTL PC members had agriculture as the primary occupation followed by Seeds PC
members (83%) and ESAF PC members (74%). Labour was another major primary occupation
reported with 8% of Seeds’ PC members involved in it. This was followed by ESAF promoted
PC (6%) and Dhan/KTL promoted PC (6%). Animal husbandry was the primary occupation of
15% ESAF PC members followed by Seeds PC members (4 %). None of the Dhan/KTL PC
members were reported to be having animal husbandry as primary occupation. (Table 6.24).
Table 6.24: Promoter wise Distribution of PC members by Primary Occupation
Promoter> Seeds Dhan/KTL ESAF
Parameter>
Primary Occupation
No. of
farmers
% of all No. of
farmers
% of all No. of
farmers
% of all
Agriculture 20 83.33 32 91.43 27 79.41
Animal Husbandry 1 4.17 0 0 5 14.71
Business 1 4.17 0 0 0 0
Labour 2 8.33 2 5.71 2 5.88
Skilled Job 0 0 1 2.86 0 0
Total 24 100 35 100 34 100
Most of the farmers were reported to have no secondary occupation. 62 % of ESAF PC
members were reported to have no secondary occupation. In the case of Dhan/KTL PC
members and Seeds PC members, 60% and 38 % of member farmers had no secondary
occupation. Dhan/KTL PC members had the highest number of farmers working as Labour as
a part of secondary occupation (17%) followed by Seeds PC members (17%) and ESAF PC
members (12%). Animal husbandry had been practiced by 21 % of Seeds’ PC members which
was higher than ESAF PC members (18%) and Dhan/KTL PC members (9%). Agriculture was
the secondary occupation for the members of all the three producer companies with a share of
13%, 6% and 9% for Seeds, ESAF and Dhan/KTL promoted PC. None of the members of
ESAF promoted PC were reported to be services of skilled labour as their secondary
occupation. But in the case of Seeds and ESAF promoted producer companies it was 9% and
8%, respectively (Table 6.25).
Table 6.25: Distribution of PC members by Promoter and Secondary Occupation
Promoter> Seeds Dhan/KTL ESAF
Parameter>
Secondary Occupation
No. of
farmers
% of all No. of
farmers
% of all No. of
farmers
% of all
Agriculture 3 12.50 2 5.71 3 8.82
Animal husbandry 5 20.83 3 8.57 6 17.65
Business 1 4.17 0 0 0 0
Labour 4 16.67 6 17.14 4 11.76
Skilled Labour 2 8.33 3 8.57 0
None 9 37.50 21 60.00 21 61.76
Total 24 100 35 100 34 100
Friends/ Neighbours/ Relatives were reported to be a major source of general information. 79
% ESAF PC members had friends/ neighbours/ relatives as source of information followed by

244
Seeds PC members (79%) and Dhan/KTL PC members (43%). Friends/ Neighbours/ Relatives,
PC was the source of information for 31% Dhan/KTL PC members (highest) followed by
ESAF PC members (9%) and Seeds PC members (8%). PC was also reported to be a key source
of information only in case of Dhan/KTL PC members. Other sources were reported to be less
important sources of information for member farmers (Table 6.26).
Table 6.26: Distribution of PC members by Promoter and source of general agricultural
knowledge
Promoter> Seeds Dhan/KTL ESAF
Parameter>
Source of info
No. of
farmers
% of all No. of
farmers
% of all No. of
farmers
% of all
Friends/ Neighbours/
Relatives
19 79.17 15 42.86 27 79.41
PC 1 4.17 4 11.43 1 2.94
Newspaper/ Radio 1 4.17 0 0 0 0
Friends/ Neighbours/
Relatives, PC
2 8.33 11 31.43 3 8.82
Friends/ Neighbours/
Relatives, Mobile Groups
1 4.17 1 2.86 0 0
Friends/ Neighbours/
Relatives, PC, ADO
0 0 1 2.86 1 2.94
Friends/ Neighbours/
Relatives,
Radio/TV/Newspaper, PC
0 0 1 2.86 0 0
ADO, Extension workers 0 0 1 2.86 0 0
Friends/ Neighbours/
Relatives, Newspaper/ Radio,
Mobile Groups, ADO
0 0 1 2.86 0 0
Friends/ Neighbours/
Relatives,
Radio/TV/Newspaper, PC,
ADO
0 0 0 0 1 2.94
Coffee Board 0 0 0 0 1 2.94
Total 24 100 35 100 34 100

245
Average land ownership was highest in the case of Seeds PC members (8.78 acres) trailed by
Dhan/KTL PC members (6 acres) and ESAF PC members (3 acres). Similarly, the average
operational landholding was also highest for Seeds PC members (12 acres) followed by
Dhan/KTL PC members (6 acres) and ESAF PC members (3 acres). ESAF PCs were really
those composed of marginal and landless farmer groups compared with those of other two
promoters (Table 6.27). On the factors in scale up and better performance of the SEEDS PCs
could be large size of farmer holdings both owned and operated compared with that of the other
two promoters PCS.
Table 6.27: Promoter wise average owned and operated land of PC members
The highest number of marginal farmers were reported for ESAF promoted PC which were
56% of the total farmers followed by Seeds PC members (42%) and Dhan/KTL PC members
(31%). There was no small farmer among Seeds promoted PC members while ESAF promoted
and Dhan/KTL promoted PC each had 35% small member farmers having 16% and 36 %
respectively, of the total owned area member farmers of these PC. Member farmers falling in
the category of semi- marginal land holding were highest for Dhan/KTL prompted PC (23%)
followed by Seeds promoted PC (21%) and ESAF promoted PC (12%) with share of 22%, 15%
and 25% respectively, in the owned land. 29 % of the Seeds PC members were medium farmers
having 43 % of the total owned area. It is followed by Dhan/KTL PC members (11%) owing
21 % of the owned land. Only 3 % of the member farmers of ESAF PC were in the category of
medium farmers owing 15 % of the total owned land. In the case of large farmers, 8 % of the
Seeds PC members were reported to be large farmers owing 38 % of the total owned land. It
was followed by Dhan/KTL PC members in which 6 % of the member farmers were large
farmers owing 36 % of the total land. No member farmer of ESAF PC was reported to be falling
in the category of large farmers (Table 6.28).
Table 6.28: Category-wise Distribution of PC members by Promoter and Owned land
Promoter
>
Seeds Dhan/ KTL ESAF
Paramete
r>
Category
No. of
farme
rs
% of
all
Land
(Acre
s)
% of
all
No. of
farme
rs
% of
all
Land
(Acre
s)
% of
all
No. of
farme
rs
% of
all
Land
(Acre
s)
% of
all
Marginal 10
41.6
7 10 4.74 11
31.4
3 11.3 5.36 19
55.8
8 24.15
24.4
8
Small 0 0 10
28.5
7 34.5
16.3
7 10
29.4
1 35
35.4
8
Semi-M 5
20.8
3 30.75
14.5
9 8
22.8
6 46
21.8
2 4
11.7
6 24.5
24.8
4
Medium 7
29.1
7 90 42.7 4
11.4
3 44
20.8
7 1 2.94 15
15.2
1
Large 2 8.33 80
37.9
6 2 5.71 75
35.5
8 0 0 0 0
Total 24 100
210.7
5 100 35 100 210.8 100 34 100 98.65 100
Promoter>
Average Land (acres)
Seeds Dhan/ KTL ESAF
Owned 8.78 6.02 2.9
Operational 12.26 6.43 2.72

246
ESAF promoted PC (62 %) has highest proportion of marginal farmers followed by Dhan/KTL
promoted PC (31%) and Seeds promoted PC (21%) comprising 30%, 5 % and 3 %,
respectively, of the operational land holding. But small farmers were highest for Dhan/KTL
promoted PC (29%) followed by ESAF promoted PC 26%) and Seeds promoted PC (13%)
covering 34%, 15% and 4 % respectively, of the operational land holding. In the case of semi-
medium category, Seeds promoted PC (21%) have the highest number of member farmers
falling in the category of semi-medium operational land handholding having 11 % of the
operational landholding. Though, the semi- medium farmers make up only 20% of Dhan/KTL
PC members but had an operational landholding of 21 %. 9% of ESAF PC members were semi-
medium farmers occupying 20% of the operational land holding. Seeds PC had highest number
of medium farmers (33%) having 36 % of the operational land holding. It was followed by
Dhan/KTL PC members (14%) occupying 25% of the operational land holding. Only 3% of
ESAF PC members were reported to be as medium farmers but had a considerable share of 16
% in the operational landholding. No large farmers were reported in case of ESAF PC members
while Seeds promoted PC (13%) had highest followed by Dhan/KTL promoted PC (6%). The
operational land holding of large member farmers of Seeds promoted PC and Dhan/KTL
promoted PC was 46 % and 33% of the total (Table 6.29).
Table 6.29: category-wise Distribution of PC members by Promoter and Operational
land
Promote
r>
Seeds Dhan/ KTL ESAF
Paramet
er>
Categor
y
No.
of
farme
rs
%
of
all
Land
(Acre
s)
%
of
all
No.
of
farme
rs
%
of
all
Land
(Acre
s)
%
of
all
No.
of
farme
rs
%
of
all
Land
(Acre
s)
%
of
all
Margina
l
5 20.8
3
8 2.72 11 31.4
3
12.3 5.46 21 61.7
6
27.65 29.8
4
Small 3 12.5 11 3.74 10 28.5
7
34.5 15.3
1
9 26.4
7
31.5 34
Semi-M 5 20.8
3
33.25 11.3 7 20 46.5 20.6
4
3 8.82 18.5 19.9
7
Medium 8 33.3
3
106 36.0
2
5 14.2
9
57 25.3 1 2.94 15 16.1
9
Large 3 12.5 136 46.2
2
2 5.71 75 33.2
9
0 0
Total 24 100 294.2
5
100 35 100 225.3 100 34 100 92.65 100
51 % of the member farmers of Dhan/KTL promoted PC owned cows which was followed by
ESAF (50%) and Seeds promoted PC (21%). But the average was highest for ESAF promoted
PC (3) followed by Dhan/KTL (3) and Seeds promoted PC (3). Goats were owned by member
farmers of all PCs. 79% of Seeds PC members owned goats followed by Dhan/KTL (29%) and
ESAF PC members (21%). The average number of goats were highest for Dhan/KTL promoted
PC (8) followed by Seeds promoted PC (7) and ESAF promoted PC (4). Sheep were not owned
by member farmers of ESAF promoted PC. However, 4 % of Seeds PC members and 9% of
Dhan/KTL PC members owned sheep with the average owned population of 4 and 7
respectively (Table 6.30).

247
Table 6.30: Distribution of PC members by promoter and livestock owned
Promoter> Seeds Dhan/ KTL ESAF
Parameter>
Livestock
No.
of
Me
mb
ers
%
of
all
No
. of
ani
ma
ls
%
of
all
Av
era
ge
No.
of
Me
mb
ers
%
of
all
No
. of
ani
ma
ls
%
of
all
Av
era
ge
No.
of
Me
mb
ers
%
of
all
No
. of
ani
ma
ls
%
of
all
Av
era
ge
Cow 5 20
.8
3
13 8.
33
2.6 18 51
.4
3
56 34
.5
7
3.1
1
17 50 56 46
.2
8
3.2
9
Cow
(Shared)
0 0 0 0 0 0 0 0 0 0 1 2.
94
35 28
.9
3
35
Oxen 1 4.
17
2 1.
28
2 2 5.
71
4 2.
47
2 0 0 0 0 0
Goat 19 79
.1
7
13
7
87
.8
2
7.2
1
10 28
.5
7
81 50 8.1 7 20
.5
9
30 24
.7
9
4.2
9
Sheep 1 4.
17
4 2.
56
4 3 9 21 12
.9
6
7 0 0 0 0 0
Total 24 1
00
15
6
1
00
6.5 35 1
00
16
2
1
00
4.6
3
34 1
00
12
1
1
00
3.5
6
Seeds were purchased either form a single source or a combination of sources. 46 % of the
Seeds’ PC members purchased seeds form dealers followed by ESAF PC members (35%) and
Dhan/KTL PC members (23%). PC was identified as another major source for the purchase of
seeds. Dhan/KTL PC members (31%) had the highest number of member farmers who were
purchasing seeds form PC followed by Seeds PC members (21%). Agriculture department was
supplying seeds to approximately 6 % of Dhan/KTL PC members and ESAF PC members. No
member was reported to have purchased seeds from dealers & PC. However, 25 % of Seeds
PC members and 17 % Dhan/KTL PC members were purchasing seeds from Dealers & PC.
Only 6 % of ESAF PC members were found to have purchased seeds from dealers & agriculture
department with members of no other PC were reported to be doing so. The member farmers
of ESAF PC had a special feature in which 26% of member farmers did not identify any source
for procurement of seeds perhaps for the reasons that they were landless or not into farming
(Table 6.31).

248
Table 6.31: Distribution of PC members by Promoter and Source of Seeds
Promoter> Seeds Dhan/ KTL ESAF
Parameter>
Source
No. of
farmers
% of all No. of
farmers
% of all No. of
farmers
% of all
Dealers 11 45.83 8 22.86 12 35.29
Local Farmers 1 4.17 2 5.71 3 8.82
PC 5 20.83 11 31.43 1 2.94
PACS 0 0 0 0 2 5.88
Other FGs 0 0 1 2.86 0 0
Agri Dept 0 0 2 5.71 2 5.88
Dealers, PC 6 25.00 6 17.14 0 0
Dealers, Local Farmers 1 4.17 2 5.71 1 2.94
Dealers, PACS 0 0 1 2.86 0 0
PC, Agri Dept 0 0 1 2.86 0 0
Local Farmers, Agri Dept 0 0 0 0 1 2.94
Local Farmers, PC 0 0 0 0 1 2.94
Dealers, Agri Dept 0 0 0 0 2 5.88
None 0 0 1 2.86 9 26.47
Total 24 100.00 35 100 34 100
Dealers were identified as major source for chemical fertilizers for member farmers. The
highest dependence was reported by Seeds PC members (54%) followed by ESAF PC members
(47%) and Dhan/KTL PC members (31%). PC was another major source for purchasing
chemical fertilizers. 29% of Seeds PC members were purchasing chemical fertilizers from PC.
23% and 12 % of Dhan/KTL PC members and ESAF PC members had purchased chemical
fertilizers form PC. Dealers & PC was a major source of chemical fertilizers for 8% Seeds PC
members. None of the members of other PC were reported to be purchasing chemical fertilizers
from there. Some members didn’t identify any source for fertilizer procurement. This category
comprises of 37.17 % Dhan/KTL PC members, 32 % ESAF PC members and 8% Seeds PC
members. Responses noted towards the preference for chemical pesticides were similar to that
of chemical fertilizers. 42% Seeds PC members, 41% ESAF PC members and 20% Dhan/KTL
members were reported to be purchasing from dealers. Similarly, PC was another major source
adopted by 57% Dhan/KTL PC members, 13% Seeds PC members and 6% ESAF PC members.
8% of Seeds PC members purchased from Dealers & PC with no significant purchased made
by member of other PC through this channel. 50% Seeds PC members, 38% Seeds PC members
and 17% Dhan/KTL PC members were reported to have not identified any source for the
purchase of chemical pesticides (Table 6.32).

249
Table 6.32: Promoter-wise Distribution of PC members by Source of Chemical inputs
Types of
Agrochemi
cals>
Fertilizer Pesticide
Promoter>
Parameter
>
Source
Seeds Dhan/KTL ESAF Seeds Dhan/KTL ESAF
No.
of
farm
ers
%
of
all
No.
of
farm
ers
% of
all
No.
of
farm
ers
% of
all
No.
of
farm
ers
%
of
all
No.
of
farm
ers
% of
all
No.
of
farm
ers
% of
all
Dealers 13 54.1
7
11 31.4
3
16 47.0
6
10 41.6
7
7 20.0
0
14 41.1
8
PC, Agri
Dept
0 0 1 2.86 0 0 0 0 1 2.86 0 0
PACS 0 0 0 0 2 5.88 0 0 0 0 0 0
PC 7 29.1
7
8 22.8
6
4 11.7
6
3 12.5
0
20 57.1
4
2 5.88
Dealers,
PC
2 8.33 1 2.86 0 0 2 8.33 1 2.86 0 0
Local
Farmers
0 0 1 2.86 0 0 0 0 0 0 0 0
Agri Dept 0 0 0 0 1 2.94 0 0 0 0 1 2.94
None 2 8.33 13 37.1
4
11 32.3
5
9 37.5
0
6 17.1
4
17 50.0
0
Total 24 100.
00
35 100.
00
34 100.
00
24 100.
00
35 100.
00
34 100.
00
Biofertilizers and biopesticides were two major bio inputs purchased by member farmers. Most
of the farmers were reported to be not purchasing any bio inputs. The range of non-usage for
bio fertilizers and bio pesticides was 83- 88% and 82- 97% of the member farmers respectively,
for different producer companies. PC emerged out as a key source of procuring bio inputs from
where 8% Seeds PC members, 6 % Dhan/KTL PC members were purchasing bio fertilizers
and 17% of Dhan/KTL PC members were purchasing bio pesticides. Approximately, 6 % of
Dhan/KTL PC members and ESAF PC members were purchasing bio fertilizers. Dealer was
also another source providing bio fertilizers 6% Dhan/KTL PC members, 4% Seeds PC
members and 3% ESAF PC members. (Table 6.33).

250
Table 6.33: Promoter wise Distribution of PC members for source of Bio inputs
Types of
Bio
inputs>
biofertilizer biopesticide
Promoter
>
Paramete
r>
Source
Seeds Dhan/KTL ESAF Seeds Dhan/KTL ESAF
No.
of
farme
rs
%
of
all
No.
of
farme
rs
%
of
all
No.
of
farme
rs
%
of
all
No.
of
farme
rs
%
of
all
No.
of
farme
rs
%
of
all
No.
of
farme
rs
%
of
all
Dealers 1 4.2 2 5.7 1 2.9 1 4.1
7
0 0 0
Local
Farmers
1 4.2 2 5.7 2 5.9 0 0 0 0 1 2.9
PC 2 8.3 2 5.7
1
1 2.9
4
0 0 6 17.
1
0 0
None 20 83.
3
29 82.
8
30 88.
2
23 95.
8
29 82.
8
33 97.
1
Total 24 10
0
35 10
0
34 10
0
24 10
0
35 10
0
34 10
0
The cropping intensity was highest for ESAF PC members (1.48) followed by Dhan/KTL PC
members (1.09) and Seeds PC members (1.08).
The number of crops grown by the member farmers in the kharif season were much higher than
the rabi and Zaid season. Banana was grown in 10% of the kharif area of ESAF PC members.
The kharif acreage reported for Seeds and Dhan/KTL PC members was found to be
insignificant. Chilli as reported to be grown by the member farmers of all three PCs. Highest
share in the kharif acreage was of Seeds promoted PC (13%) followed by Dhan/KTL promoted
PC (5%) and ESAF promoted PC (3%) with the share of 11%, 5% and 3 % in the total area.
Chilli and Onion was grown by members farmers of Seeds PC covering 10% and 8% of the
kharif and total acreage. No other member farmers were reported to be growing chilli and
onion. Coffee was grown by ESAF PC members having a share of 19% and 13 % in kharif and
total acreage. 14% of the total acreage was under maize crop in case of Seeds PC members
followed by Dhan/KTL PC members (12%) and ESAF PC members (7%). Sunflower was
grown by member farmers of Seeds and Dhan/KTL promoted PC only having 6 % share in
kharif acreage for both PC. Paddy was reported as an important crop for the member farmers
of Dhan/KTL promoted PC covering 20% of the kharif acreage and 19% of the total acreage
(Table 6.34).

251
Table 6.34: Promoter wise Kharif Cropping Pattern of PC members
Promoter> Seeds Dhan/KTL ESAF
Parameter>
Crop
Farmer
s
Cropp
ed area
Avera
ge
croppe
d area
%
Kharif
Area
%
Total
Area
Farmer
s
Cropp
ed area
Avera
ge
croppe
d area
%
Kharif
Area
%
Total
Area
Farmer
s
Cropp
ed area
Avera
ge
croppe
d area
%
Kharif
Area
%
Total
Area
Avocado 0 0 0 0 0 0 0 0 0 0 2 2.5 1.25 2.73 1.83
Banana 1 1 1.00 0.37 0.31 0 0 0 0 0 6 9 1.50 9.82 6.57
Brinjal 0 0 0 0 0 0 0 0 0 0 1 0.4 0.40 0.44 0.29
Brinjal, Sorghum 0 0 0 0 0 0 0 0 0 0 1 0.3 0.30 0.33 0.22
Chilli 6 34 5.67 12.6 10.7 6 11 1.83 4.81 4.47 4 2.5 0.63 2.73 1.83
Chilli, Onion 2 27 13.5 10.0 8.5 0 0 0 0 0 0 0 0 0 0
Coconut 0 0 0 0 0 6 10.3 1.72 4.50 4.18 0 0 0 0 0
Coffee 0 0 0 0 0 0 0 0 0 0 4 17.5 4.38 19.09 12.78
Coffee, Avocado 0 0 0 0 0 0 0 0 0 0 1 3 3.00 3.27 2.19
Coffee, Pepper,
Orange, Banana
0 0 0 0 0 0 0 0 0 0 1 1 1.00 1.09 0.73
Coffee, Pepper 0 0 0 0 0 0 0 0 0 0 4 7.9 1.98 8.62 5.77
Coffee, Pepper,
avocado, Orange
0 0 0 0 0 0 0 0 0 0 2 8.5 4.25 9.27 6.21
Coffee, Pepper,
Banana
0 0 0 0 0 0 0 0 0 0 1 1.5 1.50 1.64 1.10
Coffee, Pepper,
Orange
0 0 0 0 0 0 0 0 0 0 2 6 3.00 6.55 4.38

252
Coriander 4 11 2.75 4.08 3.46 1 2 2.00 0.87 0.81 0 0 0 0 0
Coriander, Maize 1 4 4.00 1.49 1.26 0 0 0 0 0 0 0 0 0 0
Cotton 4 10.5 2.63 3.90 3.30 2 1.5 0.75 0.66 0.61 3 4.5 1.50 4.91 3.29
Cotton, Gram 1 2 2.00 0.74 0.63 0 0 0 0 0 0 0 0 0 0
Cotton, Gram, Maize 1 6.5 6.50 2.41 2.04 0 0 0 0 0 0 0 0 0 0
Cotton, Groundnut,
Black Gram
1 3 3.00 1.11 0.94 0 0 0 0 0 0 0 0 0 0
Drumstick 0 0 0 0 0 0 0 0 0 0 3 3 1.00 3.27 2.19
Flat gram, Groundnut 0 0 0 0 0 3 3.9 1.3 1.70 1.58 0 0 0 0 0
Fodder 0 0 0 0 0 1 2 2.0 0.87 0.81 1 1 1.00 1.1 0.73
Ginger 0 0 0 0 0 1 0.5 0.5 0.22 0.20 0 0 0 0 0
Gram 15 32 2.13 11.9 10.1 17 44.7 2.6 19.5 18.15 1 1 1.00 1.1 0.73
Gram, Maize 3 7 2.33 2.6 2.2 0 0 0 0 0 0 0 0 0 0
Green Gram, Urad 1 2 2.00 0.7 0.63 0 0 0 0 0 0 0 0 0 0
Groundnut 0 0 0 0 0 8 20.5 2.56 8.96 8.32 1 2 2.00 2.18 1.46
Jasmine 2 3.25 1.63 1.2 1.02 0 0 0 0 0 0 0 0 0 0
Lemon 0 0 0 0 0 1 1.5 1.50 0.66 0.61 0 0 0 0 0
Maize 8 45 5.63 16.7 14.15 7 28.5 4.0 12.5 11.6 5 10.2 2.04 11.1 7.45
Maize, Black Gram 0 0 0 0 0 1 4 4.0 1.7 1.6 0 0 0 0 0
Maize, sorghum 1 1 1.00 0.37 0.31 0 0 0 0 0 0 0 0 0 0
Mango 0 0 0 0 0 2 3 1.5 1.3 1.2 0 0 0 0 0

253
Millet 8 32.8 4.10 12.18 10.32 10 26.5 2.65 11.58 10.76 0 0 0 0 0
Okra 0 0 0 0 0 0 0 0 0 0 3 2 0.67 2.18 1.46
Onion 3 15 5.00 5.57 4.72 1 1 1.00 0.44 0.41 0 0 0 0 0
Onion, Maize 2 12 6.00 4.46 3.77 0 0 0 0 0 0 0 0 0 0
Orange 0 0 0 0 0 0 0 0 0 0 1 0.5 0.50 0.55 0.37
Paddy 1 2.5 2.50 0.93 0.79 14 45.9 3.28 20.06 18.64 4 3.75 0.94 4.09 2.74
Pepper, Orange 0 0 0 0 0 0 0 0 0 0 1 2 2.00 2.18 1.46
Red Gram 0 0 0 0 0 2 4 2.00 1.75 1.62 0 0 0 0 0
Red Tuar, Kova 1 0.8 0.80 0.30 0.25 0 0 0 0 0 0 0 0 0 0
Sorghum, Red gram 1 2 2.00 0.74 0.63 0 0 0 0 0 0 0 0 0 0
Sunflower, Chilli 0 0 0 0 0 1 3 3.00 1.31 1.22 0 0 0 0 0
Sunflower 2 15 7.50 5.57 4.72 3 13 4.33 5.68 5.28 0 0 0 0 0
Teak 0 0 0 0 0.00 1 2 2.00 0.87 0.81 0 0 0 0 0
Tomato 0 0 0 0 0.00 0 0 0 0 0.00 2 1.6 0.80 1.75 1.17
Total 269.35 84.71 228.8 92.89 91.65 66.95

254
Table 6.35: Promoter wise Rabi Cropping Pattern of PC members
Promoter> Seeds Dhan/KTL ESAF
Parameter>
Crop
Farmers Cropped
area
Average
cropped
area
% Rabi
Area
% Total
Area
Farmers Cropped
area
Average
cropped
area
% Rabi
Area
%
Total
Area
Farmers Cropped
area
Average
cropped
area
% Rabi
Area
%
Total
Area
Banana 1 1 1.00 2.47 0.31 0 0 0 0 0 0 0 0 0 0
Black Gram 2 2 1.00 4.93 0.63 0 0 0 0 0 0 0 0 0 0
Chilli 1 3 3.00 7.40 0.94 0 0 0 0 0 1 1 1.00 3.31 0.73
Coffee 0 0 0 0 0 0 0 0 0 0 1 10 10.00 33.06 7.30
Coffee, Banana 0 0 0 0 0 0 0 0 0 0 1 5 5.00 16.53 3.65
Coriander 1 10 10.00 24.66 3.15 0 0 0 0 0 0 0 0 0 0
Cotton 1 1.5 1.50 3.70 0.47 0 0 0 0 0 1 0.75 0.75 2.48 0.55
Cotton, Gram 2 11.5 5.75 28.36 3.62 0 0 0 0 0 0 0 0 0 0
Gram 0 0 0 0 0 2 1 0.50 9.52 0.41 1 1 1.00 3.31 0.73
Groundnut 1 1.5 1.50 3.70 0.47 1 1 1.00 9.52 0.41 1 1 1.00 3.31 0.73
Jasmine 2 3.25 1.63 8.01 1.02 0 0 0 0 0 0 0 0 0 0
Maize 0 0 0 0 0 0 0 0 0 0 2 3.5 1.75 11.57 2.56
Maize, Gram 1 2 2.00 4.93 0.63 0 0 0 0 0 0 0 0 0 0
Okra 0 0 0 0 0 0 0 0 0 0 1 1 1.00 3.31 0.73
Okra, Brinjal 1 1 1.00 2.47 0.31 0 0 0 0 0 0 0 0 0 0
Onion 1 3 3.00 7.40 0.94 0 0 0 0 0 0 0 0 0 0
Paddy 0 0 0 0 0 1 4 4.00 38.10 1.62 4 7 1.75 23.14 5.11
Millet 0 0 0 0 0 1 4.5 4.50 42.86 1.83 0 0 0 0 0
Red Tuar, Kova 1 0.8 0.80 1.97 0.25 0 0 0 0 0 0 0 0 0 0
Total 40.55 12.75 10.5 4.26 30.25 22.10

255
Table 6.36: Promoter wise PC member Summer Cropping Pattern
Promoter> Seeds Dhan/KTL ESAF
Parameter>
Crop
Farmer
s
Croppe
d area
Averag
e
cropped
area
%
Summe
r Area
%
Tota
l
Area
Farmer
s
Croppe
d area
Averag
e
cropped
area
%
Summe
r Area
%
Tota
l
Area
Farmer
s
Croppe
d area
Averag
e
cropped
area
%
Summe
r Area
%
Total
Area
Banana 1 1 1 12.42 0.31 0 0 0 0 0 0 0 0 0 0
Brinjal 0 0 0 0 0 1 0.5 0.5 7.14 0.20 0 0 0 0 0
Coffee 0 0 0 0 0 0 0 0 0 0 1 12 12 80.00 8.77
Coffee, Pepper 0 0 0 0 0 0 0 0 0 0 1 3 3 20.00 2.19
Cotton 0 0 0 0 0 1 0.5 0.5 7.14 0.20 0 0 0 0 0
Groundnut,
Gram
0 0 0 0 0 1 3 3 42.86 1.22 0 0 0 0 0
Jasmine 2 3.25 1.625 40.37 1.02 0 0 0 0 0 0 0 0 0 0
Millets 0 0 0 0 0 1 3 3 42.86 1.22 0 0 0 0 0
Red Tuar, Kova 1 0.8 0.8 9.94 0.25 0 0 0 0 0 0 0 0 0 0
Vegetables 2 3 1.5 37.27 0.94 0 0 0 0 0 0 0 0 0 0
Total 8.05 2.53 7 2.84 15 10.9
6

256
The number of crops grown in rabi season were higher than summer season. Paddy was a major
crop grown by members of Dhan/KTL PC members & ESAF PC members. No member farmer
of Seeds promoted PC was reported to have grown paddy. Share in the acreage was 38% for
Dhan/KTL PC members and 23 % for ESAF PC members. Millet had a share of 43% in rabi
acreage of Dhan/KTL PC members with no members of other PCs were reported to be
cultivating it. Coffee was reported to be grown by the member farmers of ESAF promoted PC
having an average cropped area of 10 acres occupying 33 % of the rabi acreage. No other PC
members were reported to be growing coffee. Chilli was grown by member farmers of Seeds
promoted PC and ESAF promoted PC covering 7% and 3% of acreage, respectively. Coriander
was a major crop grown by Seeds PC members covering 25% of the rabi acreage. Groundnut
was grown by members of all promoted PCs covering the rabi acreage in the range of 3-10 %.
Gram was cultivated by member farmers of Dhan/KTL promoted PC and ESAF PC members
with a share of 10% and 3% respectively, of the rabi acreage. Jasmine and onion were also
grown by Seeds PC members covering 8% and 7% of the acreage. (Table 6.35)
Summer acreage of the member farmers was dominated by few crops. Cotton occupied 12.4 %
acreage of the summer cropping season. Coffee was grown by ESAF PC members covering
80% of the summer acreage and 9% of the total area. 43 % of summer acreage of Dhan/KTL
PC members was occupied by each by millets and groundnut & gram. Jasmine was reported to
be grown by Seeds PC members occupying 40% of the summer acreage occupying 1% of the
total area. Vegetable was another major crop reported to be grown on 37 % of Seeds PC
member’s summer acreage. (Table 6.36).
Whereas in case of SEED PCs, 2/3 members could specify the name of the PC they were
members of it was only 53% and 46% in case of ESAF and Dhan/KTL. Further, only 11-17%
farmers across three promoters PCs knew that PC belonged to them or farmers with others
mentioning PC employees (1-29%), promoting agency (8-29%) and BoD (5-6%) (tables 6.37&
6.38). Sadly, the lowest awareness of PC name was in case of NGO Dhan/KTL which is well
known NGO in the state. But, in general, the awareness of ownership was very low across all
PCs of all promoters.
Table 6. 37: Promoter-wise Distribution of PC members by Knowledge of PC Name
Promoter> Seeds Dhan/KTL ESAF
Parameter>
PC Name
No. of
farmers % of all No. of
farmers % of all No. of
farmers % of all
Don’t Know 7 29.17 11 31.43 14 41.18
Wrong Name 1 4.17 8 22.86 2 5.88
Correct Name 16 66.67 16 45.71 18 52.94
Total 24 35 34

257
Table 6.38: Promoter-wise Distribution of PC members by Knowledge of PC Owner
Promoter> Seeds Dhan/KTL ESAF
Parameter>
PC Owner
No. of
farmers % of all No. of
farmers % of all No. of
farmers % of all
BOD 1 4.17 2 5.71 2 5.88
Don’t Know 10 41.67 10 28.57 11 32.35
Farmers 4 16.67 4 11.43 5 14.71
PC Employees 7 29.17 9 25.71 6 17.65
Private Company 0 0.00 1 2.86 0 0
Promoting Agency 2 8.33 9 25.71 10 29.41
Total 24 35 34
6.4 Within Promoter PC Comparison
6.4.1 SEEDS NGO PCs
The share of male and female members was same for both the PCs. 58% of the member farmers
were reported to be male while 42% were female member farmers. The average age of the Seeds
PC and the Vizhuthugal PC members was 45 and 46 years respectively. 17 % of the member
farmers were illiterate for both PCs. 50% Seeds and 42% PC members were educated up to
middle level. 25% and 8% member farmers of both PCs were educated up to high school and
higher secondary level (Table 6.39)
Table 6.39: Distribution of SEEDS PC members by Education
PC> Seeds Vizuthugal
Parameter>
Education
No. of farmers % of all No. of farmers % of all
Illiterate 2 16.67 2 16.67
Primary 0 0 1 8.33
Middle 6 50.00 5 41.67
High School 3 25.00 3 25.00
Higher Secondary 1 8.33 1 8.33
Total 12 100 12 100
58 % of Seeds PC members had agriculture as the primary occupation in comparison to 92%
of Vizuthugal PC members. 8 % of Seeds PC members and 8 % of Vizuthugal PC members
had animal husbandry and business as primary occupation. 17% of Seeds PC members were
working as labour for their primary occupation while no member farmer of Seeds PC was
reported to be doing so. No member farmers were working as skilled labour for both the PCs
(Table 6.40).

258
Table 6.40: Distribution of SEEDS PC members by Primary Occupation
PC> Seeds Vizuthugal
Parameter>
Primary Occupation
No. of farmers % of all No. of farmers % of all
Agriculture 7 58.33 11 91.67
Animal Husbandry 1 8.33 0 0
Business 0 0 1 8.33
Labour 2 16.67 0 0
Skilled Labour 0 0 0 0
Total 12 12
17% and 8% of Seeds and Vizuthugal PC members respectively, had agriculture as secondary
occupation while 8% Seeds PC members and 33% Vizuthugal PC members had animal
husbandry as secondary occupation. 33 % of Seeds PC members were working as labour for
their secondary occupation. No member farmers were reported labour as secondary occupation
in the case of Vizuthugal PC. The skilled labour was secondary occupation for 17% Vizuthugal
PC members which was 8% in the case of Seeds PC members. Many member farmers were
reported to have no secondary occupation which was 42% in the case of Vizuthugal PC
members and 33% for Seeds PC members (Table 6. 41).
Table 6.41: Distribution of SEEDS PC members by Secondary Occupation
PC> Seeds Vizuthugal
Parameter>
Secondary Occupation
No. of farmers % of all No. of farmers % of all
Agriculture 2 16.67 1 8.33
Animal husbandry 1 8.33 4 33.33
Labour 4 33.33 0 0
Skilled Labour 1 8.33 2 16.67
None 4 33.33 5 41.67
Total 12 100 12 100
Friends/ Neighbours/ Relatives was the major source of agriculture information for most of the
PC members for both PCs. 83 % and 75 % of Vizuthugal and Seeds PC members respectively,
obtained information about agriculture from Friends/ Neighbours/ Relatives. 8 % of Seeds PC
members obtained agriculture information through PC and Radio/TV/Newspaper each. 8 % of
both Seeds and Vizuthugal PC members obtained information through Friends/ Neighbours/
Relatives, PC. No member farmers of both the PCs obtained information through Friends/
Neighbours/ Relatives, PC, or ADO (Table 6.42).

259
Table 6.42.: Distribution of SEEDS PC members by Source of general agricultural
knowledge
PC> Seeds Vizuthugal
Parameter>
Source
No. of
farmers
% of all No. of
farmers
% of all
Friends/ Neighbours/ Relatives 9 75.00 10 83.33
PC 1 8.33 0 0
Friends/ Neighbours/ Relatives, PC 1 8.33 1 8.33
Friends/ Neighbours/ Relatives, ADO 0 0 1 8.33
Friends/ Neighbours/ Relatives, PC, ADO 0 0 0 0
Radio/TV/Newspaper 1 8.33 0 0
Total 12 100 12 100
The average owned and operational land for Seeds PC members was reported to be 4 acres and
5 acres, respectively. In the case of Vizuthugal PC, the average owned and operational land
was 14 acres and 20 acres, respectively (Table 6.43).
Table 6.43: Average owned and operated land of SEEDS PC members
PC>
Average Land (acres)
Seeds Vizuthugal
Owned 3.89 13.66
Operational 4.72 19.79
Marginal farmers were higher for Seeds PC (58%) than Vizuthugal PC (25%) owning 19% and
1% of the total land, respectively. No small farmers were reported for both PCs. 33% Seeds
PC members were semi-medium having 49% of the owned land while 8% of Vizuthugal PC
members were semi-medium owning 5 % of the land. 8% Seeds PC members were medium
farmers owning 32% of the total land while in case of Vizuthugal PC, 50% of member farmers
were medium and owned 46% of the total land. No member farmer of Seeds PC fell in the
category of large farmers. In case of Vizuthugal PC, 17% of the members were large farmers
who owned 49% of the total land (Table 6.44).
Table 6.44: Category-wise Distribution of SEED PC members by owned land
PC> Seeds Vizuthugal
Parameter>
Category
No. of
farmers
% of
all
Land
(Acres)
% of
all
No. of
farmers
% of
all
Land
(Acres)
% of
all
Marginal 7 58.33 9 19.25 3 25.00 1 0.61
Small 0 0 0 0 0 0.00 0 0
Semi-M 4 33.33 22.75 48.66 1 8.33 8 4.88
Medium 1 8.33 15 32.09 6 50.00 75 45.73
Large 0 0 2 16.67 80 48.78
Total 12 100 46.75 100 12 100 164 100

260
42% of Seeds PC members were reported to be marginal farmers having a share of 14% of the
total operational land. No member farmers falling in the category of marginal farmer were
reported for Vizuthugal PC members. Small farmers were 17% of the Seeds PC members
having a share of 12% of the operational land. But in case of Vizuthugal PC, 8 % of the member
farmers had a share of only 2% of the operational land. Semi-medium farmers were higher for
Seeds PC (33%) than Vizuthugal PC (8%). The share of operational land was also higher for
Seeds PC (77%) than Vizuthugal PC (3%). But the medium farmers were higher for Vizuthugal
PC (58%) than Seeds PC (8%). The operational land was also higher for Vizuthugal PC (38%)
in comparison with Seeds PC (26%). No large farmer was reported in case of Seeds PC while
it was 25% for Vizuthugal PC members which had a large share of 57% of the operational land
(Table 6.45).
Table 6.45: category-wise Distribution of SEED PC members by operated land
PC> Seeds Vizuthugal
Parameter>
Category
No. of
farmers
% of all Land
(Acres)
% of all No. of
farmers
% of all Land
(Acres)
% of
all
Marginal 5 41.67 8 14.10 0 0 0 0
Small 2 16.67 7 12.33 1 8.33 4 1.68
Semi-M 4 33.33 26.75 47.14 1 8.33 6.5 2.74
Medium 1 8.33 15 26.43 7 58.33 91 38.32
Large 0 0 0 0 3 25.00 136 57.26
Total 12 100 56.75 100 12 100 237.5 100
83% of the member farmers of Seeds PC owned goats while 17% owned cows. The average
number of goats, cows and sheep owned were 5, 2 and 4 for Seeds PC members. In case of
Vizuthugal PC, 75% of the member farmers owned goats followed by cows (25%) and oxen
(8%). The population of goats, cows and oxen was 88%, 10% and 2% of the total animal
population. The average population of livestock owned by Vizuthugal PC members was 9
goats, 3 cows and 2 oxen per household. (Table 6.46)
Table 6.46: Distribution of SEED PC members by livestock owned
PC> Seeds Vizuthugal
Parameter>
Type of
animal
No.
of
farme
rs
% of
all
No.
of
Anim
als
% of
all
Avera
ge
No.
of
farme
rs
% of
all
No.
of
Anim
als
% of
all
Avera
ge
Cow 2 16.67 3 5.08 1.5 3 25.00 10 10.31 3.333
333
Oxen 0 0 0 0 0 1 8.33 2 2.06 2
Goat 10 83.33 52 88.14 5.2 9 75.00 85 87.63 9.444
444
Sheep 1 8.33 4 6.78 4 0 0 0 0 0
Total 12 100 59 12 100 97

261
The awareness of the PC name was almost similar for both the PCs. 33 % of Seeds PC members
and 25% of Vizuthugal PC members didn’t know the name of PC. 8% of the member farmers
of both the PCs gave wrong name when asked about the name of PC. Member farmers who
gave the correct name of PC were reported to be 58% and 67% for Seeds and Vizuthugal PC
members, respectively (Table 6.47).
Table 6.47: Distribution of SEEDS PC members by Knowledge of PC Name
PC>
Knowledge of PC Name
Seeds Vizuthugal
No. of farmers % of all No. of farmers % of all
Don’t know 4 33.33 3 25.00
Wrong Name 1 8.33 1 8.33
Correct Name 7 58.33 8 66.67
Total 12 100 12 100
25% Seeds PC members and 58% Vizuthugal PC members didn’t have any knowledge of
owner’s name of the PC. No member farmers reported private company as the owner of PC.
33% of Seeds PC members and 25% of Vizuthugal PC members reported PC employees as PC
owner while 25% Seeds PC members and 8% Vizuthugal PC members reported farmers as PC
owner. 8% of both Seeds and Vizuthugal PC members named promoting agency as the PC
owner (Table 6.48).
Table 6.48: Distribution of Seeds PC members by Knowledge of PC Owner
PC> Seeds Vizuthugal
Parameter>
PC Owner
No. of farmers % of all No. of farmers % of all
BOD 1 8.33 0 0
Don’t Know 3 25.00 7 58.33
Farmers 3 25.00 1 8.33
PC Employees 4 33.33 3 25.00
Promoting Agency 1 8.33 1 8.33
Total 12 100 12 100
Dealers emerged as an important source for procuring the seeds. 67% of Vizuthugal PC
members procured from dealers while in the case of Seeds PC, this share was reported to be
25% of the member farmers. PC was a source of seed purchase for 33% Seeds PC members
and 8% Vizuthugal PC members. Dealers & PC was a major source of seeds for Seeds PC
members (42%) while it was 8% for Vizuthugal PC members. 8 % of the Vizuthugal PC
members were reported to be purchasing seeds from local farmers and dealers & local farmers.
No member farmer was reported to be purchasing seeds from agriculture department and
dealers & PACS (Table 6. 49).

262
Table 6.49: Distribution of SEED PC members by source of seed
PC> Seeds Vizuthugal
Parameter>
Source
No. of
farmers % of all No. of
farmers % of all
Dealers 3 25.00 8 66.67
Local Farmers 0 0 1 8.33
PC 4 33.33 1 8.33
Dealers, PC 5 41.67 1 8.33
Dealers, Local Farmers 0 0 1 8.33
Total 12 100.00 12 100.00
In case of chemical inputs, the usage of the inputs was much higher than bio-inputs. 8 % of the
member farmers for both the Seeds and Vizuthugal PC were reported not to purchasing both
chemical fertilizers and pesticides. 83% and 25 % of Vizuthugal and Seeds PC members were
reported to be purchasing chemical fertilizers form dealers. No member farmer was reported
to be purchasing any chemical inputs from PC & agriculture department. 58% of the Seeds PC
members were sourcing chemical fertilizers from PC while no member farmers purchased
chemical fertilizers from PC. For pesticides, 50 % and 33 % of Vizuthugal and Seeds PC
members respectively, were reported to be purchasing chemical pesticides from dealers. While
17% and 8% of Seeds and Vizuthugal PC members were reported to purchasing chemical
inputs from PC. 8% of member farmers for both the PCs were reported to be purchasing
chemical pesticides from dealers & PC (Table 6.50).
Table 6.50: Distribution of SEED PC members by source of chemical inputs
Type of agro
chemical>
Fertilizers Pesticides
PC> Seeds Vizuthugal Seeds Vizuthugal
Parameter>
Source
No. of
farmers % of all No. of
farmers % of all No. of
farmers % of all No. of
farmers % of all
Dealers 3 25.00 10 83.33 4 33.33 6 50.00
PC 7 58.33 2 16.67 1 8.33
Dealers, PC 1 8.33 1 8.33 1 8.33 1 8.33
None 1 8.33 1 8.33 5 41.67 4 33.33
No member farmer of Vizuthugal PC was reported purchasing any bio inputs. However, 67%
and 92 % of Seeds PC members were reported not to purchasing biofertilizers and
biopesticides, respectively. 8% of Seeds PC members were purchasing biofertilizers from
dealers and local farmers each while 17 % purchased biofertilizers from PC. In the case of
biopesticides, 8% of the Seeds PC members were reported to be purchasing bio-inputs from
dealers (Table 6.51).

263
Table 6.51: Distribution of SEED PC members by source of Bio Inputs
The net sown area of Vizuthugal PC members (238 acres) was higher than Seeds PC members
(57 acres). Cropping intensity was reported to be higher for Seeds PC members (1.40) than
Vizuthugal PC members (1.00).
58% of Seeds PC members were able to provide the correct name of the producer company
which was higher in the case of Vizuthugal PC (67%). 33% of member farmers for both the
PCs didn’t have any knowledge about the name of PC. 8% of Seeds PC members provided
wrong name of the PC while no member farmer was reported to have given wrong name for
Vizuthugal PC (Table 6.52).
Table 6.52: Distribution of SEEDS members by knowledge of PC Name
PC> Seeds Vizuthugal
Parameter>
PC Name
No. of farmers % of all No. of farmers % of all
Correct Name 7 58.33 8 66.67
Don’t Know 4 33.33 4 33.33
Wrong Name 1 8.33 0 0
Total 12 100 12 100
25 % and 58 % of Seeds and Vizuthugal PC members didn’t have any knowledge about the
name of the PC owner. 33% of the member farmers gave the name of PC employees followed
by farmers (25%), BOD (8%) and promoting agency (8%) as the owners of the PC. In case of
Vizuthugal PC, 25 % of the member farmers provided the name of PC employees followed by
farmers (8%) and BOD (8%) when asked about the PC owners (Table 6.53).
Table 6.53: Distribution of SEEDS members by knowledge of PC Owner
PC> Seeds Vizuthugal
Parameter>
PC Owner
No. of farmers % of all No. of farmers % of all
Farmers 3 25.00 1 8.33
BOD 1 8.33 0 0
Promoting Agency 1 8.33 1 8.33
PC Employees 4 33.33 3 25.00
Don’t Know 3 25.00 7 58.33
Total 12 100 12 100
Types of Bio
Inputs>
biofertilizers biopesticides
PC> Seeds Vizuthugal Seeds Vizuthugal
Parameter>
Source
No. of
farmers % of all No. of
farmers % of all No. of
farmers % of all No. of
farmers % of all
Dealers 1 8.33 0 0 1 8.33 0 0
Local Farmers 1 8.33 0 0 0 0 0 0
PC 2 16.67 0 0 0 0 0 0
None 8 66.67 12 100.00 11 91.67 12 100.00
Total 12 100 12 100.00 12 100.00 12 100.00

264
Table 6.54: Kharif Cropping Pattern of SEEDS PC members
PC> Seeds Vizuthugal
Parameter>
Crop
Farmers Cropped
area
Avg
cropped
area
%
Kharif
Area
%
Total
Area
Farmers Cropped
area
Avg
cropped
area
%
Kharif
Area
%
Total
Area
Banana 1 1 1 1.93 1.26 0 0 0 0 0
Chilli 0 0 0 0 0 6 34 5.67 15.6 14.3
Chilli, Onion 0 0 0 0 0 2 27 13.50 12.4 11.3
Coriander 0 0 0 0 0 4 11 2.75 5.06 4.61
Coriander,
Maize
0 0 0 0 0 1 4 4.00 1.84 1.68
Cotton 2 6 3.00 11.6 7.55 2 4.5 2.25 2.07 1.89
Cotton, Gram 1 2 2.00 3.86 2.52 0 0 0 0 0
Cotton,
Groundnut,
Gram
1 3 3.00 5.79 3.78 0 0 0 0 0
Cotton,
Maize, Gram
1 6.5 6.50 12.5 8.18 0 0 0 0 0
Gram 5 10 2.00 19.3 12.6 9 21 2.33 9.66 8.81
Jasmine 2 3.25 1.63 6.27 4.09
Kova 1 0.8 0.80 1.54 1.01
Maize 1 3 3.00 5.79 3.78 7 42 6 19.3 17.6
Maize, Gram 3 7 2.33 13.5 8.81 0 0 0 0 0
Maize,
sorghum
1 1 1.00 1.93 1.26 0 0 0 0 0
Moong 1 1 1.00 1.93 1.26 0 0 0 0 0
Moong,
Urad,
1 2 2.00 3.86 2.52 0 0 0 0 0
Millet 0 0 0 0 0 2 10 5 4.60 4.19
Onion 0 0 0 0 0 3 15 5 6.90 6.29
Onion, Maize 0 0 0 0 0 2 12 6 5.52 5.03
Paddy 1 2.5 2.5 4.82 3.15 0 0 0 0 0
Red Tuar,
Kova
1 0.8 0.8 1.54 1.01 0 0 0 0 0
Sorghum,
Gram
1 2 2 3.86 2.52 0 0 0 0 0
Sorghum 0 0 0 0 0 5 22 4.4 10.1 9.22
Sunflower 0 0 0 0 0 2 15 7.5 6.90 6.29
Total 51.85 65.3 217.5 91.2

265
Gram was the most important crop grown by Seeds PC members occupying 19% of the kharif
area followed by maize & gram (14%), cotton, maize & gram (13%), jasmine (6%), maize
(6%), cotton, groundnut & gram (6%) and paddy (5%). Other crops were crops of little
importance which were either not cultivated or had a very small cultivated area. In case of
Vizuthugal PC members, 19% of the kharif area was occupied by maize occupying 18% of the
total area. Chilli was grown on 16% of the kharif area followed by chilli & onion (12%),
sorghum (10%) and gram (10%). Other major crops grown by the member farmers of
Vizuthugal PC members were onion (7%), onion & maize (6%) coriander (5%) and millet
(5%). No member farmers were reported to be cultivating moong, paddy, cotton & gram,
cotton, maize & gram etc.(Table 6.54).
Kharif acreage was dominated by fewer crops as compared to kharif season. 53% of the rabi
area was occupied by cotton & gram which was 14% of the total area. No member farmer of
Vizuthugal PC was reported to by cultivating cotton & gram. Jasmine was the second most
important crop in the case of Seeds PC occupying 15% of the rabi area which was 4% of the
total area. Maize and gram and groundnut occupied 9% and 7% respectively, of the rabi area.
No Seeds PC members were reported to be cultivating chilli, coriander, cotton, gram and onion.
In case of Vizuthugal PC, Coriander was the most important crop and occupied 53% of the rabi
area followed by chilli and onion both occupying 16 % of the rabi area. Cotton and gram each
occupied 8% of the rabi area and 1% of the total area. No member farmers of Vizuthugal PC
were reported to be cultivating banana, groundnut, jasmine, moong etc. (Table 6.55).
Table 6.55: Rabi Cropping Pattern of SEEDS PC members
PC> Seeds Vizuthugal
Parameter>
Crop
Farmers Cropped
area
Avg
cropped
area
%
Rabi
Area
%
Total
Area
Farmers Cropped
area
Avg
cropped
area
%
Rabi
Area
%
Total
Area
Banana 1 1 1 4.6 1.26 0 0 0 0 0
Chilli 0 0 0 0 0 1 3 3 15.8 1.26
Coriander 0 0 0 0 0 1 10 10 52.6 4.19
Cotton 0 0 0 0 0 1 1.5 1.5 7.89 0.63
Cotton, Gram 2 11.5 5.75 53.4 14.47 0 0 0 0 0
Gram 0 0 0 0 0 1 1.5 1.5 7.89 0.63
Groundnut 1 1.5 1.5 6.9 1.89 0 0 0 0 0
Jasmine 2 3.25 1.6 15.1 4.09 0 0 0 0 0
Maize, Gram 1 2 2 9.3 2.52 0 0 0 0 0
Moong 1 0.5 0.5 2.3 0.63 0 0 0 0 0
Okra, Brinjal 1 1 1 4.6 1.26 0 0 0 0 0
Onion 0 0 0 0 0 1 3 3 15.8 1.26
Red Tuar, Kova 1 0.8 0.8 3.7 1.01 0 0 0 0 0
Total 21.55 27.1 19 7.97
Few crops were cultivated by the member farmers of PCs viz. banana, jasmine, vegetables, red
tuar, okra, brinjal etc. Highest share of summer acreage was occupied by jasmine (54%)
followed by banana (17%), okra & brinjal (17%) and red tuar & kova (13%), in just 6 acres
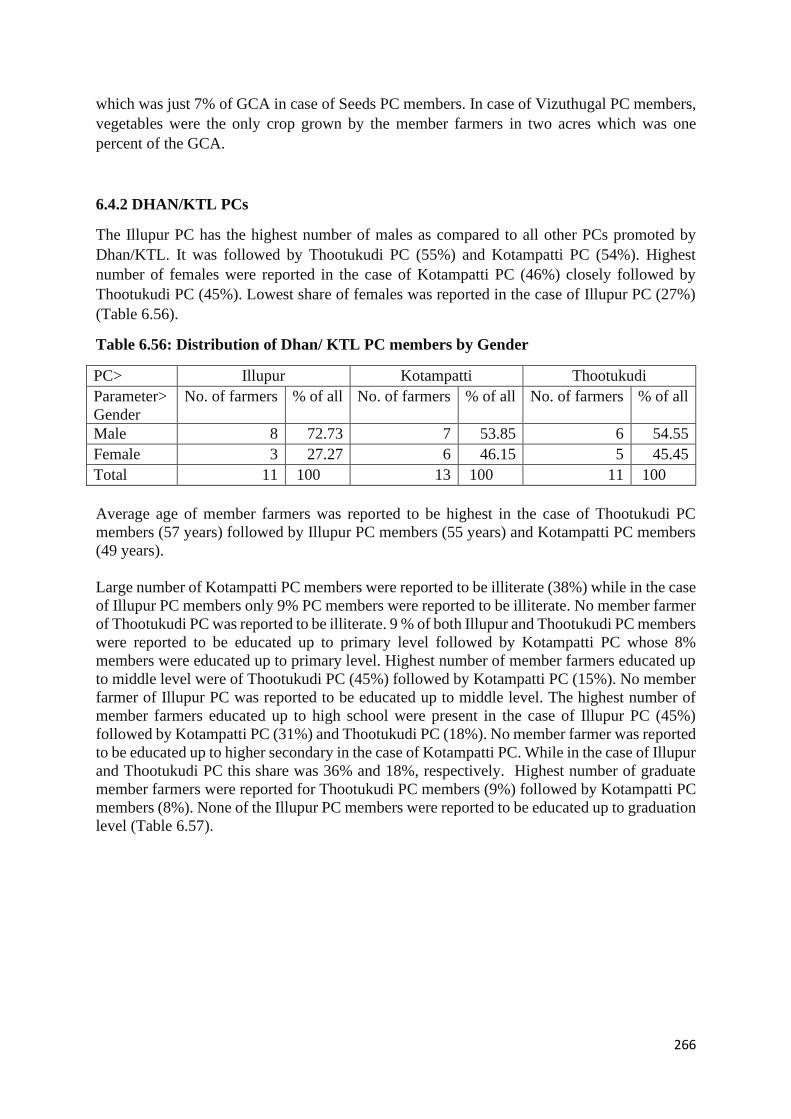
266
which was just 7% of GCA in case of Seeds PC members. In case of Vizuthugal PC members,
vegetables were the only crop grown by the member farmers in two acres which was one
percent of the GCA.
6.4.2 DHAN/KTL PCs
The Illupur PC has the highest number of males as compared to all other PCs promoted by
Dhan/KTL. It was followed by Thootukudi PC (55%) and Kotampatti PC (54%). Highest
number of females were reported in the case of Kotampatti PC (46%) closely followed by
Thootukudi PC (45%). Lowest share of females was reported in the case of Illupur PC (27%)
(Table 6.56).
Table 6.56: Distribution of Dhan/ KTL PC members by Gender
PC> Illupur Kotampatti Thootukudi
Parameter>
Gender
No. of farmers % of all No. of farmers % of all No. of farmers % of all
Male 8 72.73 7 53.85 6 54.55
Female 3 27.27 6 46.15 5 45.45
Total 11 100 13 100 11 100
Average age of member farmers was reported to be highest in the case of Thootukudi PC
members (57 years) followed by Illupur PC members (55 years) and Kotampatti PC members
(49 years).
Large number of Kotampatti PC members were reported to be illiterate (38%) while in the case
of Illupur PC members only 9% PC members were reported to be illiterate. No member farmer
of Thootukudi PC was reported to be illiterate. 9 % of both Illupur and Thootukudi PC members
were reported to be educated up to primary level followed by Kotampatti PC whose 8%
members were educated up to primary level. Highest number of member farmers educated up
to middle level were of Thootukudi PC (45%) followed by Kotampatti PC (15%). No member
farmer of Illupur PC was reported to be educated up to middle level. The highest number of
member farmers educated up to high school were present in the case of Illupur PC (45%)
followed by Kotampatti PC (31%) and Thootukudi PC (18%). No member farmer was reported
to be educated up to higher secondary in the case of Kotampatti PC. While in the case of Illupur
and Thootukudi PC this share was 36% and 18%, respectively. Highest number of graduate
member farmers were reported for Thootukudi PC members (9%) followed by Kotampatti PC
members (8%). None of the Illupur PC members were reported to be educated up to graduation
level (Table 6.57).

267
Table 6.57: Distribution of Dhan/ KTL members by Education
PC> Illupur Kotampatti Thootukudi
Parameter>
Education
No. of
farmers
% of all No. of
farmers
% of all No. of
farmers
% of all
Illiterate 1 9.09 5 38.46 0 0
Primary 1 9.09 1 7.69 1 9.09
Middle 0 0 2 15.38 5 45.45
High School 5 45.45 4 30.77 2 18.18
Higher
Secondary
4 36.36 0 0 2 18.18
Undergrad 0 0 1 7.69 1 9.09
Total 11 100 13 100 11 100
All the member farmers of Illupur PC had agriculture as the primary occupation. Thootukudi
PC falls second after it with 91% of member farmers engaged in agriculture followed by
Kotampatti PC members (85%). 15 % of Kotampatti PC members and 9% of Thootukudi Pc
members were reported to be working as labour and skilled labour respectively, as a part of
their primary occupation. No member farmer of any PC promoted by Dhan/KTL had animal
husbandry and business as primary occupation.
Most of the member farmers of PCs promoted by Dhan/KTL did not have any secondary
occupation. 82% of the Thootukudi PC members did not have any secondary occupation which
was highest among all the PCs. It was followed by Illupur PC members (55%) and Kotampatti
PC members (46%). Agriculture was the secondary occupation for 9% and 8% of Thootukudi
PC members and Kotampatti PC members, respectively while animal husbandry was reported
to be secondary occupation for 18% and 8% of Illupur and Kotampatti PC members.,
respectively. Highest number of member farmers of Kotampatti PC (31%) were working as
labour as a part off their secondary occupation followed by Illupur PC (18%). Skilled labour
was another major secondary occupation reported from these PCs with 9% of member farmers
of both Illupur and Thootukudi PC and 8% of Kotampatti PC members farmers were working
as skilled labour (Table 6.58).
Table 6.58: Distribution of Dhan/ KTL members by Secondary Occupation
PC> Illupur Kotampatti Thootukudi
Parameter>
Secondary Occupation
No. of
farmers
% of all No. of
farmers
% of all No. of
farmers
% of all
Agriculture 0 0 1 7.69 1 9.09
Animal husbandry 2 18.18 1 7.69 0 0
Labour 2 18.18 4 30.77 0 0
Skilled Labour 1 9.09 1 7.69 1 9.09
None 6 54.55 6 46.15 9 81.82
Total 11 100 13 100 11 100
Friends/ Neighbours/ Relatives was most crucial source of information for Kotampatti PC
members (62%) followed by Thotukudi PC members (336%) and Illupur PC members (27%).
Friends/ Neighbours/ Relatives, PC was reported to be another major source of agriculture

268
information from where 36% Thootukudi PC members, 31% Kotampatti PC members and 27%
Illupur PC members obtained general information. Friends/ Neighbours/ Relatives, ADO was
source of information only for 9% Thootukudi PC members while Friends/ Neighbours/
Relatives, PC, ADO was source of information for 9% of both Illupur and Thootukudi PC
members. 9% of Illupur PC members had Friends/ Neighbours/ Relatives,
Radio/TV/Newspaper, PC as source of general information with no member farmer of any
other firm using it as an information source. 8 % of the member farmers of Kotampatti PC had
ADO, Extension workers as a source of general information (Table 6.59).
Table 6.59: Distribution of Dhan/ KTL members by source of general agricultural
knowledge
PC> Illupur Kotampatti Thootukudi
Parameter>
Source of info
No. of
farmers
% of all No. of
farmers
% of all No. of
farmers
% of all
Friends/ Neighbours/
Relatives 3 27.3 8 61.5 4 36.3
PC 3 27.3 0 0 1 9.09
Friends/ Neighbours/
Relatives, PC 3 27.3 4 30.8 4 36.3
Friends/ Neighbours/
Relatives, ADO 0 0 0 0 1 9.1
Friends/ Neighbours/
Relatives, PC, ADO 1 9.1 0 0 1 9.1
Friends/ Neighbours/
Relatives,
Radio/TV/Newspaper,
PC
1 9.1 0 0 0 0
ADO, Extension
workers 0 0 1 7.7 0 0
Total 11 100 13 100 11 100
The owned land was reported to be highest in the case of Thootukudi PC members (8.9 acres)
followed by Kotampatti PC members (5.41 acres) and Illupur PC members (4 acres). Similarly,
the operated land holding was also highest for Thootukudi PC members (10 acres) followed by
Kotampatti PC members (5 acres) and Illupur PC members (4 acres) (Table 6.60).
Table 6.60: Average owned and operated land of Dhan/ KTL PC members
PC>
Average Land (Acres)
Illupur Kotampatti Thootukudi
Owned 3.86 5.41 8.9
Operational 4.04 5.41 10.04
The number of member farmers falling in the category of marginal farmers was the highest for
Kotampatti PC (62%) followed by Illupur PC (27%). In case of small farmer category, the
highest share was for Illupur PC members (26%) followed by Kotampatti PC members (31%)

269
and Thootukudi PC members (18%). In terms of land ownership too, the maximum land
ownership was of small farmers (33%) followed by Kotampatti PC members (19%0 and
Thootukudi PC members (7%). No semi- medium member farmer was present in the case of
Kotampatti PC members. 36% of each Illupur and Thootukudi PC members were semi-
medium farmers owing 56% and 36% of the total owned land. No member farmer was in the
category of medium farmers for Illupur and Kotampatti PC while 36% of Thootukudi PC
members were medium farmers owning 45% of the total area. Large farmers were not present
in case of Illupur PC while 8% of Kotampatti PC members and 9% of Thootukudi PC members
were large farmers owning 71% and 26% of the land, respectively (Table 6.61).
Table 6.61: Category-wise Distribution of Dhan/ KTL members by Owned land holding
PC Illupur Kotampatti Thootukudi
Parameter
>
Land
Category
No.
of
mem
bers
% of
all
Land
(Acr
es)
% of
all
No.
of
mem
bers
% of
all
Land
(Acr
es)
% of
all
No.
of
mem
bers
% of
all
Land
(Acr
es)
% of
all
Marginal 3 27.2
7
4.5 10.5
9
8 61.5
4
6.80 9.67 0 0 0 0
Small 4 36.3
6
14 32.9
4
4 30.7
7
13.5
0
19.2
0
2 18.1
8
7 7.14
Semi-M 4 36.3
6
24 56.4
7
0 0 0 0 4 36.3
6
22 22.4
5
Medium 0 0 0 0 0 0 0 0 4 36.3
6
44 44.9
0
Large 0 0 0 0 1 7.69 50 71.1
2
1 9.09 25 25.5
1
Total 11 100 42.5 100 13 100 70.3 100 11 100 98 100
In terms of operated landholding, 62% Kotampatti PC members and 27% Illupur PC members
were marginal farmers having 10% and 12% of the operational landholding. Member farmers
falling in the category of small farmers were present in case of all the PCs. Illupur PC (45%)
had the highest percentage of the small farmers followed by Kotampatti PC (40%) and
Thootukudi PC (9%) with the share of 40%, 31% and 9% respectively, in operational land
holding. 36% and 27% of the Thootukudi and Illupur PC members were semi-medium farmers.
No medium farmer was reported in the case of Illupur and Kotampatti PC members. 45% of
Thootukudi PC members were medium farmers having an operational landholding of 52%. 9%
Thootukudi PC members and 8% Kotampatti PC members were large farmers having a share
of 22% and 71% of the operational landholding.(Table 6.62).

270
Table 6.62: category-wise Distribution of Dhan/KTL PC members by Operational land
holding
PC> Illupur Kotampatti Thootukudi
Parameter>
Land
Category
No.
of
mem
bers
% of
all
Land
(Acr
es)
% of
all
No.
of
mem
bers
% of
all
Land
(Acr
es)
% of
all
No.
of
mem
bers
% of
all
Land
(Acr
es)
% of
all
Marginal 3 27.2
7
5.5 12.3
6
8 61.5
4
6.80 9.67 0 0 0 0
Small 5 45.4
5
18 40.4
5
4 30.7
7
13.5
0
19.2
0
1 9.09 3 2.71
Semi-M 3 27.2
7
21 47.1
9
0 0 0 0 4 36.3
6
25.5 23.0
8
Medium 0 0 0 0 0 0 0 0 5 45.4
5
57 51.5
8
Large 0 0 0 0 1 7.69 50 71.1
2
1 9.09 25 22.6
2
Total 11 100 44.5 100 13 100 70.3 100 11 100 110.
5
100
Goat was the most important livestock owned by member farmers of Dhan/KTL promoted PCs.
36% of Illupur PC members owned goats which was the highest followed by Thootukudi PC
members (18%) and Kotampatti PC members (15%). But the average number of goats per
member farmer was highest in case of Illupur PC (13) followed by Thootukudi PC (11) and
Kotampatti PC (2). 18% of Illupur PC members owned sheep while in case of Kotampatti PC
members 8% of the member farmers owned sheep. Similarly, oxen were owned by 9% Illupur
PC members followed by Kotampatti PC members in which 8% member farmers owned oxen.
No member farmer of Thootukudi PC was reported to have owned sheep and oxen. Also, no
member farmer of Illupur and Kotampatti PC owned cows. 9% of Thootukudi PC members
owned cows with the average population of 2 per member farmer (Table 6.63).
Table 6.63: Distribution of Dhan/ KTL members by livestock owned
PC> Illupur Kotampatti Thootukudi
Para
meter
>
Lives
tock
No.
of
far
mer
s
%
of
all
Ani
mal
s
(No
.)
%
of
all
Ave
rage
No.
of
far
mer
s
%
of
all
Ani
mal
s
(No
.)
%
of
all
Ave
rage
No.
of
far
mer
s
%
of
all
Ani
mal
s
(No
.)
%
of
all
Ave
rage
Cow 0 0 0 0 0 0 0 0 0 0 1 9.
09
2 8.
33
2
Oxen 1 9.
09
3 4.
00
3 1 7.
69
1 20
.0
0
1 0 0 0 0 0
Goat 4 36
.3
6
52 69
.3
3
13 2 15
.3
8
3 60
.0
0
1.5 2 18
.1
8
22 91
.6
7
11
Sheep 2 18
.1
8
20 26
.6
7
10 1 7.
69
1 20
.0
0
1 0 0 0 0 0
Total 11 1
00
75 1
00
13 5 11 24

271
55% of Thootukudi PC members procured seeds form PC followed by Illupur PC members
(36%) and Kotampatti Pc members (8%). The role of dealers for the supply of seeds to member
farmers was highest for Kotampatti PC (38%) followed by Illupur PC (18%) and Thootukudi
PC members (9%). Member farmers of Illupur PC (9%) and Kotampatti PC (8%) purchased
seeds form dealers & local farmers. Agriculture department emerged out as a source of seeds
for 9% Thootukudi PC members and 8% Kotampatti PC members. Kotampatti PC members
also obtained from other sources like local farmers (15%), PC & agriculture department (8%)
along 8% of member farmers who did not provide any source (Table 6.64).
Table 6.64: Distribution of Dhan/ KTL PC members by Source of Seeds
PC> Illupur Kotampatti Thootukudi
Parameter>
Source
No. of
farmers
% of all No. of
farmers
% of all No. of
farmers
% of all
Dealers 2 18.18 5 38.46 1 9.09
Local Farmers 0 0 2 15.38 0 0
PC 4 36.36 1 7.69 6 54.55
Other FGs 1 9.09 0 0 0 0
Agri Dept 0 0 1 7.69 1 9.09
Dealers, PC 3 27.27 1 7.69 2 18.18
Dealers, Local
Farmers 1 9.09 1 7.69 0 0
Dealers, PACS 0 0 0 0 1 9.09
PC, Agri Dept 0 0 1 7.69 0 0
None 0 0 1 7.69 0 0
Total 11 100 13 100 11 100
Most of the member farmers of Dhan/KTL promoted PC didn’t provide any source for both
chemical inputs viz. chemical fertilizers and chemical pesticides. 55%, 46% and 9% of Illupur,
Kotampatti and Thootukudi PC members respectively, didn’t provided any source for he
purchases of chemical fertilizers. While 82%, 77% and 18% of Illupur, Kotampatti and
Thootukudi PC members didn’t provide any source for the purchase of chemical pesticides. In
the specific case of chemical fertilizers, 54% Kotampatti PC members, 27% Thootukudi PC
members and 18% Illupur PC members purchased from dealers. 9% of Thootukudi PC
members purchased from each PC & Agriculture department and dealers & PC. PC was an
important source for Illupur and Thootukudi PC members from where 27% and 45 % of
members farmers respectively, were reported to be purchasing chemical fertilizers. In case of
chemical pesticides, dealer was the source of purchase for 23% Kotampatti PC members, 18
% Illupur and Thootukudi PC members. PC (45%), PC & agriculture department (9%) and
dealers & PC (9%) were other major sources identified for Thootukudi PC members (Table
6.65).

272
Table 6.65: Distribution of Dhan/ KTL PC members by Source of Chemical inputs
Type of
Agrochemical
Input>
Fertilizers Pesticides
PC> Illupur Kotampatti Thootukudi Illupur Kotampatti Thootukudi
Parameters> No. of
farmers
% of
all
No. of
farmers
% of
all
No. of
farmers
% of
all
No. of
farmers
% of
all
No. of
farmers
% of
all
No. of
farmers
% of
all Source
Dealers 2 18.1 7 53.8 3 27.2 2 18.1 3 23 2 18.1
PC, Agri dept 0 0 0 0 1 9.09 0 0 0 0 1 9.09
PC 3 27.2 0 0 5 45.4 0 0 0 0 5 45.4
Dealers, PC 0 0 0 0 1 9.09 0 0 0 0 1 9.09
None 6 54.5 6 46.1 1 9.09 9 81.8 10 76.9 2 18.1
Total 11 13 11 11 13 11
Most of the member farmers of Dhan/KTL promoted PCs didn’t use both the bio-inputs viz.
biofertilizers and biopesticides. Kotampatti PC has the largest number of non-users of
biofertilizers (92%) followed by Thootukudi PC (91%) and Illupur PC (64%). Local farmers
were the most important source of procurement of bio fertilizers for Illupur PC (18%) followed
Thootukudi PC (9%) and Kotampatti PC (8%). 18 % of the Illupur PC members were
purchasing from dealers with no member farmer of Kotampatti PC and Thootukudi PC were
reported to be purchasing from dealers. No member farmer of any PC was procuring
biofertilizers from PC. In case of biopesticide, the non-usage was highest in the case of
Thootukudi PC (100%) followed by Kotampatti PC (92%) and Illupur PC (55%). 45 % and 8
% of Illupur and Kotampatti PC members were reported to be purchasing from dealers. No
member from all PCs was reported to be purchasing biopesticides from dealers and local
farmers unlike biofertilizers where local farmers and dealers were a major source of
procurement (Table 6.66).
Table 6.66: Distribution of Dhan/ KTL members by Source of Bio inputs
Type of Bio
Input> bioertilizers biopesticides
PC> Illupur Kotampatti Thootukudi Illupur Kotampatti Thootukudi
Parameters> No. of
farmers
% of
all
No. of
farmers
% of
all
No. of
farmers
% of
all
No. of
farmers
% of
all
No. of
farmers
% of
all
No. of
farmers
% of
all Source
Dealers 2 18.1 0 0 0 0 0 0 0 0 0 0
Local farmers 2 18.1 1 7.69 1 9.09 0 0 0 0 0 0
PC 0 0 0 0 0 0 5 45.4 1 7.69 0 0
None 7 63.6 12 92.3 10 90.9 6 54.5 12 92.3 11 100
Total 11 100 13 100 11 100 11 100 13 100 11 100
The cropping intensity was reported to be lowest in the case of Thootukudi PC (1.00) succeeded
by Kotampatti PC (1.04) and Illupur PC (1.33).
Kharif was reported to be a major season in terms of number of crops sown. Both Thootukudi
and Illupur PC members reported to be growing black gram which was 6% of the kharif
acreage. Chilli was grown in 9% kharif area of Thootukudi PC members. Coconut was grown
in 5% and 12% kharif area of Illupur and Kotampatti PC members, respectively. Fodder was
grown in 5% of the kharif area of Illupur PC members occupying 3% of the total area. Gram
was reported to be a major crop grown by Kotampatti PC members with the coverage of 23%
kharif area and 22% of the total area. Similarly, green gram was a major crop for Thootukudi
PC members covering 10% of both the kharif area and total area. Groundnut was grown in 25%

273
of Kotampatti PC members kharif area covering 25% of the total area. In case of Illupur PC
members, the kharif coverage of groundnut was 7%. Similarly, mango also occupied 7% and
5% of the kharif and total area, respectively. 23% of the kharif and total area of Thootukudi
PC members area was under millet. Paddy was reported to be a major crop for Illupur and
Kotampatti PC members covering 47% and 36% of the kharif acreage. Sunflower was grown
in 12% of both the kharif and total area of Thootukudi PC members (Table 6.67).
Table 6.67: Kharif Cropping Pattern of Dhan/KTL members
PC> Illupur Kotampatti Thootukudi
Parameter
>
Crop
Far
mers
Crop
ped
area
Aver
age
crop
ped
area
%
Kh
arif
Are
a
%
To
tal
Ar
ea
Far
mers
Crop
ped
area
Aver
age
crop
ped
area
%
Kh
arif
Are
a
%
To
tal
Ar
ea
Far
mers
Crop
ped
area
Aver
age
crop
ped
area
%
Kh
arif
Are
a
%
To
tal
Ar
ea
Black
gram
3 2.5 0.83 5.6
8
4.2
4
0 0 0 0 0 3 6.5 2.17 5.8
8
5.8
8
Chilli 0 0 0 0 0 1 1 1.00 1.4
2
1.3
7
5 10 2.00 9.0
5
9.0
5
Coconut 1 2 2.00 4.5
5
3.3
9
5 8.3 1.66 11.
8
11.
4
0 0 0 0 0
Coriander 0 0 0 0 0 0 0 0 0 0 1 2 2.0 1.8 1.8
Cotton 1 0.5 0.50 1.1
4
0.8
5
1 1 1.00 1.4
2
1.3
7
0 0 0 0 0
Flat Gram 1 0.5 0.5 1.1
4
0.8
5
0 0 0 0 0 0 0 0 0 0
Fodder 1 2 2.0 4.5 3.4 0 0 0 0 0 0 0 0 0 0
Ginger 1 0.5 0.5 1.1
4
0.8 0 0 0 0 0 0 0 0 0 0
Gram 0 0 0 0 0 2 16.2 8.1 23.
0
22.
2
2 3.5 1.75 3.1
7
3.2
Green
Gram
0 0 0 0 0 0 0 0 0 0 5 11.5 2.30 10.
41
10.
4
Groundnu
t
4 3 0.75 6.8 5.0
8
5 17.9 3.5 25.
4
24.
5
0 0 0 0 0
Groundnu
t, Flat
gram
1 3 3.00 6.8 5.0
8
1 0.5 0.7 0.7 0 0 0 0 0
Lemon 1 1.5 1.5 3.4 2.5 0 0 0 0 0 0 0 0 0 0
Maize 0 0 0 0 0 0 0 0 0 0 7 28.5 4.07 25.
8
25.
7
Maize,
Black
Gram
0 0 0 0 0 0 0 0 0 0 1 4 4.0 3.6 3.6
Mango 2 3 1.5 6.8 5.0
8
0 0 0 0 0 0 0 0 0 0
Millet 1 1 1.0 2.2 1.7 0 0 0 0 0 9 25.5 2.83 23.
1
23.
1
Onion 0 0 0 0 0 1 1 1.0 0.9 0.9
Paddy 8 20.5 2.5 46.
5
34.
7
6 25.4 4.2 36.
1
34.
9
0 0 0 0 0
Red gram 1 2 2.0 4.5 3.4 0 0 0 0 0 1 2 2.0 1.8 1.8
Sunflowe
r, Chilli
0 0 0 0 0 0 0 0 0 0 1 3 3.0 2.7 2.7
Sunflowe
r
0 0 0 0 0 0 0 0 0 0 3 13 4.33 11.
7
11.
7
Teak 1 2 2.00 4.5
5
3.4
Total 44 74.
6
70.3 96.
6
110.
5

274
No member farmer of Thootukudi PC was reported to be cultivating any rabi crop. Black gram
and groundnut were reported to be major crops grown by Kotampatti PC members both
occupying 50% of the kharif area and one percent of the total area. Similarly, paddy wand ragi
were two major crops reported for Illupur PC members. The share of paddy was 47% of the
rabi area and 7% of the total area while in case of ragi it was 53% of the rabi area and 8% of
the total area (Table 6.68).
Table 6.68: Rabi Cropping Pattern of Dhan/KTL members
PC> Illupur Kotampatti Thootukudi
Parameter>
Crop
Far
mer
s
Cro
ppe
d
are
a
Av
g
cro
ppe
d
are
a
%
Rab
i
Are
a
%
Tot
al
Are
a
Far
mer
s
Cro
ppe
d
are
a
Av
g
cro
ppe
d
are
a
%
Rab
i
Are
a
%
Tot
al
Are
a
Far
mer
s
Cro
ppe
d
are
a
Av
g
cro
ppe
d
are
a
%
Rab
i
Are
a
%
Tot
al
Are
a
Black
Gram
0 0 0 0 0 2 1 0.5 50 1.4 0 0 0 0 0
Groundnut 0 0 0 0 0 1 1 1.0 50 1.4 0 0 0 0 0
Paddy 1 4 4.0 47.
1
6.7
8
0 0 0 0 0 0 0 0 0 0
Ragi 1 4.5 4.5 52.
9
7.6 0 0 0 0 0 0 0 0 0 0
Total 8.5 14.
4
2 2.7
5
0 0
None of the Thootukudi PC member was growing any crop in summer season. In case of
Kotampatti PC members, only cotton crop was grown covering 100% of the kharif area and
1% of the total area. Black gram and millets were two major crops grown in summer season
by Illupur PC members each occupying 46% and 5% of the summer area and total area. Brinjal
was another crop reported in case of Illupur PC members occupying 8% of the kharif area and
1% of the total area.
73% of Illupur PC members provided the correct name of the PC when asked. This was
followed by Thootukudi PC members (45%) and Illupur PC members (38%). 46% of the
Kotampatti PC members did not know the name of the PC being highest in the list followed by
Illupur PC members (27%) and Thootukudi PC members (18%). No member farmer of Illupur
PC gave the wrong name of PC. In case of Thootukudi PC and Kotampatti PC it was 36% and
15% (Table 6.69).
Table 6.69: Distribution of KTL/Dhan PC members by knowledge of PC Name
PC> Illupur Kotampatti Thootukudi
Parameter>
Knowledge of
Name
No. of
farmers
% of all No. of
farmers
% of all No. of
farmers
% of all
Correct Name 8 72.73 5 38.46 5 45.45
Don’t Know 3 27.27 6 46.15 2 18.18
Wrong Name 0 0 2 15.38 4 36.36
Total 11 100 13 100 11 100

275
36% of Illupur PC members along with 23% PC members and 18% PC members provided the
name of promoting agency when asked about the name of PC owner. Thootukudi PC (36%)
had the highest share among the number of farmers who provided PC employees name
followed by Kotampatti PC (23%) and Illupur PC (18%). 18% Illupur PC members provided
name of BOD while 23% Kotampatti PC members and 9% PC members provided the name of
farmers. 36% Thootukudi PC members followed by Illupur PC members (27%) and Kotampatti
PC members (23%) did not provided any name when asked about the name of PC owner. But,
paradoxically, the Illupur PC had no farmers reporting it belonged to them (Table 6.70).
Table 6.70: Distribution of KTL/Dhan members by knowledge of PC Owner
PC > Illupur Kotampatti Thootukudi
Parameter>
Owner
No. of
farmers
% of all No. of
farmers
% of all No. of
farmers
% of all
Farmers 0 0 3 23.08 1 9.09
BOD 2 18.18 0 0 0 0
Promoting Agency 4 36.36 3 23.08 2 18.18
PC Employees 2 18.18 3 23.08 4 36.36
Don’t Know 3 27.27 3 23.08 4 36.36
Private Company 0 0 1 7.69 0 0
Total 11 100 13 100 11 100
6.4.3 ESAF PCs
All the PCs had some women members unlike PCs in the north Indian states like Rajasthan
(Table 6.71). The average age of two PC members was 38 and 43 years but one had particularly
high average age i.e. 54 years in case of Kodai Hills which was into plantation crops.
Table 6.71: Distribution of ESAF PC members by Gender
PC> Periyakulam Kodai Hills Usilampatti
Parameter>
Gender
No. of
farmers % of all
No. of
farmers % of all
No. of
farmers % of all
Male 3 33.33 13 92.86 6 54.55
Female 6 66.67 1 7.14 5 45.45
Total 9 100 14 100 11 100
Male member farmers were the highest in the case of Kodai Hills PC member respondents
(93%) followed by Usilampatti PC members (55%) and Periyakulam PC members (33%). The
largest share of female member farmers was in the case of Periyakulam PC members (67%)
followed by Usilampatti PC members (45%) and Kodai Hills PC members (7%) (Table 6.71).
Large number of member farmers of ESAF promoted PCs had agriculture as the primary
occupation. In case of Kodai Hills PC members, all the member farmers were having
agriculture as the primary occupation followed by Usilampatti PC members (82%) and
Periyakulam PC members (44%). 44% of the Periyakulam PC members had animal husbandry
as the primary occupation while on member farmers of Kodai Hills PC and Usilampatti PC had
animal husbandry as the primary occupation. None of the Periyakulam and Kodai Hills PC

276
members had poultry as primary occupation while only 9% of Usilampatti PC members were
having poultry as primary occupation. 11% Periyakulam PC members and 9% Usilampatti PC
members were working as labour for their primary occupation. No member farmer of Kodai
Hills PC was reported to be working as labour as a part of its primary occupation (Table 6.72).
Table 6.72: Distribution of ESAF PC members by Primary Occupation
PC> Periyakulam Kodai Hills Usilampatti
Parameter>
Primary Occupation
No. of
farmers
% of all No. of
farmers
No. of
farmers
% of all No. of
farmers
Agriculture 4 44.44 14 100.00 9 81.82
Animal Husbandry 4 44.44 0 0 0 0
Poultry 0 0 0 0 1 9.09
Labour 1 11.11 0 0 1 9.09
Total 9 100 14 100 11 100
A very large proportion of the member farmers of two ESAF promoted PCs (36% and 44% did
not have any secondary occupation and the third one (Kodai Hills) had 93% of member farmers
who did not have any secondary occupation. Agriculture was the secondary occupation for
18% Usilampatti PC members and 11% Periyakulam PC members. Similarly, 36 % of
Usilampatti PC members had animal husbandry as secondary occupation followed by
Periyakulam PC members (22%). No member farmer of Kodai Hills PC had agriculture or
animal husbandry as secondary occupation as this a plantation crops PC. Many of the member
farmers of ESAF promoted PC were working as labour for their secondary occupation. The
share was highest in the case of Periyakulam PC members (22%) followed by Usilampatti PC
members (9%) and Kodai Hills PC members (7%) (Table 6.73).
Table 6.73: Distribution of ESAF PC members by Secondary Occupation
PC> Periyakulam Kodai Hills Usilampatti
Parameter>
Secondary
Occupation
No. of
farmers
% of
all
No. of
farmers
% of
all
No. of
farmers
% of
all
Agriculture 1 11.11 0 0 2 18.18
Animal husbandry 2 22.22 0 0 4 36.36
Labour 2 22.22 1 7.14 1 9.09
None 4 44.44 13 92.86 4 36.36
Total 9 100 14 100 11 100
The highest %age of illiterates was in the case of Periyakulam PC (44%) followed by
Usilampatti PC (9%) and Kodai Hills PC (7%). 14% of Kodai Hills PC members were educated
up to primary level with no member farmer reported for Periyakulam PC and Usilampatti PC.
Largest share of member farmers educated up to middle level was reported in the case of Kodai
Hills PC (43%) followed by Periyakulam PC (33%) and Usilampatti PC (9%). High graduates
were 21% and 27% in the case of Kodai Hills PC and Usilampatti PC, respectively. 36%
Usilampatti PC members and 11% Periyakulam PC members were educated up to higher
secondary. The member farmers who were undergraduate were reported for all the PCs ranging

277
from 18% in case of Usilampatti PC to 11% in Periyakulam PC and 7% in Kodai Hills PC
(7%). But, Kodai Hills PC has 7% member farmers who were graduate while no other PC had
graduate member farmers (Table 6.74).
Table 6.74: Distribution of ESAF PC members by Education
PC> Periyakulam Kodai Hills Usilampatti
Parameter>
Education
No. of
farmers
% of
all
No. of
farmers
% of
all
No. of
farmers
% of
all
Illiterate 4 44.44 1 7.14 1 9.09
Primary 0 0 2 14.29 0 0
Middle 3 33.33 6 42.86 1 9.09
High School 0 0 3 21.43 3 27.27
Higher
Secondary 1 11.11
0 0 4 36.36
Undergrad 1 11.11 1 7.14 2 18.18
Graduate 0 0 1 7.14 0 0
Total 9 100 14 100 11 100
Kodai Hills PC members (4.2 acres) had the largest owned landholding followed by
Usilampatti PC members (2.7 acres) and Periyakulam PC members (1.1 acres). The operational
land holding was also highest for Kodai Hills PC members (4.2 acres) followed by Usilampatti
PC members (2.6 acres) and Periyakulam PC members (0.9 acres) (Table 6.75).
Table 6.75: Average owned and operated land of ESAF PC members
PC>
Average Land (acres)
Periyakulam Kodai Hills Usilampatti
Owned 1.11 4.2 2.7
Operational 0.94 3.92 2.65
The share of marginal farmers was the largest in case of all the three PCs. The highest share
was there in the case of Periyakulam PC (78%) followed by Kodai Hills PC (43%) and
Usilampatti PC (55%). The small farmers were having a highest share for Usilampatti PC
(36%) followed by Kodai Hills PC members (29%) and Periyakulam PC members (22%)
having the share of 45%, 26% and 60% of the owned land holding. Semi-medium farmers were
highest in case of Kodai Hills PC (21%) followed by Usilampatti PC (9%). None of the
Periyakulam PC member was present in the category of semi-medium farmer. The land
ownership was 33% and 17% for Kodai Hills PC and Usilampatti PC, respectively. Also, none
of the member farmer of Periyakulam PC and Usilampatti PC had any medium farmers. Only
7% of Kodai Hills PC members were medium farmer which owns 25 % of the land (Table
6.76).

278
Table 6.76: Category-wise Distribution of ESAF members by Owned land
PC> Periyakulam Kodai Hills Usilampatti
Paramete
r> No. of
farme
rs
%
of
all
Land
(Acre
s)
%
of
all
No. of
farme
rs
%
of
all
Land
(Acre
s)
%
of
all
No. of
farme
rs
%
of
all
Land
(Acre
s)
%
of
all Category
Marginal 7 77.
8 4 40 6
42.
9 8.9
15.
1 6
54.
5 11.25
37.
8
Small 2 22.
2 6 60 4
28.
6 15.5
26.
3 4
36.
3 13.5
45.
4
Semi-M 0 0 0 0
3 21.
4 19.5
33.
1 1 9.1 5
16.
8
Medium 0 0 0 0
1 7.1 15 25.
4 0 0 0 0
Total 9 10
0 10
10
0 14
10
0 58.9
10
0 11
10
0 29.7
10
0
In the case of operated land holding, the categorial distribution of farmers was almost like the
owned land holding distribution. 90%, 50% and 55% of Periyakulam PC members, Kodai Hills
PC members and Usilampatti PC members were marginal farmers which owned 71%, 20% and
37% of the land holding. But the highest number of small farmers were reported in the case of
Usilampatti PC members (36%) followed by Kodai Hills PC members (29%) and Periyakulam
PC members (11%). The share of operational land holding was highest for Usilampatti PC
(46%) followed by Periyakulam PC (29%) and Kodai Hills PC (28%). Semi-medium farmers
had highest share in case of Kodai Hills PC (14%) followed by Usilampatti PC (9%) with a
share of 25% and 17% of the total land holding. No member farmer was in the category of
medium farmer for Periyakulam and Usilampatti PC while only 7% of Kodai Hills Pc members
were medium farmers which owned 27% of the operational land (Table 6.77).
Table 6.77: Category-wise Distribution of ESAF members by Operated land
PC> Periyakulam Kodai Hills Usilampatti
Paramet
er>
Categor
y
No.
of
farme
rs
%
of
all
Land
(Acre
s)
%
of
all
No.
of
farme
rs
%
of
all
Land
(Acre
s)
%
of
all
No.
of
farme
rs
%
of
all
Land
(Acre
s)
%
of
all
Marginal 8 88.8
9 6
70.5
9 7 50 10.9
19.8
5 6
54.5
5 10.75
36.7
5
Small 1 11.1
1 2.5
29.4
1 4
28.5
7 15.5
28.2
3 4
36.3
6 13.5
46.1
5
Semi-M 0 0 0 0
2 14.2
9 13.5
24.5
9 1 9.09 5
17.0
9
Medium 0 0 0 0
1 7.14 15 27.3
2 0 0 0 0
Total 9 100 8.5 100 14 100 54.9 100 11 100 29.25 100
90% of Periyakulam PC members owned cows which were 40% of the animal owned by
Periyakulam PC members. While 82% of Usilampatti PC members owned cows, which was
58% of animals owned by Usilampatti PC members. No member farmer of Kodai Hills PC
owned cows. The average number of cows owned was higher for Usilampatti PC members (4)

279
than Periyakulam Pc members (3). 45% of Usilampatti PC members owned goats which had
the highest share amongst all the PC followed by Periyakulam PC members (11%) and Kodai
Hills PC members (7%) which was 42%, 2% and 100% respectively, of the total animal
population. Cow (shared) was owned by 11% of Periyakulam PC members which was 58% of
the total animal population owned by Periyakulam PC members (Table 6.78).
Table 6.78: Distribution of ESAF members livestock owned
PC Periyakulam Kodai Hills Usilampatti
Para
meter
>
Type
of
livest
ock
No.
of
far
mer
s
%
of
all
Ani
mal
s
(No.
)
%
of
all
Ave
rage
No.
of
far
mer
s
%
of
al
l
Ani
mal
s
(No.
)
%
o
f
al
l
Ave
rage
No.
of
far
mer
s
%
of
all
Ani
mal
s
(No.
)
%
of
all
Ave
rage
Cow 8 88
.8
9
24 40
.0
0
3 0 0 0 0 0 9 81
.8
2
32 58
.1
8
3.56
Cow
(share
d)
1 11
.1
1
35 58
.3
3
35 0 0 0 0 0 0 0 0 0 0
Goat 1 11
.1
1
1 1.
67
1 1 7.
1
4
6 1
0
0
6 5 45
.4
5
23 41
.8
2
4.6
Total 9 10
0
60 14 1
0
0
6 11 10
0
55
Friends/ Neighbours/ Relatives was the most important source of general information which
provided information to 86% Kodai Hills PC members followed by Periyakulam PC members
(78%) and Usilampatti PC members (73%). PC, Friends/ Neighbours/ Relatives, Newspapers/
Radio, Pc, ADO and Friends/ Neighbours/ Relatives, PC, ADO each was the source of
information for 9% of Usilampatti PC members. Coffee board was reported to be the source of
information for 7% Kodai Hills PC members (Table 6.79).
Table 6.79: Distribution of ESAF members by source of general agricultural knowledge
PC> Periyakulam Kodai Hills Usilampatti
Parameter>
Source of info
No. of
farmers
% of all No. of
farmers
% of all No. of
farmers
% of all
Friends/ Neighbours/
Relatives
7 77.78 12 85.71 8 72.73
PC 0 0 0 0 1 9.09
Friends/ Neighbours/
Relatives, PC
2 22.22 1 7.14
Friends/ Neighbours/
Relatives, Newspapers/
Radio, Pc, ADO
0 0 0 0 1 9.09
Friends/ Neighbours/
Relatives, PC, ADO 0 0 0 0 1 9.09
Coffee Board 0 0 1 7.14
Total 9 100 14 100 11 100

280
Dealers were the major source of seeds for ESAF promoted PCs. 72% of Usilampatti PC
members, 33% of Periyakulam PC members and 7% of Kodai Hills PC members were
purchasing from dealers. Local farmers had the largest share for Kodai Hills PC (14%)
followed by Periyakulam PC (11%) and Usilampatti PC (9%). Kodai Hills Pc had many sources
for the supply of seeds. PACS/DCS, Agri dept, dealers & agri dept were source for 14%, 7%
and 7% Kodai Hills PC members, respectively (Table 6.80).
Table 6.80: Distribution of ESAF members by Source of Seeds
PC> Periyakulam Kodai Hills Usilampatti
Parameter>
Source
No. of
farmers
% of
all
No. of
farmers
No. of
farmers
% of
all
No. of
farmers
Dealers 3 33.33 1 7.14 8 72.73
Local Farmers 1 11.11 2 14.29 1 9.09
PACS/ DCS 0 0 2 14.29 0 0
PC 0 0 0 0 1 9.09
Agri Dept 0 0 1 7.14 1 9.09
Dealers, Agri Dept 0 0 2 14.29 0 0
Local Farmers, PC 0 0 1 7.14 0 0
Local Farmers,
Agri Dept 0 0 1 7.14 0 0
None (Home
based) 5 55.56 4 28.57 0 0
Total 9 100 14 100 11 100
82% of Usilampatti PC members were reported to be purchasing from dealers followed by
Periyakulam PC (33%) and Kodai Hills PC (29%). PACS was the source of chemical fertilizers
for 7% Kodai Hills PC members and 9% Usilampatti PC members. 29% and 7% of Kodai Hills
PC members were purchasing chemical fertilizers from PC and agriculture department,
respectively. No other member farmers of any other PC was purchasing from PC and
agriculture department. 67% Periyakulam PC members, 29% Kodai Hills PC members and 9%
Usilampatti PC members were not purchasing chemical fertilizer. In case of chemical
pesticides, 78% Periyakulam PC members, 57% Kodai Hills PC members and 18% Usilampatti
PC members were reported to be not purchasing chemical pesticides. Dealers was the major
source of chemical pesticides for member farmers of PCs promoted by ESAF. 65% Usilampatti
PC members, 36% Kodai Hills PC members and 22% Periyakulam PC members purchased
form dealers. 18% of Usilampatti PC members and 7 % of Kodai Hills PC members purchased
from PC and agriculture department, respectively. No member farmer of all the three PCs were
purchasing from PACS (Table 6.81).

281
Table 6.81: Distribution of ESAF members by Source of Chemical inputs
Type of
agrochemi
cal >
Fertilizer Pesticide
Parameter
>
Source
Periyakulam Kodai Hills Usilampatti Periyakulam Kodai Hills Usilampatti
No.
of
farm
ers
% of
all
No.
of
farm
ers
No.
of
farm
ers
% of
all
No.
of
farm
ers
No.
of
farm
ers
% of
all
No.
of
farm
ers
No.
of
farm
ers
% of
all
No.
of
farm
ers
Dealers 3 33.3
3
4 28.5
7
9 81.8
2
2 22.2
2
5 35.7
1
7 63.6
4
PACS 0 0 1 7.14 1 9.09 0 0 0 0 0 0
PC 0 0 4 28.5
7
0 0 0 0 0 0 2 18.1
8
Agri Dept 0 0 1 7.14 0 0 0 0 1 7.14 0 0
None 6 66.6
7
4 28.5
7
1 9.09 7 77.7
8
8 57.1
4
2 18.1
8
Total 9 100 14 100 11 100 9 100 14 100 11 100
Majority of the member farmers of ESAF promoted PCs did not purchase any bio-inputs. 89%
Periyakulam PC members, 86% Kodai Hills PC members and 64% Usilampatti PC members
did not purchase any bio fertilizers while 93% of Kodai Hills PC members and all the members
of Periyakulam PC members and Usilampatti PC members didn’t purchased any biopesticides.
In case of bio fertilizers, 11% Periyakulam PC members purchased from dealers, 14% Kodai
Hills PC members purchased from purchased from local farmers and 36% Usilampatti
members purchased from PC. But in case of biopesticides, only 7% of the member farmers of
Kodai Hills PC were reported to have purchased from the local farmers (Table 6.82).
Table 6.82: Distribution of ESAF members by Source of Bio inputs
Type of bio
input>
biofFertilizer biopesticide
PC>
Parameter>
Source
Periyakulam Kodai Hills Usilampatti Periyakulam Kodai Hills Usilampatti
No.
of
farm
ers
% of
all No.
of
farm
ers
No.
of
farm
ers
% of
all No.
of
farm
ers
No.
of
farm
ers
% of
all No.
of
farm
ers
No.
of
farm
ers
% of
all No.
of
farm
ers
Dealers 1 11.1
1
0 0 0 0 0 0 0 0 0 0
Local
Farmers
0 0 2 14.2
9
0 0 0 0 1 7.14 0 0
PC 0 0 0 0 4 36.3
6
0 0 0 0 0 0
None 8 88.8
9
12 85.7
1
7 63.6
4
9 100 13 92.8
6
11 100.
00
Total 9 100 14 100 11 100 9 100 14 100 11 100

282
Large %age of member farmers of ESAF promoted PCs knew the correct name of PC. The
share was reported to be highest in case of Usilampatti PC (73%) followed by Periyakulam PC
(44%) and Kodai Hills (43%). But, 56%, 43% and 27% of Periyakulam PC members, Kodai
Hills PC members and Usilampatti PC members did not know have any knowledge of the name
of PC. But in the case of Kodai Hills PC members, 14% of member farmers provided the wrong
name of PC (Table 6.83).
Table 6.83: Distribution of ESAF PC members by Knowledge of PC Name
PC> Periyakulam Kodai Hills Usilampatti
Parameter>
PC Name
No. of
members
% of all No. of
members
% of all No. of
members
% of all
Don’t know 5 55.56 6 42.86 3 27.27
Wrong Name 0 0 2 14.29 0 0
Correct Name 4 44.44 6 42.86 8 72.73
Total 9 100 14 100 1 100
56% Periyakulam PC members, 36% Kodai Hills PC members and 9% Usilampatti PC
members did not have the knowledge of PC owner. The name of promoting agency was given
by many of the member farmers which was in the range of 21-36%. The name of board of
directors was given in only one case by 14% of Kodai Hills PC members. The name of the PC
employees was also provided on response to the name of PC which was in the range of 21-
27%. None of the member farmer provided the name of private company when asked about the
name of PC owner (Table 6.84).
Table 6.84: Distribution of ESAF PC members by Knowledge of PC Owner
PC> Periyakulam Kodai Hills Usilampatti
Parameter>
Knowledge of PC
Owner
No. of
members
% of all No. of
members
No. of
members
% of all No. of
members
BOD 0 0 2 14.29 0 0
Don’t Know 5 55.56 5 35.71 1 9.09
Farmers 1 11.11 1 7.14 3 27.27
PC Employees 0 0 3 21.43 3 27.27
Private Company 0 0 0 0 0 0
Promoting Agency 3 33.33 3 21.43 4 36.36
Total 9 100 14 100 11 100
6.5 Goat PC comparison Theni and Pandhana (12 and 10 members each respectively)
So far as Theni Goat PC was concerned, it was a stand alone PC, the only one promoted by the
NGO and was keen on leveraging the Theni goat breed for its meat.

283
A comparison of the PC member profile with the goat PC (both all women) showed that age
profile was similar (42 v/s 41 for MP goat PC) and Theni goat PC women were more literate
(58% high or higher secondary school and only 17% illiterate) than their MP goat PC
(Pandhana ) members of whom 70% were illiterate. Further, 92% of them reported goatery as
primary occupation compared with only 50% in case of MP goat PC who reported it as
secondary occupation in 40% cases (table 6.85 and 6.86).
The Theni goat PC relied on friends, and friends and pc, and Pc and mobile groups (50, 17 and
17% each) for information compared with only PC in case of 60% in case of MP Pc. The land
ownership and operational land profiles were similar with average owned and operated land
being 1.52 and 1.85 acres for Theni and 1.47 and 1.6 acres for MP PC. In fact, 67% of Theni
PC member were marginal with 29% land and rest 33% small with 71% of owned land. The
operated land was also mostly marginal and small and only 8% farmers had semi-medium
farms which had 33% of operated land with 37% and 29% being with marginal and small
operators respectively. As against this, though 60% of MP PC members were marginal owners
and rest 20 and 10% each being small and semi-medium but their operated lands were marginal
in 60 %cases and 30% and 10% being small and semi-medium with 12%, 56% and 31% of
operated land respectively (tables 6.87 and 6.88).
More importantly, the number of goats per households for Theni member was large at 20 goats
with 92% owning goats and goats being 87% of livestock owned by the households. (table
6.89). This was in sharp contrast to the MP goat PC where average ownership size was 10 goats
though 90% households owned them and they were 88% all livestock owned by such
households. In fact, the MP PC members also reported buying some inputs like bio fertilisers
through the PC.
The cropping intensity of members in both cases was similar at 1.69 in case of Theni and 1.8
in case of MP PC though cropping pattern differed. Maize and cotton were major crops in terms
of area in rabi and kharif and some millets in summer season in case of Theni, it was wheat in
rabi, soyabean in kharif in case of MP goat PC members.
The awareness of PC was lower among Theni PC members with 58% not knowing the name
of the PC (table 6.90) as they were perhaps more familiar with SHGs of women they were first
members of and only 25% thought PC was owned by farmers (table 6.91), another 25%
thinking PC employees owned it and yet another 17% thought it was owned by promoting
agency. This was in sharp contrast to the 90% members knowing the name of PC in MP and
80% knowing it is owned by farmer members. This despite the fact that the MP PC was younger
by many years compared with the Theni goat PC.
Table 6.85: Distribution of Goat PC members by Primary Occupation
PC> Pandhana Theni
Parameter>
Primary Occupation
No. of
members
% of all No. of
members
% of all
Agriculture 3 30 1 8.33
Goatery 5 50 11 91.67
Labour 2 20 0 0
Total 10 100 12 100

284
Table 6.86: Distribution of Goat PC members by Secondary Occupation
PC> Pandhana Theni
Parameter>
Secondary Occupation
No. of members % of all No. of members % of all
Agriculture 2 20 7 58.33
Goatery 4 40 1 8.33
Labour 2 20 1 8.33
Skilled Job 0 0 1 8.33
None 2 20 2 16.67
Total 10 100 12 100
Table 6.87: Category-wise distribution of Goat PC members by Owned land
PC> Pandhana Theni
Parameter> No. of
members
% of
all
Land
(Acres
)
% of
all
No. of
membe
rs
% of all Land
(Acres)
% of
all Owned
Land
Marginal 7 70 3.25 22.03 8 66.67 5.25 28.7
7
Small 2 20 6.5 44.07 4 33.33 13 71.2
3
Semi-
medium 1 10 5 33.9
0 0 0 0
Total 10 100 14.75 100 12 100 18.25
Table 6.88: Category-wise Distribution of Goat PC members by Operated land holding
PC> Pandhana Theni
Parameter> No. of
members
%
of
all
Land
(Acres)
% of
all
No. of
members
% of
all
Land
(Acres)
% of
all Operated
Land
Marginal 6 60 2 12.5 9 75 8.25 37.08
Small 3 30 9 56.25 2 16.67 6.5 29.21
Semi-
medium 1 10 5 31.25 1 8.33 7.5 33.71
Total 10 100 16 100 12 100 22.25 100

285
Table 6.89: Distribution of Goat PC members of livestock owned
PC> Pandhana Theni
Parameter>
Livestock
No.
of
mem
bers
% of
all
Ani
mals
(No.)
% of
all
Aver
age
No.
of
mem
bers
% of
all
Ani
mals
(No.)
% of
all
Aver
age
Cow 4 40 8 7.92 2 3 25.00 9 3.54 3.00
Goat 9 90 89 88.12 9.89 11 91.67 220 86.6
1
20.00
Oxen 2 20 4 3.96 2 0 0 0 0 0
Sheep 0 0 0 0 0 1 8.33 25 9.84 25.00
Total 101 254
Table 6.90: Distribution of Goat PC members by knowledge of PC Name
PC> Pandhana Theni
Parameter>
PC Name
No. of members % of all No. of members % of all
Correct Name 9 90 3 25.00
Don’t Know 1 10 7 58.33
Wrong Name 0 0 2 16.67
Total 10 100 12 100
Table 6.91: Distribution of Goat PC members by knowledge of PC Owner
PC> Pandhana
Theni
Parameter>
PC Owner
No. of members % of all No. of members % of all
Don’t Know 2 20 2 16.67
Farmers 8 80 3 25.00
PC Employees 0 0 3 25.00
Promoting Agency 0 0 2 16.67
BOD 0 0 2 16.67
Total 10 100 12 100
On the output side, whereas in case of Theni PC in Tamilnadu, the number of farmers selling
goats to PC increased from nil to 5 over last three years i.e. 40% farmers were selling through
the PC now (sold 112 goats in all) with some of them reporting selling maize and millet crops
also through the PC. In case of MP goat PC (Pandhana), it was 30% farmers who were selling
through the PC (total of 14 goats) and one of them also reported selling soyabean to the PC.

286
6.6 Summary
As the PC data show there were wide variations in performance of PCs in Tamilnadu across
PCs and within each promoter’s PCs. Some were vibrant (like SEEDS ones) and others
struggling (Dhan and KTL) while some others non-starters (one of the ESAF promoted). Of
the 105 members interviewed in Tamilnadu across 9 PCs, 46% were women farmers despite
not many PCs studied being Women PCs except one in goatery. This is quite different from
that found in other states PCs.
The average owned land of members was not too small with 5.12 acres and operated land being
6 acres per household. The members were mostly marginal, small and semi medium farmers
(90%) of the total owning 53% of land. However, in terms of operated land, they accounted for
only 82% of all farmers and 43% of the operated land. Though 48% had owned groundwater
resource for irrigation still other 50% were rainfed which was the highest across states.
Therefore, average cropping intensity of the members was only 1.16 but still crop diversity was
very high.
The SEEDS PC members were much larger than their other Dhan/KTL and ESAF PC member
counterparts. There was no small farmer among Seeds promoted PC members while ESAF
promoted and Dhan/KTL promoted PC each had 35% small member farmers having 16% and
36 % respectively, of the total owned area member farmers of these PC. But the cropping
intensity was the highest for ESAF PC members (1.48) followed by Dhan/KTL PC members
(1.09) and the lowest for Seeds PC members (1.08).
The members were more aware of PC name than the non-members (57% versus 24%). Further,
only 15% member farmers thought or knew the PC belonged to farmers with others mentioning
PC employees (24%) or promoting agency (22%) as the owners. There was no difference in
this across three promoters’ PCs. There was hardly any awareness of PC ownership among
non-members.
The input interface of PCs showed that among the members, dealers emerged as the major
source of seed purchase with 35% buying from there. Only 17% farmers bought it from the PC
with another 11% from both PC as well as dealers. The reliance on dealers was even higher in
case of chemical inputs at more than 60% with only 22-30% farmers buying it from the PC. In
fact, even PACs did not figure as a major source for even fertiliser purchase. The bio inputs
which were used by the very small percentage of farmers was bought more from the PC ranging
from 75% in case of bio pesticides and 31% in case of bio fertilisers. Only 8% non-members
bought seeds and chemical inputs from PCs.
The highest dependence on dealers for seeds was reported by Seeds PC members (54%)
followed by ESAF PC members (47%) and Dhan/KTL PC members (31%).
91% members has no dislike for any of the services of the PCs 60% had not received any
subsidy or information about it from PC while 16% had received subsidised inputs and 6%
various farm equipments like MIS or implements. 50% even reported receiving loans
from/through the PCs. 45% reported monthly meeting and 34% attended it every time. 83%
wanted to continue being members as it was beneficial. 77% also were keen to encourage
others to join the PC as members as it brought benefits. While 53% did not suggest any new
product or services, others suggested loans and input supply, procurement and market linkage
for farm produce, timely supply of inputs and more training of farmers and value addition to

287
farm produce. A few others also suggested expanding the membership of the PC and making
staff more accountable to members.
The only major expansion in crop area was groundnut due to the intervention of PC and yields
had improved in cotton and many other pulses, cereals, grams. Major price benefits were
realised in pulses, groundnut, cotton and maize. In terms of channels of sale 29% of the farmers
sold 39% of their produce through the PCs, mainly in the crops of black gram, coffee, cotton,
green gram and maize. Only two and three farmers each of the 91 reported selling black gram
and green gram to the PCs where it was none and only one each three years before respectively.
This was mainly a shift from wholesale channel to the PC channel in most cases. This was in
sharp contrast to the non-member impact where only in one crop green gram. there were some
sales by the non-members through the PCs.
In terms of area shift due to the intervention of PCs there was significant increase reported in
groundnut, black gram, and to some extent coffee.

288
Appendix 6.1
SEEDS NGO PCs
Seeds NGO has been in existence since 1995 and started PC intervention in 2014. It had
promoted 11 PCs so far in TN with a total turnover of Rs. 30 crore in 2018-19 covering eight
districts, 850 self-help groups, 10200 members and 16099 PC members. Of these shareholders,
61% were women and 78% small and marginal farmers. These members cultivate 45300 acres.
It has also engaged in crop insurance and cattle insurance for its members. The NGO is
supported by SFAC and NABARD and works with Samunnati Finance, Ananya Finance,
Avanthi Finance, FWWB, South Indian Bank and Indian Overseas Bank besides State Bank of
India and SVA Karma Finance on the financing side, and Safe Harvest Pvt. Ltd. on the output
side. The 12 PCs together had share capital of Rs. 1.75 crore and SFAC has provided matching
equity grant of Rs. 10 lakh each to six of them. Some of the PCs have been recognized by
NABARD and Access Foundation and Rabo Bank. The major focus crops of the PCs include:
pulses in one case, millets and coriander in two cases each, coconut and paddy in the case of
two other PCs each, and Banana, chilly and maize in case of one each. The NABARD support
was Rs. 9.06 lakh for three years and Rs. 40 lakh was from SFAC. The NGO (SEEDS) has
two wings: Seeds RI (resource institution of SFAC) and Seeds Agro. Both of them have 5 and
4 staff each whereas RI also works as POPI of NABNZRD besides doing watershed and Non-
Pesticide Management practices (growing crops without use of chemical pesticides)
promotion. The Seeds Agro focuses on coffee exports and rural distribution of various
products.
Its model of PC organization includes a CEO, administration manager, and procurement and
marketing officers under him and inventory controller and salespersons under each of them
besides the various committees to help them with business and day to day management of the
PC affairs. Altogether, the 11 PCs have 11 CEOs, ten procurement and marketing staff, seven
agronomists, ten administration staff and 30 credit officers. The 11 PCs focus on millets (2),
pulses (1), coriander (2), coconut (3), banana (1), paddy (2), chilli (1), and maize (1). The NGO
also has presence across eight other states in central, west and east India besides Tamil Nadu
as it is a partner of the BRLF for two years (2019-21) for the purpose of organizing farmers
around NPM. The number of shareholders across PCs range from minimum of 200 to as many
as 3600 in the case of the PC under case study (SEEDS Farmer PC). The share capital of the
PCs ranges from minimum of Rs.2 lakh to a high of Rs.36 lakh (case study PC). It has already
received matching equity grant for five PCs – three supported by NABARD and two by SFAC.
The various PCs have been receiving credit from Sammunati Finance since 2017-18 and some
credit also from Ananya Finance. Interestingly, most of the loans across various PCs during
2016-19 have gone for livestock (60%) and equally for farm investments and working capital
(15% each).
The Seeds Agro production services pvt. Ltd registered in 2013 mainly works with Tata Tea
Global Beverages (TTGB) for its CSR scheme – Gaon chalo which started in 2011 in Tamil
Nadu under which this PC implements in Virudhunager district. It had turnover of Rs. 25 crore.
Over the years, it has expanded to 13 districts and 1752 villages with 4260 outlets and 84 rural
distributors employing 94 rural youth. Its coffee business involves domestic sales Rs. 12.56
crore and exports of the order of Rs. 6.96 crore. It has an agreement with Thara coffee curing

289
works in Wayanad in Kerala, and Ara processing for its coffee for exports, besides other
suppliers like Thomas and Sons, TH Traders and Sunshine Enterprises.
The PCs have market linkages with Namboodiris in Kerala, Nilon in Pune, Phallada and
Natural Remedies, and Himalaya Drug Company in Bangalore and IMPCOPS, Chennai
besides Safe Harvest, Hyderabad. One of its PCs had brought crop insurance since 2016-17
and 2017-18 covering 2000 and 6000 farmers with 4000 and 15000 acres insured with the AIC
of India. It claims that its farmers have been able to receive Rs.500 -1000 per quintal have price
across crops than the local market price. It claims that the cattle population has doubled, and
goat population increased four times in the areas of intervention. It calculates the net worth of
Seeds PC at 1.06 crore which is third highest among PCs and Rs.0.47 crores in the case of
Vizuthugal which is one of the lowest among all PCs.
Each PC has an administrative manager and finance manager each and procurement,
processing, marketing, and credit officers under whom there are inventory controllers value
addition incharge and sale persons besides a community development officer who in turn work
with the procurement, agribusiness, marketing and finance committees of the PCs. The Seeds
has 11 CEOs across 12 PCs, 30 credit officers, 10 procumbent and marketing staff, 7
agronomists and 10 administrative staff. It has 7 PCs supported by SFAC and 4 by NABARD
across 9 districts. It started with 4 PCs supported by NABARD in 2015-16 and engaged in 7
more PCs supported by SFAC in 2016-17 and 2017-18. It has partnerships with Bharat Rural
Livelihoods Foundation (BLRF) for promoting NPM in 9 states targeting 1 lakh farmers during
2019-21. These states are mostly in central, western and eastern India besides Tamil Nadu.
The shareholders for the 11 PCs range from 480 (SFAC) to as many as 3594 (NABARD PC).
The share capital ranges from Rs. 4.8 lakh to as high as Rs. 35.94 lakh (Seeds PC/NABARD).
6 out of 11 PCs which are more than 3-year-old have ever received matching equity grant from
SFAC of Rs. 10 lakh each. 75% of its loan portfolio from 2016-19 was made up of Samunnathi
Finance loans and other 24% of Ananya Finance loans. It has been able to channelize credit to
53% its member farmers across PCs. For 8 of its PCs, it has been able to leverage various
Govt. schemes for value addition and processing. These schemes included mainly SPU,
MSDA, NFSM and NADP mainly for creating land, building and machinery assets. It has an
agri business centre at its main office which sells groceries to member farmers.
Some of the best practices followed by its PCs include direct procurement from farmers and
payment at farm gate, no involvement of intermediaries in the transactions, and supply of
quality inputs. It plans to set up 33 more PCs in 2019-20 for NABARD (23) and SFAC (10)
from the existing four and seven each respectively. The farmer coverage would go up from
16700 to 49700 and area covered from 66000 acres to two lakh acres and villages from 700 to
2800.
SEEDS FPC
Seeds FPCs was registered in 2014 with 476 members, 95% of whom are women and 25%
landless and others mostly marginal and small farmers with more than 40% being SC/ST
category. They are spread across 70 panchayats and 117 villages across its blocks of the district
of Virudhunagar and Madurai. The PC has authorised capital of Rs. 50 lakh and paid up capital
of Rs. 47.15 lakh (Table 6.1). It has 10 Board members and only 3 of them are women despite
most of the members being women, and three of the board members are from reserved

290
categories. The company has various inputs licences and FSSAI licence. It has taken 60
farmers on five training and exposure visits in zero budget chilli farming and millets value
addition training. The Board of directors were taken on two training programmes in
Kodaikanal on strategic business planning and PC management. The CEO attended five
training programmes across various training centres besides exposure to the business of Safe
Harvest pvt. Ltd. The company has three-year business plan covering pulses, chilli and millets
crops and their procurement, processing, grading, packing, trading, and marketing.
This PC with 10 Directors has a CEO who is assisted by administration and marketing manager
each and an agronomist. The PC has an MoU with Safe Harvest under which it procures various
commodities worth Rs.1.47 crore with the condition that these commodities will be supplied
with proper primary value addition and it paid 50% advance for the same.
Table 6.1: Profile and Performance of SEEDS PC
Year>
Parameters
2015-16 2016-17 2017-18 2018-19
Authorised capital (Rs. lakh) 40 40 40 50
Paid up capital (Rs. lakh) 35.94 (90%)
*
35.94(90%) 35.94(90%) 47.15
Turnover (Rs. lakh) 5.3 lacs 117.8 272.3 470.8
Profits (Rs. lakh) 0.23 4.11 (4.8) 8.17
Reserves and surplus (Rs. lakh) 14.47 22.64
Assets (Rs. lakh) 0.7 52.7
Share holders 189 1140 2799 3563 Note: *- share capital mobilised as %age of authorised capital
The PC originated from farmers clubs promoted by NABARD which numbered 11 with 20
farmers each and also Self-Help Groups (150) promoted under SRLM which initially started
with micro finance. The PC has 5439 members across 117 villages of three blocks of two
districts. It initially started with Rs. one lakh authorised capital which was later increased to
Rs.10 and Rs.50 lakh. 27 staff work with the PC and it is claimed that 75 % members know
that PC belongs to them. It has given away share certificates to 3698 members but has not yet
paid any dividend. The office of the PC is rented in from ASEFA NGO @ Rs. 25000 per year.
Most of its inputs business include sale of seeds, cattle feed and fertilizers where 70% of the
buyers are members and 20% of the members buy exclusively from the PC. Its major input
sales come from cattle feed supply to 56 farmers which accounts for more than 60% of the
turnover, the rest mainly coming from fertilizers sold to over 200 farmers. The sales of cattle
feed were throughout the year as were for home products and groceries, whereas the
procurement of various crops mostly happened from September to April.
It has a warehouse constructed with a loan from NABARD. It also runs 2 vegetable markets
which were originally set up and run by ASEFA NGO since 2015 on a weekly basis. It has
five retail shops. It has discouraged the growing of a medicinal plant in five villages as it was
harmful for soil and health and has moved these farmers to black gram and millets with high
yielding varieties. It has been selling more and more to SHPL ranging from Rs. 50 lakh in
2015-16 to Rs. 182 lakh in 2017-18 and Rs. 311 lakh in 2019-20. It claims that 60% of the
farmers follow NPM practices.

291
It has also undertaken organic produce contract farming for PHALADA Agro in the past and
has supplied to hotels in Madurai directly. It claims that 80% of its inputs buyers are members
and 75% output comes from the members. Its major loan portfolio also consists of loan for
livestock including goats to 2555 members (50% of the total) accounting for 65% amount
disbursed.
It claims it has been able to give Rs. 400 per quintal higher price than the market in barnyard
millets, Rs. 300 per quintal in black gram and green gram, Rs. 400 per quintal in coriander, Rs.
500 per quintal in chilly, and Rs. 200 per quintal in maize and Rs. 600 per quintal in red gram.
For the year 2018-19, its procurement was mainly made up of black gram, green gram, and
chillies. The total procurement was Rs.2.68 crore.
It has trained its board members twice. It feels that value addition to farm produce and selling
in rural markets besides promotion of NPM practices are best practices which should be taken
up by other PCs. It plans to scale up, do more value addition besides producing ready to eat
foods. It has trained 250 farmers in livestock management with the help of KVKs, 185 farmers
in millet value addition with the help of TNAU, 305 in kitchen gardening with the help TNAU,
250 in crop, animal, and life insurance and 135 in vermicompost and bee keeping.
The business plan of the PC for 2019-20 included credit needs of Rs. 20 crore for new
shareholders, fertilizer sale of Rs. 25 lakh, procurement of various crops of the order of Rs.
1023 crore and home products of Rs. 1 crore besides cattle feed sales and grocery sales of Rs.
40 lakh each.
Vizhuthugal agri farmer PC
The PC registered in 2015 across 62 villages and 31 panchayats had a membership of 1394 in
2018-19 and shareholding of 1537 in 2019-20 out of whom 45% were women and most of the
farmers were marginal and small farmers and 13% even landless. The PC had 25 FIGs and 10
JLGs. The PC has authorised capital of Rs.20 lakh and share capital of Rs.15.37 lakh (Table
6.2). It has also received equity grant from SFAC for Rs.10 lakh. The PC has made loans of
Rs.2.3 crore to 462 farmers and goat loans of the order of Rs.1.3 crore to 263 farmers besides
cattle and agri allied loans to another 122 and 77 farmers respectively, totalling Rs.4.36 crores
across 920 farmers. company served more than 900 farmers for agri business transactions and
700 farmers for credit.
95% of the members are active, 65% of the business in agri inputs came from members and
40% members bought exclusively from PC. It had a warehouse and a processing facility besides
running a retail outlet. It had only sold to private and corporate in wholesale. Of the 7 Board
members, one is a woman and four also promoting members.
Photo 6.1: TNSCM provided office, warehouse and cold room at Vizhuthugal AFPC

292
The PC supplied mostly fertilizers and transacted in the procurement of chillies, coriander and
black and green gram. The major crops dealt by the PC included pulses maize, and chillies.
98% of its turnover came from output transactions. The value addition was also mostly in these
commodities.
Photo 6.2: A spice processing facility and a retail outlet of Vizhuthugal AFPC
The PC has besides the CEO an administration and finance manager each and a procurement
and marketing officer at the next level who are helped by various committees like purchase and
marketing committee. The finance portfolio is managed by a credit manager with the help of
CDOs and finance committee. It had provided training to Board directors of two days each
locally and to the CEO at BIRD Mangalore for three days.
It has been allotted a primary processing centre (PPC) from the Govt. of Tamilnadu under TN
Supply Chain Management project. Its business model revolves around scaling up and value
addition besides diversification into new products.It still faces problems of getting adequate
markets for farmers produce and the dryland conditions and lower MSP on the external front
as the major challenges.
Photo 6.3: Dry chillies at the local APMC market yard
As a future strategy, it plans to remain focussed on NPM and engage in edible oil and various
spices. The PCs also tries to rope in large farmers as they are the opinion leaders whom small
farmers imitate. The BoD is of the view that more export thrust is needed, and high value
enterprises like poultry and goatery should be added to the PC business for the benefit of

293
women farmers. They were also concerned that many of the govt. scheme benefits go mostly
to large farmers, therefore, PC should focus on small farmers. The PC has been allotted an
office in the APMC complex under the Tamilnadu supply chain management (SCM) project
which also includes a primary processing centre. The market which is 20 years old cotton and
chilli market has 3000 square feet unit leased out for 3 years extendable by 2 years. The PC
has total staff of 11 people including a CEO, two marketing managers and one credit and
administration manager each. 60% of the processing capacity is used for member produce.
The processing facility also carries out job work for the members on payment basis in oil,
spices and flour.
Table 6.2: Profile and performance of VAFPC
Year>
Parameters
2015-16 2016-17 2017-18 2018-19
Authorised capital (Rs. Lakh) 20 20 20 20
Paid up capital (Rs. Lakh) 13.94 (70%)
*
7.7
(38.5%)
10(50%) 15.37(77%)
Turnover (Rs. Lakh) 0 44 6.41
Profits (Rs.) 0 932 1637 Note: *- share capital mobilised as %age of authorised capital
Dhan/KTL PCs
Thoothukudi pulses PC
KTL has promoted 30 PCs supported by NABARD SFAC and Tamil Nadu SFAC in Tamil
Nadu. This PC, promoted by KTL – a for-profit arm of the Dhan Foundation which has
promoted five SFAC and seven Tamilnadu SFAC supported PCs in the state, was registered in
2015. It is all women member PC with 52 farmer interest groups (FIGs) across 22 villages of
two blocks of the district. It has 1000 members who are either owner cultivators or tenant
farmers. 3% of the members are landless and 50% members are active. The PC has wrongly
categorised its farmer members into marginal and small categories besides large where it
mistakenly categorizes marginal as small and small as marginal as against the official
categorization of farmers in India. The authorised capital of the PC is Rs. 25 lakh and paid up
capital Rs. 20 lakh (Table 6.3). Besides, it has received a matching equity grant of Rs. 10 lakh
from the SFAC. It has all the input sale licences and the APMC licence. Any farmer has to
have support of 100 farmers to become the members of the BoD. it has a manager, one
accountant, one procurements unit manager, and two Local Resource Persons (LRPs), besides
the CEO. It has a warehouse in the regulated market yard and one processing unit besides its
own brand – Kharisal Bhoomi. The office complex also has a retail outlet. It has five members
of the Board of Directors of whom only one is women and there is an advisory committee of
15 persons.
Various inputs are bought mostly by non-members upto the extent of 70% while only 300
members buy exclusively from the PC. On the output side, its buys various crop produce like
pearl millet, jowar, minor millets, spices like chilli, and coriander besides maize from a few
members each worth Rs. 20 lakh per year. The farmers sell to it because of the field pick up
and cash payment. It has earlier procured various pulses from 470 farmers at MSP for NAFED
for which it received 1% commission. 60% of its turnover it made up of inputs and the rest

294
from output handling. It has paid with bonus of Rs. 300 per share last year for three years.
It has also received a grant of Rs. 60 lakh for seed processing plant from the state (TN) SFAC.
It has a cash credit limit of Rs. 60 lakh from Canara Bank. The BoDs have been trained for
three days in 2015-16 at the Tata Dhan Academy by Dhan Foundation. They were also taken
to an exposure visit at Mulkanoor Cooperative in Andhra Pradesh. The CEO and other
professionals of the PC were also given three days training by the Dhan Foundation. The
present CEO is a former employee of Dhan Foundation and he has no professional business
training. The PC considers contract seed production by 20 farmers for NSC and bio-input
business as the best practices. It believes that the best way to help farmers is to intervene in the
open market for better realization of price for the benefit of the farmers. It has faced problems
with governance wherein three members of BoD were removed as they defaulted on payments.
On the external front, it feels lack of government support for bio-inputs and competition as
major challenges.
Table 6.3: Profile and performance of Thoothukudi pulses PC
Year >
Parameters
2015-16 2016-17 2017-18 2018-19
Authorised capital (Rs. lakh) 10 10 25 25
Share capital (Rs. lakh) 10 (100%)
*
10(100%) 20 (80%)
(Rs. 25000 by
KTL)
20(80%)
Turnover (Rs. lakh) 49.5 71.9 99.51 95.98
Profit (Rs.) 9772 48320 67999 48391
Reserves and Surplus (Rs.
lakh)
0.09772 0.58092 1.14 1.52
Assets (Rs. Lakh) 0.59 0.47 0.20 4.67 Note: *- share capital mobilised as %age of authorised capital
Box: Safe harvest private Limited
Safe Harvest Private Ltd. (SHPL), founded in 2009 as a SE, was conceptualised by a group of
eight grassroots NGOs with the twin objectives of strengthening the NPM (Non Pesticide
Management of Agriculture) movement by enabling farmers shift to sustainable agriculture by
creating a market for their ‘pesticide-free’ produce, and offering consumers a safe and
affordable alternative to food produced through conventional farming. SHPL aims to provide
remunerative market for one lakh small and marginal farmers by reaching out to one million
consumers by 2023.
After facing challenges both in procurement and sales in its initial years, it is now in its turn-
around phase, with sales improving from just Rs 0.25 crores to nearly Rs 18 crores since
inception. SHPL partners with about 25 producer organisations comprising of farmers’
collectives with a membership base of about one lakh farmers spread over 13 states, to procure
50 commodities in the 5 categories of cereals, millets, pulses, spices, and flavourings worth
more than Rs 25 crore (2018-19).
The 8 founding partners of the NPM movement were:

295
1) Samaj Pragati Sahayog (SPS), Madhya Pradesh
2) Chirag, Uttarakhand
3) Watershed Support Service and Activities Network (WASSAN), Andhra Pradesh
4) Samarthak Samiti, Rajasthan
5) Chetna Organic, Hyderabad
6) The Covenant Centre for Development (CCD), Tamilnadu
7) Samuha, Karnataka
8) Satvik, Gujarat
The partners formed the NPM Network to promote pesticide-free sustainable agriculture at
grassroots. Ford Foundation, a USA based international philanthropic organisation evinced
interest in supporting NPM. The grant funding from Ford Foundation was extremely critical
to the NPM movement as it catalysed the NPM Network’s partner organizations’ efforts to help
farmers switch to practicing pesticide-free sustainable agriculture.
To retail the ‘pesticide-free’ produce in consumer markets, V.K. Madhavan, Ganesan
Balachander, Muthuvelayutham Nagamalai, Shailesh Vyas, and Rajesh Sahadevan each
pooled Rs 20,000 and registered Safe Harvest Private Limited as a for-profit company in 2009.
Ganesan Balachander, former head of Ford Foundation, India played a unique role in SHPL
first as an investor and later as a chairman of the company’s Board. V.K.Madhavan, who
headed Chirag-one of the founding partners of the NPM movement- steered SHPL in its
formative years.
The Vision of SHPL is to: To boost the NPM movement at grassroots and accelerate farmers’
switch to sustainable agriculture by creating a market for their ‘pesticide-free’ produce; and
to offer urban consumers a safe, credible and affordable alternative to food produced through
conventional, input intensive agriculture.
Almost all partner Farmer Producer Companies (FPCs) of Safe Harvest were accessing
organized markets for the very first time. Some of the FPCs promoted by founding NGOs (e.g.
SPS, Samuha, Chetna Organic) had the ability to procure commodities at scale, but were not
conversant with the workings of organized retail. It was therefore natural for each FPC to
defend its own farmers’ quality of goods and demand higher prices. This put SHPL at a
disadvantage in the highly competitive consumer markets.
Rangu Rao joined as CEO in 2013 when SHPL was on the verge of closure. It was during this
time that the board was also restructured. The shareholders of SHPL include: one individual
with 52.46%, another pvt, ltd. entity with 36.73%, two individuals with 4.89% and 2.29% and
FPCs with 3.63% share as of March 2018.
SHPL has been able to make a mark on platforms of emerging E-commerce players such as
Grofers, Big Basket and Flipkart. Likewise, SHPL has been able to negotiate better terms of
trade with Modern Trade partners and also been able to intensify its presence in existing and
new General Trade outlets across geographies. Earlier confined to southern Indian urban
markets SHPL expanded its operations to NCR (Delhi). In 2016, SHPL also entered into a
‘co-branding’ agreement with Metro Cash and Carry, an international retail giant and has
successfully established a niche pesticide-free category in their stores.
With a monthly sales turnover of over Rs. 2 crore and with a retail presence in Bengaluru,
Hyderabad, Chennai and NCR, Safe Harvest today is a recognized brand in the safe food
category.

296
SHPL also trains and provides handholding support to partner FPCs in the following areas:
a) Best practices to be followed during aggregation b) Weighing practices and commodity
specific quality parameters c) Safe storage practices d) Grading, cleaning and processing of
aggregated commodities to achieve market standards and e) Value addition.
With an improved working capital base and with assistance from Safe Harvest, many of these
FPCs have been able to move up the agricultural value chain and take up post-harvest
activities resulting in higher returns for farmers and enhance the efficiency of SHPL’s supply
chains.
Recognizing that farmer organisations can learn from each other and also contribute to the
larger policy environment SHPL revived and expanded the NPM Network. The Network as of
today comprises 35 farmer organizations, agricultural research institutions and policy makers
committed to further the agenda of NPM in Indian agriculture.
Ananya finance was the first direct lender to the company and debt from them allowed the
company to make timely procurement from FPCs. Ananya moved many steps forward when it
decided in partnership with Safe harvest to advance credit to partner organisations so that
procurement could take place on behalf of Safe harvest by the FPCs. Tripartite agreements are
signed between Ananya, FPC partner and Safe harvest which allows FPCs to transfer custody
of aggregated agri commodities to safe harvest with the promise that safe harvest will pick up
the cost of finance. Such agreements based primarily on trust has no precedents. 2016-17
onwards SHPL has built similar partnerships with Nabkisan and Avanti Finance which have
helped the company to not only scale up its operations in terms of volumes and its reach, but
it also helped in bringing down its cost of finance.
SHPL procures more than 50 pesticide-free commodities from about 25 partner organisations
spread across 13 states. Since different commodities are grown in different states and the same
commodity is harvested during different times of the year, procuring from different geographies
reduces the inventory and assures the quality of the produce.
SHPL sources its products in three different ways:
1. From founding partners and organisations who have been working on NPM for long.
These organizations today are relatively well versed in procurement, storage and
transportation of aggregated commodities. Farmers associated with these
organizations also only require refresher trainings to continue practicing NPM.
2. From organisations located in regions where farmers, by default, practice pesticide
free agriculture. In many cases, these partners are not experienced in aggregation and
procurement. SHPL therefore builds the capacities of these organizations by providing
technical, financial and managerial support before procuring from them.
3. From organisations who share the same belief in NPM’s potential to positively impact
farmers and the environment. SHPL trains the farmers associated with these
organizations on NPM practices and accelerates their switch to pesticide-free
sustainable agriculture. SHPL procures from these farmers once they have become
conversant with practices and protocols of NPM.
SHPL procures in all 3 cropping seasons with Kharif being the most important. The
aggregation season starts in October and peaks during December and January when paddy is
procured. In 2018-19, it procured worth Rs. 25,86 crore. And its sales were of the order of Rs.
17.89 crore.

297
Every batch of products Safe Harvest procures from its partner FPCs is tested in FSSAI (Food
Safety and Standards Authority of India) accredited laboratories for the pesticide
compounds listed in the Food Safety and Standards (Contaminants, Toxins and Residues)
Regulations, 2011.
Safe Harvest is the only organization in the Indian safe food segment today to make the
Maximum Residue Limit (MRLs) test reports publicly available for all its products. By testing
the end product, Safe Harvest ensures the pesticide-free nature of the agro commodities and
effectively addresses the growing trust deficit in the safe food space.
1) Pricing & Procurement
Safe Harvest draws up a Memorandum of Understanding with its partner FPCs in which
the detailed terms and conditions regarding quantity, quality, price, timing etc. are
specified. After representative samples (drawn randomly) of the commodity have tested
negatively for pesticide residues, prices are pegged to the prevailing rates in the nearest
APMC (Agricultural Produce Market Committee) market (mandi) in partner locations.
Safe Harvest offers these prices to farmers (who, due to the remoteness of their location,
are often at a considerable disadvantage) at the farm gate and eliminates the risks/costs
associated with transporting the material to the Mandis. The weighing mechanisms
followed by Safe Harvest are fool proof, transparent and open to scrutiny. Safe Harvest
also provides for the storage bags during procurement. Furthermore, the promise of season
on season, year on year procurement gives farmers sufficient time to make suitable sowing
and land use plans.
2) Payment - Enabling partners access timely working capital
Many FPCs face the problem of inadequate working capital. A lack of sufficient capital
makes procurement during the peak season very difficult. These cash strapped FPCs often
have to compete with exploitative traders whose ability to pay the farmer quickly gives
them a considerable edge. Since most of Safe Harvest’s partner FPCs work with small and
marginal farmers, their equity base is small, even with schemes like matching equity from
the government being available. Recognizing this critical problem, SHPL often extends the
transaction amount as advance to the partners or pays them within a maximum of 2-3 weeks
of the delivery of goods.
It had majority of independently owned stores (230; 60%) and 75% modern trade stores in
Bengaluru, 90 independent stores (23%) in Chennai, 63(15%) such stores and 18% modern
stores in in Hyderabad and 4 online stores each in Bengaluru, Chennai and Hyderabad
each.
Modern Trade ‘brick and mortar’ retail partners of SHPL include Spencer’s, SPAR and Aditya
Birla Retail (with whom a recent deal was cemented to place SHPL’s products in 56 ‘More’
supermarkets across Bengaluru). Online retail partners of SHPL include Big Basket, Grofers,
Flipkart and Amazon. Safe Harvest has also negotiated a co-branding deal with Metro Cash
and Carry (an international retail giant) to introduce the pesticide-free range of products
under their own brand label ‘Fine Life Bio’. This is a significant achievement and an important
step towards the creation of a nation-wide ‘pesticide-free’ food category. A similar agreement
with Grofers, a nationally recognised e-commerce market platform is under the works.
The share capital increased from Rs 1 lakh in 2009-10 to about Rs 12.90 crore in Jan 2019,
while the long-term debt has increased from Rs 25 lakhs in 2012-13 to more than Rs 2 crore
in Jan 2019. Net losses are Rs. 3.18 core in 2018-19.

298
The various advantages that accrue to the farmer due to their partnership with SHPL are as
follows:
1. A premium for their ‘pesticide-free’ produce
2. Savings on commission (~3%) that would have otherwise been charged by agents in the
AMPC market
3. Saving in cost of transportation of produce to APMC markets
4. Savings in loading and unloading and those arising from following fair weighing practices
5. Prompt payment (7-15 days) (adapted from Anil, 2019).
Illupur PC
This PC registered in 2015 and promoted by KTL had its origins in 50 agricultural producer
groups (APGs) involving 750 male and 250 female members. At present, there are 71 groups,
including 20 all-women groups, with a membership of 1000 farmers across 7 villages of one
block of the Pudukkottai district All the members farmers have land holdings and most of them
(95%) are marginal or small farmers. In general, 40% of the income of a farmer in the local
area comes from labour and 30% each from paddy and animal husbandry. In this region,
farmers earn equally from crop cultivation, allied activities and wage labour.
Of the total members, 650 (65%) actively transact with the PC. PC has authorised as well as
paid up capital of Rs. 10 lakh besides reserves of Rs. 1.16 crore (Table 6.4). The PC has seeds
selling licences and farm produce handling licences and facilitates credit for agricultural and
livestock activity.
Photo 6.4: A drying yard, warehouse and grading and processing machines at Illupur PC
In 2019, the PC had 5 board members. The eligibility conditions for becoming a member of
BoD include: represent a group, attend the most of the group meetings, have formal transaction
with the PC (minimum Rs. 50000 per year) and no default on loan, besides having various ID
proofs. The PC has 9 regular and 19 part time staff. Among the regular, there are 3 enterprise
managers and one accountant.
The PC sells seeds only to very few members but on the output side, which is 100% organic it
deals with more than 100 members who are given a premium price. It claims that 100%
members are aware that they own the company. It had procured pulses for NAFED in 2019
worth Rs. 2.5 lakh. It sells paddy and pulses to wholesale traders. It turnover includes 40%
from paddy, 35% from milk, 15% from pulses and 10% from country chicken. 350 farmers
supply 1000 litres of milk 80% of which is sold in retail. The chicken supplies come from 50
farmers. The PC has a chicken hatchery and poultry farm on its campus.

299
Photo 6.5: A poultry farm and free range birds at Illupur PC complex.
The PC is focussed on organic and traditional food products and milk and country chicken as
the high value products for its business scale up and viability. The company has not paid any
dividend so far as it does not want sleeping members to benefit from it. The major problems
faced by the PC include low volume of business and shortage of working capital especially
loans for crop production at the farmer level. It is also looking at other product options in
livestock and honey.
Table 6.4: Profile and Performance of Illupur PC
Year >
Parameters
2015-16 2016-17 2017-18 2018-19
Authorised capital (Rs. lakh) 10 10 10 10
Share capital (Rs. lakh) 10(100%) * 10(100%) 10(100%) 10(100%)
Turnover (Rs. lakh) 48.06 62.33 116.82 136.06
Profit (Rs.) 0.40 0.22 0.059 5.69 lacs
Reserves and Surplus (Rs. lakh) 0.33 0.55 0.72 116.92
Assets (Rs. Lakh) 19.07 40.82 43.55 -
Note: *- share capital mobilised as %age of authorised capital
Surprisingly, the company has made large no. of loans to individual members for animals with
CSR grants. It also had large inventories of grains of the order of Rs. 3.07 lakh in 2017. It had
also obtained an income of Rs. 1.87 lakh from its model farm and secured Rs. 11.69 lakh
subsidy from the TNSFAC for a pulses processing mill. Paddy and pulses turnover mainly
came from 800 members each. Most of these farmers are engaged in most of these crops and
allied sector enterprises thus being pluri-active households. In this region, farmers earn equally
from crop cultivation, allied activities and wage labour. Its major fixed assets include land and
building accounting for 90% of the total value of the assets. The PC has 27 staff of whom 18
are casual.

300
Photo 6.6: A view of the office and storage complex provided by TNSCM project of the GoTN
2/3 of the members of the PC are active 22% scheduled caste 75% of the members are women.
It claims that it has introduced a new variety of Paddy and pulses in the area. 100% of the
organic farmers buy inputs from PC. 10-20% of the non-members also sell regularly to PC.
100 to 150 farmers sell all their produced only to PC. Organic produce gets premium price and
is purchased entirely. It is estimated that 38% of the farmers produce is sold through the PC.
It has been registered under E-NAM but it is not aware of the features of the market. 95% of
its turnover was from output side where 200 members farmers participated in it. It claimed it
had been able to increase farmers income by 25% with 15% from price benefit and 10% from
cost saving. It brings buyers to the doorstep of the farmers and makes spot payment besides
fair weighment This was important as there was no regulated market in Tamilnadu and no MSP
purchases in the area. It had trained the BoD in PC management and business planning at the
state agricultural university. The BoD have been trained multiple times by various agencies
like DNS, FSAC, TNAU, SLTC, APF and ALC. Besides the CEO has been heading 3 PCs
earlier and had received many trainings therein.
Kottampatti PC
This PC started its operations in 2018 an is promoted by Dhan Foundation. It had its origins
in the Tank Farmers’ Association (TFA) which was a collective of water users’ groups. There
were 220 associations in the block across 90 villages involving 11500 farmers. TFA has
SHGs/AFGs and 86 such groups across 55 villages have membership in this PC at individual
level amounting to 1028 farmers, 60% of whom are women. This PC represents 68 FIGs across
six clusters with a membership of 1028 and cultivated area of 2652 acres. This PC is promoted
with support from NABARD and any farmer can become a member of the TFA and of the PC.
In fact, 30% of the PC members are not members of AFGs. The major crops grown by the
member farmers include coconut, paddy, groundnut, pulses and vegetables. Of the 1028
members of the PC, 90% are marginal and small operators and 5% even landless. Only 25%
of the members are active. PC had authorised capital of Rs. 25 lakh and paid up capital of Rs.
10 lakh in 2017-18 (Table 6.5).. The PC has no licenses to deal with any of the inputs and the
output products. The district has 140 PACS which provide crop loans to individual farmers.
Among the 10 Directors of the Board, two are women, and most of the promoters are members
of BoD and producer groups nominate them from their area. Besides the CEO position, which
is vacant now, there are two supports staff and 70% of their cost is still borne by promoting by
POPI that is Dhan Foundation. The PC sells only bio fertilizers and only 100 farmers buy
exclusively from it.

301
In 2017-18, the sales of the PC were of the order of Rs.6.44 lakh which increased to Rs.61.22
lakh in 2018-19. The major inputs being traded by the PC included kitchen garden seed used
by 4500 farmers and panchgavia used by 630 farmers. On the output side, most of the revenue
came from sale of coconut, copra, and coconut shell. The other big business came from
purchase and sale of millets involving 110 members and paddy involving 26 members. The PC
claims that the farmers received Rs.0.3 higher price per nut than the market price and in paddy
and groundnut, it was Rs.100 and Rs.150 higher than the market price per bag.
Majority of inputs sales are to non-members but most of the produce (80%) is bought from
members. 50 farmers sell regularly to the PC. 98% of its turnover comes from output handling.
On the output side, it has retail outlet in its office where 80% of the revenue comes from
members. It also buys copra from farmer members (50) for sale to buyers like Marico besides
handling some groundnut and paddy produce. It claims that it has promoted hybrid variety of
coconut among its members. The handling of copra has given it large jump in turnover and
matching equity from SFAC of the order of Rs. 10 lakhs has been very significant. It has also
facilitated loans of Rs. 40 lakhs from Axis Bank to its farmer members through the Federation.
The BoDs and staff of the PC have been trained by the promoter and other local agencies in
Madurai. It had provided seven trainings to the CEO and five to the Board of Directors besides
running farmer field school for paddy multiple times for 34 farmers and a coconut certificate
course from a KVK for 22 farmers.
It believes that eliminating intermediaries on the output side is one of its major best practices
leading to better price realization for farmers. It has never bought for the government at MSP
as there is a director purchase centre for paddy and also market prices are generally higher than
MSP. It is focused on black gram and paddy processing for scale up of its business.
The PC had availed warehouse loans and was able to sell paddy at fair price. It also looks at
coconut processing into copra and groundnut shelling as additional activities for scale up and
viability.
However, it faces problems of lack of storage space and lack of working capital for payment
of advance to farmers as done by private market players. On the external side, it faces the
challenges in locating relevant market for farmers produce. It claims 70% of the members and
more of male members appreciate that PC is owned by them.
Table 6.5: Profile and Performance of Kottampatti PC
Year>
Parameters
2016-17 2017-18 2018-19
Authorised capital (Rs. lakh) 10 25 25
Share capital (Rs. lakh) 1 (10%) * 10 (40%) 10(40%)
Turnover (Rs. lakh) 0.011 2.99(1.88 from
coconut)
56.45 (51.72 only
from coconut)
Profit (Rs. lakh) 0.38 (-)0.39 0.30
Reserves and Surplus (Rs. lakh) 0.00038 -0.29 -0.08
Assets (Rs. Lakh) 0 0 10.56
Note: *- share capital mobilised as %age of authorised capital

302
Uslimapatti PC
This PC originated from 25 FIGs and 5 JLGs under 7 panchayat level federations promoted by
ESAF and covers 25 villages under 5 Panchayats in one block of the district. It has 507 farmer
members most of whom are small and marginal landowners and 10 are even landless. 60% of
the members are women and 50% of total members are still active. The PC has authorised
capital Rs. 10 lakh and paid up capital of only one lakh rupees in 2018-19.
It has five members of the board of Directors including one woman. Beside the CEO, it has a
purchase manager and one field staff.
80% of the members have livestock and therefore, its major business on the input side is sale
of cattle feed, 98% of which is sold to members and these sales accounts for 75% of total input
sales. The other significant product sold by the PC is bio fertilizers most of which is again sold
to members. About 200 farmers purchase cattle feed and about 60% bio fertilizers. It had
received a NABARD grant of the order of Rs. 4.25 lakh for capacity building and similar
amount is still pending. The CEO and the board of Directors have been exposed to business
planning by the promoter twice.
The PC did no business for the first two years. Around 300 of its members also are also
members of the state’s (Aavin’s) dairy cooperative society (DCS) which makes them default
on milk deliveries. It was reported by the promoting agency staff that two of its own board
members were milk vendors and they didn’t want PC to succeed. In fact, the milk collection
centre of the PC was found to be closed on the day of the visit of the study team and it seemed
it had not been functioning for a long time. The PC plans to buy maize and vegetables from
its members to sell to bigger buyers.
Table 6.6: Profile and performance of Uslimpatti PC
Year >
Parameters
2015-16 2016-17 2017-18 2018-19
Authorised capital (Rs. lakh) 10 10 10 10
Share capital (Rs. lakh) 1(10%) * 1 (10%) 1(10%) 1(10%)
Turnover (Rs. lakh) 0 0 0 0.11
Profit (Rs lakh.) -0.03 -0.05 -0.05 -1.51
Reserves and Surplus (Rs. lakh) -0.03 -0.08 -0.13 -1.64
Assets (Rs. Lakh) 0 0 0 0.072 Note: *- share capital mobilised as %age of authorised capital
Perriyakulam mango and veg PC
This PC registered in 2016 by 10 member promoters now has 1028 farmers who are members
of 72 FIGs which were earlier farmer clubs (31) promoted under NABARD scheme. These
members are spread across 23 villages of two blocks of Theni District. PC was supported by
ESAF (the POPI) for three years (2016-19).
A farmer to become member should be practicing cultivator. 50% of the farmers are marginal,
small or semi medium. 55% of the members are men and 90% of all members are active. The
PC had authorised as well as paid capital of Rs. 10 lakh in 2017-18 (Table 6.7). It had not

303
undertaken any transactions in input or output markets so far. It had tried mango sales for one
year, but it did not make money and now looks at Moringa (drumstick seeds) for value addition
into drumstick power for supplying to various food and pharma companies.
Photo 6.7: A locked milk collection centre of the PMV PC in a village
One out of its five board members is woman and the only condition to become of member of
the BoD is that the member should be active in PC. The PC has 9 staff including the CEO
besides the CEO which include two marketing managers, one purchase manager, four dairy
centre staff and one accountant and administrative staff each. It has been given a 20 ton
warehousing facility and a primary processing centre by TNSCM. The PC has also facilitated
contact farming of gherkins with 42 members which has been fairly successful for two years.
Th PC gets 10% commission for this facilitation. It has directly sold in wholesale, drumstick
seeds, its leaves, garlic, tomato, mango, onion, and milk. Very large part of its turnover came
from milk and high value produce like garlic and drumstick. Its sells milk procured from 200
farmers to Godrej. The PC had not paid dividends to its members and has capitalized them as
share capital. It has availed loans from Nabkisan and Ananya finance at 14% interest for
funding milch cattle at farmer level. The BoD and staff have been mostly exposed to business
planning and day to day management of the PC by the promoter and at BIRD Bengaluru. The
major problems faced by the PC include: Directors losing interest in the PC, and lack of
awareness among the CAs about the PC Act and rules. The PC plans to engage into direct
exports with its own brand and setting up a resource centre for PC training with the help of
state govt.
Table 6.7: Profile and performance of Periyakulum PC
Year>
Parameters
2016-17 2017-18 2018-19
Authorised capital (Rs. lakh) 10 10 10
Share capital (Rs. lakh) 1(10%) * 10(100%) 10(100%)
Turnover (Rs. lakh) 29.61 67.17 125.07
Profit (Rs.) 0.07 0.25 0.13
Reserves and Surplus (Rs. lakh) 0.07 0.20 0.34
Assets (Rs. Lakh) 0.83 1.24 Note: *- share capital mobilised as %age of authorised capital.

304
Kodai Hills Crops PC
This PC originating from 26 FIGs across 75 villages in three blocks of Dindigul district has
501 shareholders. 30% of the members of this PC promoted by ESAF and supported by
NABARD are in active. The PC has authorised capital of Rs. 10 lakh and paid up capital Rs.
6.11 lakh (Table 6.8).. The PC has only one staff at the level of CEO. 90% of the PC members
are also members of the local PACS. Two of its FIGs runs custom hiring Centres (CHCs) of
farm machinery. It has been sanctioned a 500 metric ton warehouse. 70% of its input sales are
to the members and it has one retail shop. It has mostly bought coffee and pepper from the
farmers and sold that to exporters receiving 2% commission. It has been into profit from the
beginning and has applied for matching equity grant from SFAC. It has received Rs. 4.5 lakh
grant from NABARD for capacity building and obtained loans of Rs. 43.5 lakh for working
capital from Nabkisan. It has exposed its BoDs to the mechanisms for increasing farmer
incomes at various places facilitated by the POPI.
Table 6.8: Profile and performance of Kodai Hills PCs
Year >
Parameters
2016-17 2017-18 2018-19
Authorised capital (Rs. lakh) 10 10 10
Share capital (Rs. lakh) 1(10%) * 3(30%) 6.11(61%)
Turnover (Rs. lakh) 3.13 3.64 17.4
Profit (Rs.) 0.09 0.18 0.28
% of Shares held by promoters 100 33 20 Note: *- share capital mobilised as %age of authorised capital
In 2017-18, the list of shareholders showed that at the end of the year thee shareholders had
more than ten shares each going upto 30, another six had ten shares each and 15 members had
shares ranging between two and four. These 24 people held 150 shares out of the 612 shares of
the company.
Photo 6.8: Coffee plantation, and wet and dry coffee beans in the PC area (near its office)
At the beginning of this year, it had 501 members and Rs. 5.74 lakh share capital collected. It
had fixed assets of Rs.6.27 lakhs. It had also obtained two loans of Rs.15 lakhs and Rs.28.7
lakhs from NAB Kissan in 2018 and 2019 respectively. It had also received a grant from
NABARD for capacity building which was Rs.4 lakhs. It had most of its stocks which
amounted to Rs.38.46 lakh was composed of mainly coffee (Rs.33.87 lakh) and pepper

305
(Rs.4.29 lakh). It finds its location as disadvantage and does not have qualified staff to manage
the PC.
Theni Goat PC
Theni district has 69% of its land holders who are marginal. The district produces paddy,
vegetables and fruits and also known as the cardamom city due to high quantity of cardamom
production besides grape production throughout the year. It is also an agri export zone (AEZ)
for mangoes. The major crops grown are paddy, millets, pulses, sugarcane, oilseeds, coconut,
cotton, fruits, vegetables, silk, spices and tea and coffee. 47% of the workers are farm labourers
and 10 percent cultivators. 24% of the district’s rural population is BPL which higher than the
state average (Kumar and Kulkarni, 2013).
Vidiyal (meaning ‘dawn’) -an NGO which was set up in 1986 and has by now promoted 35
PCs in 11 district, has been promoting SHGs of women since 1996 and they were aggregated
into village level federations from 1997 and then into Panchayat level federations since
1998.The federations are the apex bodies of the Taluka level, village level and self-help group
(SHG) structures and engage in on lending of loans to the members of the SHGs through the
block level and the village level federations.
The NGOs had organized 4250 women in 250 self-help groups across 25 village under a
federation called Vidivelli in 2000. This federation has further panchayat level and village level
groupings going down to the SHGs with 12 to 20 members each. The federation provides
credit to the groups who in turn give it to the members. The groups retain 6% interest. The
federation shares 3% interest with the VLF and PLF each.
The other federation (Vanavil) which represents 70 JLGs with 1000 members has panchayat
level sub federations and then 5 to 10 members with each JLG at the primary level. The PC has
membership from both these federation members. Each member of the JLG contributes Rs.100
as entry fee and deposits Rs.2000 as contribution leading to Rs.2.1 lakh one-time contribution
and annual member subscription of Rs.10, group maintenance of Rs.100 per month and Rs.100
per month for each PLF leading to 1.32 lakhs contribution.
The loans obtained by the federation at 12% rate of interest are lent out to the SHG members
at 24% interest which includes 3% each as a service charge for two federations at taluka and
village level and 6% for the SHG for purchase of 10 goats and one mobile or purchase of two
cows and one mobile phone. IFFCO Kisan Sanchar Limited provided free mobile phone
services. These loans were repaid within three years and each member made an earning of Rs.
1.5 lakh. Most of the members are marginal or small land and livestock owners and 25% are
landless. 80% of the members of the SHGs avail of loans.
This PC, with support from CCD (technical) and NABARD (capacity building finance) besides
Commonwealth of Learning (CoL) was set up in 2015 has 1050 mostly women shareholders
(only 33 men) from 77 FIGs with 50,000 goats ranging from 20-200 goats per member and
most of the members are small and marginal landholders and 1/3 completely landless. There
are more than 5000 farmers in goat rearing in the district. For becoming a member of the PC,
goat raring is a must. All the of goat rearers are non-migrant. 85% all members are active.
The PC has authorised capital of Rs. 20.5 lakh and paid up capital Rs. 10.5 lakh. It has reserves
of Rs. 4 lakh. It buys cattle feed to supply its members and has 10 franchisees in rural areas to
sell goat meat.

306
Photo 6.9: Theni goat and goat pens in a village in PC area
It had 10 board members including two men and the PC has a part time CEO and other
marketing and accounts staff. It sells various farming inputs mostly to its members and 50%
of them buy exclusively from the PC which has a retail shop on its promises. It also sells goats
to its members and buys back goats mostly from the members and also the non-members and
sells them further for profit as animals (300-400 per month) in six districts including Theni
and other markets like Pudukottai or Raisingpuram as well as retails meat through the
franchised shop.
It has one franchised meat shop which sells Kooru (mixed) goat meat and skin is sold
separately. 3-4 goats meat is sold daily which has come down to two goats per day and mostly
sold to members during covid-19 period. The differentiating factors for PC shop are: hygiene
and young goat health check up before slaughter on the day of butchering besides freshness of
meat. The meat shop opens only for a few hours in the morning and workers work part time in
it. It has introduced weight based purchase of animals unlike the observation based purchase
by the private traders, and makes instant payments. It also participates in community goat
market which is held weekly. The weekly goat markets are leased out to private players by the
government on the basis of tenders. The Franchises pay 10% royalty to the PC on sale of meat.
90% of its turnover is made up of goat and its meat sales.
Photo 6.10: A retail outlet of the PC at its office complex
It has already received matching equity grant of Rs. 10 lakhs from SFAC. It has received
financial support from NABARD of the order of Rs. 5 lakh for three years in 2015. The
members are trained by in crop seed production by 70 ToTs with 50% of them being women
and have trained more than 2100 farmers including 1287 women. The PC is the only goat PC

307
in the district and the district is known for special breed of goat (Theni). The PC intents to
study the meat market for its potential and focus on hygienic supply of meat. The BOD
members and the staff were taken on exposure visits to various PCs before the registration of
this PC. The PC claims that all the members know that they own the PC.
Table 6.9: Profile and performance of Theni Goat PC
Year>
Parameters
2015-16 2016-17 2017-18 2018-19
Authorised capital (Rs. lakh) 12 20.5 20.5 20.5
Share capital (Rs. lakh) 10.5(88%)
*
20.47(100%) 20.47(100%) 20.47(100%)
Turnover (Rs. lakh) 3.19 14.47 26.94 54.65
Profit (Rs.) 0.01 0.18 0.43 0.84
Reserves and Surplus (Rs. lakh) 0.01 0.19 0.62 1.47 Note: *- share capital mobilised as %age of authorised capital
In 2018-19 more than 50% of the revenue came from sale of goat meat and 20% from sale of
groceries and 10% from sale of pulses. In the previous year, more than 50% of the turnover
came from the sale of groceries. Even during 2016-17 and 17-18, groceries sales accounted
for more than 50% of the total sale of the PC.
The members of the PC obtained bank loan of Rs. 40,000/- with own contribution of Rs. 3,500
for a period of five years at the rate of 13% interest. However, they repaid the loan in three
years and made a profit of Rs.1.5 lakh each because 60% of the goats had doubled kidding and
10% even triple. The expenditure for raising these goats for three years included medical
expenses besides insurance leading to a total of Rs.94400 per batch of 9 female goat and one
male buck. On the other hand, these goats with less than 2% mortality and sale price of Rs.3000
for 80 goats led to revenue of Rs.2.4 lakh besides earning Rs.7200 from the sale of manure and
milk. This led to a net earning of Rs.1.528 lakh.
A study of the effectiveness of its operations by an external agency which covered 69 borrowers
for goat rearing across six villages in two blocks which had 245 borrowers revealed that the
survival rate of the kids had significantly improved as reported by 24% and 48% of the
respondents which ranges from more than 50% (substantial) and between 26 to 50%
(significant) improvement, respectively. Similar responses were received on the number of
goats born with 30% reporting more than 50% and 47% reporting 26 to 50% increase. Even
the weight of goat was reported to have improved substantially and significantly by one-third
of the respondents each. More importantly, 38% and 35% respondents reported substantial and
significant improvements in the market value of goat. Forty percent also reported significant
income increase from droppings. It has also found that the net returns from goat activity
improved with increase in the level of education of the borrower. The birth of kids which was
eleven in 2009 increased to 20 in 2011 and a borrower sold on an average 21 goats in 2013
compared with 15 in 2011. Overall the net returns increased from Rs.9684 in 2009-10 to
Rs.32353 in 2012-13. Majority of the women, after the loans, owned minimum of 30 to 50
goats worth Rs.1-1.2 lakh besides what they had sold by then. From the second year of the
loan, each rearer had sold 12 to 15 goats for Rs.30000 and those with herd size of 40 also
earned Rs.1000 per month from selling dung/goat droppings (Kumar and Kulkarni, 2013).

308
Chapter 7
Overview, Conclusions and Recommendations
This chapter brings together the findings across all states, promoters, and PCs together in
section 7.1, highlights the major problems of PC in section 7.2, examines best practices in
section 7.3 and makes a few relevant recommendations in section 7.4.
7.1: Overview
As seen in previous chapters (2-6), the PC performance and impact varies widely depending
on the PC, the promoter, and the location. Therefore, it is important to get an overall assessment
of how PCs are doing at the aggregate level as revealed by this set of case studies. As table 7.
1 shows the PC members were generally larger land holders unlike their non-member
counterparts both in owned and operated land. In fact, the gap widened in operated land
compared with owned land. These means were also statistically different from each other at
both 1% and 5% level of significance for paired t-test (Table Appendix 7.1).
However, this is not to say that PCs exclude small farmers as still most of the members were
owners and operators of around five acres of land. However, non-members were more close to
marginal ownership and operation.
The average land ownership was low in WB and UP as expected both among members and
non-members and very high in Rajasthan and very different from those of non-members (1.5
times larger for members). The members everywhere had higher average land holding both
owned and operated across all states with large difference only in Rajasthan and Tamilandu
both of which also had the highest average size of holding across all states (Table 7.1). It was
goat owning households which were landless or marginal landowners or operators which
moderated the average size in Tamilnadu and MP to some extent.
Table 7.1: State-wise Average owned and operated land of PC members and non-
members
State>
Category
>
Average
Land
Holding
(Acres)
MP Rajasthan TN UP West Bengal All
Mem
ber
Non-
Member
Me
mbe
r
Non
-
Me
mbe
r
Member Non-
Membe
r
Me
mbe
r
Non
-
Me
mbe
r
Mem
ber
Non-
Mem
ber
Me
mbe
r
Non-
Mem
ber
Owned 5.38*
4.9**
4.84*
4.54**
8.22 5.99 5.59*
5.12**
3.69*
3.49**
2.28 1.53 1.99 1.29 4.5 3.42
Operated 6.09*
5.53
**
5.43*
5.08**
10.3 5.96 6.58*
6.04**
4.12*
3.8**
2.91 2.55 2.32 1.61 5.34 3.86
Notes: * excluding goat PC members/non-members; ** including goat PC members/non-
members

309
It was important to know whether members in any way differed from non-members in their
awareness of the PC. This has been an issue in the past in that very small percentage of
members were aware of the PC details and its ownership. Therefore, this aspect was explored
proactively as it has implications for promotion of the concept and the mobilisation efforts for
organising a PC which determines its success or failure. As table 7.3 reveals though more of
members knew the name of the PC (62%) compared with non-members (44%), it is till not
very high and 27% did not know it at all and another 11% reported it wrong. At the state level,
overall awareness of PC name among members hovered around 60% with the exception of
U.P. where it was high at 85%. This was much higher than the knowledge of non-members
where only 24% in Tamilnadu to as high as 71% of non-members in U.P knew it but it was
between 40-60% across the three states of Rajasthan, M P and West Bengal and only 24% in
Tamilnadu (Table 7.2). Further, whereas 27% farmers knew PC was owned by farmers
compared with only 6% of non-members thinking so, the more worrying part was the large
proportion of members saying it was owned by PC employees (18% ) and BoD (8%) besides
the fact that 31% did not have any awareness of this aspect. 80% of non-members were in this
category which is not very surprising.
Table 7.2: State wise distribution of PC member and non-members by knowledge of PC
name
State>
Catego
ry>
PC
Name
Known
MP Rajasthan TN UP West Bengal All
Membe
r (No &
%)
Non-
Membe
r (No &
% )
Membe
r (No &
%)
Non-
Membe
r (No &
% )
Membe
r (No &
%)
Non-
Membe
r (No &
% )
Memb
er (No
& %)
Non-
Member
(No & %
)
Membe
r (No &
%)
Non-
Mem
ber
(No
& % )
Me
mbe
r
(No
&
%)
Non-
Mem
ber
(No
& % )
Don’t
Know
2
1
25.
93
4
9
56.
98
1
0
24
.39
2
1
50
.0
0
37 35
.2
4
77 76
.2
4
3 7
.
3
2
12 28
.5
7
19 29
.6
9
26 4
1
.
9
4
9
0
2
7
.
1
1
1
8
5
55
.5
6
No 1
3
16.
05
0
0 5 12
.20
0 0 8 7.
62
0 0 3 7
.
3
2
0 0 10 15
.6
3
3
8
1
1
.
4
5
0 0
Yes 4
7
58.
02
3
7
43.
02
2
6
63
.41
2
1
50
.0
0
60 57
.1
4
24 23
.7
6
35 8
5
.
3
7
30 71
.4
3
35 54
.6
9
36 5
8
.
0
6
2
0
4
6
1
.
4
5
1
4
8
44
.4
4
Total 8
1
10
0
8
6
10
0
4
1
10
0
4
2
1
00
10
5
1
00
10
1
1
00
41
1
0
0
42 1
00
64 1
00
62
1
0
0
3
3
2
1
0
0
3
3
3
10
0
At the state level, with the exception of UP, about 30% members in all states except WB did
not know who owned the PC whereas in WB, 45% did not know it. The farmer members in
UP, MP and Rajasthan knew that farmers owned it with %age going from 36% in Rajasthan to

310
as high as 43% in MP and 56% in U.P. In WB, 38% thought it was owned by PC employees
and that was stated by 24% farmers in Tamilnadu as well. Promoting agency came next in
Tamilnadu (22%) and Rajasthan (15%) and MP (11%). A few famers in all states except
Tamilnadu also thought it was owned by government (Table 7.3). on the other hand, 70-80%
non-members had no knowledge of PC ownership. In general, mostly farmer members joined
PC due to encouragement and persuasion by PC promoters and PC employees (78%) with some
others due to their friends advice (Table 7.4).
Even though the performance on awareness of the PC and its ownership is mixed, it is important
to know the extent and nature of interface of PCs with their members on the input and output
side of their business. On the input side, 33% members were buying seeds from the PC
compared with only 8% non-members doing so. Also, a few other members (20%) combined
buying from PC with other sources like dealers, PACS and other farmers or government outlets.
Only 6% non-members reported such a purchase behaviour (Table 7.5). The reliance on PCs
for chemical inputs like fertilisers and pesticides was very high with 31% and 27% buying
exclusively from PCs and another 4% and 3% respectively combining it with other sources like
dealers and PACS and government outlet (Table 7.6). But, this was much higher compared
with non-member purchase from PCs which was only 11% and 8% respectively for fertilisers
and pesticides. But, bio-input purchases were very low from PC with only 7% and 5% non-
members buying from PC and 3% and 7% non-member farmers buying bio fertiliser and
biopesticides from PCs (Table 7.7).
Across states, the seed purchase from PCs varied from a low of 18% in Tamilnadu and WB to
a high of 40-56% across MP, Rajasthan and U.P. or a combination of dealers and PCs in about
11-26% cases. Non-members mostly relied on dealers in all states especially MP, WB, and
Rajasthan (57-59%) with some non-members buying from PCs as well (6-17% across states).
Only about 5-15% members reported buying biofertilisers from PCs mostly in MP, U.P, and
Rajasthan whereas non-members mostly bought them from dealers though only very small
%age of all used them (3-16%). Biopesticides were also bought by only 2-12% of members
across states (except WB where members bought it from dealers) as most of them did not use
the product at all. Reliance of members for chemical fertilisers on PCs was high in MP and
U.P. (38% and 71% respectively) and very low in Rajasthan, Tamilandu and WB (10, 20 and
28% respectively). PACS wee important source in MP and Rajasthan for about 23% farmers.
On the other hand, majority of non-members bought chemical fertilisers from dealers in WB
(73%), U.P. (55%) and Tamilandu (50%) and 33% in Rajasthan and 42% in MP, with only 20-
28% each in U.P, Rajasthan and Tamilnadu buying from PCs. Chemical pesticides were
bought by 37-64% members in MP, U.P. and Rajasthan from PCs while non-members mostly
bought them in all states (32-55%) from dealers.

311
Table 7.3: State-wise distribution of PC members and non-members by knowledge of ownership of PC ownership
State> Category> PC Owner
MP Rajasthan TN UP West Bengal ALL
No. of Members
%age of total
No. of Non-Members)
%age of total
No. of Members
%age of total
No. of Non-Members
%age of total
No. of Members
%age of total
No. of Non-Members)
%age of total
No. of Members
%age of total
No. of Non-Members
%age of total
No. of Members
%age of total
No. of Non-Members
%age of total
No. of members
%age of total
No. of Non-members
%age o f non-members
BOD 6 7.41 1 2.44
2 4.76 7 6.67
7 17.07
5 11.90
5 7.81 5 8.06
26 7.8
13 3.9
Farmers
35 43.21 3 3.49
15 36.59
2 4.76 16 15.24
4 3.96
23 56.10
5 11.90
3 4.84
89 26.8
19 5.7
Government
2 2.47 1 1.16
3 7.32
1 2.38 2 4.88
4 6.25 11 3.3
2 0.6
PC employee
5 6.17 3 3.49
4 9.76
2 4.76 25 23.81
3 2.97
3 7.32
1 2.38
24 37.50 5 8.06
61 18.4
12 3.6
Promoting Agency
9 11.11 8 9.30
6 14.63
23 21.90
5 4.95
1 2.44
2 4.76
2 3.13 4 6.45
41 12.4
19 5.7
Private Company
2 4.76 1 0.95
1 0.3
0 0
IFFCO 1 1.23 1 1.16
1 0.3
1 0.3
Don’t know
23 28.40 70 81.40
12 29.27
33 78.57 33 31.43
89 88.12
5 12.20
29 69.05
29 45.31 45 72.58
102
30.7
267 80.2
Total 81 100 86 100 41 100 42 100 105 100 101 100 41 100
42 100 64 100 62 100
332
100
333 100

312
Table: 7.4: State-wise distribution of PC members by influencer for joining PC
State> MP Rajasthan Tamilnadu U.P. W.B. All
Parameter>
Influencer
No. of
memb
ers
%age
of
total
No. of
memb
ers
%age of
total
No. of
memb
ers
%age
of
total
No. of
member
s
%age
of
total
No. of
memb
ers
%age
of
total
No. of
memb
ers
%age
of
total
BOD 0 0 0 9 21.95 0 10 3.0
Friends 12 14.8
1
4 9.76 18 17.14 7 17.07 17 26.56 57 17.2
PC
Promoters
62 76.5
4
17 41.46 38 36.19 14 34.15 13 20.31 144 43.4
PC
Employees
7 8.64 17 41.46 49 46.67 11 26.83 33 51.56 117 35.2
PC
employees
and others
0 1 2.44 0 0 01 1.56 3 0.9
PC
Promoters
& PC
Employees
0 1 2.44 0 0 0 1 0.3
Others 1 2.44 0 0
Total 81 100 41 100 105 100 41 100 64 100 332 100
Table 7.5: Distribution of PC members and non-members by source of Seeds
Category>
Parameter>
Source
Members Non-Members
No. of farmers %age of total No. of farmers
%ag of total
ADO 7 2.11 11 3.30
ADO, Dealers 6 1.81 2 0.60
ADO, Local Farmers 1 0.30
ADO, PACS 1 0.30
ADO, PC 4 1.20
Dealers 81 24.40 167 50.15
Dealers, Local Farmer 8 2.41 12 3.60
Dealers, Local Farmer,
ADO 1 0.30 1 0.30
Dealers, PACS 9 2.71 6 1.80
Dealers, PACS, PC 1 0.30
Dealers, PC 55 16.57 21 6.31
Local Farmer,PACS 2 0.60 1 0.30
Local Farmers 12 3.61 30 9.01
Local Farmers, PC 5 1.51 2 0.60
Nursery 1 0.30
Other FPO 1 0.30 2 0.60
PACS 6 1.81 3 0.90
PACS, PC 1 0.30
PC 108 32.53 26 7.81
Doesn’t buy 24 7.23 47 14.11
Total 332 100 333 100
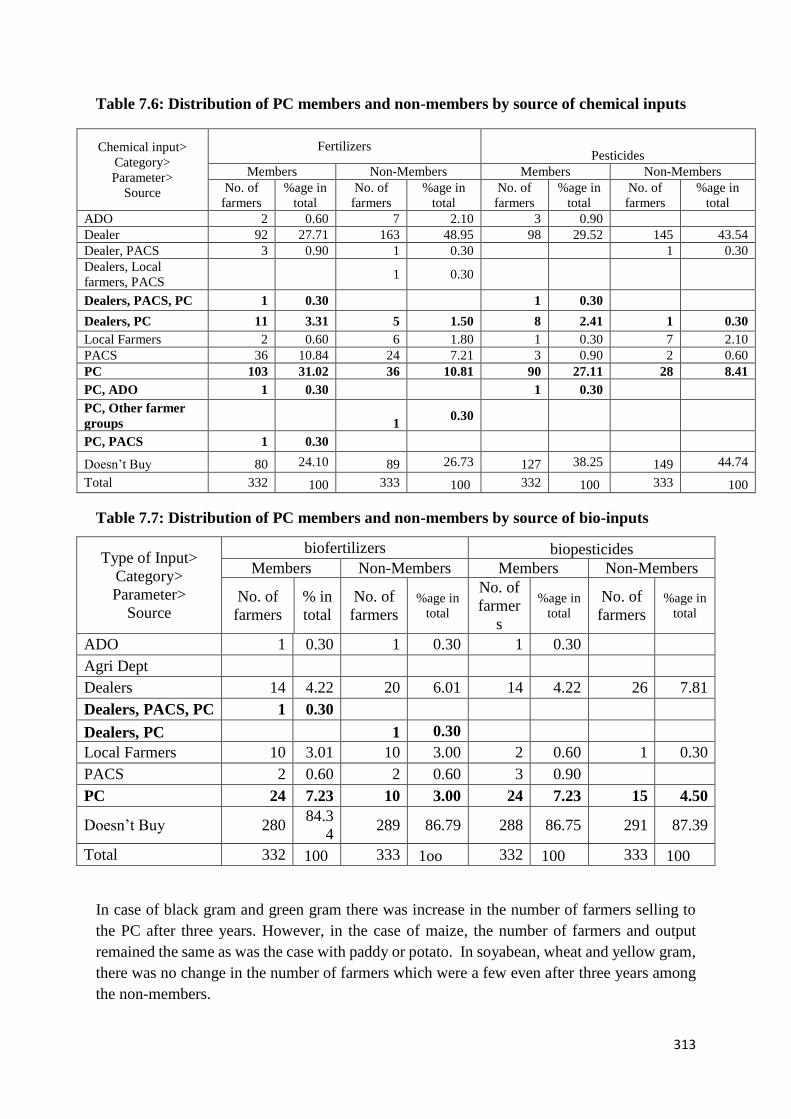
313
Table 7.6: Distribution of PC members and non-members by source of chemical inputs
Chemical input>
Category>
Parameter>
Source
Fertilizers Pesticides
Members Non-Members Members Non-Members
No. of
farmers
%age in
total
No. of
farmers
%age in
total
No. of
farmers
%age in
total
No. of
farmers
%age in
total
ADO 2 0.60 7 2.10 3 0.90
Dealer 92 27.71 163 48.95 98 29.52 145 43.54
Dealer, PACS 3 0.90 1 0.30 1 0.30
Dealers, Local
farmers, PACS 1 0.30
Dealers, PACS, PC 1 0.30 1 0.30
Dealers, PC 11 3.31 5 1.50 8 2.41 1 0.30
Local Farmers 2 0.60 6 1.80 1 0.30 7 2.10
PACS 36 10.84 24 7.21 3 0.90 2 0.60
PC 103 31.02 36 10.81 90 27.11 28 8.41
PC, ADO 1 0.30 1 0.30
PC, Other farmer
groups
1 0.30
PC, PACS 1 0.30
Doesn’t Buy 80 24.10 89 26.73 127 38.25 149 44.74
Total 332 100 333 100 332 100 333 100
Table 7.7: Distribution of PC members and non-members by source of bio-inputs
In case of black gram and green gram there was increase in the number of farmers selling to
the PC after three years. However, in the case of maize, the number of farmers and output
remained the same as was the case with paddy or potato. In soyabean, wheat and yellow gram,
there was no change in the number of farmers which were a few even after three years among
the non-members.
Type of Input>
Category>
Parameter>
Source
biofertilizers biopesticides
Members Non-Members Members Non-Members
No. of
farmers
% in
total
No. of
farmers %age in
total
No. of
farmer
s
%age in
total No. of
farmers %age in
total
ADO 1 0.30 1 0.30 1 0.30
Agri Dept
Dealers 14 4.22 20 6.01 14 4.22 26 7.81
Dealers, PACS, PC 1 0.30
Dealers, PC 1 0.30
Local Farmers 10 3.01 10 3.00 2 0.60 1 0.30
PACS 2 0.60 2 0.60 3 0.90
PC 24 7.23 10 3.00 24 7.23 15 4.50
Doesn’t Buy 280 84.3
4 289 86.79 288 86.75 291 87.39
Total 332 100 333 1oo 332 100 333 100

314
On the other hand, the number of farmers selling through the PCs increased from 3 to 15 in
black gram and from 5 to 13 in cotton and even in black gram come to 2 to 5 besides red gram
from 1 to 4. There was also substantial increase in numbers in green gram and ground nut from
2 to 8 and 3 to 7 respectively. In fact, the biggest increase in numbers was in maize which
increase from 6 to 19 farmers and in millets from 1 to 4 farmers over 3 years. Paddy also had
a big jump in farmers selling through the PC from 1 to 9 as was the case in soyabean where it
increased from 6 to 11 and in wheat from 7 to 18. Among the members, there were also cases
of contract farming in avocado, coconut, drumstick, and in the case of non-members, there was
contract farming in chilli, and vegetables besides potato contract farming through the PC by
two farmers (Table 7.8).
Across states, majority of the farmers (60-83%) and average of 72% did not receive any scheme
or subsidy information from PC of which they were members (Table 7.9) and only some in
Tamilnadu and WB reported getting subsidised inputs, (19%), equipment (6%), and loans (5%)
respectively. In U.P, just 6% farmers reported getting subsidised inputs and in Rajasthan
though 25% reported it but no details could be obtained (Table 7.10). In Tamilnadu, 52%
reported special loans for members and in Rajasthan 12% reported receiving input subsidies.
In other states, thee was no such special subsidies for any significant number of members where
94-96% reported receiving no special subsidy with overall response being negative for 80%
members across states.
On the value placed by members on various services offered by PCs, about 22% members
disliked them ranging from poor access to some services, lack of timely and adequate
availability and no or poor procurement of farm produce. The problem of poor procurement
was particularly reported in U.P. (10%) (Table 7.11).
Box
Non-PC FPOs: Satpuda and Saptarishi
Member profiles and interface
Whereas Satpuda mushroom co-operative (promoted by PRADAN in M.P.) had all women
members and Saptarishi Trust (by Chaltaberia MGO) all male members as respondents,
Satpuda members were also younger in age on an average (35 years versus 50 years). Further
majority of Satpuda members were illiterate (60%) while majority of Satpuda were high school
or middle pass (54%).
All of them in Saptarishi had farming as primary occupation but 70% in Satpuda mentioned
mushroom cultivation as their primary occupation. For 70% of them farming was secondary
occupation. As against this, 73% of Saptarishi members had no secondary occupation. Both
FPO members were generally marginal holders of land both owned and operated with average
being 1.85 and 1.6 acres for Satpuda and 1.05 and 1.28 acres in Saptarishi as owned and
operated land respectively. Some of the Satpuda member did not even cultivate their owned
land. Thus, 80% of Satpuda member were marginal and 10% each small land semi-medium
while 100% of Saptarishi were marginal owners and operators. But, Satpuda members had

315
more livestock on an average of all kinds with average of 2-3 buffaloes or cows or oxen and
even 8 goats per hh. But Satpuda farmers were in majority rainfed unlike none in case of
Saptarishi.
Saptarishi member had higher cropping intensity (2.89 versus 1.56 of Satpuda) and a cropping
pattern dominated by paddy, potato and groundnut compared with that of Satpuda which was
dominated by maize, wheat, paddy, and gram. Whereas all Satpuda members bought
mushroom seedlings from FPO (Co-op), the Saptarishi members mostly bought seeds from
dealers and other sources including PACS and FPO. But, farm inputs like chemical fertlisers
and were bought from dealers in both cases but 50% in both cases relied on FPO for agri
information.
Both the FPO members were aware of the FPO name with 64% in case of Saptarishi and 40%
in case of Satpuda. But a higher proportion in Saptarishi (64%) did not know who owned the
FPO unlike the Satpuda members where only 30% did not know while 40% knew that farmer
members owned it which was only 9% in case of Saptarish. Only 30% in case of Satpuda
thought it was owned by promoting agency (NGO) while in Saptarishi members thought it was
owned by govt, FPO employees or BoD other than 10% who said it was farmer member owned.
Governance and participation
Another major inclusion issue is the participation of women in PCs. As the data in table 7.9A
reveals other than in TN (39%), MP and Rajasthan (25% each), there was hardly any women
members among the respondents though there were separate all-women member PCs in states
like Rajasthan, M.P. and Tamilnadu. Rajasthan %age is reasonable because one of the PCs was
a milk PC which had substantial proportion of women members. This is largely due to the fact
that most of the time membership for a farmer PC is based on land ownership which is generally
in the name of the male member/s and also socio-cultural restrictions on women in these states
especially among upper and middle castes. However, even the BoD of most PCs in Rajasthan
and U.P. with the exception of the milk PC in Rajasthan had only one woman member each if
they were not all -women PCs. Even NDDB promoted milk PC in U.P. did not have any woman
BoD member.
Generally, members reported meetings being held monthly in majority cases across states
(56%) followed by quarterly meetings (16%) with only 50% members attending them regularly
and others only sometimes (25%) or occasionally (10%) with 15% never attending any of the
meetings. This varied from only 35% attending regularly in UP to 65% doing so in Rajasthan
(tables 7.12 and 7.13). This is also corroborated by an exploratory study of 13 FPCs in
Maharashtra which stated that in 84% PCs, meetings of the BoD were monthly but only 25-
70% shareholders across PCs attended AGMs held annually (Badayta et al, 2018). However,
most of the members across states (87% ranging from 70-100% ) wanted to continue as
members. The lowest was in MP (70%) and the highest in Rajasthan (100%). Further, 80%
also were willing to encourage others to become member of the PC ranging from 71% in WB
and UP to as high as 98% in Rajasthan (table 7.14 and 7.15).

316
A majority of members (53%) across states (47-66%) suggested interventions in procurement,
(11%), better, timely, and lower cost input supply and procurement (9%) and rentals of farm
machinery and equipment (3%). Tamilnadu members were keen to get loans and input
subsidies (11%) and see procurement happening (11%) while those in WB, wanted more of
better input supply (6%) and their timely availability(8%) and farm improvements support
(6%) besides procurement (8%). The UP PC members were particularly keen on better
procurement (14%) and farm machinery rentals (14%) and storage and warehousing facility
(6%) besides lower cost and timely input supply and procurement at the same time (18%). The
MP PC members also emphasised better inputs and extension advice, (14%), procurement (9%)
and lower cost and timely input supply along with better procurement (7%). Similarly,
Rajasthan farmers were keen on procurement (16%) better price realisation (6%), value
addition (6%), new crops (4%), crop insurance (4%) and lower cost inputs and procurement
(4%) (table 7.16). This clearly shows output interventions were lacking in most cases and that
is what matters the most for farmers as even if they produce at lower cost or higher output from
same piece of land, if they are not able to sell it well, the farmer benefit goes missing.
The members suggested various ways to improve governance of the PCs which included more
members, more professional resources, better governance at the BoD level and better trust
among members about PC and more funding especially in the case of Rajasthan. On the
management of the PC, in general, farmer members suggested expansion of membership, better
communication among members and PC, and trained and professional staff for business
management. The accountability to members came up as a big suggestion in TN along with
membership expansion while in WB, it was more about better communication and in UP more
employee support for PC and more frequent meetings. In MP too, membership expansion was
the main suggestion while some members also mentioned better business plans for making the
PCs viable, while in Rajasthan, it was all about better professional management of the PCs
(tables 7.17 and 7.18). Infact, out of nine PCs in MP, 5 had some business plan, only one out
of 4 had one in Rajasthan (excluding milk PC),and two out of 4 in U.P (excluding milk PC). In
WB, it was just one PC out of five which had a business plan and in Tamilnadu, out of 9, no
one had a business plan. Thus, only 1/3rd all PCs had a business plan each.
It is also important to understand what makes some farmers join the PC while others don’t. An
examination of the factors which can be associated with farmers becoming members of PCs as
against non-members, the logit regression results suggested that literacy (p < 0.01), ownership
of livestock (p < 0.01), and being a member of any other farmer collectives like PACS, SHG,
or another PC (p < 0.01) had a significant association with the membership of a
PC/FPO. However, other factors included in the regression model like operated land and
gender were not associated with the membership of a PC.
7.2 Organising models and Best practices in management and governance of PCs
Interestingly, there was not much variation across promoters and PCs so far as their organising
levels and forms were concerned. In U.P. and WB, it was FIGs, WUGs and in one case farmer
clubs which were the smallest levels of a PC membership. Since both IGS and BKSL in WB
and BCTS and BKSL in U.P. as promoters were a part of the same family of BASIX, they both

317
followed the same approach. In M.P. too, it was all about SHGs, and FIGs, across PCs
organised by different promoters which led to evolution of the PC structures. In Tamilnadu too,
it was JLGs, FIGs, APGs across various promoters and nine PCs. This happened as
government agencies like SFAC and NABARD also recommended and supported such
evolution and local NGOS anyway followed such local level mobilisation strategies for their
work besides the fact that PCs based on such structures seemed more stable and sustainable
(Singh and Singh, 2014).
An assessment of the best practices of PCs across states revealed a varied picture and not so
many PCs being confident about calling their practices best practices.
In WB, major best practices across PCs were contract farming, value addition, bidding for sufal
Bangla, crop insurance new crops, and market linkages. In Rajasthan and U.P. a few innovative
best practice were: no credit sales, new crops, and contract farming.
In Tamilnadu, in case of PCs promoted by SEEDS NGO, some of the best practices followed
by its PCs included: direct procurement from farmers and payment at farm gate, no
involvement of intermediaries in the transactions, and supply of quality inputs. In the case of
Thoothukudi PC, the PC considered contract seed production by 20 farmers for NSC and bio-
input business as the best practices. It believed that the best way to help farmers is to intervene
in the open market for better realization of price. Kottampatti PC also believed in eliminating
intermediate on the output side ass one of its major best practices leading to better price
realization for farmers. It also brought new hybrid variety of coconut to the member farmers
and had corporate linkage for sale of nuts. Seeds PCs also provided crop and livestock
insurance which was innovative as it reduced risk. They also sold to institutions and even
arranged loans for members. Theni goat PC trading in goat markets and also franchising meat
shop were important innovative best practices.
In M.P., ASA promoted Ranapur Mahila PC stated that its seed production intervention was
very successful. Its other innovations included: scaling up and branding of produce. The
AKRSPI promoted Nevali PC saw its own brand in bio-inputs and focus on output marketing
as best practices. The other innovations included: decentralized procurement and quality seed
production. On the process innovations, organic farming practices in cotton and other crops in
the same farms including facilitation of market with private market linkages for 7000 of its
12000 farmers in M.P. out of whom 3000 were fully organic across PCs was important
innovation.
The Pandhana goat PC treated own production and marketing of some of the inputs as best
practice. Besides that, it also considered weight based purchase of goats and other animals as
process innovation. Similarly, Theni goat PC using franchisees for meat selling was also an
innovation. On the other hand, Chirayu Women Crop PC had best practice innovations which
included: seed contract farming, distant market trading, and introduction of mechanical
grading. The ram Rahim PPC making use of warehouse receipt based loans for storing its
produce in its own warehouses and participation in futures markets were its innovations and
best practices.

318
NDDB’s model of promoting milk PCs is based on certain rules of governance to enhance
patronise cohesiveness and governance and operating effectiveness which are: one, they will do
business with only members, new members can join only during specific windows in each year
and only those with minimum supplies of milk can vote. They have to maintain a ratio of 3:1
flush to lean milk supply and they have to increase their shareholding after one year; two, there
are classes of membership and face value of the share is revalued periodically and old members
can leave the company and retire their equity capital at present valuation besides 20% of the
directors being co-opted experts. This is reflected also in the scale of the milk PCs which are state
level with membership ranging from 23000 to 87000, women being 12 to 100% of the
membership and smallholder 43 to 75% of the membership. The paid up share capital ranged
from 13.8 million to 262 million, milk procurement from 1.7 lac litres to 5.36 lac litres and
business turnover from Rs.868 million to Rs.5968 million in 2014-15. The elected board
members were forbidden from holding any political office and have staggered terms where one
third retire every year/two year.
However, it is also important to discuss other possible best practices for mother contexts which
are relevant within India. First of all, equity mobilisation should be higher in such entities to
create member stakes and interest other business entities in undertaking business with these
companies. It is possible to mobilise more equity from within the membership. For example,
some PCs have attempted variation in shareholding related patronage to mobilise capital. One had
voting rights linked to the patronage and another linked patronage to shareholding. Others had
minimum patronage in terms of sale or purchase transactions annually with the PC to remain
members (NABCONS, 2011). Further, dividends can be used to build equity. Since PCs are
income tax exempt now for five years they should create reserves instead of passing on all the
profits as price benefit. The PCs also lead to define their boundaries in terms of member
treatment versus non-member treatment and membership should be rewarded more than non-
members. Further, PCs can make voting rights proportionate to member business in order to
encourage more involvement of members of the PC (Mahajan, 2015).
The PCs also need to choose their activity portfolio carefully keeping in mind the member
centrality. For this, they should do adequate value chain mapping of the relevant commodity
sector before undertaking any intervention for farmer benefit. It is possible to identify new
activities in local areas which are valuable for small farmers e.g. custom hiring of farm
machinery and equipment which they can’t afford to buy but can rent in. This is being done in
some parts of India viably by private entities and PACS.
Large member base and involvement is crucial as also suggested by NDDB experience across
states to achieve economies of scale and scope and obtain member centrality and patronage.
PCs can also be made more gender inclusive by making both spouses (or one male and another
female member) from the same household. Further, like the NGCs, they can also restrict
membership by byelaws to remain viable and not become unwieldy in terms of membership
size.
Further, though PCs are generally focused on small producers to achieve inclusiveness, there
is some merit in mixed member PCs in terms of farmer base as that helps achieve scale and

319
mobilise more equity. It is also argued that if they are composed of only small and marginal
producers, they find it difficult to break even sooner, and later, due to small scale of their
operations, bringing in larger farmers at a later stage creates problems of governance as it was
originally designed with patronage cohesiveness.
Initial spadework in member mobilisation is a must with wide stakeholder consultations, and
some pre-existing structures of collectivisation like WUAs, FIGs are helpful as it takes time to
make farmers appreciate that they are building their own enterprise.
PCs can be supported by various types of stakeholders like government, development NGOs,
alternative trading agencies, donors, or private agribusinesses, but, the promoter should have a
definite time bound withdrawal strategy for PCs to become self-sustaining. It’s also important
to have the basic units of producer company organization at a local level legally structured
which can also undertake some business activities. Therefore, only informal collectives
building up to the producer company may not be desirable.
In order for PCs to achieve producer risk reduction (production and market), they should
involve in contract farming, and crop insurance facilitation and even base their member
economic relations on contract farming type of structure as in a competitive market it is
important to have assured and reliable supplies from members.
For milk PCs, value addition was the mantra for their success. Further, they made payments
directly into the bank accounts of the members. The milk procurement is managed by a single
person called sahayak, and the companies have an asset light business model of owning low fixed
assets and maintaining high asset turnover. Most importantly, member equity dominates capital
structure and healthy retention of earning is practiced to build reserves and raise credit worthiness
(Shah, 2016).
So far as professionalization of PCs is concerned, despite limitations of ability to hire
competitive staff, the provision of expert Directors in BoD should be used to bring in skills and
market knowledge for both cost and quality competitiveness.
On the financing front, the FWWB role in their financing of PCs needs to be appreciated as
they have designed innovative products for PCs since 2011 and today they have financed 80
such FPOs, mostly PCs in terms of working capital to PCs, Co-ops and societies for
procurement of output, credit services to members, input supply, and infrastructure with first
two dominating the loans . The loans were of the order of Rs. 24 crores in 2017-18 and total
financing since 2011-12 has been of the order of Rs. 61 crore. Every year, 20-30 POs are
supported with Rs. 5-10 crore loans at the interest rate of 12-14% and for a maximum of 18
months (FWWB, 2018). The banks and NBFCs need to learn from this and design more
innovative FPO relevant loan products.
Another best practice includes the entry into fair trade channel by some PCs in groundnut in
Gujarat and coffee in Karnataka wherein their produce is going into processing by well

320
recognised companies in India. More of such markets should be explored as a part of global
and national value chains and networks to capture value for member producers.
Good business plans and strategy is a must to compete in a globalised market and to attract
funding. Therefore, adequate attention need to be paid to this aspect where special support can
be provided to help PCs come up with robust business plans which need not be based only on
existing crops and local enterprises of members.
There are cases of some PCs in Maharashtra creating JVs/subsidiaries for scale and external
capital which is quite innovative and gives leads to others to follow suit to overcome capital
and other constraints. Some well established PCs can take that route. Also, franchising is a
mechanism to cut costs and reach larger markets for famr inputs and services and even output
handing. Many PCs and agri startups are using this for some time now and this needs to be
adopted by more PCs.

321
Table 7.8: Crop and channel wise sale of output by all PC members across five states (2019 v/s 3 years before)
Channel Total Wholesale APMC Retail PC CF
Farmers
and Produce Farmers Produce Farmers Produce Farmers Produce Farmers Produce Farmers Produce Farmers Produce
Parameter
Bef
ore
Af
ter
%
diff
Bef
ore
Afte
r
%
diff
Bef
ore
Af
ter
%
diff
Bef
ore
Afte
r
%
diff
Bef
ore
Af
ter
%
diff
Bef
ore
Aft
er
%
diff
Bef
ore
Af
ter
%
diff
Bef
ore
Af
ter
%
diff
Bef
ore
Af
ter
%
diff
Bef
ore
Aft
er
%
diff
Bef
ore
Af
ter
%
diff
Bef
ore
Af
ter
%
diff
Avocado 4 4 325.
5
315.
5
-
3.07
4 3 -
25.
00
325.
5
15.5 -
95.
24
1 30
0
Banana 5 6 20.
00
765 820 7.19 2 3 50.
00
100 130 30.
00
2 2 590 590 1 1 75 100 33.
33
Barley 4 4 152 152 3 3 102 102 1 1 50 50
Black Gram 25 25 100.
8
133.
55
32.4
9
21 9 -
57.
14
90.2
5
30 -
66.
76
1 1 0.7
5
0.7
5
3 15 400
.00
9.8 102
.8
948
.98
Brinjal 2 2 15.6 15.6 2 2 15.6 15.6
Chilli 21 22 4.7
6
256.
3
270.
5
5.54 20 19 -
5.0
0
244.
3
241.
5
-
1.1
5
1 1 12 12 2 17
Coconut 4 4 960
0
960
0
3 2 -
33.
33
710
0
670
0
-
5.6
3
1 400 1 1 250
0
25
00
Coffee 14 14 97.5 97.7
5
0.26 13 13 92.5 94.7
5
2.4
3
1 1 5 3 -
40.
00
Coriander 6 6 77 81.5 5.84 6 6 77 81.5 5.8
4
Cotton 38 42 10.
53
336.
75
403 19.6
7
31 27 -
12.
90
255.
75
244 -
4.5
9
2 2 32 32 5 13 160
.00
49 127 159
.18
Drumstick 3 3 65 85 30.7
7
1 1 25 25 2 2 40 60 50.
00
Flat Gram 7 7 35.0
8
38 8.32 5 2 -
60.
00
33.0
8
30 -
9.3
1
2 5 150 2 8 300
Fruits 8 8 498.
5
569.
5
14.2
4
7 5 -
28.
57
428.
5
369.
5
-
13.
77
1 1 70 70 2 130
Garlic 12 12 114
5
890.
5
-
22.2
3
4 4 33 33.5 1.5
2
8 8 111
2
857 -
22.9
3
Gram 32 33 3.1
3
485.
7
503.
2
3.60 28 26 -
7.1
4
467.
2
466.
7
-
0.1
1
3 3 17 17 1 4 300 1.5 19.
5
120
Green Gram 25 25 226.
3
229.
05
1.22 20 14 -
30.
00
124 110.
5
-
10.
89
2 2 94 94 1 1 1.5 0.7
5
-
50.
00
2 8 300 6.8 23.
8
250
Groundnut 17 17 115.
5
148.
9
28.9
2
13 9 -
30.
77
102.
5
87 -
15.
12
1 1 10 10 3 7 133
.3
3 51.
9
163
Jasmine 2 2 0.4 1.3 225 1 1 0.1 0.1 1 1 0.3 1.2 300
Jute 6 6 99 99 6 6 99 99
Maize 72 78 8.3
3
197
3.7
212
3.1
7.57 56 46 -
17.
86
163
0
136
1
-
16.
50
9 11 22.
22
185 275 48.6
5
1 1 0.7
5
0.7
5
6 19 216
.67
158 486
.4
207
.85
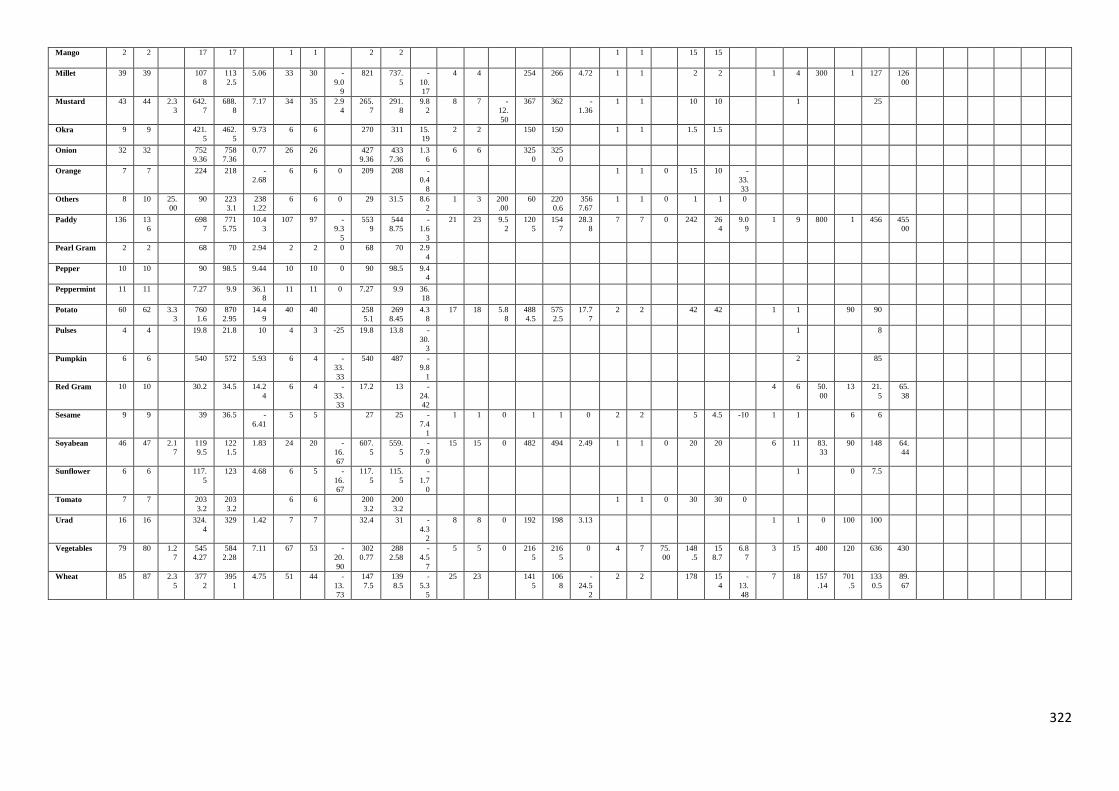
322
Mango 2 2 17 17 1 1 2 2 1 1 15 15
Millet 39 39 107
8
113
2.5
5.06 33 30 -
9.0
9
821 737.
5
-
10.
17
4 4 254 266 4.72 1 1 2 2 1 4 300 1 127 126
00
Mustard 43 44 2.3
3
642.
7
688.
8
7.17 34 35 2.9
4
265.
7
291.
8
9.8
2
8 7 -
12.
50
367 362 -
1.36
1 1 10 10 1 25
Okra 9 9 421.
5
462.
5
9.73 6 6 270 311 15.
19
2 2 150 150 1 1 1.5 1.5
Onion 32 32 752
9.36
758
7.36
0.77 26 26 427
9.36
433
7.36
1.3
6
6 6 325
0
325
0
Orange 7 7 224 218 -
2.68
6 6 0 209 208 -
0.4
8
1 1 0 15 10 -
33.
33
Others 8 10 25.
00
90 223
3.1
238
1.22
6 6 0 29 31.5 8.6
2
1 3 200
.00
60 220
0.6
356
7.67
1 1 0 1 1 0
Paddy 136 13
6
698
7
771
5.75
10.4
3
107 97 -
9.3
5
553
9
544
8.75
-
1.6
3
21 23 9.5
2
120
5
154
7
28.3
8
7 7 0 242 26
4
9.0
9
1 9 800 1 456 455
00
Pearl Gram 2 2 68 70 2.94 2 2 0 68 70 2.9
4
Pepper 10 10 90 98.5 9.44 10 10 0 90 98.5 9.4
4
Peppermint 11 11 7.27 9.9 36.1
8
11 11 0 7.27 9.9 36.
18
Potato 60 62 3.3
3
760
1.6
870
2.95
14.4
9
40 40 258
5.1
269
8.45
4.3
8
17 18 5.8
8
488
4.5
575
2.5
17.7
7
2 2 42 42 1 1 90 90
Pulses 4 4 19.8 21.8 10 4 3 -25 19.8 13.8 -
30.
3
1 8
Pumpkin 6 6 540 572 5.93 6 4 -
33.
33
540 487 -
9.8
1
2 85
Red Gram 10 10 30.2 34.5 14.2
4
6 4 -
33.
33
17.2 13 -
24.
42
4 6 50.
00
13 21.
5
65.
38
Sesame 9 9 39 36.5 -
6.41
5 5 27 25 -
7.4
1
1 1 0 1 1 0 2 2 5 4.5 -10 1 1 6 6
Soyabean 46 47 2.1
7
119
9.5
122
1.5
1.83 24 20 -
16.
67
607.
5
559.
5
-
7.9
0
15 15 0 482 494 2.49 1 1 0 20 20 6 11 83.
33
90 148 64.
44
Sunflower 6 6 117.
5
123 4.68 6 5 -
16.
67
117.
5
115.
5
-
1.7
0
1 0 7.5
Tomato 7 7 203
3.2
203
3.2
6 6 200
3.2
200
3.2
1 1 0 30 30 0
Urad 16 16 324.
4
329 1.42 7 7 32.4 31 -
4.3
2
8 8 0 192 198 3.13 1 1 0 100 100
Vegetables 79 80 1.2
7
545
4.27
584
2.28
7.11 67 53 -
20.
90
302
0.77
288
2.58
-
4.5
7
5 5 0 216
5
216
5
0 4 7 75.
00
148
.5
15
8.7
6.8
7
3 15 400 120 636 430
Wheat 85 87 2.3
5
377
2
395
1
4.75 51 44 -
13.
73
147
7.5
139
8.5
-
5.3
5
25 23 141
5
106
8
-
24.5
2
2 2 178 15
4
-
13.
48
7 18 157
.14
701
.5
133
0.5
89.
67

323
Table 7.9: State wise distribution of PC members by schemes and subsidies information provided by PCs
State > All TN WB UP MP Rajasthan
Parameters > No of members
% of total No of members
% of total No of members
% of total No of members
% of total No of members
% of total
No of members % of total Scheme and subsidy info
Agri Machinery 4 1.14 3 2.86 1 1.56
Animals and Poultry 2 0.57 2 1.9
Drip & Sprinkler irrigation
3 0.85 3 2.86
Drumstick farming 2 0.57 2 1.9
horticulture and floriculture
1 0.28 1 0.95
Loan and other details
5 1.42 2 1.9 3 4.68
Subsidized inputs 22 6.25 17 16.19 2 3.12 3 5.88
Via Voice mail/ SMS 4 1.14 4 3.81
Loss Management during Bulbul storm
1 0.28
1 1.56
Yes 54 15.34 8 7.62 12 18.75 7 13.72 14 17.28 13 25.49
No 254 72.16 63 60 45 70.31 41 80.39 67 82.72 38 74.51
Total 352 100 105 100 64 100 51 100 81 100 51 100
Table 7.9A: State-wise composition of membership of PCs (excluding all women PCs) by gender
State UP MP Rajasthan WB TN Total
Parameter> Gender
No. of Members
%age in total
No .of Members
%age in total
No. of Members
%age of total
No. of Members
%age of total
No. .of Members
%age of total
No. of Members
%age of total
Female 1 2.0 10 25.0 10 24.4 1 1.8 36 38.7 48 17.8
Male 50 98.0 30 75.0 31 75.6 53 98.2 57 61.3 221 82.2
Total 51 100 40 100 41 100 54 100 93 100 269 100

324
Table 7.10: State-wise Distribution of PC members by subsidy availed
State > All TN WB UP MP Rajasthan
Parameters >
No of members
% of total No of members
% of total No of members % of total No of members
% of total No of members % of total No of members % of total Special Subsidy for PC member
Input Subsidy 14 3.98 2 3.12 1 1.96 5 6.17 6 11.76
Loan 55 15.6 55 42.38
Machine and Loan Subsidies
3 0.85
2 3.12 1 1.96
No 280 79.55 50 47.62 60 93.75 49 96.08 76 93.83 45 88.24
Total 352 100 105 100 64 100 51 100 81 100 51 100
Table 7.12: State –wise Distribution of PC members by their perception of frequency of meetings of the PC
State > All TN WB UP MP Rajasthan
Parameters > No of
member % of total
No of members % of total No of members % of total No of members % of total No of members % of total No of members % of total Meeting frequency
Annually 36 10.23 8 7.62 3 4.69 5 9.80 16 19.75 4 7.84
Biannually 21 5.97 8 7.62 3 4.69 5 9.80 1 1.23 4 7.84
Quarterly 56 15.91 18 17.14 7 10.94 12 23.53 11 13.58 8 15.69
Monthly 199 56.53 48 45.71 41 64.06 27 52.94 51 62.96 32 62.75
Weekly 13 3.69 4 3.81 6 9.38 1 1.96 1 1.23 1 1.96
Don’t Know 27 7.67 19 18.1 4 6.25 1 1.96 1 1.23 2 3.92
Total 352 100 105 100 64 100 51 100 81 100 51 100

325
Table 7.11: State-wise Distribution of members of PCs for dislike of services offered by the PC
State > All TN WB UP MP Rajasthan
Parameters > No of member
% of total
No of members % of total No of members % of total No of members % of total No of members % of total No of members % of total Disliked Services
High Costs 4 1.14 1 0.95 1 1.56 2 2.47
High Costs, Not available on time
2 0.57 1 0.95
1 1.96
Inadequate quantity 7 1.99 4 6.25 3 5.88
Inadequate quantity, not available on time
4 1.14
1 1.56
3
3.70
Lack of choice 4 1.14 1 1.56 1 1.96 1 1.23 1 1.96
Lower Price realization 7 1.99 1 0.95 5 9.8 0.00 1 1.96
No Accessibility 8 2.27 2 1.9 2 3.13 4 4.94
No Accessibility, High Costs 3 0.85 1 0.95 2 2.47
No Accessibility, High Costs, Not available on time
2 0.57 1 0.95 1 1.56
No meetings 2 0.57 1 1.56 1 1.23
Non-members given equal importance
1 0.28
1 1.96
Not available on time 11 3.13 1 0.95 2 3.13 8 15.69
Not available on time, Not Active
2 0.57
1 1.56 1
1.23
Not in Procurement 7 1.99 5 9.8 1 1.23 1 1.96
Nothing 276 78.41 96 91.43 49 76.56 25 49.02 60 74.07 46 90.20
Poor quality 4 1.14 1 1.56 3 3.70
Too many meetings 1 0.28 1 0.95
Unavailability 3 0.85 3 5.88
No Animal Insurance 1 0.28 1 1.96
Lack of training 3 0.85 3 3.70
Total 352 100 105 100 64 100 51 100 81 100 51 100

326
Table 7.13: State –wise Distribution of PC members by their frequency of attendance in meetings of the PC
Table 7.14: State wise Distribution of PC members by intention to continue as members
State > All TN WB UP MP Rajasthan
Parameters > No of member
% of total No of members % of total No of members % of total No of members % of total No of members % of total No of members % of total Continue as member
No 46 13.07 18 17.14 3 4.69 1 1.96 24 29.63 0 0
Yes 306 86.93 87 82.86 61 95.31 50 98.03 57 70.37 51 100.00
Total 352 100 105 100 64 100 51 100 81 100 51 100
Table 7.15: State-wise distribution of members by intention to encourage others to become members of the PC
State > All TN WB UP MP Rajasthan
Parameters > No of member
% of total No of members % of total No of members % of total No of members % of total No of members % of total No of members % of total Encourage others
Yes 281 79.83 81 77.14 45 71.31 36 70.57 69 85.19 50 98.04
No 71 20.17 24 22.86 19 29.69 15 29.43 12 14.81 1 1.96
Total 352 100 105 100 64 100 51 100 81 100 51 100
State > All TN WB UP MP Rajasthan
Parameters > No of member
% of total No of members
% of total No of members
% of total No of members % of total No of members
% of total No of members % of total Frequency
Every time 175 49.72 51 48.57 31 48.44 18 35.29 42 51.85 33 64.71
Sometimes 89 25.28 17 16.19 20 31.25 28 54.90 20 24.69 4 7.84
Occasionally 36 10.23 11 10.48 8 12.50 2 3.92 7 8.64 8 15.69
Never 52 14.77 26 24.76 5 7.81 3 5.88 12 14.81 6 11.76
Total 352 100 105 100 64 100 51 100 81 100 51 100

327
Table 7.16: State-wise Distribution of PC members by suggestions for new products/services
State > All TN WB UP MP Rajasthan
Parameters > No of
members % of total
No of
members % of total No of members % of total No of members % of total No of members % of total No of members % of total
Product/ Service suggestion
Add members and villages 2 0.57 2 1.9
Home based livelihood 1 0.28 1 1.10
Banking system 1 0.28 1 1.56
Field visits 1 0.28 1 1.96
Hybrid Seeds, Proper Training 1 0.28 1 1.56
Inputs and information 21 5.97 2 3.13 13 14.29 6 11.76
Inputs at lower cost and timely, Procurement 21 5.97 4 6.25 9 17.64 6 6.59 2 3.92
Insurance 3 0.85 1 0.95 2 3.92
Irrigation, transport, wild animals, rainwater
harvesting/watershed 4 1.14 1 0.95 3 6.26
Labelling Machine 1 0.28 1 1.56
Loan 2 0.57 1 1.56 1 1.96
Loan & Input subsidies 15 4.26
12 11.43 1 1.56 1 1.96 1 1.10
Market opportunity 2 0.57 1 1.56 1 1.96
Milk/ Poultry Society 1 0.28
1 0.95
More Schemes and subsidies 2 0.57 2 2.20
More varieties of inputs, bigger tractors,
computers 2 0.57 2 3.92
Need loan, more land, solar power, better
seeds, subsidy, wild animal control 1 0.28 1 0.95
No proper guideline, better fertilizers,
schemes, funds, income, cows and oxen 1 0.28 1 0.95
Organic Products 3 0.85 1 0.95 1 1.56 1 1.10
Procurement 39 11.08 11 10.48 5 7.81 7 13.72 8 8.79 8 15.69
Procurement and Warehouse 2 0.57 2 2.20
Rented Agri Machineries 10 2.84 1 0.95 2 3.12 7 13.72
Storage, Weighing scale 3 0.85 3 5.88
Timely Availability 7 1.99 1 0.95 5 7.81 1 1.96
Timely availability and accessibility 1 0.28 1 1.56
Timely availability, experts 1 0.28 1 1.56
Timely Availability, no corruption 2 0.57 2 3.13
Timely Input services 9 2.56 6 5.71 3 3.30
Trainings 5 1.42 3 2.86 2 3.92
Value Addition 8 2.27 4 3.81 1 1.10 3 5.88
Wall around farm land 1 0.28 1 0.95
Warehouse 3 0.85 1 1.56 2 3.92
Irrigation facilities 3 0.85 2 1.9 1 1.96
More Price realization 3 0.85 3 5.88
Services, get new crops 2 0.57 2 3.92
Encourage to have more animals 1 0.28 1 1.96
Inputs, Market Linkage, Funding 1 0.28 1 1.96
Inputs, Trainings, MSP Sales 1 0.28 1 1.96
Introduce new crops 1 0.28 1 1.96
None 164 46.59 56 53.33 31 46.88 17 33.33 43 47.25 17 33.33
Total 352 100 105 100 64 100 51 100 81 100 51 100

328
Table 7.17: State-wise Distribution of PC members by their suggestions for improvement of governance of PC
State > All TN WB UP MP Rajasthan
Parameters > No of
members % of total
No
of
members
% of total No of
members % of total No of members % of total No of members % of total No of members % of total
Governance suggestion
Develop trust in the PC 1 0.28 1 1.10
More involvement 2 0.57 1 1.96 1 1.96
More men need to be involved in PC 4 1.14 1 1.10 3 5.88
Old members should be removed 1 0.28 1 1.10
Change Chairperson and Secretary every term 1 0.28 1 0.95
Professionalism, More Corporate Structure 1 0.28 1 0.95
Should inform aboout meetings 4 1.14 1 0.95 1 1.56 1 1.96 1 1.96
Should work honestly 1 0.28 1 1.10
They don’t talk to us, so no point 1 0.28 1 1.96
More funding 2 0.57 2 3.92
More funding, Remove inactive members 1 0.28 1 1.96
None 333 94.60 102 97.14 63 98.44 48 94.12 77 96.62 43 84.31
Total 352 100 105 100 64 100 51 100 81 100 51 100
Table 7.18: State-wise Distribution of PC members by suggestions for better management of PC
State > All TN WB UP MP Rajasthan
Parameters > No of
members % of total No of members % of total No of members % of total No of members % of total No of members % of total No of members % of total
Management suggestion
Accountability 3 0.85 3 2.86
Business Plans 3 0.85 1 0.95 2 2.20
Buy more quantity of inputs 1 0.28 1 1.56
Communication regarding meeting 4 1.14 1 0.95 3 4.69
Don’t do business on credit 1 0.28 1 1.10
Fund management, add new villages 1 0.28 1 0.95
Include more members 7 1.99 3 2.86 4 4.40
More Employees needed 3 0.85 1 0.95 2 3.92
Needs improvement 1 0.28 1 1.10
None 317 90.06 92 87.62 57 89.06 49 96.08 73 80.22 46 90.20
Regulated Meetings 1 0.28 1 0.95
Better farmer representation geographically 1 0.28
1 0.95
Subsidised farmer centre, farmer
office, dividend 1 0.28 1 0.95
Trained Staff/ Professionals 5 1.42 5 9.80
Weekly Meetings 3 0.85 3 4.69
Total 352 100 105 100 64 100 51 100 81 100 51 100

329
7.3 State specific problems of PCs and recommendations
The PCs in U.P. other than the milk PC were modest in their profile and performance with one
still making small losses. Though most of them had moved out of loss making but that
happened after 5-6 years of existence. Still thy were small in membership numbers hovering
around 1000 each. In case of at least one of the four, revenue was also very small even after 5
years. But, they had good portfolio of contract farming and banana as new crop in at least two
cases and other one had tried contract farming unsuccessfully.
Most of the PCs in U.P suffered shortage of working and some of them even shortage of
qualified human resources to manage the PCs besides issues of internal governance which
included poor member awareness and poor BoD capability to oversee and guide the affairs of
the PC. The poor working and fixed capital led to poor coverage of members for farm services
and problems in engaging with produce markets.
In Rajasthan, besides the typical problem of shortage of working capital and professional
human across PCs, the governance of the PCs was a major concern in terms of inactive BoD
or some members dominating the PC. For example, in one PC, multiple members from same
hhs (250) has membership in PC (500 members). This was further accentuated due to the fact
that most promoters were not locally based and had promoted the PCs as projects for SFAC
for limited period. Therefore, constant oversight and hand holding from local promoter was
missing.
There were also other reported problems in Rajasthan for PCs like high interest loans (13-15%)
and lack of storage space as there are only 540 godowns in the state and cold storage exists
only in 9% markets, many of which are not covered under warehouse receipts system (GoR,
2017).
MP PCs also reported working capital shortage and high interest rate for loans in most cases
besides the poor member awareness of their stakes and role in making the PC work. This was
reflected in poor awareness of the farmer ownership of PC and poor market orientation of
members which are more about internal governance. The poor handling of PC busines like
unsold stocks, competition from private sector and PACS, lack of availability of organic seeds
were other reported challenges. In one case, large farmers and their lack of involvement in PC
affairs and political affiliation and interference by large farmers also led to decline of the PC.
The PCs in WB faced lack of staff, and working capital, besides poor governance especially at
BoD level and lack of awareness among members emerged as major issues. Most of these were
internal challenges, though there were also external challenges like spurious seed potato supply
in one case, local competition, and lack of government support for engaging in procurement at
MSP in some cases.
Tamilnadu was no different on many of these aspects of PC governance and management and
problems included: Shortage of working capital and lack of professional staff, poor BoD
governance (manipulation and lack of engagement), poor member awareness, poor govt.

330
support for bio inputs, lack of infrastructure like storage space, local competition and even
locational disadvantage in one case.
Lack of staff was reported as a major problem in the exploratory study of FPCs in Maharashtra
where out of 13, 61% did not have any staff other than the CEO and 69% had not appointed
any one as CEO where Chairpersons performed this role (Badayta et al, 2018). It also
corroborates the working capital problem faced by PCs when it states that 40% of the study
FPCs which had applied for cash credit limit (CCL) had been denied it by Public Sector Banks
due to lack of solid track record for three years and lack of collateral besides defaulting by
some of the BoDs.
One of the concerns which still remains is low equity mobilisation across most of the PCs
across states which puts limits on the volume of loans and business they can undertake. This
was true of various PCs (13) promoted by three different promoters like NABARD, SFAC and
MACP in Maharashtra where the authorised equity was mostly Rs. 10 lakh and mobilised
capital remained within 10-61% and more commonly within 50% of authorised capital even
after 4-5 years of PC being set up. This was so as share value was only Rs. 1000 (Badayta et
al, 2018). Though the case study PCs had somewhat better performance on this aspect than
those in Maharashtra, it was still small by any measure.
7.4 Policy Recommendations
Given the relatively large size of land holdings of the PC members compared with those of
non-members, there is need to seek membership of marginal and landless categories
proactively to make the FPC journey more inclusive and impactful. This does not deny the
fact that mixed membership still retains its rationale to gain scale and scope. This is only to
highlight that those already excluded from other networks like institutional credit and produce
market or traditional co-operatives need to be roped in as they need the FPCs much more than
any other category of land owner or rural producer.
One of the most important findings of the study is that the output linkages still remain poor
across most PCs and therefore, the impact on farmers is limited. This was also one of the
important suggestions by the farmers when asked about how PC performance could be
improved and PCs made more useful for them. There were many cases of PCs procuring for
the government in pulses and oilseeds and in cereals in some cases but that was more to avail
of the MSP and to earn some revenue for the PC and was limited in coverage and volumes. On
the other hand, some PCs engaged in contract farming with private agencies like in potato or
drumsticks or even seeds and that benefited farmers in terms of growing a new high value crop
as well as realising assured and better prices especially because these crops did not have MSP
protection. This becomes important in the recent context of the new contract farming Act 2020
implemented by the Union Government which provides a freer environment for contracting
agencies to work with farmers and it is here that PCs can play an important role as
intermediaries or facilitators between the farmer members and contracting agencies to make
smallholders attractive to such agencies because PC intervention can lower the transaction cost
for the PC and bring large number of producers into the contract farming net which is much

331
needed. Even in Maharashtra out of the 13 PCs studied, five were mainly dependent on SFAC
linkage for public procurement of pulses at MSP and only two had developed corporate
linkages with agencies like Pepsi for potato and Amul for milk and fresh procure supermarkets
for vegetables (Badayta et al, 2018). In fact, PCs should pro-actively engage in contract
farming with their members for their own procurement as well as for supplying to processors
and exporters until they have those capacities. This can help build more robust supply chains
to earn buyer confidence and also earn farmer goodwill by bringing stable and assured prices
to farmer members.
It was also observed that some promoters are too small to make any difference in terms of scale
of farmer organization under the PC structure. For example in Uttar Pradesh there were dozens
of promoting agencies which had organized only one or two PCs each. Further, many of the
promotors not belonging to the local areas, unlike the traditional NGOs, did create large
number of PCs but since they were not organically linked with local communities and
organized these PCs more as projects, the viability and sustainability of such PCs was in
question as seen in many cases in Rajasthan, Uttar Pradesh and Madhya Pradesh. The recent
guidelines on promotion of FPOs with the help of cluster based business organization
(CBDOS) can lead to multiplication of such PCs which may not have any one to look after
them after the project duration and funding ends though the provision of longer term for support
provided in the guidelines can help prevent such a phenomenon.
Though most of the PCs were composed of very small and marginal landholders and even
landless in some cases, there were a few e.g. the one in Madhya Pradesh and another in
Rajasthan which had medium and large farmers as members and that was one of the reasons
that one of them was a non-starter from the beginning and the other one also could not
undertaken any major business activity as there was no felt need for such collectivisation.
The experience of West Bengal and Tamil Nadu also shows that public support in the form of
infrastructure and marketing opportunity can also help PCs scale up and turn profitable sooner
or later. This was the case with PCs in West Bengal which had franchise rights of Sufal Bangla
supermarkets as operational entities which led to many farmers selling vegetables and fruits to
these outlets which had very high number of footfalls and turnover. Similarly, in Tamil Nadu,
the handing over of Tamil Nadu supply chain management (TNSCM) owned processing and
warehouse infrastructure facilities gave a jump start to the PCs. In both cases, this was given
on competitive bidding bases.
The new market Acts of the Union Government provide many new opportunities like stocking
exemption for food products from the ECA which they can use if they have warehousing
facilities. Innovations in warehousing close to growing areas like by starts ups like Ergos and
Arya Collateral warehousing and even NCML can help PCs help farmers realise better prices
and get out of the compulsion of selling immediately after harvest due to the interlocked
transactions with local traders and moneylenders. The warehouse receipts Act provides for this
facility of loans against produce but physical infrastructure was missing earlier though it is still
inadequate. The PCs should proactively hire or lease in such warehouses or make locals invest
in them as managed by Ergos and PC then can manage them for their members and non-

332
members benefit. Also, the new Trade and Commerce Act, 2020 also frees FPOs/PCs from any
permission and payment of market fee to the local APMCs and they can buy directly from
farmers and even undertake contract farming activity to compete with private entities.
To deal with working capital and investment capital problems of the PCs, working capital
provision under priority sector needs to be activated to give loans w/o collateral for a limited
period. The banks should be asked to give collateral free loans to FPCs as they do to the SMEs.
The interest charged to FPOs should be priority sector interest rate as applicable to farmer and
it should be collateral free upto Rs. 25 lakh. The RBI mandate of extending upto Rs. two crore
loans to PCs under priority sector lending as direct agricultural credit and upto Rs. five crore
under indirect agricultural finance needs to be enforced. Infact, there could be even sub-targets
for FPOs under the PSL norms for indirect finance.
Since FPOs are like MSMEs, it is possible to mandate a pat of all government purchases of
food and fibre thru FPOs and even food supermarkets required to buy atleast 25% from FPOs
like there is a provision in FDI in retail policy for MSMEs.
The NABARD proposal to set up infra fund guarantee subsidiary for FPOs is welcome and it
should also cover crop FPOs not just animal husbandry and fisheries.
More training and capacity building for members and BoD required to create awareness and
engagement and more equity. Professional raining for staff also required. Infact, there could be
tie ups with rural management and agribusiness management colleges to train professionals for
such roles which is more than simple agribusiness management. The co-operative training
colleges at the state level should move to include FPCs under their mandate and train their BoD
and executives as now NCDC is also involved in promoting FPOs.
The FPOs can benefit from ECA, 2020 if they have warehouses and are into processing,
storage, packing, transport and distribution- any activity which adds value. The FPOs also
should proactively make us of ECA, 2020 now to store produce in warehouses and avail loans
against it from banks. Further, the Farmer Produce Trade and Commerce Act, 2020 provides
for e-markets by FPOs. This was earlier allowed in the APMC Acts where private wholesale
markets could be set up by such collectives and there a few dozen such markets set up by FPC
in Maharashtra already operating under the APMC Act. But, the Trade and Commerce Act,
2020 and the contract farming Act, 2020 both include the FPO under the definition of a farmer.
But, no FPO is involved in production as most of them are into pre- and post-production
aggregation, trading and value addition. This needs to be changed to make FPOs buyers of farm
produce in their own right and even contracting agencies which many of them are as they
undertake seed contact farming with their members.
The state government need to step in as they are located close to these entities and should frame
definite policies and programs for organising and supporting FPCs no just implement central
schemes about it. Some states like Punjab, Kerala and Odisha have moved in this direction with
policy and this needs to be encouraged and supported.

333
The Government of Kerala’s 2015 Agricultural Development Policy has a separate chapter on
FPO policy and provides for promotion of FIGs and FPOs by handholding them with the
provision of an expert for each FPO for professional management and extending all policy
benefits at par with co-operatives and also engaging them as agents in public procurement at
MSP for various crops and implementing agencies for various government programs. It even
provides for restricting the ‘rice and coconut bioparks only to FPOs. Interestingly, it even gives
the credit provision role to FPOs for their farmer members for various farm activities and
investment like purchase of farm machinery or construction of wells or laying of pipelines, and
role of bringing crop insurance and other risk protection for its members. For promotion of
FPOs, the state SFAC is proposed as the RI in the state to train both BoD and professional
staff for smooth functioning of FPOs and recommends an incubation period of 18-24 months
before a PC is registered (GoK, 2015).
Punjab’s FPOs policy of 2020 though does not commit any resources for promotion of FPOs
from the state government but it has also included private limited and public limited companies
under the Companies Act, 2013 also as FPOs which is likely to be misused if not monitored
and checked carefully as any family and its members can also float a private limited company
and all public limited companies need not adhere to norms of an FPO. Further, it stipulates that
no political or electoral interferences would be made in the working of FPO in any way. Again
this is easier said that done. The Policy treats FPOs at par with co-operatives and corporations
which is again surprising as no other state policy treats FPOs at par with corporations.
Additionally, it also provides for facilitating contract farming between FPOs and bulk buyers.
Like other states, it also provides for FPOs acting as procurement agents for MSP based
procurement of various crops for PDS. Infact, it says that it would treat them as ‘arthiyas’ in
the mandis and would be given preferences over individuals and other organisations. Further,
like other states, FPOS would be allowed as implementing agencies for various agricultural
development programs of the central and state government and other organisations.
Unfortunately, it makes Punjab Agro Export Corporation (PAGREXCO) as the nodal agency
despite the fact that is is an export corporation. This nodal agency would appoint FPO Mittar
for helping FPOs on day to day basis for their operations and for preparing business plans. The
state level committee would have two nominated FPO representatives while other members
include: various departmental officials and agricultural and veterinary university vice-
chancellors and there is a provision for co-opting other officials. The only definite incentive
specified is that all incentives under the state industrial business development policy 2017
would be available to all registered FPOs (GoP, 2020).
Odisha’s FPO policy (2018) is very comprehensive and provides for treating PCs at par with
co-operatives and provides for single window clearance system for all approvals at the
department of agriculture and farmer empowerment. It even aims to provide land for FPOs at
concessional rate for setting up exclusive storage, sorting, grading yards and processing plants.
It also advises the state agricultural universities to introduce courses on FPOs in their rural
management or agribusiness management programs with a provision for one time capital grant
of upto Rs. 50 lakh for such course and provision for reimbursement of student fees for such
courses upto Rs. 10,000.Besides, there is a provision of 50% course fee reimbursement for FPO

334
course fee for training run by BIRD as back ended subsidy. It has also allocated a corpus fund
of Rs. 100 crore per year for promotion of FPOs with maximum seven year time frame.
Directorate of Horticulture is the nodal agency for FPO promotion in the state with each
department having its own RI and project management unit (PMU) at directorate level. Each
FPO would be eligible for investment promotion subsidy @ 50% of the value of fixed assets
for purposes not specified but relevant. They are also exempted from stamp duty on loan
agreements, credit deeds, mortgage and hypothecation for availing loans or lease deeds , lease-
cum sale and absolute sale deeds for purchase of sheds, plots and godowns at the rate of 100%
if used for office or retail or wholesale outlet or godown or processing or grading and sorting
yard or similar purpose. The registration charges for loan documents, lease deeds and sales
deeds entered into by FPOs are reduced to Re. 0.50 per Rs. 1000 irrespective of size of FPO.
These two exemptions are also applicable to lands purchased and converted landed used by
FPOs for various purposes specified and similar activities. Further, interest subsidy of 6% per
annum on term loans would be provided to FPOs for period of seven years which would be
paid to various financial institutions on behalf of the FPOs, if the FPO does not default on loan
repayment or interest on it. The state government would also establish an information and
support centre for FPOs at the Directorate of Horticulture (GoO, 2018).
Some states have started supporting FPOs in a big way even without a policy. For example,
Tamilandu has provided Rs. 266.7 crore for financing FPOs thru TN SFAC which would have
three components- mezzanine capital assistance (Rs. 50 crore), credit guarantee (Rs. 50 crore)
and revolving fund (Rs. 166.7 crore). This is to support more than 500 PCs in the state of which
130 are promoted by the state department of agricultural marketing and agribusiness itself. The
credit guarantee fund would provide easy access to bank credit for FPCs with 50% guarantee
against default by the PCs which would be written off eventually by the lending agency. This
would be available for first 3-5 years of a PC. The mezzanine capital would be a margin fund
corpus with a lending agency which would invest in the FPCs in the form of cumulative
redeemable long term preferential capital or debentures at nominal rates, redeemable after five
years (ENS, November 19,2019).
Similarly, Karnataka allocated Rs. 630 lakh in 2017-18 for FPO promotion thru the state SFAC
which was Rs. 936.89 crore in 2016-17(GoK, 2018) but there is no separate policy on FPOs in
the state which has directly promoted 73 PCs across the state.
Bihar government has provided for 25% of the project cost as capital subsidy for FPOs as
against 15% for individuals, partnerships firms and LLPs provided the project cost is at least
Rs. 25 lakh, and it is credit linked. Further, under the PMFMFPES, there is grant of 35% of the
project cost linked with credit as long as it is ODOP produce and has been into it for at least
three years and has turnover of Rs. one crore but they need to put in margin money (10% of
the project cost) for working capital and the scheme is also available for common infrastructure
creation. Upto Rs. five lakh can be availed for preparing a branding and marketing DPR with
a ceiling of 50% of the total cost. Under the AIF, there is interest subvention of 3% up to loans
of Rs. two crore and a credit guarantee upto this amount under CGTMSE scheme (GoB,2020).

335
The state governments need to proactively offer APMC licenses to FPOs for commission
agency or trading of agricultural produce as well as engage them in setting up farmer consumer
market yards (FCMY) as provided in the model APLM Act, 2017.
The state governments can also provide initial seed capital in the form of grants to FPOs for
undertaking initial business activities and allocate funds for CHCs under ATMA and other
schemes based on need and merit.
Further, the government can incentivise private sector to work with PCs when it undertakes
procurement through contract farming or direct purchase which are now legal. Rather, state
governments can incentivise it by not insisting on bank guarantees or the like or not linking
contract price in any way to the MSP.

336
Appendix 7.1
Table 7.1: Paired t-test for means of owned and operated land holdings of members and non-members
Owned Owned
t-Test: Paired Two Sample for Means (95%) t-Test: Paired Two Sample for Means (99%)
M_Owned _Land NM_Owned_Land M_Owned _Land NM_Owned_Land
Mean 4.50160327 3.421837349 Mean 4.50160327 3.421837349
Variance 41.49777445 19.34216953 Variance 41.49777445 19.34216953
Observations 332 332 Observations 332 332
Pearson Correlation 0.183101348 Pearson Correlation 0.183101348
Hypothesized Mean Difference 0 Hypothesized Mean Difference 0
Df 331 Df 331
t Stat 2.769514217 t Stat 2.769514217
P(T<=t) one-tail 0.002965308 P(T<=t) one-tail 0.002965308
t Critical one-tail 1.649470149 t Critical one-tail 2.337666351
P(T<=t) two-tail 0.005930616 P(T<=t) two-tail 0.005930616
t Critical two-tail 1.9671568 t Critical two-tail 2.590763895
Operated Operated
t-Test: Paired Two Sample for Means (95%) t-Test: Paired Two Sample for Means (99%)
M_Operated_Land NM_Operated_Land M_Operated_Land NM_Operated_Land
Mean 5.342104131 3.8658821 Mean 5.342104131 3.8658821
Variance 74.78922388 24.61253989 Variance 74.78922388 24.61253989
Observations 332 332 Observations 332 332
Pearson Correlation 0.129234285 Pearson Correlation 0.129234285
Hypothesized Mean Difference 0 Hypothesized Mean Difference 0
df 331 Df 331
t Stat 2.862264787 t Stat 2.862264787
P(T<=t) one-tail 0.002237051 P(T<=t) one-tail 0.002237051
t Critical one-tail 1.649470149 t Critical one-tail 2.337666351
P(T<=t) two-tail 0.004474102 P(T<=t) two-tail 0.004474102
t Critical two-tail 1.9671568 t Critical two-tail 2.590763895

337
References
Anil, R K (2019): linking farmer producers and urban consumers for pesticide free and safe
food, in A Kanitkar and S Prasad (eds.): farming futures: emerging social enterprises in India,
Authors Upfront.340-375.
Anonymous (2018): Farmer Producers’ Organizations (FPOs): Status, Issues & Suggested
Policy Reforms, National Paper - PLP 2019-20
Arya CWS and Tata Trusts (2018): A comprehensive study for identification for vibrant FPO
clusters for effective marketing integration, by Arya collateral warehousing services pvt. ltd.
for Tata Trusts, Mumbai.
Bachke, M E (n.d.): Are farmers' organisations a good tool to improve small-scale farmers'
welfare?, an unpublished paper, downloaded on October 24, 2011.
Badayta K C, S Ananthi and Y Sethi (2018): An exploratory study on FPOs in Maharashtra,
CAB (RBI), Pune.
Bhamra, A (2016): Farmer producer Organisations in India, Case Study Compendium,
Development Alternative, New Delhi and HBF, Berlin.
Cherukuri, R. R., & Reddy, A. A. (2014). Producer organisations in Indian agriculture: Their role in
improving services and intermediation. South Asia Research, 34(3), 209-224.
https://doi.org/10.1177/0262728014544931
CIKS (2017): Farmer producer companies- empowerment and livelihood of farmers: case
studies from Tamil Nadu, CIKS Chennai.
Desai, R. M., & Joshi, S. (2014). Can Producer Associations Improve Rural Livelihoods?
Evidence from Farmer Centres in India, Journal of Development Studies, 50(1), 64-80.
Dey, K (2018); Farmer producer companies in India; determinants of performance and
viability, EPW 53 (35), 44-52.
Gowda C, S Dixit and M HL (2018): Women’s Participation in Karnataka’s FPOs, EPW, Vol
LIII no 45, 20-22.
Gersch,I,(2018): Producer organizations and contract farming: a comparative study of
smallholders ‘market strategies in South India, Zeitschrift fur Wirtschftsgeographie, January,
http://doi.org/10.1515/zfw-2017-0026.
Giannakas K, M Fulton and J Sesmero (2016): Horizon and Free-Rider Problems in
Cooperative Organizations, Journal of Agricultural and Resource Economics, September
2016, 372-392
GoB (2020): Bihar Agri Investment Promotion Ecosystem-Creating an enabling ecosystem for
agri investors, Department of Agriculture , Govt. of Bihar, Patna.

338
GoI (2010): West Bengal development Report, Academic foundation, Planning Commission,
GoI, New Dlehi.
GoK (2018): Economic Survey of Karnataka, 2107-18, Department of Planning, program
monitoring and statistics, Bangalore.
GoK (2015): Agricultural Development Policy, Govt. of Kerala, Thiruvananthapuram, chapter
18.
GoO (2018): Odisha Farmer Producer Organisations (FPOs) Policy, 2018 (Draft), Deptt of
Agriculture and Farmers’ Empowerment, Government of Odisha.
GoP (2020): Farmer producer organisations (FPOs ) Policy for state of Punjab, Deptt of
agriculture and farmer welfare, Government of Punjab, Chandigarh.
GoR (2017): Building an enabling FPO ecosystem in Rajasthan-An approach paper,
Department of Agriculture, Govt of Rajasthan.
GoUP (2009): Integrated Watershed Management Program (IWMP) in U.P.-
perspective and strategic plan, 2009-2027, Deptt. of land development and water
resources, Govt. of U.P. (GoUP).
Goyal M (2017): Role of state government in promoting agriculture in Rajasthan: An empirical
study of selected farmer’s satisfaction level, P h D thesis, Univ of Kota, Kota. December.
Gulati, A, P Rajkhowa and P Sharma (2017): Working Paper 339 Making Rapid Strides:
Agriculture in Madhya Pradesh: Sources, Drivers, and Policy Lessons, WP no. 339, ICRIER,
New Delhi, April.
Gupta, A. (2015). Case studies of successful pro-poor value chain models in India. National
Rural Livelihood Project. World Bank. September.
Huang, Z, V Vyas an Q Liang (2015): Famer Organisations in China and India, China
Agricultural Economic Review, 7(4), 601-615.
IIIE (2019): Can collectives help overcome challenges facing small and marginal farmers in
India?, Literature review brief- Agriculture, International Initiative for Impact Evaluation
(IIE), August.
Ito, J, Z Bao and Q Su (2012): Distributional effects of agricultural cooperatives in China:
Exclusion of small holders and potential gains on participation, Food Policy, 37, 700-709.
Jain R and P Narnaware (2018): Role of Local Context in the Success of Farmer Collectives:
A Review, Millennial Asia, 9(3), 318-335.
Kumar, A, P Shinoj and S Jee (2013): Do dairy co-operatives enhance milk production,
productivity and quality? Evidence from the Indo-Gangetic plain of India, IJAE, 68(3), 457-
468.

339
Kumar, A, S Saroj, P K Joshi and H Takeshima (2018): Does co-operatives improve household
welfare? Evidence from a panel data analysis of smallholder dairy farmers in Bihar, India, Food
Policy, 75, 24-36.
Kumar N K and A Kulkarni (2013): Investments by the Commercial Banks in Training of Rural
Communities and its Impact: Scope of Open and Distance Learning, NIBM and
Commonwealth of Learning, NIBM, Pune.
Ma, W and A Abdulai (2016); Does co-operative membership improve household welfare?
Evidence from apple farmers in China, Food Policy, 58, 94-102.
Mahajan V (2105): Farmers’ producer companies: Need for Capital and Capability to Capture
the value added in Access Development Services (Ed.) State of India’s Livelihoods Report
2014, OUP, 2015.
Manaswi BH, P Kumar, P Prakash, P Anbukkani, A Kar, G K Jha, and D U M Rao (2018):Progress and
Performance of States in Farmer Producer Organisation in India, Indian jrl of Ext Edu, 54(2), 108-113.
Manaswi BH, P Kumar, P Prakash, P Anbukkani, A Kar, G K Jha, D U M Rao and V Lenin (2020):
Impact of farmer produce organisation on organic chilli production in Telangana, India, Indian Journal
of traditional Knowledge, 19(1), 33-43.
Mondal S , D Burman, U K Mandal, T D Lama, B Maji and P C Sharma (2017): Challenges,
Options and Strategies for doubling farmers’ income in West Bengal- reflections from Coastal
region, AERR, 30, (conf. number), 89-100..
Mukherjee A, P Singh, R R Burman, Satyapriya, KS Shubha, ML Roy (2019a): Development
of test to measure the knowledge level of famer producers about improvement on hill
agriculture practices, Journal of Community mobilisation and sustainable development, 14 (1),
57-64.
Mukherjee A, P Singh, S Rakshith, Satypriya, RR Burman K Shubha, K Sinha and V Nikam
(2019): Effectiveness of poultry based farmers’ producer organisation and its impact in
livelihood enhancement of rural women, Indian journal of animal sciences, 89(10), 1152-1162.
NABCONS (2011): Integration of Small Producers into Producer Companies-Status and
Scope, NABARD Consultancy Services Pvt. Ltd., Hyderabad.
Nayak A K J R (2013): A report on Producer’s Companies in India, DEAR NABARD,
Mumbai.
Neti A, R Govil and M R Rao (2019): Farmer Producer Companies in India; De-mystifying the
numbers, Review of Agrarian Studies 9 (2).
Neti A, R Govil, and M R Rao (2020): Farmer Producer Companies: Past, Present and Future,
Azim Premji University, Bangalore, March.
Pandian VJ and M Ganesan (2019): Empowerment of farmers through organisation of producer
companies for their yield, Anthropologist, 36 (1-3), 1-12.

340
Prasad, S (2019) Farming as an enterprise: Ten years of FPO movement in India, in State of
Livelihoods Report, ADS, New Delhi.
Patibandla M and T Sastry (2004): Capitalism and Co-operation: co-operative institutions in a
developing economy, Economic and Political Weekly, July 3, 2997-3004.
Purushotham, P (2012): Small producer companies’ participation in retail and commodity
markets: A case study of poor farmers’ SPCs in MP, paper presented at the intl. seminar on
Organised retailing vis-à-vis farm economy of India, September 21-22, at CESS, Hyderabad
by ISAM, CESS and IPE, Hyd.
Raju KV, R Kumar, S Vikraman, S D Moses, Kumara S R, and Charyulu K D and S P Wani
(2017): Farmer Producer Organizations in Andhra Pradesh: A Scoping Study. Rythu Kosam
project. Research Report IDC-16, Patancheru India: International Crops Research Institute for
the Semi-Arid Tropics. 160.
Rani. R C, R Divakar, P G Kumar and R Baburao (2018): Horizontal and Vertical scanning of
FPOs- A project cycle study, CAS, NIRDPR, Hyderabad.
Rosairo, H S R, M C. Lyne, S K. Martin and K Moore (2012): Factors Affecting the
performance of Farmer Companies in Sri Lanka: Lessons for Farmer-Owned Marketing Firms,
Agribusiness, 28(4) 505-517.
Roy, D and A Thorat (2008): “Success in High Value Horticultural Export Markets for the
Small Farmers: The Case of Mahagrapes in India” World Development, 36(10), 1874-1890.
Roy D, P.K. Joshi, V.K. Sonkar, B. Karnadikar, A.More, R K P Singh and A. Kumar (2020),
Comparative Study of Farmer Producer Organization in Bihar and Maharashtra, TCI –
TARINA Policy Brief No. 15, TCIAN, New Delhi.
Shankar G. (2019): Farmer producer companies- preliminary studies on efficiency and equity
study from Maharashtra, The Hindu centre for Politics and Public Policy, Chennai, Policy
Report No. 27.
Sharma M and R Sharma (2013): Developing retail linkages for food processing industry in
Rajasthan, in Proceedings of the National seminar on agribusiness potential of Rajasthan,
March 19-20, IABM and SK Agri Univ, Bikaner and ISAM Nagpur.
Sharma H O, D Rathi. RS Chauhan and S C Meena (2013): State of Agriculture in Madhya
Pradesh, AERC study no. 112, JNKVV, Jabalpur. Report submitted to MoA, GoI. New Delhi.
http://jnkvv.org/PDF/AERC/Study-112.pdf
Singh S (2015): Promotion of Milk Producer companies: Experience of NDS, presentation
at the Workshop on Governance Issues in Producers Organizations held at and organised by
NDDB, Anand, October 8.
Singh, S (2008): “Producer Companies as New Generation Co-operatives” Economic and
Political Weekly, 43(20), 22-24, May 17.

341
Singh, G, P Budhiraja, K Vatta (2018): Sustainability of Farmer Producer Organisations under
Agricultural Value Networks in India: A case of Punjab and Gujarat: Ind. Jn. Of Agri. Econ.
Vol. 73, No.3, July-Sept.2018, 370-385.
Singh, S and T Singh (2014): Producer Companies in India: Organisation and Performance,
Allied, New Delhi.
Singh, S (2016): Smallholder Organisation through Farmer (Producer) Companies for Modern
Markets: Experiences of Sri Lanka and India, in Jos Bijman, Roldan Muradian and Jur
Schuurman, (eds.): Cooperatives, Economic Democratization and Rural Development, 75-99,
Chapter 4, Edward Elgar, Cheltenham (UK).
Sivagnanam K J (2014): State Agriculture Profile of Tamil Nadu, 2011, AERC, Chennai.
Trebbin, A (2014): Linking small farmers to modern retail through producer organisations-
experience with producer companies in India, Food Policy, 45, 35-44.
Tripathi, A (2018): Doubling of farmers’ income in Uttar Pradesh by 2022: Opportunities
and Constraints, IEG, Delhi.
Trebbin, A and M Hassler (2012); Farmers’ producer companies in India: a new concept for
collective action?, Environment and Planning A, 44, 411-427.
Uloom A Uand M Gautam (2017): Sharing of experiences of farmer producer organisation, a
presentation.
Vicziany, M., and Plahe, J. (2017). Extending Traditional Food Knowledge into New
Marketing Institutions for Small Farmers in India, South Asia: Journal of South Asian Studies,
40(3), 645-668. https://doi.org/10.1080/00856401.2017.1342183.
Vorley B, L Cotula and M Chan (2012): Tipping the Balance: policies to shape agricultural
investments and markets in favour of small-scale farmers, Research report, IIED London and
Oxfam, December.
Verma S. (2017): Farmer producer organisations and agri-marketing, experience ins
selected states, relevance and their performance in Punjab, CRRID Chandigarh, First draft.
Verma, S, V K Sonkar, A Kumar and D Roy (2019):Are farmer producer organisations a boon to
farmers? The evidence from Bihar, India, AERR, 32 (conf. no.) 123-137.
Vutukuru V K, P Singh and M Kumar (n.d): Delivering Value for Small Farmers: Farmer
Producer Organizations in JEEViKA, JEEViKA Learning Note Series, No. 7, 70-76.
Wadkar S K (2018): Farmer producers organisations: present status, challenges and way
forward, Co-operative Perspective, 53(1), Special issue, September, 71-80.

Appendix 1
Review comments and Author response
Comment
No.
Reviewer Comment Author response to the
comment
1. The impact on crop structural components such
as improvements in yield, reduction in costs,
realization of better output price etc appears
limited. Providing more information on these
aspects will add value to the study.
Added new tables on the
reasons for purchase of
inputs by PC members in
each chapter and also the
information on %age
increase in prices realised
wherever possible compared
with pre-PC situation.
2. The functioning and impact of a PC can be
assessed better when analysed in relation to its
core objectives. For example, if a PC’s main
objective is to smoothen input supply, then the
impact should be assessed in terms of the
reduced cost of inputs (if any) to its members.
Similarly, if a PC is mainly aimed at improving
the market access to the members, then the
impact should be visible in terms of increase in
number of farmers or quantum of output
marketed through or with the assistance of the
PC. Even if a PC has multiple objectives,
improvements in yield and output price;
reduction in production and transaction costs can
go a long way in improving farmers’ position.
Thus, these can be considered legitimate
objectives. The study may therefore (list out the
main objectives of each PC and) assess the
impact in relation to the objectives of the PC.
This is not possible to do as
most PCs have no specified
or limited objectives. Their
objectives are very broad
ranging and they do all kinds
of things to improve farmer
incomes. That is why an
overall assessment has been
attempted with mixed
methods research involving
case study of the PC
functioning and the sample
survey of its members in
each case and gains from
input supply by the PC,
output purchase by PC and
the like.
3. Impact of an intervention needs to be based on
the appropriate counter-factual. For example,
most of the member farmers of the PCs in the
study are reported to have owned and operated
larger area. Hence, the member farmers and non-
member farmers are not exactly comparable.
Hence, the correct way to assess the impact of
the PC is to analyze the outcome before and after
the intervention (here becoming a member of the
PC) for the same set of farmers. Thus, whether it
is increase in yield or income; decrease in cost
of cultivation or marketing costs, after the
intervention should be assessed relative to the
same set of farmers. The data on various
parameters like yield, cost, price realized,
income etc need to be clearly reported in tables
for before and after the intervention to make the
impact of PC clear.
Yes, this was exactly the
design of the study and both
before and after and with and
without analysis have been
attempted subject to the
limitations of data
availability. Some more
analysis on before and after
has been added for output
side of the impact. Also, one
of the objectives of the study
was whether PCs were small
holder inclusive and the
differences in the member
and non-member profile is
post-facto and a finding of
the study. However, the
before and after intervention

analysis has been done
besides with and without the
intervention.
4. Since the study has collected data
systematically on several PCs across states by
different RIs both before and after the
intervention, a systematic quantitative analysis
of the impact of the PCs can be carried out. The
state, time and individual fixed effects can be
used to control for unobserved heterogeneity
across beneficiaries after controlling for
observables like land size, caste, irrigation and
other variables. This will yield a plausible
estimate of the impact of PC on the outcome
variable (which can be crop yield, price, input
cost or any other). Such a quantitative analysis
can add a lot of value to this work and can also
help the author publish the findings in a
scholarly journal. All in all, the study is a good
contribution to the literature on this important
subject.
This aspect would be
attended to while publishing
the results of the study
formally in peer reviewed
journals to the extent
possible.
5. Summary of the study is very long and needs a
lot of pruning. The ES should at most be of 3-4
pages and bring out the salient features of the
study such as the objectives of the study,
methodology, main findings and important
policy implications
The executive summary has
been pruned by a few pages
but since it involves state
specific and promoter
specific findings, it can’t be
made into just a few pages.
6. The Report is replete with spelling errors and
grammatical mistakes. The Report needs be
copy editing by a competent copy editor to
improve readability.
Proof reading and editing
done
7. There are a few places in the Report where the
references in the text are not matching with the
Tables.
This has been rectified