understanding paclitaxel / pluronic f127 nanocrystals ... · understanding paclitaxel / pluronic...
TRANSCRIPT

Understanding Paclitaxel / Pluronic F127 Nanocrystals Prepared by the Stabilization of Nanocrystal (SNC) Method
Jiexin Deng
A thesis submitted to the faculty of the University of North Carolina at Chapel Hill in partial fulfillment of the requirements for the degree of Master of Science in the Division of Molecular Pharmaceutics at Eshelman School of Pharmacy.
Chapel Hill 2009
Approved by
Philip Smith, Ph.D.
Feng Liu, Ph.D.
Moo J Cho, Ph.D.

©2009 Jiexin Deng
ALL RIGHTS RESERVED
ii

Abstract
Jiexin Deng:Understanding Paclitaxel / Pluronic F127 Nanocrystals Prepared by the Stabilization of Nanocrystal (SNC) Method
(Under the direction of Dr. Feng Liu and Dr. Leaf Huang)
The objectives of this study were to understand the structure and stability of
paclitaxel nanocrystals, as well as the biodistribution of nanocrystals after intravenous
injection in mice. The nanocrystal size increased after 2 h 37 oC incubation due to
thermal induced aggregation. The addition of more F127 surfactant further destabilized
nanocrystals and led to a larger size increase concurrent with micelle formation.
PTX/F127 nanocrystals (1/5 w/w) had little size increase upon dilution, indicating tight
monomer surfactant absorption. Nanocrystals of more F127 surfactant (1/20, 1/30 w/w)
increased much in size upon dilution, suggesting low-affinity surfactant absorption with
micelle formation in solution. The re-nanonization after 37 oC incubation effectively
inhibited crystal growth after 37 oC incubation again by disturbing the preferred crystal
growth pattern of PTX. The biodistribution of nanocrystals revealed that the majority of
nanocrystals were quickly taken up by reticuloendothelial system and went to the liver 1
h post injection.
iii

Acknowledgements
First of all, I would like to thank Dr. Leaf Huang, my research advisor. I have the
fortune of knowing Dr. Huang as a research advisor, teacher, and also as a preacher at my
church. I have to say that Dr. Huang is a good teacher as well as an excellent preacher,
and I have learned much from him in both roles. Dr. Huang has challenged me to show
my best efforts as a graduate student, as well as provided much advice to me about life. I
would also like to thank Dr. Feng Liu for mentoring me in the lab. Dr. Feng Liu has
shaped the way I approach science and taught me to be a good experimenter that put my
heart into everything that I do. Dr. Feng Liu just has been such an integral part of my
graduate student life, and I could not thank him more for his excellent mentoring. I
would like to thank my two other committee members, Dr. Moo J Cho and Dr. Philip
Smith. I have to thank them for facilitating this project and providing excellent expertise.
I would like to thank all members of the Huang Lab for providing help, support, and
friendship. Also, thanks goes to the administrative staff, Angela Lyght, Kathryn Fiscelli,
Kim Hoenerhoff, and Amber Allen for taking care of miscellaneous matters. Finally, I
would like to thank my parents, Dr. Jinbo Deng and Ping Wu, as well as my little
brothers, Delai Deng and Weibo Deng, for providing me the best family love and support.
iv

Table of Contents
LIST OF TABLES .......................................................................................................... vi
LIST OF FIGURES ....................................................................................................... vii
ABBREVIATIONS ....................................................................................................... vii
INTRODUCTION ........................................................................................................... 1
MATERIALS AND METHODS ..................................................................................... 4
RESULTS ........................................................................................................................ 9
DISCUSSION ................................................................................................................ 19
CONCLUSION .............................................................................................................. 26
REFERENCES .............................................................................................................. 50
v

LIST OF TABLES
Table 1: X-Ray Powder Diffraction Peaks ................................................................... 27
Table 2: Nanocrystal size after 2 h 37 oC incubation .................................................... 28
Table 3: Manually measured nanocrystal size after 2 h 37 oC incubation .................... 29
Table 4: Manually measured nanocrystal size after re-nanonization ............................ 30
Table 5: XRD of re-nanonized nanocrystals ................................................................. 31
Table 6: HPLC extraction difference between Taxol® and nanocrystals ..................... 32
vi

LIST OF FIGURES
Figure 1: X-Ray Powder Diffraction Peaks .................................................................. 33
Figure 2: PTX crystals Alone without F127 and PTX/F127 Physical Mixture ............ 34
Figure 3: TEM pictures of nanocrystals for thermal stability studies ........................... 35
Figure 4: Effects of increasing F127 on nanocrystal cytotoxicity ................................ 36
Figure 5: TEM of nanocrystals of 1/10 and 1/20 w/w PTX/F127 ................................ 37
Figure 6: Illustration of nanocrystals stabilized by F127 .............................................. 38
Figure 7: Nanocrystal size increase upon dilution at room temperature ...................... 39
Figure 8: TEM of undiluted sample at the end of dilution-size experiment ................. 41
Figure 9: Illustration of size increase of nanocrystals upon dilution ............................ 42
Figure 10: Nanocrystal (1/5 w/w PTX/F127) size increase upon dilution at 37 oC ..... 43
Figure 11: Re-nanonization by Incubation-Sonication procedure ................................ 44
Figure 12: Nanocrystal TEM pictures after Incubation-Sonication procedure ............. 45
Figure 13: Cytotoxicity of nanocrystals after Incubation Sonication procedure .......... 46
Figure 14: Extraction procedure of PTX with addition of acetonitrile ......................... 47
Figure 15: Plasma and organs PTX extraction standard curves ................................... 48
Figure 16: Nanocrystal biodistribution in mice plasma and organs ............................. 49
vii

Abbreviations
F127: diblock copolymer Pluronic F127 H460: NCI-H460 human lung cancer cells MTT: 3-(4,5-Dimethylthiazol-2-yl)-2,5-diphenyltetrazolium bromide PTX: paclitaxel RES: reticuloendothelial system SNC: stabilization of nanocrystals TBME: tert-butyl methyl ether TEM: transmission electron microscope XRD: X-ray powder diffraction
viii

Introduction
Paclitaxel (PTX), the first of a new class of microtubule stabilizing agents, has
demonstrated significant antitumor activity in clinical trials against a broad range of solid
tumors, including refractory ovarian cancer, metastatic breast cancer, non-small-cell lung
cancer, AIDS-related Kaposi’s sarcoma1,2. PTX is a highly hydrophobic diterpenoid
pseudoalkaloid (of 853 Da3) with poor aqueous solubility of approximately 1 μg/mL4. It
is currently formulated as Taxol, a concentrated solution containing 6 mg PTX/mL of
Cremophor EL (polyoxyl 35 castor oil) and dehydrated alcohol (1:1, v/v)2. However,
Cremophor EL component of the drug formulation is thought to be responsible for
hypersensitivity reactions approaching some 25 to 30 percent of patients, since it can
induce histamine release by mast and basophil cells5. Therefore, novel formulations of
paclitaxel alternative to the commercial ones are still highly desirable.
Attempts to solubilize poorly water soluble drugs such as paclitaxel using co-
solvents, in micelles, in liposomes, or with cyclodextrin has been of limited success. An
alternative formulation is nanosuspensions which are sub-micron colloidal dispersions of
pure particles of drug that are stabilized by surfactants6. Contrary to conventional
approach of solubilizing insoluble drugs with excess amounts of co-solvents,
nanosuspensions forgo the need of solubilization by stabilizing nano-sized drug crystals
acceptable for pharmaceutical uses. According to Noyes-Whitney and Ostwald-
Freundlich principles, homogeneous particle sizes of nanosuspension in nanometer range

can lead to increased dissolution velocity and saturation solubility, thus increase in
bioavailability7,8. Nanosuspensions could be given in various routes of administrations
such as oral9, parenteral10, ocular11, and pulmonary delivery12. These nanosuspension
studies by different routes of administration have revealed benefits such as increased rate
and extent of absorption, increased bioavailability, reduced administration volumes, and
increased resistance to hydrolysis and oxidation13. Pharmacokinetic profiles of
intravenous administration have shown the sustained release of nanosuspension by
slowing diffusing out of monocyte phagocytic system following uptake for prolonged
periods of time13.
One such nanosuspension formulation is PTX nanocrystals prepared using simple
method of stabilization of nanocrystals (SNC) using a diblock copolymer Pluronic F127
as the sole exipient14. PTX is relatively complex organic drug having several solid
structures such as crystal and amorphous, and the stabilized amorphous aggregate of PTX
and F127 co-precipitation played an important role in SNC method. The amorphous co-
precipitate provided the flexibility such that minimal energy and F127 were required in
the nanoparticle forming process, and this resulted in simple preparation and high drug
loading efficiency14. The resulting nanoparticle formulation has low toxicity due to low
PTX to F127 ratio, and the nanoparticle can bring higher amount of drug to cancer cells
upon delivery. In this study we would like to further understand the structure and
stability of PTX/F127 nanocrystals, as well as the biodistribution of the nanocrystals after
IV injection in mice. X-ray powder diffractions were performed to evaluate the
crystalline state of the nanocrystal samples. The effects of increasing concentration of
F127 surfactant on nanocrystal stability after 2 h 37 oC incubation were studied using
2

light scattering ZetaSizer. TEM pictures of nanocrystal samples were taken to observe
the morphology, crystal growth, and micelle formation in our samples. F127 surfactant
desorption from nanocrystals, and subsequent size increase, due to water dilution was
studied with increasing surfactant concentration at room temperature and 37 oC. The
“Incubation-Sonication” procedure was used to make stable nanocrystals that resisted
growth during 37 oC incubation. Finally, the biodistribution of nanocrystals in mice
plasma and organs 1 h post injection was evaluated.
3

Materials and Methods
Animals and Materials. Female BALB/c mice (5 weeks old) were purchased
from National Cancer Institute U.S. National Institute of Health (NCI). Human lung
cancer cell line, NCI-H460, was obtained from American Type Culture Collection. All
work performed on animals was in accordance with and permitted by the University of
North Carolina Institutional Animal Care and Use Committee. Paclitaxel (PTX) was
bought from Lc Laboratories (Woburn, MA). Pluronic F-127 (F127), Cremophor-EL,
Butyl-4-hydroxybenzoate, and tert-butyl methyl ether (T-BME) were purchased from
Sigma.
Preparation of the PTX samples. The nanocrystals were prepared by the
method of stabilization of nanocrystals (SNC). Briefly, paclitaxel (PTX) and F127 were
first dissolved in chloroform (in a glass tube) with a weight ratio of 1/5, 1/10, 1/20, or
1/30 (PTX/F127) and then co-precipitated by evaporating the chloroform with a steady
stream of nitrogen gas. Traces of chloroform were then removed by keeping the samples
under a vacuum with desiccators for 30 min. Following 30 min of hydration (in double
deionized water) and vortex, suspensions of the crystal were sonicated for 5 min by a
bath-type sonicator (output 80 kc, 80 Watts) to form nanocrystals. After hydration for 20
min, the samples were sonicated for another 5 min. For the physical mixture of
PTX/F127, PTX and F127 were not co-dissolved in chloroform and were not co-

precipitated by evaporating the chloroform. Only PTX was dissolved in chloroform, and
the chloroform was evaporated with a stream of nitrogen, leaving PTX residues at the
bottom of the tube. Then aqueous F127 solutions of appropriate concentration were
added to the residues of PTX to make the final weight ratio of 1/5 PTX/F127 w/w. The
mixture was then hydrated and sonicated in the same way as described for nanocrystals.
Transmission Electron Microscope (TEM). Transmission electron microscopy
(TEM) images of the resulting nanocrystals were acquired using a Phillips CM12 (FEI,
Hillsboro, OR). Freshly prepared nanoparticle samples (5 μl) were dropped onto a 300
mesh carbon-coated copper grid (Ted Pella, Inc., Redding, CA) and allowed a short
incubation (5 min) at room temperature. Grids were then stained with 1% uranyl acetate
(40 μl) and wicked dry. All images were acquired at an accelerating voltage of 100 kV.
Gatan DigitalMicrograph software was used to analyze the images.
Nanocrystal Size. The distribution of cumulative particle size in the nanocrystal
formulation was measured using ZetaSizer Nano-ZS of Malvern Instrument
(Westborough, MA). To study the effects of dilution on nanocrystal size, 1 ml of
undiluted sample (143 μg PTX/mL H2O), 10 fold diluted sample, 50 fold diluted sample
were placed in particle size measurement cuvette. These samples were left standing at
room temperature or incubated in 37 oC, and at various time points their particle size
were measured.
5
X-Ray Powder Diffraction. The X-ray powder diffraction (XRPD) patterns for
Paclitaxel samples were obtained with a Rigaku Multiflex diffractometer. The X-ray
source was Ni filtered CuK-alpha radiation (Wavelength 1.5418 A). The X-ray tube was
run at a power of 40 kV, 40 mA. The sample size was approximately 60 mg. The 2θ
range scanned was 7.5 to 60o at a rate of 0.25 deg 2θ/min at increments of 0.02o 2θ.
H460 Cell Cytotoxicity Study. The cytotoxicity of nanocrystals on NCI-H460
human lung cancer cells were determined by MTT assay. Briefly, H460 cells were
seeded into 96-well plates at a concentration of 1×10⁴ cells/well in a volume of 200 μl per
well. After 24 h, 20 μl of phosphate buffered saline (PBS) containing the nanocrystals
were applied to H460 cells to make the final concentration to be 100 nM of PTX. After
43 hour of incubation, 20 μl of MTT (3-(4,5-Dimethylthiazol-2-yl)-2,5-
diphenyltetrazolium bromide) solution (3.33 mg/ml) was added to cell medium in each
well. Following 2 hour of incubation with MTT, medium were removed and 100 μl of
dimethyl sulfoxide (DMSO) was added to dissolve the formazan crystals. The
absorbance values were then measured on a microplate reader (Hidex Plate Chameleon,
Turku, Finland) at the wavelength of 570 nm. Cell viability was calculated using the
following formula: %viability = (A570 nm for the treated cells / A570 nm for the control
cells) × 100%, where A570 nm is the absorbance.
Biodistribution of Paclitaxel Formulations. Biodistribution study of paclitaxel
was performed on Balb/C mice, and the animals were kept in the animal facility and had
6

free access to food and water. For administration, nanocrystal (1/5 w/w PTX/F127)
formulations were suspended in certain volumes of PBS (pH 7.4) in order to obtain the
required concentration. The different formulations were injected through the tail vein at
the paclitaxel dose of 20 mg/kg mouse, and each group consisted of 5 animals. One hour
after injection, blood and organs (liver, lung, spleen, kidney) were collected. Blood was
obtained from the retro orbital plexus, and plasma was obtained by immediately
centrifuging blood samples with EDTA at 7000 g for 5 min. Harvested tissues were
stored at -20 oC until analyzed for paclitaxel by HPLC.
HPLC Analysis of Paclitaxel. HPLC method was used for the analysis of
paclitaxel concentration in all samples. For plasma samples, 200 μL of plasma was
spiked with 10 μL of butyl-4-hydroxybenzoate (50 μg/mL) as internal standard. For
paclitaxel plasma standard curve 20 μL of paclitaxel of appropriate concentrations along
with the internal standards were dissolved in the plasma samples. After addition of 100
μl of acetonitrile, the plasma samples were then extracted with 2 mL of tert-butyl methyl
ether (T-BME) with vigorous mixing for 5 minutes. After centrifugation at 3000 rpm for
5 minutes, the organic phase was collected. The extraction procedure was repeated with
2 mL of T-BME, and total organic phase was combined and dried under nitrogen gas.
The residue was then dissolved in 100 μL of the mobile phase, 45% acetonitrile / water.
The solution was centrifuged for 5 min at 3000 rpm, and 50 μL of the supernatant was
injected into the HPLC system for analysis.
For tissue organs, the tissue samples (liver, spleen, lung, kidney) were
homogenized with 1 mL of water Bovine Serum Albumin (BSA) solution, containing 4%
7

(w/v) bovine serum albumin, using a tissue homogenizer for 5 min at 4 oC. The tissue
homogenate (1.0 mL) was spiked with 10 μL of internal standard (Butyl-4-
hydroxybenzoate, 50 μg/mL). For paclitaxel organs standard curve 20 μL of paclitaxel of
appropriate concentrations along with the internal standards were dissolved in the organ
samples. The samples were then extracted twice with 2 mL of T-BME as described for
the plasma sample. The T-BME fractions were then combined and were dried under
nitrogen gas. The residue was dissolved with 100 μL of mobile phase, 45% Acetonitrile /
Water, and was mixed for 5 minutes. The solution was centrifuged at 3000 rpm for 5
min, and 10 μL of the supernatant was injected into the HPLC system for analysis. The
HPLC system was performed at a flow rate of 1.0 ml/min at 228 nm with a UV detector,
using a 25mm × 4.6 I.D. mm reverse phase Analytical column of Axxiom
Chromatography (Moorpark, CA).
Statistical Analysis. All statistical analyses were performed by a two-tailed
student t-test. Data were considered statistically significant when the P value was less
than 0.05.
8

Results
A. Understanding the Structure and Stability of PTX / F127 Nanocrystals
1. Crystalline Structure Identification of Nanocrystals
Although nanocrystals could be observed under TEM, the crystalline structure of
nanocrystals was never evaluated. Therefore X-ray powder diffraction analysis was
carried out for nanocrystals (PTX/F127 1/5 w/w) as well as physical mixture in
comparison with pure PTX and F127. Figure 1 shows the X-ray diffraction peaks for
pure paclitaxel, pure F127, nanocrystals, and PTX/F127 physical mixture. As shown in
figure 1, the X-ray diffraction pattern of the nanocrystals showed the combined peaks of
both of the pure components (paclitaxel and F127). The F127 peaks were much more
prominent than the peaks of paclitaxel near the base line at 2θ of 10o to 15o, this is
because F127 were present in larger weight ratio (1/5) in the formulation. The X-ray
powder diffraction confirmed that in nanocrystal formulation both Paclitaxel and F127
components retained their native crystalline structure. X-ray diffraction peaks for
physical mixture were also shown in figure 1c. The diffraction peaks for nanocrystal and
PTX/F127 physical mixture were highly similar. Table 1 is a summary of the major X-
ray diffraction peaks for each sample, and the nanocrystals and physical mixture had peak
characteristics of PTX and F127.

From x-ray diffraction pattern, nanocrystals and the PTX/F127 physical mixture
were highly similar in composition and crystalline structure. However, as could be
expected the crystal formation in nanocrystal samples and the physical mixture were very
different. As shown in figure 2b, the crystal growth of PTX alone with out surfactant
was vastly different than that of nanocrystal in shape and pattern. Nanocrystals were rod-
shaped structures stabilized by F127 surfactant on the surface; on the other hand, PTX
alone formed small trunks of irregular crystals and aggregated with each other. Figure 2c
shows the aggregate formed in PTX/F127 physical mixture. While there were
resemblances of rod-shaped crystals, these individual crystals collapsed and aggregated
with each other forming a mass. Due to the lack of the co-solvation (in chloroform) and
co-precipitation step, F127 surfactant in physical mixture could not be adequately coated
on the surface of nanocrystals to prevent the aggregation.
2. Effects of Increasing Surfactant on Thermal Stability of Nanocrystals
It is known that the aggregation efficiency of hydrophobic particles would be
enhanced at higher temperatures15. As shown in figure 3 this is also true for our
nanocrystals, and after 37 oC incubation for 2 hours longer crystals were formed despite
the fact that nanocrystals were stabilized by F127 surfactant. The size as measured by the
ZetaSizer went from 176 nm to 258 nm after 2 hour incubation at 37 oC. Therefore, to
attempt to further protect the nanocrystals, higher amounts of F127 surfactant were used
to prepare PTX/F127 nanocrystals of ratios 1/10, 1/20, and 1/30 w/w. On the contrary, as
shown in Table 2 the measured size after 37 oC incubation increases with higher amount
10

of F127 surfactant used. The measured size for PTX/F127 (1/5 w/w) after 37 oC
incubation was 258 nm, but for PTX/F127 (1/20 w/w) and (1/30 w/w) the sizes were 359
and 441 nm respectively after 37 oC incubation.
Due to the inaccuracies of measurement by ZetaSizer for rod-shaped crystals,
manual measurements were performed for the TEM pictures, and the results were shown
in Table 3. At least 20 crystals of various field-views were measured for each sample,
and the average values with standard deviations were given. For nanocrystals prepared
with 1/5 w/w of F127, the sizes both before and after 37 oC were statistically smaller than
the sizes of crystals with higher concentration of F127. The manual measuring in TEM
confirmed the trend in size change measured by the ZetaSizer. Adding more F127
surfactant to the preparation did not help to increase the stability of nanocrystals during 2
h 37 oC incubation.
In order to observe the effects of increasing concentrations of F127 on the
cytotoxicity of nanocrystals, PTX nanocrystals with different concentrations of F127
surfactants (1/10, 1/20, 1/30 w/w) were prepared and were applied to NCI-H460 cells.
As shown in figure 4, F127 alone at all concentrations (1/10, 1/20, 1/30 w/w) did not
cause significant cytotoxicity. Also, the increase in F127 concentrations in nanocrystal
formulations did not have significant effects on cell viability, as the nanocrystals
treatment groups all had about 45% cell viability regardless of the concentration of F127.
Therefore increasing F127 concentrations did not alter the cytotoxic effects of
nanocrystals on NCI-H460 cells.
The reason why increasing amount of F127 did not help to further stabilize
nanocrystals during 2 h 37 oC incubation became clear in figure 5, which showed that the
11

formation of micelles was evident at higher concentration of F127 surfactant. The CMC
of Pluronic F127 at 25 oC is 7.19 × 10⁻⁵ M27. The concentration of F127 in nanocrystals
prepared with 1/5 w/w of PTX/F127 is below the CMC of F127. However, for 1/10, 1/20,
and 1/30 of PTX/F127, the concentration of surfactant goes beyond the CMC. Instead of
forming a thicker coating layer, the additional F127 formed micelles that competed for
nanocrystal surface adsorption. Unimers of F127 surfactant bound the surface of
nanocrystals with high affinity due to hydrophobic interactions. As the concentration of
F127 increased however, surface monomers interacted with each other, forming “hemi-
micelles” on the surface of nanocrystals that bound with lower affinity than monomers.
These lower affinity surfactant could easily be competed off the nanocrystal surface. So
this could actually mean less surface adsorption due to competition by micelles as more
F127 surfactant was added to the sample, and less surface adsorption means less stability
for nanocrystals during 2 h 37 oC incubation.
3. The Effects of Dilution on Surfactant Adsorption and Nanocrystal Stability
Upon IV injection nanocrystals would be diluted many folds in the blood stream,
therefore, it would be important to understand the effects of water dilution on surfactant
adsorption and nanocrystal stability. As shown in Figure 6, our nanocrystals are in a
meta-stable state stabilized by surface adsorbed F127 surfactant. At low concentration of
F127 (1/5 w/w PTX/F127) monomers bind with high affinity. At high concentration of
F127, monomers aggregated and bind to surface with low affinity; there is also micelle
formation competing for surface adsorption. In this experiment, nanocrystal samples
12

were diluted 10 fold or 50 fold to attempt to draw the adsorbed surfactant layer into free
form. By doing so, it is expected that the particle size of PTX nanocrystals would
increase upon dilution if surfactant does indeed leave. ZetaSizer measures the size of
particles using light scattering from only one angle rather than multiple angles, and there
would be measurement inaccuracies for our long rod-shaped PTX crystals. However, the
ZetaSizer does give a cumulative measurement of total particle size in solution and is
more than capable of giving an idea of the level of crystal aggregation.
As seen in figure 7a, PTX nanocrystals prepared with 1:5 w/w of F127 increased
a little in size as time went on however, size increase upon dilution was not observed. As
shown by 7b to 7d, the crystal size of nanocrystals formulations containing higher
amounts of F127 (1/20, 1/30 w/w) drastically increased upon dilution. In TEM pictures
of figure 8, micelle formations were evident in undiluted samples with higher F127
concentration at the end of the dilution-size experiment. These data indicate that the
affinity of surfactant binding to the surface of nanocrystals at low concentration of
surfactant (1/5 w/w) was not the same as that of nanocrystals with high concentration of
surfactant (1/20, 1/30 w/w). At low concentration of F127 (1/5 w/w), no micelles were
observed in TEM, and it is likely that monomers bound to nanocrystals with high affinity,
and dilution could not pull the surfactant off the surface. At higher concentration of F127
(1/20, 1/30 w/w), micelles started to form that would compete for surface adsorption of
F127 (Figure 9). Also, the size increase upon dilution of the nanocrystals of 1/20 and
1/30 PTX/F127 suggests that the surfactant bound with lower affinity, coming off easily
upon dilution. It is likely that as F127 concentration increased, monomers started to lose
13

the high affinity to surface of nanocrystals and would instead interact more with each
other.
The Critical Micelle Concentration (CMC) of F127 would decrease drastically
from 0.3 wt % at room temperature to 0.025 wt % at 37 oC16. Therefore, it would be
interesting to find out whether the nanocrystal size increases upon dilution at 37 oC where
micelle formation would be enhanced. As shown in figure 10, for PTX/F127 1:5 w/w the
nanocrystal size indeed increased upon dilution at 37 oC. This suggests that monomers
on the surface of nanocrystals started to aggregate at higher temperature and was drawn
to leave the crystal surface upon dilution, making the crystal prone to aggregate. This
size increase upon dilution for nanocrystals of 1/5 w/w PTX/F127 was not observed at
room temperature, where no micelles were formed.
4. Increase of Nanocrystal Stability by Re-nanonization
The crystal growth of nanocrystals after 37 oC incubation presents storage
problems, because long crystals could also form at room temperature after preparation or
reconstitution due to Ostwald ripening17,18. To solve this problem, sonication for 15
minutes was used to break down the longer crystals after incubation at 37 oC, resulting in
smaller nanocrystals again, and the sonicated nanocrystals were then incubated at 37 oC
for 2 hours again to see if the incubation would cause regrowth into longer crystals
(Figure 11). As shown by Figure 12, the “incubation-sonication” procedure effectively
prevented the growth of nanocrystals at 37 oC incubation and provided a much better
thermal stability for nanocrystals. It is assumed that the crystal growth pattern would be
14

disturbed by sonicating large nanocrystals after 37 oC incubation, and it would be
difficult to regrow crystals into longer needle-like crystals, thus providing better stability.
To confirm, manual measurements were performed in TEM pictures, and the
results with standard deviations were given in Table 4. According to the measurements,
the second time 37 oC incubation did not induce statistically significant increase in length
after the “incubation-sonication” procedure. Rather the increase in width in sample C
was significant. This showed that the “incubation-sonication” procedure made it difficult
for crystals to regrow in length, which is the preferred growth pattern for PTX crystals.
Thus, this procedure provided overall inhibition of crystal growth and better crystal
stability.
The cytotoxic effects of nanocrystal on NCI-H460 cells after the “Sonication-
Incubation” procedure were studied. As shown in figure 13, the different treatments of
10 μM PTX were 1) before 2 hr 37 oC incubation, 2) after 2 hr 37 oC incubation, 3) after
2 hr 37 oC incubation then sonication, 4) after 2 hr 37 oC incubation then sonication then
2 hr 37 oC incubation again. The different preparative procedures did not cause
significant differences in cytotoxicity, and the cell viability were 40 to 45% across all
treatment groups. The crystalline state of nanocrystals after “Sonication-Incubation”
procedure were also evaluated using X-ray Powder Diffraction analysis. It was found
that the nanocrystal crystallinity was unaltered by procedures such as 37 oC incubation
and sonication (Table 5).
15

B. Biodistribution of Nanocrystals
1. The Difference in Extraction Efficiency of Taxol® and Nanocrystal
PTX samples were extracted from plasma and tissue samples and were
subsequently analyzed by HPLC in the biodistribution study. To investigate whether
there was extraction efficiency differences between the two PTX formulations, 600 μL
of blood was spiked with 50 μg of paclitaxel formulations (Taxol® and nanocrystals),
then the blood was centrifuged at 7000 g for 5 minutes to separate the plasma and blood
precipitate. 200 μL of plasma was then extracted with tert-butyl methyl ether (TBME)
for analysis by HPLC. As shown by the HPLC results in Table 6A, there were
differences in extraction for the two formulations (i.e. Taxol® and nanocrystals). For the
same amount of paclitaxel spiked in the blood, the HPLC ratio (PTX/Internal STD) of
Taxol® formulation is 2.86 times larger than that of the nanocrystal. To confirm that this
difference is indeed due to extraction differences and not due to formulation itself, 10 μg
of paclitaxel in plasma of both formulations were directly injected into HPLC, and
similar HPLC ratio were obtained as shown in Table 6B (61.87 for Taxol® and 58.13 for
nanocrystal). The nanocrystals extraction by tert-butyl methyl ether (TBME) was lower
compared with that of Taxol®. To resolve the differences in extraction between the two
formulations, 100 μL of acetonitrile was added to plasma samples to dissolve the
nanocrystals prior to extraction by TBME (Figure 14). As shown in Table 6C, for the
same amount of paclitaxel spiked in plasma, the HPLC ratios were similar for Taxol® and
nanocrystal after the addition of acetonitrile prior to extraction by TBME.
16
2. Difference in Extraction Recovery of Plasma and Organs
In order to construct a paclitaxel in plasma standard curve, various amounts of
paclitaxel were dissolved in plasma, and the internal standard (Butyl-4-hydroxybenzoate)
was fixed in all plasma samples. After the addition of 100 μL of acetonitrile, the plasma
samples containing paclitaxel and internal standard were extracted using tert-butyl methyl
ether (T-BME) twice, and the organic phase was dried with a stream of nitrogen gas. The
residue was then reconstituted with 100 μL of mobile phase, and 50 μL of the
reconstituted samples were then injected into HPLC for analysis. The resulting paclitaxel
plasma and organs standard curves were shown in figure 15, and the liver PTX standard
curve was significantly differently from that of the other organs.
3. PTX Nanocrystal Biodistribution Study
The PTX nanocrystal biodistribution in mice plasma and organs 1 h post injection
was displayed in figure 16. The plasma concentration of nanocrystal consists of only
12.63% of recovered dose, and the majority of the nanocrystal went to the liver (65.85%)
due to rapid reticuloendothelial system (RES) uptake. It seems that F127 surfactant on
the surface of nanocrystals could prevent aggregation, yet the surfactants were unable to
protect the nanocrystals from RES uptake. The nanocrystals formed by F127 Pluronic
formulation were of rod-shaped and of <150 nm in length. It was hoped that the small
rod shaped nanocrystals could escape reticuloendothelial system (RES) uptake. Despite
17

this property, the biodistribution data shown indicated that the F127 nanocrystals formed
were still largely taken up by the RES system and went into liver.
18

Discussion
Nanosuspensions are useful dosage forms for the formulation of water-insoluble
drugs13,19. Techniques such as high-pressure homogenization and wet milling are often
used to produce nanosuspensions of small size suitable for pharmaceutical uses, these
nanosuspensions are stabilized by surfactant such as Pluronics polymers for storage
purposes to prevent aggregation20,21. Studies have demonstrated that stable
nanosuspensions of sparingly water-soluble drugs was comparable or improved over the
response elicited by the conventional formulations; dosages could be increased without
incidence of acute toxicity, abnormal weight loss, or organ pathology14,21. Currently five
products are on the market by the approval of FDA since the year 2000, all intended for
oral delivery; all five products are based on top-down approaches such as media milling
and high-pressure homogenization22. PTX/F127 nanocrystal is a nanosuspension
formulation of PTX developed in our lab using stabilization of nanocrystals (SNC)
method, and the objectives of this study were to further understand the structure and
stability of the nanocrystals, as well as the biodistribution of the nanocrystals 1 h post
injection in vivo.
The state of crystallinity of the nanocrystals was evaluated using X-ray powder
diffraction. F127 is a semicrystalline polymer, with the crystalline phase consisting of
PEO layers and amorphous layers formed by PPO and PEO23. Nanocrystals, as well as
PTX/F127 physical mixture, has the diffraction pattern consisting of both pure PTX and

F127 (figure 1), showing that the crystallinity of nanocrystals were unaltered by the
preparation and lyophilization process. Because the PTX/F127 physical mixture and
nanocrystals had very similar XRD patterns, TEM pictures were taken to observe
compare the crystal growth morphology of physical mixture and nanocrystals (Figure 2).
The pure PTX crystals were highly irregular in shape that aggregated with each other.
While the PTX/F127 physical mixture had semblance of rod-shaped crystals, the crystals
aggregated with each other into a mass because the F127 were unable to adequately
stabilize the crystals. This shows that the co-solvation in chloroform and subsequent co-
precipitation were important steps in preparing stable nanocrystals, without these steps,
the crystals formed would collapse into a mass.
Hydrophobic interactions are negative entropic processes, therefore, the higher
the temperature of the suspension, the more thermodynamically unfavorable the system
becomes; in hydrophobic suspensions, the tendency of aggregation is enhanced at higher
temperature15. Our nanocrystals stabilized by F127 surfactant increased in size upon 2 h
incubation at 37 oC, becoming crystals of great length (figure 3). It has been reported that
further increase in surfactant in nanosuspensions could afford thicker coating layer to the
nanocrystals, thus providing better long-term stability17,24. Therefore, in our study
nanocrystals with increasing F127 surfactant were prepared (1/10, 1/20, 1/30 w/w
PTX/F127). It was hoped that the increase in F127 could afford better stability against
aggregation from 37 oC incubation. On the contrary however, nanocrystals with higher
concentration of F127 surfactant increased even more in size after 2 h 37 oC incubation
(Table 2). This trend was confirmed by manually measuring the nanocrystals in each
TEM field-view (Table 3). The reason for this trend became clear from TEM (Figure 5),
20

instead of forming a thicker layer on the nanocrystals surface, micelles began to form in
solution at higher concentration of F127. The CMC of Pluronic F127 at 25 oC is 7.19 ×
10-5 M27. The concentration of F127 in nanocrystals prepared with 1/5 w/w of PTX/F127
is below the CMC of F127. However, for 1/10, 1/20, and 1/30 of PTX/F127, the
concentration of surfactant goes beyond the CMC. After the attainment of the CMC, the
micelles began to compete for surface adsorption so that the total adsorption at the
interface begins to decrease as the micelles become more numerous25. Another study on
the adsorption of Pluronic polymers on the adsorption of DDS-glass by radiolabelling
also confirmed this effect26. Thus, the higher F127 surfactant concentration could
actually mean less surfactant adsorption, which would further destabilize the nanocrystals
during the 2 h 37 oC incubation, thus contributing to a larger size increase. Croy et al.
studied the effects of Pluronic polymers on the aggregation state of poorly soluble
nystatin. They found that nystatin could partition into pluronic micelles and the largest
contributing factor to the solubilization of nystatin was the number and size of the
micelles formed27. However in our case PTX nanocrystals were stabilized by surface
adsorption of F127 surfactant, and the formation of micelles would compete with F127
surface adsorption—thus destabilizing the nanocrystals.
The effects of dilution on size increase of nanocrystals prepared with varying
amounts of F127 (1/5, 1/10, 1/20, 1/30 w/w) were studied. The nanocrystals were in a
meta-stable state with free surfactant in solution and adsorbed surfactant for stabilization.
By dilution it is hoped that the equilibrium would be shifted such that the adsorbed
surfactant would leave the nanocrystals and go into the free form. If the surfactant does
indeed leave, the crystal size increase would be detected. It was found that for
21

nanocrystals of 1/5 w/w PTX/F127, the dilution had no effect on size increase; however,
nanocrystals prepared with higher amount of F127 (1/10, 1/20, 1/30 w/w) increased much
in size upon dilution (Figure 7). The TEM of undiluted samples at the end of the
experiment (Figure 8) revealed micelle formation in nanocrystals samples with higher
concentration of surfactant (1/20, 1/30 w/w PTX/F127).
One study by Lin et al. using dynamic light scattering (DLS) and small-angle
neutron scattering (SANS) found that below CMC PPO of Pluronic F127 preferred
hydrophobic Carbon Black (CB) particle surface to water, but above CMC Pluronic F127
preferred to associate with each other and had decreased affinity to CB surface28. Below
CMC monolayer of F127 monomers bound to CB surface with high affinity, above CMC
adsorbed layer thickness measured by DLS, as well as structure determined by SANS,
suggested that the adsorbed layer was in the form of micelles28. The observation that at
higher bulk surfactant concentration, micelles, or monomer aggregates “hemi-micelles”,
bound to hydrophobic surface with lower affinity is also confirmed by Amiji using
radiolabelling methods26. This is in line with our observation that at higher F127
concentration surface surfactants readily leave upon dilution, making the crystals increase
in size. At higher F127 concentration where micellization occurs, F127 monomers on the
surface aggregated with each other and consequently bound the surface with lower
affinity.
It is known that the CMC of Pluronic F127 decreases strongly with increasing
temperature, from 0.3 wt % at room temperature to 0.025 wt % at 37 oC16. At higher
temperatures the surfactant adsorption is inhibited more than micellization, meaning that
micellization will out-compete surface adsorption29. At 37 oC nanocrystals of 1/5
22
PTX/F127 increased in size upon dilution concurrent with micelle formation (Figure 10),
whereas at room temperature the same nanocrystals did not increase in sizes. This
experiment thus showed again that in samples with micelle formation either because of
high F127 concentration or induced by higher temperature, surface surfactant aggregated
and bound the nanocrystals with lower affinity; the surfactant readily desorbed upon
dilution, destabilizing nanocrystals and causing size increase.
The size increase of nanocrystals due to thermal induced aggregation at 37 oC
incubation or Ostwald ripening at room temperature poses storage problems and could be
undesirable. This negates important advantages of nanosuspensions, such as the increase
in saturation solubility and increase in dissolution rate of compound30. Nanosuspensions
have shown increased antitumor efficacy by taking advantage of the Enhanced
Permeability and Retention (EPR) effect during its prolonged retention time31. It would
be difficult for large crystals to take advantage of the EPR effect. Therefore the
“Incubation-Sonication” procedure was used to provide better stability of the
nanocrystals. After the crystal size increased after the 2 h 37 oC incubation, sonication
was used to break down the samples into smaller nanocrystals. After incubating at 37 oC
for 2 hours, it was found that the “Incubation-Sonication” procedure (figure 11)
effectively prevented the regrowth into longer crystals (figure 12). Closer examination
by manual measuring in TEM revealed that the “Incubation-Sonication” procedure
prevented the regrowth in length of the crystals; however, the growth in width of the
crystals was statistically significant (Table 4). The growth in width was less favored by
the nanocrystals. Therefore, the “Incubation-Sonication” procedure disturbed the growth
pattern of the nanocrystals, thus providing better stability.
23

HPLC was used to analyze PTX in biodistribution studies, and it was found that
there were extraction differences by tert-butyl methyl ether. The ratio of PTX to internal
standard ratio was 2.86 times larger for Taxol® than for nanocrystals (Table 6A). As
opposed to using excess co-solvents such as Cremophor EL to dissolve PTX, nanocrystal
formulation is in a dense, solid state that has the property of higher mass per volume13.
This could be the reason PTX extraction efficiency by TBME is lower for nanocrystals
than for Taxol®, and to resolve the difference, acetonitrile had to be added as a co-solvent
to dissolve the nanocrystals prior to extraction (figure 14). PTX standard curves were
constructed for plasma and organs, and it was found that the liver standard curve was
significantly different from the others (Figure 15).
The biodistribution of nanocrystals 1 h post intravenous injection revealed that
majority of nanocrystals (65.86%) were quickly taken up by the RES system and went to
the liver (Figure 16). Several pharmacokinetic profiles have been reported for
nanosuspensions after intravenous injection. If the particles dissolve in the blood readily,
both the pharmacokinetics and tissue distribution will be equivalent to those for the
solution formulations32,33. However, there is evidence that our nanocrystals are slow-
dissolving after injection into the blood stream. Previous studies have shown that slow
dissolving nanocrystals were taken up by the phagocytic cells of the mononuclear
phagocyte system (MPS), primarily the Kupffer cells in the liver, spleen, and lungs34,35.
The drug particles could dissolve in the reduced pH environment of the
phagolysosomes36 and slowly diffuse out of the MPS cells based on their lipophilic
character13. This effect will result in a pharmacokinetic profile with significantly reduced
Cmax, but quite prolonged t1/2, and this trend has been observed for nanosuspensions by
24

many studies20,37. This can be very advantageous for certain drug classes, for which
toxicity is mediated by peak plasma values, but for which efficacy is driven by AUC, as
in the case of triazole antifungals38.
25

Conclusion
In conclusion, the crystalline structure of PTX nanocrystals was unaltered from
that of pure PTX based on X-ray Powder Diffraction analysis. The nanocrystal size
increased after 2 h 37 oC incubation due to thermal induced aggregation, and more F127
surfactant further destabilized nanocrystals and led to a large size increase concurrent
with micelle formation. Cytotoxicity on H460 cells indicate that increased F127 did not
affect the cytotoxicty of the nanocrystals. PTX/F127 nanocrystals (1/5 w/w) had little
size increase upon dilution, and nanocrystals of increasing F127 surfactant (1/20, 1/30
w/w) increased much in size upon dilution. At 37 oC where micellization is enhanced,
even PTX/F127 nanocrystals (1/5 w/w) increased in size upon dilution. The “Incubation-
Sonication” procedure effectively inhibited crystal growth after 37 oC by disturbing the
preferred crystal growth pattern of PTX. The cytotoxicity and crystalline structure of
nanocrystals were unaltered after “incubation-sonication” procedure. Finally, the
biodistribtuion of nanocrystals revealed that majority of nanocrystals were quickly taken
up by the reticuloendothelial system and went to the liver 1 h post injection.

Table 1. X-Ray Powder Diffraction Peaks and Corresponding d spacings for pure PTX, pure F127, nanocrystal, and PTX/F127 physical mixture.
2θ Angle
d spacing (Angstrom)
Pure PTX Pure F127 Nanocrystal Physical Mixture
9.8 9.02 Present (weak)
Present Present
11 8.04 Present Present (faint)
Present (weak)
12 7.38 Present Present Present 13.5 6.56 Present Present Present 19.5 4.55 Present Present Present 23.7 3.75 Present Present Present
27

Table 2. Nanocrystal size increase after 37 oC incubation for 2 hours. Nanocrystals prepared with various amounts of F127 were measured for their sizes before and after 37 oC incubation.
Measured Size (nm) Before 37 oC Incubation
Measured Size (nm) After 37 oC Incubation
PTX/F127 (1/5 w/w) 176 258 PTX/F127 (1/10 w/w) 187 303 PTX/F127 (1/20 w/w) 158 359 PTX/F127 (1/30 w/w) 181 441
28

Table 3. Size of nanocrystals prepared with various amounts of F127 determined by manual measuring in TEM. At least 20 crystals were measured for each sample. **For the length of nanocrystal, P < 0.05 when compared to either PTX (1/10), (1/20), or (1/30).
Measured Size (nm) Before 37 oC incubation
Measured Size (nm) After 37 oC incubation
PTX/F127 (1/5 w/w)
37 × 160** (±7 × ±47)
53 × 660** (±18 × ±318)
PTX/F127 (1/10 w/w)
39 × 297 (±10 × ±113)
57 × 971 (±14 × ±324)
PTX/F127 (1/20 w/w)
45 × 322 (±11 × ±82)
47 × 1273 (±10 × ±652)
PTX/F127 (1/30 w/w)
37 × 344 (±10 × ±149) ------
29

Table 4. The size of nanocrystals prepared by manual measurements in TEM. Samples are PTX/F127 nanocrystals before 37 oC incubation (Sample A), nanocrystals after 37 oC incubation then sonication (Sample B), nanocrystals after 37 oC incubation, sonication, then 37 oC incubation again (Sample C). The increases in length of sample C was not statistically significant compared to A or B. *For the width of nanocrystals, p < 0.05 compared to either Sample A and B.
Measured Size (nm)
Sample A PTX/F127 Before 37 oC (1/5 w/w)
37 × 160 (±7 × ±47)
Sample B PTX/F127 37 oC – Sonication (1/5 w/w)
63 × 177 (±7 × ±46)
Sample C PTX/F127 37 C – Sonication – 37 oC (1/5 w/w)
73* × 185 (±12 × ±68)
30

Table 5. X-ray Powder Diffraction Analysis of nanocrystals after the “Sonication-Incubation” procedure. The crystalline structure were unaltered for (1) nanocrystals after 37 oC incubation and (2) nanocrystals after 37 oC incubation, then sonication, then incubated at 37 oC for 2 h again.
2θ Angle
d spacing (Angstrom)
Pure PTX
Pure F127
Nanocrystal37 oC
Incubation
Nanocrystal 37 oC
Incubation Sonication
37 oC Incubation
9.8 9.02 Present (weak) Present Present
11 8.04 Present Present Present 12 7.38 Present Present Present
13.5 6.56 Present Present Present 19.5 4.55 Present Present Present 23.7 3.75 Present Present Present
31

Table 6. (A) HPLC plasma results of 600 μL of blood spiked with 50 μg of paclitaxel extracted with TBME without the addition of acetonitrile prior to extraction (B) HPLC results of 10 μg of paclitaxel by direct injection (C) HPLC plasma results of 600 μL of blood spiked with 10 μg of paclitaxel extracted with TBME with the addition of acetonitrile prior to extraction.
A)
Name Retention Time Area Ratio Plasma Taxol® 22.4 11956375 (PTX/Int) Internal Standard 12.8 47329.08 252.6 Name Retention Time Area Ratio Plasma Nanocrystal 22.5 4108067 (PTX/Int) Internal Standard 12.9 46524.07 88.3
B)
Name Retention Time Area Ratio Internal Standard 12.1 54806.8 (PTX/Int) Taxol® (10 μg) Direct Injection 18.5 3390698 61.9 Name Retention Time Area Ratio Internal Standard 12.1 55726.55 (PTX/Int) Nanocrystal (10 μg) Direct Injection 18.5 3239422 58.1
C)
Name Retention Time Area Ratio Internal Standard 12.2 49270.75 (PTX/Int) Plasma Taxol® (with Acetonitrile) 18.6 1478042 30.0 Name Retention Time Area Ratio Internal Standard 12.3 42690.28 (PTX/Int) Plasma Nanocrystal (with Acetonitrile) 18.8 1175104 27.5
32

Figure 1. X-Ray Powder Diffraction Peaks for A) pure paclitaxel B) pure F127 C) nanocrystals and physical mixture of PTX and F127.
A)
B)
C)
33

Figure 2. TEM pictures of A) PTX/F127 nanocrystals (1/5 w/w) B) PTX crystal without addition of F127 surfactant. C) Physical mixture of PTX and F127 surfactant.
A)
B)
C)
34

Figure 3. TEM pictures of nanocrystals for thermal stability studies. A) Nanocrystals before 37 oC incubation. Measured size using ZetaSizer 176 nm B) Longer crystals formed by incubation at 37 oC for 2 hours. Measured size using ZetaSizer 258 nm.
A)
B)
35

Figure 4. Effects of Increasing F127 Concentrations on Nanocrystal Cytotoxicity. Nanocrystals of 1/10, 1/20, 1/30 w/w PTX/F127 were prepared and applied to H460 cells. F127 of various concentrations without PTX were also tested. Each data represents the mean ± standard deviation (n = 6).
Cytotoxicity on H460 Cells 100 nM PTX / F127 Nanocrystal
0
20
40
60
80
100
120
PTX (1
/10 F12
7)
PTX (1
/20 F12
7)
PTX (1
/30 F12
7)
F127
1/10
F127
1/20
F127
1/30
Untrea
ted
% C
ell V
iabi
lity
36

Figure 5. TEM of nanocrystals of A) PTX/F127 (1/10 w/w) and B) PTX/F127 (1/20 w/w). The white spherical structures in the background are micelles formed at high concentration of F127.
A)
B)
37

Figure 6. Illustration of nanocrystal stabilized by F127 at either low (1/5 w/w PTX/F127) or high concentration (1/20, 1/30 w/w PTX/F127). For nanocrystals prepared with low concentration of F127, monomers bound with high affinity. As more F127 was added, there was micelles formation in solution and formation of surfactant aggregates (hemi-micelles) on nanocrystal surface. Micelles could also compete for surface adsorbed F127 surfactants.
Surfactant binds With High Affinity
More F127 Added
Above CMC
• Surfactant binds With low Affinity
• Micelles competing for surface adsorption
38

Figure 7. Nanocrystal Size increase upon dilution at room temperature. A) Nanocrystals (1:5 w/w PTX/F127). B) Nanocrystals (1:10 w/w PTX/F127). C) Nanocrystals (1:20 w/w PTX/F127). D) Nanocrystals (1:30 w/w PTX/F127). Data represents mean value for at least 20 readings for each sample.
Nanocrystals (1:5 w/w PTX/F127) Size Increase upon Dilution at Room Temperature
0
50
100
150
200
250
300
350
0 5 10 15 20 25 30 35
Hours
Size
Det
ecte
d by
Zet
asiz
er
(nm
)
Undiluted 10 Fold 50 Fold
A)
Nanocrystals (1:10 w/w PTX/F127) Size Increase upon Dilution at Room Temperature
050
100150200250300350400450500
0 5 10 15 20 25 30 35
Hours
Siz
e D
etec
ted
by Z
etas
izer
(n
m)
Undiluted 10 Fold 50 Fold
B)
39

Figure 7. Nanocrystal Size increase upon dilution. A) Nanocrystals (1:5 w/w PTX/F127). B) Nanocrystals (1:10 w/w PTX/F127). C) Nanocrystals (1:20 w/w PTX/F127). D) Nanocrystals (1:30 w/w PTX/F127). Data represents mean value for at least 20 readings for each sample.
Nanocrystals (1:20 w/w PTX/F127) Size Increase upon Dilution at Room Temperature
0
100
200
300
400
500
600
700
0 5 10 15 20 25 30 35
Hours
Size
Det
ecte
d by
Zet
asiz
er
(nm
)
Undiluted 10 Fold 50 Fold
C)
Nanocrystals (1:30 w/w PTX/F127) Size Increase upon Dilution at Room Temperature
0
100
200
300
400
500
600
0 5 10 15 20 25 30 35
Hours
Siz
e D
etec
ted
by Z
etas
izer
(n
m)
Undiluted 10 Fold 50 Fold
D)
40

Figure 8. TEM of undiluted samples at the end of dilution-size experiment at room temperature. Notice the formation of micelles in samples with higher F127 concentrations. A) PTX/F127 (1/5 w/w) B) PTX/F127 (1/10 w/w) C) PTX/F127 (1/20 w/w) D) PTX/F127 (1/30 w/w).
B)A)
C) D)
41
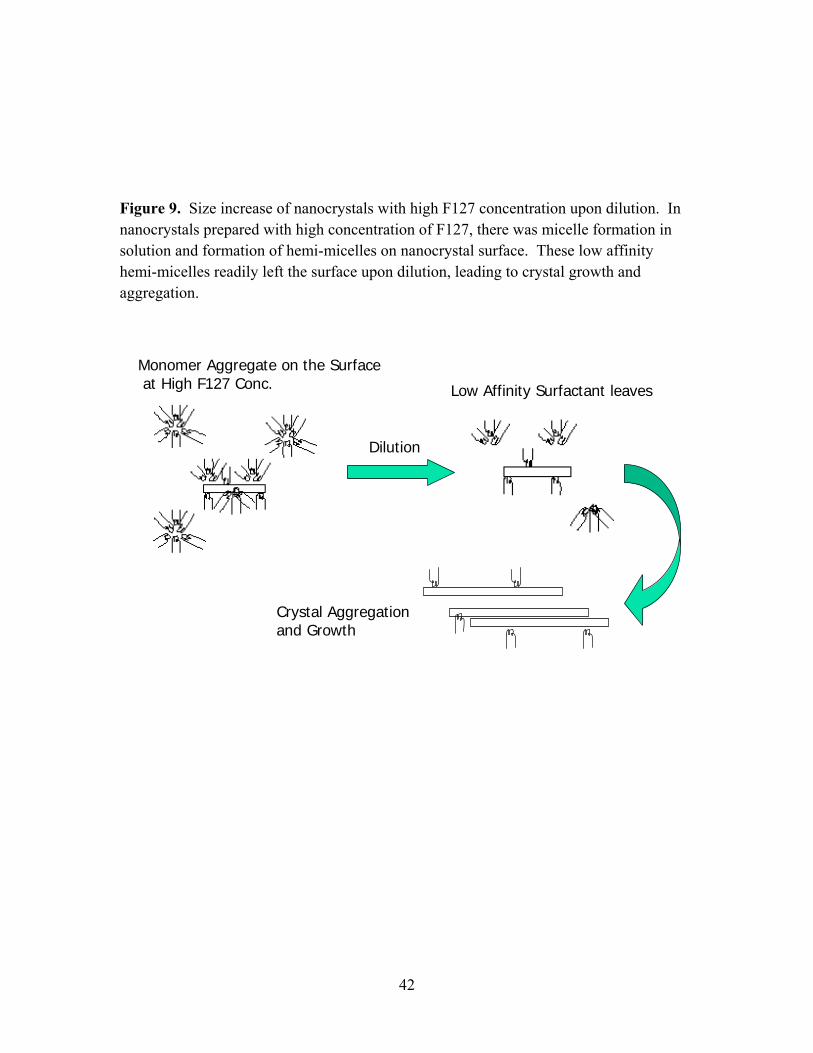
Figure 9. Size increase of nanocrystals with high F127 concentration upon dilution. In nanocrystals prepared with high concentration of F127, there was micelle formation in solution and formation of hemi-micelles on nanocrystal surface. These low affinity hemi-micelles readily left the surface upon dilution, leading to crystal growth and aggregation.
Dilution
Monomer Aggregate on the Surfaceat High F127 Conc. Low Affinity Surfactant leaves
Crystal Aggregation and Growth
42
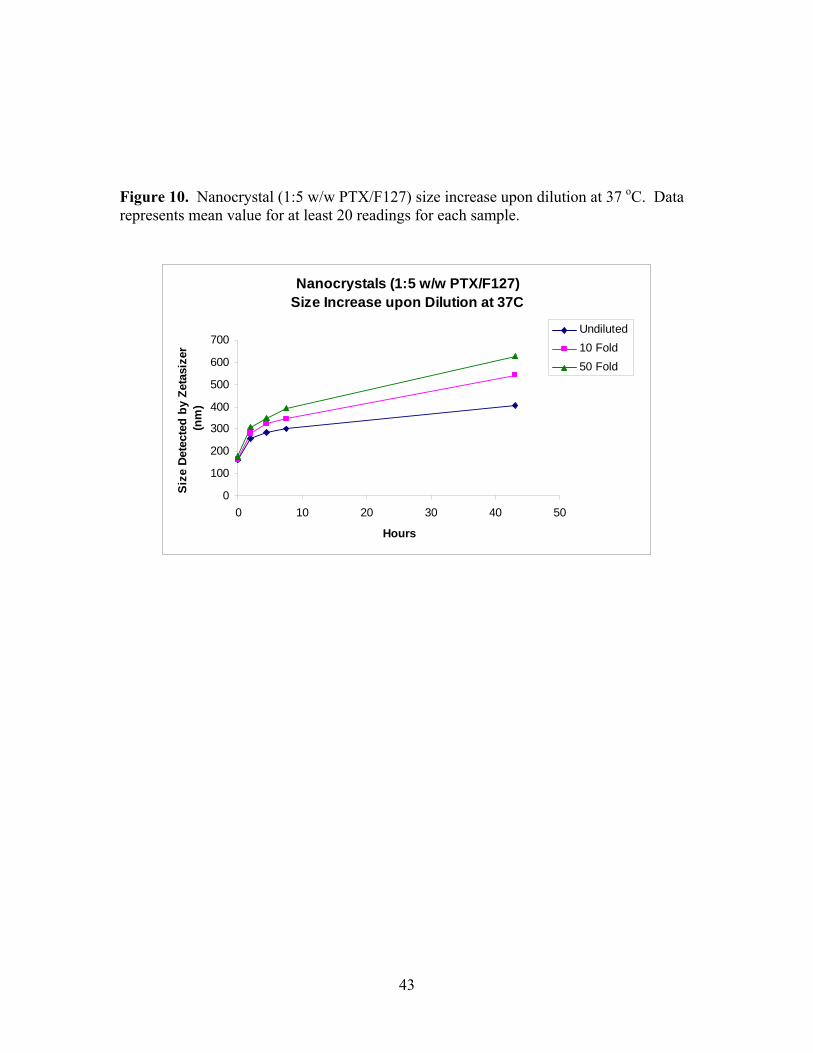
Figure 10. Nanocrystal (1:5 w/w PTX/F127) size increase upon dilution at 37 oC. Data represents mean value for at least 20 readings for each sample.
Nanocrystals (1:5 w/w PTX/F127) Size Increase upon Dilution at 37C
0
100
200
300
400
500
600
700
0 10 20 30 40 50
Hours
Size
Det
ecte
d by
Zet
asiz
er
(nm
)
Undiluted 10 Fold 50 Fold
43

Figure 11. Re-nanonization by the “Incubation-Sonication” procedure. After 37 oC incubation long crystals were formed due to thermal induced aggregation. Sonication was used to break down long crystals into small nanocrystals again. After 37 oC incubation for the second time, no regrowth in length was observed for these small nanocrystals.
44

Figure 12. Nanocrystal TEM pictures after Incubation-Sonication procedure. A) Break down of long crystals into nanocrystals by sonication for 15 min after 2 h 37 oC incubation. Measured size by ZetaSizer 139 nm. B) No observed regrowth into long crystals by incubating again at 37 oC incubation for 2 hours. Measured Size by ZetaSizer 163 nm.
A)
B)
45
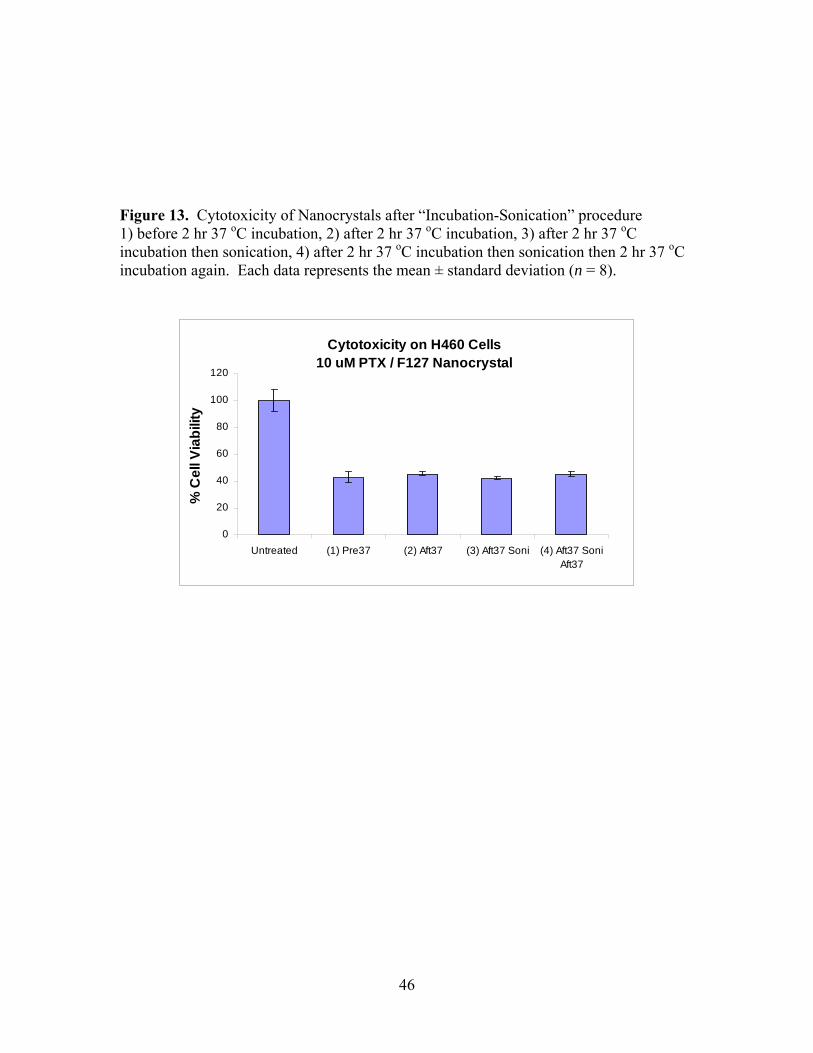
Figure 13. Cytotoxicity of Nanocrystals after “Incubation-Sonication” procedure 1) before 2 hr 37 oC incubation, 2) after 2 hr 37 oC incubation, 3) after 2 hr 37 oC incubation then sonication, 4) after 2 hr 37 oC incubation then sonication then 2 hr 37 oC incubation again. Each data represents the mean ± standard deviation (n = 8).
Cytotoxicity on H460 Cells10 uM PTX / F127 Nanocrystal
0
20
40
60
80
100
120
Untreated (1) Pre37 (2) Aft37 (3) Aft37 Soni (4) Aft37 SoniAft37
% C
ell V
iabi
lity
46

Figure 14. Extraction procedures of PTX with addition of acetonitrile. Acetonitrile was added to dissolve the nanocrystal structure prior to the extraction with tert-butyl methyl ether (TBME)
47
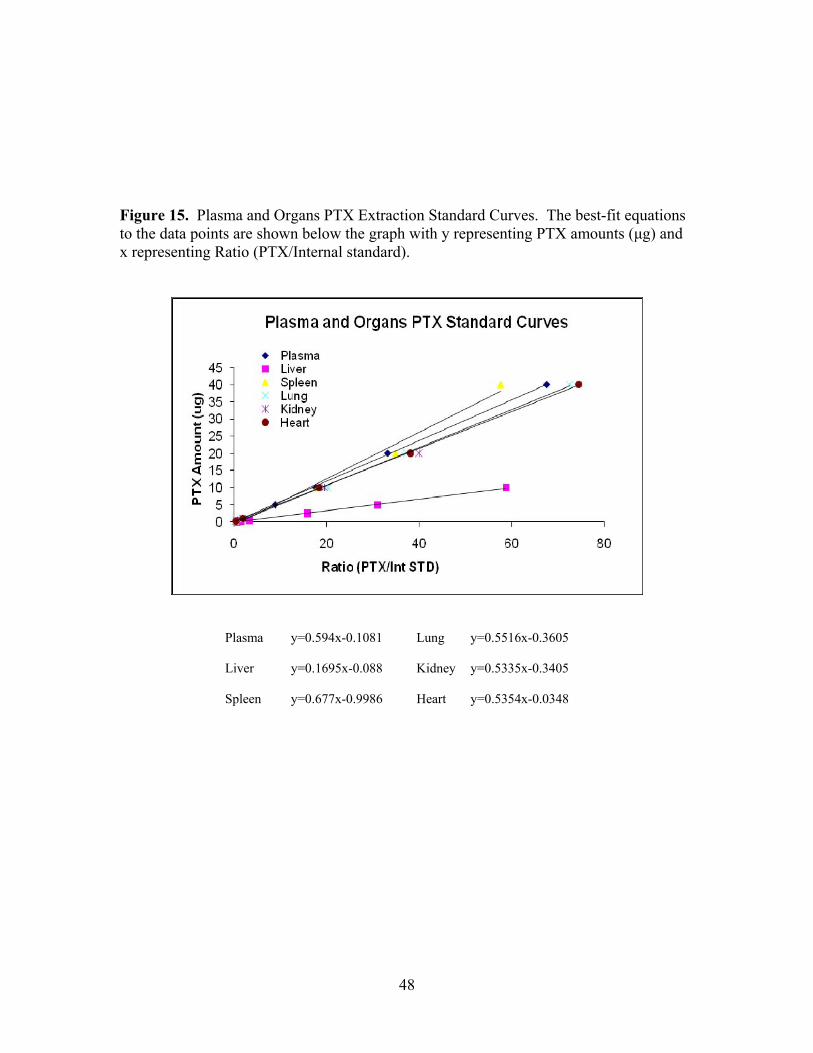
Figure 15. Plasma and Organs PTX Extraction Standard Curves. The best-fit equations to the data points are shown below the graph with y representing PTX amounts (μg) and x representing Ratio (PTX/Internal standard).
Plasma y=0.594x-0.1081 Lung y=0.5516x-0.3605
Liver y=0.1695x-0.088 Kidney y=0.5335x-0.3405
Spleen y=0.677x-0.9986 Heart y=0.5354x-0.0348
48

Figure 16. Nanocrystals biodistribution in mice plasma and organs 1 h post injection. Each data represents the mean ± standard deviation (n = 5).
Nanocrystal Biodistribution in Mice 1 h Post Injection
3.01
14.86
3.65
12.63
65.85
0
10
20
30
40
50
60
70
80
Spleen % Liver % Kidney % Lung % Plasma %
% o
f Rec
over
ed D
ose
49

References
1. Singla AK, Garg A, Aggarwal D 2002. Paclitaxel and its formulations. Int J Pharm 235(1-2):179-192. 2. Kim SC, Kim DW, Shim YH, Bang JS, Oh HS, Wan Kim S, Seo MH 2001. In vivo evaluation of polymeric micellar paclitaxel formulation: toxicity and efficacy. J Control Release 72(1-3):191-202. 3. Rowinsky EK, Donehower RC 1995. Paclitaxel (taxol). N Engl J Med 332(15):1004-1014. 4. Cheon Lee S, Kim C, Chan Kwon I, Chung H, Young Jeong S 2003. Polymeric micelles of poly(2-ethyl-2-oxazoline)-block-poly(epsilon-caprolactone) copolymer as a carrier for paclitaxel. J Control Release 89(3):437-446. 5. Lasser EC, Walters A, Reuter SR, Lang J 1971. Histamine release by contrast media. Radiology 100(3):683-686. 6. Na GC, Stevens HJ, Jr., Yuan BO, Rajagopalan N 1999. Physical stability of ethyl diatrizoate nanocrystalline suspension in steam sterilization. Pharm Res 16(4):569-574. 7. Bohm BH, Muller RH 1999. Lab-scale production unit design for nanosuspensions of sparingly soluble cytotoxic drugs. Pharm Sci Technolo Today 2(8):336-339. 8. Hintz RJ, KC. 1989. The effect of particle size distribution on dissolution rate and oral absorption. International Journal of Pharmaceutics 51:9-17. 9. Liversidge GG, Cundy KC 1995. Particle-Size Reduction for Improvement of Oral Bioavailability of Hydrophobic Drugs .1. Absolute Oral Bioavailability of Nanocrystalline Danazol in Beagle Dogs. International Journal of Pharmaceutics 125(1):91-97. 10. Peters K, Leitzke S, Diederichs JE, Borner K, Hahn H, Muller RH, Ehlers S 2000. Preparation of a clofazimine nanosuspension for intravenous use and evaluation of its therapeutic efficacy in murine Mycobacterium avium infection. Journal of Antimicrobial Chemotherapy 45(1):77-83. 11. Pignatello R, Bucolo C, Ferrara P, Maltese A, Puleo A, Puglisi G 2002. Eudragit RS100 (R) nanosuspensions for the ophthalmic controlled delivery of ibuprofen. European Journal of Pharmaceutical Sciences 16(1-2):53-61. 12. Jacobs C, Muller RH 2002. Production and characterization of a budesonide nanosuspension for pulmonary administration. Pharmaceutical Research 19(2):189-194.
50

13. Rabinow BE 2004. Nanosuspensions in drug delivery. Nature Reviews Drug Discovery 3(9):785-796. 14. Liu FP, JY. Zhang, Y. Conwell, C. Bathula, SR. Huang, L. 2009. Targeted Cancer Therapy with Novel High Drug-Loading Nanocrystals. In submission. 15. Lu SP, RJ. Forssberg, KSE. 2005. Interfacial Separation of Particles. ed., Amsterdam: Elsevier. p 427. 16. Linse P, Malmsten M 1992. Temperature-Dependent Micellization in Aqueous Block Copolymer Solutions. Macromolecules 25(20):5434-5439. 17. Van Eerdenbrugh B, Froyen L, Van Humbeeck J, Martens JA, Augustijns P, Van den Mooter G 2008. Drying of crystalline drug nanosuspensions-the importance of surface hydrophobicity on dissolution behavior upon redispersion. Eur J Pharm Sci 35(1-2):127-135. 18. Arunkumar ND, M. Rani, C. 2009. Nanosuspension technology and its applications in drug delivery. Asian Journal of Pharmaceutics 3:168-173. 19. Muller RH, Peters K 1998. Nanosuspensions for the formulation of poorly soluble drugs - I. Preparation by a size-reduction technique. International Journal of Pharmaceutics 160(2):229-237. 20. Ganta S, Paxton JW, Baguley BC, Garg S 2009. Formulation and pharmacokinetic evaluation of an asulacrine nanocrystalline suspension for intravenous delivery. International Journal of Pharmaceutics 367(1-2):179-186. 21. Merisko-Liversidge E, Sarpotdar P, Bruno J, Hajj S, Wei L, Peltier N, Rake J, Shaw JM, Pugh S, Polin L, Jones J, Corbett T, Cooper E, Liversidge GG 1996. Formulation and antitumor activity evaluation of nanocrystalline suspensions of poorly soluble anticancer drugs. Pharm Res 13(2):272-278. 22. Van Eerdenbrugh B, Van den Mooter G, Augustijns P 2008. Top-down production of drug nanocrystals: Nanosuspension stabilization, miniaturization and transformation into solid products. International Journal of Pharmaceutics 364(1):64-75. 23. Shatalova OV, Krivandin AV, Aksenova NA, Solov'eva AB 2008. Structure of pluronic F-127 and its tetraphenylporphyrin complexes: X-ray diffraction study. Polymer Science Series A 50(4):417-421. 24. Jacobs C, Kayser O, Muller RH 2000. Nanosuspensions as a new approach for the formulation for the poorly soluble drug tarazepide. International Journal of Pharmaceutics 196(2):161-164.
51

25. Chatterjee P, Gupta BS. . 2002. Absorbent Technology. ed., Amsterdam: Elsevier. p 162. 26. Amiji MM, Park K 1994. Analysis on the Surface-Adsorption of Peo Ppo Peo Triblock Copolymers by Radiolabeling and Fluorescence Techniques. Journal of Applied Polymer Science 52(4):539-544. 27. Croy SR, Kwon GS 2004. The effects of Pluronic block copolymers on the aggregation state of nystatin. Journal of Controlled Release 95(2):161-171. 28. Lin YN, Alexandridis P 2002. Temperature-dependent adsorption of pluronic F127 block copolymers onto carbon black particles dispersed in aqueous media. Journal of Physical Chemistry B 106(42):10834-10844. 29. Rosen MJ. 2004. Surfactants and interfacial phenomena. 3rd ed., Hoboken, N.J.: Wiley-Interscience. p xiii, 444 p. 30. Kocbek P, Baumgartner S, Kristl J 2006. Preparation and evaluation of nanosuspensions for enhancing the dissolution of poorly soluble drugs. International Journal of Pharmaceutics 312(1-2):179-186. 31. Lou HY, Zhang XM, Gao L, Feng FF, Wang JY, Wei XB, Yu ZQ, Zhang DR, Zhang Q 2009. In vitro and in vivo antitumor activity of oridonin nanosuspension. International Journal of Pharmaceutics 379(1):181-186. 32. Clement Mea 1992. Tissue distribution and plasma clearance of a novel microcrystal-encapsulated flurbiprofen formulation. The Pharmacologist 34:204. 33. Gassmann P, List M, Schweitzer A, Sucker H 1994. Hydrosols - Alternatives for the Parenteral Application of Poorly Water-Soluble Drugs. European Journal of Pharmaceutics and Biopharmaceutics 40(2):64-72. 34. Gao L, Zhang DR, Chen MH, Duan CX, Dai WT, Jia LJ, Zhao WF 2008. Studies on pharmacokinetics and tissue distribution of oridonin nanosuspensions. International Journal of Pharmaceutics 355(1-2):321-327. 35. Moghimi SM, Hunter AC, Murray JC 2001. Long-circulating and target-specific nanoparticles: Theory to practice. Pharmacological Reviews 53(2):283-318. 36. Mukherjee S, Ghosh RN, Maxfield FR 1997. Endocytosis. Physiological Reviews 77(3):759-803. 37. Connelly Jea 2001. Pharmacokinetics of a 14 day course of itraconazole nanocrystals given intravenously to allogeneic haematopoietic stem cell transplant (HCST) recipient. 41st Intersci Conf Antimicrob Agents Chemother A32.
52

38. Andes D 2003. In vivo pharmacodynamics of antifungal drugs in treatment of candidiasis. Antimicrobial Agents and Chemotherapy 47(4):1179-1186.
53