understanding indian trade policy: implications for the
TRANSCRIPT

Understanding Indian Trade Policy:
Implications for the Indo–SACU Agreement
Philip Alves

Copyright © SAIIA, November 2004
All rights reserved
THE SOUTH AFRICAN INSTITUTE OF INTERNATIONAL AFFAIRS
ISBN: 1-919969-15-2
SAIIA Trade Report No. 5
SAIIA National Office Bearers
Fred Phaswana Elisabeth Bradley • Moeletsi Mbeki Brian Hawksworth • Alec Pienaar
Dr Greg Mills

Understanding Indian Trade Policy: Implications for the Indo–SACU Agreement
Philip Alves1
Introduction The Southern African Customs Union (SACU)2 and India plan to start trade negotiations before the end of 2004. South Africa and India have been in talks on and off since 2001, and managed to sign a framework agreement in 2002. But progress halted when it came time to renegotiate the SACU Agreement, a procedure that resulted in the other SACU countries expressing a desire to be involved. This and a number of other events, such as the two World Trade Organisation (WTO) Ministerials at Doha and Cancun, have meant that talks with India have been on hold since then.
SACU Ministers formally agreed in June 2004 to re-open negotiations with India. A new framework agreement was discussed with India in September in Windhoek, Namibia. Much like the original, it stipulates, inter alia, that the process will evolve in two stages. The first will comprise a preferential trade agreement (PTA) covering trade in goods; the second envisages a graduation of this PTA into a so-called ‘new generation’ free trade agreement (FTA),
1 PHILIP ALVES is a trade research intern at the South African Institute of
International Affairs (SAIIA), based at the University of the Witwatersrand, Johannesburg. He wishes to thank Peter Draper, Dipankar Sengupta, Willem van der Spuy, Suresh Goel, Julius Sen and Brendan Vickers for important comments on earlier versions of this report. The usual disclaimer applies.
2 Botswana, Lesotho, Namibia, South Africa and Swaziland.

Understanding Indian Trade Policy 2
covering a much broader agenda.3 The end of 2005 has been set as the provisional deadline for the conclusion of negotiations. This report aims to assess the likely form, depth, and structure of the final agreement.
For historical reasons explored later on, trade agreements (bilateral, regional, or multilateral) have never played an integral role in India’s development strategy. And in spite of ongoing reform efforts that began in 1991 (or perhaps because of them), trade and liberalisation remain highly controversial, politically sensitive issues. Because of this, India is not only relatively inexperienced at managing big bilateral deals, but is also less willing than most to bear the risks of a genuinely intrusive agreement. SACU, on the other hand, has had ample exposure to the costs and benefits of negotiating and implementing expansive bilateral deals (e.g. the Trade, Development and Co-operation Agreement (TDCA) with the EU, and the upcoming FTA with the USA). However, in India’s case, it isn’t clear that SACU would be after something similar. Moreover, even if SACU was interested in a comprehensive agreement, India’s conservative approach to previous bilateral negotiations suggests it wouldn’t get one.
Market access-related opportunities certainly do exist for exporters in both regions, but SACU and India are far from being natural trading partners. This on its own suggests a commercially shallow agreement. Combined with evidence from India’s aforementioned bilateral deals with other countries, there is even reason to doubt whether the first stage PTA will result in meaningful changes to the current volume and structure of merchandise trade between India and SACU, let alone open avenues for sectors where to date there has been little or no bilateral trade at all.
3 ‘SACU states agree on a framework for FTA negotiations with India’, Tralac
Newsletter, 14 September, 2004, available at http://www.tralac.org/newsletter/ 14sep2004.html.

SAIIA Trade Report No. 5 3
To explore these assertions, the report proceeds in the following manner. We begin with the general: India’s economic history and the reform process of the 1990s, and the dramatic effects both have had on the way in which Indian trade policymakers and strategists view the world. This lays the necessary foundation for all of the subsequent analysis.
We then narrow things down to the specific: what has India strived for in previous bilateral trade negotiations? Crucially, how extensive has the coverage of those agreements been, and how deep do the concessions and commitments go? And for issues India has not yet negotiated in bilateral settings, what has been its position in the WTO? From the answers to these questions, what can we realistically expect the architecture of an Indo-SACU agreement to be?
Indian trade policy history This section tries to explain why India is often considered by many to be a relatively ‘difficult’ trading partner.4 While this brief tour of Indian economic history cannot hope to provide a complete set of answers, what follows will supply some general insights into the Indian ‘trade psyche’. In later sections, the analysis of India’s existing trade agreements, as well as its stance on important WTO issues, is conducted from this vantage point. As will become clear, none of what India has done in the trade arena post-1991 makes any sense without knowing something about what their economy and policy environment has evolved from.
4 For a report answering similar questions, but focussing less on history and more
on the internal workings (and associated problems) of the relevant branches of the Government of India, see Sen J, ‘Trade policy making in India: The reality below the waterline’, forthcoming 2004.

Understanding Indian Trade Policy 4
It is necessary to distinguish no less than three eras of Indian trade policy, stretching all the way back to the mid-1600s. First we consider the long trajectory prior to independence — time spent under the influence of the British (mid-1600s–1947). This may seem like ancient history, irrelevant to the analysis of a 21st century trade agreement. However, the blend of new policies and existing historical circumstances in each era set the stage for the oncoming of the next, and one needs to know in each instance where the economy came from in order to be able to grasp why policymakers reacted as they did.
The second era traverses the initial post-independence period (1947–1990), during which dependence on the global economy was reduced to an absolute minimum. And the third era, which has emerged as the best response to the crippling 1990–91 debt crisis, constitutes the years 1991 to the present. During this brief period, India has more or less transformed its economy from a policy-pinioned ‘license-permit-quota raj’ into a relatively deregulated, market-based system rapidly having to find its feet in the fiercely competitive international economy.5
The pre-independence period The British Raj spanned three distinct periods. The British East India Company (EIC) first established commercial activities in and near Bombay in 1661. At this stage they were seeking to avoid confrontations with the Dutch and the Portuguese, and thus attempted to develop trading links and privileges with the Mughal Empire in as discreet a fashion as possible. After establishing a second base at Madras, the EIC moved north and created a commercial centre at Calcutta in 1690. By this time the Company was
5 Rodrik D & A Subramaniam, ‘From “Hindu growth” to productivity surge: The
mystery of India’s growth transition’, NBER Working Paper No. 10376, 2004.

SAIIA Trade Report No. 5 5
finding it increasingly difficult to further its ambitions without resorting to force — the point had been reached where more could be made by appropriation and usurpation than by earning.
For roughly 100 years following victory at the battle of Plassey in 1757, the EIC commanded a monopoly on Indian trade flows, of which cotton textiles formed by far the biggest export component. But by the end of the 18th century, the nature and composition of Indian trade flows had changed significantly. From being comprised up until then mainly of value-added textiles and garments produced using traditional methods, Indian exports came to be dominated by non-manufactured goods, including cash crops such as raw cotton, jute and indigo. The proportion of manufactures in the Indian import basket rose accordingly.
The transition from the imperialist trading relationship under the EIC to direct colonial control is commonly explained by three factors. From the 1850s, the EIC’s monopoly over Indian trade began to erode. Attracted by the immense wealth being generated by EIC activities, both British and Indian entrepreneurs began to set up their own ventures (why they didn’t do so earlier is difficult to tell). The EIC certainly couldn’t use force against their own countrymen to preserve their monopoly privileges, as they had done in the past to French and Dutch undertakings.
Perhaps more importantly, the enormity of the fortunes being earned in India attracted interest from English authorities. They understandably wanted more control over the administration of Bengal, and forced the necessary changes to the EIC’s constitution in order to get it.6
The third force driving Britain’s official interest in the subcontinent was the long-standing mercantilist opposition in Britain to the payment of bullion for imports from India; it was
6 Landes DS, , The Wealth and Poverty of Nations. London. Little, Brown & Company
(UK), 1998, Chapter 11.

Understanding Indian Trade Policy 6
argued that land revenues generated in Bengal should be used instead. By 1858, these factors had provided enough incentive to the British government for bringing India officially under the control of the Empire. Indian trade volumes under colonial rule continued to grow, while the Indian textiles sector continued to shrink.7
The ‘violent’ changes to trade and production, along with various other socio-economic distortions introduced under colonialism (to industry more so than agriculture), have routinely been considered by mainstream Indian economic history to be at the root of India’s underdevelopment.8 In its common formulation, this thesis states that the decline in traditional textile production, caused by worsening terms of trade under British control, led to India’s more widespread de-industrialisation, which in turn halted economic growth entirely.
Roy holds markedly different views.9 While not going so far as ignoring the problems colonialism introduced, he argues carefully that this traditional view of things is perhaps too simple. First, industrial decline was more or less restricted to cotton textiles — other industrial activities showed robust growth and employment
7 Right up until the 1990s, India was on average more open to world trade during
the colonial period (1858-1947) than at any time in its history. Exports as a percentage of GDP rose from around 2% in 1800 to 20% at the start of World War One. By 1970 it was down to its lowest post-independence level of 8%, but by the mid 1990s it was back up to about 20%. See Roy T, ‘Economic history and modern India: Redefining the link’, Journal of Economic Perspectives, 16, 3, 2002, pp.109–130. In 2002 trade comprised 21% of GDP. See Appendix 1 for comparative openness figures.
8 See for example, Habib I, ‘Colonisation of the Indian economy’, Social Scientist, 3, 32, 1975, pp.23–53; or Sarkar S, ‘The colonial economy’, in Sarkar S (ed.), Modern India: 1885–1947. New Delhi: MacMillan, 1983, Chapter 2.
9 Roy T, op. cit., cites Morris MD, ‘Towards a reinterpretation of nineteenth century Indian economic history’, Journal of Economic History, 23, 6, 1963, pp.606–18, as the first real ‘dissenter’; and Kumar D & M Desai (eds), The Cambridge Economic History of India, 2. Cambridge: Cambridge University Press., 1983 as the publication that sparked volumes of research questioning the orthodoxy.

SAIIA Trade Report No. 5 7
growth throughout the period of British control. Also, the decline in textiles didn’t continue unabated during the rest of the 19th century and into the 20th, which casts doubt as to colonialism’s causal role. Moreover, the decline began in the early to mid-1700s, before the industrial revolution in Britain (factory products began to appear sometime between 1780 and 1820, and world prices began to change only after their volumes had grown sufficiently). This is supported by the data: the share of Indian textiles in Britain’s total trade with the rest of Europe was 20% in the 1720s, but had already fallen to 6% by the 1780s.10 That mechanised British cotton products eventually (i.e. by the early 1800s) out-competed Indian hand-woven textiles in both the foreign markets and India’s domestic market is beyond doubt, but the notion that it was the initial reason for the Indian textile industry’s loss of international competitiveness is clearly false.
Relative to agriculture, textiles accounted for a small proportion of aggregate output and employment. More importantly, the losses incurred by textile producers were more than offset by gains accruing to the majority of consumers, who were now paying less for their clothing. If one is looking for the source of India’s economy-wide productivity collapse and subsequent growth slow-down, one has to start in the sector that accounted at that time for the biggest proportion of output, prices, productivity, employment, and all other macroeconomic fundamentals — agriculture.11 In Roy’s view
10 Clingingsmith D & JJ Williamson, ‘India’s de-industrialisation under British rule:
New ideas, new evidence’, NBER Working Paper No. 10586, 2004. 11 Unfortunately, a comprehensive review of the debate surrounding the causes of
India’s de-industrialisation, and whether or not the decline in the textile industry was an event big enough to halt development, is beyond the scope of this report. However, for two excellent contributions see Raychaudhuri T, ‘The mid-eighteenth century background’ in Kumar D & M Desai (eds), op. cit., 1983; and Clingingsmith D & JJ Williamson, ibid. In their estimations, the collapse of the Mughal Empire in about 1750 is the exogenous shock that surpasses all others (including an unfavourable global economic environment) in its potential to be the root cause of India’s long and slow decay.
Understanding Indian Trade Policy 8
therefore, a shrinking cotton textiles sector, caused by colonialism or not, ‘…was not capable of causing economy-wide distress’.12
Nevertheless, the underdevelopment-due-to-colonialism thesis was the popular view circa independence in 1947. In his review of the debate, Roy provides an apt description of the position held over the years by many Indian economic historians:13
According to informal consensus, markets and institutions built under the colonial situation retarded India and enriched Britain. Indian society and economy without colonialism, it was suggested, was capable of doing better than it actually did … In the leftist-nationalist formulation, the ‘totality’ of colonialism was defined in terms of [the] integration of India into world capitalism in a ‘subservient’ position’. Whichever side is correct in all this, the most important issue is
that politicians believed strongly in the ‘informal consensus’, and it therefore underwrote Indian economic nationalism during the first 40-odd years of independence. It provided a readily acceptable explanation of the dreadful socio-economic situation the British left behind, and provided enough incentive to focus all available attention of finding ways to become self-sufficient. Belief in the ‘dependency’ rhetoric remained more or less intact until the 1980s, and over the years was responsible for the construction of a monolithic public sector rivalled only by an equally large anti-export bias.14 Tragically, India turned its back on the world precisely at a time when the global economy began to boom.
12 Roy T, op. cit., p.112. 13 Ibid., p.122. 14 By way of explanation, any economy in which a large percentage of producers
operating in tradable goods industries have little or no incentive to produce for the export market is considered to possess an anti-export bias.

SAIIA Trade Report No. 5 9
The evolution of protectionism, 1947–1991 The desire for self-sufficiency necessitated a development strategy anchored by large-scale import substitution. Known as the Mahalanobis model, it called for massive initial investment in ‘heavy industries’, a capital-intensive exercise requiring a lot of resources India didn’t have. Furthermore, the drive for self-sufficiency required substantial industrial diversification. But the scarcity of capital, coupled with the Government of India’s desire to create jobs through the encouragement of small-scale industries (SSIs), meant that a large number of the newer industries never managed to achieve significant economies of scale, giving rise to a generally high-cost industrial sector. But this wouldn’t have raised concerns at the time, because policymakers never intended India to be a major player in the global economy.
The Planning Commission,15 in its first Five Year Plan (1951–1955/56), had the following to say on matters concerning trade:16
The expansion of trade has, under our conditions, to be regarded as ancillary to agricultural and industrial development rather than as an initiating impulse in itself. In fact, in view of the urgent needs for investment in basic development, diversion of investment on any large scale to trade must be viewed as a misdirection of resources.
15 India’s Planning Commission, established in 1950, played the most influential
role in the formulation of economic policy (its potency has lessened since 1991). Their mandate covered literally everything. Pricing, taxation, savings, investment, fiscal and monetary policy, capital ownership and production controls are just some of the issues they sought to understand and manipulate. Their overarching goal was to figure out, given the vastness of the country and relative lack of productive capacity, the best allocation of India’s resources in order to ensure specific long-term development goals were achieved.
16 Planning Commission, Chapter 2: Objectives, techniques and priorities in planning, 1951. Online at http://planningcommission.nic.in/plans/planrel/fiveyr/ welcome.html.

Understanding Indian Trade Policy 10
This summarises neatly the view of economists and policymakers in the early years of independence. Trade and trade policy were not of primary importance, and the latter would be determined automatically by whatever was needed to augment and make more favourable the conditions under which domestic industry (and agriculture) had to operate. What happened to trade policy in this environment?
Interestingly, conventional protective measures were not an immediate priority of the first post-independence government. To be sure, quantitative restrictions (QRs) and tariffs were employed from day one, but it is generally accepted that use of the former reached its height only in the 1970s, while use of the latter began in earnest only from the 1960s. How then, were infant industries protected?
The Industrial Development Regulation Act (IDRA) of 1955 ensured that licences and permits, which could only be issued by central government, controlled most economic activity. Licences were required to set up industrial units as well as to expand capacity. Permits were required to import and export. And the process by which they were awarded was entirely subject to bureaucratic discretion. Under these circumstances, even if QRs and tariffs were not comprehensively employed, trade (especially in capital goods) was de facto restricted (and local industry de facto protected), because only a business with the right license was able to import. Similarly, there was no leeway for autonomous action on behalf of exporters, as raising resources to export without state approval was illegal under the IDRA.
The Mahalanobis development strategy began to run into difficulties within a decade or so of its initial implementation. As mentioned, it called for investment in relatively capital-intensive ‘heavy industry’, which required the large-scale importation of all sorts of machinery and equipment. But the Indian economy lacked the export capacity to pay for these imports. The state-driven ‘inward-focus’ exacerbated that problem. Fewer resources available

SAIIA Trade Report No. 5 11
for export-oriented industries combined with a high and rising import demand resulted in rapidly mounting pressure on foreign exchange reserves. The overall situation was worsened by droughts in the 1960s, which gave rise to a massive food shortage that had to be remedied with yet more imports.17
Thus, after the costs of ignoring the balance of payments during the second Plan period became obvious, big efforts were made during the third and fourth (1960/1–1969/70) to encourage and expand exports. And to a degree, they worked. Export growth went from around zero between 1951 and 1960 to an annual average expansion of about 4% in the subsequent 5 years. A strong international economy, government subsidies, devaluation of the rupee, a widened domestic industrial and agricultural base, and favourable institutional and fiscal conditions are all cited as reasons for the increase. Examples of institutional innovation include the establishment of the Board of Trade, various Export Promotion Councils, and the Minerals and Metals Trading Corporation.18
Nevertheless, trade deficits and ‘balance of payments difficulties’ are a consistent theme in every Five Year Plan right up until the late 1980s; export promotion clearly never did quite enough.
17 Unemployment was also a serious concern. To address it directly, the state
reserved certain items, such as textiles and garments, for SSIs. That is, modern, mechanised, scale- and capital-intensive producers were barred from operating in these sectors. However, this raised average costs, and because most of the sectors reserved for SSIs included traditional export industries, SSI promotion inadvertently hampered the development of a competitive export sector. This in turn stunted growth and overall job-creation. See Sengupta D & P Banerjee, ‘India and global economic governance: The search for an appropriate coalition’. Report presented at the IBSA Dialogue, Global Governance and Development Workshop, Johannesburg, 5 and 6 July 2004.
18 Planning Commission, Chapter 5: Foreign trade, 1969. Online at http://planningcommission.nic.in/plans/planrel/fiveyr/welcome.html.

Understanding Indian Trade Policy 12
Some details of the protective shell Although there is nothing specific in the Plans, clues as to the nature and extent of the protection employed can be found.19 Beyond the IDRA’s provisions, QRs of various sorts were the primary weapons in the trade policymakers’ arsenal. Generally speaking, two aspects determined the degree to which imports were restricted: how essential they were to Indian industry, and how much of a domestic industry the imports threatened.20 Thus manufactured consumer goods were completely banned, agricultural products the next most heavily restricted, and capital goods and raw materials (particularly minerals) required for industry the least so.21
Complementing the quantitative restrictions (QRs) was a convoluted tariff structure, combining ad valorem and specific duties. As mentioned, tariffs became popular during the 1960s, and their coverage and complexity escalated from then onwards. By 1991–92, peak rates tipped the scales at 150% on some products, trade weighted average tariffs stood at 72.5%, and there were 22 basic ad valorem rates.22
The two outstanding features of the tariff regime were • that very few duties were founded on any economic reasoning
and/or welfare analysis; and • the development of a large and confusing system of exemptions.
19 It is not clear where one would find this information, as the now freely available
export/import (EXIM) policies, which do specify these details, only began in 1985. 20 Das DK, ‘Manufacturing productivity under varying trade regimes: India in the
1980s and 1990s’, ICRIER Working Paper No. 107, 2003. 21 Virmani A, ‘Economic reforms: Policy and institutions, some lessons from Indian
reforms’, ICRIER Working Paper No. 121, January 2004a. 22 Ahluwalia MS, ‘Economic reforms in India since 1991: Has gradualism worked?’
Journal of Economic Perspectives, 16, 3, 2002, pp.67–88.

SAIIA Trade Report No. 5 13
Thus compared with the QR system, the erection of tariff barriers and the specific exemptions to them was an ad hoc process driven by a combination of pressure from lobby groups and government priorities, such as the need for alternative sources of revenue.23 Corruption and non-transparency notwithstanding, the QRs were at least established with specific developmental goals in mind.
After 1991: Relenting to a different worldview The QR and license/permit systems had evolved into incredibly complex and administratively costly monsters by the 1970s. The process of liberalisation began in the 1980s. But the project was slow and drawn out. For example, QRs on manufactured consumer goods and agricultural products were completely eliminated as late as 2001, and even then only as a result of losing a WTO case arising from a complaint lodged by the US.24
Before any of it could happen, however, entrenched ways of thinking required alterations. The big debate surrounded the principal tool that should be used to manage trade flows (and thus the balance of payments): a semi-managed exchange rate, or the established hybrid system? This is not to say that the exchange rate had never been used in the past, but rather that the debate was over whether or not use of the exchange rate should fully replace existing methods.
The government view was that Indian exports were supply constrained, and thus unresponsive to price changes brought about by altering the exchange rate. Essential imports were similarly considered price-inelastic. But ‘unnecessary’ or ‘luxury’ imports were not. Given that the import basket would contain some of both, it was argued that the targeted QR and license systems were the most
23 Virmani A, op. cit., 2004a. 24 Ahluwalia MS, op. cit.

Understanding Indian Trade Policy 14
efficient way of managing the volumes of luxury imports. The exchange rate, on the other hand, would levy an inequitable ‘tax’ on essential imports.25
Reformists had at least three good responses. One, the exchange rate cost nothing to administer. The second related to the failure to create enough jobs, a key long-term policy goal of Nehru’s overall vision for India. Reformers observed that, so long as imports of consumer manufactures remained banned, industrialists would have strong incentives to raise the capital intensity of production, as this was the cheapest way to replace these imports. Their third argument was of a more standard and general nature. Restricting the imports of capital goods and essential raw material inputs was inhibiting productivity and creating unnecessary economy-wide inefficiencies.26 They saw huge potential for better quality, imported intermediate inputs to improve industrial productivity and strengthen overall GDP growth.
By the 1980s these claims were finding considerable empirical support. And because they were based on simple observations, traditionalists were finding them increasingly difficult to refute. But as the reader will easily be able to see, they didn’t fully discredit the view that QRs were a better way to manage trade flows. Thus intellectual conformists simply refused to acknowledge that the potential inefficiencies of the exchange rate system would probably be less than those existing in the Indian set up at the time. And until 1991, they had the requisite political backing. Only when India’s balance of payments position worsened to crisis point did attitudes finally begin to change.
25 Ahluwalia MS, ibid.; Virmani A, op. cit., 2004a. 26 Virmani A, ibid.

SAIIA Trade Report No. 5 15
The eighth Plan (1992/3–1997/8) has the following sombre comments on the 1991 crisis. The excerpt is long, but describes the situation better than any other source:27
The Balance of Payments situation has been continuously under strain for over almost a decade. During the Seventh Plan period the ratio of the current account deficit to GDP averaged 2.4%— far above the figure of 1.6% projected for this period in the Plan document. This deterioration in the Balance of Payments occurred despite robust growth in exports in the last three years. The already difficult Balance of Payment situation was accentuated in 1990–91 by a sharp rise in oil prices and other effects of the Gulf War. With access to commercial borrowings going down and the Non-Resident deposits showing no improvement, financing the current account deficit had become extremely difficult. Exceptional financing in the form of assistance from IMF, the World Bank and the Asian Development Bank had to be sought. While the immediate problems have been resolved to some extent, it is imperative that during the Eighth Plan steps are taken to curb the fundamental weakness in India’s Balance of Payments situation so that it does not cause serious disruption to the economy. The events described above finally tipped opinions in favour of
reform, and the policy environment became more amenable to change. Internal trade became freer as the license/permit system loosened its control of economic activity and increasing emphasis was placed on the need for a more competitive export sector. Slowly but surely, the two biggest events in recent Indian economic history — the initiation of a market-based reform project and an incremental re-introduction to the global economy — began to take shape. But despite strong commitment to affect change, the going has been very slow and very difficult. Trade policy reform is no exception.
27 Planning Commission, Chapter 1: Objectives and orientation, 1992.

Understanding Indian Trade Policy 16
The lingering irrelevance of the outside world India’s behaviour before and during the Uruguay Round (UR) strongly suggests that the impetus behind the reform process did not immediately translate into a greater willingness to engage in trade negotiations. And perhaps more relevant to the arguments to follow, the UR seems to have played almost no role at all in cementing or accelerating the liberalisation process.
At Punta del Este, India was unhappy with the idea of a new Round in the first place, and predictably opposed the inclusion on the GATT agenda of services, intellectual property and trade-related investment. Along with Brazil, which was in a similarly defensive position (but for different reasons), this strategy led to the formation of the Group of Ten (otherwise known as the ‘like-minded’ group or LMG). India perceived itself as the leader of developing country interests. But the LMG position rapidly weakened, and in the end India stood alone in its opposition to a new Round. The resultant compromise was an agreement with the US that services and goods trade would be negotiated on separate tracks.28
India was therefore actively involved in the UR preliminaries, but its absence became conspicuous during the Round itself.29
In the view of unfriendly observers, India has been a pirate: it has made sporadic forays designed to throw negotiations into disarray … However, whether hostile or not, all observers agree that India has not taken any bold initiatives to give a new direction to the proceedings in
ny of the negotiation groups. a There are three basic reasons explaining Delhi’s strict instructions
not to give anything away at the UR. First, due to India having been such a small player in international trade since the end of the Second
28 Srinivasan TN, ‘India in the Doha Round’, 2003. Available online at
http://www.econ.yale.edu/~srinivas/India%20in%20the%20Doha%20Round.pdf. 29 Desai AV, ‘India in the Uruguay Round,’ Journal of World Trade, 23, 6, 1989, pp.33–
58.

SAIIA Trade Report No. 5 17
World War, its share in other countries’ export baskets was so small that any reciprocal tariff concessions would almost certainly result in a net welfare loss. Second, and related, because import-substitution had resulted in such a wide variety of industries in India, some of them inefficient, any reciprocal concessions to economies with a narrower industrial base (presumably more in line with its comparative advantages), would hurt India more than it would the other economy. In a multilateral context, where the ‘other economy’ is the whole world, this implies huge pressure on India’s import-competing industries.
Third, and perhaps most important, India’s export sector has suffered (and to some degree still suffers) serious policy-related supply-side impediments to rapid and effective expansion. The textiles sector provides a good working example that is relevant to this day. As mentioned much of SSI drive occurred in export industries like textiles and garments. They effectively prevented Indian producers from realising the economies of scale necessary to reduce costs and compete internationally. The Indian textile industry came to be characterised by a wide array of technologies and production techniques, each with an army of high cost small producers; the stagnating mill sector, discriminated against by SSI policy, attracted less and less investment. And although it was clear that things needed to change in order to compete with China and other parts of East Asia, SSIs in textiles employed millions who would be out of jobs if the modern sector were allowed to grow. Even though in 1994 it was known that the MultiFibre Arrangment (MFA) would be phased out in 10 years, steps to reform this sector commenced only in 2000 and the first phase will be over by 2004.
These problems, amongst others, led Delhi to believe that any substantial measure of reciprocal liberalisation during the UR would result only in net welfare- and job-losses. Thus Desai’s observation:30
30 Desai AV, op. cit., p.56.
Understanding Indian Trade Policy 18
‘… an unspoken consensus is emerging between India and the major powers that India should be allowed to shelter behind s&dt (sic) and abdicate an active role’.
In short, market access negotiations in the UR were unattractive, and India’s attitude to other issues was already well known. Together these made India an unattractive bargaining partner. This resulted, by and large, in India being left alone or ignored, which provided ample time and space to champion the cause of special and differential treatment, and to concentrate on its few defensive interests.31 Essentially, by declining to aggressively seek concessions from its major trading partners, India had found a way to deflect attention from its own protection levels, and thus effectively prevented UR negotiations from interfering with its reform process at home. As will be argued later, this desire to minimise external pressures to liberalise, arising potentially from the WTO and bilateral agreements, remains a feature of the Indian reform strategy.
Nevertheless, most believe that the trade and exchange rate reforms have been the most successful of the entire reform package.32 The 1980s saw the dismantling of controls on imported goods required by exporters. New policy in 1992 liberalised the imports of most capital and intermediate goods. 1995 saw the beginnings of similar reform in consumer goods, although much involved substituting bans for a ‘special import licence’ (SIL).33 As mentioned
31 The notable exception was India’s very keen involvement in attempted changes
to the MFA. 32 Privatisation of state assets, as evidenced by comments made to the press by
some Communist Party representatives immediately after the Congress party’s win in the recent general election, have met with less success. See for example ‘India shining campaign led to BJP debacle, say economists,’ The Financial Express, online edition, 14 May 2004. Reforms to infrastructure, particularly in the power sector, have also performed poorly. See Virmani, op. cit., 2004a.
33 A tradable import permit given only to exporters in relation to export value. See Das DK, op. cit.

SAIIA Trade Report No. 5 19
already, after a long twenty years, QRs are finally no longer an outstanding feature of Indian trade policy.34
Tariff liberalisation in most areas (agriculture being the notable exception) has been similarly successful. Although India still has some of the highest rates of nominal protection in the world, it is comfortably within its WTO obligations. The tariff structure is much simpler than it was 20 years ago, and the current trade-weighted average tariff is about 29%, two and half times less than the 1991 value. It should be noted, however, that this is actually four percentage points above comparable values in the mid-1990s, indicating that there are still plenty of sensitive industries within India that are successfully lobbying the government. Encouragingly, the biggest source of within-government resistance to tariff reform has been eroded — customs duties as a percentage of GDP have dropped from 4% in 1988 to 1.8% in 2003.35
Synopsis Trade policy during the period 1947–1991 was determined in the main by three exogenous considerations. First, and initially foremost, was the overarching goal of self-sufficiency, which in turn was part of pervasive negative reaction to the open economy experiences under colonialism. Export-led growth was out of the question.
34 Given that multilateral disciplines prohibit QRs, one might expect the UR to have
played some significant role in India’s reforms in this area. The UR is, however, never mentioned in accounts of that process. See Virmani, op. cit., 2004a, pp.46-48; or Das DK, ibid., pp.3–5 for two good examples in which any number of internal forces at work in the early 1990s are discussed, but no mention of UR pressure is made. It is only since the formation of the WTO and the associated dispute settlement mechanism in 1995 that external pressure has become important to QR reform. See Reserve Bank of India (RBI), Currency and Finance Report, 2002-3, 2004.
35 This point is raised because despite a general acceptance of the need to cut tariffs, the Revenue Ministry was often as vociferous as the private sector in its attempts to preserve the old regime. See Virmani, ibid.; and RBI, ibid.

Understanding Indian Trade Policy 20
Second, trade policy had to complement whatever each Five Year Plan was trying to achieve. Each Plan made different projections regarding essential import requirements and which export industries would earn the requisite foreign exchange; restrictions were changed accordingly. A distinct lack of continuity in the formulation of trade policy resulted.
The third consideration, which rapidly assumed top priority, was the sensitivity of the balance of payments. It loomed large in the minds of macroeconomic planners, and ultimately determined all trade policy decisions. In short, and the first factor above notwithstanding, trade policy developed in a patchwork fashion, determined chiefly according to opportunistic attempts at fixing problems in the external accounts.
The advent of the crisis in 1991 set the stage for a change in the way trade policy was viewed. Although it still has many detractors, mainstream opinion on the costs and benefits of a more liberal external sector has now swung almost 180 degrees. Instead of being labelled as the chief cause of economic backwardness, playing the global capitalism game is now part of India’s overall development strategy.
However, there are two reasons why trade will not for a long while spearhead Indian development policy. The first is that domestic demand and productivity improvements, not demand for India’s exports (despite their impressive growth in recent times), are still by far and away the largest components of GDP growth.36 This results from the simple fact that trade as a whole (exports plus imports) accounts for only a fifth of GDP (see Appendix 1). Poor export performance doesn’t hurt Indian growth in the same way as it does in SACU countries. This suggests that export-led development a-la South Korea or Taiwan is an unrealistic near-term option for
36 Virmani A, ‘India’s economic growth: From socialist rate to Bharatiya rate of
growth,’ ICRIER Working Paper No. 122, February 2004b.

SAIIA Trade Report No. 5 21
Indian policymakers, which in turn suggests that the need for expansive trade agreements is less than it is in developing countries with smaller domestic markets.
The second reason why trade doesn’t take centre-stage in Indian development is more simple: the WTO, despite now being almost ten years old, remains ‘… deeply unpopular amongst the people and is the favourite whipping boy for politicians…’.37 It remains to be seen whether bilateral and regional agreements, assuming they become bigger and more intrusive over time, will suffer similar problems. Characterising the fundamentals of the current trade strategy Despite the changes, there remains a pronounced anti-export bias in India. As just mentioned, the ratio of imports and exports to GDP is relatively low at around 21% in 2002, and India’s share in world exports, although rising gradually since 1983, is still only 0.8%. Similarly, India’s share of world imports was 0.9% in 2002, barely up from 0.7% in 1983. According to some gravity model work performed by the IMF, India’s actual trade between 1995 and 1999 averaged about 36% below its potential, indicating the extent to which various non-tariff barriers, be they due to policy or commercial realities, still exist.38
But whatever the details, the basic point is that export orientation is still fairly novel in Indian industry. This explains the Government of India’s interest in export promotion initiatives, which since 1991 have included, inter alia, the ‘extreme focus’ product strategy of 1992, the ‘15 commodity 15 country’ strategy of 1995, and the new special economic zones, which are more comprehensive in their ability to
37 Hoda A, ‘India and the WTO: Issues, challenges and prospects of co-operation
with the ASEAN’. Mimeo, 2004, p.5. 38 RBI, op. cit.

Understanding Indian Trade Policy 22
facilitate export industries and TNC activity than the prototypical export processing zones.39
What is the nature of the underlying vision driving these initiatives? And into what sort of liberalisation strategy has this translated since 1991? Has it worked, and is it likely to change significantly in the near future?
There are a number of options available to a developing economy slowly opening itself to the world. Safe in the knowledge that it can out-compete most countries in a large number of industries, China has embarked on an aggressive unilateral liberalisation process. They have viewed their WTO obligations as much more of an opportunity than a burden, and in so doing present an attitude distinctly different from that in India.40 Other countries have interpreted the failures at Seattle and Cancun as good reasons to pursue their interests through bilateral and regional agreements. Still others place paramount importance on making a success of the WTO process. The most common, however, is a combination of the latter two.
Lawrence and Chadha41 have used the label ‘incremental unilateralism’ to describe the Indian liberalisation strategy over the past decade. This involves active support for the WTO process and the occasional bilateral trade agreement or investment treaty, but liberalisation is driven almost entirely by decisions taken on a unilateral basis. Neither WTO commitments nor bilateral agreements will be allowed to pressurise the process beyond a pace comfortable to all factions in India.
39 Ministry of Commerce and Industry (MOCI), various documents available online
at: http://commerce.nic.in; and WTO Secretariat, Trade Policy Review: India, Document No. WT/TPR/S/100. Geneva, WTO, 2002.
40 Srinivasan TN, op. cit. 41 Lawrence RZ & R Chadha, ‘Should a US–India FTA be part of India’s trade
strategy?’ Mimeo, 2004.

SAIIA Trade Report No. 5 23
This characterisation is broadly correct. India’s WTO commitments are amongst the most lenient of all members, and they have not signed any comprehensive free trade agreements with their major trading partners in the West (that is, the US or the EU).42 Furthermore, because nominal rates were so high relative to applied rates around the time of the 1991 crisis, policymakers recognised that there was plenty of ‘water’ that could be ‘squeezed’ out of the tariff structure without risking any serious consequences.43 Clearly trade negotiations and other external commitments have not played a big part in trade liberalisation — the impetus comes from within.44
Two closely related factors explain the above assertion. India is keenly aware of the limits imposed on its negotiating flexibility by the sensitivities surrounding some of the other elements of the reform package. Trade reform cannot go ahead in isolation, and as mentioned already, it has never been the flag-bearer of the broader reform process. Consequently, India’s strategy in trade negotiations revolves around preserving as much ‘policy space’ as possible.
As with any strategy, this way of doing things has its risks. Lawrence and Chadha45 are quick to point out that despite the successes of the past decade, many of the reforms are still in their infancy, and many more are yet to be drafted. This means that some of the reforms currently in place are reversible — that there is a real threat of ‘backsliding’ on some commitments. They argue that
42 India’s non-WTO trade agreements are discussed in detail in section ‘The
medium term export strategy, 2002 — 2007’ below. For the current argument, it is enough to point out that the three agreements India has with globally important partners (one each with Thailand and Singapore and another, separate agreement with ASEAN) either have not yet progressed beyond the framework stage (ASEAN and Thailand), or are still under negotiation (Singapore).
43 Virmani A, op. cit., 2004a 44 An important exception here is the aforementioned role they have played since
1995 in complementing QR reform in consumer manufactures. 45 Lawrence RZ & R Chadha, op. cit.

Understanding Indian Trade Policy 24
incremental unilateralism therefore has its limits, and as reforms enter increasingly sensitive territory, the external pressure provided by comprehensive trade agreements will be the only way to ensure gains made thus far are properly cemented.
Are they right? Answering this question requires a deeper look at how the reform process has proceeded thus far. The common view is that India has adopted a gradualist approach, implying a slow and steady process that is guided by clearly defined targets and time frames. But critics and radicals blame this gradualism for frequent implementation delays and the government’s occasionally indifferent attitude to issues in need of attention.46
If the last paragraph seems self-contradictory, it is because the critics and radicals have partially misunderstood what has actually been happening. They are correct in ‘accusing’ the process for being slow and gradual, but they err in assuming that gradualism necessarily implies steadiness and predictability. In many areas end-goals and deadlines have never been clearly defined. Vague guidelines and a general, unfocussed picture of where the process ought to be going are more common than narrow, convergent policy initiatives.47
This outcome is not because of a lack of desire to affect fundamental change, but rather because of a pragmatic acceptance of some important realities. Generally speaking, it is a good idea to be relatively imprecise about proposed reforms whose outcomes are highly unpredictable. Planners cannot always be sure their ideas will meet with success, and the necessary flexibility to change things is curtailed if specific targets and strict deadlines are stipulated ex ante. But more specific to the Indian situation was (is) the omnipresent threat of political fallout over many of the issues. This is what ultimately necessitates the sorts of ‘softer’ commitments
46 Ahluwalia MS, op.c it. 47 Virmani A, op. cit., 2004a.

SAIIA Trade Report No. 5 25
contemporary critics find fault with. And whether it was intended to evolve in this manner or not, Ahluwalia48 argues that this approach ‘… enabled a consensus of sorts to evolve … with many interested groups joining only because they believed that reforms would not go ‘too far’.’ He concludes that, ‘Progress was made as and when it was politically feasible.’49
With all this in mind, it is easy to see why policy space is so important to Indian trade negotiators. No matter how good an idea it seems to use comprehensive trade agreements to lock in domestic reforms, it simply is not clear that the Government of India desires that sort of inflexibility. They want to be free to ‘backslide’ if the political environment at any point in time requires such a move, and did indeed do so in some areas of tariff reform under the recently ousted BJP-led National Democratic Alliance government.50
The preceding analysis can be summarised as follows. India is unlikely to make significant alterations to the strategy of incremental unilateralism, for two main reasons. The first is that it has worked fairly well. The second is that the slow-moving, opportunistic nature of the reform process has provided the right blend of progress and conservatism to ensure the politics remains manageable. Trade agreements are therefore unlikely to assume a greater role in the reform process than they have occupied until now.
That said, it should be noted that the MOCI believes India to be in a weaker position relative to some other emerging economies precisely because it has so few strategically important trade partners.51 It isn’t necessarily concerned that the world is
48 Ahluwalia MS, op. cit., p.87. 49 It must be stressed that this is not true of all the reforms India has undertaken,
simply because some have been reasonably agreeable to everyone (e.g. the financial sector). But most trade reforms, unfortunately, have not enjoyed such support.
50 ‘Who, me?’ The Economist, 22 May, 2004. 51 MOCI, op. cit.

Understanding Indian Trade Policy 26
‘regionalising’, because it perceives multilateralism to be the best way forward. But the MOCI is concerned that India doesn’t appear to fit naturally into any of the more powerful blocs (except possibly ASEAN). We can therefore expect increased activity on this front, but it would have no bearing on to SACU countries. The medium term export strategy, 2002 — 2007 The Department of Commerce’s (a branch of the MOCI) Medium Term Export Strategy (MTES) forms part of the Tenth Five Year Plan for the Indian economy. Its principle aim is to increase India’s share of world exports from its current 0.8% to 1% by 2007, which implies an estimated doubling of current export volumes.52 In and amongst a dazzling variety of recommended policy changes designed to achieve this goal, the MTES includes criteria for judging whether or not a non-WTO trade agreement, be it bilateral or regional, will be worth India’s while. The following works on the assumption that these criteria form the framework within which trade planners and negotiators will operate in the near future.
The to-be-expected items on this list include the likely impact of a potential agreement,53 the existence of complementarities between India and the prospective partner, relative price competitiveness in each other’s markets, and existing trade versus trade potential. These are all standard exercises, and tell us nothing interesting about ‘how far’ India would go.
Some of the other criteria set out in the Strategy do provide such insights. India is specifically interested in the scope for services trade, particularly in information technology (IT) and related industries. Investments and joint ventures are also on the list. However, as is
52 RBI, op. cit. 53 ‘Impact’ here refers to everything: welfare, price, production, trade, and revenue
effects.

SAIIA Trade Report No. 5 27
evidenced by FDI policies that are still relatively restrictive, India remains wary of foreign ownership, particularly in strategically important service sectors.54 Finally, India regards political considerations to be of some significance: is the potential partner going to provide any obvious political advantages, particularly in international fora like the WTO?
Whether or not SACU fits this profile is discussed in detail in the following section, which deals with the possible motivations for an Indo–SACU agreement. It is the purpose of this section to analyse India’s behaviour in non-WTO trade negotiations. As will be shown, the nature and issue-coverage of those agreements signed before 2002 differ from those signed under the influence of the MTES. India of late is slightly more amenable to broader trade deals, and the framework agreements with Thailand and ASEAN analysed below provide the best indication of what SACU can expect from Indian negotiators in the offers department.
Regional arrangements India is a member of four different groupings. The oldest is the Bangkok Agreement, signed in 1975, and comprises Bangladesh, the Republic of Korea, Sri Lanka, India, Laos, and China. Under this arrangement, India provides tariff concessions averaging about 5% below MFN rates on 188 products at the HS-6 digit level. Although there is provision for concessions to be made in non-tariff barriers, nothing concrete has yet been negotiated.
India is also a member of the South Asian Association for Regional Co-operation (SAARC). Other members include Bangladesh, Bhutan,
54 See Kumar N, ‘Liberalisation, foreign direct investment flows and economic
development: The Indian experience in the 1990s’, RIS Discussion Paper No. 65/2003, 2003. for an excellent overview of FDI policies since 1991; and Hoda A, op. cit.

Understanding Indian Trade Policy 28
India, the Maldives, Nepal, Pakistan and Sri Lanka. This association signed the South Asian Preferential Trade Agreement (SAPTA) in 1993; the agreement was ratified by 1995, and initiated a product-by-product tariff concession process. India’s concessions in this agreement are considerably greater than those in the Bangkok Agreement: concessions of between 5% and 10% were granted to SAPTA signatories on 2565 tariff lines at the HS-6 digit level.
The Agreement to establish a South Asian Free Trade Area (SAFTA), signed earlier this year, is effective from 2006 and will be fully realised 12 years from now (the implementation time frames depend on level of development: seven years for non-LDCs and 10 for LDCs). This timetable is well behind the initial plan of an FTA by 2008, a customs union by 2015, and full economic union by 2020. Interestingly, services are absent from the agreement. Furthermore, there is no commitment to an eventual liberalisation of negative list items or of non-tariff barriers. The effectiveness of the SAFTA has therefore been questioned.
The third regional arrangement India is party to is called the Bangladesh, India, Myanmar, Sri-Lanka, Thailand Economic Co-operation (BIMST–EC), a forum established in 1997 aimed at increasing trade and investment facilitation. Originally conceived as a way to link SAFTA and ASEAN, a framework agreement was signed earlier this year, and it is intended to become an FTA in its own right at some stage in the future.55 Indeed agreement has already been reached on time frames for tariff reductions on goods trade, but it is worth noting that a positive list approach will be used to determine which traded items (both goods and services) will be liberalised.56
55 Hoda A, op. cit. 56 UNCTAD, ‘Regionalism and South-South co-operation: The case of MERCOSUR
and India’. Background study to UNCTAD XI, 2004. Available online at: http://www.unctad.org/en/docs//tdl370_en.pdf.

SAIIA Trade Report No. 5 29
The Indian Ocean Rim Agreement for Regional Co-operation (IOR–ARC) is the fourth group India is involved with. It was signed by all 19 members (mostly Indian Ocean island states, but also including Australia) in 1997, and like BIMST–EC, is primarily targeting increased economic co-operation by maintaining an open dialogue on trade and investment facilitation. Given the diversity in this grouping and the huge distances between the countries, there are no plans to create an FTA. Bilateral agreements According to the MOCI, India currently holds bilateral trade agreements or transit arrangements with eight partners, all of which are on or in close proximity to the sub-continent. The countries or groups of countries concerned are Afghanistan, ASEAN, Bangladesh, Bhutan, the Maldives, Nepal, Sri Lanka and Thailand.57 The most interesting of these agreements, at least for our purposes here, is the FTA with Sri Lanka and the two framework agreements with ASEAN and Thailand (the rest are all small PTAs or ‘frameworks for greater economic co-operation’). Comparing the former with the latter two draws out the influences of the MTES on non-WTO trade policy.
The Sri Lanka agreement was signed in late 1998, and has been effective since 2000. India’s concessions included duty free access on 1000 product lines (HS-6 digit), a 50% below MFN rates preference on all other products except textiles, which receive a 25% preference, and 400 items on India’s negative list, which obviously receive no preference.58 There are tariff quotas applied to tea and garments
57 India has also entered into talks with Colombia, Egypt, and obviously SACU
(WTO, 2002). Although there is no official documentation on the MOCI website, negotiations with MERCOSUR over a PTA are concluded, and negotiations over the Singaporean Comprehensive Economic Co-operation Agreement (CECA), which is intended to include a full FTA, are reportedly quite advanced.
58 MOCI, op. cit.; WTO, op. cit.
Understanding Indian Trade Policy 30
originating in Sri Lanka (within quota rates on both are 50% below MFN rates), and some odd rules to go with them.59 Other interesting provisions include the ability to suspend preferences in lieu of balance of payments problems, a fairly sophisticated set of rules of origin, as well as special and differential treatment in the form of an extra five years for Sri Lanka to meet the tariff reduction commitments.
While the product coverage is most of the existing trade60 between India and Sri-Lanka, the negative list is almost half as large as the duty-free list. And, as in the SAFTA case, there doesn’t appear to be any inclination to eventually tackle the negative list items. However, bilateral trade between the two countries increased over 50% between 2000 and last 2003, and the trade balance, which used to favour India by about 15 to 1, has come down to 5 to 1.61
There does appear to be some interest in extending the scope of the agreement to include services and investment. The aim is to establish a CECA,62 targeting long-term bilateral co-operation in trade and investment, as well as service sectors attached to tourism. These ideas have surfaced after 2002, presumably as a result of the MTES.
59 Tea may only enter India through Kochi and Kolkata, while garments may enter
only through Chennai and Mumbai. 60 All of India’s agreements are limited to existing trade only. This is something
SACU negotiators will have to address early on if they want an agreement on goods trade to have the widest possible product coverage. Existing trade between India and SACU comprises relatively few products at the HS 6-digit level; liberalising these should thus be viewed only as a starting point.
61 UNCTAD, op. cit. 62 Also known to some in India as an ‘FTA-plus’ agreement. As mentioned in an
earlier footnote, the prospective Singapore trade agreement is also intended to form part of a CECA. However, some difficulties have subsequently been encountered, and the final version is now some way off.

SAIIA Trade Report No. 5 31
Whether or not the ideas will be tabled within the context of formal negotiation remains to be seen.63
The frameworks with ASEAN and Thailand are India’s two newest deals, and are virtually identical. Both include provisions to negotiate trade in goods, services, investment, and ‘other areas of co-operation’ such as trade facilitation. Neither makes provision for substantive treatment of government procurement, competition policy, agriculture, or labour and environmental standards. Both include an Early Harvest Programme (EHP), designed to expedite the liberalisation process by listing up front 105 6-digit level products for immediate tariff concessions.
A further similarity between the two agreements lies in the provisions for negotiating rules of origin (RoO). Talks with Thailand on this matter have soured in recent months. Thailand is reportedly calling for a replication of the RoO used in the internal ASEAN FTA; India finds these inadequate. Given this, RoO negotiations with ASEAN will presumably also run into trouble.64
The ASEAN negotiations are due to be fully concluded by 2007, while the negotiations with Thailand are scheduled to end by early 2006. Provided these frameworks translate smoothly into bilateral agreements, and there is no guarantee they will, the resulting FTAs will have the widest scope, in terms of issue-coverage, to which India has consented up until now.
In both instances the tariff reductions on goods not forming part of the two EHPs are to be separated into a ‘normal track’ and a ‘sensitive track’, the latter having a limited number of allowable items. In the ASEAN agreement, time frames for the completion of normal track reductions are set at 2011 and 2016, depending on the
63 ‘Indo-Lanka agreement to include services and investment too’, The Financial
Express, online edition, 20 December 2003. 64 ‘Indo-Thai FTA stuck in the rules of hanging fire’, The Financial Express, online
edition, 17 March 2004.

Understanding Indian Trade Policy 32
member concerned. In the Thai agreement, a full FTA in normal track goods is planned for 2010. Sensitive track time frames are still to be agreed in both. Provisions are also made for the negotiation of NTBs, safeguards, out-of-quota rates, subsidies, intellectual property and antidumping. And as regards services and investments, only a commitment to negotiate is stipulated, with no further details.
Importantly, these two agreements are the first of India’s to explicitly use the phrase ‘substantially all trade’ in stipulating the agenda for goods negotiations. However, New Delhi’s notion of ‘substantially all trade’ differs somewhat from standard interpretations. The troubles encountered in negotiations with Singapore are emblematic of this, and have received substantial attention in India. A press release detailing the problems is included as Appendix 4. It indicates the sorts of things SACU negotiators can expect.
The Singapore deal notwithstanding, these agreements show that India is these days willing to negotiate on a slightly longer front than before. But the change does not appear uniform. For example, India recently agreed to a very limited (just 548 products) PTA with MERCOSUR, with the intention of upgrading to an FTA at a later date. The interesting thing with the MERCOSUR PTA is that a host of other bilateral treaties and memoranda of understanding have sprung up between India and Brazil since their initial offers were first negotiated. One of them is an agreement to set up a consultation process on all matters related to the WTO.65 Given the political considerations in the MTES, it seems this, and no more, is exactly what India wants out of Brazil. In other words, having got the political co-operation it was seeking, India’s interest in going the extra step to an FTA may now be lessened. This argument is unpacked in ‘Motivating an Indo–SACU trade agreement’ below.
65 ‘More than opportunities, Brazil wants partnership with India’, The Financial
Express, online edition, 29 January 2004.

SAIIA Trade Report No. 5 33
Motivating an Indo–SACU trade agreement Despite India’s long-standing commercial relationship with East Africa, it regards an agreement with SACU as the best way to increase its commercial presence in the sub-Saharan region. However, as it stands today, trade flows between India and South Africa66 certainly do not warrant any special attention from either country. To be sure, total trade has increased significantly since the end of apartheid. But it is important to realise this is almost solely attributable to massive growth in one area: Indian imports of gold from South Africa.
Table A3.1 in Appendix 3 shows that annual growth in total trade (including gold) between 1994 and 2002 averaged over 31%. If gold is excluded, that figure drops by more than half to only 12%. Alternatively put, total trade with gold in 2002 was an impressive $2.3 billion (up from $ 271 million in 1994), but a less impressive $658 million (up from $ 264 million) if it is left out.67 The importance of gold is also reflected in balance of trade, which, if it is left out, drops from $1.8 billion in favour of South Africa to just over $106 million (but still in favour of South Africa). And if we focus only on total trade in chemicals, manufactured goods, and machinery and transport equipment (SITC groups 5–7), growth averaged only 9% over the period.
For obvious reasons, a free trade agreement cannot be motivated on the basis of gold. But without it, Indo–South African trade accounts for an insignificant proportion of each country’s total. In
66 The discussion to follow focuses on Indo-South African trade as opposed to Indo-
SACU trade, simply because the only two quantitative studies on this topic do not consider the other SACU countries.
67 This all translates into the following for the bilateral gold trade itself. Between 1994–2002, Indian imports of gold from South Africa rose 129% annually, from $2.2 million to $1.7 billion. The latter figure in turn accounted for over 40% of South Africa’s total gold exports in 2002, and 72% of total Indo–South African trade.

Understanding Indian Trade Policy 34
2002, non-gold Indian imports from South Africa comprised only 0.7% of total non-gold Indian imports, and 1.7% of total non-gold South African exports. The corresponding figures for South Africa were 1.2% and 0.5% respectively. This compares, for example, with the proportion of South African imports originating in the USA — almost 12%. The only surprise in Appendix 3 is the fact that India imported almost 18% of all of South Africa’s exports of animal and vegetable oils (SITC 4) in 2002. However, this product group comprised only 0.13% of South Africa’s total export figure for that year. To summarise, South Africa is India’s 14th most important source of imports (including gold), but is outside India’s 20 most important export destinations.
The most recent detailed (at the HS-6 digit level) study of Indo–South African trade was undertaken by van Seventer and Mlangeni.68 They found that South Africa’s imports from India were concentrated in textiles and clothing, raw hides and leather, and vegetable products, while Indian imports from South Africa spanned a slightly more diverse range of products: minerals, chemicals, base metals, textiles, and pulp and report. In a similar study, also at the HS-6 digit level, the International Trade Centre69 found considerable export potential for South African producers of cane and refined sugar, diamonds, phosphoric and polyphosphoric acids, phosphates, and chemical wood pulp, as well as some manufactures, such as parts for data processing machinery and transmission apparatus for telecommunications.
Indian exports to South Africa face an unweighted average tariff of 12%, with the highest levels of protection occurring in textiles and
68 Van Seventer D & T Mlangeni, ‘A free trade area between South Africa and India:
Which commodities matter?’ Presented at the TIPS Policy Review Workshop, Johannesburg, August 2001.
69 International Trade Centre, ‘Southern African Customs Union–India: identifying export potential and study of the automotive assembly and components industry’. Working paper, 2001.

SAIIA Trade Report No. 5 35
clothing (27%), footwear (24%), and raw hides and leather products (16%). South African exports to India face an unweighted average tariff of 24%; broad product groups such as motor vehicles and machinery face average tariffs of 40% and higher.70
Standard trade creation/trade diversion71 exercises show that, in the event of zero tariffs across the board, South Africa can expect its domestic production of textiles, clothing, leather, and electrical machinery to suffer. Food products, metal products, and heavy machinery are at less of a risk. From an Indian point of view, an FTA with all tariffs set to zero would cause trade creation and diversion in precious metals and jewellery, coal, iron and steel, basic chemicals, machinery, and certain non-metal mineral products. In goods negotiations, these will presumably comprise the core of the defensive interests for both parties.72
On a more positive note, the study identified good potential for increased intra-industry trade. This is clearly of considerable interest to politicians, as it provides evidence in support of the argument that South-South integration can benefit all involved. Van Seventer and Mlangeni’s73 calculations suggest that there could be substantial intra-industry trade in basic fabricated metals, precious stones and jewellery, and some non-metallic minerals.
70 See Appendix 1 for more details on India’s tariffs compared to selected
developing countries. Van Seventer D & T Mlangeni, op. cit. 71 Trade creation measures how much domestic production in country X would be
displaced by cheaper imports from country Y should an agreement be signed. Trade diversion measures the extent to which imports from country Y displace imports that country X previously sourced from third countries. Both measures obviously depend on assumptions about price elasticities and the level of the post-FTA tariff. But for any reasonable elasticity, and any tariff below the current level, these measures indicate fairly accurately which domestic sectors will be (negatively) affected and the sectors in which the FTA partner will have a new-found competitive edge over third countries.
72 Van Seventer D & T Mlangeni, op. cit. 73 Ibid.

Understanding Indian Trade Policy 36
Overall, however, it is obvious that South Africa and India are not important in either of each other’s import or export baskets. This is unsurprising, as both countries compete for consumers in bigger OECD markets (especially the EU and the US). Relatedly, or perhaps the reason why this is the case, is the fact that there are relatively few complementarities between the two economies. Unlike in a traditional North-South relationship, there are few natural comparative advantages to be exploited by either partner, and unambiguous mutual benefits have to come in the form of increases in intra-industry trade. At the very least, these factors, when taken together, show that the motivations for an FTA aren’t obvious. At worst, they indicate an FTA that might cost more than it’s worth. In any event, this report needs to dig deeper if we are to satisfactorily motivate this agreement. Why SACU? We have seen that to date India has signed bilaterals with other developing countries only, and of the agreements it is currently negotiating with, only Singapore could be considered outside this group. Nothing that India has signed or is interested in remotely compares to South Africa’s agreement with the EU or SACU’s upcoming FTA with the USA. What explains this strategy? After all, cementing trade preferences with your major trade partners is a standard developing country ploy. One columnist in India has recently argued that the overarching reason for India to consider any bilateral agreements is much less of a market access issue than it is the result of the MOCI’s desire for stronger allegiances in the WTO. To be sure, increased market access secured through bilaterals is

SAIIA Trade Report No. 5 37
good for India, but the political implications of these agreements are considered much more valuable.74
Let me elaborate a little. India views the multilateral forum as the safest, indeed the only means of securing greater market access in the big economies like the US, the EU and Japan.75 Bilateral agreements with these countries are considered too risky. There are two main reasons. Firstly, this attitude forms part of a long-standing broader view that holds, on balance, that the WTO process is the best means for India to secure gains from world trade.76 But more importantly, India suspects there to be a much greater cost involved (in terms of which issues it will be forced to negotiate and how much it will have to concede) if it pursues its offensive interests with bigger countries on a bilateral basis rather than in the WTO. Again, India’s unhealthy industrial diversity and relative inability to rapidly expand exports underpin its fears of opening up to big, well-developed economies, or the world at large. And a quick look at how the USA has steamrolled some countries (e.g. Australia) in recent bilateral negotiations only reinforces those concerns.
Bilateral agreements with developing countries, on the other hand, pose less risk to India, and the support these countries can provide India in its WTO battles is something it would never get from Japan, the USA, or Europe. The history of India’s relationship with ASEAN is a good example. India rejected an invitation to join ASEAN at the time of its inception, owing principally to its policy of non-alignment. Now that India is in a position to co-operate more
74 ‘India launches FTA spree before Cancun’, Financial Express, online edition, 20 June
2003. 75 The talks with the EU in 2001 showed no indication of resulting in an FTA. They
revolved primarily around expanding Indian textile quotas in the EU. Three years on, and at least two Indian journalists believe an FTA with Europe, although desperately needed, is unlikely. See ‘India-EU trade links: Stronger the better’, The Hindu Business Line, online edition, 3 March 2004.
76 Hoda A, op. cit.

Understanding Indian Trade Policy 38
fully with ASEAN, it is seeking to do so using the politics engendered by a trade agreement. For example, one of the immediate results of recent dialogue has been the first ever ASEAN–India Economic Roundtable, which took place in February this year. Amongst other issues, this forum is there to address ways in which India and ASEAN can find more common ground in the WTO.77
But do the SACU countries fit this profile? India’s Africa Policy has traditionally focussed on countries in East and South East Africa. Having always been strongly opposed to the policy of apartheid in South Africa, India has long standing diplomatic relations with many SADC countries. In fact the commercial connection between East Africa and India’s western seaboard stretches back a few centuries.78 In the WTO, this affinity pays India dividends; Zimbabwe, Kenya and Tanzania often offer their support to India’s positions on a number of issues. Is that true of South Africa too?
The Doha Round has thus far delivered some interesting developments. Before and during the meeting in Doha itself, India was once again actively involved in a rejuvenated Like Minded Group (LMG), which this time involves, directly or indirectly, a remarkable range of countries: Cuba, the Dominican Rep., Egypt, Honduras, Kenya, Malaysia, Mauritius, Pakistan, Singapore, and Tanzania are all involved. Their desires regarding the draft agenda centred on the removal of labour standards and environmental issues, the prioritising of the mandated reviews of the TRIPS and TRIMS agreements, the focussing of services negotiations on the movement of natural persons, the tackling of tariff peaks and tariff
77 See the paper by Hoda A, op. cit., written for the Roundtable. 78 Beri R ‘India’s Africa policy in the post-Cold War era: An assessment’, Strategic
Analysis, 27, 2, 2003, pp.1–18. Available online at: http://www.ciaonoet.org/olj/ sites/sa.html.
SAIIA Trade Report No. 5 39
escalation, and most of all, the full liberalisation of OECD agricultural sectors.79
Then at Cancun we witnessed the formation of the G20+, which included India, South Africa, Brazil, China, Argentina and other developing countries. Interestingly, none of the LMG members besides India officially lent their support. The G-20’s exploits as a group are now very well known.
However, South Africa and India are not natural WTO partners.80 In the G-20 case, co-operation was possible because it was an informal issue-based ‘alliance’. The intent was to form a bloc strong enough to make meaningful demands on OECD agricultural protectionism. On this score India and South Africa share fairly similar views. However, being also a member of the Cairns Group, South Africa has always been willing to concede something in order to secure reductions in agricultural export subsidies, domestic support payments, tariffs, and non-tariff barriers. India, on the other hand, demands all of the above without making any concessionary offers at all.81 So even with such a clear-cut, justified reason to co-operate, South Africa and India might still have found grounds to disagree.
And beyond offensive interests in agriculture, it is decidedly unclear where South Africa and India can co-operate smoothly in the WTO. Of course they will always find common ground in calling for remedies to tariff escalation and tariff peaks on developing country exports, but in that instance there are very few developing countries that wouldn’t be on their side. ‘Friendships’ based on those sorts of issues do not require pre-existing bilateral agreements to thrive.
79 See ‘Like-minded group chalks out joint strategy’, 9 November 2001. Available
online at: http://www.southcentre.org/info/doha/doha2/doha2.htm. 80 Again the focus here is on South Africa rather than SACU. But the added
complexities of the divergent interests within SACU itself only lend weight to the following arguments.
81 Srinivasan TN, op. cit.

Understanding Indian Trade Policy 40
India remains strongly opposed to one of the four Singapore Issues (investment), and has only ‘softened a little’ on the other three (transparency in government procurement, competition policy, and trade facilitation)82. South Africa has been more flexible. It is a major outward investor on the African continent whilst also being a recipient of substantial FDI. It also has a robust competition policy and institutional framework. Furthermore, the pending SACU–USA FTA is forcing South Africa to tackle these issues in a bilateral context head-on, as well as other ‘non-core’ issues, such as intellectual property, and labour and environmental standards.
There is some scope for co-operation in services negotiations. However, beyond the basic need to redress the stark imbalance in the GATS that is common to all developing countries, South Africa and India’s offensive and defensive interests in services diverge. As mentioned above, India and the LMG have made it clear that they want greater liberalisation of mode 4 — the movement of natural persons. With an official unemployment rate hovering around 30% and a large immigration problem from countries in the region, South Africa has a strong interest in keeping the movement of natural persons to a minimum. South Africa has more to gain from cross-border supply (mode 1) and has a strong interest in commercial presence (mode 3). India, which has been a major beneficiary of business process outsourcing, also has an interest in mode 1, but is entirely defensive on mode 3.
Although they are painted with broad brushstrokes, these examples suggest that South Africa would not be a terribly useful strategic partner (to India) in multilateral trade negotiations.
Outside the WTO, the prospects for co-operation are better. For example, in a well-justified attempt to restructure the international
82 See ‘Defensive play simply won’t work’, Economic Times, 29 August 2003.
Available online at: http://economictimes.indiatimes.com/cms.dll/articleshow?msid =152348.

SAIIA Trade Report No. 5 41
order, India, Brazil and South Africa have all expressed a desire to be on the United Nations Security Council, and all have pledged support to each other’s bid. This sort of rhetoric has underpinned the formation of the India–Brazil–South Africa Dialogue Forum (IBSA), which is aiming to be the first ever South-South diplomatic alliance to involve three of the four most influential developing countries. And since IBSA was launched, things like transport links and maritime security in the Indian Ocean have re-surfaced as areas for co-operation between India and South Africa. It is thus plausible that a trade agreement is useful to India to the extent that it aids and expedites a bigger process, which is motivated less by economics than by politics and diplomacy.
But this begs the question this report has been hinting at all along: if India views the FTA as the means to a greater political or diplomatic end, and not as an economic end in and of itself, it is highly unlikely that an agreement with broad coverage and deep commitments is something they are very interested in. Any trade agreement will possess the sort of symbolism and political significance that India wants. Why India? When South Africa first began pursuing the idea in 2000, there was widespread, well-informed enthusiasm regarding India’s stellar growth prospects. The reasoning was simple: India is a massive, rapidly growing economy with high nominal barriers to trade. Those barriers are slowly coming down as India’s WTO commitments tighten. In the meantime therefore, a bilateral free trade deal with India would provide South Africa, at least temporarily, with an excellent competitive edge over all countries that don’t secure similar deals for themselves. This would constitute an immensely valuable head start for South African exporters.

Understanding Indian Trade Policy 42
The second half of this reasoning is correct — an FTA would give South Africa preferential access to Indian markets, and those preferences would be valuable precisely because they are guaranteed to erode over time. But it is worth spending a little time on India’s much-publicised growth successes.
Table 1: Mean and volatility of output per worker growth rates 1960–2000
1960-1970
1970-1980
1980-1990
1990-2000
1960-1980
1980-2000
1960-2000
India Mean 1.91 0.77 3.91 3.22 1.34 3.57 2.45
Standard deviation 3.24 4.16 1.87 2.05 3.68 1.94 3.11
Industrial countries Mean 4.12 2.12 1.54 1.47 3.12 1.51 2.34
Standard deviation 2.26 2.61 1.98 2.06 2.71 2.08 2.63
East Asia (including China) Mean 4.19 4.11 4.15 3.98 4.15 4.07 4.11
Standard deviation 3.99 2.80 3.24 3.91 3.69 3.74 3.98
China Mean 1.66 2.82 6.86 8.85 2.24 7.85 5.05
Standard deviation 12.45 3.40 3.59 2.37 8.90 3.13 7.17
Latin America Mean 2.38 1.69 -1.65 0.83 2.03 -0.48 0.81
Standard deviation 3.47 4.00 4.40 3.03 4.07 4.17 4.43
Africa Mean 1.87 0.69 -0.47 -0.03 1.28 -0.26 0.53
Standard deviation 5.41 5.25 4.48 4.48 5.54 4.89 5.55 Notes: Regional numbers are simple averages Clearly the Indian average for 1990–2000 is influenced negatively by the
early 1990s crisis; ideally one should remove the years 1991–1993 when calculating these growth rates. However, the preceding discussion is less interested in the changes between the 1980s and the 1990s — it is the difference between the 1960–1980 and 1980–2000 periods that is important.
Source: Rodrik D & A Subramaniam, op. cit., Table 3, p.33.

SAIIA Trade Report No. 5 43
Nearly everyone assumes that the 1991 liberalisation package unlocked a sleeping giant of an economy, and that as reforms become more widespread and meaningful, growth rates will soar ever higher. In other words, had the reforms not come about, India would still be suffering the ‘Hindu’ rate of growth, or something close to it. This assumption is incorrect.
Following the lead of other authors, Rodrik and Subramaniam83 show very clearly that trend growth in real GDP per worker exhibits a structural break from the ‘Hindu’ rate (about 1.4%) to the much higher modern rate (about 3.6%) in 1980, which is a full decade before liberalisation began to take hold. Some other indicators, such as economy-wide total factor productivity, have actually decelerated since 1991. Therefore, the reforms have, at best, sustained growth rates that had already risen substantially, or at worst, allowed some slippage.84 The table above presents a very simple overview of India’s per worker GDP growth rates since 1960, and compares them with other regions and countries.
Furthermore, Rodrik and Subramaniam85 argue that the causes of the increase in trend growth rates at the beginning of the 1980s had to do with what they call an attitudinal shift on behalf of the national government of the time. Indira Ghandi’s administration chose a set of policies best described as pro-business, focussed on raising the profitability of established commercial interests — a strategy obviously favouring incumbents and producers. Pro-business policies are distinct from pro-market policies. The latter are liberalisation policies, aimed at removing impediments to the efficient functioning of markets, and favour new entrants and consumers. Rodrik and Subramaniam claim that, generally speaking,
83 Rodrik D & A Subramaniam, op. cit. 84 Virmani reaches similar conclusions. The 1991 reforms provided only a small
‘impulse’ to a pre-existing momentum that was interrupted by the foreign exchange crisis. See Virmani A, op. cit., 2004b.
85 Rodrik D & A Subramaniam, op. cit.

Understanding Indian Trade Policy 44
the East Asian NICs adopted pro-business policies in the 1960s and 1970s, while Latin American countries tended to go the pro-market route.86
After much econometric huffing and puffing, they conclude that the sorts of pro-business policies introduced by Indira Ghandi’s government (such as removing price controls and reducing corporate taxes) in the 1980s were the essential trigger for a subsequent boom in manufacturing productivity. Rajiv Ghandi’s ‘stealthy liberalisation’87 from 1984 onwards may have contributed, but did not kick-start the process. Indeed one might safely argue that his attempts to begin the liberalisation process would never have made it out of his office were it not for the fact that his mother’s government had done much to win the confidence and support of producers and businessmen. And even then, his effectiveness and successes were severely limited.
But regardless of whether or not their explanation is correct88, the data show clearly that Rodrik and Subramaniam89 are not mistaken in their assertion that something other than Manmohan Singh’s 1991
86 Ocampo JA & L Taylor, ‘Trade liberalisation in developing countries: Modest
benefits but problems with productivity growth, macro prices and income distribution’, The Economic Journal, 108, p.1543 hold similar views: ‘… the good productivity performance in the Asian economies has been associated with outward-oriented, but distinctly not liberal trade regimes’.
87 See ‘Looking on the bright side’, The Economist, 21 February 2004. 88 Others point to the central government’s gargantuan consumption levels during
the 1980s as being amongst the prime drivers of GDP growth. But the huge deficits were offset with commercial borrowings, making the spending levels unsustainable. So while it probably did spur growth rates upwards, this spending also significantly worsened the balance of payments problems leading up to the 1990-1991 crisis. And given that government spending has dropped steadily since then while growth rates have remained more or less intact, one must conclude that the spending in the 1980s was only a proximate as opposed to fundamental cause of the upswing in GDP growth rates.
89 Rodrik D & A Subramaniam, op. cit.

SAIIA Trade Report No. 5 45
liberalisation package pulled India out of its slow-growth nightmare of the previous 30 or so years.
In drawing out the implications of the above discussion, I must stress that I am not labelling the reform package a white elephant, nor am I implying that India has not performed admirably in recent years. Without reform the effects of 1991 crisis would have been immeasurably worse, and longer lasting. But I am arguing that it is very important to realise that the reforms themselves added little impetus to India’s growth90 after the crisis period. And since the initial recovery period, aggregate GDP growth has begun to slow down slightly. Since 1996–97, aggregate GDP grew on average at 5.7% per year, which is one percentage point below the average for 1992–95 period. Both industry and agriculture have performed particularly poorly (by India’s own 1980s standards) since 1996–97, with the former growing at only 5% per year and the latter 2% per year on average.91 In 2003, GDP expanded by only 4%, largely due to an absent monsoon season.
This means two things for SACU. Since reforms in 1991 weren’t the initial cause of India’s earlier success, there’s no reason to believe that further liberalisation will greatly alter the slightly downward trend we are witnessing today. China’s projected slowdown and high energy costs won’t help matters either. Of course if tough changes are introduced to address India’s prominent under-investment and persistent government deficit problems, then resources will certainly be freer to move into more productive activities.92 But these alterations will take a long time, as there
90 To reiterate, ‘growth’ in this discussion refers to real GDP per capita. 91 ‘Singh coalition must support reform’, Financial Times, 25 May 2004. Available
online at http://www.ft.com/. 92 Investment has remained low at 20% of GDP in recent years, and the public
sector deficit, including central and state governments, as well as state-owned companies, has hovered at or just below 10% of GDP since 1998. See ‘The flip side’, The Economist, 21 February 2004.

Understanding Indian Trade Policy 46
remains a fairly high degree of institutionalised resistance to lessen government spending and raise investment caps. Therefore, SACU’s expectations regarding export earnings potential, which were based on notions of Indian growth rates topping 8% and undoubtedly motivated South Africa’s 2000 decision to pursue a deal in the first place, should be revised downwards.
Second, and perhaps more importantly, now that the ‘India Shining’ bubble has popped, Indian negotiators will be well aware once again of the constraints on their flexibility. This strengthens the chance that SACU will not get the broad ‘new-generation’ deal it is looking for. Implications for the Indo–SACU agreement India’s approach to the ASEAN and Thai frameworks indicate which issues India will and won’t be willing to have on the agenda for the second-stage FTA negotiations. However, since India is only in the process of negotiating her very first FTA of this nature, we only have press releases to provide some clues at to how they will tackle the specifics of issues like services and investment. For more concrete insights into these matters, we must turn to India’s positions at Doha and Cancun.
The analysis breaks down into six sections: goods, services, investment, transparency in government procurement, agriculture, and intellectual property. Labour standards, environmental issues, and trade and competition are not individually addressed because New Delhi is on record stating that it will not negotiate the former two outside of the WTO, and is vehemently opposed to the latter being on the WTO agenda in the first place.93
93 Hopes of harmonising competition policies between India and SACU are very
small. India’s Competition Act is only two years old, but more problematic is that SACU as a group has no standardised competition policy provisions.

SAIIA Trade Report No. 5 47
Industrial goods The big question is whether or not India will be willing to adopt a negative list approach in the PTA negotiations (they will have to do so if the FTA stage is reached). The evidence presented earlier is mixed. The Thai and ASEAN frameworks appear to commit to using a negative list (although nowhere is it stipulated that all products will be divided between the normal and sensitive tracks). But in the Singapore negotiations, which are supposed to be about an FTA, India wants to adopt a positive list approach. As the Singaporean negotiators have commented (see Appendix 4), you don’t have an FTA until you assume all trade to be free and then exempt a small number of sensitive sectors.
One thing is sure: India will not be aggressively seeking the opening of all goods to completely free trade, even at the FTA stage. It has never done so in any bilateral negotiations, it cannot do so with tariffs that remain so high in some sectors, and it already runs a significant trade deficit with South Africa. It will be up to SACU to push hard if it wants the majority of goods trade between itself and India to be liberalised. But even if a negative list approach is agreed, SACU negotiators can expect the Indian one to be fairly lengthy (c.f. the Sri Lanka agreement).
SACU will have some of its own problems to overcome too. Despite a common external tariff (CET), SACU’s tariff structure is by no means simple. And as regards NTBs, difficulties arise from the fact that many of SACU’s policies vis-à-vis external partners are still not harmonised.94 However, the pending SACU–US agreement will most likely change some of that for SACU, since the US is famous for being very demanding on these issues. Thus by the time SACU negotiates with India, customs procedures, technical and sanitary
94 Draper P & M Soko, ‘US trade strategy after Cancun: Prospects and implications
for the SACU–US FTA’, SAIIA Trade Policy Report No. 4, 2004.

Understanding Indian Trade Policy 48
standards, and other technical regulations will (hopefully) be simpler and more cohesive.
The final issue SACU negotiators should be aware of is that the outgoing Ministry of Finance in India recently called for tariff ceilings to come down to 5% on raw materials, 8% on intermediates, 10% on finished goods, and 20% on consumer durables, by 2006–7.95 Changes like this would drastically alter the landscape of the goods negotiations — liberalisation would be much easier. However, the Ministry of Finance has never played a part in the trade policy formulation process. Trade policy and trade agreements are controlled by the MOCI. For historical reasons outlined in Sen,96 the MOCI occupies a privileged and exclusive space in Indian politics, and formulates policy largely in isolation, that is, without consulting other government branches. While this behaviour does not endear the MOCI to very many outsiders, it means that the Ministry of Finance’s opinions on trade policy will more than likely be ignored.
Furthermore, the Ministry of Finance that made these recommendations belonged to the BJP-led government, which lost the April 2004 election to the Sonia Ghandi’s Congress Party. Which issues dominated the election struggle, and ultimately caused the BJP’s downfall? Many believe it to be a set of liberalisation and reform policies that marginalised hundreds of millions of rural Indians.97 So because liberalisation and reform in general is once again squarely in the political spotlight, it is unlikely that the new personnel in the Ministry of Finance will be very eager to support their predecessors’ trade policy recommendations.
Overall, negotiations in this area are expected to be fiercely contested, simply because there is so much protection to cut through
95 Hoda A, op. cit. 96 Sen J, op. cit. 97 See for example, ‘”India shining” campaign led to BJP debacle, say Economists’,
Financial Express, online edition, 14 May 2004.

SAIIA Trade Report No. 5 49
and defend. In negotiations with the EU and the US, SACU has experienced roughly the opposite (i.e. other issues have tended to dominate), because much of their industrial produce already enters these markets duty- and quota-free. Services In the bilateral setting, only the current negotiations with Singapore provide any evidence of India’s stance on trade in services. In these talks, India has been very conservative thus far, requesting that a positive list with very few items be adopted. But given that the partner in this instance is Singapore, an economy heavily dominated by a world-renowned service sector, one ought not to find this surprising. To be precise, India’s main concerns with Singapore, and completely free trade zone, surround rules of origin.
As mentioned earlier, India’s traditional priority in GATS negotiations has been the liberalisation of mode 4 — the movement of natural persons. In recent times, however, mode 1 (cross-border trade) has risen in significance. During the 1990s, Indian services exports grew by about 15% per year, and reached $25 billion in 2002, or over 1% of global services exports.98 Most of this is due to software (which has grown at 40% per year since 2000) and business related services, including IT (e.g. business process outsourcing99). But despite this good performance, the value-added component of services exports counted for only a small proportion of the overall growth of the sector (0.6 percentage points of an average 1990s
98 Gordon J & P Gupta, ‘Understanding India’s services revolution’, IMF Working
Paper No. WP/04/171. Presented at the IMF–NCAER India–China Conference, New Delhi, November 2003.
99 The South African government is currently devising strategies to lower costs and successfully enter this industry, as it holds huge potential for low-skill job creation. This is a clear-cut example of SACU and India competing for the same foreign business, and should thus prove a tricky area of negotiations.

Understanding Indian Trade Policy 50
sectoral growth rate of 7.5%).100 In other words, domestic demand remains a much bigger contributor to the success of the sector as a whole. In this light, it is unsurprising that the Government of India is concentrating most of its efforts on finding ways to further liberalise the domestic industry, and may well be less concerned at this stage with the potential contribution of services exports.
Nevertheless, what can we say about either party’s room to manoeuvre in these negotiations? If we confine the analysis to services only, it is difficult to see any scope for meaningful ‘give-and-take’. For example, South Africa’s good financial depth undoubtedly gives SACU an advantage over India in some financial services (insurance in particular). India’s biggest strength, as we’ve just seen, is in software and IT. But South Africa’s IT sector is already completely open to foreign competition101, whereas India’s financial services sector remains heavily protected from the outside world (see the sub-section on investment below). So SACU can’t offer anything that isn’t already available to Indian IT firms, and India can’t realistically make any concessions that would greatly interest South Africa’s big financial houses.
Unfortunately, this sort of thing is a problem across the range of services, so unless there is a completely separate area of the negotiations, for example agriculture, where one side can make an offer that the other can’t match, progress in services will be limited.
100 Gordon J & P Gupta, op. cit. 101 Although suffers a lack of foreign interest due to very high telecommunications
costs. However, the South African Department of Communications is due to introduce a liberalisation package in February 2005, which will go a long way to making South Africa’s telecommunications sector highly cost-competitive.

SAIIA Trade Report No. 5 51
Investment India’s WTO position on investment is particularly critical. They regard it as a non-trade issue, and therefore view its inclusion on the agenda as unnecessary. As a result, India considers ‘the framework of bilateral investment treaties (BITs) adequate for meeting the requirements of investors while also providing flexibility to countries to make the development choice according to their needs’.102
The FDI regime in India has been considerably liberalised since 1991. However, investment caps remain significant. In insurance-related, banking, and other financial services, only 26% foreign ownership is allowed103, while in telecommunications and aviation services, up to 49% and 40% respectively is allowed. No FDI is allowed in legal, accounting, real estate, and retailing services, all of which would be very attractive to SACU firms. Since BITs rarely contain market access provisions, SACU negotiators will have to find ways of raising this as a substantive issue to be included in the trade agreement itself. But their chances of successfully making SACU countries the first to be allowed overstep the investment caps are severely limited. Transparency in government procurement Government procurement in India accounts for about 20% of GDP on average.104 The efficient and transparent awarding of government
102 Hoda A, op. cit., p.15. 103 Chadha R, Brown D Deardorff A & R Stern, ‘Computational analysis of the
impact on India of the Uruguay Round and forthcoming WTO trade negotiations’, New Delhi, National Council for Applied Economic Research, 2000. Available online at http://www.ncaer.org. Chadha, Brown, Deardorff & Stern say the banking cap is 20%.
104 Woolcock S, ‘Government procurement’. Paper at presented at the Planning Commission/Jawaharlal Nehru University Seminar on India’s Post-Cancun Concerns, New Delhi, October 2004.

Understanding Indian Trade Policy 52
contracts to the best bidder must therefore be of considerable interest to SACU negotiators. To take an example, South Africa arguably has the potential to out-compete many Indian firms in the provision of a wide range of services related to the improvement of physical infrastructure (like construction). However, given that government accounts for such a large portion of GDP, it is unlikely to source these services from foreign suppliers, and will be hesitant in entering into an agreement that restricts its freedom to favour local suppliers.
This is much the same dilemma as that faced by the South African government in achieving its black economic empowerment objectives. Stronger competition from foreigners in certain service industries coupled with procurement rules disallowing discrimination in favour of local firms could easily undermine this legitimate development objective.105
Unsurprisingly then, both South Africa and India are opposed to WTO negotiations on transparency in government procurement, and neither is party to the existing plurilateral agreement. The official objection in India is that binding multilateral rules would be too administratively costly for developing countries.106 In South Africa, black economic empowerment underpins the government’s lack of enthusiasm. But whatever the reasons given, the fact that India and South Africa agree more often than not on how procurement ought to be handled in trade negotiations, i.e., not at all, suggests there is a good chance these aspects of the services negotiations may simply fall by the wayside. Agriculture For obvious reasons, India and SACU share a large interest in the liberalisation of trade in agriculture in the OECD. Specifically, both
105 Draper P & M Soko, op. cit. 106 Hoda A, op. cit.
SAIIA Trade Report No. 5 53
desire a significant reduction in the supports and subsidies given to farmers in industrialised countries. However, SACU’s and India’s positions in the WTO are not identical. Furthermore, the liberalisation of south-south agricultural trade is less of a clear-cut issue, especially for India.
The earlier discussion of the G-20 showed South Africa and India to hold different positions vis-à-vis OECD tariffs and subsidies, which stem from much higher levels of protection in India. India is far more radical than South Africa in the sense that it wants drastic reform in Europe, the US and Japan, while maintaining and even increasing the support provided to its own farmers.107
This suggests that India stands to lose more than SACU if agriculture trade between the two were significantly liberalised. India engages more in the provision of domestic support and export subsidies to its farmers, and has higher tariffs and other restrictions on food imports.108 This is a direct consequence of the pre-1991 mindset, the fact that about 700 million Indians depend on agriculture for their livelihoods, and the pressures introduced since 1995 by the WTO Agreement on Agriculture (AoA). Chand109 argues that the AoA was the major reason for the decline in agricultural commodity prices during the late 1990s. As a result, he argues, India suffered lower-than-expected export earnings and unprecedented import growth during that period. His recommendation: ‘In order to deal with this kind of situation, India needs either higher bound
107 Ibid. 108 In fact most forms of agricultural protection have slipped through the reform net.
For example, India raised the bound as well as applied rates on some cereals and dairy products in 1999 from zero to between 60% and 80%. Similarly, export subsidies were provided for rice and wheat between 2001 and 2003 . See Hoda A, op. cit.
109 Chand R, ‘WTO agriculture negotiations and India’. Paper presented at the Planning Commission/Jawaharlal Nehru University Seminar on India’s Post-Cancun Concerns, New Delhi, October 2004.

Understanding Indian Trade Policy 54
tariffs so that applied tariffs can be raised appropriately, or, special safeguards to regulate imports of sensitive products’.110 Liberalising Indian agricultural trade is still a long way off.
Lastly, India has no bilateral agreements, properly finalised or in the framework stage, that address agricultural trade as a separate issue. Farming products have only entered into these agreements, if at all, as items on PTA lists. It is highly unlikely that the agreement with SACU will be any different. Intellectual property rights To be candid, this is a rather murky area of enquiry. Of all the Uruguay Round documents, India found the TRIPS Agreement to be the one that was especially ‘painful to accept’.111 This was mainly due to a strong lobby from the Indian pharmaceuticals industry, which prides itself on being able to produce high quality generics at low cost. Today, India’s biggest concern regarding TRIPS is in the area of implementation, especially in relation to public health matters.112 They do not wish to commit to any new negotiations on IPR issues until the provisions in the current agreement have been implemented to their satisfaction.
On the domestic front, all that can be discerned is that India has introduced new legislation on trademarks and industrial designs, as well as amendments to the Patent Act. In terms of compliance, a public education programme has been initiated, but enforcement remains a serious problem.113
Intellectual property has not been an area of great concern to India in its bilateral negotiations. It does not feature anywhere in the text
110 Ibid., p.6. 111 Hoda A, op. cit. 112 Ibid. 113 WTO, op. cit.

SAIIA Trade Report No. 5 55
of the free trade agreement with Sri Lanka. The only two documents where it is mentioned, the ASEAN and Thai framework agreements, have the following to say:114
The negotiations … covering trade in goods shall also include … [the] facilitation and promotion of effective and adequate protection of trade-related aspects of intellectual property rights based on existing WTO Agreements, World Intellectual Property Organisation (WIPO) and other relevant agreements. Therefore, in contrast to negotiations with the EU and the US,
SACU has little to fear in terms of being pressurised to increase transparency and strengthen enforcement procedures, etc. India has too many of its own problems enforcing IPR laws, and will have no interest in committing to anything in a trade agreement. Thus SACU businesses ought to take a keen interest in this part of the negotiations — enforcement of IPRs in India are simply not up to SACU standards. Final considerations and concluding remarks This report has not addressed one very important issue. How capable are India and SACU in managing and monitoring an intrusive free trade agreement? It should be abundantly clear by now that India has not yet signed a deal big enough to impose significant administrative costs. India also has limited experience relative to SACU in negotiating one. These aspects may affect negatively India’s eagerness for a far-reaching FTA, as has been suggested might happen with MERCOSUR.
In SACU’s case, the new SACU Agreement, finalised in 2002, at last allows SACU to negotiate as a single entity. In the past, a laborious and inefficient consultation process was required before a united
114 Taken directly from the framework agreement with Thailand, which is available
online at: http://commerce.nic.in/thailand.htm.

Understanding Indian Trade Policy 56
position on the various issues could be established. The Agreement will hopefully reduce internal conflicts considerably, and free up the administrative resources required to focus on more important negotiating and administrative challenges. Acting against this is the fact that SACU is currently engaged on a number of fronts, including the US, MERCOSUR, and the European Free Trade Area, which results in a diminished negotiating capacity in each set of talks.115
However, SACU’s experience with the EU and the US should prove useful. In terms of issue-coverage, these agreements dwarf anything India has signed or plans to sign. The fact that the EU deal was concluded to everyone’s satisfaction, and that the US deal will possibly be very advanced by the time negotiations with India heat up, should be sources of confidence and encouragement to SACU negotiators. In the bilateral environment, these experiences could provide an edge when it comes to issues not covered in regular preferential trade agreements.
So, what is the realistic best guess estimate of the likely architecture of the proposed trade agreement between India and SACU? Sen’s view on this question is instructive:116
Overall, therefore, one can envisage the Indian government negotiating a bilateral trade agreement that is politically weighted (involving such matters as an agreement to consult frequently, some undertaking on defence, minerals and other strategic priorities, exhortations to step up trade in certain sectors where potential is perceived to be substantial), but is commercially shallow and lacking binding reciprocal commitments. This would fit with her current set of political priorities at three levels: with her interests in terms of the broader international context; with her need to build alliances with other developing countries post-Cancun; and with her interest (limited but still significant) in building good relations with countries that have large Indian populations.
115 Draper & Soko, op. cit. 116 Sen J, op. cit., p.8.

SAIIA Trade Report No. 5 57
Given the evidence put forth in this report, one cannot help but agree. The agreement will not be expansive, and will not cover the full range of issues normally subsumed in a ‘new generation’ FTA. Additionally, as in India’s recent agreement with MERCOSUR, the first step PTA will not cover the majority of industrial goods; India could demand a positive list approach. And in the second stage FTA, if it is reached, we can only realistically expect India to be willing to discuss services as a substantive issue. Agriculture, investment, transparency in government procurement, and intellectual property all pose domestic problems big enough to provide either or both teams of negotiators enough incentive to keep them aside.
The views expressed in the report have been less than optimistic about the depth and breadth of the proposed agreement. However, there is one strong diplomatic force that might do enough to change all that. If the India–Brazil–South Africa Dialogue Forum (IBSA for short) is up to the task it has been saddled with, we may see India coming to the negotiations as a more willing partner than the one I have portrayed it to be. Some pundits and bureaucrats are excited enough about IBSA to even be talking of a grand trilateral FTA, serving as the bedrock of the most influential South-South alliance to emerge in international trade relations to date. Let’s first wait and see what happens with the three bilateral agreements.

Understanding Indian Trade Policy 58
Appendix 1: Openness to trade — country comparisons
Average 1960s
Average 1970s
Average 1980s
Average 1990s
1995 1996
US 10.0 13.3 14.9 17.4 18.3 18.5 Japan 10.5 15.9 20.7 15.7 14.7 16.1 India 13.6 13.2 11.7 16.9 18.5 19.0 Argentina 13.3 12.2 12.2 15.1 15.9 17.5 UK 31.0 39.8 42.2 41.5 44.7 46.2 Turkey ? ? 27.8 30.2 33.1 37.5 Indonesia 43.7 63.7 37 47 42.6 40.9 China 18.3 13.3 19.9 35.6 40.1 35.5 Mexico 17.0 17.4 27.3 44.3 54.3 57.1 Chile 43.1 49.8 37 44.8 44.3 45.9 Germany 27.7 40.8 48.8 43.2 40.2 41.2 South Africa* 48.6 53.7 52.4 44.4 45.1 47.8 Philippines 42.8 41.1 38.6 63.8 60.7 64.6 Thailand 42.6 47.2 47.9 74 75.7 70.4 Malaysia 97.0 90.5 97 156.7 170.7 155.4 1997 1998 1999 2000 2001 2002 US 19.1 18.5 19 20.8 18.9 18.2 Japan 17.6 16.9 16.3 18 18 18.9 India 18.8 18.7 18.9 20.4 19.7 21.4 Argentina 19.4 19.3 17.2 18.2 17.4 37.3 UK 44.2 41.2 40.1 42.7 41.1 39 Turkey 39.3 35.5 34.3 41.1 49.8 47.3 Indonesia 44.1 79.8 51.9 63.7 61.8 48.2 China 36.2 34.2 36.4 43.9 43.3 49 Mexico 56.2 59 59.2 60 53.6 52.9 Chile 46.9 45.6 45.4 50.4 53.1 53.3 Germany 45.3 47.3 48.2 55.8 56.9 55.4 South Africa* 48.1 50.5 48.9 54.7 58.1 63.8 Philippines 75.8 91.5 90.8 102.6 93.8 94.5 Thailand 79.7 87.1 88.7 106.9 110.3 105.5 Malaysia 157.5 182.2 189.5 199.9 184 182.5 Notes: Data ranked in ascending order according to openness in 2002. ‘Openness’ is the sum of imports and exports expressed as a % of GDP.
Ε South African data from the South African Reserve Bank’s online data download facility: http://www.resbank.co.za.
Source: RBI Currency and Finance Report, 2004.

SAIIA Trade Report No. 5 59
Appendix 2: Tariffs — country comparisons
Primary goods Manufactures Country Year Simple
mean Standard
Dev Weighted
mean % of lines with international
peaks
% of lines with
specific tariffs
Bangladesh 1989 106.2 79.2 88.2 98.5 1.0 India 1990 79.0 43.6 56.2 97.1 0.9 Pakistan 1995 50.8 21.6 46.3 92.3 3.5 Thailand 1989 38.5 19.5 33.0 72.9 21.8 China 1992 41.2 30.6 32.5 78.2 0.0 Brazil 1989 42.2 17.2 32.0 92.4 0.2 Egypt 1995 25.6 33.2 16.7 53.1 1.2 Korea 1988 18.8 7.9 13.8 73.0 10.3 Indonesia 1989 22.0 19.7 13.2 50.5 0.4 Argentina 1992 12.2 7.7 12.8 31.0 0.0 Mexico 1991 13.4 4.3 12.0 20.9 0.0 South Africa* 1990 11.5 11.7 10.3 27.3 ? Malaysia 1988 17.0 15.1 9.9 46.4 6.7 Country Year Simple
mean Standard
Dev Weighted
mean % of lines with international
peaks
% of lines with specific
tariffs India 2001 30.9 12.4 28.2 91.8 0.1 Bangladesh 2000 21.6 13.6 21.0 52.9 0.0 Mexico 2001 16.2 9.3 15.4 50.8 0.5 Pakistan 2001 20.6 19.2 14.7 58.5 0.5 China 2001 15.3 10.0 14.3 40.5 0.5 Egypt 1998 20.5 39.5 13.8 47.4 9.5 Brazil 2001 12.9 7.2 11.1 46.3 0.0 Thailand 2000 17.0 14.3 9.7 47.1 1.2 Argentina 2001 11.6 7.2 9.2 39.1 0.0 Korea 1999 8.7 5.9 6.0 4.8 0.8 Malaysia 1997 9.2 33.3 5.8 24.7 0.4 Indonesia 2000 8.4 10.8 5.4 11.2 0.0 South Africa* 2001 9.3 11.6 4.9 32.1 ? Bangladesh 1989 88.2 53.6 108.7 109.6 India 1990 56.2 25.4 79.9 70.8 Pakistan 1995 46.3 24.0 51.5 50.8 Thailand 1989 33.0 24.3 39.0 34.9

Understanding Indian Trade Policy 60
Appendix 2: Tariffs — country comparisons (continued) Primary goods Manufactures
Country Year Simple mean Weighted mean Simple mean Weighted mean China 1992 32.5 14.0 41.6 35.6 Brazil 1989 32.0 18.6 42.4 37.1 Egypt 1995 16.7 7.6 25.6 22.2 Korea 1988 13.8 8.2 18.6 17.0 Indonesia 1989 13.2 5.9 22.1 15.1 Argentina 1992 12.8 5.8 12.3 13.6 Mexico 1991 12.0 8.3 13.4 13.0 South Africa* 1990 7.7 4.6 11.9 10.9 Malaysia 1988 9.9 4.6 17.3 10.8 Country Year Simple mean Weighted mean Simple mean Weighted mean
India 2001 28.2 28.5 30.6 29.0 Bangladesh 2000 21.0 18.6 21.5 22.3 Mexico 2001 15.4 19.9 16.1 14.7 Pakistan 2001 14.7 8.5 20.5 16.8 China 2001 14.3 18.6 15.0 12.9 Egypt 1998 13.8 7.5 20.2 17.5 Brazil 2001 11.1 4.7 12.9 12.5 Thailand 2000 9.7 7.7 15.9 10.1 Argentina 2001 9.2 4.8 11.7 9.7 Korea 1999 6.0 5.6 7.8 6.1 Malaysia 1997 5.8 10.0 10.2 5.5 Indonesia 2000 5.4 2.8 8.9 6.6 South Africa* 2001 7.7 1.9 9.4 5.8 Notes: Data in each time period ranked in descending order according to the (import) weighted average tariff on ‘all products’. All tariffs are effectively applied rates * South African data from UNCTAD’s TRAINS database. Source: RBI Currency and Finance Report, 2004.

SAIIA Trade Report No. 5 61
Appendix 3: Recent trends in Indo–South African trade
Table A3.1: Total trade between India and South Africa (‘000 US dollars and %) SITC code Chapter Description 1994 2002 Ave.
annual growth rate (%)
Trade balance (South
African) 0 Food and live animals 10,012 57,894 24.53 -53,777
1 Beverages and tobacco 44 3,965 75.58 -3,948
2 Crude materials, inedible, except fuels 42,377 51,333 2.43 35,107
3 Mineral fuels, lubricants & related mat. 1,766 127,109 70.67 127,026
4 Animal and vegetable oils, fats & waxes 1,363 6,987 22.67 3,378
5 Chemicals & related products n.e.s. 56,175 164,436 14.37 57,880
6 Manufactured goods class. by material 114,579 133,497 1.93 -31,053
7 Machinery and transport equipment 15,428 75,249 21.91 3,577
8 Miscellaneous manufactured articles 22,762 37,462 6.43 -31,862
9 Commodities & transactions n.e.s. 6,592 1,706,398 100.28 1,697,023
1-9 Total 271,098 2,364,331 31.09 1,803,350
1-8 Total less gold (SITC 9) 264,506 657,932 12.06 106,327
Source: TIPS, COMTRADE and own calculations.
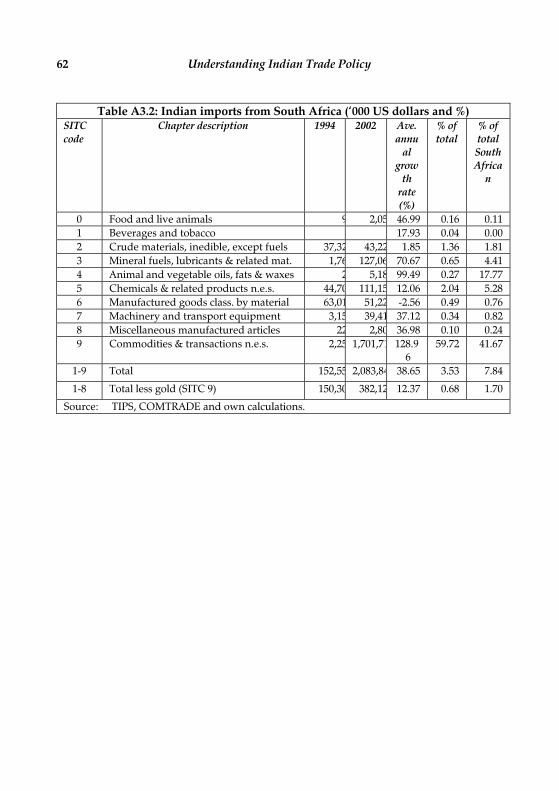
Understanding Indian Trade Policy 62
Table A3.2: Indian imports from South Africa (‘000 US dollars and %) SITC code
Chapter description 1994 2002 Ave. annu
al grow
th rate (%)
% of total
% of total South Africa
n
0 Food and live animals 9 2,05 46.99 0.16 0.11 1 Beverages and tobacco 17.93 0.04 0.00 2 Crude materials, inedible, except fuels 37,32 43,22 1.85 1.36 1.81 3 Mineral fuels, lubricants & related mat. 1,76 127,06 70.67 0.65 4.41 4 Animal and vegetable oils, fats & waxes 2 5,18 99.49 0.27 17.77 5 Chemicals & related products n.e.s. 44,70 111,15 12.06 2.04 5.28 6 Manufactured goods class. by material 63,01 51,22 -2.56 0.49 0.76 7 Machinery and transport equipment 3,15 39,41 37.12 0.34 0.82 8 Miscellaneous manufactured articles 22 2,80 36.98 0.10 0.24 9 Commodities & transactions n.e.s. 2,25 1,701,71 128.9
6 59.72 41.67
1-9 Total 152,55 2,083,84 38.65 3.53 7.84
1-8 Total less gold (SITC 9) 150,30 382,12 12.37 0.68 1.70
Source: TIPS, COMTRADE and own calculations.

SAIIA Trade Report No. 5 63
Table A3.3: South African Imports from India (‘000 US dollars and %) SITC code
Chapter Description 1994 2002 Ave. annual growth rate
(%)
% of total South
African imports in
2002
% of total Indian
exports in 2002
0 Food and live animals 9,918 55,835 24.11 6.43 0.97
1 Beverages and tobacco 42 3,957 76.67 2.54 1.71
2 Crude materials, inedible, except fuels
5,056 8,113 6.09 0.97 0.34
3 Mineral fuels, lubricants & related mat.
0 42 92.76 0.00 0.00
4 Animal and vegetable oils, fats & waxes
1,342 1,805 3.77 0.88 1.06
5 Chemicals & related products n.e.s.
11,468 53,278 21.17 1.76 0.92
6 Manufactured goods class. by material
51,568 82,275 6.01 2.62 0.41
7 Machinery and transport equipment
12,274 35,836 14.33 0.37 0.82
8 Miscellaneous manufactured articles
22,537 34,662 5.53 1.52 0.37
9 Commodities & transactions n.e.s.
4,339 4,688 0.97 0.20 0.38
1–9 Total 118,544 280,491 11.37 1.08 0.54
1–8 Total less gold (SITC 9) 114,205 275,803 11.65 1.17 0.54
Source: TIPS, COMTRADE and own calculations.

Understanding Indian Trade Policy 64
Appendix 4 The following was published in the Financial Express Online Edition on 10 February 2004. The grammar is difficult at times, but the point is unmistakable. It may be accessed at: http://www.financialexpress.com/ Cloud over test case Singapore FTA New Delhi, 9 February: The Prime Ministerial deadline of April to conclude a comprehensive economic co-operation agreement (CECA) between India and Singapore has run into trouble. Due to political distractions, New Delhi’s negotiating position has hardened. Singapore’s negotiators, too, are showing signs of impatience. For starters, the visit of Singapore Prime Minister Goh Chok Tong here in early April aimed at signing CECA has been put off. Sources in the PMO said this has been told to the Singaporeans in writing.
The main component of CECA is a free trade agreement (FTA). Optimists describe it as ‘FTA-plus’. The more cautious call it a ‘test-case FTA’ for India. The cynics are winning. Sources said India’s ‘offers’ made in mid-January are as tough as the existing norms for other countries. ‘They are beset with a WTO mindset,’ a Singapore negotiator said, identifying telecom and services as ‘problem areas’. An Udyog Bhavan justifying that the concern was more about rules of origin (RoO) and Singapore’s existing tariff of near-zero levels. He said India wanted to use the change in tariff heading rule for RoO determination and not the percentage value-added rule that the other side wanted.
Also, India’s offer contains a specified list of items that could fall under a zero import duty regime. ‘Include what you produce, why include everything’ New Delhi said.
Singapore countered that if this were to happen it wouldn’t be an FTA at all. ‘You seem to be talking about a PTA (preferential trade agreement)! In an FTA you mark out the sensitive areas and open up
SAIIA Trade Report No. 5 65
everything else,’ a negotiator complained. The matter took an unpleasant turn forcing an Udyog Bhavan negotiator to quip: ‘I’m just a secretary of one department, please appreciate my limitation.’
Singapore contested India’s problems on the subject of ‘asymmetry’ between their existing tariffs. ‘If we start talking of asymmetries, you have a billion people and we have just 4 million,’ it said. Udyog Bhavan countered by citing asymmetries between per capita incomes in the two countries both in absolute and purchase power terms.
Besides fundamental differences over how they view an FTA, India wanted to pre-define the areas in which services will be opened up. Singapore found the entire effort at drawing lists of professions a waste of time. ‘If Infosys or Wipro comes we’ll trust them and allow anybody they want. Why should we sit and determine who is an accountant, who is in HR or who is their canteen manager,’ Singapore said. ‘Our offer is on top of what we have with Japan. We shouldn’t complicate matters!’
Udyog Bhavan sources echoed concerns by the chemicals sector that a full-blown FTA with zero-tariff and Singapore-style RoO will be an invitation to re-routing (dumping) of products from third countries. Singapore disagreed. It cited its own FTA with Australia and Japan. ‘Does Australian beef enter Japan through Singapore?’ they asked.
The next round of negotiations involved an Indian team flying down to Singapore this month. That’s got cancelled because New Delhi refused to buy the near-double hotel rates in Singapore because of the Asian Aerospace show there. Sources said new dates for March are being ‘negotiated’.
All said what’s going for the FTA is the visit last month of deputy Prime Minister Lee Hsien Loong and his wife and Temasek Securities boss Ho Ching. Both went back thrilled with the youthful exuberance in India’s IT companies. ‘India’s (poor) infrastructure can

Understanding Indian Trade Policy 66
change in one to five years, what India needed was the change in mindset. And that’s happening’, Ms Ho told an aide.
India and Singapore signed a draft CECA in April 2003. Prime Minister Atal Bihari Vajpayee and Mr Goh announced that the final version, including an FTA-plus agreement, will be signed within a year.