understanding fixed income returns: past, present and … · understanding fixed income returns:...
TRANSCRIPT

Understanding Fixed Income Returns: Past, Present and Future by Stephen Kroah,CFA
In today’s economic environment, much discussion is centered around the impact of rising interest rates on fixed income portfolios. This paper will look at how bond portfolios have performed over the years, the current interest rate environment and provide a framework for forecasting returns given the concern of rising interest rates in the future. To assist in this study, this paper will focus on the returns of the Barclays Capital Aggregate Bond Index, a widely accepted proxy for a diversified bond portfolio, and the ten-year U.S. treasury yield, the most commonly referenced measure of the level of interest rates.
The Past
The U.S. Treasury market can trace it roots back to 1790, but this analysis
will concentrate on the period starting in 1926. As can be seen in
Chart 1, through the 30s and 40s yields were not too dissimilar from
those seen today. The ten-year yield attained a prior low in 1940 at
2.01%. In 1949, yields reached another low—2.19%—that wasn’t seen
again until 2008. From that 1949 low point, yields moved upward until
peaking in 1981 at 13.72%.
According to “Ibbotson SBBI (Stocks, Bonds, Bills and Inflation) 2013
Classic Yearbook”,1 intermediate treasury bonds (defined as 3- to
ten-year maturities) from 1926 until today have posted a negative
annual return only seven times. Taking this into context, over an 88-year
Stephen Kroah
Stephen Kroah joined the
General Board of Pension
and Health Benefits’ Wespath
investment management
division in January 2011 as director
of fixed income. Previously, he
spent much of his career as
a principal and senior portfolio
manager at Lotsoff Capital,
a Chicago-based investment
firm. Stephen also spent four
years in the United States
Marine Corps. He graduated
magna cum laude from
Northeastern University with
a B.S. in International Business/
Finance and has an MBA from
the Tepper School of Business
at Carnegie Mellon University.
He is also a CFA Charterholder.
Chart 1—Ten-year U.S. Treasury Note Yield (1927-2012)
Year-end yield—Source: Federal Reserve of St. Louis (FRED)
1 Morningstar, 2013

2
period, intermediate treasury bonds have had a positive annual
return 92% of the time. From 1926, the average annual rate
of return on intermediate treasuries has been 5.4%, with an
average yield for the ten-year treasury of 5.10%.
The yield peaked in the early 1980s and just recently experienced
an all-time low. The prices of bonds and interest rates have an
inverted relationship. As yields go down, the prices of bonds go up
and vice versa. We can see over the last 30 years the yields
of bonds have moved down in a fairly linear fashion. This has
led to a long period of positive returns for bonds and has been
called the 33-year bond bull market.
U.S. treasury bonds are only a part of the investable fixed income
universe. A better measure of bond market performance is a
broader index that includes U.S. treasury bonds as well as other
types of bonds. The Barclays Capital Aggregate bond index
was created in 1976 and was known as the Lehman Aggregate
Bond Index prior to Barclays Capital’s purchase of the Lehman
Brothers bond index business. This index is a combination of most
of the investment-grade high-quality investable U.S. dollar bond
universe, which includes treasuries, agency debt, corporate debt,
as well as mortgages and other structured securities. Below is
a chart (Chart 2) of the returns of this index since inception. The
average return over this period is 8.4%.
There have only been three years that produced negative
returns: 1994, 1999 and 2013. 1994, referred to as the “Great
Bond Massacre”, was the worst year on record for bond market
returns. With inflation, as measured by the Consumer Price
Index, below 3% at the end of 1993 and into early 1994, the
bond market was surprised when the Federal Reserve, under the
leadership of Chairman Alan Greenspan, started raising short-
term interest rates. The 1999 losses were associated with the
Federal Reserve raising the Fed Funds rate by 175 basis points
from May 1999 to May 2000. This was a reversal of Fed lowering
interest rates in 1998 to protect the U.S. economy from adverse
consequences resulting from the Asia Financial Crisis.
The Present
How does the past relate to the present day market? As Chart 2
shows, 2013 was the third negative return year since inception
for the Barclays Capital Aggregate Bond index. Events in 2013
were similar to the events that took place in 1994, the “Great
Bond Massacre”. Unanticipated actions by the Federal Reserve
impacted interest rates, bond yields, and returns. In 1994, the
markets did not expect the Federal Reserve to raise short-term
interest rates. Last year, unexpected “tapering” comments of
Federal Reserve Chairman Ben Bernanke adversely impacted
bond prices. The “tapering” comments refer to the Federal
Reserve slowing down or discontinuing its bond purchasing
known as quantitative easing or “QE”. At that time, the Fed had
been purchasing $85 billion a month in debt to try to stimulate
the economy by keeping long-term interest rates low. On July 24,
2012 the ten-year treasury yield reached an all-time low of 1.39%.
Following Bernanke’s comments earlier in 2013, the ten-year
treasury yield spiked to 3.00%, an increase of 161 basis points
in less than a year. This quick jump in interest rates caused the
Barclays Aggregate Bond Index to significantly decline and end
2013 with its third negative year since its inception. After the
Federal Reserve decided in September not to begin tapering,
ten-year treasury yields returned to lower levels and fluctuated
Chart 2—Barclays Capital Aggregate Bond Index Returns
…over an 88-year period, intermediate treasury bonds have had
a positive annual return 92% of the time.
“ ”
between 2.50% and 3.00%. In December 2013, the Federal
Reserve finally decided to reduce its bond purchases from $85
billion to $75 billion per month and the ten-year treasury yield
rose to 2.98% by the end of the year.
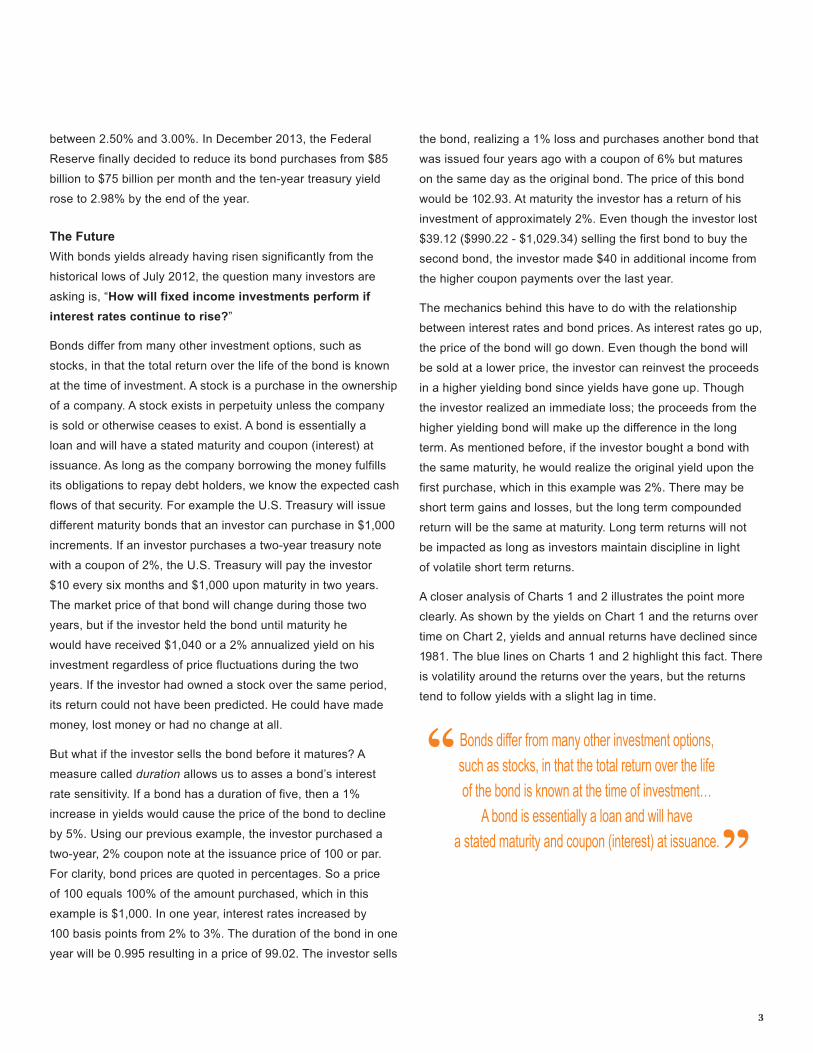
The Future
With bonds yields already having risen significantly from the
historical lows of July 2012, the question many investors are
asking is, “How will fixed income investments perform if
interest rates continue to rise?”
Bonds differ from many other investment options, such as
stocks, in that the total return over the life of the bond is known
at the time of investment. A stock is a purchase in the ownership
of a company. A stock exists in perpetuity unless the company
is sold or otherwise ceases to exist. A bond is essentially a
loan and will have a stated maturity and coupon (interest) at
issuance. As long as the company borrowing the money fulfills
its obligations to repay debt holders, we know the expected cash
flows of that security. For example the U.S. Treasury will issue
different maturity bonds that an investor can purchase in $1,000
increments. If an investor purchases a two-year treasury note
with a coupon of 2%, the U.S. Treasury will pay the investor
$10 every six months and $1,000 upon maturity in two years.
The market price of that bond will change during those two
years, but if the investor held the bond until maturity he
would have received $1,040 or a 2% annualized yield on his
investment regardless of price fluctuations during the two
years. If the investor had owned a stock over the same period,
its return could not have been predicted. He could have made
money, lost money or had no change at all.
But what if the investor sells the bond before it matures? A
measure called duration allows us to asses a bond’s interest
rate sensitivity. If a bond has a duration of five, then a 1%
increase in yields would cause the price of the bond to decline
by 5%. Using our previous example, the investor purchased a
two-year, 2% coupon note at the issuance price of 100 or par.
For clarity, bond prices are quoted in percentages. So a price
of 100 equals 100% of the amount purchased, which in this
example is $1,000. In one year, interest rates increased by
100 basis points from 2% to 3%. The duration of the bond in one
year will be 0.995 resulting in a price of 99.02. The investor sells
the bond, realizing a 1% loss and purchases another bond that
was issued four years ago with a coupon of 6% but matures
on the same day as the original bond. The price of this bond
would be 102.93. At maturity the investor has a return of his
investment of approximately 2%. Even though the investor lost
$39.12 ($990.22 - $1,029.34) selling the first bond to buy the
second bond, the investor made $40 in additional income from
the higher coupon payments over the last year.
The mechanics behind this have to do with the relationship
between interest rates and bond prices. As interest rates go up,
the price of the bond will go down. Even though the bond will
be sold at a lower price, the investor can reinvest the proceeds
in a higher yielding bond since yields have gone up. Though
the investor realized an immediate loss; the proceeds from the
higher yielding bond will make up the difference in the long
term. As mentioned before, if the investor bought a bond with
the same maturity, he would realize the original yield upon the
first purchase, which in this example was 2%. There may be
short term gains and losses, but the long term compounded
return will be the same at maturity. Long term returns will not
be impacted as long as investors maintain discipline in light
of volatile short term returns.
A closer analysis of Charts 1 and 2 illustrates the point more
clearly. As shown by the yields on Chart 1 and the returns over
time on Chart 2, yields and annual returns have declined since
1981. The blue lines on Charts 1 and 2 highlight this fact. There
is volatility around the returns over the years, but the returns
tend to follow yields with a slight lag in time.
3
Bonds differ from many other investment options, such as stocks, in that the total return over the life of the bond is known at the time of investment…
A bond is essentially a loan and will have a stated maturity and coupon (interest) at issuance.
“”

4
A useful tool for forecasting future returns is a table of forward
rates. A forward rate is the expected yield of a certain maturity
bond at a given point in the future. The table at right (Table 1)
of treasury forward rates shows that in three years the yield
of the ten-year treasury (highlighted in yellow) is expected to
increase by approximately 100 basis points (as shown by the
blue arrow).
Another interesting observation from the table is how the yield
curve is expected to change over time. Based on November
2013 one month forward rates, the rates for shorter maturity
treasuries do not start to rise until the end of 2014, implying that
this is when the market believes the Federal Reserve will start
to raise the Fed Funds rate. From years 2-10, the yield curve
flattens fairly dramatically as the Federal Reserve is expected
to increase rates from their current artificial lows.
Another use of the forward rate curve is to calculate an
approximation of the short-term impact on returns due to
changes in the interest rate. The table on page 5 (Table 2)
calculates approximate future returns using forward rates.
This table looks at the Fixed Income Fund’s benchmark, the
Barclays Capital U.S. Universal ex MBS.
Table 2 was calculated using the forward rates for U.S. Swaps
rather than treasuries. Swap rates are a good proxy for
evaluating a diverse bond portfolio because they account for
credit risk. By examining swap rates, we are able to capture
both the expected changes in treasury yields as well as changes
to credit spreads. The blue column shows Key Rate Durations
Key Rate Durations (KRD)
KRD measures the duration of the bond in segments at different parts of the yield curve by maturity. The KRD for each of the segments of a bond will sum up to the overall duration of the bond. Since the yield curve does not generally move in a parallel fashion, KRD highlights the effects of changes in interest rates on different maturity bonds. Referring to the graph at right of the U.S. Treasury yield curve from the end of 2012 to 2013, you can see that different points along the curve moved by different amounts. A steepening yield curve, where the difference between long-term rates and short-term rates is greater, or a flattening yield curve, where this difference narrows, will impact fixed income portfolios differently. This is important when looking at events such as the Federal Reserve raising short-term rates which would cause the curve to flatten if long-term rates are unchanged. A simple way to think about this is to compare the results when an investor holds a portfolio
of all five-year maturity bonds to the results of holding two-year and ten-year bonds. The portfolios might have the same duration, but their KRD’s would be different. Thus, the price impact of the move seen in the graph would result in diverging returns.
Source: Bloomberg
Table 1—Treasury Forward Rates
Source: Bloomberg
5
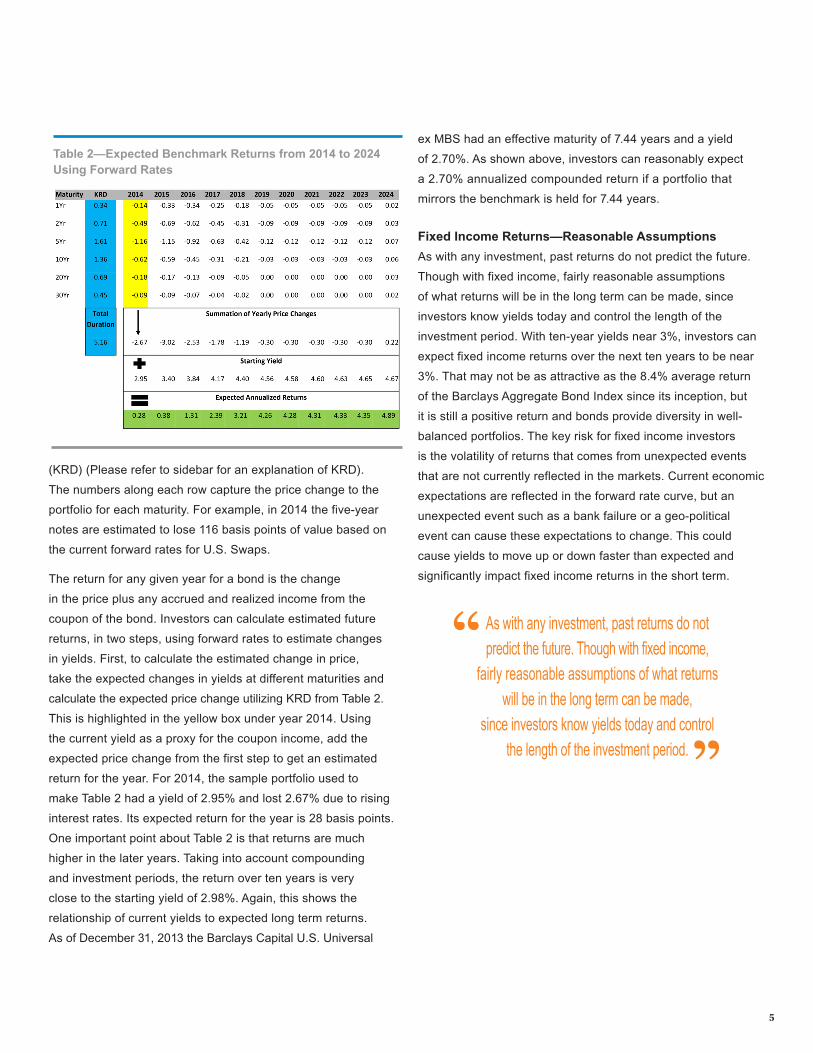
(KRD) (Please refer to sidebar for an explanation of KRD).
The numbers along each row capture the price change to the
portfolio for each maturity. For example, in 2014 the five-year
notes are estimated to lose 116 basis points of value based on
the current forward rates for U.S. Swaps.
The return for any given year for a bond is the change
in the price plus any accrued and realized income from the
coupon of the bond. Investors can calculate estimated future
returns, in two steps, using forward rates to estimate changes
in yields. First, to calculate the estimated change in price,
take the expected changes in yields at different maturities and
calculate the expected price change utilizing KRD from Table 2.
This is highlighted in the yellow box under year 2014. Using
the current yield as a proxy for the coupon income, add the
expected price change from the first step to get an estimated
return for the year. For 2014, the sample portfolio used to
make Table 2 had a yield of 2.95% and lost 2.67% due to rising
interest rates. Its expected return for the year is 28 basis points.
One important point about Table 2 is that returns are much
higher in the later years. Taking into account compounding
and investment periods, the return over ten years is very
close to the starting yield of 2.98%. Again, this shows the
relationship of current yields to expected long term returns.
As of December 31, 2013 the Barclays Capital U.S. Universal
ex MBS had an effective maturity of 7.44 years and a yield
of 2.70%. As shown above, investors can reasonably expect
a 2.70% annualized compounded return if a portfolio that
mirrors the benchmark is held for 7.44 years.
Fixed Income Returns—Reasonable Assumptions
As with any investment, past returns do not predict the future.
Though with fixed income, fairly reasonable assumptions
of what returns will be in the long term can be made, since
investors know yields today and control the length of the
investment period. With ten-year yields near 3%, investors can
expect fixed income returns over the next ten years to be near
3%. That may not be as attractive as the 8.4% average return
of the Barclays Aggregate Bond Index since its inception, but
it is still a positive return and bonds provide diversity in well-
balanced portfolios. The key risk for fixed income investors
is the volatility of returns that comes from unexpected events
that are not currently reflected in the markets. Current economic
expectations are reflected in the forward rate curve, but an
unexpected event such as a bank failure or a geo-political
event can cause these expectations to change. This could
cause yields to move up or down faster than expected and
significantly impact fixed income returns in the short term.
Table 2—Expected Benchmark Returns from 2014 to 2024 Using Forward Rates
As with any investment, past returns do not predict the future. Though with fixed income,
fairly reasonable assumptions of what returns will be in the long term can be made,
since investors know yields today and control the length of the investment period.
“
”
Wespath provides UMC-affiliated institutional investors with access to well-managed investment programs that historically have delivered competitive performance while honoring United Methodist Social Principles. Wespath is the investments division of the General Board of Pension and Health Benefits of The United Methodist Church, a century-old institution with a well-regarded reputation for delivering returns aligned with values.
Wespath is an established investment manager with approximately $20 billion in assets under management.
Our name honors John Wesley, the founder of Methodism and a leader in establishing social principles that outline the tenets of socially responsible business practices. Wespath reflects this heritage, along with the idea of putting clients on the right path to financial growth with a commitment to values-driven investing.
4655/021014
wespath.com
® Copyright Wespath 2014.
Wespath Investment Management
1901 Chestnut Avenue
Glenview, IL 60025-1604
1-847-866-4100