understanding fish behavior during typhoon events in real-life underwater...
TRANSCRIPT
Understanding fish behavior during typhoon eventsin real-life underwater environments
Concetto Spampinato · Simone Palazzo · Bastian Boom · Jacco van Ossenbruggen ·Isaak Kavasidis · Roberto Di Salvo · Fang-Pang Lin · Daniela Giordano ·Lynda Hardman · Robert B. Fisher
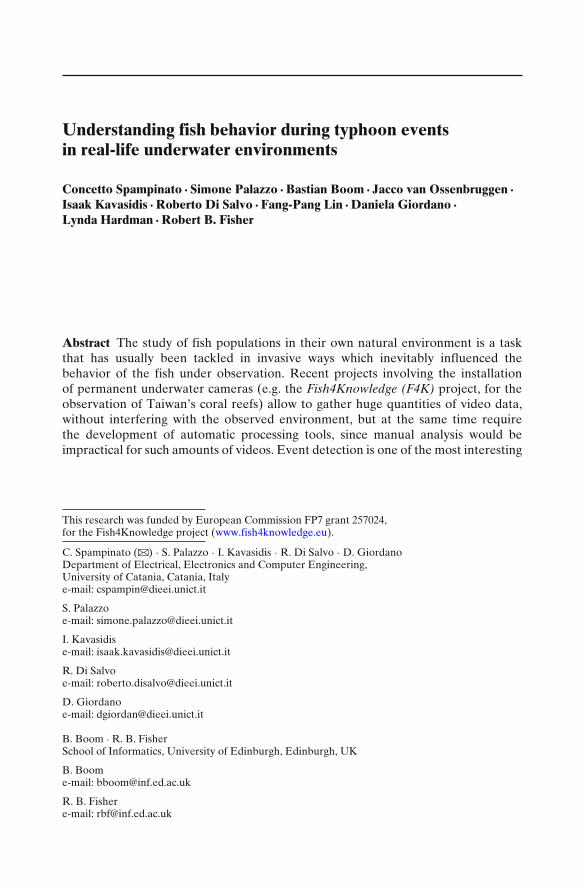
Abstract The study of fish populations in their own natural environment is a taskthat has usually been tackled in invasive ways which inevitably influenced thebehavior of the fish under observation. Recent projects involving the installationof permanent underwater cameras (e.g. the Fish4Knowledge (F4K) project, for theobservation of Taiwan’s coral reefs) allow to gather huge quantities of video data,without interfering with the observed environment, but at the same time requirethe development of automatic processing tools, since manual analysis would beimpractical for such amounts of videos. Event detection is one of the most interesting
This research was funded by European Commission FP7 grant 257024,for the Fish4Knowledge project (www.fish4knowledge.eu).
C. Spampinato (B) · S. Palazzo · I. Kavasidis · R. Di Salvo · D. GiordanoDepartment of Electrical, Electronics and Computer Engineering,University of Catania, Catania, Italye-mail: [email protected]
S. Palazzoe-mail: [email protected]
I. Kavasidise-mail: [email protected]
R. Di Salvoe-mail: [email protected]
D. Giordanoe-mail: [email protected]
B. Boom · R. B. FisherSchool of Informatics, University of Edinburgh, Edinburgh, UK
B. Boome-mail: [email protected]
R. B. Fishere-mail: [email protected]

aspects from the biologists’ point of view, since it allows the analysis of fish activityduring particular events, such as typhoons. In order to achieve this goal, in this paperwe present an automatic video analysis approach for fish behavior understandingduring typhoon events. The first step of the proposed system, therefore, involvesthe detection of “typhoon” events and it is based on video texture analysis and onclassification by means of Support Vector Machines (SVM). As part of our behaviorunderstanding efforts, trajectory extraction and clustering have been performed tostudy the differences in behavior when disruptive events happen. The integrationof event detection with fish behavior understanding surpasses the idea of simplydetecting events by low-level features analysis, as it supports the full semanticcomprehension of interesting events.
Keywords Event detection · Fish detection · Covariance tracking · Behaviorunderstanding
1 Introduction
The typical techniques adopted by marine biologists to study fish populations in theirnatural habitat involve casting nets in the ocean, human underwater observationand photography [48], combined net casting and acoustic (sonar) [6] and humanhand-held video filming. However, these approaches suffer several limitations: forexample, the net casting method, though accurate, has the disadvantage of killingthe fish and damaging their environment; human filming and photography do notdamage the habitat, but provide limited information.
In order to overcome these limitations, in recent years the use of embeddedunderwater cameras has drawn a lot of interest, since it is an environmentally friendlyapproach, does not influence fish behavior and also provides large amounts of videomaterial. On the other hand, it becomes impractical to manually analyze this hugequantity of video data, both because it requires a lot of time and concentration andalso because it is error prone—it is unrealistic to assume people can fully investigateall the information in the videos. Therefore, automatic video analysis methods areheavily demanded.
J. van Ossenbruggen · L. HardmanCentrum voor Wiskunde en Informatica (CWI),University of Amsterdam, Amsterdam, Netherlands
J. van Ossenbruggene-mail: [email protected]
L. Hardmane-mail: [email protected]
F.-P. LinNational Center of High Performance Computing, Hsinchu City, Taiwane-mail: [email protected]

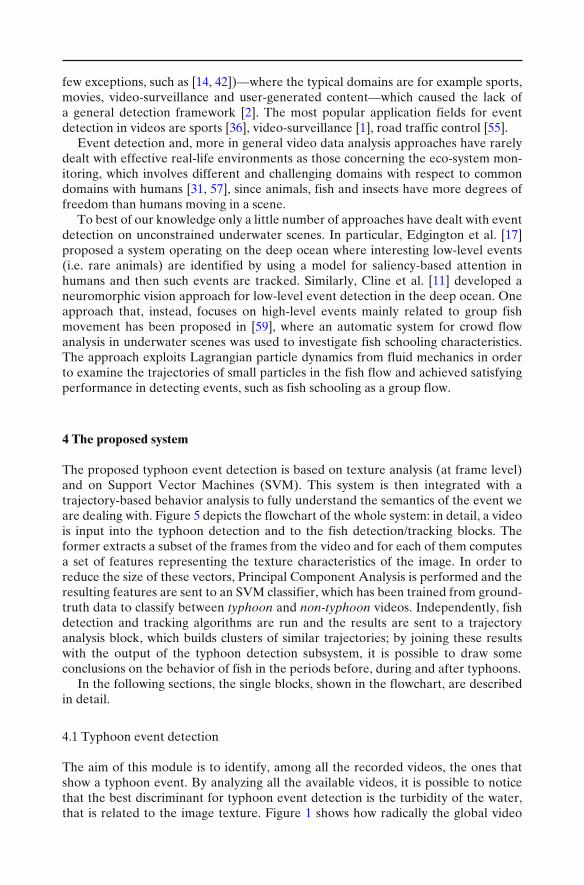
(a) Scene under standard conditions (b) Scene during a typhoon
Fig. 1 Underwater scenes recorded by the Coral Reef in Ken-Ting Area (Taiwan)
The Fish4Knowledge1 project uses live video feeds from ten underwater cameraslocated in the coral reefs of Taiwan’s shores and aims at developing an automaticsystem for integrated data capturing, video analysis, fish detection and classification,and querying, for the marine biologists to use, in order to study fish populations,behavior and interactions. The main difficulty of this kind of task is the nature ofthe videos to be processed. Traditionally, such tasks involve the analysis of video shotin controlled environments, such as tanks, where for example lighting conditionsdo not change with time, the background can be chosen to simplify fish detection,the type of fish is known, etc. The lack of these assumptions greatly complicatesthe task to be accomplished and requires the development of automatic analysismethods which are robust enough to handle all the possible varying conditions ofthe environment.
Another critical aspect of the project is the recognition of “events”, both relatedto fish behavior (such as eating, preying, sleeping, mating, etc) and to environmentalphenomena (such as typhoons), in order to have videos automatically labeled andcategorized by the happening of such events. In fact, in marine biology it is of extremeimportance to monitor habitat and fish fauna before and after catastrophic typhoons.For example, The Taiwan area is often hit by typhoons (e.g. five in 2010), whichcause severe deleterious effects on fish and their habitat [33, 58]. Although thereexist studies, e.g. [40] and [53], that have investigated the changes in underwaterenvironment after such events happen, most of them have focused on long-termmonitoring and they are not able to explore the effects right after the typhoon. This ismainly due to the impracticability for human operators to monitor the area becauseof, for instance, the floods coming down from neighboring mountains. Therefore, theimportance of using underwater cameras (and intelligent video analysis approaches)rises again, especially for short/middle term monitoring but also for analyzing allthose cases where a typhoon hits a specific area unexpectedly.
However, underwater camera-based monitoring shows some deficiencies (as abovementioned): the impossibility of a human operator to deeply analyze the stored videosand the poor clarity of the images during such events, that makes hardly possible notonly the identification of fish behavior, but also of fish, as shown in Fig. 1.
1http://fish4knowledge.eu

In this paper we propose an approach that integrates typhoon event detectionand fish behavior understanding based on the analysis of fish trajectory dynamics.Since the videos shot during with typhoons show an increase of the turbidity of thewater, the event detection algorithm relies on classification of texture features ofvideo frames by means of Support Vector Machines (SVM). Once a typhoon event isdetected, fish trajectories are extracted by suitable detection and tracking modules inorder to study to what extent typhoons influence fish behavior. Finally, to describethe differences in fish activities at the different times of a typhoon’s passage, theclustering of fish trajectories in standard underwater conditions (i.e., no typhoon)and during typhoons is performed.
This paper focuses on typhoon event detection and trajectory-based behaviorunderstanding (Section 4), which rely on automatic object detection and trackingmethods. These are advances on previous underwater object detection, tracking andevent analysis algorithms (Section 3).
The data for the project comes from the fixed camera underwater monitoringsystem of the Fish4Knowledge project (Section 2). We achieve an accuracy of about80% on fish detection, 95% on tracking and 97% on event detection (Section 5).Possible improvements include (discussed in Section 6) the extension of the eventdetection algorithm to any event detection problem which can be formulated in termsof texture description of videos and the publication of all the achieved event data asLinked Open Data in order to provide sufficient detail to allow full replication of theexperiments described, but also a sufficient level of abstraction to facilitate linkingto existing event data.
2 The underwater monitoring system
The Fish4Knowledge project exploits the distributed system for real-time videostreaming and storage provided by the National Center of High Performance Com-puting in Taiwan. This system includes a stream receiving unit, a stream processingunit and a presentation unit [10]. Figure 2 illustrates the distributed streaming systemarchitecture and the stream pipeline.
Fig. 2 Architecture blocks and stream pipeline

The stream receiving unit supports and identifies automatically multiple capturedevices, choosing a proper encoder accordingly. It creates a device identificationmodule, packed together with several commonly used software components intoone package. This package contains not only the most commonly used devices,such as HDV, DV, DC, Webcams, TV Cards and Capture Cards, but also multiplestream compression encoders of the most commonly used standards, such as MPEG-1/2/4, WMV, FLV, MJPEG. The benefit of the architecture is the decoupling of thepipeline, which allows flexible configurations of capture devices and codec standards.The stream processing unit, after receiving a stream, offers two options: one thatdirectly streams the received video to the presentation unit and another that slices itinto a sequence of images, which can be extracted and stored for further processing.These images are sent to the respective round robin queues, to be treated by imageprocessing techniques, such as event detection, object detection and tracking, imagesegmentation etc. When the image processing phase terminates, the images and theassociated logging information are automatically stored in an image database. There,users can query, browse, analyze, and manage these images via image managementservices. The presentation unit supports multiple display devices to accommodateend-users’ needs. The easiest way for users to view the streams is by using a Webbrowser. For this purpose, a Web-based user interface was designed to allow users tobrowse multiple real-time streams (Fig. 3). In order to reduce network traffic and toenhance the streaming efficiency, two distributed video stream compression conceptsare implemented. The first distributed compression is a client-server based concept.It includes pre-compression on the client side and post-compression on the serverside. The stream receiving unit grabs the video stream from the client and compressesit to reduce the necessary bandwidth needed. The post-compression transfers the
Fig. 3 A Web interface for stream viewing, users can select multiple real-time streams from toppanel
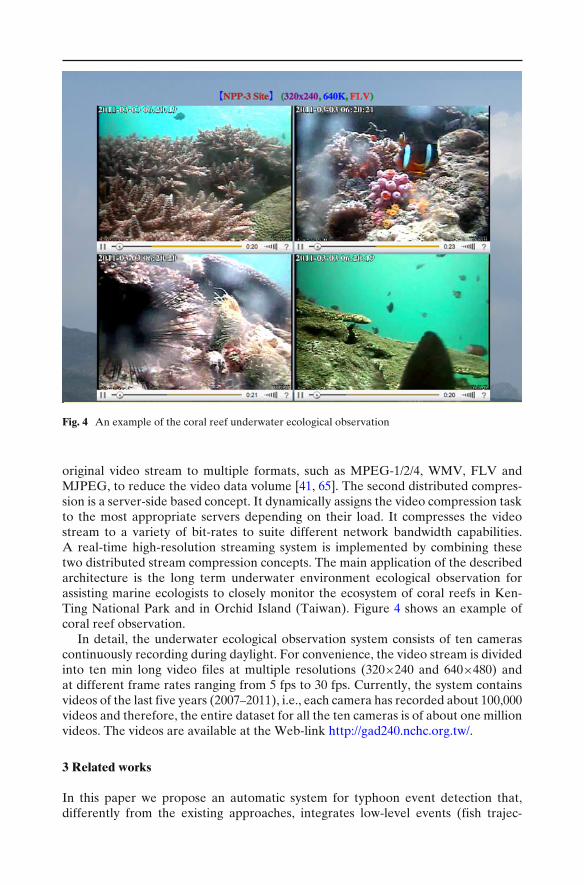
Fig. 4 An example of the coral reef underwater ecological observation
original video stream to multiple formats, such as MPEG-1/2/4, WMV, FLV andMJPEG, to reduce the video data volume [41, 65]. The second distributed compres-sion is a server-side based concept. It dynamically assigns the video compression taskto the most appropriate servers depending on their load. It compresses the videostream to a variety of bit-rates to suite different network bandwidth capabilities.A real-time high-resolution streaming system is implemented by combining thesetwo distributed stream compression concepts. The main application of the describedarchitecture is the long term underwater environment ecological observation forassisting marine ecologists to closely monitor the ecosystem of coral reefs in Ken-Ting National Park and in Orchid Island (Taiwan). Figure 4 shows an example ofcoral reef observation.
In detail, the underwater ecological observation system consists of ten camerascontinuously recording during daylight. For convenience, the video stream is dividedinto ten min long video files at multiple resolutions (320×240 and 640×480) andat different frame rates ranging from 5 fps to 30 fps. Currently, the system containsvideos of the last five years (2007–2011), i.e., each camera has recorded about 100,000videos and therefore, the entire dataset for all the ten cameras is of about one millionvideos. The videos are available at the Web-link http://gad240.nchc.org.tw/.
3 Related works
In this paper we propose an automatic system for typhoon event detection that,differently from the existing approaches, integrates low-level events (fish trajec-
tories) with high-level events (typhoon), in order to understand how fish behaveduring specific events and thus supporting the full semantic comprehension of aspecific event [51]. Therefore, one of the main parts of the proposed system is fishtrajectory analysis, which involves fish detection and tracking. For this reason, atthe beginning of this section, a brief review of the detection and tracking methodsthat work under conditions similar to the underwater’s ones is presented; then, theexisting approaches in underwater domain are reviewed. Finally, the analysis of theexisting approaches for event detection in underwater scenes is given.
Before reviewing the literature, let us introduce which are the effects that usuallyoccur in underwater scenes and that make the task of video analysis very difficult andchallenging:
– sudden and gradual light changes: typically, the videos are available startingfrom sunrise up to sunset, so it is necessary to consider the light transition dueto these particular moments of the day in which brightness and contrast of theimages are strongly compromised by the absence of sunlight. Moreover, theperiodical gleaming in the underwater scene has to be considered when designingthe detection and tracking algorithms;
– bad weather conditions: the weather conditions could be subject to unexpectedchanges such as sudden cloudiness, storms and typhoons. Under these conditionsthe scene becomes very difficult to analyze due to a worsening of image contrastwhich makes it hard to detect and track clearly any targets;
– murky water: in order to investigate the movements of fish in their naturalhabitat it is important to consider that the clarity of the water during theday could change due to the drift and the presence of plankton. Under theseconditions, targets that are not fish might be detected as false positives;
– algae on camera lens: the direct contact of seawater with the lens causes a rapidformation of algae and filth that compromises the quality of the observed scene;
– periodic and multimodal background: handling background movements andvariations is one of the most difficult tasks and algorithms must be robust enoughto cope with any arbitrary changes in the scene. Also periodic movements (e.g.plants affected by flood-tide and drift) have to be taken into account to avoid thedetection of moving non-fish objects;
However, one of the most complex issues to deal with, when processing underwa-ter videos, concerns the targets to be detected and tracked. Indeed, differently fromhumans, fish show erratic and fast movements (in three dimensions) that, therefore,lead to frequently changes in size and appearance.
All these aspects can be classified as extreme conditions, and in the following theobject detection and tracking methods that deal with similar conditions are reviewed.
3.1 Object detection ad tracking under extreme conditions
A myriad of detection algorithms have been proposed for handling different back-grounds and scene phenomena. Basically, the existing approaches for motion mod-eling [9, 19] can be classified into recursive techniques [18, 62] which adaptivelyupdate single or multiple background models based on each input frame at thecurrent time, and non-recursive techniques [22, 64] that use a buffer of N previousframes to estimate the background image according to the temporal variation of

each pixel within the buffer. However, none of these approaches have demonstratedto be generally superior to the other ones, and the performance depends on thespecific application domain. Porikli in [44] have compared different algorithms(both for detection and tracking) under extreme conditions that somehow recallthe ones present in underwater scenes such as erratic motion, sudden and globallight change, presence of periodic and multimodal background, arbitrary changes inthe observed scene, low contrast and noise. In detail, the authors have shown thatthe algorithms that best perform under these conditions use mixture of probabilitydensity function (pdf ) models [23, 24, 62], Wave-Back Model [45] and IntrinsicModel [43]. In detail, mixture of pdf models have been adopted to handle multi-modal backgrounds. In these models, background pixels are modeled as a mixture ofeither Gaussian or Poisson pdf s, which are iteratively updated at every frame. Theseapproaches are flexible enough to handle sudden and global illumination changesand other arbitrary variations in the scene and, moreover, they can converge to anyarbitrary distribution providing enough number of observations, but generally thecomputational cost grows exponentially as the number of models in the mixtureincreases. A drawback of the previous methods is that they ignore the temporalcorrelation of color values. This impedes the differentiation of periodic backgroundmotion from foreground motion. Since real-world physics (especially, in underwa-ter domains) induces near-periodic phenomenon in the environment, a frequencydecomposition-based representation of the background (Wave-Back [45]) has beenalso adopted. This algorithm detects moving objects based on the form of thetemporal color variation by comparing the frequency transform responses. Basically,the algorithms use frequency decomposition of pixels’ history to catch periodicbackground movements. In particular, for any input frame the DCT (Discrete CosineTransform) coefficients are calculated and compared to the respective backgroundcoefficients, thus resulting in a distance map. By thresholding this distance map, themoving objects can be isolated. The Wave-Back algorithm usually performs well inrepetitive scenes and with low-contrast colors but it performs inadequately in sceneswith erratic movement and when sudden lighting transitions take place.
To overcome these limits, background scene has been represented using intrinsicimages [43] as a multiplication of static and dynamic parts. The idea behind thisalgorithm is that in a video, every image can be decomposed in two components:the reflectance image and the illumination image. The former is invariant to lightingchanges and is almost identical under any light conditions. The background ismodeled by calculating the temporal median of these reflectance parts of the inputimages. This algorithm has been proved to perform better than the previous onesunder extreme conditions, specially, in scenes with lighting changes, fast-and-erraticobject movements and low-contrast.
In a behaviour understanding system, tracking is of core importance since itextracts the trajectories of the objects involved in the scene and, at the same, itallows to repair detection failures. Visual tracking consists of following an objectin a video across consecutive frames; in other words a tracking algorithm has tobe able to recognize that two regions in two different frames represent the sameobject. However, this task presents a few major difficulties, which are even moreemphasized in unconstrained environments such as the underwater one. First ofall, in a tracking algorithm, the search region of an object has to be limited to a

neighborhood of its previous detection, otherwise a new object appearing in thescene might be associated to the old one, even if it is located in a different part ofthe video. The choice of the search area depends on the motion characteristics of theobjects which typically appear in the scene. For example, in an urban environment wecan safely assume that pedestrians and cars (e.g. the same holds for football players)move approximately always in the same direction, without swift changes, and thisrestricts the search area to something shaped like a cone oriented towards the maindirection of the target. However, with fish this is not necessarily true, because theirtypical erratic motion in three dimensions makes their direction less predictable.Another tracking issue consists of the change in appearance of an object across thevideo, because of variations of lighting, orientation, shape. This is especially truefor fish, because of their non-rigidity and, again, of erratic motion. Finally, anothercomplication is caused by occlusions, that is the case of partial or total overlappingof two or more objects.
Many different approaches have been studied in literature on how to solve thevisual tracking problem. Among these, the most famous and widely-used algorithms[32] are Kalman filter-based tracking [16], multiple hypothesis tracking (MHT) [47],optical flow-based tracking [56], particle filter tracking [27], point feature tracking,and mean shift tracking [12]. A detailed analysis and comparison of the existingapproaches is beyond the aim of the paper, and an extensive literature of objecttracking approaches may be found in [70] and [49]. However, a brief descriptionof the existing approaches showing pros and cons under extreme conditions is, here,given.
One of the simplest ways to see the tracking problem is as an estimation ofthe probability density function of a state representing an object’s position andappearance, given the set of all measurements up to that moment. When themeasurement noise is assumed to be Gaussian, Kalman filters provide an optimalsolution. The most general class of such filters is represented by particle filters, wherethe current state distribution is modeled as a set of weighted samples which areupdated as soon as new measurements become available. Particle filter tracking isused in several applications [5, 71], however it may become impractical because of thesize of the state vector and of the large number of particles in complex scenes (such asunderwater domain). Another tracking approach consists in characterizing objects bylocal point features [37, 56] and trying to match objects through frames by evaluatingthe correspondences between feature point sets, chosen in such a way as to make thedescription of the objects invariant to affine or projective transformations. However,this technique presents several limits, especially with smooth object surfaces (forwhich it is difficult to extract distinguishing feature points) or when objects undergopose changes, intersections and severe deformations as often happens with fish.
A computationally efficient and very popular approach is mean-shift tracking[12], which models the object’s probability density in terms of color histogram, andmoves the object region towards the largest gradient direction, in order to maximizethe similarity between the reference and candidate object regions, measured withthe Bhattacharyya coefficient or the Kullback-Leibler divergence criteria. However,this technique fails in the case of occlusions and quick appearance changes, whenthe color distribution of the background is too similar to that of the target objector when the object moves outside of the kernel search area. Tracking algorithms
based on covariance representation [66] model objects as the covariance matricesof a set of feature built out of each pixel belonging to the object’s region. Thisrepresentation embodies both the spatial and statistical properties, unlike fromhistogram representations (which disregard the structural arrangement of pixels) andappearance models (which ignore statistical properties) and, therefore, it is the mostsuitable to track objects under the above described conditions.
3.2 Object detection and tracking in underwater scenes
The existing literature for automatic video and image analysis of real-life underwaterenvironments has been mainly focused on fish recognition [3, 34, 39, 61], whereasonly few approaches for fish detection and tracking have been proposed.
Most of the existing methods have largely been driven by commercial fish aquacul-ture, with the goal of non-intrusive estimation of fish numbers and sizes in controlledenvironments or in labs (i.e., with fixed lighting, cameras, background, fixed objectsin the water, known types of fish, known number of fish, etc.) in order to providealso useful feedback for the study of behavioral and locomotion under differentenvironmental variations.
The first step before detecting and tracking fish is to perform image registrationand to improve the quality of the grabbed frames. In this direction very fewapproaches have been proposed in underwater environment: for image registration,recently, Costa et al. [13] developed an approach based on artificial neural networksfor correcting the distortion due to camera lens (as far as we know no approachexists for correcting jitter). Iqbal et al. [30] developed an enhancement system basedon contrast stretching for solving lighting problems or clarity of water problems. Anextensive literature of underwater image enhancement and restoration methods canbe found in [52].
A variety of methods for fish detection and tracking have been proposed. Moraiset al. [38] proposed a system, based on Bayesian filtering techniques, to detect andcount fish in a fish tank with a fixed number of fish, reporting a success rate for fishcounting of 81%. Evans [21] detected and counted isolated Southern Bluefin tuna incages. Spampinato et al. [60], instead, proposed a system that detects and counts livefish free swimming by the coral reefs through the use of a video change detectionalgorithm with a performance of about 85%. Zhou and Clark [72] tracked individualLarge Mouth Bass through multiple frames while simultaneously estimating their3D position and orientation. Walther et al. [69] developed an automatic machinevision system for animal detection and tracking by using high-resolution videoequipment on board of the ROV (ocean-going remotely operated vehicles—ROV).Hariharakrishnan and Schonfeld [28] proposed a tracking system based on theprediction of object contour by analyzing motion vector information.
3.3 Event detection in underwater scenes
In the last few years, high-level event detection and description in videos has drawnincreasing interest from the scientific community [2]. Video surveillance systems,advanced human-computer interfaces and semantic video indexing are just the mainexamples of the possible application fields of this research branch. However, thevideo event recognition task has often been tackled in a domain-specific way (except
few exceptions, such as [14, 42])—where the typical domains are for example sports,movies, video-surveillance and user-generated content—which caused the lack ofa general detection framework [2]. The most popular application fields for eventdetection in videos are sports [36], video-surveillance [1], road traffic control [55].
Event detection and, more in general video data analysis approaches have rarelydealt with effective real-life environments as those concerning the eco-system mon-itoring, which involves different and challenging domains with respect to commondomains with humans [31, 57], since animals, fish and insects have more degrees offreedom than humans moving in a scene.
To best of our knowledge only a little number of approaches have dealt with eventdetection on unconstrained underwater scenes. In particular, Edgington et al. [17]proposed a system operating on the deep ocean where interesting low-level events(i.e. rare animals) are identified by using a model for saliency-based attention inhumans and then such events are tracked. Similarly, Cline et al. [11] developed aneuromorphic vision approach for low-level event detection in the deep ocean. Oneapproach that, instead, focuses on high-level events mainly related to group fishmovement has been proposed in [59], where an automatic system for crowd flowanalysis in underwater scenes was used to investigate fish schooling characteristics.The approach exploits Lagrangian particle dynamics from fluid mechanics in orderto examine the trajectories of small particles in the fish flow and achieved satisfyingperformance in detecting events, such as fish schooling as a group flow.
4 The proposed system
The proposed typhoon event detection is based on texture analysis (at frame level)and on Support Vector Machines (SVM). This system is then integrated with atrajectory-based behavior analysis to fully understand the semantics of the event weare dealing with. Figure 5 depicts the flowchart of the whole system: in detail, a videois input into the typhoon detection and to the fish detection/tracking blocks. Theformer extracts a subset of the frames from the video and for each of them computesa set of features representing the texture characteristics of the image. In order toreduce the size of these vectors, Principal Component Analysis is performed and theresulting features are sent to an SVM classifier, which has been trained from ground-truth data to classify between typhoon and non-typhoon videos. Independently, fishdetection and tracking algorithms are run and the results are sent to a trajectoryanalysis block, which builds clusters of similar trajectories; by joining these resultswith the output of the typhoon detection subsystem, it is possible to draw someconclusions on the behavior of fish in the periods before, during and after typhoons.
In the following sections, the single blocks, shown in the flowchart, are describedin detail.
4.1 Typhoon event detection
The aim of this module is to identify, among all the recorded videos, the ones thatshow a typhoon event. By analyzing all the available videos, it is possible to noticethat the best discriminant for typhoon event detection is the turbidity of the water,that is related to the image texture. Figure 1 shows how radically the global video

Fig. 5 Flow chart of the proposed typhoon detection and behavior understanding system
appearance changes after the arrival of a typhoon in the area. Accordingly, thedetection of typhoon events is based on computing blurring and texture featureson different parts of the images and at different scales. The features extractionmethod takes inspiration from the object detection algorithm described in [68], wherethe model of the background is built by iteratively dividing the image into a grid,computing histogram-based features on each cell, grouping cells into coarser blocksand repeating the procedure, until the size of the cells becomes too large (accordingto user criteria). The subdivision of the input image into a grid provides a convenientrepresentation for both global and local texture statistics. The main disadvantage ofthis approach is the computation time, since the number of sub-images to process canbe very large, because of the iterative grid division algorithm. Nevertheless, it is notnecessary to process every frame in a video, since the global appearance of the sceneis unlikely to change suddenly. For this reason, we only process a subset of frames(per video) in order to achieve the best compromise between computation costs andvariability of the recorded scene. The proposed algorithm (the flowchart of which isdepicted in Fig. 6) for feature extraction is described in Algorithm 1. The initial cellsize is set to 40×30 pixels in order to keep the 4:3 ratio of the input videos.
The output vector describing global and local texture contains a number ofelements that depends on the video resolution; for 320 × 240 videos, it stores 3,910values for each frame. In order to reduce the dimensionality of the problem, principalcomponent analysis (PCA) is then applied for features selection. The data obtained isthen fed to a Support Vector Machine with a quadratic kernel, because of their goodgeneralization property [29], as a binary classifier for identifying videos that depicttyphoons from ones that do not. After typhoon event detection is accomplished, fishdetection and tracking is performed to extract the trajectories used for investigatingfish behavior during typhoons.
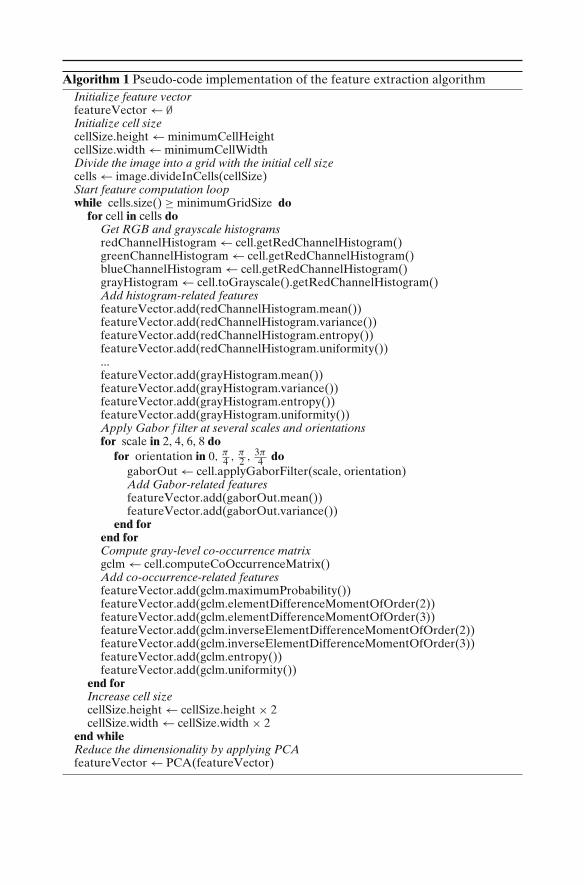
Algorithm 1 Pseudo-code implementation of the feature extraction algorithmInitialize feature vectorfeatureVector ← ∅Initialize cell size cellSize.height ← minimumCellHeightcellSize.width ← minimumCellWidthDivide the image into a grid with the initial cell sizecells ← image.divideInCells(cellSize)Start feature computation loop while cells.size() ≥ minimumGridSize do
for cell in cells doGet RGB and grayscale histogramsredChannelHistogram ← cell.getRedChannelHistogram()greenChannelHistogram ← cell.getRedChannelHistogram()blueChannelHistogram ← cell.getRedChannelHistogram()grayHistogram ← cell.toGrayscale().getRedChannelHistogram()Add histogram-related featuresfeatureVector.add(redChannelHistogram.mean())featureVector.add(redChannelHistogram.variance())featureVector.add(redChannelHistogram.entropy())featureVector.add(redChannelHistogram.uniformity())...featureVector.add(grayHistogram.mean())featureVector.add(grayHistogram.variance())featureVector.add(grayHistogram.entropy())featureVector.add(grayHistogram.uniformity())Apply Gabor f ilter at several scales and orientations for scale in 2, 4, 6, 8 do
for orientation in 0, π4 , π
2 , 3π4 do
gaborOut ← cell.applyGaborFilter(scale, orientation)Add Gabor-related featuresfeatureVector.add(gaborOut.mean())featureVector.add(gaborOut.variance())
end for end for Compute gray-level co-occurrence matrixgclm ← cell.computeCoOccurrenceMatrix()Add co-occurrence-related featuresfeatureVector.add(gclm.maximumProbability())featureVector.add(gclm.elementDifferenceMomentOfOrder(2))featureVector.add(gclm.elementDifferenceMomentOfOrder(3))featureVector.add(gclm.inverseElementDifferenceMomentOfOrder(2))featureVector.add(gclm.inverseElementDifferenceMomentOfOrder(3))featureVector.add(gclm.entropy())featureVector.add(gclm.uniformity())
end forIncrease cell size cellSize.height ← cellSize.height × 2cellSize.width ← cellSize.width × 2
end whileReduce the dimensionality by applying PCAfeatureVector ← PCA(featureVector)

Fig. 6 Flow chart describingthe algorithm for theextraction of features from avideo
4.2 Fish trajectory extraction
4.2.1 Fish detection
Following the evaluation on detection algorithms under extreme conditions per-formed by Porikli [44], we have implemented four approaches for fish detection,namely, Adaptive Gaussian Mixture Model (AGMM), Adaptive Poisson MixtureModel (APMM), Intrinsic Model (IM) and Wave-Back (W B), each one dealingwith some aspects of the underwater scenes as described in Section 3. These algo-rithms perform fairly well (as shown in the experimental result section) in underwaterenvironment, however they often detect non-fish objects (i.e. false positives) thathave to be filtered out. This requirement led us to provide the fish detector with anadditional level of post-processing that assigns to each detected blob a quality score.This score is a numerical value between 0 and 1 and is computed as the average ofthe following features:
– Dif ference of color at object boundary (�CO): this index is based on the assump-tion that color boundaries often coincide with fish/background boundaries; thisvalue is highest when the areas “just inside” and “just outside” of the contour ofthe detected fish have markedly different color values. It is computed accordingto the following procedure.
– Select N equidistant points on the object’s contour. The current value for N(the number of sampled contour points) has been set to 25. This choice is dueto the fact that the minimum fish contour size, in pixels, has been estimated tobe about 150–160 points for 320×240 images. Sampling one point in every sixallows to accurately follow the contour of the object, without missing sharpchanges in the shape.

– For each point Pi,
• Select two points Pi,in and Pi,out located just inside and just outside ofthe contour on the line passing by Pi and such that it is orthogonal to thetangent of the contour in that point.
• Compute Ci,in and Ci,out as the average color intensities in the 5 × 5neighborhoods of Pi,in and Pi,out.
– Compute the result as:
�CO = 1N
N∑
i=1
∣∣∣∣∣∣Ci,in − Ci,out
∣∣∣∣∣∣√
3 · α2(1)
In this formula, the numerator of the fraction inside the sum is the norm ofthe color intensity between the pair of pixels, and the denominator repre-sents the minimum Euclidean distance between two pixels to be consideredas belonging to markedly separate color regions. Ideally, for each pair ofpoints, the contribution to the sum should be low if the contour belongs toa homogenous region, and high if the color difference is greater than thereference distance (the denumerator).
– Dif ference of motion vectors at object boundary �MV : similarly to the previouscase, the motion vector in the regions close to the object contour are com-pared; this value (computed by formula (2)) takes into account the fact that,hypothetically, the motion vector outside of the object contour should be zero(static background) or significantly different than inside (as shown in Fig. 7).In the following formula, Mi,in and Mi,out represent the average motion vectors
(a) Original frame (b) Motion vector
Fig. 7 Motion vector boundaries typically coincide with object boundaries
computed just inside and just outside of contour point Pi (obtained as in theprevious formula).
�MV = 1N
N∑
i=1
∣∣∣∣∣∣Mi,in − Mi,out
∣∣∣∣∣∣∣∣∣∣∣∣
Mi,in∣∣∣∣∣∣ + ∣∣∣∣∣∣
Mi,out∣∣∣∣∣∣ (2)
As in the previous formula, this score returns a high value if the motion vectorsare different, and a low value otherwise. The denumerator allows to normalizebetween 0 and 1, since the norm of the difference is necessarily smaller than thesum of the respective norms.
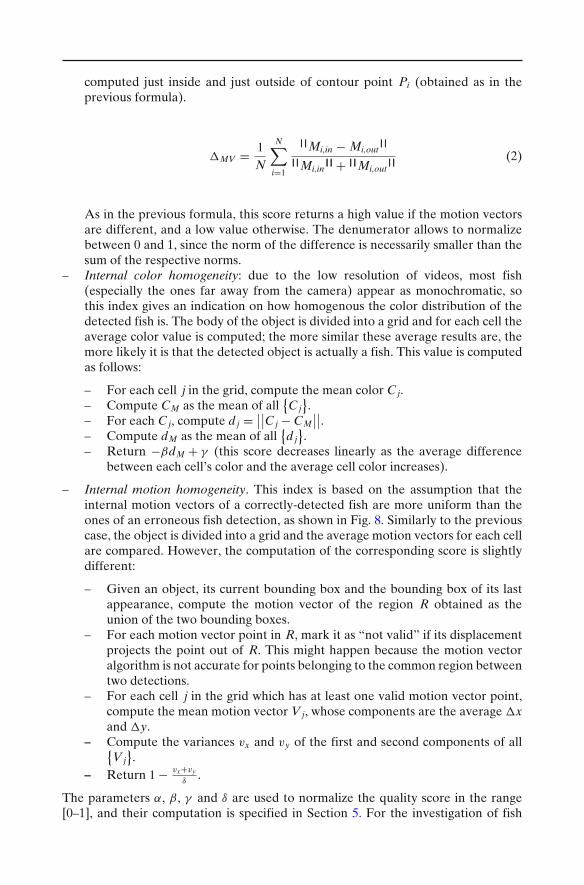
– Internal color homogeneity: due to the low resolution of videos, most fish(especially the ones far away from the camera) appear as monochromatic, sothis index gives an indication on how homogenous the color distribution of thedetected fish is. The body of the object is divided into a grid and for each cell theaverage color value is computed; the more similar these average results are, themore likely it is that the detected object is actually a fish. This value is computedas follows:
– For each cell j in the grid, compute the mean color C j.– Compute CM as the mean of all
{C j
}.
– For each C j, compute d j = ∣∣∣∣C j − CM∣∣∣∣.
– Compute dM as the mean of all{d j
}.
– Return −βdM + γ (this score decreases linearly as the average differencebetween each cell’s color and the average cell color increases).
– Internal motion homogeneity. This index is based on the assumption that theinternal motion vectors of a correctly-detected fish are more uniform than theones of an erroneous fish detection, as shown in Fig. 8. Similarly to the previouscase, the object is divided into a grid and the average motion vectors for each cellare compared. However, the computation of the corresponding score is slightlydifferent:
– Given an object, its current bounding box and the bounding box of its lastappearance, compute the motion vector of the region R obtained as theunion of the two bounding boxes.
– For each motion vector point in R, mark it as “not valid” if its displacementprojects the point out of R. This might happen because the motion vectoralgorithm is not accurate for points belonging to the common region betweentwo detections.
– For each cell j in the grid which has at least one valid motion vector point,compute the mean motion vector V j, whose components are the average �xand �y.
– Compute the variances vx and vy of the first and second components of all{V j
}.
– Return 1 − vx+vy
δ.
The parameters α, β, γ and δ are used to normalize the quality score in the range[0–1], and their computation is specified in Section 5. For the investigation of fish

(a) Original frame (good detection) (b) Filtered motion vector (good detection)
(c) Original frame (bad detection) (d) Filtered motion vector (bad detection)
Fig. 8 Correct object detections are made up of points generally orientated towards the samedirection. The circle to the right of subfigures b and d maps color to direction of motion
behavior during typhoons, we consider fish to be all those objects with a qualityscore larger than 0.8. After the fish detection, the tracking algorithm is carried out,which serves both as a proof of the correctness of the detected fish—i.e., a movingfish usually remains in the monitored scene longer than a spurious object and itsmovements (as erratic as possible) are more regular than plants’ ones—and to extractconsistently fish paths necessary for the trajectory-based behavior understandingmodule.
4.2.2 Fish tracking
The tracking algorithm, adopted to handle all the phenomena typical of underwaterdomain, is based on [46] and uses covariance matrices (since the covariance-basedtracker has been demonstrated to be superior under extreme conditions [44]) com-puted on a set of pixel-based features to model the fish appearance. In the followingdescription, we use “tracked object” to indicate an entity that represents a unique fishand contains information about the fish appearance history and its current covariancemodel; and “detected object” to indicate a moving object, which has not beenassociated to any tracked object yet. For each detected object, the correspondingcovariance matrix is computed by first building a feature vector for each pixel, madeup of the pixel coordinates, the RGB and hue values and the mean and standarddeviation of the grey level histogram of a 5×5 window which contains the target pixel.

The covariance matrix, which models the object, is then computed from this featurevector and associated to the detected object. Afterwards, the covariance matrix isused to compare the object with the currently tracked objects, in order to decidewhich one it resembles the most. The main issue in comparing covariance matricesis that they do not lie on the Euclidean space—for example, the covariance space isnot closed under multiplication with negative scales. For this reason, as suggested in[46], we used Förstner’s distance [25], which is based on generalized eigenvalues, tocompute the similarity between two covariance matrices:
ρ(Ci, C j
) =√√√√√
d∑
k=1
ln2λk(Ci, C j
)(3)
where d is the order of the matrices and{λk
(Ci, C j
)}are the generalized eigenvalues
of covariance matrices Ci and C j, computed from
λkCixk − C jxk = 0 k = 1 · · · d (4)
The model of each tracked object is then computed as a mean of the covariancematrices corresponding to the most recent detections of that object. In order todeal with occlusions, the algorithm handles the temporary loss of tracked objects, bykeeping for each of them a counter for how many frames it has been missing; whenthis counter reaches a user-defined value (time-to-live, TTL), the object is consideredlost and discarded. Of course, it is important to find a good trade-off for this value:if it is too low, an object which temporarily disappears (for example, because it ishidden behind a plant) might be treated as a different object when it reappears; ifit is too high, different objects might be recognized as the same one, which has longexited the scene.
The steps performed by the proposed tracking algorithm are described in detail inAlgorithm 2.
The fish tracking algorithm is one of the most important parts of the proposedsystem since it identifies the fish trajectories on which the behavior understandingmodule relies. Thereafter, in order to consistently investigate fish behavior, it isnecessary to estimate the quality of each detected trajectory and to select the onesthat respect a specific criteria of goodness, thus avoiding to invalidate the finalbehavior analysis. To compute such a quality score (referred in the following as qS),we have adopted a series of measurements taken from [8] and [20] and combinedthem with new measurements in order to obtain values indicating the goodness andthe feasibility of a trajectory. In detail, for each tracking decision (i.e. an associationbetween an object in frame t and one in frame t + 1) the following features arecomputed and combined into a single score as an average. As for the detectionquality scores, the formulas below are parameterized by normalization constants(which are described in Section 5).
– Dif ference of shape ratio between frames: this score detects rapid changes in theobject’s shape, which might indicate tracking failure. This value is high if theshape ratio (R = W
H , with W and H, respectively, the width and the height of

Algorithm 2 Pseudo-code implementation of the tracking algorithmdetected_objects ← runDetectionAlgorithm()tracked_objects ← getCurrentlyTrackedObjects()feasible_associations ← ∅Compute covariance matrix for each detected objectfor D j in detected_objects do
D j.computeCovarianceMatrix()end for Compute set of possible associations between tracked objects and detected objectsfor Ti in tracked_objects do
for D j in detected_objects do if Ti.getCurrentPosition() ∩ D j.getBlob() �= ∅ then
dij ← computeCovarianceDistance(Ti.currentModel(),Dj.covarianceMatrix())feasible_associations.add(
(Ti, D j, dij
))
end ifend for
end for sortByDistance(feasible_associations)Assign each detected object to the covariance-closest tracked objectfor
(Ti, D j, dij
)in feasible_associations do
if not D j.isAssigned() thenD j.assignTo(Ti)Ti.updateModel()
end if end for If a tracked object has been missing for too many frames, remove itfor Ti in tracked_objects do
if Ti.foundInCurrentFrame() thenTi.resetTTL()
elseTi.decreaseTTL()if Ti.getTTL() = 0 then
tracked_objects.remove(Ti)end if
end if end for Add new tracked objects for D j in detected_objects do
if not D j.isAssigned() thentracked_objects.createNew(D j)
end ifend for
the bounding box containing the object) between consecutive frames t − 1 and tkeeps as constant as possible:
Rmax = max {Rt, Rt−1}Rmin = min {Rt, Rt−1}
shape_ratio_score = Rmin
Rmax

– Histogram dif ference: this feature evaluates the difference between two appear-ances of the same object by comparing the respective histograms (analyzingindependently the three RGB channels and the grayscale versions of the twoobjects). Given histograms Ht and Ht−1, the corresponding score is computed bysubtracting each bin’s difference (scaled by a constant) from the maximum score(1):
1 − 1ε
255∑
i=0
|Ht (i) − Ht−1 (i)|
– Direction smoothness: assuming a trajectory is as good as it is regular and withoutsudden direction changes, this value keeps track of the direction of the object inthe last frames and checks for unlikely changes in the trajectory. It is computedas:
direction_smoothness = 1 − |θ1 − θ2|180
where θ1 and θ2 are the angles (with respect to the x axis) of the last two displace-ments of the object. For simplicity, we use θ1 − θ2 in the formula, although theactual implementation handles the case of angles around the 0◦/360◦ boundary.According to this formula, the corresponding score is equal to 1 if the object’sdirection keeps constant in two consecutive frames (θ1 = θ2), and is 0 if theobject’s direction is inverted.
– Speed smoothness: similarly to the previous feature, this value checks whetherthe current speed of the object (i.e. the displacement between the previous posi-tion and current one) is similar to the average speed in the object’s history. LetPt and Pt−1 be the last two positions of the object, we compute st = ||Pt − Pt−1||,so that st represents the last displacement (speed) of the object, and compare itwith the average speed s̄ in order to compute speed_smoothness as:
smax = max {st, s̄}smin = min {st, s̄}speed_smoothness = η
smin
smax
– Texture dif ference: texture features (mean and variance of several Gabor filters)are computed from two consecutive appearances and compared. Given twofeature vectors v1 and v2, this value is computed by subtracting the (scaled)Euclidean distance from 1:
1 −√√√√
n∑
i=1
(v1 (i) − v2 (i))2/λ (5)
– Temporal persistence: this value is the number of frames in which a given objectappears.
The overall quality score qS is computed as follows:
– Compute the average μ of the above-described values, except the temporalpersistence T P.

(a) Unusual fish trajectory (b) Feasible fish trajectory
Fig. 9 Some results about fish tracking: a an erroneous path (average qS score 0.63) due to a fail ofthe tracking algorithm, b a correct path (average qS score is of 0.91)
– If T P > 5, return μ;– Else, return μ · (
0.9 + T P50
).
In the formula above, the temporal persistence score is used to limit the actualmaximum overall score achievable: if the object has appeared for less than 5 frames,then the maximum score is limited, proportionally, between 0.95 and 1.
Figure 9 shows two sample trajectories with related average qS scores; it is possibleto notice that the trajectory of the left image is unrealistic and its average score,computed as average of the scores of each tracking decision for all the appearancesof a fish (four times, in this case), was of 0.63, whereas the image on the right sideshows a correct trajectory whose average score is of 0.91.
4.3 Fish trajectory analysis
In marine biology, it is interesting to observe how the occurrence of anomalousevents can influence fish behavior. In this section we describe a trajectory-based be-havior understanding approach for investigating how fish act when typhoons happen.In detail, the behavior understanding module uses fish trajectories to describe usualfish habits and, based on our knowledge of the periods when typhoons occur, allowsus to study the behavioral deviations that might apperar during such events.
The combined information of fish detection and tracking gives us the apparenttrajectories (due to the 2D nature of the input data) that fish follow in the videos.There exist different ways to represent trajectories, although the literature in thisarea focuses mainly on video surveillance applications [31, 57]. However, in un-derwater recordings fish have more degrees of freedom than humans walking in ascene; furthermore, fish sometimes tend to stay in one place instead of followingclear trajectories. In order to model 3D fish paths, a representation based on the x, ylocation and blob size of the fish, which gives an indication of the depth z, is used.Therefore, for each appearance of a fish we keep the tuple T = (x, y, z) and a pathis represented by its start, middle and end locations (Tfirst, Tmiddle, Tend). Given thisrepresentation, we divide the set of all trajectories into fish trajectories P = {pi}N
i=1during standard underwater conditions and fish trajectories during typhoons Q =
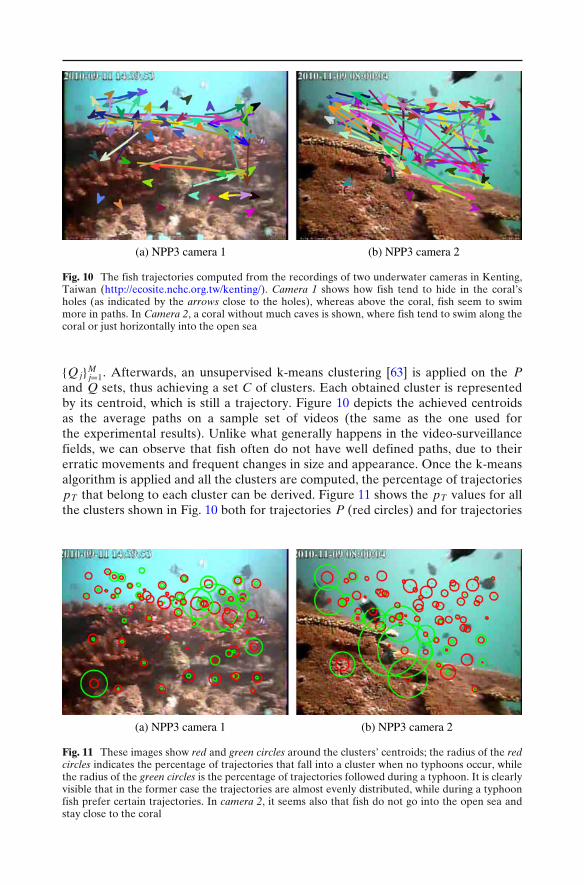
(a) NPP3 camera 1 (b) NPP3 camera 2
Fig. 10 The fish trajectories computed from the recordings of two underwater cameras in Kenting,Taiwan (http://ecosite.nchc.org.tw/kenting/). Camera 1 shows how fish tend to hide in the coral’sholes (as indicated by the arrows close to the holes), whereas above the coral, fish seem to swimmore in paths. In Camera 2, a coral without much caves is shown, where fish tend to swim along thecoral or just horizontally into the open sea
{Q j}Mj=1. Afterwards, an unsupervised k-means clustering [63] is applied on the P
and Q sets, thus achieving a set C of clusters. Each obtained cluster is representedby its centroid, which is still a trajectory. Figure 10 depicts the achieved centroidsas the average paths on a sample set of videos (the same as the one used forthe experimental results). Unlike what generally happens in the video-surveillancefields, we can observe that fish often do not have well defined paths, due to theirerratic movements and frequent changes in size and appearance. Once the k-meansalgorithm is applied and all the clusters are computed, the percentage of trajectoriespT that belong to each cluster can be derived. Figure 11 shows the pT values for allthe clusters shown in Fig. 10 both for trajectories P (red circles) and for trajectories
(a) NPP3 camera 1 (b) NPP3 camera 2
Fig. 11 These images show red and green circles around the clusters’ centroids; the radius of the redcircles indicates the percentage of trajectories that fall into a cluster when no typhoons occur, whilethe radius of the green circles is the percentage of trajectories followed during a typhoon. It is clearlyvisible that in the former case the trajectories are almost evenly distributed, while during a typhoonfish prefer certain trajectories. In camera 2, it seems also that fish do not go into the open sea andstay close to the coral
Q (green circles). The bigger the radius of a circle is, the more trajectories havebeen assigned to the cluster found in that specific point. Therefore, the size ofthe red circles indicates how often a certain trajectory is followed by fish when notyphoon affects the recorded scene, whereas the size of the green circles indicatesthe percentage of followed trajectories by fish during typhoons. It is possible to noticehow, in the former case, the distribution of the clusters is quite regular over the scene,while in the latter case, the trajectories are not evenly distributed anymore.
Moreover, during a typhoon, fish seem to stay by the coral instead of going toopen sea, as shown in Fig. 11b.
Although the scientific value of this finding has to be validated by marinebiologists, it is easy to understand the asset that the proposed approach may provideto marine biology, especially in discovering and interpreting anomalous events.
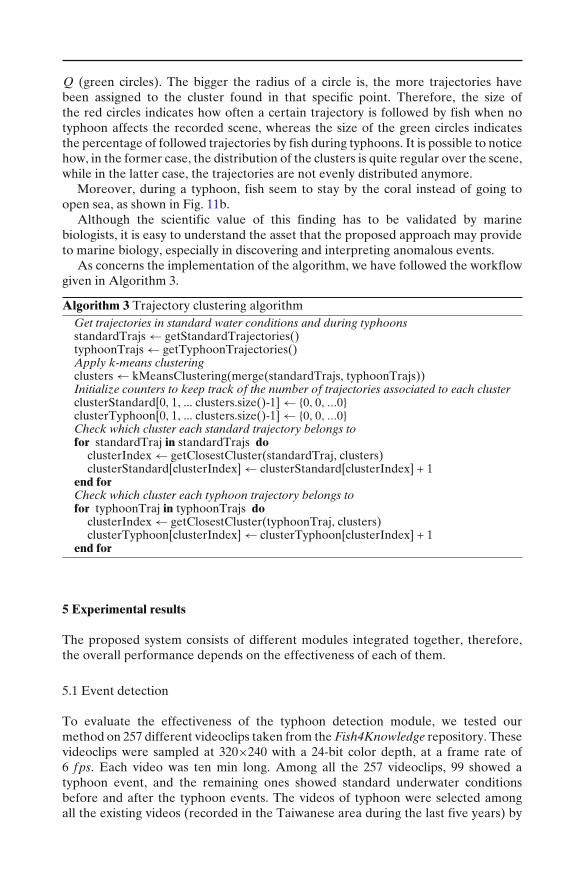
As concerns the implementation of the algorithm, we have followed the workflowgiven in Algorithm 3.
Algorithm 3 Trajectory clustering algorithmGet trajectories in standard water conditions and during typhoonsstandardTrajs ← getStandardTrajectories()typhoonTrajs ← getTyphoonTrajectories()Apply k-means clustering clusters ← kMeansClustering(merge(standardTrajs, typhoonTrajs))Initialize counters to keep track of the number of trajectories associated to each clusterclusterStandard[0, 1, ... clusters.size()-1] ← {0, 0, ...0}clusterTyphoon[0, 1, ... clusters.size()-1] ← {0, 0, ...0}Check which cluster each standard trajectory belongs tofor standardTraj in standardTrajs do
clusterIndex ← getClosestCluster(standardTraj, clusters)clusterStandard[clusterIndex] ← clusterStandard[clusterIndex] + 1
end forCheck which cluster each typhoon trajectory belongs tofor typhoonTraj in typhoonTrajs do
clusterIndex ← getClosestCluster(typhoonTraj, clusters)clusterTyphoon[clusterIndex] ← clusterTyphoon[clusterIndex] + 1
end for
5 Experimental results
The proposed system consists of different modules integrated together, therefore,the overall performance depends on the effectiveness of each of them.
5.1 Event detection
To evaluate the effectiveness of the typhoon detection module, we tested ourmethod on 257 different videoclips taken from the Fish4Knowledge repository. Thesevideoclips were sampled at 320×240 with a 24-bit color depth, at a frame rate of6 fps. Each video was ten min long. Among all the 257 videoclips, 99 showed atyphoon event, and the remaining ones showed standard underwater conditionsbefore and after the typhoon events. The videos of typhoon were selected amongall the existing videos (recorded in the Taiwanese area during the last five years) by

Table 1 Obtained results interms of CR and ER
K-Iteration CR (%) ER (%)
1 97.95 2.052 97.90 2.103 97.46 2.544 98.01 1.995 97.30 2.70
using the information (i.e. the dates) on the specific events gathered from DBpedia2
and were then validated against two expert (over 20 years of experience) marinebiologists.
For each video we processed 15 frames and the feature vector for each framehad dimensionality of [1×3910]. We selected only 15 frames per video since this wasthe best trade-off between computation costs and variability of the analysed scene:indeed by processing only 15 frames we were able to perform the method on-the-flyand, at the same, about one frame per minute was enough to grab the dynamics of atyphoon as the scenes change very gradually and slowly. This implies that the originaldataset describing the features of all the 257 videos was a matrix of [3855×3910]values. After feature selection, carried out by means of PCA, the original datasethad dimensionality of [3855×18]. Then the reduced features vector was used to trainand test the Support Vector Machines classifier. To calculate the expected risk since alarge amount of data is considered, the K-fold cross-validation method was applied.By using N = 3855 labels for the data that represents the observations, we dividethem into K subsets:
– K-1 subsets are used as training sets (learning);– the remaining subset is used as the test set.
This operation is repeated leaving out each k subset, with k = 1, 2, · · · , K and thefinal risk is obtained from the combination of the k intermediate estimates. Toevaluate the effectiveness of the classifier K = 5 was chosen, while Correct Rate(CR) and Error Rate (ER) were chosen to estimate the accuracy. Table 1 shows theobtained results in terms of CR and ER, while K varies from 1 to 5.
To test the capability of the proposed event detection approach in discriminatingtyphoon from other events, another evaluation was carried out by taking into accountevents “storm”. In fact, the effects of a storm and of a typhoon on underwater scenesmay appear similar at a visual inspection, as shown in Fig. 12.
In this case, we compared the “typhoon” videoclips (99) with 35 videoclips(extracted from the original dataset) depicting underwater scenes during storms.The K-fold (with K = 5) cross-validation method was also used. The achievedaverage correct rate was of 0.98, thus confirming the discrimination capability of theproposed method. The same procedure was applied to distinguish “storm” eventsfrom standard underwater conditions yielding an average correct rate (with K = 5) ofabout 0.91. This good performance indicates that a cascade of SVM classifiers is ableto discriminate typhoon event, storm event from “not interesting” events (standardconditions).
2http://dbpedia.org/

(a) typhoon event (b) storm event
Fig. 12 Example of underwater scenes during a typhoon and b storm
The performance of the proposed system in detecting typhoon event was alsoestimated using the normalized detection cost (NDC) [26, 35], that represents theperformance of detecting a specific event and it is defined as a weighted linearcombination of missed detection (MD) and false alarm (F A) probabilities. TheNDC for a specific event is given by:
NDC = CMD · PMD · PT + CF A · PF A · (1 − PT) (6)
with PMD = NMDNT
, PF A = NF ANT
that are, respectively, the missed detection and falsealarm probabilities; where NT , NMD, NF A are the numbers of videoclips, misseddetections and false alarms regarding the specific event under investigation. PT is thea priori rate of event instances E, whereas CMD and CF A are, respectively, the costsof MD and F A. The NDC was computed for both “typhoon” and “storm” events andwe used 130 videoclips whose 52 with typhoons and 18 with storms as the training set.The evaluation set consisted of 127 videoclips, of which 47 with typhoons and 17 withstorms. During our experiments, CMD and CF A were both set to 5. Table 2 reportsthe achieved values in terms of MD, F A and NDC for both “Typhoon” events and“Storm” events. Figure 13, instead, shows both the DET curve and the ROC curveof the SVM classifier when dealing with “Typhoon” events.
5.2 Fish trajectory extraction
The fish trajectory extraction module was evaluated by assessing the performance offish detection and tracking methods. As described in the “Fish Detection” section,we used four different algorithms for detecting fish, namely, Adaptive GaussianMixture Model (AGMM), Adaptive Poisson Mixture Model (APMM), IntrinsicModel (IM) and Wave-Back (W B), together with a post-processing module. To
Table 2 Evaluation results for events “Typhoon” and “Storm”
Events E NT MD F A PMD PF A PT NDC
Typhoon 47 127 2 7 0.02 0.05 0.37 0.19Storm 17 127 3 3 0.02 0.02 0.13 0.10

0 0.1 0.2 0.3 0.4 0.5 0.6 0.7 0.8 0.9 10
0.1
0.2
0.3
0.4
0.5
0.6
0.7
0.8
0.9
1
False Positive Rate
Tru
e P
ositi
ve R
ate
ROC curve for "Typhoon" Event (AUC = 0.98182 )
(a) ROC Curve
0.1 0.2 0.5 1 2 5 10 20 40
0.1
0.2
0.5
1
2
5
10
20
40
False Alarm probability (in %)
Mis
s pr
obab
ility
(in
%)
DET Curve for "Typhoon" Event
(b) DET Curve
Fig. 13 Performance evaluation of the SVM Classifier for “Typhoon” events

evaluate the performance of the detection algorithms we adopted common metrics[35], i.e., detection rate (DR) and false alarm rate (F AR) which are defined as:
DR = NT P
NT P + NF N(7)
F AR = NF P
NT P + NF P(8)
where NT P, NF P and NF N are, respectively, the number of true positives, falsepositives and false negatives. For the evaluation of the detection performance weused five videos (ten min long each) of the Fish4Knowledge repository, and twoof them depicted typhoons. The videos had resolutions of 320×240 with a 24-bitcolor depth at a frame rate of 6 fps. The selection of these videos was based onspecific features to test the effectiveness of every algorithm when non-standardconditions were encountered. In particular, the features taken into account were:dynamic backgrounds, illumination variations, high water turbidity, low contrast andcamouflage phenomena. The ground truth on these videos was hand labeled by ususing the Video Performance Evaluation Resource (VIPER) [15] and then validatedby the same two marine biologists who labeled the ground-truth for typhoon eventdetection. The used videos are described in Table 3 together with the number ofhand-labelled fish (NF) in the ground truth data.
Moreover, in order to test the performance of the post-processing module, theresults of the detection with and without the post-processing were estimated andare shown in Table 4. The results indicated that on average the best performance,in terms of fish detection in typhoon videos, was achieved by the Intrinsic Modelcombined with the proposed post-processing module and this was the method weused as basis for the subsequent fish tracking part.
For testing the tracking algorithm we used a different approach from ground-truth-based evaluation for two main reasons. First of all, the hand-labeling of groundtruth for tracking is more tedious and more difficult than the detection one. Thesecond reason is that it is not simple to define a quantitative performance metricsfor an algorithm that may provide partially correct results, i.e. tracking algorithmsprovide multiple measures for the same object that represent the positions of all of itsappearances and the algorithm may identify correctly only a subset of these positions.
Table 3 Description of thevideos used as ground truth
Video Description NF
1 Dynamic background 156Striped fish texture
2 Dynamic background 1,373Camouflage phenomena
3 Typhoon 1,790Frequent illumination variationsVery low contrast
4 Typhoon 34Plants movements
5 High illumination 840Camouflage phenomenaStriped fish texture

Table 4 Experimental results achieved when the detection algorithms run, respectively, without(NPP) and with (PP) the post-processing module
V. Alg. No post-processing Post-processing
NT P NF P NF N DR F AR NT P NF P NF N DR F AR
1 AGMM 102 38 54 0.65 0.27 129 11 27 0.83 0.08APMM 112 29 44 0.72 0.21 132 15 24 0.85 0.10IM 111 14 45 0.71 0.11 113 10 23 0.85 0.07WB 81 22 75 0.52 0.21 124 7 32 0.79 0.05
2 AGMM 957 89 416 0.70 0.09 1,126 87 247 0.82 0.07APMM 925 167 448 0.67 0.15 1,168 106 205 0.85 0.08IM 1,001 121 372 0.73 0.11 1,219 82 154 0.89 0.06WB 1,033 71 349 0.75 0.06 1,103 55 270 0.80 0.05
3 AGMM 1,253 228 537 0.70 0.15 1,458 159 332 0.81 0.10APMM 1,096 152 694 0.61 0.12 1,501 92 289 0.84 0.06IM 1,199 113 591 0.67 0.09 1,534 161 256 0.86 0.09WB 982 215 808 0.55 0.18 1,447 131 343 0.81 0.08
4 AGMM 26 10 8 0.76 0.28 30 6 4 0.88 0.17APMM 22 11 12 0.65 0.33 29 3 5 0.85 0.09IM 23 8 11 0.68 0.26 31 4 3 0.91 0.11WB 16 9 18 0.47 0.36 28 6 6 0.82 0.18
5 AGMM 563 60 277 0.67 0.10 686 68 154 0.82 0.09APMM 598 123 242 0.71 0.17 689 44 151 0.82 0.06IM 697 176 233 0.72 0.22 746 56 94 0.89 0.07WB 500 121 340 0.60 0.19 677 25 163 0.81 0.04
This is the case shown in Fig. 9, where we classified the two found trajectories (in fourconsecutive frames), respectively, as bad and good. Actually, the bad one indicatesthat the tracking algorithm followed the fish in three frames out of four, whereasthe good one shows that the fish was correctly tracked in all its appearances. Thisconsideration led us to use an online self-evaluation framework for the trackingalgorithm based on the quality score qS (described in Section 4.2.2) computed forassessing the quality of trajectories. Of course, such score is relative, since it iscomputed through software; nevertheless, the values computed by the self-evaluationalgorithms [8, 20] have proved to provide reliable indication on the correctness oftracking. Let us recall that the quality score qS lies in the range [0–1] and takes intoaccount also the capacity of the algorithm to track fish when it leaves the scene andcomes back in a reasonable interval of time (in the current version within six frames).
Therefore, the testing of the tracking algorithm involved the evaluation of thequality scores of the fish trajectories extracted from the same dataset (herein calledD1) used for event detection. However, for comparison purposes, the scores of thetrajectories extracted from a wider set of 1,399 videos (D2) were also computed.Table 5 shows the obtained results for both two datasets D1 and D2 in terms ofminimum (m), maximum (M), average μ and standard deviation σ . The number of
Table 5 Obtained qualityscores qS for the datasets D1and D2
Dataset Nt ρT m M μ σ
D1 13,920 54.2 0.48 0.98 0.97 0.02D2 79,323 56.7 0.29 0.97 0.82 0.11
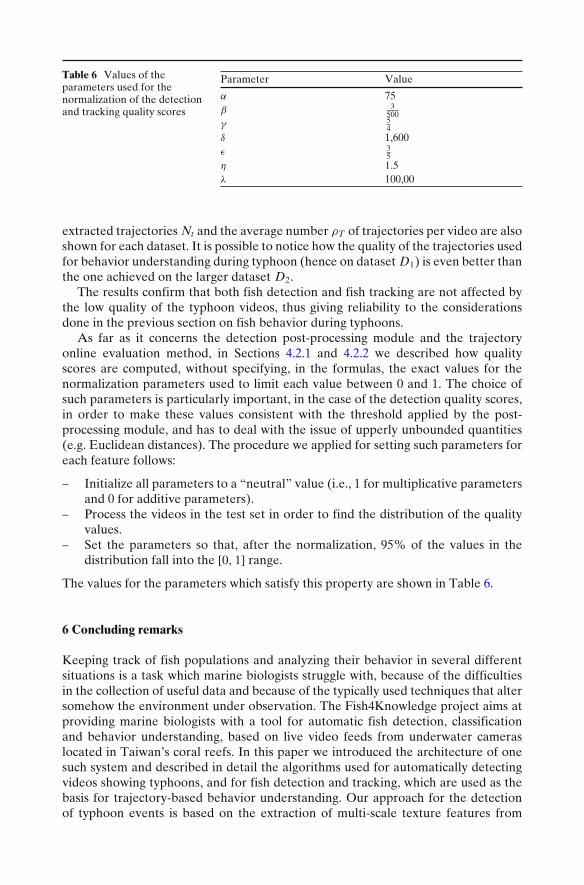
Table 6 Values of theparameters used for thenormalization of the detectionand tracking quality scores
Parameter Value
α 75β 3
500γ 5
4δ 1,600ε 3
5η 1.5λ 100,00
extracted trajectories Nt and the average number ρT of trajectories per video are alsoshown for each dataset. It is possible to notice how the quality of the trajectories usedfor behavior understanding during typhoon (hence on dataset D1) is even better thanthe one achieved on the larger dataset D2.
The results confirm that both fish detection and fish tracking are not affected bythe low quality of the typhoon videos, thus giving reliability to the considerationsdone in the previous section on fish behavior during typhoons.
As far as it concerns the detection post-processing module and the trajectoryonline evaluation method, in Sections 4.2.1 and 4.2.2 we described how qualityscores are computed, without specifying, in the formulas, the exact values for thenormalization parameters used to limit each value between 0 and 1. The choice ofsuch parameters is particularly important, in the case of the detection quality scores,in order to make these values consistent with the threshold applied by the post-processing module, and has to deal with the issue of upperly unbounded quantities(e.g. Euclidean distances). The procedure we applied for setting such parameters foreach feature follows:
– Initialize all parameters to a “neutral” value (i.e., 1 for multiplicative parametersand 0 for additive parameters).
– Process the videos in the test set in order to find the distribution of the qualityvalues.
– Set the parameters so that, after the normalization, 95% of the values in thedistribution fall into the [0, 1] range.
The values for the parameters which satisfy this property are shown in Table 6.
6 Concluding remarks
Keeping track of fish populations and analyzing their behavior in several differentsituations is a task which marine biologists struggle with, because of the difficultiesin the collection of useful data and because of the typically used techniques that altersomehow the environment under observation. The Fish4Knowledge project aims atproviding marine biologists with a tool for automatic fish detection, classificationand behavior understanding, based on live video feeds from underwater cameraslocated in Taiwan’s coral reefs. In this paper we introduced the architecture of onesuch system and described in detail the algorithms used for automatically detectingvideos showing typhoons, and for fish detection and tracking, which are used as thebasis for trajectory-based behavior understanding. Our approach for the detectionof typhoon events is based on the extraction of multi-scale texture features from

the videos, which are then used to train a Support Vector Machine (SVM). We haveshown how the resulting classifier is able to reach a very high accuracy (about 97%) inthe discrimination between typhoon and non-typhoon videos. Based on these results,a trajectory clustering algorithm is used to study the differences in paths followed bythe fish in standard underwater conditions and during typhoons. The comparisonbetween the results obtained at those times gave indications on fish behavior, whichof course have to be validated by marine biologists.
As future work, we are planning to extend the event detection algorithm toany event detection (as we simply did for “storm” events) problem which can beformulated in terms of texture description of videos. Indeed, the combination oftexture features and classifier has been proved to be a reliable means. We arealso aiming at improving both the detection and tracking algorithms (also addingsome preprocessing steps [7]), which represent the foundation on which the entiresystem works, and the trajectories representation in order to better describe the 3Dfish movements. Finally, in future all the achieved typhoon event data and the fishbehavior events will be also mapped into RDF (Resource Description Framework)and published as Linked Open Data in order to provide sufficient detail to allow fullreplication of the experiments described, but also a sufficient level of abstraction tofacilitate linking to existing event data.
In detail, we will allow third party applications to work directly on the raw databy providing a direct, lossless mapping from the relational tables to RDF [4]. Asan example of a direct translation of a database row, one could directly addressthe fish detection table by dereferencing this URI: http://data.fish4knowledge.eu/fk4/direct/fish_detection/fish_id=256993, which would return in the following RDF(using Turtle notation):
@base <http://data.fish4knowledge.eu/fk4/direct>@prefix xsd: <http://www.w3.org/2001/XMLSchema#> .@prefix gml: <http://www.opengis.net/gml> .
# Example row of the fish_detection table:
<fish_detection/fish_id=260794><fish_detection/fish_id> 260794 ;<fish_detection/video_id> <videos/video_id=3568> .<fish_detection/frame_id> 90 .<fish_detection/fish_id=260794><fish_detection/detection_certainty> 0.77146 .<fish_detection/tracking_certainty> 1.0 .<fish_detection/timestamp> "2011-02-01"^^xsd:date .<fish_detection/bounding_box> "19,32 57,59"^^gml:posList .<fish_detection/countour_polygon> "55,34 56,34 61,34 ..."^^gml:posList .
Second, to transform the event data to a higher abstraction we will map thetyphoon event data and the fish behavior events to a number of common RDF eventmodels such as F [50], SEM [67] and LODE [54]. These event-centric representationsshould also simplify aligning our data with other Linked Open Data, such as typhoonevents that are part of DBPedia.
References
1. Albiol A, Silla J, Albiol A, Mossi J, Sanchis L (2009) Automatic video annotation and event de-tection for video surveillance. In: 3rd international conference on crime detection and prevention(ICDP 2009), pp 1–5
2. Ballan L, Bertini M, Bimbo AD, Seidenari L, Serra G (2011) Event detection and recognitionfor semantic annotation of video. Multimed Tools Appl 51:279–302
3. Benson B, Cho J, Goshorn D, Kastne R (2009) Field programmable gate array based fishdetection using Haar classifiers. In: American academy of underwater science
4. Bertails A, Prud’hommeaux E (2011) Interpreting relational databases in the rdf domain. In:Musen MA, Corcho Ó (eds) K-CAP. ACM, pp 129–136
5. Bouaynaya N, Qu W, Schonfeld D (2005) An online motion-based particle filter for headtracking applications. In: Proc of the IEEE intl conf on acoustics, speech and signal processing
6. Brehmer P, Do Chi T, Mouillot D (2006) Amphidromous fish school migration revealed bycombining fixed sonar monitoring (horizontal beaming) with fishing data. J Exp Mar Biol Ecol334:139–150
7. Cannavo F, Nunnari G, Giordano D, Spampinato C (2006) Variational method for image de-noising by distributed genetic algorithms on grid environment. In: Proceedings of the 15th IEEEinternational workshops on enabling technologies: infrastructure for collaborative enterprises.Washington, DC, USA, IEEE Computer Society, pp 227–232
8. Chau DP, Bremond F, Thonnat M (2009) Online evaluation of tracking algorithm performance.In: The 3rd international conference on imaging for crime detection and prevention
9. Cheung S-CS, Kamath C (2005) Robust background subtraction with foreground validation forurban traffic video. EURASIP J Appl Signal Process 2005(1):2330–2340
10. Chou H, Shiau Y, Lo S, Lin S, Lin F, Kuo C, Lai C (2009) A real-time ecological observationvideo streaming system based on grid architecture. In: HPC Asia 2009
11. Cline DE, Edgington DR, Mariette J (2008) An automated visual event detection system forcabled observatory video. In: VISAPP (1), pp 196–199
12. Comaniciu D, Meer P (2002) Mean shift: a robust approach toward feature space analysis. IEEETrans Pattern Anal Mach Intell 24(5):603–619
13. Costa C, De Natale FGB, Granelli F (2004) Quality evaluation and nonuniform compressionof geometrically distorted images using the quadtree distortion map. EURASIP J Appl SignalProcess 2004:1899–1911
14. Dasiopoulou S, Mezaris V, Kompatsiaris I, Papastathis V-K, Strintzis M (2005) Knowledge-assisted semantic video object detection. IEEE Trans Circuits Syst Video Technol 15(10):1210–1224
15. Doermann D, Mihalcik D (2000) Tools and techniques for video performance evaluation. In:Proceedings 15th international conference on pattern recognition, 2000, vol 4, pp 167–170
16. Doucet A, De Freitas N, Gordon N (eds) (2001) Sequential Monte Carlo methods in practice.Springer Verlag
17. Edgington D, Salamy K, Risi M, Sherlock R, Walther D, Koch C (2003) Automated eventdetection in underwater video. In: OCEANS 2003. Proceedings, vol 5, pp 2749–2753
18. Elgammal A, Duraiswami R, Davis LS (2003) Efficient kernel density estimation using the fastgauss transform with applications to color modeling and tracking. IEEE Trans Pattern AnalMach Intell 25:1499–1504
19. Elhabian S, El-Sayed K, Ahmed SH (2008) Moving object detection in spatial domain usingbackground removal techniques—state-of-art. Recent Patents on Computer Science 1(1):32–54
20. Erdem C, Tekalp AM, Sankur B (2001) Metrics for performance evaluation of video objectsegmentation and tracking without ground truth. In: Proceedings of internation conference onimage processing, vol 2, pp 69–72
21. Evans F (2003) Detecting fish in underwater video using the em algorithm. In: Proceedings ofthe 2003 international conference on image processing, ICIP 2003, vol 3, pp III – 1029–32, vol 2
22. Faro A, Giordano D, Spampinato C (2006) Soft-computing agents processing webcam imagesto optimize metropolitan traffic systems. In: Wojciechowski K, Smolka B, Palus H, Kozera R,Skarbek W, Noakes L (eds) Computer vision and graphics. Computational imaging and vision,vol 32. Springer Netherlands, pp 968–974. doi:10.1007/1-4020-4179-9-141
23. Faro A, Giordano D, Spampinato C (2011) Adaptive background modeling integrated withluminosity sensors and occlusion processing for reliable vehicle detection. IEEE Trans IntellTrans Syst 12(4):1398–1412
24. Faro A, Giordano D, Spampinato C (2011) Integrating location tracking, traffic monitoring andsemantics in a layered its architecture. IET Intell Trans Syst 5(3):197–206
25. Forstner W, Moonen B (1999) A metric for covariance matrices. Tech rep, Dept of Geodesy andGeoinformatics, Stuttgart University
26. Gkalelis N, Mezaris V, Kompatsiaris I (2011) High-level event detection in video exploitingdiscriminant concepts. In: 9th international workshop on content-based multimedia indexing,Madrid, Spain (CBMI 2011)
27. Gordon N, Doucet A, Freitas N (1979) An algorithm for tracking multiple targets. IEEE TransAutom Contr 24(6):843–854
28. Hariharakrishnan K, Schonfeld D (2005) Fast object tracking using adaptive block matching.IEEE Trans Multimed 7:853–859
29. Hearst M, Dumais S, Osman E, Platt J, Scholkopf B (1998) Support vector machines. IEEE IntellSyst Appl 13:18–28
30. Iqbal K, Abdul Salam R, Osman A, Zawawi Talib A (2002) Underwater image enhancementusing an integrated colour model. AENG International Journal Of Computer Science 35(1):31–41
31. Junejo IN, Foroosh H (2008) Euclidean path modeling for video surveillance. Image Vis Comput26:512–528 (ACM ID: 1332292)
32. Khan Z, Gu I-H (2010) Joint feature correspondences and appearance similarity for robust visualobject tracking. IEEE Transactions on Information Forensics and Security 5(3):591–606
33. Kuo C (2011) Damage to the reefs of Siangjiao Bay marine protected area of Kenting NationalPark, southern Taiwan during typhoon Morakot. Zoological Studies Environmental Biology ofFishes 50:457–462
34. Larsen R, Olafsdottir H, Ersbll B (2009) Shape and texture based classification of fish species.In: Image analysis. Lecture notes in computer science, vol 5575. Springer Berlin / Heidelberg,pp 745–749
35. Lazarevic-McManus N, Renno J, Jones GA (2006) Performance evaluation in visual surveillanceusing the f-measure. In: Proceedings of the 4th ACM international workshop on video surveil-lance and sensor networks, VSSN ’06. New York, NY, USA, ACM, pp 45–52
36. Li W, Chen S, Wang H (2009) A rule-based sports video event detection method. In: Interna-tional conference on computational intelligence and software engineering, 2009. CiSE, pp 1–4
37. Lowe D (2004) Distinctive image features from scale-invariant key-points. Int J Comput Vis60:91–110
38. Morais EF, Campos MFM, Padua FLC, Carceroni RL (2005) Particle filter-based predictivetracking for robust fish counting. Brazilian Symposium on Computer Graphics and ImageProcessing 1:367–374
39. Nagashima Y, Ishimatsu T (1998) A morphological approach to fish discrimination. In: MVA98,pp xx–yy
40. Nanami A, Nishihira M (2002) The structures and dynamics of fish communities in an Okinawancoral reef: effects of coral-based habitat structures at sites with rocky and sandy sea bottoms.Environ Biol Fish 63:353–372. doi:10.1023/A:1014952932694
41. Nguyen H, Duhamel P, Brouet J, Rouffet D (2004 ) Robust vlc sequence decoding exploitingadditional video stream properties with reduced complexity. In: IEEE international conferenceon multimedia and expo, 2004. ICME ’04., vol 1, pp 375–378
42. Papadopoulos G, Mezaris V, Kompatsiaris I, Strintzis M (2008) Estimation and representationof accumulated motion characteristics for semantic event detection. In: 15th IEEE internationalconference on image processing, 2008. ICIP, pp 41–44
43. Porikli F (2005) Multiplicative background-foreground estimation under uncontrolled illumina-tion using intrinsic images. In: Proc of IEEE motion multi-workshop
44. Porikli F (2006) Achieving real-time object detection and tracking under extreme conditions. JReal-Time Image Process 1(1):33–40
45. Porikli F, Wren C (2005) Change detection by frequency decomposition: wave-back. In: Proc ofworkshop on image analysis for multimedia interactive services
46. Porikli F, Tuzel O, Meer P (2005) Covariance tracking using model update based on lie algebra.In: Proc IEEE conf on computer vision and pattern recognition
47. Reid D (1979) An algorithm for tracking multiple targets. IEEE Trans Autom Control 24(6):843–854
48. Rouse W (2007) Population dynamics of barnacles in the intertidal zone. Marine BiologyResearch Experiment

49. Sankaranarayanan A, Veeraraghavan A, Chellappa R (2008) Object detection, tracking andrecognition for multiple smart cameras. Proc IEEE 96(10):1606–1624
50. Scherp A, Franz T, Saathoff C, Staab S (2009) F–a model of events based on the founda-tional ontology DOLCE+DnS ultralight. In: Proceedings of the fifth international conferenceon knowledge capture KCAP 09. ACM, pp 137–144
51. Scherp A, Jain R, Kankanhalli M, Mezaris V (2010) Modeling, detecting, and processing eventsin multimedia. In: Proceedings of the international conference on Multimedia, MM ’10. ACM,New York, NY, USA, pp 1739–1740
52. Schettini R, Corchs S (2010) Underwater image processing: state of the art of restoration andimage enhancement methods. EURASIP J Adv Signal Process 2010:14:1–14:7
53. Shaish L, Levy G, Katzir G, Rinkevich B (2010) Coral reef restoration (Bolinao, Philippines) inthe face of frequent natural catastrophes. Restor Ecol 18(3):285–299
54. Shaw, R, Troncy, R, and Hardman, L, (2009) LODE: linking open descriptions of events. In:Gómez-Pérez A, Yu Y, Ding Y (eds) ASWC, Lecture notes in computer science, vol 5926,Springer. pp 153–167
55. Sheng H, Li C, Wei Q, Xiong Z (2008) Real-time detection of abnormal vehicle events with multi-feature over highway surveillance video. In: 11th international IEEE conference on intelligenttransportation systems, 2008. ITSC, pp 550–556
56. Shi J, Tomasi C (2008) Good features to track. In: Proc IEEE int conf comp vision and patternrecognition, pp 593–600
57. Sillito RR, Fisher RB (2009) Parametric trajectory representations for behaviour classification.In: BMVC
58. Siong Tew K, Han C-C, Chou W-R, Fang L-S (2002) Habitat and fish fauna structure in asubtropical mountain stream in Taiwan before and after a catastrophic typhoon. Environ BiolFish 65:457–462. doi:10.1023/A:1021111800207
59. Soori U, Arshad M (2009) Underwater crowd flow detection using Lagrangian dynamics. Ind JMar Sci 38:359–364
60. Spampinato C, Chen-Burger Y-H, Nadarajan G, Fisher RB (2008) Detecting, tracking andcounting fish in low quality unconstrained underwater videos. In: VISAPP (2), pp 514–519
61. Spampinato C, Giordano D, Di Salvo R, Chen-Burger Y-HJ, Fisher RB, Nadarajan G (2010)Automatic fish classification for underwater species behavior understanding. In: Proceedings ofthe first ACM international workshop on analysis and retrieval of tracked events and motion inimagery streams, ARTEMIS ’10. ACM, pp 45–50
62. Stauffer C, Grimson WEL (1999) Adaptive background mixture models for real-time tracking.In: Proceedings 1999 IEEE computer society conference on computer vision and pattern recog-nition Cat No PR00149, vol 2, no c, pp 246–252
63. Sugar CA, James GM (2003) Finding the number of clusters in a dataset. J Am Stat Assoc 98:750–763
64. Toyama K, Krumm J, Brumitt B, Meyers B (1999) Wallflower: principles and practice of back-ground maintenance. In: The Proceedings of the seventh IEEE international conference oncomputer vision, 1999, vol 1, pp 255–261
65. Traiperm C, Kittitomkun S (2005) High-performance mpeg-4 multipoint conference unit. In:Proceedings of networks and communication system, pp 189–193
66. Tuzel O, Porikli F, Meer P (2006) Region covariance: a fast descriptor for detection and clas-sification. In: Proc. 9th European conf on computer vision
67. Van Hage WR, Malais V, De Vries GKD, Schreiber G, Van Someren M (2012) Abstracting andreasoning over ship trajectories and Web data with the simple event model (SEM). MultimedTools Appl 57(1):1–23
68. Varcheie P, Sills-Lavoie M, Bilodeau G-A (2010) A multiscale region-based motion detectionand background subtraction algorithm. Sensors 10(2):1041–1061
69. Walther D, Edgington D, Koch C (2004) Automated video analysis for oceanographic research.In: Proc computer vision and pattern recognition, CVPR 2004, pp 544–549
70. Yilmaz A, Javed O, Shah M (2006) Object tracking: a survey. ACM Comput Surv 38(4):1–45
71. Zhou S, Chellappa R, Moghaddam B (2003) Visual tracking and recognition using appearance-based modeling in particle filters. In: Proc intl conf on multimedia and expo
72. Zhou J, Clark C (2006) Autonomous fish tracking by rov using monocular camera. In: The 3rdCanadian conference on computer and robot vision, 2006. p 68

Concetto Spampinato received the Laurea in Computer Engineering in 2004, grade 110/110 cumlaude, and the Ph.D. in 2008 from the University of Catania, where he is currently ResearchAssistant. His research interests include image and video analysis, content-based and semantic imageand video retrieval, event detection in multimedia, medical image analysis, object detection andtracking in real-life environment. He has co-authored over 70 publications in international refereedjournals and conference proceedings and he is member of IEEE and IAPR. He has also served inmany international conference organization and technical program committee.
Simone Palazzo received the Laurea degree in Computer Engineering in 2010, grade 110/110 cumlaude from the University of Catania, where he is currently doing his Ph.D. His interest activitiesinclude image and signal processing, image enhancement and reconstruction.

Bastian Boom received his bachelor engineer degree in Computer Science in 2002 from theHogeschool van Amsterdam (www.hva.nl), The Netherlands. During this period he did two intern-ships at fox-it. During the first internship he studied PGP (Pretty Good Privacy) and PKCS#11(Smart card standard) and combined these two protocols in a C++ implementation (proof ofconcept) which was able to save the private key of PGP on a smartcard. During the second internshipseveral strategies for Anomaly Detection on HTTP traffic were studied and he implemented a proveof concept of several methods for Anomaly Detection in Snort (Intrusion Detection Sofware). In2005 he received the Master degree from the Vrije Universiteit (Free University) Amsterdam inComputer Science on a thesis entitled “Fast Object Detection”. This thesis was the result of a succes-full internship at Prime Vision, where he did research at methods for fast detection (localisation) oflicense plates, faces and addresses in images. He has received this PhD at the University of Twente, inthe fields of biometrics. His research topics are face detection, face registration and face recognitionin video surveillance environments. He is at the moment working on the fish4knowledge project, atthe University of Edinburgh. His research topic is fish recognition and clustering in large-scale videodatabases.
Jacco van Ossenbruggen is a senior researcher with the Interactive Information Access group atthe Centrum voor Wiskunde en Informatica (CWI) in Amsterdam, and affiliated as an assistantprofessor with the Web & media research group at VU University in Amsterdam. His researchinterests include semantic Web interfaces for cultural heritage and other linked open data (workingwith Riste Gligorov, Alia Amin and Michiel Hildebrand on interfaces such as /facet) and Web-baseddata integration (working with Anna Tordai on alignment of SKOS vocabularies). Jacco is currentlyactive in the Agora and PrestoPrime projects and the EuropeanaConnect Best Practice Network.Jacco obtained a PhD in computer science from VU University Amsterdam in 2001.

Isaak Kavasidis received the Laurea degree in Computer Engineering in 2009 from the Universityof Catania, where he is currently doing his Ph.D. His interest activities include semantic Web, RDFand semantic image processing.
Roberto Di Salvo received the Laurea degree in Computer Engineering in 2008, grade 110/110 cumlaude from the University of Catania, where he is currently doing his Ph.D. His interest activitiesinclude mainly object detection and tracking in real-life scenarios.

Fang-Pang Lin is the Grid Application Division Manager in National Center for High PerformanceComputing (NCHC). He is one of key developers for developing a national cyber-infrastructure,namely Knowledge Innovation National Grid (KING). He initiated the Ecogrid project withinPRAGMA as well as within KING to overarch international collaboration and extended develop-ment of KING for the year of 2003. His recent major efforts include Grid-based Lake Metabolismresearch and Telescience in PRAGMA, World Wide Metacomputing with HLRS, Germany andworkflow model with AIAI, Edinburgh University, UK. He has been working on unstructured gridmethods for Computational Fluid Dynamics (CFD) for more than a decade. His interests includemultigrid methods, unstructured grid mesh generation, optimal design, multi-disciplinary numericalsimulation and scientific visualization. His interest has been extended to advanced visualization,parallel and distributed computing and grid computing in recent years. Fang-Pang Lin obtainedhis PhD in University of Wales at Swansea, UK. He worked in Rolls-Royce University ComputingCenter in Oxford University as a research scientist after one-year postdoctoral research in Swansea.He joined NCHC in Oct., 1997 and has been working in numerical simulation and softwareengineering regarding application integration. He was the winner of 2006 Outstanding AchievementAward in Science and Technology, the Executive Yuan of Taiwan.
Daniela Giordano received the Laurea degree in Electronic Engineering, grade 110/110 cum laude,from the University of Catania, Italy, in 1990. She also holds the Ph.D. degree in Educational Tech-nology from Concordia University, Montreal (1998). She is Associate Professor of InformationSystems at the Engineering Faculty of the University of Catania since 2001. Daniela Giordano’sresearch has been published in international refereed journals and conference proceedings and hasdealt with topics such as: advanced learning technology, knowledge discovery, image processing, andinformation technology in medicine. Her current research interests include: cognitive systems, multi-modal interaction and semantic technologies. She is a member of the IEEE and of the ACM.

Lynda Hardman is head of the Information Systems research cluster and a member of the InteractiveInformation Access research group at the Centrum Wiskunde & Informatica (CWI) in Amsterdam,The Netherlands. Her current research includes creating linked-data driven, user-centric applicationsfor exploring media content and investigating user-centric interaction design in the context ofdeveloping technologies.
Robert B. Fisher has been an academic in the School of Informatics (originally in the formerDepartment of Artificial Intelligence) at University of Edinburgh since 1984 and a full Professorsince 2003. He received his PhD from University of Edinburgh (1987), investigating computer visionin the former Department of Artificial Intelligence. His previous degrees are a BS with honors(Mathematics) from California Institute of Technology (1974) and a MS (Computer Science) fromStanford University (1978). He worked as a software engineer for 5 years before returning to studyfor his PhD.