understanding & designing dedicated outdoor air ... - ashrae - wi - doas... · 4 reasons vav...
TRANSCRIPT

1
Stanley A. Mumma, Ph.D., P.E.Prof. Emeritus, Architectural EngineeringPenn State University, Univ. Park, PA
[email protected]: http://doas-radiant.psu.edu
Understanding & Designing Dedicated Outdoor Air
Systems (DOAS)
ASHRAE CRCMilwaukee: May 14, 2010
2
Presentation Outline & Learning Objectives
Quick review of current leading building HVAC system issues.Define DOAS.Explain terminal equipment choices and issues.Describe DOAS equipment choices and Psychrometrics.Provide a DOAS design example. 30% surplus OA, why and does it use more energy? Explain relevance of DOE and ASHRAE Research findings.Describe field applications.Conclusions.
3
Current HVAC System of Choice: VAV
Std. VAV AHU
VAV
OA
Space 1,VAV w/ single air
delivery path

4
Reasons VAV has been system of choiceEliminates bucking: a characteristic of predecessor systems such as dual duct, multi-zone, and terminal RH.At off-design conditions, the majority of the time, fan power is reduced; i.e. at 50% flow, fan power is 0.53—or 12.5%. Huge improvement over previous systems.Single duct, and easy to design for tenant fit out.Often thought to be simple to control—but that is not a fact—especially with ventilation needs, SAT reset, economizer, and building pressurization.
5
Inherent Problemswith VAV Systems
Poor air distributionPoor humidity controlPoor acoustical propertiesPoor use of plenum and mechanical shaft spaceSerious control problems, particularly with tracking return fan systemsPoor energy transport medium: airPoor resistance to the threat of biological and chemical terrorismPoor and unpredictable ventilation performance
6
OAreq’d=900 cfm
based on table 6-1
Z1=900/1,500
Z1=0.6
OAreq’d=1,350 cfm
Z2=0.3
AHU6,000 cfm
% OAB=?
1,500 cfm 4,500 cfm
Poor & Unpredictable Vent’n Performance

7
OAreq’d=900 cfm
based on table 6-1
Z1=900/1,500
Z1=0.6
OAreq’d=1,350 cfm
Z2=0.3
AHU6,000 cfm
% OAB=?
OAB=3,600 cfm
1,500 cfm 4,500 cfm
60
Poor & Unpredictable Vent’n Performance
8
OAreq’d=900 cfm
based on table 6-1
Z1=900/1,500
Z1=0.6
OAreq’d=1,350 cfm
Z2=0.3
AHU6,000 cfm
% OAB=?
OAB=3,600 cfm
1,500 cfm 4,500 cfm
Over vent=?1,350 cfm, Unvit
60
Poor & Unpredictable Vent’n Performance
9
OAreq’d=900 cfm
based on table 6-1
Z1=900/1,500
Z1=0.6
OAreq’d=1,350 cfm
Z2=0.3
AHU6,000 cfm
% OAB=?
OAB=3,600 cfm
1,500 cfm 4,500 cfm
Over vent=?1,350 cfm, Unvit
OA=?
OA=2,250? (900+1,350) No! OA=3,600? No! Why not?
60
Poor & Unpredictable Vent’n Performance

10
OAreq’d=900 cfm
based on table 6-1
Z1=900/1,500
Z1=0.6
OAreq’d=1,350 cfm
Z2=0.3
AHU6,000 cfm
% OAB=?
OAB=3,600 cfm
1,500 cfm 4,500 cfm
Over vent=?1,350 cfm, Unvit
Unvit ratio = 0.2251,350/6,000
OA=? 60
Eq. for OA?
Poor & Unpredictable Vent’n Performance
11
OAreq’d=900 cfm
based on table 6-1
Z1=900/1,500
Z1=0.6
OAreq’d=1,350 cfm
Z2=0.3
AHU6,000 cfm
% OAB=?
OAB=3,600 cfm
1,500 cfm 4,500 cfm
Over vent=?1,350 cfm, Unvit
Unvit ratio = 0.2251,350/6,000
OA=?
OA+(6,000-OA)*0.225=3,600OA=2,903, ~30% more, but no
LEED point
2,903-(900+1,350)=653more than table 6-1 value
Where does the 653 cfm go?
60
Eq. for OA?
Poor & Unpredictable Vent’n Performance
12
Can VAV Limitations be Overcome?
OAreq’d=900 cfm
Z1=1
OAreq’d=1,350 cfm
Z2=1
AHU2,250 cfm
% OAB =100
900 cfm 1,350 cfm
OA=2,250

13
Can VAV Limitations be Overcome?
OAreq’d=900 cfm
Z1=1
OAreq’d=1,350 cfm
Z2=1
AHU2,250 cfm
% OAB =100
900 cfm 1,350 cfm
OA=2,250
How is the space load handled,
when 6,000 cfm required
for say a VAV?
14
Can VAV Limitations be Overcome?
OAreq’d=900 cfm
Z1=1
OAreq’d=1,350 cfm
Z2=1
AHU2,250 cfm
% OAB =100
900 cfm 1,350 cfm
OA=2,250
How is the space load handled,
when 6,000 cfm required
for say a VAV?
15
Can VAV Limitations be Overcome?
OAreq’d=900 cfm
Z1=1
OAreq’d=1,350 cfm
Z2=1
AHU2,250 cfm
% OAB =100
900 cfm 1,350 cfm
OA=2,250
How is the space load handled,
when 6,000 cfm required
for say a VAV?

16
Can VAV Limitations be Overcome?
OAreq’d=900 cfm
Z1=1
OAreq’d=1,350 cfm
Z2=1
AHU2,250 cfm
% OAB =100
900 cfm 1,350 cfm
OA=2,250
How is the space load handled,
when 6,000 cfm required
for say a VAV?
17
DOAS Defined for This Presentation
20%-70% less OA,than VAV DOAS Unit
w/ Energy Recovery
Cool/Dry Supply
Parallel Sensible
Cooling System
High Induction Diffuser
Building with Sensible
and Latent Cooling
Decoupled
18
Key DOAS Points1. 100% OA delivered to each zone via its
own ductwork2. Flow rate generally as spec. by Std. 62.1-
2007 or greater (LEED, Latent. Ctl)3. Employ TER, per Std. 90.1-20074. Generally CV5. Use to decouple space S/L loads—Dry6. Rarely supply at a neutral temperature7. Use HID, particularly where parallel
system does not use air

19
TotalEnergy
Recovery (TER)Wheel
20
High Induction Diffuser
Provides complete air mixingEvens temperature gradients in the spaceEliminates short-circuiting between supply & returnIncreases ventilation effectiveness
21
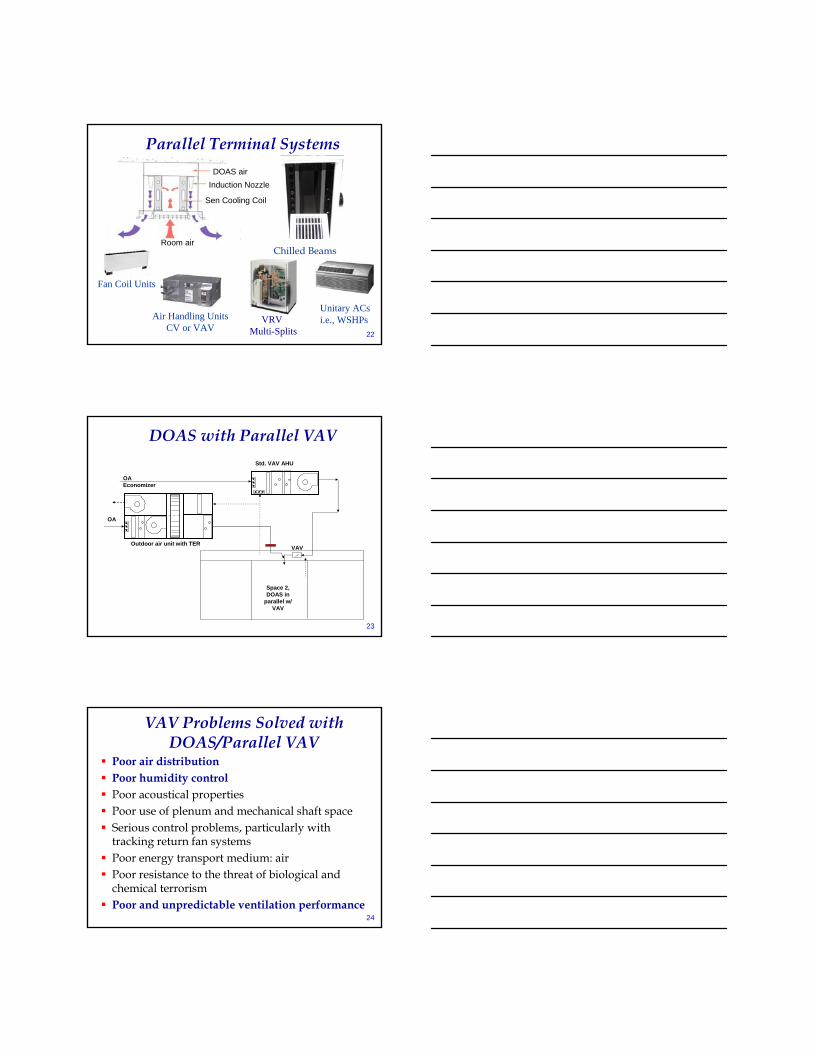
Fan Coil UnitsFan Coil Units
Air Handling UnitsCV or VAV
Air Handling UnitsCV or VAV
Unitary ACsi.e., WSHPsUnitary ACsi.e., WSHPs
Parallel Terminal Systems
Radiant Cooling PanelsRadiant Cooling Panels
Chilled Beams
VRV Multi-Splits
VRV Multi-Splits
22
Fan Coil UnitsFan Coil Units
Air Handling UnitsCV or VAV
Air Handling UnitsCV or VAV
Unitary ACsi.e., WSHPsUnitary ACsi.e., WSHPs
Parallel Terminal Systems
Radiant Cooling PanelsRadiant Cooling Panels
Chilled Beams
DOAS airInduction Nozzle
Sen Cooling Coil
Room air
VRV Multi-Splits
VRV Multi-Splits
23
Std. VAV AHU
OA Economizer
OA
Outdoor air unit with TER
Space 2, DOAS in
parallel w/ VAV
VAV
DOAS with Parallel VAV
24
Poor air distributionPoor humidity controlPoor acoustical propertiesPoor use of plenum and mechanical shaft spaceSerious control problems, particularly with tracking return fan systemsPoor energy transport medium: airPoor resistance to the threat of biological and chemical terrorismPoor and unpredictable ventilation performance
VAV Problems Solved with DOAS/Parallel VAV

25
Outdoor air unit with TER
OA
FCU
Space 3, DOAS in
parallel w/ FCU
DOAS with Parallel FCU
26
Parallel vs. Series OA Introduced for DOAS-FCU Applications?
Parallel, Good Series, Bad
27
Advantages of the Correct Paradigm Parallel FCU-DOAS Arrangement
At low sensible cooling load conditions, the terminal equipment may be shut off—saving fan energyThe terminal device fans may be downsized because they are not handling any of the ventilation air, reducing first costThe smaller terminal fans result in fan energy savingsThe cooling coils in the terminal FCU’s are not deratedbecause they are handling only warm return air, resulting in smaller coils and further reducing first cost.Opportunity for plenum condensation is reduced because the ventilation air is not introduced into the plenum near the terminal equipment, for better IAQ

28
Poor air distributionPoor humidity controlPoor acoustical propertiesPoor use of plenum and mechanical shaft spaceSerious control problems, particularly with tracking return fan systemsPoor energy transport medium: airPoor resistance to the threat of biological and chemical terrorismPoor and unpredictable ventilation performance
VAV Problems Solved with DOAS/Parallel FCU
29
Outdoor air unit with TER
OA
Space 3, DOAS in
parallel w/ CRCP
Radiant Panel
DOAS with Parallel Radiant, or Chilled Beam
30
Poor air distributionPoor humidity controlPoor acoustical propertiesPoor use of plenum and mechanical shaft spaceSerious control problems, particularly with tracking return fan systemsPoor energy transport medium: airPoor resistance to the threat of biological and chemical terrorismPoor and unpredictable ventilation performance
VAV Problems Solved with DOAS/Radiant-Chilled Beam

31
Additional Benefits of DOAS/Radiant-Chilled Beam
Beside solving problems that have gone unsolved for nearly 35 years with conventional VAV systems, note the following benefits:Greater than 50% reduction in mechanical system operating cost compared to VAVEqual or lower first costSimpler controlsGenerates up to 80% of points needed for basic LEED certification
32
Role of Total Energy Recovery
33
DOAS & Energy RecoveryASHRAE Standard 90.1-2007 in section 6.5.6.1
Exhaust Air Energy Recovery requires the following:
“Individual fan systems that have both a design supply air capacity of 5000 cfm or greater and have a minimum outside air supply of 70% or greater of the design supply air quantity shall have an energy recovery system with at least 50% total energy recovery effectiveness.”
Std 62.1-2007 allows its use with class 1-3 air.

34
DOAS & Energy RecoveryASHRAE Standard 90.1-2007 in section 6.5.6.1
Exhaust Air Energy Recovery requires the following:
“Individual fan systems that have both a design supply air capacity of 5000 cfm or greater and have a minimum outside air supply of 70% or greater of the design supply air quantity shall have an energy recovery system with at least 50% total energy recovery effectiveness.”
Std 62.1-2007 allows its use with class 1-3 air.
ASHRAE’s new Standard for the Design
Of High Performance Green Buildings
(189.1) tightens the requirements
(increased the minimum effectiveness to
60% and requires TER for even the
smallest systems in the moist USA--
located primarily east of the continental
divide)
35
DOAS & Energy RecoveryASHRAE Standard 90.1-2007 in section 6.5.6.1
Exhaust Air Energy Recovery requires the following:
“Individual fan systems that have both a design supply air capacity of 5000 cfm or greater and have a minimum outside air supply of 70% or greater of the design supply air quantity shall have an energy recovery system with at least 50% total energy recovery effectiveness.”
Std 62.1-2007 allows its use with class 1-3 air.
ASHRAE’s new Standard for the Design
Of High Performance Green Buildings
(189.1) tightens the requirements
(increased the minimum effectiveness to
60% and requires TER for even the
smallest systems in the moist USA--
located primarily east of the continental
divide) Climate Zone 60% TER Req’d Std. 189.1-2009 Design Air flow when >80% OA1A, 2A, 3A, 4A, 5A, 6A, 7, 8 (Moist E. US + Alaska) > 0 cfm (all sizes require TER) 6B > 1,500 cfm1B, 2B, 5C > 4,000 cfm3B, 3C, 4B, 4C, 5B > 5,000 cfm
36
Merits of Using a TER(Enthalpy Wheel) with DOAS
A significant reduction in the design OA cooling load, reducing both the chiller size & the peak demandA reduction in the annual OA cooling and dehumidify energy consumption A significant reduction in the OA heating and humidification energy consumption (in the N)Conforms to ASHRAE Standard 90.1-2007A major reduction in the variability of the OA conditions entering the CC (critical w/ pkg. equip.)

37
Atlanta Data, 12 hr/day-6 day/wk
0102030
405060
7080
90100110
120130140150
160
0 5 10 15 20 25 30 35 40 45 50 55 60 65 70 75 80 85 90 95 100
DBT, F
W, g
rain
s/lb
Δh=26.0 Btu/lb
Δh=3.5 Btu/lb
h=27.6 Btu/lb
h=17.1 Btu/lb
h=43.1 Btu/lb
Conditions after the TER equipment & entering the CC
h=31.1 Btu/lb
38
Implications of the Small Area on the Psychrometric
Chart Entering the CCVariation in the OA load on the CC ranges by only 25% (from a low of 75% to a max of 100%)At peak design load conditions, the enthalpy wheel reduces the OA load on the chiller by 70-80%. Often 40-50% of the total design load on the chiller.
39
DOAS Equipment on the Market TodayI: Equipment that adds sensible energy
recovery or hot gas for central reheatII: Equipment that uses total energy
recoveryIII: Equipment that uses total energy
recovery and passive dehumidification wheels
IV: Equipment that uses active dehumidification wheels, generally without energy recovery

40
DOAS Equipment on the Market Today
4850 gr
41DRY BULB TEMPERATURE (F)
80
40
40
60
Wet Bulb
(F)
50
50
60
70
70
40%
80 90 100 120
20%
80% 60%
90
.004
.016
.012
.008
HUMIDITY RATIO
(Lbv/Lba).028
.024
.020
28
140
168
196
112
84
56
Hum
idity
ratio
(gra
ins/
lb)
OA
EW
RA1 2 3 4
5
PH CC
Space
2
45
Hot & humid OA condition
42DRY BULB TEMPERATURE (F)
80
40
40
60
Wet Bulb
(F)
50
50
60
70
70
40%
80 90 100 120
20%
80% 60%
90
.004
.016
.012
.008
HUMIDITY RATIO
(Lbv/Lba)
.028
.024
.020
28
140
168
196
112
84
56
Hum
idity
ratio
(gra
ins/
lb)
OA
EW
RA1 2 3 4
5
PH CC
Space
2
3
45
Hot & humid OA condition

43DRY BULB TEMPERATURE (F)
80
40
40
60
Wet Bulb
(F)
50
50
60
70
70
40%
80 90 100 120
20%80
% 60%
90
.004
.016
.012
.008
HUMIDITY RATIO
(Lbv/Lba)
.028
.024
.020
28
140
168
196
112
84
56
Hum
idity
ratio
(gra
ins/
lb)
OA
EW
RA1 2 3 4
5
PH CC
Space
2
3
45
Hot & humid OA condition
44
6
1 2 3 4 5
7
DOAS Equipment on the Market Today
45DRY BULB TEMPERATURE (F)
80
40
40
60
Wet Bulb
(F)
50
50
60
70
70
40%
80 90 100 120
20%
80% 60%
90
.004
.016
.012
.008
HUMIDITY RATIO
(Lbv/Lba)
.028
.024
.020
28
140
168
196
112
84
56
Hum
idity
ratio
(gra
ins/
lb)
1
2
46
3
5
Hot & humid OA condition

46
DOAS Equipment on the Market TodayType 3
47
DOAS Equipment on the Market TodayType 3Desiccant added for 3 reasons:
1. 45°F CHWS still works2. Achieve DPT < freezing3. Reduce or eliminate reheat
48
Process on the Psych Chart
30405060708090
100110120130140150
34 36 38 40 42 44 46 48 50 52 54 56 58 60 62 64 66 68 70 72 74 76 78 80 82 84 86
DBT, F
W, g
r/lbm
2
1
4
5
6
721
3
4
567
3
Enthalpy 4 > 3 DOAS needs

49
DOAS Equipment on the Market TodayType 3
Desiccant wheel
EW
EW effec. Control’d,w/ bypass damper
RA when unoccupied, EA when occupied
84 F DBT148 gr/lb
7558
7891
7498
7698
5443
44 DPT
Heater7891
5051
82129
50
51
Process on the psych chart
30
40
50
60
70
8090
100
110
120
130
140
150
34 36 38 40 42 44 46 48 50 52 54 56 58 60 62 64 66 68 70 72 74 76 78 80 82 84
DBT, F
W, g
r/lbm
2
1
3 4
56
7
8
2 13
4 5 6 7 8

52
Type III Desiccant Wheel
Heating
53
Description CC Load, T
SA DBT, F
Lost Sen. Cooling ref CC alone, T
Total Cooling Input, T Ranking
CC alone 9.7 44 0.0 9.7 6
CC w/ HGRH 9.7 70 2.3 12.0 8
EW + CC 5.2 44 0.0 5.2 1
EW+PCC+CC+RHC 3.7 61.4 1.6 5.3 1
EW+CC+SW 4 68 2.2 6.2 5PDHC+CC 9.0 53.1 0.8 9.8 7
EW+CC+PDHC 4 63.3 1.7 5.7 1
EW+PDHC+CC 5.2 53 0.8 6.0 4
CC+ADesW 6.8 88.5 4 10.8 9
DOAS Equipment Summary:Conditioning 1,000 scfm of 85°F 148 Gr OA
54
Top DOAS Configuration Choices

55
A Few Additional Comments Regarding DOAS Equipment
TER Effectiveness is an important factorTER desiccant an important choiceTER purge, pro and con
56
A Few Additional Comments Regarding DOAS Equipment
TER Effectiveness is an important factorTER desiccant an important choiceTER purge, pro and conFan energy use management
57
A Few Additional Comments Regarding DOAS Equipment
TER Effectiveness is an important factorTER desiccant an important choiceTER purge, pro and conFan energy use managementReserve capacity must be considered: many benefits

58
A Few Additional Comments Regarding DOAS Equipment
TER Effectiveness is an important factorTER desiccant an important choiceTER purge, pro and conFan energy use managementReserve capacity must be considered: many benefitsImportance of building pressurization, and the impact on TER effectiveness when unbalanced flow existsSmaller DOAS with a pressurization unit
59
60

61
62
Unbalance @ TER if pressurization is ½ ACH, based upon Std. 62.1
63
hOA hSAmOA
hRAhEA
mRA
For unbalanced flow, mOA= mRA + mPressurization
ε = mOA(hOA-hSA)/mRA(hOA-hRA) = (hEA-hRA)/(hOA-hRA)
εapparent = ε∗mRA/mOA = (hOA-hSA)/ (hOA-hRA)
Supply air
Wheel Rotation
Return air, including toilet exhaust
Outdoor air
0 scfm Purgeor seal leakage
Exhaust air

64
Qlatent=0.68*scfm*Δw (grains)
Selecting the Supply Air DPT
65
Qlatent=0.68*scfm*Δw (grains)
If all latent load from people @ 205 Btu/person, then,Δw=15 gr/lb with 20 scfm/person, requires 48°F DPT if space 75°F 50% RH
Selecting the Supply Air DPT
66
Qlatent=0.68*scfm*Δw (grains)
If all latent load from people @ 205 Btu/person, then,Δw=15 gr/lb with 20 scfm/person, requires 48°F DPT if space 75°F 50% RHor Δw=10 gr/lb with 30 scfm/person, requires 51°F DPT if space 75°F 50% RH
Selecting the Supply Air DPT

67DRY BULB TEMPERATURE (F)
80
40
40
60
Wet Bulb
(F)
50
50
60
70
70
40%
80 90 100 120
20%80
% 60%
90
.004
.016
.012
.008
HUMIDITY RATIO
(Lbv/Lba)
.028
.024
.020
OA
EW
RA1 2 3 4
5
PH CC
Space
Δw=15 grains, with 20 cfm/person
4, 48F DPT, 50 grains
5, 75F, 50%
28
140
168
196
112
84
56
Hum
idity
ratio
(gra
ins/
lb)
68
Example Design Calculation for DOAS w/ VAV Comparison
• 70,000 ft2 3-story office building• 350 occupants, 245 Btu/h sen, 205 Btu/h lat.• Uncorrected Ventilation: 350*5+70,000*0.06=5,950 scfm• Other lat load: 20 Btu/h-person• Internal generation, lights & equip: 4W/ft2 or 80 tons• Design Envelope load: 15 tons sens.• Design Space: 75°F for VAV, 78°F DBT, 40% RH DOAS• SA, VAV, 55°F and Sat, DOAS 44°F and Sat.• OA conditions, St. Petersburg, 94°F DBT, 80°F WBT• Max Zp=0.55• DOAS energy recovery, single EW eff=0.85• Radiant Panel avg heat flux, 34 Btu/h-ft2
Building Data:
69
VAV Design Calculation Summary
Qs=102 tonQL=6.6 ton
75F DBT, 51.3% RHw=66.67 gr/lbmDAh=28.44 Btu/lbmDA
9,916 scfm
OA load, 55.6 Ton
QCC=164 Ton
56,748 scfm55F, SAT

70
DOAS Design Calculation Summary
Qs=102 tonQL=6.6 ton
78°F DBT, 40% RH51.75°F DPT
w=57.29 gr/lbmDAh=27.7 Btu/lbmDA
7,921 scfm
OA load, 7 Ton w/
HR
QCC=38 Ton
7,921 scfm44°F, SAT
DOAS Qs, 24.4 ton
Panel, 78 Ton, 27,480 ft2, 39% ceiling
Chiller, 116 ton
71
VAV vs. DOAS/Radiant Comparison
VAV DOAS/Radiant
OA, scfm 9,916 7,921
OAload, Tons 55.6 7
CCload, Tons 164 38, (7 OA, 31 Internal)
Terminal load, Tons 0 78, rad. panels
Total Chiller load, tons 164 116 (70%)
72
Leadership in Energy and Environmental Design

73
IE Q Prerequisite 1: Minimum Indoor Air Quality Performance Required
IntentTo establish minimum indoor air quality (IAQ) performance to enhance indoor air quality in buildings, thus contributing to the comfort and well-being of the occupants.
RequirementsCASE 1. Mechanically Ventilated SpacesMeet the minimum requirements of Sections 4 through 7 of ASHRAE Standard 62.1-2007, Ventilation for Acceptable Indoor Air Quality (with errata but without addenda1). Mechanical ventilation systems must be designed using the ventilation rate procedure or the applicable local code, whichever is more stringent.
74
IE Q Credit 2: Increased Ventilation: 1 PointIntentTo provide additional outdoor air ventilation to improve indoor air quality (IAQ) and promote occupant comfort, well-being and productivity.
RequirementsCASE 1. Mechanically Ventilated SpacesIncrease breathing zone outdoor air ventilation rates to occupied spaces by at least 30% above the minimumrates required by ASHRAE Standard 62.1-2007 (with errata but without addenda1) as determined by IEQPrerequisite 1: Minimum Indoor Air Quality Performance.
Wellbeing: the state of being happy, healthy, or prosperous
75
IE Q Credit 2: Increased Ventilation: 1 PointIntentTo provide additional outdoor air ventilation to improve indoor air quality (IAQ) and promote occupant comfort, well-being and productivity.
RequirementsCASE 1. Mechanically Ventilated SpacesIncrease breathing zone outdoor air ventilation rates to occupied spaces by at least 30% above the minimumrates required by ASHRAE Standard 62.1-2007 (with errata but without addenda1) as determined by IEQPrerequisite 1: Minimum Indoor Air Quality Performance.
Wellbeing: the state of being happy, healthy, or prosperous
Sustainable site 26 24%
H2O η 10 9%
Energy & Atmos. 35 32%
Mat’ls & Resource 14 13%
IEQ 15 14%
Innovation 6 5%
Regional Priority 4 4
Max points 110
GoldGold: 60-79 points

76
IE Q Credit 2: Increased Ventilation: 1 PointIntentTo provide additional outdoor air ventilation to improve indoor air quality (IAQ) and promote occupant comfort, well-being and productivity.
RequirementsCASE 1. Mechanically Ventilated SpacesIncrease breathing zone outdoor air ventilation rates to occupied spaces by at least 30% above the minimumrates required by ASHRAE Standard 62.1-2007 (with errata but without addenda1) as determined by IEQPrerequisite 1: Minimum Indoor Air Quality Performance.
Wellbeing: the state of being happy, healthy, or prosperous
Sustainable site 26 24%
H2O η 10 9%
Energy & Atmos. 35 32%
Mat’ls & Resource 14 13%
IEQ 15 14%
Innovation 6 5%
Regional Priority 4 4
Max points 110
GoldGold: 60-79 points
Is this a good reason for
30% surplus ventilation air?
77
30% Surplus Air Questioned!
78
Calculating the OA Load:
75F
50% RH
75F
50% RH
hSA
900 cfm 1,350 cfm
hOA
hRelief
mOA mSA= mOA
AHU

79
Calculating the OA Load:
75F
50% RH
75F
50% RH
hSA
900 cfm 1,350 cfm
hOA
1: QOA1=mOA*(hOA-hSA)
hRelief
mOA mSA= mOA
AHU
80
Calculating the OA Load:
75F
50% RH
75F
50% RH
hSA
900 cfm 1,350 cfm
hOA
2: QOA2=mOA*(hOA -hrelief)
hRelief
mOA mSA= mOA
AHU
81
Calculating the OA Load:
75F 75F
50% RH
hSA
900 cfm 1,350 cfm
hOA
QBldg=mSA*(hrelief-hSA)=QOA1-QOA2
hRelief
mOA mSA= mOA
AHU

82
Calculating the OA Load:
75F 75F
50% RH
hSA
900 cfm 1,350 cfm
hOA
1: QOA1=mOA*(hOA-hSA) = coil load
2: QOA2=mOA*(hOA -hrelief) = OA load
QBldg=mSA*(hrelief-hSA)=QOA1-QOA2
So, QOA2 is correct: QOA1=QOA2+QBldg= coil load
hRelief
mOA mSA= mOA
AHU
83
Calculating the OA Load:
75F 75F
50% RH
hSA
900 cfm 1,350 cfm
hOA
1: QOA1=mOA*(hOA-hSA) = coil load
2: QOA2=mOA*(hOA -hrelief) = OA load
QBldg=mSA*(hrelief-hSA)=QOA1-QOA2
So, QOA2 is correct: QOA1=QOA2+QBldg= coil load
hRelief
mOA mSA= mOA
AHU
Very important to get correct!
84
ASHRAE HQ, Atlanta, GA

85
ASHRAE HQ, Atlanta, GA
86
Limits of LEED AuthorityDo you believe there is a rational basis for granting a LEED point when the ventilation air flow rate is increased beyond 62.1? Many do not. Can LEED be ignored? Yes, in the sense that the LEED rating systems are not formal standards in and of themselves. Rather they are criteria established by leaders in the industry on what constitutes good practices to protect the environment and enhance the wellbeing of those impacted by development. Conclusion: There is no mandate in LEED, or the law, to garner this point, and many may in fact choose to garner a LEED point by the much simpler installation of a bicycle rack.
87
Limits of LEED AuthorityDo you believe there is a rational basis for granting a LEED point when the ventilation air flow rate is increased beyond 62.1? Many do not. Can LEED be ignored? Yes, in the sense that the LEED rating systems are not formal standards in and of themselves. Rather they are criteria established by leaders in the industry on what constitutes good practices to protect the environmental and enhance wellbeing of those impacted by development. Conclusion: there is no mandate in LEED, or the law, to garner this point, and many may in fact choose to garner a LEED point by the much simpler installation of a bicycle rack.

88
Limits of LEED AuthorityDo you believe there is a rational basis for granting a LEED point when the ventilation air flow rate is increased beyond 62.1? Many do not. Can LEED be ignored? Yes, in the sense that the LEED rating systems are not formal standards in and of themselves. Rather they are criteria established by leaders in the industry on what constitutes good practices to protect the environmental and enhance wellbeing of those impacted by development. Conclusion: there is no mandate in LEED, or the law, to garner this point, and many may in fact choose to garner a LEED point by the much simpler installation of a bicycle rack.
89
Why question 30% surplus OA?1st consider a Standard VAV System
Std. VAV AHU
VAV
OA
Space 1,VAV w/ single air
delivery path
RH Allowed by std 90.1?
90
Why question 30% surplus OA?1st consider a Standard VAV System
Std. VAV AHU
VAV
OA
Space 1,VAV w/ single air
delivery path
RH Allowed by std 90.1?

91
Why question 30% surplus OA?1st consider a Standard VAV System
Std. VAV AHU
VAV
OA
Space 1,VAV w/ single air
delivery path
• CC• HC• Fan• Economizer• IEQ• AHU 1st cost• Chiller 1st cost• Boiler 1st cost• Elec. Serv to bldg 1st cost• Conclusion? Energy/Env
RH Allowed by std 90.1?
92
Why question 30% surplus OA?Consider DOAS.
CCHCFanEconomizerIEQAHU 1st costChiller 1st costBoiler 1st costElec. Serv to bldg 1st costConclusion? (1st, op, LCC, env)
OA
EW
RA1 2 3 4
5
PH CC
Space
93
How does the 62.1 flow impact DOAS design—w/ space latent load decoupled?
Occ.Category cfm/p SA DPT
0F 1.3*cfm/p SA DPT 0F
A Conf. rm 6.2 24.84 8.06 34.75
B Lec. cl 8.42 35.9 10.96 41.63
C Elem. cl 11.71 42.75 15.23 46.08
D Office 17 47.18 22.1 49.2
E Museum 9 31.05 11.7 38.56

94
How does the 62.1 flow impact DOAS design—w/ space latent load decoupled?
Occ.Category cfm/p SA DPT
0F 1.3*cfm/p SA DPT 0F
A Conf. rm 6.2 24.84 8.06 34.75
B Lec. cl 8.42 35.9 10.96 41.63
C Elem. cl 11.71 42.75 15.23 46.08
D Office 17 47.18 22.1 49.2
E Museum 9 31.05 11.7 38.56
?
95
How does the 62.1 flow impact DOAS design—w/ space latent load decoupled?
Occ.Category cfm/p SA DPT
0F 1.3*cfm/p SA DPT 0F
A Conf. rm 6.2 24.84 8.06 34.75
B Lec. cl 8.42 35.9 10.96 41.63
C Elem. cl 11.71 42.75 15.23 46.08
D Office 17 47.18 22.1 49.2
E Museum 9 31.05 11.7 38.56
96
How does the 62.1 flow impact DOAS design—w/ space latent load decoupled?
Occ.Category cfm/p SA DPT
0F 1.3*cfm/p SA DPT 0F
A Conf. rm 6.2 24.84 8.06 34.75
B Lec. cl 8.42 35.9 10.96 41.63
C Elem. cl 11.71 42.75 15.23 46.08
D Office 17 47.18 22.1 49.2
E Museum 9 31.05 11.7 38.56

97
SA DPT vs OA/person
242628303234363840424446485052
4 6 8 10 12 14 16 18 20 22 24 26 28 30 32
CFM/person
SA D
PT
Std 62.1 flow1.3* Std 62.1 flowmore cfm/person
Required SA DPT vs. cfm/person
Occ.Category
A Conf. rm
B Lec. cl
C Elem. cl
D Office
E Museum
Increasing the latent load (200 to 250 Btu/hr-p) for a given SA flow rate, requires a lower SA DPT.
Knee of curve around 18 cfm/person
A
A’B
B’C
C’D
D’
E
E’
98
SA DPT vs OA/person
242628303234363840424446485052
4 6 8 10 12 14 16 18 20 22 24 26 28 30 32
CFM/person
SA D
PT
Std 62.1 flow1.3* Std 62.1 flowmore cfm/person
Required SA DPT vs. cfm/person
40%
16%
8%
4%Occ.
Category
A Conf. rm
B Lec. cl
C Elem. cl
D Office
E Museum
Increasing the latent load (200 to 250 Btu/hr-p) for a given SA flow rate, requires a lower SA DPT.
Knee of curve around 18 cfm/person
A
A’B
B’C
C’D
D’
E
E’
99
S.S. CO2 PPM vs. cfm/person
24
26
28
30
32
34
36
38
40
42
44
46
48
50
52
4 6 8 10 12 14 16 18 20 22 24 26 28 30 32
CFM/person
SA D
PT
700
810
920
1,030
1,140
1,250
1,360
1,470
1,580
1,690
1,800
1,910
2,020
2,130
2,240
Spac
e C
O2
, PPM
DPT @ Std 62.1 flowDPT @ 1.3* Std 62.1DPT @ > cfm/pCO2
Assumes an OA CO2 conc. of 400 PPM & an occupant
CO2 gen. rate of 0.31 L/min.
Note: CO2conc. Is a
measure of dilution, i.e.
IEQ

100
S.S. CO2 PPM vs. cfm/person
24
26
28
30
32
34
36
38
40
42
44
46
48
50
52
4 6 8 10 12 14 16 18 20 22 24 26 28 30 32
CFM/person
SA D
PT
700
810
920
1,030
1,140
1,250
1,360
1,470
1,580
1,690
1,800
1,910
2,020
2,130
2,240
Spac
e C
O2
, PPM
DPT @ Std 62.1 flowDPT @ 1.3* Std 62.1DPT @ > cfm/pCO2
Knee of curves~18 cfm/p
i.e. increased flow/p yields
minimal returns
Assumes an OA CO2 conc. of 400 PPM & an occupant
CO2 gen. rate of 0.31 L/min.
Note: CO2conc. Is a
measure of dilution, i.e.
IEQ
101
30% Surplus OA Hypotheses:In Context of DOAS
Increasing the ventilation air flow rate will increase the energy required to cool and dehumidify, as well as temper the outdoor air (OA), but only about 20-25% as much as would occur if TER equipment were not used.Increasing the DOAS ventilation air flow rate will result in a reduction in the winter cooling plant operation, saving operating cost. The extra free winter cooling will more than offset the increased cooling energy use during the summer months, i.e. refuting the ”madness”statement in the ASHRAE Journal article.
102
Test of the hypotheses based upon a 4,600 cfm & 6,000 cfm (i.e. 1.3*4,600 cfm) DOAS
After many assumptions, including operating with and without an EW, energy use and costs were evaluated for a few diverse geographical locations:– Atlanta, GA– New Orleans, LA– Columbus, OH– International Falls, MN
Ref: http://doas-radiant.psu.edu/mumma_Journal_30_PC_OA_6_09.pdf

103
Operating Cost1 2 3 4 5 6 7 8
FlowCFM TH
w/oEW
THw/
80%EffEW
OPCOSTw/oEW$
OPCOST
w/80%Eff
EW-$
HoursNo
Freeclg
HrsSomeFreeclg
LowestTempExitEW
Cold’stday
Columbus, OH simulation data4,600 7,506 1,500 $525 $105 1,0926,000 9,786 1,957 $685 $137 1,0924,600 -47,084 -11,814 -$3,296 -$827 2,9646,000 -61,387 -15,402 -$4,297 -$1,078 2,964 61
International Falls, MN simulation data4,600 1,934 387 $135 $27 3086,000 2,521 504 $176 $35 3084,600 -75,795 -19,210 -$5,303 -$1,345 3,7486,000 -98,774 -25,045 -$6,914 -$1,753 3,748 59
104
Operating Cost1 2 3 4 5 6 7 8
FlowCFM TH
w/oEW
THw/
80%EffEW
OPCOSTw/oEW$
OPCOST
w/80%Eff
EW-$
HoursNo
Freeclg
HrsSomeFreeclg
LowestTempExitEW
Cold’stday
Columbus, OH simulation data4,600 7,506 1,500 $525 $105 1,0926,000 9,786 1,957 $685 $137 1,0924,600 -47,084 -11,814 -$3,296 -$827 2,9646,000 -61,387 -15,402 -$4,297 -$1,078 2,964 61
International Falls, MN simulation data4,600 1,934 387 $135 $27 3086,000 2,521 504 $176 $35 3084,600 -75,795 -19,210 -$5,303 -$1,345 3,7486,000 -98,774 -25,045 -$6,914 -$1,753 3,748 59
$32
-$1,001
105
Operating Cost1 2 3 4 5 6 7 8
FlowCFM TH
w/oEW
THw/
80%EffEW
OPCOSTw/oEW$
OPCOST
w/80%Eff
EW-$
HoursNo
Freeclg
HrsSomeFreeclg
LowestTempExitEW
Cold’stday
Columbus, OH simulation data4,600 7,506 1,500 $525 $105 1,0926,000 9,786 1,957 $685 $137 1,0924,600 -47,084 -11,814 -$3,296 -$827 2,9646,000 -61,387 -15,402 -$4,297 -$1,078 2,964 61
International Falls, MN simulation data4,600 1,934 387 $135 $27 3086,000 2,521 504 $176 $35 3084,600 -75,795 -19,210 -$5,303 -$1,345 3,7486,000 -98,774 -25,045 -$6,914 -$1,753 3,748 59
$8
-$1,611

106
1st and Op Cost SummaryIII) Columbus, OH, Economic comparison of 6,000 and 4,600 cfm flow without EW
Flow 1st cost Op. Cost OA Fan op cost6,000 $43,900 $685-$4,297=-$3,612 $1,2304,600 $39,450 to $43,750 $525-$3,296=-$2,771 $950
Extra $ for surplus air $4,450 to $150 -$841 $280Payback years with
surplus air8 to 0.3 years
IV) Columbus, OH, Economic comparison of 6,000 and 4,600 cfm flow with EWFlow 1st cost Op. Cost OA Fan op cost6,000 $48,200 $137-$4,297=-$4,160 $1,5624,600 $43,770 to $48,070 $105-$3,296=-$3,191 $1,204
Extra $ for surplus air $4,430 to $130 -$969 $358Payback years with
surplus air7 to 0.2 years
107
30% Surplus Conclusion #1:The veracity of the Journal article claim concerning the cooling energy waste “madness” of garnering a LEED point in the IEQ category has been disproved w/ DOAS. Even Atlanta and New Orleans, locations not required by Standard 90.1 to have economizers, used less cooling energy with 30% surplus OA. Significantly more energy savings were demonstrated for Columbus and International Falls, where economizers are required.
108
30% Surplus Conclusion #2:The 3 hypotheses set forth above were
confirmed: A TER device substantially reduces the summer cooling energy used to treat OA.30% surplus air is quite beneficial in the winter at reducing the cooling plant energy use.The winter savings offsets the added cooling energy use during the warm months for the locations explored.

109
30% Surplus Conclusion #3:Increasing the ventilation air to spaces with low OA cfm/person yields big dividends in terms of allowing the SA DPT to be elevated while still accommodating all of the occupant latent loads. This strongly suggests a non-uniform ventilation increase strategy!!!!
In other words, if a space combined minimum OA/person is ~ 18 cfm/person, do not increase those values at all. But for spaces with the 6 to 18 cfm/person range, increase those values upward close to 18 cfm/person. Then step back and assess how close the entire building ventilation has approached a total 30% increase.
110
30% Surplus Conclusion #3, cont’dIf, after equalizing the flow rate per person to about 18 cfm, the 30% surplus ventilation has been achieved, take the LEED point. Note, the point is simply a by-product of elevating the SA DPT. Otherwise abandoning the goal of gaining a LEED point by this method (time to consider the bike rack?!:)—but don’t reduce the cfm/person!!!!
Such an approach should make gaining the LEED point possible while significantly simplifying the equipment choices and avoiding elevated first cost by eliminating the need for below freezing DPTs to some spaces.
111
30% Surplus Conclusion #3, cont’d
Increasing the OA flow rate beyond 18 cfm/person yields diminishing returns in terms of increasing the required SA DPT or enhanced IEQ achievement.
24
26
28
30
32
34
36
38
40
42
44
46
48
50
52
4 6 8 10 12 14 16 18 20 22 24 26 28 30 32
CFM/person
SA
DP
T
700
810
920
1,030
1,140
1,250
1,360
1,470
1,580
1,690
1,800
1,910
2,020
2,130
2,240
Spac
e C
O2
, PP
M
DPT @ Std 62.1 flowDPT @ 1.3* Std 62.1DPT @ > cfm/pCO2

112
Energy Consumption Characteristics of Commercial Building HVAC Systems: Volume III, Energy Savings Potential
Available at: http://doas-radiant.psu.edu/DOE_report.pdf
DOE Report: Ranking of DOAS and Parallel Radiant Cooling
113
#1
#2
#3
#3
Both DOAS and Radiant Have Instant Paybacks

115
What Has ASHRAE-Sponsored Research Found?
censored
Office: 1 story 6,600 ft2
Retail: 1 story 79,000 ft2
116
Base Case: DX, 350 cfm/ton
117
DX (400 cfm/ton) with Desiccant
Outdoor
Exhaust
Outdoor Supply

118
DOAS w/ Desiccant +DX
350 cfm/ton
400 cfm/ton
119
DOAS w/ EW +DX
CC
CC
350 cfm/ton
400 cfm/ton
120
Performance for office, based upon 62.1-2007 ventilation req’d
Location Miami Hous Shrev Ft. Wor Atlant DC St. Lo NY Chic Port
DX w/ Desiccant 0 0 0 0 0 0 0 0 0 0DOAS w/ Des. +DX 0 0 0 0 0 0 0 0 0 0DOAS w/ EW +DX 0 0 0 0 0 0 0 0 0 0
DX w/ Desiccant 52% 23 18 12 9 1 -2 1 -8 -1DOAS w/ Des. +DX 48% 18 14 8 8 -3 -5 -6 -14 -8DOAS w/ EW +DX -18% -21 -20 -19 -19 -23 -26 -19 -26 -14
DX w/ Desiccant 51 45 43 45 40 44 41 59 41 38DOAS w/ Des. +DX 54 48 46 48 44 47 45 63 45 42DOAS w/ EW +DX 35 35 33 37 33 37 35 52 37 36
Annual Op Cost vs. Base DX
Humidity Control (Occ. Hours >65% RH)
LCC: Equipment 1st + 15 yr Gas and Electric $, 1,000’s 2004 dollars

121
Performance for retail, based upon 62.1-2007 ventilation req’d
Location Miami Hous Shrev Ft. Wor Atlant DC St. Lo NY Chic Port
DX w/ Desiccant 0 0 0 0 0 0 0 0 0 0DOAS w/ Des. +DX 0 0 0 0 0 0 0 0 0 0DOAS w/ EW +DX 0 1 6 0 0 0 0 0 0 0
DX w/ Desiccant 169 79 75 47 61 18 14 6 -11 -2DOAS w/ Des. +DX 137 53 44 20 20 -9 -11 -14 -30 -15DOAS w/ EW +DX -39 -42 -41 -42 -41 -51 -54 -44 -55 -28
DX w/ Desiccant 322 250 235 226 210 209 189 247 174 148
DOAS w/ Des. +DX 313 245 228 220 203 205 189 242 174 153
DOAS w/ EW +DX 88 91 90 104 92 100 90 138 100 106
Annual Op Cost vs. Base DX (%)
Humidity Control (Occ. Hours >65% RH)
LCC: Equipment 1st + 15 yr Gas and Electric $, 1,000’s 2004 dollars
122
Do Other DOAS-Radiant Systems Currently Exist—in the US?
Let’s look briefly at one
123Municipal Building, Denver

124
Sys. AltsIAQ(5)
(wtg)
1st $ (5)
Op. $ (4)
DBT Ctl. (3)
Plenum depth (5)
AHU (1)
Future Flex (4)
Maint(3)
Ductwork (2)
Noise(2)
Total Score
FCU w/ DOAS 5/25 7/35 1/4 1/3 6/30 8/8 1/4 1/3 6/12 1/2 126
VAV, HW RH 4/20 5/25 3/12 5/15 2/12 4/4 5/20 7/21 2/4 7/14 145
LT VAV, HW RH 4/20 6/30 4/16 6/18 3/30 4/4 6/24 7/21 3/6 7/14 183
FPVAV, HW RH 2/10 4/20 5/20 4/12 4/20 8/8 3/12 3/9 4/8 2/4 123
FPVAV, Chw recool 1/5 3/15 6/24 3/9 5/25 8/8 4/16 2/6 7/14 3/6 128
LT DDVAV 3/15 2/10 2/8 2/6 1/5 4/4 2/8 4/12 1/2 5/10 80
UFAD 6/30 1/5 7/28 8/24 8/40 4/4 8/32 5/15 8/16 4/8 202
CRCP-DOAS 8/40 8/40 8/32 7/21 7/35 8/8 7/28 8/24 5/10 8/16 254
• Category Feature rating/score
• System performance in a category (i.e. 1st cost) rating 1-8 (8 Best): i.e. FCUw/ DOAS meeting 1st cost earns a 7
• Importance weighting of a category 1-5 (5 most important)
• Score: in a cell: product of importance weighting and system performance. i.e. for CRCP-DOAS in the category of Op $, the score is 4*8=32
125
Sys. AltsIAQ(5)
(wtg)
1st $ (5)
Op. $ (4)
DBT Ctl. (3)
Plenum depth (5)
AHU (1)
Future Flex (4)
Maint(3)
Ductwork (2)
Noise(2)
Total Score
FCU w/ DOAS 5/25 7/35 1/4 1/3 6/30 8/8 1/4 1/3 6/12 1/2 126
VAV, HW RH 4/20 5/25 3/12 5/15 2/12 4/4 5/20 7/21 2/4 7/14 145
LT VAV, HW RH 4/20 6/30 4/16 6/18 3/30 4/4 6/24 7/21 3/6 7/14 183
FPVAV, HW RH 2/10 4/20 5/20 4/12 4/20 8/8 3/12 3/9 4/8 2/4 123
FPVAV, Chw recool 1/5 3/15 6/24 3/9 5/25 8/8 4/16 2/6 7/14 3/6 128
LT DDVAV 3/15 2/10 2/8 2/6 1/5 4/4 2/8 4/12 1/2 5/10 80
UFAD 6/30 1/5 7/28 8/24 8/40 4/4 8/32 5/15 8/16 4/8 202
CRCP-DOAS 8/40 8/40 8/32 7/21 7/35 8/8 7/28 8/24 5/10 8/16 254
• Category Feature rating/score
• System performance in a category (i.e. 1st cost) rating 1-8 (8 Best): i.e. FCUw/ DOAS meeting 1st cost earns a 7
• Importance weighting of a category 1-5 (5 most important)
• Score: in a cell: product of importance weighting and system performance. i.e. for CRCP-DOAS in the category of Op $, the score is 4*8=32
Conventional VAV 145 pts: DOAS-Rad 254 pts
126
Sys. AltsIAQ(5)
(wtg)
1st $ (5)
Op. $ (4)
DBT Ctl. (3)
Plenum depth (5)
AHU (1)
Future Flex (4)
Maint(3)
Ductwork (2)
Noise(2)
Total Score
FCU w/ DOAS 5/25 7/35 1/4 1/3 6/30 8/8 1/4 1/3 6/12 1/2 126
VAV, HW RH 4/20 5/25 3/12 5/15 2/12 4/4 5/20 7/21 2/4 7/14 145
LT VAV, HW RH 4/20 6/30 4/16 6/18 3/30 4/4 6/24 7/21 3/6 7/14 183
FPVAV, HW RH 2/10 4/20 5/20 4/12 4/20 8/8 3/12 3/9 4/8 2/4 123
FPVAV, Chw recool 1/5 3/15 6/24 3/9 5/25 8/8 4/16 2/6 7/14 3/6 128
LT DDVAV 3/15 2/10 2/8 2/6 1/5 4/4 2/8 4/12 1/2 5/10 80
UFAD 6/30 1/5 7/28 8/24 8/40 4/4 8/32 5/15 8/16 4/8 202
CRCP-DOAS 8/40 8/40 8/32 7/21 7/35 8/8 7/28 8/24 5/10 8/16 254
• Category Feature rating/score
• System performance in a category (i.e. 1st cost) rating 1-8 (8 Best): i.e. FCUw/ DOAS meeting 1st cost earns a 7
• Importance weighting of a category 1-5 (5 most important)
• Score: in a cell: product of importance weighting and system performance. i.e. for CRCP-DOAS in the category of Op $, the score is 4*8=32
Conventional VAV 145 pts: DOAS-Rad 254 pts
Max points, 272: VAV 53%, DOAS-Rad 90%

127
A Few Other DOAS Applications
128
ASHRAE HQ, Atlanta, GA
DOAS
129
ASHRAE HDQ DOAS
VRV Outdoor Units

130
131
132

133
134
Middle School w/ DOAS
135
Air Cooled DX DOAS

136
137
Chiller Serving2-pipe FCU’s
138
Mumma Preferred Equipment ChoicesAlways consider dual path DOAS to the spaces, and use where it makes sense.I have yet to find a DOAS application where EW’s should not be used, when controlled properly.In most situations, use mechanical refrigeration to dehumidify, even if it means increasing the ventilation rate above the Std. 62.1 minimums. Choice is supported by the ASHRAE research.To achieve the low temperature chilled water economically, use OPAC where cost effective.

139
Conclusion
It is time to select systems that solve the inherent problems of VAV,While retaining the advantages of VAV,At equal or lower first cost,With lower operating cost,And achieves superior humidity control, thermal comfort, sense of wellbeing and productivity.
140
141
Future Questions?
Stanley A. Mumma, Ph.D., P.E.
Penn State [email protected]
http://doas-radiant.psu.edu