understanding data part 2
TRANSCRIPT
Understanding DataPart 2
Images and Compression

BitmapAn image is 2D grid of squares(bitmap), where each square is filled with only one color; this is kind of structure is called a raster graphics image.
Each of these small squares, called a pixel, can be filled with exactly one color. Computers use additive color mixing to produce colors. Primary colors are red, green and blue(RGB)
Typically, bitmaps use 24-bit(3 bytes) for colors.- 8 bits for each of the three primary colors.- each color has values 0 to 255.- 24-bit equals approximately 16.8 million colors.
MetadataThe pixels of an image is its data. An image may contain some metadata(data that describes a file's data) such as width, height, size, location of the image.
Metadata allow data to be structured and organized.
Metadata are used for finding, organizing, and managing information. Metadata can increase the effective use of data or data sets by providing additional information about various aspects of that data.
Changes and deletions made to metadata do not change the primary data.
RGB Model
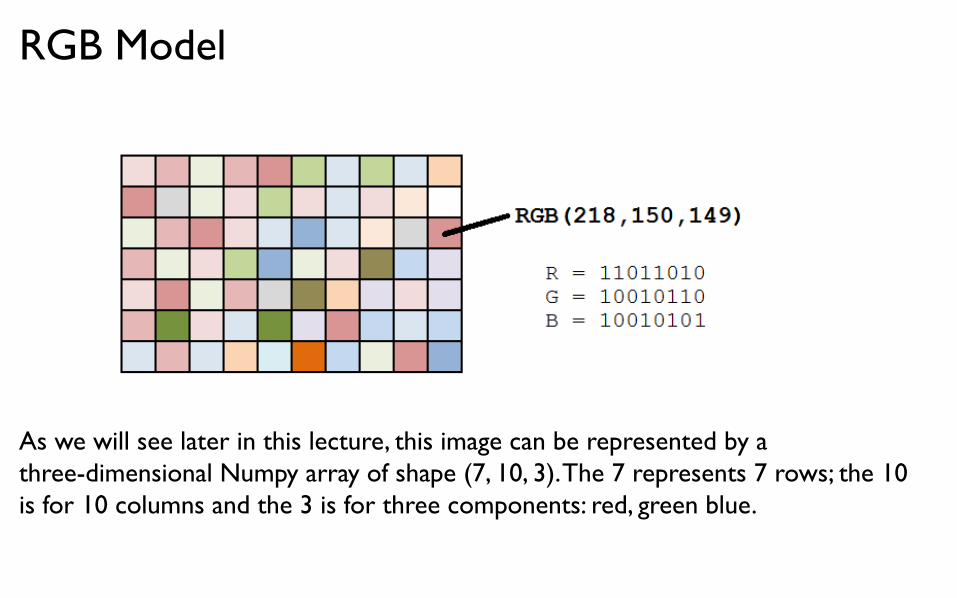
As we will see later in this lecture, this image can be represented by a three-dimensional Numpy array of shape (7, 10, 3). The 7 represents 7 rows; the 10 is for 10 columns and the 3 is for three components: red, green blue.
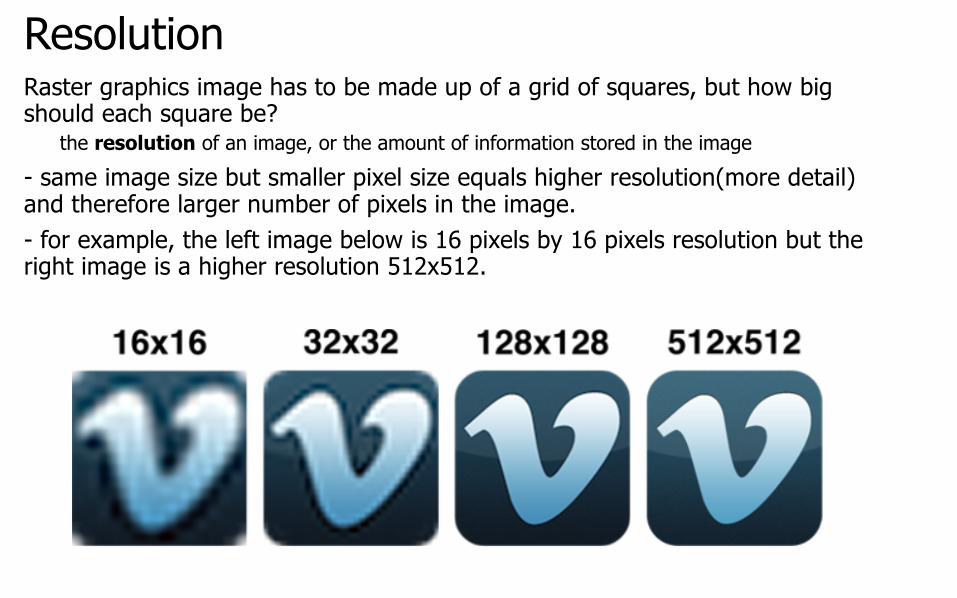
ResolutionRaster graphics image has to be made up of a grid of squares, but how big should each square be?
the resolution of an image, or the amount of information stored in the image- same image size but smaller pixel size equals higher resolution(more detail) and therefore larger number of pixels in the image.- for example, the left image below is 16 pixels by 16 pixels resolution but the right image is a higher resolution 512x512.

Lossless CompressionWhat would the bitmap data look like for the image below? A lot of the data would be the same! Is there a way to encode the image with an abbreviation for “500 black pixels” rather than listing each pixel individually?
Data compression can reduce the size(number of bits) of stored data. CompuServe develops GIF, or the Graphics Interchange Format, in 1987. • can be pronounced “GIF” or “JIF”
Unlike bitmaps, GIFs are compressed: can represent exactly the same information as some bitmaps using a smaller number of bits essentially, if two pixels that are horizontally adjacent are exactly the same, then
GIF compresses the data.
This method is called lossless compression: reducing number of bits stored while guaranteeing complete reconstruction of the original data, i.e, no data is lost. Thus few bits does not necessarily mean less information.Besides images, you may have used RAR, ZIP, GZIP, LZW to compress any file.

Lossy CompressionWhile lossless compression preserves all of a file's data, lossy compression throws away some data in the interest of compressing the file even more.
Lossy data compression algorithms can significantly reduce the number of bits stored or transmitted but only allow reconstruction of an approximation of the original data.
Effective lossy compression should preserve the essential data. You use effective lossy compression every time you text someone!
Hey wat r u doin tmrw? I wntd 2 go 2 c Ben.(43 characters)Hey, what are you doing tomorrow? I wanted to go to see Ben.(57 characters)(compressed by about 25%.) (you can “probs” do even better.)
GIF uses lossless compression
JPEG(Joint Photographic Experts Group), for example, uses lossy compression.PNG(Portable Network Graphic) is another popular format.
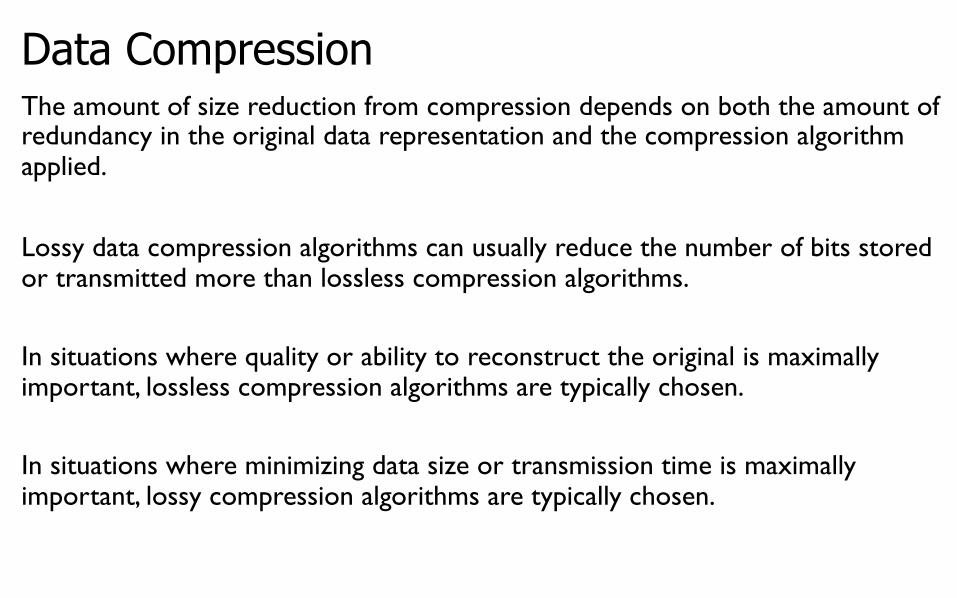
Data CompressionThe amount of size reduction from compression depends on both the amount of redundancy in the original data representation and the compression algorithm applied.
Lossy data compression algorithms can usually reduce the number of bits stored or transmitted more than lossless compression algorithms.
In situations where quality or ability to reconstruct the original is maximally important, lossless compression algorithms are typically chosen.
In situations where minimizing data size or transmission time is maximally important, lossy compression algorithms are typically chosen.

Comparison(Optional)Like GIF, PNG uses lossless compression, and like JPEG, PNG uses 24 bits for color.Another feature of the PNG format is support for alpha, or transparency. BMP and JPEG, on the other hand, don't have a channel devoted to transparency. GIF does have the distinct advantage of supporting animation achieved by repeatedly showing a series of frames.
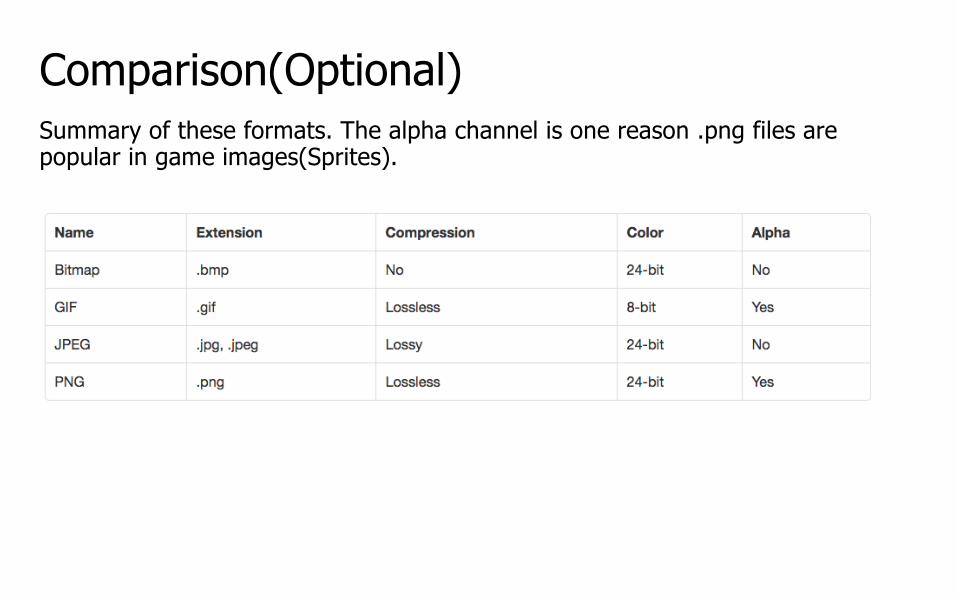
Comparison(Optional)Summary of these formats. The alpha channel is one reason .png files are popular in game images(Sprites).
Vector GraphicsIf a raster graphics image is scaled larger, the image will appear pixelated. Vector graphics can scale without losing quality.
Unlike raster graphics, vector graphics doesn't involve turning an image into a grid and storing the values of individual pixels.Instead, vector graphics stores images using mathematics.
For example, let's say we want to represent a circle. In raster graphics, we'd create a grid of squares and then trace out a circle by filling in squares with some color.Using vector graphics, we'd instead say that the equation for a square looks something like x^2 + y^2 = r^2.We can create a raster graphic simply by picking a size for the image, then using the equation to figure out which pixels should be colored.This representation doesn't depend on any pixels. If we want to create a larger circle, we can just pick a larger value for r, and our equation will create a larger circle without any loss in quality.
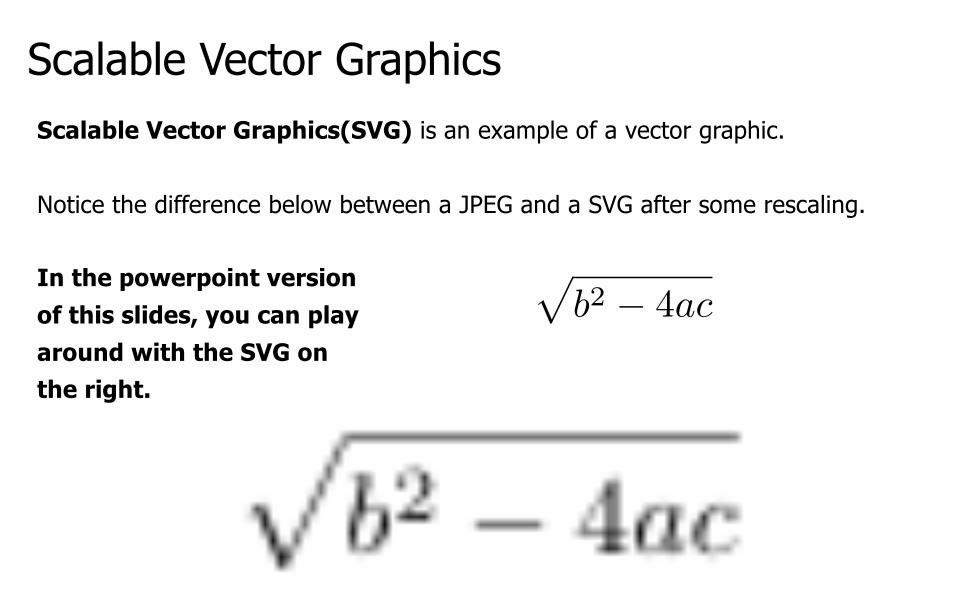
Scalable Vector GraphicsScalable Vector Graphics(SVG) is an example of a vector graphic.
Notice the difference below between a JPEG and a SVG after some rescaling.
In the powerpoint version of this slides, you can play around with the SVG on the right.
pb2 � 4ac
<latexit sha1_base64="aLubJ2FqEi6J3q5R2t5voKGl3v8=">AAAB9HicbVBNT8JAEJ3iF+IX6tFLIzHxImkJiXojevGIiQgJFLJdtrBhu627Uw1p+B9ePKjx6o/x5r9xgR4UfMkkL+/NZGaeHwuu0XG+rdzK6tr6Rn6zsLW9s7tX3D+411GiKGvQSESq5RPNBJesgRwFa8WKkdAXrOmPrqd+85EpzSN5h+OYeSEZSB5wStBI3Y5+UJj63cpZldBJr1hyys4M9jJxM1KCDPVe8avTj2gSMolUEK3brhOjlxKFnAo2KXQSzWJCR2TA2oZKEjLtpbOrJ/aJUfp2EClTEu2Z+nsiJaHW49A3nSHBoV70puJ/XjvB4MJLuYwTZJLOFwWJsDGypxHYfa4YRTE2hFDFza02HRJFKJqgCiYEd/HlZdKolC/L7m21VLvK0sjDERzDKbhwDjW4gTo0gIKCZ3iFN+vJerHerY95a87KZg7hD6zPH4Kckg8=</latexit><latexit sha1_base64="aLubJ2FqEi6J3q5R2t5voKGl3v8=">AAAB9HicbVBNT8JAEJ3iF+IX6tFLIzHxImkJiXojevGIiQgJFLJdtrBhu627Uw1p+B9ePKjx6o/x5r9xgR4UfMkkL+/NZGaeHwuu0XG+rdzK6tr6Rn6zsLW9s7tX3D+411GiKGvQSESq5RPNBJesgRwFa8WKkdAXrOmPrqd+85EpzSN5h+OYeSEZSB5wStBI3Y5+UJj63cpZldBJr1hyys4M9jJxM1KCDPVe8avTj2gSMolUEK3brhOjlxKFnAo2KXQSzWJCR2TA2oZKEjLtpbOrJ/aJUfp2EClTEu2Z+nsiJaHW49A3nSHBoV70puJ/XjvB4MJLuYwTZJLOFwWJsDGypxHYfa4YRTE2hFDFza02HRJFKJqgCiYEd/HlZdKolC/L7m21VLvK0sjDERzDKbhwDjW4gTo0gIKCZ3iFN+vJerHerY95a87KZg7hD6zPH4Kckg8=</latexit><latexit sha1_base64="aLubJ2FqEi6J3q5R2t5voKGl3v8=">AAAB9HicbVBNT8JAEJ3iF+IX6tFLIzHxImkJiXojevGIiQgJFLJdtrBhu627Uw1p+B9ePKjx6o/x5r9xgR4UfMkkL+/NZGaeHwuu0XG+rdzK6tr6Rn6zsLW9s7tX3D+411GiKGvQSESq5RPNBJesgRwFa8WKkdAXrOmPrqd+85EpzSN5h+OYeSEZSB5wStBI3Y5+UJj63cpZldBJr1hyys4M9jJxM1KCDPVe8avTj2gSMolUEK3brhOjlxKFnAo2KXQSzWJCR2TA2oZKEjLtpbOrJ/aJUfp2EClTEu2Z+nsiJaHW49A3nSHBoV70puJ/XjvB4MJLuYwTZJLOFwWJsDGypxHYfa4YRTE2hFDFza02HRJFKJqgCiYEd/HlZdKolC/L7m21VLvK0sjDERzDKbhwDjW4gTo0gIKCZ3iFN+vJerHerY95a87KZg7hD6zPH4Kckg8=</latexit><latexit sha1_base64="aLubJ2FqEi6J3q5R2t5voKGl3v8=">AAAB9HicbVBNT8JAEJ3iF+IX6tFLIzHxImkJiXojevGIiQgJFLJdtrBhu627Uw1p+B9ePKjx6o/x5r9xgR4UfMkkL+/NZGaeHwuu0XG+rdzK6tr6Rn6zsLW9s7tX3D+411GiKGvQSESq5RPNBJesgRwFa8WKkdAXrOmPrqd+85EpzSN5h+OYeSEZSB5wStBI3Y5+UJj63cpZldBJr1hyys4M9jJxM1KCDPVe8avTj2gSMolUEK3brhOjlxKFnAo2KXQSzWJCR2TA2oZKEjLtpbOrJ/aJUfp2EClTEu2Z+nsiJaHW49A3nSHBoV70puJ/XjvB4MJLuYwTZJLOFwWJsDGypxHYfa4YRTE2hFDFza02HRJFKJqgCiYEd/HlZdKolC/L7m21VLvK0sjDERzDKbhwDjW4gTo0gIKCZ3iFN+vJerHerY95a87KZg7hD6zPH4Kckg8=</latexit>
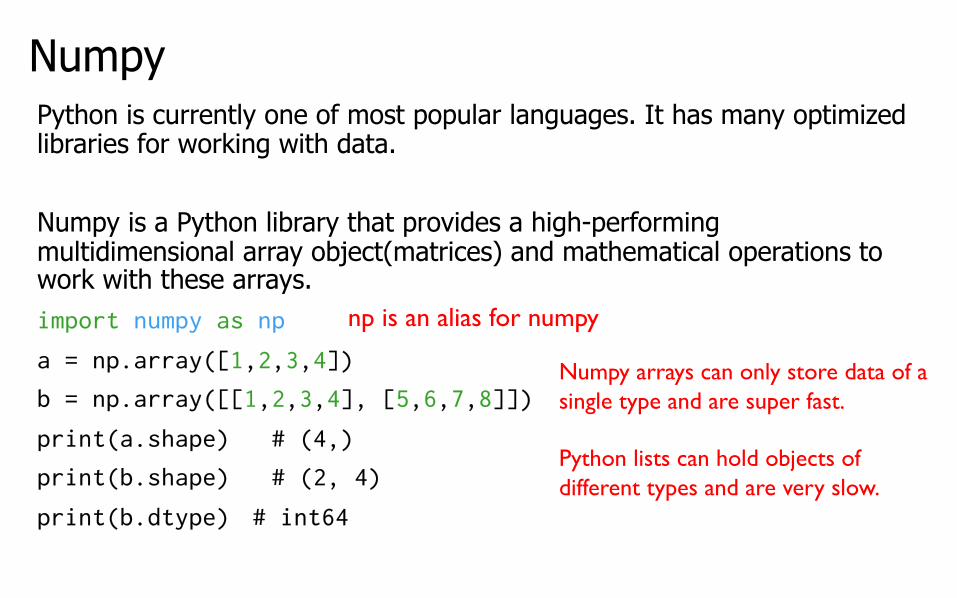
NumpyPython is currently one of most popular languages. It has many optimized libraries for working with data.
Numpy is a Python library that provides a high-performing multidimensional array object(matrices) and mathematical operations to work with these arrays. import numpy as np
a = np.array([1,2,3,4])
b = np.array([[1,2,3,4], [5,6,7,8]])
print(a.shape) # (4,)
print(b.shape) # (2, 4)
print(b.dtype) # int64
Numpy arrays can only store data of a single type and are super fast.
Python lists can hold objects of different types and are very slow.
np is an alias for numpy
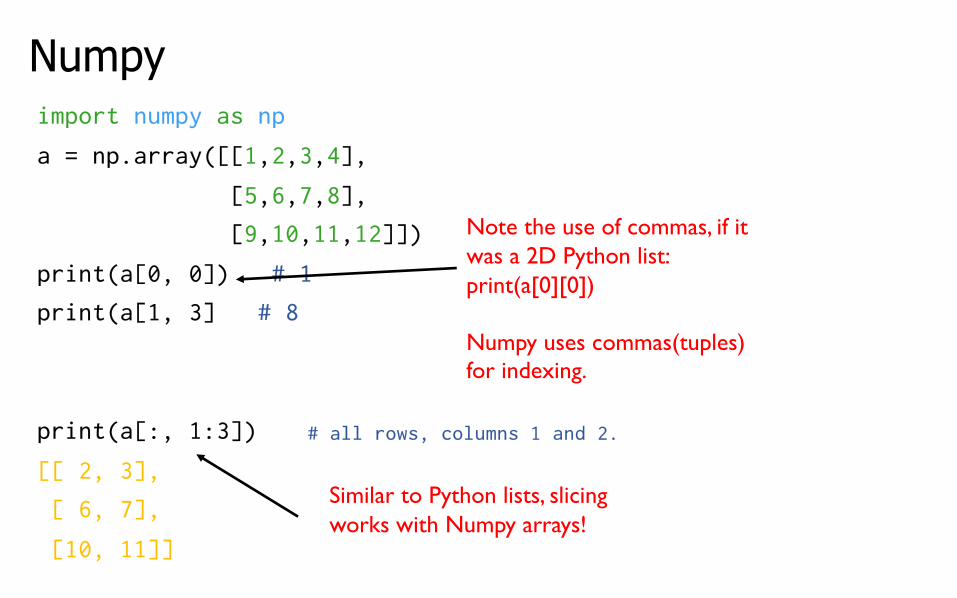
Numpyimport numpy as np
a = np.array([[1,2,3,4],
[5,6,7,8],
[9,10,11,12]])
print(a[0, 0]) # 1
print(a[1, 3] # 8
print(a[:, 1:3])
[[ 2, 3],
[ 6, 7],
[10, 11]]
Similar to Python lists, slicing works with Numpy arrays!
Note the use of commas, if it was a 2D Python list:print(a[0][0])
Numpy uses commas(tuples) for indexing.
# all rows, columns 1 and 2.

MatplotlibMatplotlib is built on top of Numpy and provides plotting capabilities. It is recommended that you use the Jupyter Notebook when working with these libraries.
import matplotlib.pyplot as plt
img = plt.imread("flower.jpg")
print(img.shape)
(859, 840, 3)
rows(height)
columns(width)
RGB channel
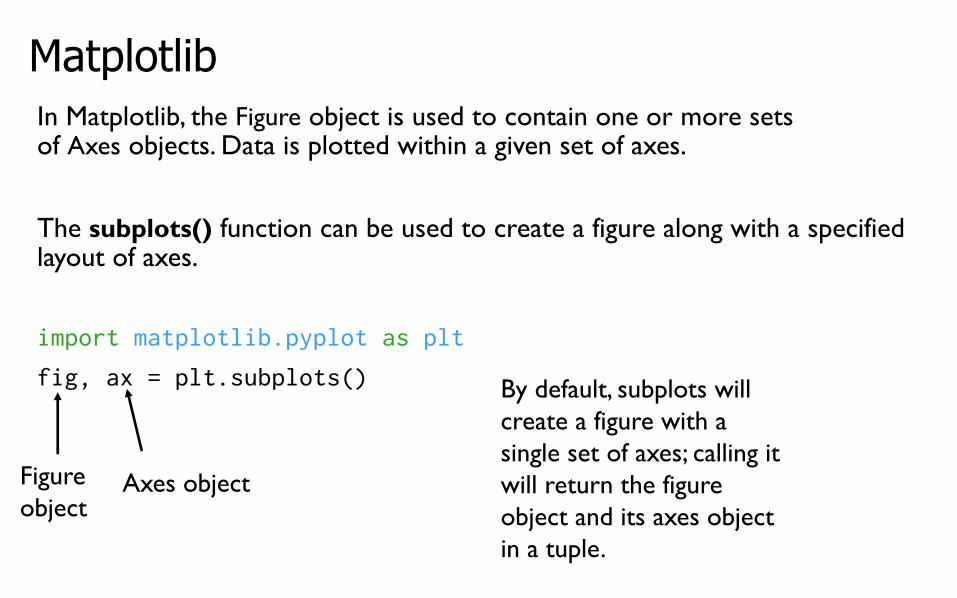
MatplotlibIn Matplotlib, the Figure object is used to contain one or more sets of Axes objects. Data is plotted within a given set of axes.
The subplots() function can be used to create a figure along with a specified layout of axes.
import matplotlib.pyplot as plt
fig, ax = plt.subplots()
Figure object
Axes object
By default, subplots will create a figure with a single set of axes; calling it will return the figure object and its axes object in a tuple.

imshow()import matplotlib.pyplot as plt
img = plt.imread("flower.jpg")
print(img.shape) # (859, 840, 3)
fig, ax = plt.subplots()
ax.imshow(img)
imshow() displays the 2D grid of pixels as an image.
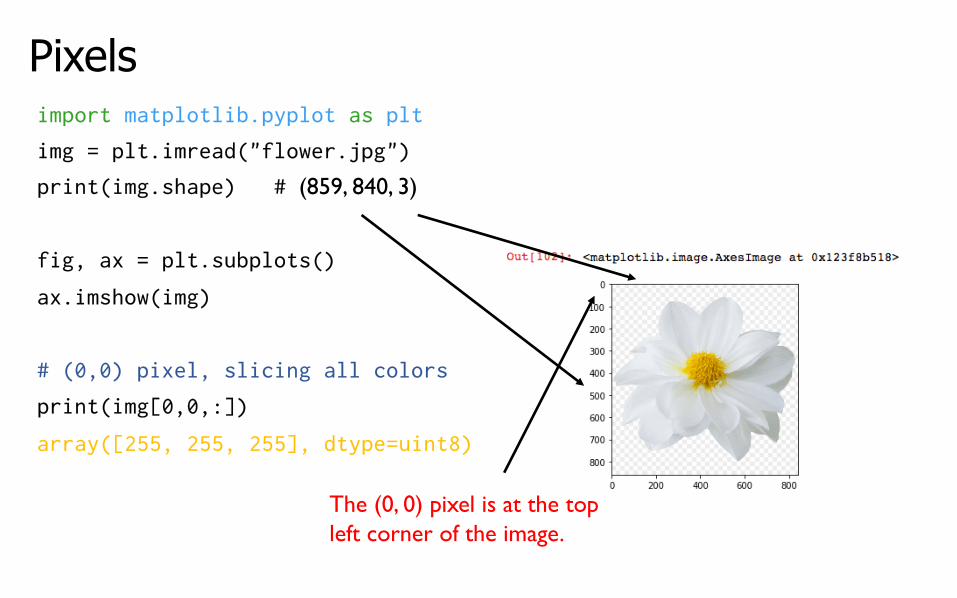
Pixelsimport matplotlib.pyplot as plt
img = plt.imread("flower.jpg")
print(img.shape) # (859, 840, 3)
fig, ax = plt.subplots()
ax.imshow(img)
# (0,0) pixel, slicing all colors
print(img[0,0,:])
array([255, 255, 255], dtype=uint8)
The (0, 0) pixel is at the top left corner of the image.
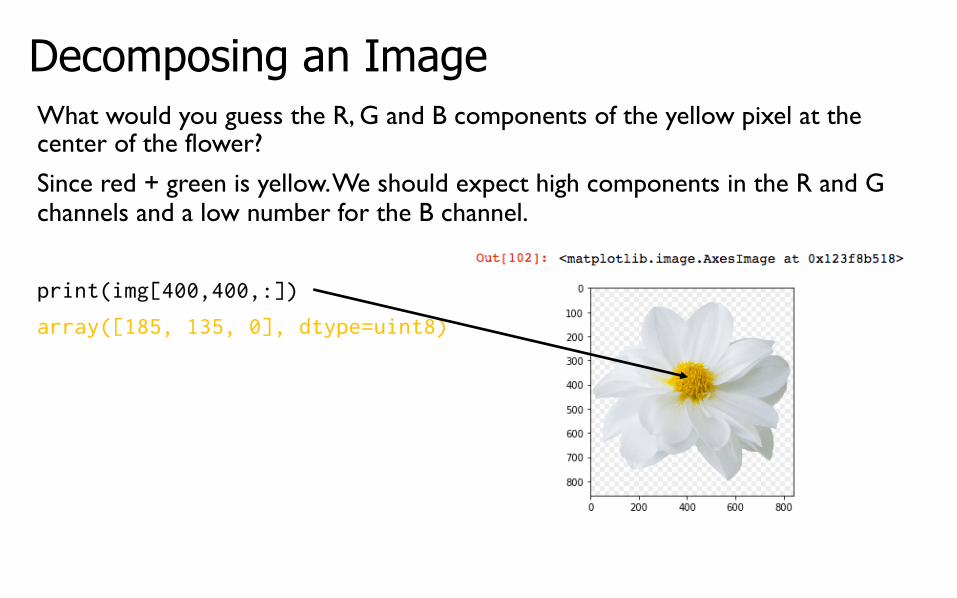
Decomposing an ImageWhat would you guess the R, G and B components of the yellow pixel at the center of the flower?
Since red + green is yellow. We should expect high components in the R and G channels and a low number for the B channel.
print(img[400,400,:])
array([185, 135, 0], dtype=uint8)

Decomposing an ImageHow about a pixel on one of the white petals?Since red + green + blue is white. We should expect high components in all R, G and B channels.
print(img[200,400,:])
array([218, 222, 225], dtype=uint8)
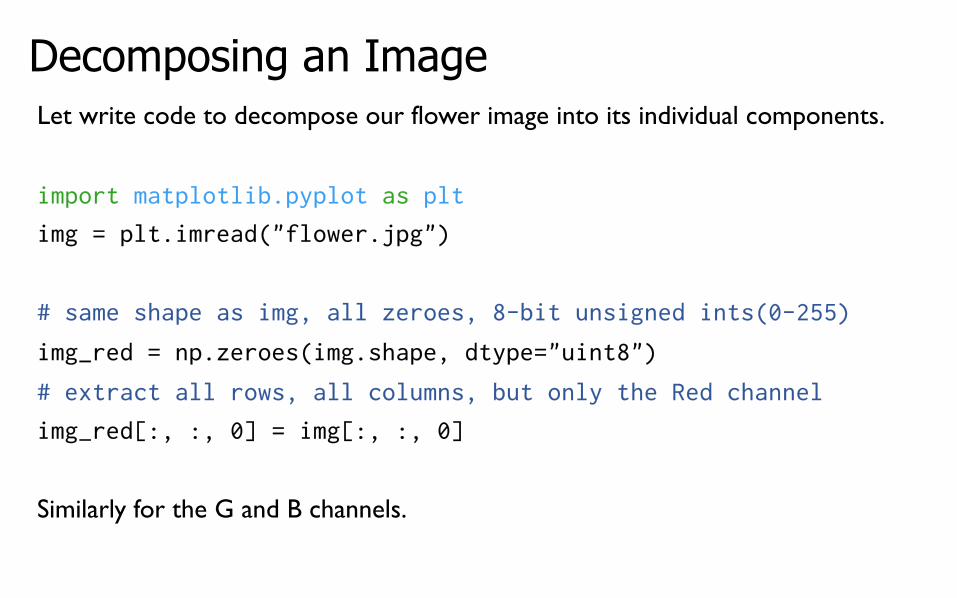
Decomposing an ImageLet write code to decompose our flower image into its individual components.
import matplotlib.pyplot as plt
img = plt.imread("flower.jpg")
# same shape as img, all zeroes, 8-bit unsigned ints(0-255)
img_red = np.zeroes(img.shape, dtype="uint8")
# extract all rows, all columns, but only the Red channel
img_red[:, :, 0] = img[:, :, 0]
Similarly for the G and B channels.

Decomposing an ImageLet's generalize this and put our code into a loop to extract all three components, create three set of axes on Matplotlib and plot all components!
import matplotlib.pyplot as plt
img = plt.imread("flower.jpg")
fig, axs = plt.subplots(nrows=1, ncols=3, figsize=(15,5))
red = np.zeros(img.shape,dtype="uint8")
red[:,:,0] = img[:,:,0]
# similarly for blue and green
axs[0].imshow(red)
axs[1].imshow(green)
axs[2].imshow(blue)
Creates 3 Axes objects using 1 row and 3 columns layout.
(width, height) of Figure object

Decomposing an ImageWe can write the previous code using a for loop instead.
import matplotlib.pyplot as plt
img = plt.imread("flower.jpg")
fig, axs = plt.subplots(nrows=1, ncols=3, figsize=(15,5))
for c in range(3):
temp_img = np.zeros(img.shape, dtype="uint8")
temp_img[:,:,c] = img[:,:,c]
axs[c].imshow(temp_img)
See the next slide for the output.
Creates 3 Axes objects using 1 row and 3 columns layout.
(width, height) of Figure object

Decomposing an ImageThis output is generated from the previous slide of code in Jupyter Notebook.Pretty good for just a few lines of Python code!
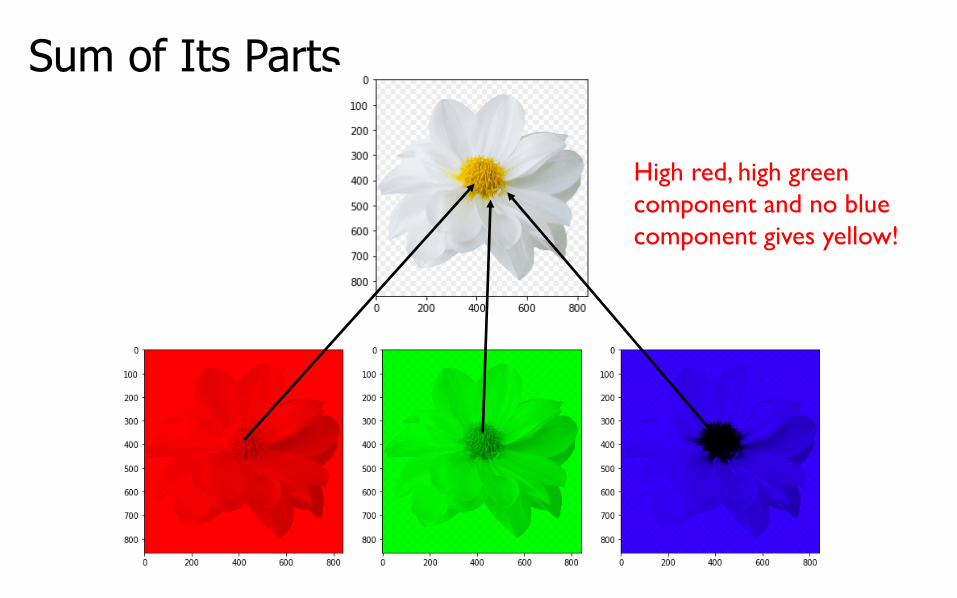
Sum of Its Parts
High red, high green component and no blue component gives yellow!
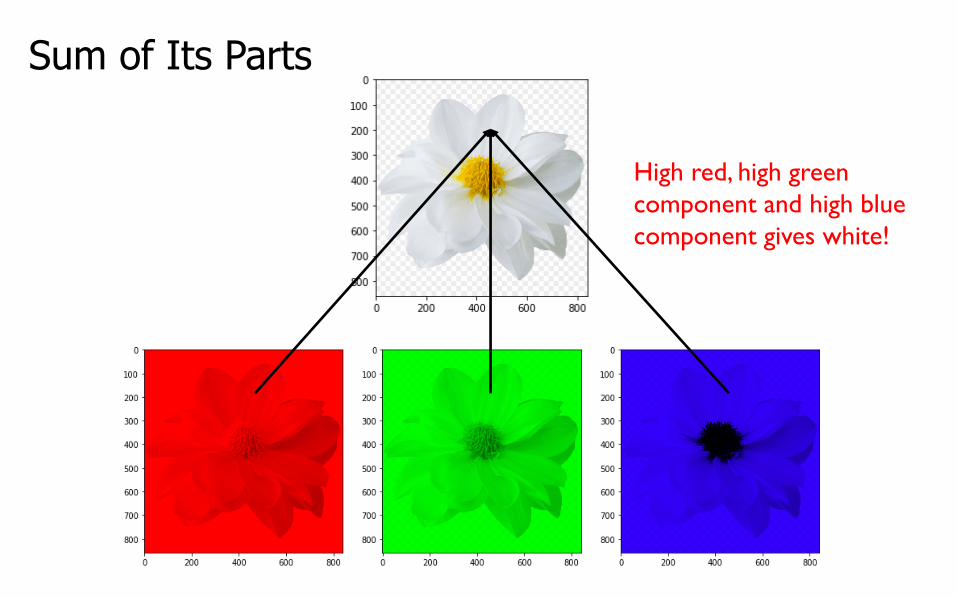
Sum of Its Parts
High red, high green component and high blue component gives white!
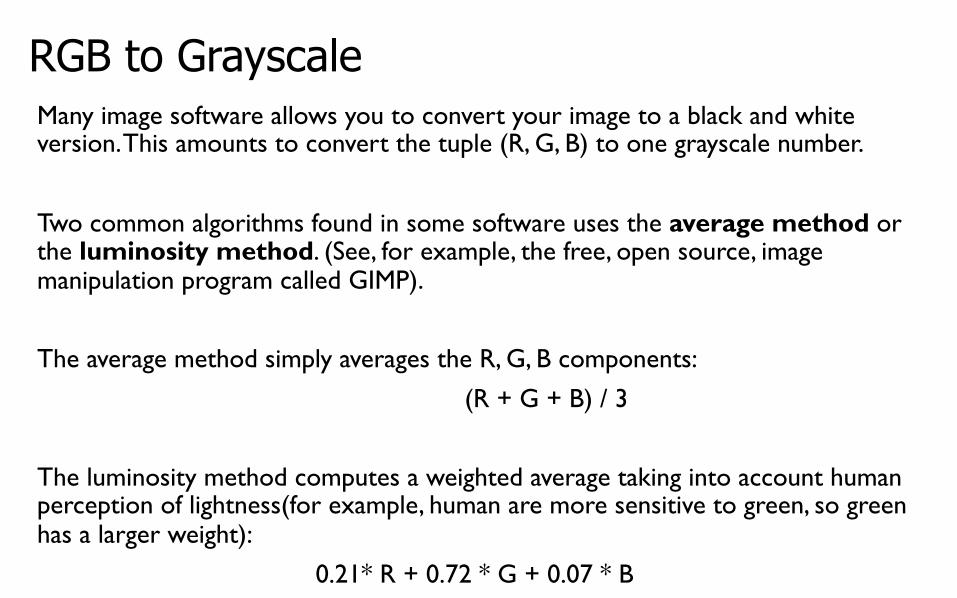
RGB to GrayscaleMany image software allows you to convert your image to a black and white version. This amounts to convert the tuple (R, G, B) to one grayscale number.
Two common algorithms found in some software uses the average method or the luminosity method. (See, for example, the free, open source, image manipulation program called GIMP).
The average method simply averages the R, G, B components: (R + G + B) / 3
The luminosity method computes a weighted average taking into account human perception of lightness(for example, human are more sensitive to green, so green has a larger weight):
0.21* R + 0.72 * G + 0.07 * B

RGB to GrayscaleIn your homework, you'll writePython code to do the followingconversion to grayscale.
The left image uses the averagemethod, the right uses the luminositymethod.
The luminosity is the default method inGIMP.

TintTo tint an image is to mix its colors with white. This will increase the lightness of the image. In your lab, you will write a Python function, which takes an image and a percentage value as a parameter. Setting 'percentage' to 0 will not change the image, setting it to one means that the image will be completely whitened.
For example, suppose a pixel with RGB components of [0.80, 0.60, 0.40]. Tinting it by 25% means that the pixel is now [0.85, 0.70, 0.55].

References
1) Part of this lecture is taken from a lecture from an OpenCourseWarecourse below.Computer Science E-1 at Harvard Extension SchoolUnderstanding Computers and the Internetby Tommy MacWilliam.
2) The formulas for converting RGB to grayscale can be found in the GIMP documentation: https://docs.gimp.org/2.6/en/gimp-tool-desaturate.html