understanding cropping systems in the semi-arid
TRANSCRIPT

Understanding cropping systems in the semi-arid environments of Zimbabwe: options for soil fertility management

Promotor: Prof. Dr. K.E. Giller Hoogleraar in de Plantaardige Productiesystemen Wageningen Universiteit Co-promotoren: Dr. S.J Twomlow Global Theme Leader (Principal Scientist)
International Crops Research Institute for the Semi-arid Tropics (ICRISAT), Zimbabwe Dr. M.T. van Wijk Universitair docent
Leerstoelgroep Plantaardige Productiesystemen Wageningen Universiteit
Samenstelling Promotiecommissie: Dr. M. Corbeels, CIRAD, France Dr. J. Vos, Wageningen Universiteit Prof. Dr. Th.W. Kuyper, Wageningen Universiteit Dr.ir. J.M. van Paassen, Wageningen Universiteit Dit onderzoek is uitgevoerd binnen de onderzoekschool: Production Ecology and Resource Conservation

Understanding cropping systems in the semi-arid environments of
Zimbabwe: options for soil fertility management
Bongani Ncube
Proefschrift
Ter verkrijging van de graad van doctor op gezag van de rector magnificus
van Wageningen Universiteit, Prof. Dr. M.J. Kropff
in het openbaar te verdedigen op dinsdag 3 april 2007
des namiddags te 13:30 uur in de Aula

Bongani Ncube (2007) Understanding cropping systems in the semi-arid environments of Zimbabwe: options for soil fertility management PhD Thesis, Wageningen University, Wageningen, The Netherlands. 2007. With references – with summaries in English and Dutch ISBN: 90-8504-635-1

Abstract African smallholder farmers face perennial food shortages due to low crop yields. The major cause of poor crop yields is soil fertility decline. The diversity of sites and soils between African farming systems is great, therefore strategies to solve soil fertility problems should suit the opportunities and problems encountered in the different climatic regions. This thesis characterizes the semi-arid regions of south-western Zimbabwe and explores some of the strategies that can be used to provide farmers with more options for soil fertility improvement. Resource flow maps were used to study the characteristics of the semi-arid farming system of Tsholotsho (Mkhubazi) in south-western Zimbabwe. The results revealed that farmers in the region face perennial cereal grain shortages, but the poorly-resourced farmers are the most affected. Nutrient management is limited to the use of limited amounts of manure by the better-resourced and medium-resourced farmers. Poorly-resourced farmers did not apply any nutrients to their crops. The use of low rates of manure and fertilizer is one option that farmers in the semi-arid regions can adopt. Farmers who had access to small amounts of manure and fertilizer were able to increase cereal yields through farmer participatory research experiments. Previously the farmers did not apply manure to crops. In 2003–2004, with good rainfall maize yields due to manure applications at 3 and 6 t ha−1 were 1.96 and 3.44 t ha−1 compared to 1.2 and 2.7 t ha−1 from plots without. Top dressing with 8.5 kg N ha−1 increased yields to 2.5 t ha−1 with 3 t ha−1 of manure, and to 4.28 t ha−1 with 6 t ha−1 of manure. In dry years manure in combination with N fertilizer increased grain yield by about 0.14 and 0.18 t ha−1. The research results also showed that it is possible to successfully grow grain legumes under the semi-arid conditions and derive substantial residual yield benefits to sorghum grown after the legumes. New varieties of grain legumes seemed to be well adapted to dry environments. Sorghum grain yields after legumes reached 1.62 t ha-1 in 2003/04, more than double the yields in the sorghum after sorghum rotation, and the yields were also higher in 2004/05. The Agricultural Production SIMulator (APSIM) was used to model the legume-sorghum rotation to test it’s capability in simulating cropping systems in the semi-arid southern Africa. The model output of N and water stress factors on plant growth assisted in better understanding the water, N and plant growth interactions within a

cropping season, as well as the residual benefits of legumes interacting with variable seasonal conditions. The model showed that the residual benefits of the legumes were driven by nitrogen availability more than water even under the semi-arid conditions. Further research will focus on the simulation of long-term effects of the manure/fertilizer experiments and the legume-cereal rotations. The use of farming systems models is required in order to get a better understanding of the functioning of smallholder farming systems in semi-arid regions and identify possible development pathways of the systems.

Preface This thesis is a product of collaboration between Wageningen University and the International Crops Research Institute for the Semi-arid Tropics (ICRISAT). Special thanks go to the Netherlands Foundation for Science in the Tropics (WOTRO) for funding the PhD research and ICRISAT for funding part of the work in Zimbabwe. I consider myself privileged to have managed to carry out this work. I am greatly indebted to Professor Ken Giller my promoter for making the PhD study possible. His guidance and advice during the study period is greatly appreciated. I also want to thank Dr Steve Twomlow for making it possible through ICRISAT to carry out this PhD. I am also humbled by the encouragement and assistance from Dr John Dimes who was not only a supervisor, but also a father figure in this PhD. He always assured me when things were very difficult. Thank you also to Dr. Mark van Wijk my daily supervisor at Wageningen University. He kept telling me we were getting there, and we finally did! To Dr. P Mapfumo, Dr. Ed Rowe, Dr G.M. Heinrich, Dr J. Rusike, Dr. A. VanRooyen, Dr. I. Minde, Dr. K. Mazvimavi, Dr L. Hove, Dr S. Honmann and Dr P. Belder, thank you all for your encouragement. Thank you also to Mr Elisha Bepete and the Mkhubazi farmers for making me part of them during the field studies. I would also like to thank everyone who assisted me during the course of the research both at ICRISAT and at Wageningen: Walter Mupangwa, Patricia Masikate, Swathi Sridharan, Murairo Madzvamuse, Thuthukani Lusaba, Kundishora Mhuruyengwe, Juliet Ndlovu, Tinah Moyo, Nester Mashingaidze, Canford Chiroro, Putso Maphosa, Martin Moyo, Nicholas Safure, my field assistants Getrude Mpofu, Bhekimpilo Ncube, Vusumuzi Ndlovu, Sevi Dube and Nkazimulo Tshuma. I also thank Zanele Mabhikwa, Cordelia Ndwalaza and Sifiso Ncube for their help, Mr. Govo, Mrs. Tapela and the Finance department, not forgetting Robert Shamwarira and Mr. Christopher Mabika for making things easier with the car. Special thanks also go to our secretaries at the Plant Production Systems Group, Ria van Dijk and Charlotte Schilt. The two ladies always gave me reason to smile in their office. I would also like to express my gratitude to Mrs. Gijsbertje Berkhout for assisting with financial arrangements at Wageningen and for being a mother figure by assuring me all the time. Thank you also to Wampie van Schouwenburg for the assistance with editing. I would also like to thank the Zimbabwean and RCCG communities at Wageningen for making us feel at home. Maphosas and Zvinavashes

thank you. Special thanks to Tafadzwa Mandimika for being a pillar when things were so difficult, and to Ruth Ngadze for making us smile. Thank you to my friends and colleagues in the Attic and PPS: Dr. Shamie Zingore, Dr. John Ojiem, Shibu MuhammedEbrahim, Trinh van Mai, Samuel Guto, Benjamin Kibor, Christine Chizana, Charles Bucagu, Jessica Milgroom, Fernando Funes Mozote, Chrispen Murungweni, Eduardo Citaddini, Dr. Afio Zannou, Dr. Comfort Kudadjie and K. Senthikumar. Lastly thank you to my family, my brothers and sisters for all the encouragement. My heartfelt thanks go to my son Alford Mbongeni for being so strong when I had to be away for so long. I salute Mbonisi for the dedication that he showed during my study period. To Wilson Nhliziyo thank you for the encouraging calls and for your support. I would also like to thank the Sibandas (NaBha and family), and to Bongani Sibanda thank you for the assistance and encouragement. Bongani Ncube Wageningen, April 2007

To my son Alford Mbongeni and my brother Mbonisi


Table of Contents Chapter 1 General Introduction 1 Chapter 2 Farm characteristics and soil fertility management strategies
across different years in smallholder farming systems under semi-arid environments of south-western Zimbabwe 13
Chapter 3 Raising the productivity of smallholder farms under semi-arid conditions by use of small doses of manure and nitrogen: a case of participatory research 43
Chapter 4 Productivity and residual benefits of grain legumes to sorghum grown in rotation under semi-arid conditions in south-western Zimbabwe 69
Chapter 5 Productivity and residual benefits of grain legumes to
sorghum under semi-arid conditions in southern Zimbabwe: Unravelling the effects of water and nitrogen using a simulation model 101
Chapter 6 General discussion and conclusions 135
Summary 149 Samenvatting 151 Curriculum vitae 153 PE & RC PhD Education Statement Form 154 Funding 155


CHAPTER 1
General Introduction


1. General introduction Problems of poor productivity and food security in sub-Saharan Africa Declining and stagnant crop productivity is a continuing problem faced by the majority of smallholder farmers in sub-Saharan Africa (FAO Stats, 2006, http://faostat.fao.org/). A major cause of poor crop productivity is poor soil fertility (Sanchez, 2002). Zimbabwe is one of the sub-Saharan countries that experience perennial food shortages due to complex reasons that are exacerbated by the current economic crisis. At farm scale poor soil fertility management plays a major role in restricting productivity and the ability of farmers to guarantee their own food security. There is limited application to crops of the major nutrients and recommendations for fertilizer technologies are rarely implemented by farmers (Dimes et al., 2004a, b). The most limiting nutrient in Zimbabwe’s agricultural system is nitrogen, although phosphorus availability is also a major problem in the smallholder farming sector. Inadequate nutrient supply to crops has resulted in serious nutrient depletion in many parts of the country (Hikwa et al., 2001). The semi-arid regions of Zimbabwe face even more challenges because the problem is further exacerbated by limited moisture availability (Mapfumo and Giller, 2001). The semi-arid regions of Zimbabwe fall into two agro-ecological zones Natural Regions IV and V (Vincent and Thomas, 1960). Natural Region IV has an annual rainfall range of 350–650 mm, and the region is characterized by semi-intensive farming systems suitable for livestock and drought resistant crops. Natural region V is dry (rainfall 400–600 mm) with semi-extensive farming suitable for cattle ranching. Most of southern Zimbabwe falls within these two natural regions; hence research in the semi-arid regions is focused in the southern part of the country. The soils are predominantly sandy and have a limited ability to store organic matter and nutrients, such that soil fertility declines rapidly under cultivation (Zingore et al., 2005). Efforts to curb soil fertility decline in the semi-arid regions of Zimbabwe are hampered by a number of challenges, which are also common within much of Southern Africa. Decline in inorganic fertilizer use The most recommended nutrient source for replenishing soil fertility is inorganic fertilizer, but the high cost, lack of credit and poor transport and marketing infrastructure have led to poor adoption of the fertilizer technologies by the smallholder farmers (Buresh and Giller, 1998). These problems are increasingly acute due to the general economic malaise in Zimbabwe. In addition to these problems
3

Chapter 1
smallholder farmers have been offered inappropriate recommendations that fail to consider risk and investment capacity of the farmers (Dimes et al., 2004a, b; Twomlow et al., 2006). The semi-arid smallholder farmers are even more affected. Farm surveys in semi-arid southern Zimbabwe have revealed certain trends that are peculiar to these regions (Ahmed et al., 1997; Rohrbach, 2001). Less than 10 % of farmers in southern Zimbabwe use chemical fertilizer. In addition to problems of cost and availability, many farmers believe that mineral fertilizer burns crops (Ahmed et al., 1997; Rohrbach, 2001) which has contributed to the limited use of fertilizers. Limited application of manure The application of cattle and/or goat manure is one of the most recommended technologies that smallholder farmers can adopt to solve the soil fertility problems in Zimbabwe. Manure availability is however limited in most of the smallholder farming sector in Zimbabwe, especially in the sub-humid regions. In areas where the nutrient source is available it is of low quality (Mugwira and Murwira, 1997, 1998). In the semi-arid regions the use of manure has been hampered by other factors. In southern Zimbabwe it was estimated in 2000 that up to 60 % of farmers who had access to manure were not using the source (Rohrbach, 2001). One of the reasons given was that manure burns the crops. Some farmers also cited lack of transport as a major problem. It has therefore been common in the past to see heaps of manure which were left next to the kraals and never used (Rohrbach, 2001). Cereal monoculture and unsystematic crop rotations The semi-arid regions of southern Zimbabwe are dominated by cereal production, particularly maize (Zea mays L.), sorghum (Sorghum bicolor (L.) Moench) and pearl millet (Pennisetum glaucum (L.) R.Br.). Pearl millet and sorghum provide food security; maize normally fails when the rainfall seasons are not good (Rohrbach, 2001). There is a wide imbalance in crop area allocations between cereals and legumes; as a result there are no systematic crop rotations. Legumes are grown in small areas and they receive less than 5% of soil fertility inputs (Mapfumo and Giller, 2001; Twomlow, 2004). The monoculture of cereals continues to deplete nutrients and this has resulted in continued decline of cereal yields. In addition to specific soil fertility management challenges the semi-arid regions of Zimbabwe also face natural disasters such as perennial droughts. The regions are usually affected by mid-season droughts that occur in January, most of the time resulting in poor crop yields that make the farmers even more vulnerable to food insecurity (Twomlow et al., 2006).
4

General introduction
Approaches to solve soil fertility problems in the smallholder farming sector The diversity of sites, soils and strategies found within and between African farming systems is great. Soil fertility research approaches should therefore be tailored to suit the opportunities and problems encountered in a particular location (Scoones, 2001). Such an approach is required to address soil fertility problems in semi-arid Zimbabwe. Many authors have made the case for soil fertility management options that take into account local variability in soil fertility (Giller et al., 2006), and that are effective within farmer resource constraints and acceptable risk (Snapp et al., 1998, 2003). Farm scale studies have helped in generating a better understanding of farmer’s problems. The use of resource flow and allocation studies concepts have generated a lot of knowledge on farming systems in various locations (Defoer et al., 1998; Briggs and Twomlow, 2002; Defoer, 2002; Esilaba, 2005; Tittonell et al., 2005a; Tittonell et al., 2005b; Zingore et al., 2006). A better understanding of the farming system dynamics, including nutrient management and resource allocation has helped in identifying relevant interventions in the smallholder farming sector. Approaches to managing soil fertility need to be analysed within the context of the extended livelihoods of smallholder farmers in Africa. This necessitates a focus on farm scale rather than field or plot scale, which is the focus of the NUANCES (Nutrient Use in Animal and Cropping Systems: Efficiency and Scales) framework (Giller et al., 2006) within which context this research was designed (see http://www.africanuances.nl/). Farmer participatory research has become an important approach in developing strategies of solving soil fertility management problems. Involving farmers in experiments is thought to be one effective way of accelerating technology adoption. Building farmer–researcher partnerships using participatory methods makes technology testing more realistic (Snapp et al., 2003; Douthwaite et al., 2003). Research should provide farmers with a ‘basket’ of options from which they can make choices of relevant technologies that suit their conditions. Recent soil fertility research recommendations emphasize options that combine both mineral fertilizers and organic sources (Ahmed et al., 1997; Palm et al., 2001; Nyathi et al., 2003; Snapp et al., 2003). Targeting of nutrients within crop rotations can increase use efficiency and allow farmers to use the limited inputs of N and P fertilizers and manure that are available effectively (Giller, 2002). Apart from their direct provision of food and cash if sold, grain legumes play an important role in soil fertility management. There is a myth that growing legumes
5

Chapter 1
always leads to improvement in soil fertility, but it is generally accepted that cereal crops yield better when they are grown in rotation with legumes than in continuous monocultures (Vanlauwe and Giller, 2006). As we try to find ways of increasing the contribution of legume-cereals rotations to food security in semi-arid environments there is also need to understand the magnitude of the yield benefits. Simulation models play an important role in capturing the interactions between climatic conditions, soil types and nutrient dynamics in legume cereal rotations (Delve and Probert, 2004). The Agricultural Production Simulator (APSIM) is one such model. Performance of the model has been reported in Africa in explaining aspects of N dynamics of manure inputs (Delve and Probert, 2005), maize response to N (Shamudzarira and Robertson, 2002; Robertson et al., 2005), weed competition (Keating et al., 1999; Dimes et al., 2004), water use efficiency (Dimes and Malherbe, 2006) and one study on legumes in Malawi (Robertson et al., 2005). There is limited application of APSIM in Africa especially with legumes. The model can be used to assess simultaneous above- and below-ground dynamics for water, N uptake and N2-fixation, biomass production and partitioning to grain to create a better understanding of the legume-cereal rotations under dry conditions. Rationale of the study Smallholder farmers in the semi-arid regions are diverse in resource endowment; therefore their approaches to farming are also diverse. The farmers are also differently affected by soil fertility problems. Research should therefore provide farmers with a ‘basket’ of soil fertility management options to improve crop productivity. Targeting resources could be one solution to the soil fertility management problems, but the targeting will be relevant provided certain conditions are met. There should be a clear understanding of the farmers’ constraints and farming conditions, and farmers should also be involved in developing and testing some of the technologies. Results of soil fertility management technologies should also be tested and understood before they are passed to the farmers and this can be done using both experimentation and modelling. The aims of the study were first, to understand the cropping systems in the semi-arid environments of Zimbabwe and secondly to assess options for solving soil fertility management problems. A farm scale study was carried out over three seasons using resource flow maps in order to capture inter-annual variability and its effects on farm management and productivity. The targeting of low rates of manure and fertilizer was also explored within the same farming system. Legumes were further studied on-station to assess their productivity and residual benefits to sorghum. Modelling was
6

General introduction
further used to explore the legume-cereal rotation and the dynamics of the nitrogen and water stress factors within the rotation. Objectives of the study The main objectives of the study were to assess soil fertility management strategies that could be offered to smallholder farmers in the semi-arid regions to increase soil nutrient availability and increase food production within the farming systems. The other objectives were to identify opportunities for the expansion of production areas of grain legumes. The potential to utilize the residual N and moisture benefits of the legumes to increase sorghum yield was also investigated using field experiments and modelling. The specific objectives of the study were: 1. To study the Tsholotsho semi-arid smallholder farming system and identify the
constraints and opportunities for grain legume intensification in south western Zimbabwe and other semi-arid regions;
2. To explore the use of low rates of manure and fertilizer in improving the productivity of maize using farmer participatory research approaches under semi-arid conditions;
3. To assess the productivity of indigenous and improved grain legumes under semi-arid conditions and quantify their residual benefits to subsequent sorghum;
4. To test the capability of the Agricultural Production Simulator model to predict the growth and yield of grain legumes, their residual benefits to subsequent sorghum, and to analyse the stress dynamics of nitrogen and water within the rotation under semi-arid conditions.
Outline of the thesis In Chapter 2 the semi-arid farming system found in Mkhubazi, Tsholotsho, and south-western Zimbabwe is described and analysed using resource flow maps and records of on-farm crop production across three cropping seasons. Results of on-farm experiments examining response to small amounts of P fertilizers within the same period are presented. Farmer participatory research exploring the benefits of low rates of N fertilizer and manure on the productivity of maize is described in Chapter 3. In Chapter 4 results are presented of experiments conducted on an experimental station to study the productivity and residual benefits of grain legumes to sorghum grown in rotation under semi-arid conditions. In Chapter 5, APSIM was used to model the results of the legume-cereal rotations described in Chapter 4 and to assess the stress
7

Chapter 1
dynamics of nitrogen and water within the rotations. Chapter 6 is a general discussion of the results, their implications for farmers’ practice and further research needs. References Ahmed M M, Rohrbach D D, Gono L, Mazhangara E, Mugwira L, Masendeke D D
and Alibaba S 1997 Soil fertility management in communal areas of Zimbabwe: current practices, constraints and opportunities for change. Results of a diagnostic survey. Southern and Eastern Africa Region. Working Paper no 6. PO Box 776, Bulawayo, Zimbabwe.
Briggs L and Twomlow S 2002 Organic material flows within a smallholder highland farming system of South West Uganda. Agric. Ecosyst. Env. 89, 191-212.
Buresh R J and Giller K E 1998 Strategies to replenish soil fertility in African smallholder agriculture. Waddington, S.R.; Murwira, H.K.; Kumwenda, J.D.T.; Hikwa, D.; Tagwira, F. Soil fertility research for maize-based farming systems in Malawi and Zimbabwe. Harare, Zimbabwe. Soil Fertility Network and CIMMYT. 13–19
Defoer T, De Groote H, Hilhorst T, Kante S and Budelman A 1998 Participatory action research and quantitative analysis for nutrient management in southern Mali. a fruitful marriage? Agric. Ecosyst. Environ. 71, 215-228.
Defoer T 2002 Learning about methodology development for integrated soil fertility management. Agric. Syst. 73, 57-81.
Delve R J and Probert M E 2004 Modelling nutrient management in tropical cropping systems. Australian Centre for International Agricultural Research (ACIAR), Canberra, AT; Centro Internacional de Agricultura Tropical (CIAT). p. 135-138. (ACIAR proceedings no. 114).
Dimes J and Malherbe J 2006. Climate variability and simulation modelling – challenges and opportunities, In Mgonja M A, Waddington S, Rollin D and Masenya M (eds.) 2006 Livelihoods in the Limpopo: CGIAR Challenge Program on Water and Food Project No 1. (CPWFPN1): Increased food security and income in the Limpopo basin through intergrated crops, soil fertility and water management options and links to markets. Proceedings of the CPWFPN1 Inception Workshop, 25-27 Jan 2005, Polokwane. South Africa. PO Box 776, Bulawayo, Zimbabwe: ICRISAT. 132 pp.
Dimes J, Muza L, Malunga G, Snapp S 2004a Trade-offs between investments in nitrogen and weeding: On-farm experimentation and simulation analysis in Malawi and Zimbabwe. In: Friesen DK, Palmer AFE (eds) Integrated approaches to higher maize productivity in the New Millennium: Proceedings
8

General introduction
of the Seventh Eastern and Southern Africa Regional Maize Conference, 11–15 February, 2001. CIMMYT (International Maize and Wheat Improvement Center) and KARI (Kenya Agricultural Research Institute). Nairobi, Kenya, pp 452–456
Dimes J, Twomlow S, Rusike J, Gerard B, Tabo R, Freeman A and Keatinge J D H 2004b Increasing research impacts through low-cost soil fertility management options for Africa’s drought-prone areas. International Symposium for Sustainable Dry land Agriculture Systems. International Crops Research. Institute for the Semi Arid Tropics (ICRISAT) December 2 to 5, 2003. Sahelian Center, Niamey, Niger
Douthwaite B, Kuby T, van de Fliert E and Schulz S 2003 Impact pathway evaluation: an approach for achieving and attributing impact in complex systems. Agricultural Systems. 78, 243-265.
Esilaba A O, Nyende P, Nalukenge G, Byalebeka J B, Delve R J and Ssali H 2005 Resource flows and nutrient balances for crop and animal production in smallholder farming systems in eastern Uganda. Agric. Ecosyst. Environ. 109, 192-201.
Giller K E 2002 Targeting management of of organic resources and mineral fertilizers: Can we match scientists' fantasies with farmer's realities? In: Vanlauwe B, Diels J, Sanginga N and Merckx (R eds) Integrated Plant Nutrient Management in Sub-Saharan Africa. CAB International, Wallingford, pp. 155-171.
Giller K E, Rowe E C, de Ridder N and van Keulen H 2006 Resource use dynamics and interactions in the tropics: Scaling up in space and time. Agric. Syst. 88, 8-27.
Hikwa D N P, Mugwira L M, Mushambi CF 2001 Integrated soil fertility development for resource-poor farmers in Zimbabwe. The Research and Development Strategy beyond 2001. Harare Zimbabwe, Department of Research and Specialist Services, 48 pp
Keating B A, Carberry P S. and Robertson M J 1999 Simulating N fertiliser responses in low-input farming systems 2. Effects of weed competition. In Donatelli M, Stockle C, Villalobus F, and Villar Mir J M (eds), International Symposium, Modelling Cropping Systems, Proceedings European Soc. For Agronomy, Div. Agroclimatology and Agronomic Modelling, Lleida, Spain, 21-23 June 1999, 205-206.
Surveyor General 1984 Zimbabwe Natural regions and farming areas. 1:1000 000. Deaprtment of the Surveyor General, Harare, Zimbabwe.
Mapfumo P and Giller K E 2001 Soil Fertilty Management Strategies and Practices by Smallholder Farmers in Semi Arid Areas of Zimbabwe. International Crops
9

Chapter 1
Research Institute for the Semi Arid Tropics (ICRISAT) with permission from the Food and Agricultural Organization (FAO). Bulawayo, Zimbabwe and Rome, Italy. 60p.
Mugwira L M, Murwira H K 1998 A review of research on cattle manure as a soil fertility amendment in Zimbabwe: some perspectives. In: Waddington, SR, Murwira HK, Kumwenda JDT, Hikwa D, and Tagwira F (eds) Soil fertility research for maize-based farming systems in Malawi and Zimbabwe. Proceedings of the Soil Fert Net Results and Planning Workshop held from 7 to 11 July 1997 at Africa University, Mutare, Zimbabwe. Soil Fert Net and CIMMYT-Zimbabwe, Harare, Zimbabwe, pp 195–201
Nyathi P, Kimani S K, Jama B, Mapfumo P, Murwira H K, Okalebo J R, Bationo A (2003) Soil fertility management in semi-arid areas of East and Southern Africa. In: Gichuru M P, Bationo A, Bekunda M A, Goma H C, Mafongoya P L, Mugendi D N, Murwira H M, Nandwa S M, Nyathi P, Swift M J (eds) Soil fertility management in Africa: a regional perspective. Academy Science Publishers, Nairobi, Kenya, pp 219–252
Palm C A, Gachengo C N, Delve R J, Cadisch G, Giller K E (2001) Organic inputs for soil fertility management in tropical agroecosystems: application of an organic resource database. Agric. Ecosyst. Environ. 83:27–42
Rohrbach D D 2001 Zimbabwe baseline: crop management options and investment priorities in Tsholotsho. In: Twomlow SJ, Ncube B (eds) Improving soil management options for women farmers in Malawi and Zimbabwe: Proceedings of a Collaborators Workshop on DFID-supported project Will Women Farmers Invest in Improving their Soil Fertility? Participatory Experimentation in a Risky Environment, 13–15 September 2000, ICRISAT-Bulawayo, Zimbabwe. International Crops Research Institute for the Semi Arid Tropics, Bulawayo, Zimbabwe, pp 57–64
Robertson M J, Sakala W, Benson T, and Shamudzarira Z. 2005 Simulating response of maize to previous velvet bean (Mucuna pruriens) crop and nitrogen fertiliser in Malawi. Field Crops Res. 91: 91-105.
Sanchez P A 2002 Ecology - Soil fertility and hunger in Africa. Science 295, 2019-2020.
Scoones I 2001 Transforming soils: the dynamics of soil-fertility management in Africa. Pp. 1-44 in: Scoones, I. (ed.) Dynamics and Diversity: Soil Fertility and Farming Livelihoods in Africa. London: Earthscan.
Shamudzarira Z and Robertson M J 2002. Simulating the response of maize to nitrogen fertiliser in semi-arid Zimbabwe. Exp. Agric. 38: 79–96.
10

General introduction
Snapp S S 1998 Soil nutrient status of smallholder farms in Malawi. Communic. Soil Sci. Plant Anal. 29, 2571-2588.
Snapp S S, Blackie M J and Donovan C 2003 Realigning research and extension to focus on farmers' constraints and opportunities. Food Pol. 28, 349-363.
Tittonell P, Vanlauwe B, Leffelaar P A, Rowe E C and Giller K E 2005 Exploring diversity in soil fertility management of smallholder farms in western Kenya - I. Heterogeneity at region and farm scale. Agric Ecosyst Environ. 110, 149-165.
Tittonell P, Vanlauwe B, Leffelaar P A, Shepherd K D and Giller K E 2005 Exploring diversity in soil fertility management of smallholder farms in western Kenya - II. Within-farm variability in resource allocation, nutrient flows and soil fertility status. Agric. Ecosyst. Environ. 110, 166-184.
Twomlow S J 2004 Increasing the role of legumes in smallholder farming systems - The future challenge, p 29-46. In: Serraj R (ed). Symbiotic Nitrogen Fixation: Prospects for Application in Tropical Agroecosystems. Science Publishers, NH, USA
Twomlow S, Rohrbach D, Rusike J, Mupangwa W, Dimes J and Ncube B 2006 Spreading the word on fertilizer in Zimbabwe. Global Theme on Agro-ecosystems Report No. 24. PO Box 776, Zimbabwe. International Crops Research Institute for the Semi-Arid Tropics. 16 pp
Twomlow S J, Steyn J T, and du Preez C C 2006 Dryland Farming in Southern Africa. Chapter 19 Dryland Agriculture, 2nd Edition, Agronomy Monograph no. 23. ASA, CSSA, SSSA, Madison, WI, USA. 769-836
Vincent V and Thomas R G 1960 An Agricultural Survey of Southern Rhodesia, Part 1. Agro-ecological survey. Government Printer, Salisbury (Zimbabwe).
Zingore S, Manyame C, Nyamugafata P, Giller K E 2005 Long-term changes in organic matter of woodland soils cleared for arable cropping in Zimbabwe. Euro. J. Soil Sci. 56, 727-736
Zingore S, Murwira H K, Delve R J and Giller K E 2006 Influence of nutrient management strategies on variability of soil fertility, crop yields and nutrient balances on smallholder farms in Zimbabwe. Agric. Ecosyst. Environ. doi:10.1016/j.agee.2006.06.019.
11


CHAPTER 2
Farm characteristics and soil fertility management strategies across different years in smallholder farming systems under semi-arid environments of south-
western Zimbabwe
Bongani Ncube, Steve Twomlow, Mark T. van Wijk, John Dimes and Ken E. Giller (To be submitted to Soil Use and Management)


2. Farm characteristics and soil fertility management strategies across different years in smallholder farming systems under semi-arid environments of south-western Zimbabwe
Abstract Smallholder farming systems in Africa are faced with poor crop production and food insecurity. In semi-arid farming systems poor soil fertility and erratic rains are the most important constraints to crop production. To understand the functioning of these systems and to identify potential interventions for long term improvement of crop production, quantification of resource availability, resource allocation and production within the farm is essential. In farming systems of semi-arid regions these factors are strongly affected by the inter-annual rainfall variability. The aims of the research were to characterise a smallholder farming system in south-western Zimbabwe, to assess the current farming activities in terms of crop production and to assess the possibilities of improving legume productivity within the system. The system was studied using resource flow mapping, farmer interviews and on-farm experiments over three cropping seasons (2002/03, 2003/04 and 2004/5) in order to capture the inter-annual variability and its effects on farm management and productivity. The farmer resource groups were categorized into three groups: better-resourced, medium-resourced and poorly-resourced. Better-resourced farmers produced adequate grain for their food requirements except in the drought year (2002/03). Poorly-resourced farmers had large grain deficits while the medium-resourced class had lower deficits. All farmers produced less than 300 kg ha-1 of legumes per season. Lack of seed was cited as the main reason for poor legume production. Better-resourced farmers used manure (2 -5 tonnes per season) and some fertilizer, while the medium-resourced group used less manure (maximum 2 tonnes per season) and no fertilizer. The use of manure varied strongly across the years. The poorly-resourced farmers used no nutrient input with their crops. All groups had negative nitrogen balances across the three cropping seasons, but the value varied strongly across the 3 seasons. The on farm experiments showed that improvement of legume production was possible within the system. Cowpea and groundnut yielded up to 1 t ha-1 in a wet season. There is a need to introduce more productive legume-cereal rotations within the semi-arid farming system to harness these benefits to address the problem of food security in these unpredictable environments. Key words: grain legumes, food security, manure, resources
15

Chapter 2
Introduction Smallholder farming systems in Africa are faced with poor crop production and perennial food insecurity, especially the semi-arid tropics where the majority of smallholder farmers live. In addition to poor rainfall, the major constraint to crop production is poor soil fertility, caused by inherently poor soil quality and inappropriate soil management practices (e.g Ryan and Spencer, 2001; Vanlauwe, 2003). Assessments of nutrient balances of smallholder farms have consistently found negative balances for nitrogen and phosphorus in smallholder farming systems (Roy et al., 2003). Soil fertility management interventions therefore require a good understanding of the farming systems in order to develop appropriate technological interventions (Hilhorst and Muchena, 2000). Some studies have been conducted to assess the dynamics (including nutrient management and resource allocation) of smallholder farming systems (Defoer et al., 1998; Briggs and Twomlow, 2002; Tittonell et al., 2005b; Zingore et al., 2006). Most previous studies were conducted in medium-resourced to high rainfall areas. The few studies that have been conducted in the semi-arid regions of Africa were carried out mainly in West Africa (Harris and Mortimore, 2005). Data on resource allocation and use patterns in the semi-arid regions of southern Africa is limited to a few case studies (Toulmin and Scoones, 1997; Scoones, 2001). Different resource allocation strategies of smallholder farmers have resulted in soil fertility gradients between farms and between field types. In Western Kenya for example soil fertility gradients were found to be related to the variation in biophysical and socio-economic conditions (Tittonell et al., 2005a) at region and farm scale level, while within farm variability was related to differential resource allocation (Tittonell et al., 2005b). In the higher rainfall conditions of eastern Zimbabwe soil fertility gradients were a function of organic matter management (Mtambanengwe et al., 2005) and concentration of nutrients such as fertiliser and manure in fields that are closer to homesteads (Twomlow, 2001; Zingore et al., 2006). Surveys and reviews on soil fertility management in the semi-arid regions of Zimbabwe have reported that there is a crisis for soil fertility management in the semi-arid smallholder farming areas (Mapfumo and Giller, 2001; Ahmed et al., 1997). These authors highlighted the lack of quantitative information on indigenous soil fertility management practices, including nutrient balances in the semi-arid areas. There was also limited use of soil-improving nutrient sources such as manure and fertilizer mainly due to scarcity and high cost respectively (Ahmed et al., 1997). Crop
16

Characteristics of the semi-arid farming system
rotations were limited and farmers were using crop sequences that were not designed to improve soil fertility. Legumes were grown in small areas and they received the least nutrient inputs (Mapfumo and Giller, 2001; Twomlow, 2004). Reasons why semi-arid farmers follow such farming practices are not very clear. There is therefore a strong need to conduct research to characterize the resource flows in the smallholder farms in semi-arid regions, quantify their nutrient balances and assess whether legumes can play a role in these cereal-based systems (Mapfumo and Giller, 2001). Tsholotsho (Mkhubazi) was selected as the representative site for the study of smallholder farming systems under semi-arid conditions. The site was selected because baseline studies had been previously conducted in the area using surveys (Ahmed et al., 1997; Rohrbach, 2000) and interventions through participatory research (Carberry et al., 2004). Two approaches were used to conduct initial research in Tsholotsho. First, resource flow maps were used to identify resource allocation and soil fertility management strategies within the farming system. Secondly, farmer participatory experiments were conducted using maize/manure and legumes to assess the feasibility of some of the soil fertility management strategies identified through farmer/researcher interactions. The results of the maize/manure experiments have been reported separately as Ncube et al. (2006). This paper reports the results of resource flow mapping and legume experimentation carried out over three cropping seasons at Mkhubazi, Tsholotsho to assess the effects of the inter-annual variability in rainfall on crop production, the resources available and the resource allocation patterns. The specific objectives of the studies were to: i) characterize the farming system using resource flow maps for three consecutive years; ii) assess the current annual crop production and the inter-annual variability of both cereal and legume production; iii) identify current soil fertility management strategies and their link to annual rainfall; and iv) assess the constraints and opportunities for increasing legume productivity within the system.
Methodology The study site The research was conducted at Mkhubazi village, Tsholotsho (27o 41’ E, 19o 38’ S). Figure 1 shows the location of Tsholotsho District, Wards 12 and 13 where soil fertility management experiments were conducted and Mkhubazi Village.
17

Chapter 2
Figure 1. Location of Tsholotsho District; research Wards 12 (X11) and 13 (XIII) and Mkhubazi Village. The black circles represent resource flow farms (homesteads) and boxes represent the fields. The whiter patches show fields and the darker areas represent forestland. Map drawn by ICRISAT-Bulawayo GIS Unit, 2006 The average rainfall for Tsholotsho is 590 mm per annum. The study area is dominated by deep (>150 cm) Kalahari sand (Ustic Quartzipsamment (FAO/UNESCO)) from Aeolian sand parent material (Moyo, 2001). The soil type is locally referred to as ihlabathi. There are also some small patches of Aridic Haplustalfs (iphane) and fields where ihlabathi-iphane are mixed. Agricultural activity in Mkhubazi is primarily a semi-extensive mixed farming system, involving goat and cattle production, and cultivation of drought-resistant crops. Fields are individually owned, following allocation by the local headman on behalf of the chief. There is enough land and new fields are still being opened. The major crops grown are maize (Zea mays L.), sorghum (Sorghum bicolor (L.) Moench), pearl millet (Pennisetum glaucum (L.) R.Br.) and groundnut (Arachis hypogaea L.). Minor crops include cowpea (Vigna unguiculata (L.) Walp), Bambara groundnut (Vigna subterranea (L.) Verdc), sunflower (Helianthus annuus L.) and cotton (Gossypium hirsutum L.). Other minor crops include melons, water melons
18

Characteristics of the semi-arid farming system
(Citrullus lanatus (Thunb)), and pumpkins (Cucurbita maxima L.) that are also planted as intercrops. Current extension reports estimate Tsholotsho District crop yields to be 0.40 t ha-1 (cowpea), 0.5 t ha-1 (pearl millet), 0.70 t ha-1 (sorghum) and 0.80 t ha-1 (maize) in a normal rainy season (AREX, 2005). National average yields in smallholder farming areas are 0.30 t ha-1 for both cowpea and groundnut and 0.6 t ha-1 for cereals (Hildebrand, 1996; Ahmed et al., 1997; Nhamo et al., 2003). Livestock production includes rearing of beef cattle, goats and donkeys. The livestock census of 2005 reported the following numbers in Mkhubazi: beef cattle (3150), goats (3829), donkeys (1509) and sheep (15) (AREX, 2005). The village has the highest number of cattle and the number constitutes about 3.4 % of the total district cattle population. Livestock management involves communal grazing in the natural veld during the day and kraaling over-night during the crop production period. Communal grazing in any field is allowed after harvesting, and during the dry season. The farmers Twenty farmers were selected for resource flow mapping. A list of all the farmers was obtained from the village headman, and he was asked to classify the villagers into three wealth groups (better-resourced, medium-resourced and poorly-resourced). The main criteria of classification used by the headman were livestock ownership and farming activities. A subset of farmers was then selected from each class (7 better-resourced farmers, 6 medium-resourced and 7 poorly-resourced farmers). Initially the farmers were classified into 4 groups: very poorly-resourced, poorly-resourced, medium-resourced and better-resourced based on the results of the preliminary mapping. However subsequent reflective discussions with the group led to the classification being revised based on the groups own classification. Subsequently this led to three groups namely: poorly-resourced, medium-resourced and better-resourced. These groups were based on livestock and assets only. The type of housing was used as a criterion indicating wealth (e.g. metal roof) in the first season but it was realized that some of the better-resourced farmers within the village had thatched houses. Ownership of livestock and farm implements were the most important criteria mentioned by the farmers, hence these were included as criteria for classification. Another fifteen farmers who had no access to manure and fertilizer volunteered to carry out the legume experiments. The 15 farmers were part of a group that was involved in farmer participatory research in Mkhubazi (Carberry et al., 2004; Ncube et al., 2006).
19

Chapter 2
Resource flow mapping The resource flow mapping methods used in the study followed Defoer et al. (2000) and Esilaba et al. (2005) approaches. The definition of poorly-resourced and better-resourced covered various aspects of wealth such as ownership of livestock and farm implements and consideration was also given to a preliminary mapping exercise conducted during the dry season in 2001/02. The important role played by remittances was also explored during semi-structured interviews. The location of the households and the fields used in resource flow mapping are shown in Figure 1. Resource flow maps were drawn four times starting from the 2001/02 cropping season, although the first session was mainly to collect preliminary data. Each farm was visited in the middle of the cropping season to assess and discuss the various activities within the farm. Information collected covered issues such as the family structure, household map, ownership of livestock and farm implements, field map, farming objectives, cropping pattern (including estimates of area cultivated) and soil fertility management strategies. During the mapping exercise each farmer drew their household and a field map on the ground showing where the various components of the farm were, and where the various crops had been grown. The map was then transferred to a large sheet of paper. The seed source, nutrients applied and estimated (or harvested) yield from each crop was then noted on the map showing the various flows of nutrients and resources within the farm. The farm was then toured together with the farmer to confirm the various aspects of the farm shown on the map. In season 1 the location of each household, the fields and their extent were determined using a calibrated hand-held global positioning (GPS) unit. During the visits other aspects of the farming system such as problems (of acquiring resources, selling harvests to the markets, food insecurity) were also discussed during farmer interviews. The role played by legumes within the system and the problems they faced in growing the legumes were discussed with each of the twenty farmers. Legume experiments Experiments were set up on 15 smallholder farms starting in the 2001/02 cropping season, but results from the 2002/03 to 2004/05 season are reported. The first season was used for preliminary studies and selecting germplasm. Farmers did not have enough seed stock to be used as local varieties. As a result the experiments were
20

Characteristics of the semi-arid farming system
established using germplasm sourced by the International Crops Research Institute for the Semi-arid Tropics (ICRISAT). Each farmer was provided with a short duration cowpea variety (86D 719, 60-70 days) from the International Institute for Tropical Agriculture (IITA) and short season groundnut variety Nyanda (70-90 days) from a local seed company, Seed Co. Each farmer was also provided with fertilizer single super phosphate (SSP) applied at a rate of 12 kg P ha-1 (28 kg ha-1 P2O5); and Compound D fertiliser (7%N, 14% P2O5 and 6% K2O), applied at rate of 6 kg P ha-1. Compound D is normally not recommended for legumes because of the possibility of the nitrogen suppressing N2-fixation (Lombin et al., 1985, Giller, 2001, Nhamo et al., 2003); hence we used a lower rate of the Compound D fertilizer, to assess if legumes required starter N under these conditions. The total trial area was 1080 m2 divided into six equal plots. Half the area was planted with groundnut with the three treatments, control (0 P), Compound D (6 kg ha-1 P) and SSP (12 kg ha-1 P) and the other half was planted with cowpea with the same treatments. Each farmer was also provided with a rain gauge, which was located near the experimental plots. The farmers also received a manual (including record sheets) outlining the agreed experimental protocols in the vernacular language siNdebele. The farmers were assisted by a field assistant to fill in the record sheets. Information recorded included daily rainfall, date of fertiliser application, planting date, date of emergence, emergence count, gap filling date, weeding date, days to physiological maturity, harvest date and yield (grain and stover). Farmers could also record other observations on the manual such as problems encountered (pests and diseases). Farmers selected a uniform field previously planted with a cereal with no fertilizer applied at the start of each season. The field history was recorded and a composite soil sample (0-30 cm layer) was also taken for analysis. The soils were analysed for pH, total and available N, total and available P and organic carbon using standard methods (Anderson and Ingram, 1993). The farmers then planted the legumes at the usual time that they would normally plant their crops. Crop management followed was the farmer’s practice. At the end of each season the plots were harvested and all grain and stover weighed and sampled for moisture determination and yield calculation. Crop yields are reported at 12.5 % moisture content. Statistical Analysis Data from both the resource maps and the experiments was tested for significance using the Genstat 8.1 statistical package. Legume yields were analysed using the
21

Chapter 2
restricted maximum likelihood model (REML) method. The structure of the model finally used in the analysis of the legume yields was: Response variable: Yield Fixed model: Constant + Treatment + Season + Treatment.Season Random model: Farmer REML accounts for more than one source of variation in on-farm data and provides estimates for treatment effects in unbalanced treatment designs (Genstat Guides, Statistics. http://www.genstat.com/). Results and Discussion Rainfall Smallholder farmers in these semi-arid environments are highly dependent on seasonal rainfall amounts and patterns in their farming decisions. Figure 2 shows cumulative rainfall figures recorded in Tsholotsho over the three seasons of mapping and experimentation.
0
100
200
300
400
500
600
700
800
Oct Nov Dec Jan Feb Mar Apr May
Month
Rai
nfal
l (m
m)
2002/03
2003/04
2004/05
Long TermAverage
Figure 2 Cumulative monthly rainfall across three seasons in Tsholotsho. The solid line shows the 50 year long-term average
22

Characteristics of the semi-arid farming system
The 2002/03 season was very dry (330 mm) and far below the long-term average of 560 mm. This was followed by above average rainfall in 2003/04 of 670 mm, while the 2004/05 was also dry with total rainfall of 470 mm. Resource flow mapping and resource allocation Farmer Classes Table 1 shows farmer wealth classes, livestock numbers and major asset ownership and the average size of the family within each category. The average number of people providing farm labour per class were 5 (better-resourced class), 5 (medium-resourced class) and 4 (poorly-resourced class). The better-resourced farmer class also hired extra labour in addition to the labour available within the household. Table 1 Farmer resource classes at Mkhubazi – Tsholotsho Criteria
Better-resourced (n = 7) Medium-resourced (n = 6) Poorly-resourced (n = 7)LandAverage crop area (ha) 5.1 (0.7) 4.5 (0.7) 3.5 (0.8)
LivestockCattle 7 (1.1) 2 (0.8) 0 (0.1)Donkeys 3 (1.1) 3 (1.1) 0 (0.2)Goats 15 (4.2) 12 (4.1) 2 (1.0)Chickens 29 (3.2) 13 (3.0) 4 (1.6)
AssetsPlough 2 (0.2) 1 (0.2) 0 (0.2)Scotchcart 1 (0.2) 1 (0.2) 0 (0.1)Wheelbarrow 1 (0.2) 1 (0.2) 0 (0.1)Bicycle 2 (0.2) 1 (0.2) 0 (0.7)
Family size 9 (0.8) 7 (0.9) 6 (0.8)
Farmer Wealth Class
The numbers in brackets indicate standard errors of means. Family size includes adults and children. Livestock numbers are average numbers recorded during the 2002/03 season. Most farmers in the study area owned more than 3.5 ha of land, a contrast with farmers from the eastern part of the country where the largest farms were 3 ha in size (Mtambanengwe et al., 2005; Zingore et al., 2006). Better-resourced farmers owned the largest fields, up to 8.4 ha in size. Tsimba et al. (2000) reported average crop areas of 6.2 ha in a survey carried out in another part of the same district. In this study better-resourced farmers also owned the largest numbers of livestock with herds up to 11 cattle. The cattle numbers in the better-resourced farmer group were similar to the numbers recorded by Chibudu et al. (2001) in Mangwende (high rainfall area, 10 head of cattle) and Chivi (low rainfall area, 8 head of cattle). The average number of cattle in the better-resourced group reported by Zingore et al. (2006) in Murewa east of Zimbabwe was 10-16, while the next group (better-resourced) owned 2-9 head of
23

Chapter 2
cattle. However, Tsholotsho farmers owned much larger numbers of goats and chickens compared with the eastern parts of the country. The better-resourced households owned enough cattle and donkeys that allowed them to use two ploughs at the same time. Therefore, this group had no constraints of draught power for both farming and carrying manure. The medium-resourced class owned at least 2 head of cattle and some donkeys, and they also owned a plough and a scotch cart. The poorly-resourced farmers had many constraints. They had no cattle and donkeys, and they did not own large farm implements such as the plough and scotch cart. Therefore some of the farmers resorted to minimum tillage using hand hoes, while others waited to get draft animal power through reciprocal arrangements from extended family members or neighbours. The Mkhubazi household system consists of extended or close family units. Household sizes were larger in Mkhubazi compared with numbers in the eastern parts of the country. Family size also varied across the classes. The better-resourced farmers had larger families; hence more farm labour, while the poorly-resourced farmers had the smallest families. Consequently poorly-resourced farmers left parts of their land fallow, especially during poor rainfall seasons with limited moisture, and in a few occasions fields were abandoned, probably because of low fertility in addition to labour constraints. In wet seasons poorly-resourced farmers faced labour constraints for weeding. Resource flows Figure 3 shows representative resource flow maps of the three farmer classes, better-resourced (3a), medium-resourced (3b) and poorly-resourced (3c) drawn for a normal rainy season. Resource flows within the farming system were related to the farmer wealth classes. The total field areas do not add up to the averages for each class because all classes leave some land fallow every season, mainly because of labour constraints, and at times due to moisture limitations.
24

Characteristics of the semi-arid farming system
House
Granary
7 cattle
15 goats
Manure 500 kg 0.5 ha maize (30 kg)
1.5 ha sorghum (150 kg)
3.5 ha Pearl millet
Fertiliser 50 kg
(820 kg)
residues
a) Better-resourced farm
0.5 ha groundnut (200 kg)
1 ha maize (200 kg)
29 chickens
4 500 kg nutrients
harvest
residues
hut
Granary
2 goats
1.5 ha Pearl millet
c) Poorly-resourced farm
0.1 ha maize (30 kg)
4 chickens
(320 kg)
0.01 ha groundnut (10 kg)
0.4 ha sorghum (40 kg)
harvest
hut
House
Granary
2 cattle
12 goats
manure 500 kg 0.5 ha sorghum (80 kg) 0.5 ha groundnut
(150 kg)
2.5 ha pearl millet
(660 kg)
1 ha maize (60 kg)
13 chickens
nutrients harvest
hut
b) Medium-resourced farm
Figure 3 Resource flow maps of the three farmer classes found in Mkhubazi, Tsholotsho. The maps represent average resources and flows and crop production levels are based on a normal rainfall season (590 mm)
25

Chapter 2
Figure 3a) represents the better-resourced farmer class. The yields shown in brackets are averages of the yields obtained across the three cropping seasons. Better-resourced farmers owned an average of 7 cattle (s.e. 1.1), about 15 goats (s.e. 4.2) and an average of 3 donkeys (s.e. 1.1). About 60% of the cropped area was planted with millet annually, while about 30 % was planted with maize and sorghum. The rest of the field was planted with groundnut and Bambara groundnut. Cowpea was planted as an intercrop in the sorghum and maize portions. Seed was purchased from Bulawayo, the nearest big city, from the Tsholotsho business centre or from neighbours, although legume seed is usually retained seed. The better-resourced farmers used manure from the animals on the maize field. Better-resourced farmers also bought fertilizer especially during good rainy seasons. The farmers also applied ashes and chicken manure to fields that were closest to the homestead. All the harvest was kept for consumption by the household, and any surpluses sold only when the next cropping season promised to be good. Figure 3b) shows a medium-resourced farm situation where typical farmers owned 2 (s.e. 0.8.) head of cattle and about 12 (s.e. 4.1) goats. The farmers also planted about 90 % of the land with cereals (60 % millet, 20 % sorghum, 10% Maize). The remainder was planted with legumes, mainly groundnut. Seed purchasing patterns were similar to those reported for the better-resourced households, with households purchasing from the city and neighbours. The better-resourced and medium-resourced farmers also tried to earn income from farming by planting cash crops such as cotton, although not in all seasons. Over the three seasons a few farmers were observed growing cotton and sunflower for sale, but at the end of mapping period in 2004/2005 no farmer was growing cotton in the village anymore, due to high input costs and low selling prices. The medium class farmers also used manure but at much lower rates (maximum 1000 kg per farm per season), compared with better-resourced farmers (average 5000 kg per season per farm). Ashes were applied to field portions nearest to the homestead. All harvest was kept for home consumption, except where cash crops were grown. Figure 3c) shows a poorly-resourced farm with a lower number of flows, which are also smaller in magnitude compared with the medium-resourced and better-resourced farmers. About 90 % of the field area was planted with cereals, mostly received through an emergency relief initiative facilitated by Humanitarian Relief Agencies operating in the district such as The United Kingdom Department for International Development (DFiD), the European Commission Humanitarian Aid Office (ECHO) and German Action Aid. A small portion was planted with groundnut (< 10 %)
26

Characteristics of the semi-arid farming system
obtained from neighbours. Poorly-resourced farmers generally did not apply nutrients to their fields, except for ashes applied to the home field which was practiced by all farmer classes. Field distance from the homestead was not a critical issue in the Mkhubazi farming system; hence farmers planted major food crops even in the farthest fields (up to 3 km away). Even farmers who also owned home fields considered the main field as more important. Home fields were mainly used for growing maize and some legumes, which were eaten green, while the major grain crop (millet) was always planted in the main field. The area planted with legumes was less than 10 % in all seasons, an observation also noted in the eastern parts of the country for both high rainfall (Zingore et al., 2006) and low rainfall areas (Twomlow, 2004; Mtambanengwe and Mapfumo, 2005). In addition to crops and manure flow, some farmers in the better-resourced-class category also received remittances from husbands and relatives working in the nearest city, Bulawayo, or in neighbouring countries. Seasonal crop production Cereal production All farmers grew crops with an objective of meeting food security needs until the next harvest: consistent with the findings of Ahmed et al. (1997). Surplus yield from the previous harvest was only sold when the farmers are convinced that the current season is good. Farmers grew more cereals than any other crops across the three seasons. It was difficult to quantify grain productivity in terms of kg per ha in the smallholder farming system. The major problem being that farmers did not plant their fields in regular patterns. Production per household was however easier to compute as farmers used 50 kg and 90 kg bags to measure their shelled produce. The largest cereal producers in each season were the better-resourced farmers. Table 2 shows cereal production per farm per season and total cereal production over the three farmer classes across the three seasons.
27

Chapter 2
Table 2 Average cereal production per household wealth class across three seasons (2002 to 2005), Mkhubazi, Tsholotsho, Zimbabwe Crop/Season
Better-resourced (n = 7) Medium-resourced (n = 6) Poorly-resourced (n = 7)Millet (kg farm-1)2002/03 502 432 1072003/04 1167 1062 5742004/05 800 490 278
Sorghum (kg farm-1)2002/03 67 33 512003/04 193 111 1602004/05 207 83 87
Maize (kg farm-1)2002/03 58 0 62003/04 393 143 932004/05 99 40 0
Total cereal production kg farm-1
2002/03 466 388 1642003/04 1753 1316 6042004/05 1106 613 365
P values total cereal productionClass <0.001Season <0.001
SED for total cereal productionClass 196Season 119
Farmer Class
Cereal yields were largely determined by the rainfall received each season (Figure 1 and Table 2). The lowest yields were harvested in 2002/03, after this season all farmer classes had a grain deficit. The better-resourced farmers were able to utilise reserves from their granaries, while the medium-resourced and poorly-resourced farms required food relief assistance. Table 3 shows cereal requirements per class, total production and the deficits or surpluses incurred each season. Table 3 Cereal requirements, production and deficits/surpluses observed across three seasons at Mkhubazi, Tsholotsho Class Seaon Grain required (kg) Grain produced (kg) Deficit/surplus (kg)
Better-resourced 2002/03 1354 543 -8112003/04 1354 1753 3992004/05 1354 1106 -248
Medium-resourced 2002/03 960 465 -4952003/04 960 1316 3562004/05 960 613 -347
Poorly-resourced 2002/03 789 164 -6252003/04 789 604 -1852004/05 789 365 -424
Grain requirement figures were calculated using actual monthly grain consumption figures provided by the farmers. Yields were also based on actual yields given by the individual farmers.
28

Characteristics of the semi-arid farming system
In 2003/04 the better-resourced group had an average surplus cereal grain of about 400 kg grain after meeting their seasonal cereal food requirements. The medium-resourced farms also met their grain needs and had a 360 kg surplus. The poorly-resourced farms harvested the least grain in 2003/04, and they had a 200 kg deficit despite the good rainfall. At the end of the 2004/05 season all farmer groups had a grain deficit, 250 kg, 350 kg, and 400 kg for the better-resourced, medium-resourced and poorly-resourced class respectively. The main cereal grown by Mkhubazi farmers across the three seasons was millet constituting about 80 % of all cereal production, followed by sorghum and maize (Table 2). This is in contrast with high rainfall regions of Zimbabwe where maize is the major cereal (Zingore et al., 2006). All farmers cultivated sorghum but it constituted only about 10-30 % of the total harvest. Maize was mainly planted by the better-resourced farms, but they harvested low yields except in the 2003/04 where the total maize harvest was about 400 kg per farm. The medium-resourced and poorly-resourced farms harvested more than 50 kg maize only in the wet 2003/04 season. Legume production Legume yields showed a completely different picture (Table 4) compared with cereals. Legumes were grown on less than 10 % of the area in almost all farms. Groundnut was the major legume produced, but only by the better-resourced farms, who harvested more than 100 kg in all three seasons.
29

Chapter 2
Table 4 Average legume production per household wealth class across three seasons (2002 to 2005), Mkhubazi, Tsholotsho, Zimbabwe Crop/Season
Better-resourced (n = 7) Medium-resourced (n = 6) Poorly-resourced (n = 7)Groundnut (kg farm-1)2002/03 148 37 242003/04 362 40 02004/05 280 42 12
Cowpea (kg farm-1)2002/03 2 1 52003/04 54 13 52004/05 21 2 3
Bambara (kg farm-1)2002/03 10 14 02003/04 149 133 02004/05 79 91 14
Total legume production kg farm-1
2002/03 137 44 292003/04 484 186 42004/05 380 134 29
P values total legume productionClass 0.002Season NS
SED for total legume productionClass 103Season 129
Farmer Class
NS – not significant Contrary to current belief of research and extension that cowpea is the most planted legume in smallholder farms (Madamba et al., 2001), this study found the opposite. The legume was the least planted and most farms recorded zero yields even from the little that was planted. Bambara groundnut yields were highest (about 150 kg) during the wetter season in 2003/04 in the medium-resourced and better-resourced farms. The poor yields in the dry seasons were probably a result of moisture limitation. The poorly-resourced farmers harvested no Bambara groundnut at all, despite the crop being a traditional legume considered to be highly resistant to drought. We tried to elucidate the reasons for such limited legume cultivation and productivity by interviewing individual farmers about legume problems during the last season (2004/05) of resource flow mapping (Figure 4).
30

Characteristics of the semi-arid farming system
0
10
20
30
40
50
60
70
80
90
100
Lack ofseed
Rodents(cowpea)
Drought Aphids Otherpests
% re
port
ed
Figure 4 Reasons for limited production of grain legumes in Mkhubazi, Tsholotsho (n = 20). Interviews were carried out at the end of the 2004/05 cropping season Lack of seed was cited as one of the major reasons for not growing legumes (85 % of respondents) in Mkhubazi. This is consistent with conclusions made long before, which indicated lack of germplasm as one of the major problems faced by smallholder farmers in Zimbabwe (Shumba, 1983, Hildebrand, 1996, Twomlow, 2004). Legumes such as Bambara groundnut and groundnut are large seeded and therefore need high seeding rates. Combined with the high cost of legume seed this might be the real barrier to farmers planting larger areas with legumes, especially in the absence of better market linkages to sell the surplus production. Those farmers who planted small areas of legumes also reported major problems with rodents during the 2004/05 season, especially in cowpea. However, it appeared the rodent problem was a rare outbreak. Other pests such as leaf eaters and cutworms were also a problem. Aphids and drought problems were reported by less than 20 % of the farmers. None of the farmers mentioned poor soil fertility as a problem in legume production. This is in contrast with findings of Waddington et al. (2001) and Mupangwa et al. (2005) who reported poor soil fertility as a major reason for poor groundnut production in smallholder farms in eastern Zimbabwe. Soil fertility management strategies Soil fertility management strategies followed by the Mkhubazi farms confirmed the poor soil fertility management crisis reported by Mapfumo and Giller (2001). Inorganic fertilizer use was negligible within the farming system. Only two farmers in
31

Chapter 2
the better-resourced and medium class categories reported using basal fertilizer once (Compound D) during the three seasons of mapping. Ammonium nitrate was applied as top dressing by three of the better-resourced farmers during the wetter 2003/04 season at average rates of around 50 kg ha-1. These results indicate a worsening situation as far as fertilizer use is concerned. Ahmed et al. (1997) reported limited use of chemical fertilizer in 1995; ten years later the situation seems to be the same or even getting worse. Farmers said they could not buy fertiliser because it was not locally available, and when it was available it could only be bought in 50 kg bags which were too expensive. All farmers in the three classes reported applying their household ashes to the home fields, although the amounts were difficult to quantify, as the application of the ashes was not systematic. Some farmers also threw the ashes into rubbish pits. Manure was the major organic source of nutrients used by the better-resourced and medium-resourced farms (Figure 5 a). The manure was applied at average seasonal amounts of 5 tonnes per farm for the better-resourced farms, up to 1 tonnes per farm for medium-resourced class and negligible amounts in the poorly-resourced farms. Farmers reported applying manure to fields that had shown signs of poor fertility such as the yellowing of leaves in cereal crops. This is in contrast with farmers in high rainfall areas who applied large amounts of manure to fields that were closer to the homesteads (Zingore et al., 2006). Maize was always planted in fields that had received manure that season in Mkhubazi, although 2 farmers in the better-resourced class also applied manure to sorghum. Millet never received manure directly, but only when the crop was grown in rotation with maize, which had previously received manure. Manure was never used on legumes. Virtually no manure was used by farmers in the poorly-resourced class, although one poorly-resourced farmer reported that she picked cow dung from around the dip tank in one season. Chicken manure was used in the small vegetable gardens of some farmers, but due to water shortage little was grown in the gardens in the dry season. The amount of manure applied showed a large inter-annual variability (Fig 5a). The amount of available manure was highest during the dry 2002/2003 season whereas it was lowest in the relatively wet 2003/2004 season. The main reason for the low manure in 2003/04 was due to insufficient production during the drier 2002/03 season. In very dry seasons farmers graze their animals far away from the village in the forest for up to three months before the start of the rainy season. Most of the manure
32

Characteristics of the semi-arid farming system
produced is thus dropped in the forest; hence farmers collect less manure after a dry season. Crop residues were primarily grazed in situ by livestock from the whole village; hence all farms exported both the grain and stover out of their fields. However, better-resourced and medium-resourced farms did carry a proportion (about 50 %) of the maize residues to the homestead for dry season feeding of livestock, when kraaled at night. This practice is not carried out by poorly-resourced household who lacked draught animals for transport. Calculations of the total N and P applied per season using N and P content values measured by Ncube et al. (2006) showed that the better-resourced farms were applying up to a maximum of 50 kg N per farm per season (Figure 5 b). The medium-resourced and poorly-resourced classes however applied less than 10 kg. The P source was also manure, hence the trends were similar to manure (Figure 5 c), although the amounts applied were low (less than 10 kg). Total N applied decreased across the seasons. The large amount of N used in the 2003/04 season was due to more N fertilizer purchased for top-dressing during the good season. In 2002/03 the better-resourced class had a large positive N balance due to the large amounts of manure applied, while the medium-resourced and poorly-resourced groups had slightly negative N balances (Table 5). The favourable N balances were also due to reduced uptake by crops as almost all farmer groups harvested low crop yields. However in a wetter season (2003/04) all of the farmer classes had strongly negative N balances due to the greater production and removal. In 2004/05 the medium-resourced class had the worst N balance indicating that the rates of manure applied by the group was not enough to replenish the soil N that season
33

Chapter 2
a) Manure
2002/03 2003/04 2004/05
Tota
l N a
pplie
d (k
g)
0
1000
2000
3000
4000
5000
6000Better-resourcedMedium-resourcedPoorly-resourced
b) Nitrogen
2002/03 2003/04 2004/050
10
20
30
40
50
60
c) Phosphorus
Season
2002/03 2003/04 2004/050
2
4
6
8
10
Man
ure
appl
ied
(kg)
Tota
l pho
spho
rus
appl
ied
(kg)
Figure 5 Manure (a), total N (b) and total P (c) applied by the different farmer resource classes across the seasons, Mkhubazi Tsholotsho. Calculations of N and P content were based on manure analysis results reported by Ncube et al. (2006). The error bars represent standard errors of differences between farmer classes
34

Characteristics of the semi-arid farming system
The partial N balance showed that the medium-resourced and poorly-resourced farms were mining the soil every season (Table 5). Table 5 Partial N balance for the Mkhubazi farmer classes
Season Better-resourced (n = 7) Medium-resourced (n = 6) Poorly-resourced (n = 7)
2002/03 N applied (kg) 51 10 1N removed (kg) 16 16 5Partial Balance (kg) 25 -4 -6
2003/04 N applied (kg) 37 6 0N removed (kg) 59 44 24Partial Balance (kg) -25 -38 -23
2004/05 N applied (kg) 26 1 1N removed (kg) 37 21 12Partial Balance (kg) -11 -20 -11
Wealth class
The partial balance calculations are based on nutrients supplied by manure and fertilizer only and the values are calculated per average farm in each wealth class. The figures do not include contributions from soil mineralization and atmospheric deposition. Legume experiments Soils Soil chemical characteristics of the Mkhubazi fields used in the legume experiments are shown in Table 6. The soils were poor in organic carbon, available N (nitrate) and P (Olsen) and pH was low. The home fields and main fields did not show any consistent differences in chemical characteristics. Table 6 Soil characteristics of the Mkhubazi fields used for legume experimentation across three seasons
Season Field Type Soil Type pH C (%)Total N
(%)Nitrate N
(mg kg-1)Total P
(%)Olsen P (mg kg -1)
2002/03 Home Sandy 4.7 0.32 0.03 0.87 0.005 0.04Main Sandy 4.9 0.38 0.03 0.62 0.010 0.07
2003/04 Home Sandy 5.8 0.31 0.05 2.24 0.010 0.02Main Sandy 5.1 0.37 0.04 3.87 0.004 0.06
2004/05 Home Sandy 4.8 0.26 0.06 2.72 0.020 0.09Main Sandy 5.0 0.20 0.02 2.00 0.010 0.17
Fpr. Field Type 0.597 0.229 0.046 0.788 0.057 0.257Season 0.339 <0.001 0.340 <0.001 <0.001 0.003
Legume grain yields Groundnut grain and stover yields were significantly different (P<0.001) across the three cropping seasons, but no significant differences were observed between fertilizer
35

Chapter 2
treatments. Both Compound D and SSP gave similar yields in each season (Figure 6a). Groundnut grain yields were below the national average 0.3 t ha-1 (Nhamo et al., 2003) at the end of the 2002/03 cropping season, which had the lowest rainfall. For the above average (2003/04) rainfall season groundnut yields were higher than the district average (0.4 t ha-1), with again no significant differences between the three treatments. This was an indication that water was the most limiting resource for legumes in the Mkhubazi soils and therefore the groundnuts were responding more to moisture than to P application. Only in the wet year, when water was less limiting, there was an indication that the groundnuts responded to P fertilizer. This is in agreement with Mapfumo and Giller (2001) who reported that farmers in two districts in dry western Zimbabwe ranked rainfall as the most limiting factor in crop production.
b) Cowpea
0
0.2
0.4
0.6
0.8
1
1.2
2002/03 2003/04 2004/05
Gra
in y
ield
t ha
-1
Control Cpd SSP
a) Groundnut
0
0.2
0.4
0.6
0.8
1
1.2
2002/03 2003/04 2004/05
Gra
in Y
ield
t ha
-1
Control Cpd SSP
Figure 6 Groundnut (a) and cowpea (b) grain yield across 3 seasons at Mkhubazi, Tsholotsho. The error bars represent standard errors of differences between means of the fertilizer treatments.
36

Characteristics of the semi-arid farming system
The trend in the average grain yield of cowpea across the three seasons was similar to that of groundnut, but cowpea yields were higher (Figure 6b). The cowpea grain and stover yields were significantly different across the three seasons (P<0.001) and in all three seasons the grain yields were higher than the national smallholder farmer average of 0.3 t ha-1. P fertilizer significantly increased (P<0.05) cowpea grain yield. More of the yield increase was explained by the initial soil conditions (soil pH, soil N and soil P) in the random REML model in the statistical analysis. Nhamo et al. (2003) reported an average yield of 0.27 ton ha-1 cowpea grain yield in semi-arid Zimuto in Zimbabwe under granitic sands (the rates of P applied were not given). Elsewhere Ntare and Bationo (1992) reported substantial grain and fodder yield increase when P was applied to the cowpea varieties under Sahelian conditions with similar rainfall (560 mm) to Tsholotsho. Results of both groundnut and cowpea yield indicated that above average legume production is possible in semi-arid Tsholotsho despite seasonal moisture limitations. The results also concur with the opinion of the resource flow farmers that soil fertility is not one of the main causes of low legume productivity in this environment. Conclusions There was great variability within the Tsholotsho farming system in terms of wealth status. Better-resourced farmers had more livestock and farm implements, while the poorly-resourced had none, although all farmers, irrespective of their wealth status, shared a common goal in farming, chiefly household food security. The main driver of the Tsholotsho farming system is rainfall. Farmers base their farming decisions on the quality of the rainfall season. Farmers said they would only sell surpluses from the previous season harvests provided the current rainy season looks good during the planting period. Soil fertility management in Tsholotsho was dependent on manure as the major source of nutrients. Fertilizer was used less because of the high cost and unavailability locally. Manure was applied by the better-resourced and medium-resourced farms at varying rates (1000 and 5000 kg per season per farm respectively); poorly-resourced farmers applied very little or none at all. The amount of manure available showed a large inter-annual variability. This is because of the variation in the grazing system followed by the farmers, where in a dry season most manure is lost because the animals are kept in far away grazing lands. Potential sources of nutrients such as
37

Chapter 2
residue management, termitaria and leaves were not utilised, probably because farmers are not aware of the benefits of these sources. Overall there was inadequate nutrient replacement in all farms, so that soil mining is depleting soil nutrient reserves. In the long run the system will probably face more serious productivity problems, especially the poorly-resourced households who already face perennial food deficits. Legumes were grown in very small areas within the system, with lack of seed and markets for the produce being major problems. Introducing new groundnut and cowpea varieties into the system has potential. Farmers harvested up to 1 t ha-1 of improved groundnut Nyanda in a good rainfall season (2003/04). It is clear that coping strategies of households depend to a large extent on remittances, on possibilities to buy, or directly earn food from so called food for work schemes, and on food handouts during drought years. Further research considering the potential strategies for developing sustainable production systems within the context of the extended livelihoods of the rural households (Giller et al., 2006) are urgently required to address the problems of food security in semi-arid parts of the country and the region. References Ahmed M M, Rohrbach D D, Gono L, Mazhangara E, Mugwira L, Masendeke D D
and Alibaba S 1997 Soil fertility management in communal areas of Zimbabwe: current practices, constraints and opportunities for change. Results of a diagnostic survey. Southern and Eastern Africa Region. Working Paper no 6. PO Box 776, Bulawayo, Zimbabwe.
Balasubramanian V, Singh L and Nnadi L A 1980 Effect of long-term fertilizer treatments on groundnut yield, nodulation, and nutrient uptake at Samaru, Nigeria Plant Soil 55, 171-180.
Briggs L and Twomlow S 2002 Organic material flows within a smallholder highland farming system of South West Uganda. Agric. Ecosyst. & Environ. 89, 191-212.
Carrberry P, Gladwin C and Twomlow S J 2004 Linking Simulation Modeling to Participatory Research in Smallholder Farming Systems. In: Delve R J and Probert M E (eds.) 2004 Modelling Nutrient Management in Tropical Cropping Systems. ACIAR Proceedings No. 114. 138pp.
38

Characteristics of the semi-arid farming system
Carsky R J 2003 Response of cowpea and soybean to P and K on terr de barre soils in southern Benin. . Agric. Ecosyst. & Environ. 100.
Cox F R and Barnes J S 2002 Peanut, corn, and cotton critical levels for phosphorus and potassium on Goldsboro soil. . Comminic. Soil Sci. and Plant Anal. 33
Defoer T 2002 Learning about methodology development for integrated soil fertility management. Agric. Syst. 73, 57-81.
Defoer T, De Groote H, Hilhorst T, Kante S and Budelman A 1998 Participatory action research and quantitative analysis for nutrient management in southern Mali. a fruitful marriage? Agriculture Ecosystems & Environment 71, 215-228.
District Agricultural Extension Officer. 2005. Agricultural Research and Extension (AREX) Office, Fact Sheet. P.O. Box 72. Tsholotsho. Zimbabwe.
Esilaba A O, Nyende P, Nalukenge G, Byalebeka J B, Delve R J and Ssali H 2005 Resource flows and nutrient balances for crop and animal production in smallholder farming systems in eastern Uganda. Agric. Ecosyst. & Environ. 109, 192-201.
GenStat Release 8.1. 2005. GenStat Procedure Library Release PL16. Lawes Agricultural Trust. Rothamsted Experimental Station.
Giller K E 2001 Nitrogen Fixation in Tropical Cropping Systems. Wallingford, UK, CAB International.
Giller K E, Rowe E C, de Ridder N and van Keulen H 2006 Resource use dynamics and interactions in the tropics: Scaling up in space and time. Agric. Syst. 88, 8-27.
Gosh P K, Wanjari R H, Mandal K G, Hati K M and Bandyopadhyay K K 2002 Recent trends in inter-relationship of nutrients with various agronomic practices of field crops in India. J. Sust. Agric. 21, 47-77.
Hella J P, van Huylenbroeck G and Mlambiti M E 2003 Small farmers' adaptive efforts to rainfall variability and soil erosion problems in semiarid Tanzania. J. Sust. Agric. 22, 19-38.
Hilderbrand G L 1996 The status of technologies used to achieve high groundnut yields in Zimbabwe. In: Gowda, G.L.L., Nigam, S.N., Johansen, C., and Renard, C. (eds.). 1996. Achieving high groundnut yields: proceedings of an international workshop, 25-29 Aug 1995. Laixi City, Shandong, China (in En summaries in En, Ch.), Patancheru 502 324, Andra Pradesh, India: International Crops Research Institute for the Semi Arid Tropics, 300pp. ISBN 92-9066-350-2. Order Code CPE 105. .
Hilhorst T and Muchena F 2000 Nutrients on the move: Soil fertility dynamics in African farming systems. International Institute for Environment and Development, London. pp146.
39

Chapter 2
Lombin G, Singh L and Yayock L Y 1985 A decade of fertilizeer research on groundnuts (Arachis hypogea) in the savannah zone of Nigeria. . Fert. Res. 6 157-170.
Madamba R, Mwashaireni A and Soko T 2001 A guide to pulse production in Zimbabwe. Ministry of Lands, Agriculture and Rural Resettlements. Department of Research and Specialists Services. Zimbabwe Government, Harare.
Mapfumo P and Giller K E 2001 Soil Fertilty Management Strategies and Practices by Smallholder Farmers in Semi Arid Areas of Zimbabwe. International Crops Research Institute for the Semi Arid Tropics (ICRISAT) with permission from the Food and Agricultural Organization (FAO). Bulawayo, Zimbabwe and Rome, Italy. 60p.
Mtambanengwe F and Mapfumo P 2005 Organic matter management as an underlying cause for soil fertility gradients on smallholder farms in Zimbabwe. Nut Cycl Agroecosyst 73, 227-243.
Mupangwa W T and Tagwira F 2005 Groundnut yield response to single superphosphate, calcitic lime and gypsum on acid granitic sandy soil. Nut Cycl Agroecosyst 73, 161-169.
Ncube B, Dimes J P, Twomlow S, Mupangwa W and Giller K E 2006 Raising the productivity of smallholder farms under semi-arid conditions by use of small doses of manure and nitrogen: A case of participatory research.. Nut Cycl Agroecosyst (Published online: DOI: 10.1007/s10705-006-9045-7)
Nhamo N, Mupangwa W, Siziba S, Gatsi T and Chikazunga D 2003 The role of cowpea (Vigna unguiculata) and other grain legumes in the management of soil fertility in the smallholder farming sector of Zimbabwe. In: Waddington S R (ed.) 2003. Grain legumes and green manures for soil fertility in Southern Africa: Taking stock of progress. Proceedings of a conference held 8-11 October 2002 at the Leopard Rock Hotel, Vumba, Zimbabwe. Soil Fert Net and CIMMYT-Zimbabwe, Harare, Zimbabwe. 246pp.
Ntare B R and Bationo A 1992 Effects of phosphorus on yields of cowpea cultivars intercropped with pearl millet on Psammentic paleustalf in Niger. Fert. Res. 32 143-147.
Okalebo R J, Gathua K W and Woomer P L 1993 Laboratory Methods of Soil and Plant Analysis: A Working Manual. Soil Science Society of East Africa. Marvel EPZ. Nairobi, Kenya.
Rohrbach D D 2001 Zimbabwe baseline: crop management options and investment priorities in Tsholotsho. In: Twomlow SJ, Ncube B (eds) Improving soil management options for women farmers in Malawi and Zimbabwe:
40

Characteristics of the semi-arid farming system
Proceedings of a Collaborators Workshop on DFID-supported project Will Women Farmers Invest in Improving their Soil Fertility? Participatory Experimentation in a Risky Environment, 13–15 September 2000, ICRISAT-Bulawayo, Zimbabwe. International Crops Research Institute for the Semi Arid Tropics, Bulawayo, Zimbabwe, pp 57–64
Roy R N, Misra R V, Lesschen J P and Smalling E M 2003 Assessment of soil nutrient balance. Approaches and methodologies. FAO Fertilizer and Plant Nutrition Bulletin 14 Food and Agriculture Organization of the United Nations, Rome.
Ryan J G and Spencer D C 2001 Challenges and opportunities shaping the future of the semi-arid tropics and their implications. Draft White paper, March 2001. Patencheru, A. P. 502324, India: International Crops Research Institute for the Semi-Arid Tropics.pp 143.
Scoones I 1997 Landscapes, Fields and Soils: Understanding the History of Soil Fertility Management in Southern Zimbabwe J. South Afric. Stud. 23, 615–634.
Scoones I 2001 Transforming soils: the dynamics of soil-fertility management in Africa. Pp. 1-44 in: Scoones, I. (ed.) Dynamics and Diversity: Soil Fertility and Farming Livelihoods in Africa. London: Earthscan.
Shumba E M 1983 Factors contributing to a decline in groundnut production in Mangwende –Murehwa District, and the need for a technical research input Zim. Agric. J. 80, 251-255.
Tittonell P, Vanlauwe B, Leffelaar P A, Rowe E C and Giller K E 2005 Exploring diversity in soil fertility management of smallholder farms in western Kenya - I. Heterogeneity at region and farm scale. Agric Ecosyst. Environ 110, 149-165.
Tittonell P, Vanlauwe B, Leffelaar P A, Shepherd K D and Giller K E 2005 Exploring diversity in soil fertility management of smallholder farms in western Kenya - II. Within-farm variability in resource allocation, nutrient flows and soil fertility status. Agric Ecosyst. Environ 110, 166-184.
Twomlow S J 2004 Increasing the role of legumes in smallholder farming systems - The future challenge, p29-46 In: Serraj R (ed). Symbiotic Nitrogen Fixation: Prospects for Application in Tropical Agroecosystems. Science Publishers, NH, USA
Vanlauwe B, Bationo A, Carsky R J, Diels J, Sanginga N and Schulz S 2003 Enhancing the contribution of legumes and biological nitrogen fixation in cropping systems: Experiences from West Africa. In: Waddington, S.R., (ed.) 2003. Grain legumes and green manures for soil fertility in Southern Africa: Taking stock of progress. Proceedings of a conference held 8-11 October 2002 at the Leopard Rock Hotel, Vumba, Zimbabwe. Soil Fert Net and CIMMYT-Zimbabwe, Harare, Zimbabwe. 246pp.
41

Chapter 2
Waddington S R and Karigwindi J 2001 Productivity and profitability of maize plus groundnut rotations compared with continuous maize on smallholder farms in Zimbabwe. Exp. Agric. 37, 83-98.
Zingore S, Murwira H K, Delve R J and Giller K E 2006 Influence of nutrient management strategies on variebility of soil fertility, crop yields and nutrient balances on smallholder farms in Zimbabwe. Agric Ecosyst. Environ (in press).
42

CHAPTER 3
Raising the productivity of smallholder farms under semi-arid conditions by use of small doses of manure and nitrogen: a case of participatory research
B Ncube, J P Dimes, S J Twomlow, W Mupangwa and K E Giller Nutrient Cycling in Agroecosystems (Published online: DOI: 10.1007/s10705-006-
9045-7)


3. Raising the productivity of smallholder farms under semi-arid conditions by use of small doses of manure and nitrogen: a case of participatory research
Abstract Participatory on-farm trials were conducted for three seasons to assess the benefits of small rates of manure and nitrogen fertilizer on maize grain yield in semi-arid Tsholotsho, Zimbabwe. Two farmer resource groups conducted trials based on available amounts of manure, 3 t ha−1 (low resource group) and 6 t ha−1 (high resource group). Maize yields varied between 0.15 t ha−1 and 4.28 t ha−1 and both absolute yields and response to manure were strongly related to rainfall received across seasons (P < 0.001). The first two seasons were dry while the third season received above average rainfall. Maize yields within the seasons were related to N applied and other beneficial effects of manure, possibly availability of cations and P. In the 2001–2002 season (total rainfall 478 mm), application of 3 and 6 t ha−1 of manure in combination with N fertilizer increased grain yield by about 0.14 and 0.18 t ha−1, respectively. The trend was similar for the high resource group in 2002–2003 although the season was very dry (334 mm). In 2003–2004, with good rainfall (672 mm), grain yields were high even for the control plots (average 1.2 and 2.7 t ha−1). Maize yields due to manure applications at 3 and 6 t ha−1 were 1.96 and 3.44 t ha−1, respectively. Application of 8.5 kg N ha−1 increased yields to 2.5 t ha−1 with 3 t ha−1 of manure, and to 4.28 t ha−1 with 6 t ha−1 of manure. In this area farmers do not traditionally use either manure or fertilizer on their crops, but they actively participated in this research during three consecutive seasons and were positive about using the outcomes of the research in future. The results showed that there is potential to improve livelihoods of smallholder farmers through the use of small rates of manure and N under semi-arid conditions. Keywords: Cattle manure, maize yields, nitrogen fertilizer, on-farm research, smallholder farming Introduction Poor soil fertility is the fundamental biophysical cause of declining per capita food production on smallholder farms in Africa (Sanchez 2002). Recommendations for nutrient management, and in particular fertilizer use technologies, have rarely been implemented by smallholder farmers (Dimes et al. 2004a, b). High costs of fertilizers, lack of credit, delays in the delivery of fertilizers and poor transport and marketing infrastructure serve as disincentives to fertilizer use by smallholder farmers (Buresh
45

Chapter 3
and Giller 1998). As a result, fertilizers are sparsely used, grain yields and per capita food production are declining, and food security is worsening, particularly in the extensive semi-arid areas of Africa. The poor adoption of improved fertility management methods is attributable to several reasons, including: (i) inappropriate recommendations that fail to consider rainfall risks and investment capacity of smallholder farmers, (ii) blanket recommendations that overlook the spectrum of farming objectives and returns on investment that typifies smallholder farming systems, and (iii) inappropriate marketing of fertilizers to smallholder farmers (Dimes et al. 2004a, b). Several authors have made the case for fertility options rather than blanket recommendations that do not take into account the local variability in soil fertility (Giller et al. 2006) and largely ignore socio-economic factors (Ahmed et al. 1997; Rohrbach 1999; Snapp et al. 2003). In semi-arid areas of Zimbabwe the soils are inherently infertile and have a low potential to sustain agricultural production under continuous cultivation (Mapfumo and Giller 2001). The soils are particularly deficient in nitrogen, phosphorus and sulphur and the soil fertility on smallholder farms in Zimbabwe continues to decline (Hikwa et al. 2001). Maintenance of soil fertility is the key to sustaining productivity of smallholder agriculture in sub-Saharan Africa (Brinn et al. 1999). The nutrient resource most readily available to smallholder farmers is cattle manure although the small nutrient contents of manures makes them poorly effective in improving crop yields (Mugwira and Murwira 1997, 1998). One of the greatest research challenges is to develop technologies that are effective within farmer resource constraints, resource levels and acceptable risk (Snapp et al. 1998, 2003). Recent research emphasizes options that combine mineral fertilizer and organic manures (Ahmed et al. 1997; Palm et al. 2001; Nyathi et al. 2003; Snapp et al. 2003). Research approaches are also required that help to build quality farmer–researcher partnerships using participatory research methods that can make technology testing more realistic (Snapp et al. 2003). Smallholder farmers are more likely to accept the results and recommendations of research if they have been engaged in developing the recommendations under their farming environment. However, site and season specificity of on-farm experimentation remains an issue in interpretation and extrapolation of results, and the case for simulation modelling as an analytical tool in participatory research, especially in the area of fertility management, has been documented (Rohrbach 1999; Dimes et al. 2002a) and applied in smallholder farming systems in Africa (Shamudzarira et al. 2000; Dimes et al. 2002b). Carberry et al. (2004) reported the use of a simulation model with farmers and researchers at
46

Use of small doses of manure and nitrogen fertiliser
Tsholotsho, Zimbabwe, to explore the climatic risks associated with the application of various crop management technologies and as an aid to designing farmer experimentation. In this paper, we report the results of the ensuing 3 years of participatory research in developing and testing recommendations for improving soil fertility. The main objective of the participatory research was to develop strategies for improving maize yield under farmer conditions in semiarid environments, by combining low rates of manure and mineral nitrogen fertilizer. A further objective was also to assess farmer participation dynamics and how successful engaging farmers could be in developing soil fertility management strategies. Materials and methods Site characteristics Rainfall On-farm trials were conducted in Tsholotsho District, southwestern Zimbabwe. Tsholotsho is located in Natural Farming Region IV. This natural farming region is characterized by semi-arid climatic conditions and annual uni-modal rainfall of between 450 mm and 650 mm (long-term average, 590 mm). The duration of the rainy season is from October/November to March/April and is typically characterized by sporadic, heavy rainstorms, with periodic dry spells. It is followed by a cool to warm dry season from May to September. Soils On farm trials were carried out in two adjacent villages of Tsholotsho District, namely Mahangule and Mkhubazi. The two villages have similar soils and vegetation. The most common soil type is the deep ( > 150 cm) Kalahari sand (Ustic Quartzipsamment, 93% sand, 4% clay, 3% silt, in the 0–11 cm layer) originating from Aeolian sand parent material (Moyo 2001). The farmers commonly refer to the soil by its local name, ihlabathi. Other soils in the area include Aridic Haplustalfs (local name, iphane) and mixed ihlabathiand iphane though these are not common. The pH (0.01 M CaCl2) of the soils was slightly acidic (5.5–5.8 in the 0–11 and 11–30 cm, respectively), organic carbon content less than 1%, and cation exchange capacity (CEC) less than 5 cmolc kg−1. Base saturation was 56% in the 0–11 cm layer. Exchangeable Ca, Mg, Na and K in the 0–11 cm layer were 0.9, 1.2, 0.07 and 0.33 cmolc kg−1, respectively (Moyo 2001).
47

Chapter 3
Farming System The farming system in Mkhubazi and Mahangule (generally referred to as Mkhubazi) is semi-extensive mixed farming, involving goat and cattle production, and cultivation of drought resistant crops. Both crop and livestock productivity in the smallholder-farming sector is poor (Hikwa et al. 2001). The farmers grow maize (Zea mays L.), sorghum (Sorghum bicolor (L.) Moench) and pearl millet (Pennisetum glaucum (L.) R.Br.) as the major cereal grain crops. Maize and sorghum are normally planted with the first rains from around mid-November. Normal fertility management practice is to apply amendments (mainly manure) to the maize crop, and plant sorghum the following season (Carberry et al. 2004). Groundnut (Arachis hypogaea L.), Bambara groundnut (Vigna subterranea (L.) Verdc.) and cowpea (Vigna unguiculata (L.) Walp.) are the three legumes grown, but areas sown to legume each season are generally small (Ahmed et al. 1997), and legumes receive less than 5% of the applied nutrients (Mapfumo and Giller 2001). Background to the participatory action research The Mkhubazi farmer group had worked together with researchers since 1999. In 2001, farmers and researchers jointly participated in using a simulation model (APSIM, Keating et al. 2002) to assess the climatic risks associated with the application of various crop management technologies in the farmers’ cropping system (Carberry et al. 2004). Following this interaction, the majority (22 out of 26) of the farmers were keen to carry out experiments using cattle manure and small rates of fertilizer. Out of the 22 farmers, 11 had manure available. At the beginning of the 2001–2002 cropping season, on-farm trials were established to test maize response to small doses of manure, with and without small rates of N fertilizer. The farmers divided themselves into two groups; a lower resource group (LRG) that could afford one cart of manure per ha (equivalent to ten standard wheel barrows full of manure), and a higher resource group (HRG) that could afford two carts per ha (20 wheel barrows). When the amounts were translated to rates they were equivalent to 3 t ha−1 (one cart) and 6 t ha−1 (two carts) of manure, respectively. It should be noted that while this division reflected the relative resource capacities of the farmers in the group, the manure application rates were substantially lower than existing extension recommendations; 10 t ha−1 applied annually or 40 t ha−1 applied every 4 years in high rainfall areas and 8–20 t ha−1 for semi-arid areas (Mapfumo and Giller 2001), hence, the use of the term ‘small’ in describing the manure applications. In 2001–2002, the lower resource group consisted of four farms, increasing to eight farms in the second
48

Use of small doses of manure and nitrogen fertiliser
and third cropping seasons. The higher resource group consisted of seven farms throughout. Farmers selected parts of their fields for experimental plots. They were asked to select plots that had previously been planted with a cereal with no fertility inputs, on a relatively uniform soil. The plot size was agreed after lengthy discussions with the farmers who had raised concern about typical research plots, which they considered too small. The farmers unit of area measurement was an acre and they agreed on a total plot size of one quarter of an acre (0.1 ha), which they could weed and harvest in one day. The experimental design was agreed with the farmers and began as simple paired plots during the 2001–2002 cropping season. Each farmer hosted one replicate of the experiment according to the resource group to which they belonged. At the end of each cropping season the results for each group member were presented and discussed. This generated debate as the farmers discussed lessons learnt and possible explanations for the results. From these meetings farmers came up with more ideas for further experimentation, hence the number of treatments increased each season. Plot sizes were reduced but were still substantially larger than typical research plots. Table 1 summarizes the development of the experiments and the changes in treatments from the first to the third season. Table 1 Experimental treatments applied in each season from 2001 to 2004. Season 1 (2001-2002) Season 2 (2002-2003) Season 3 (2003-2004)
1. Manure only 2. Manure + low
rate ammonium nitrate* at a rate of 25 kg ha-1 (8.63 kg N)
1. Manure only 2. Manure + AN at 25
kg ha-1 (8.63 kg N) 3. Recommended
rates: 150 kg ha-1
Compound D* (10.5 kg N) and 150 kg ha-1 AN (51.75 kg N)
4. Control
1. Manure only 2. Manure + AN at 25 kg
ha-1 (8.63 kg N) 3. Recommended rates
basal Compound D+ AN each 150 kg ha-1 (total 62.25 kg N)
4. Control 5. Low rates Compound
D and AN each 25 kg ha-1 (total 12.13 kg N)
6. High rate of compound D and low rate of AN (total 19.13 N)
*Ammonium Nitrate contains about 35% N, Compound D contains 7% N, 6% P and 6% K. Treatment plot sizes decreased as the number treatments increased, but total trial plot area remained 0.1 ha per farm. In season one the treatments consisted of paired plots treated with small doses of manure. The HRG applied 6 t ha−1 while the LRG applied 3 t ha−1. The manure was
49

Chapter 3
applied in November prior to ploughing. To one of the paired plots, 25 kg ha−1 ammonium nitrate (AN, 35% N) was applied as top-dressing at approximately 4–6 weeks after planting. Twenty-five kg ha−1 of ammonium nitrate was the amount of fertilizer that farmers agreed they could afford to buy. In the second season, the number of plots increased to four (total area remained 0.1 ha) after the farmers realized that during the first season there was no control treatment for comparison, although in some cases surrounding crop areas could be used for comparison. A fertilizer treatment was also included to show how the manure treatments compared with the recommended fertilizer practice. Two further treatments were added in the third season. A plot with recommended rate of Compound D (containing 7%, 6% and 6% of N–P–K, respectively) and a small rate of AN, and another plot with small rates of both AN and Compound D. At this stage the farmers better understood the research process and these treatments were added in order to increase the number of options from which the farmers could choose. Trial protocol The maize seed variety planted each season was a short season hybrid recommended for the dry regions. In year 1 and 2 this was SC401, and in year 3, SC403. Farmers were provided with the appropriate amounts of seed and fertilizer. The varieties are available to the farmers for purchase every season. The farmers were also provided with rain gauges and a field manual prepared for the project, outlining the agreed experimental methods, which were translated into the local language during the first season. Each manual guided the farmers on record keeping (rainfall, activity date, problems and any other relevant information). A locally recruited field assistant provided further support throughout the season. Apart from site selection, pegging and training on fertilizer application, all other activities, such as land preparation (farmers plough using the ox-drawn moldboard plough), manuring, planting, weeding and pest control were undertaken by the farm household following their normal farm management practice. At the end of the season, farmers were assisted in harvesting the experimental plots and weighing the maize grain and stalk yields. A sub-sample of 3–4 maize plants and cobs per treatment plot was taken for moisture determination in the laboratory and in the third season the samples were also analysed for N and P uptake. Grain yields are reported at 12.5% moisture content. In seasons 2 and 3, soil samples were collected from the experimental plots to determine organic carbon, nitrogen and phosphorus. The experimental plot was divided into a grid of three equal sections. Soil samples were then collected in the 0–30 cm layer, from three equally distributed points within each section using sampling tubes. A composite sample was then created by thoroughly mixing and sampling each
50

Use of small doses of manure and nitrogen fertiliser
time until about 1.5 kg of soil had been collected. Organic carbon, total N, total and available P were analysed using methods outlined by Okalebo et al. (1993). Soil nitrate-N was determined using the colorimetric method of Anderson and Ingram (1993). In addition a sample of each farmer’s manure was taken in each season to determine total and available N and P, and organic carbon (OC). The number of fields harvested within each resource group varied across the three seasons. The reduction in the number of harvested fields was mainly due to crop failure as a result of low rainfall, and an increase was due to the expansion of the group as new members joined. Table 2 shows the numbers of farms within the resource groups, the number of harvested farms within each group and the location of the harvested fields for that season (main, home). A home field is smaller in area (about 0.2–1 ha) compared with the main field, and it is usually located just behind the homestead. The main field is usually a distant field (up to 5 km away from the homestead) and the whole field can be in excess of 5 ha in area. Some farmers own 8 ha of land as main fields. Table 2 Number of farms, field types and maize crops harvested in the respective farmer resource groups each season
Lower Resource Farms
2001/02 4 1 (0 **) 3 (3) 7 6 (4) 1 (1)2002/03 8 3 (0) 5 (3) 7 6 (3) 1 (1)2003/04 8 3 (3) 5 (4) 7 6 (4) 1 (1)
No. FarmsField Type
Main Home
Higher Resource Farms
Season No. FarmsField Type
Main Home
** Numbers in brackets represent the number of fields harvested from the respective field types Statistical analysis The maize yield data were analysed using the method of residual maximum likelihood (REML) included in the statistical software package Genstat 6.1. The choice of REML was based on the fact that the model includes fixed and random factors, accounts for more than one source of variation in the data and provides estimates for treatments effects in unbalanced treatment designs. The on-farm data met these criteria. In the REML linear mixed models, two model components need to be defined. The random model component defines the random terms, while the fixed model component defines the systematic or fixed terms. Random factors can be included in either the random or the fixed model component, depending on the objective of the analysis (Genstat Guides, Statistics. http://www.genstat.com/). Season was included in the fixed model so that differences between seasons could be tested.
51

Chapter 3
The dialogue box in Genstat 6.1 for the REML Linear Mixed Model requires that both the fixed and the random model terms be defined, respectively. Hence, these terms are defined in the following paragraphs that show the structure of the statistical analyses. The models were defined following Genstat notation and syntax. There were four statistical analyses, one analysis for the two manure treatments that were present over the three seasons (Figure. 2), and one analysis for each season (Table 5 and Figures. 3, 5, 6) that included the corresponding treatments, respectively. The linear mixed model, used to analyse the seasonal effects on the two manure treatments that were present across all three seasons (Table 1) had the following components and terms: Response: Yield Fixed model: Constant + Resource Group + Treatment + Season + Resource Group . Treatment + Resource Group . Season + Treatment . Season + Resource Group . Treatment . Season Random model: Farmer + Field location (type) + Relative planting date Because the set of treatments was not the same for each season (Table 1) the REML linear mixed model was used to analyse the data for each season separately, and the terms in the model were defined as: Response: Yield Fixed model: Constant + Resource Group + Treatment + Resource Group . Treatment Random model: Farmer + Field Location + Relative planting date Soil type and previous crop were tested as random variables but were not significant in accounting for any of the unexplained variability. The results of the statistical analyses are also shown as standard errors of differences in the graphs. Results Field characteristics and manure quality Home fields for the LRG had larger organic carbon content than main fields but lower soil pH (Table 3). For this sample of farmers’ fields, the measured parameters indicated slightly better soil fertility status for the LRG farms compared with that of the HRG farms. However, all soils had a low content of organic matter (< 0.6% C) and
52

Use of small doses of manure and nitrogen fertiliser
total N (≤ 0.04% N) and thus had a poor capacity to supply N for crop growth. The manures used in experiments had N contents consistently below 1% and are considered to be of poor nutrient quality (Murwira et al. 1998). Table 3 Chemical characteristics of the soil from the experimental fields and the manure belonging to the different farmer resource groups.
Field Type C (%) % N % P pH (H2O) C (%) %N % P pH (H2O)
Low Resource Group (3 t ha-1
manure)Home 0.53 0.03 0.03 5.0 5.4 0.38 0.08 8.8
Main 0.49 0.04 0.03 5.4
High Resource Group (6 t ha-1
manure)Home 0.38 0.04 0.03 4.8 7.3 0.51 0.1 9.1
Main 0.51 0.04 0.03 6.2
Resource Group Soil (0-30cm depth) Manure
Rainfall Total rainfall and its seasonal distribution varied considerably between the three cropping seasons (Figure 1). The first cropping season (2001–2002) started well with average rainfall pattern for October to December, but then there was a 3 month dry spell, and despite above average rainfall in April, seasonal rainfall was substantially below average at 478 mm. The second cropping season (2002–2003) was the driest overall with a total rainfall of only 334 mm, attributable to an almost dry post-sowing January, coupled with an early end to the rainfall in February. The third season (2003–2004) was the most favourable for crop growth with an above average total of 672 mm. Although there was below average rainfall from October to December, rainfall was above average in each of the subsequent months up to and including April.
53

Chapter 3
0
100
200
300
400
500
600
700
800
Oct Nov Dec Jan Feb Mar Apr
Month
Rai
nfal
l (m
m) 2001/02
2002/032003/04Long Term Average
Figure 1. Cumulative total rainfall for three seasons from 2001 to 2004 in Tsholotsho District, Zimbabwe. The long-term average total precipitation is 590 mm per annum. Experimental results and farmer evaluation Harvested plots A total of 116 observed plots were harvested over the three experimental seasons (Table 4). A summary of the average yields obtained from the different treatments across the three seasons for both the LRG and the HRG is given in Table 5. The HRG harvested more plots during the dry seasons (2001–2002 and 2002–2003) compared with the LRG. Table 4 Harvested plots per season, farm and treatment
Season LRG HRG
Total harvested
Plots
Treatment Farms Harvested Plots Treatment FarmsHarvested
Plots2001-2002 2 3 6 2 5 10 16
2002-2003 4 3 12 4 4 16 28
2003-2004 6 7 42 6 5 30 72
Total 13 60 14 56 116
54

Use of small doses of manure and nitrogen fertiliser
Table 5 Summary of maize grain yields from the different treatments across the three cropping seasons
Season TreatmentLRG HRG Treatment Manure rate Treatment Manure rate
2001-2002 Manure only 0.18 0.44Manure + N 0.32 0.62 < 0.001 0.075 0.053 0.084
2002-2003 Manure only 0.06 0.62Manure + N 0.05 0.77High D, high N 0.04 0.80Control 0.04 0.91 0.057 <0.001 0.098 0.190
2003-2004 Manure only 1.96 3.44Manure + N 2.50 4.28High D, high N 3.07 4.06Control 1.26 2.76High D, low N 2.11 3.37Low D, low N 1.81 3.00 <0.001 0.014 0.239 0.725
Mean maize grain yield (t ha-1) P value sed
Performance of maize yield for the farmer resource groups across the seasons As the manure only and manure with N treatments were tested in each of the three seasons, a comparison of maize grain yield across the three seasons was done for these treatments for the two farmer resources groups (Figure. 2). In the third season, which had above average rainfall, maize yields were in excess of 2 t ha−1, significantly higher (P < 0.001) than the average yields in the previous seasons that had below average rainfall and severe mid-season drought periods. In seasons 2 and 3, maize yields in the fields of the HRG farmers were significantly larger than yields in the fields of the LRG farmers (P < 0.01), but this was not the case in season 1. The soil chemical properties could not explain the yield difference because there were no significant soil chemical differences between LRG and HRG fields. However, the HRG farmers applied twice as much manure as farmers in the LRG. Also, the HRG manure contained more N, 0.51% N compared with the LRG manure which contained 0.38% N (Table 3). It is likely that the difference in manure quantity and quality resulted in better yield for the HRG. The difference in yield was also probably a result of different management of the crops between the two farmer resource groups and the interaction of management with rainfall distribution.
55

Chapter 3
0.36 0.38
2.20
0.500.90
4.20
0.0
0.5
1.0
1.5
2.0
2.5
3.0
3.5
4.0
4.5
5.0
2001/02 2002/03 2003/04
Gra
in Y
ield
(t h
a-1)
Low Resource Group High Resource Group
n=3 n=5
n=7
n=5
n=3 n=4
Figure 2. Mean seasonal maize grain yield for the manure and manure + N treatments, Mkhubazi 2001-2004. Error bars represent standard errors of differences between the predicted means of the manure by season yields. In the first season both LRG and high HRG farmers planted at about the same time, by early December. All farms were similarly affected by the good December rainfall for plant establishment and the subsequent three-month dry spell which severely limited grain yield. By contrast, in the second season, farmers in the HRG tended to have planted by early December and those in the LRG by mid- to late-December. This difference in planting date resulted in beneficial and detrimental post-sowing rainfall conditions for the respective crops, culminating in some grain yield for the HRG crops in a severely below average rainfall season, and almost no yield for the LRG crops. Conversely, in the third season, the high resource farms mostly sowed their fields at the end of December 2003 and the growth of their crops coincided with 4 months of above average rainfall, whereas the low resource farms had mostly planted by early December, and experienced post-sowing moisture stress through December causing set-backs to crop growth. The low resource farms probably planted earlier in the third season because of the early planting benefits that they had seen in high resource farms during the second season. However, it appears the high resource farms based their planting decisions on other issues, probably weather forecasts from the radio; hence they planted at a more optimal time in all the three seasons. Further management differences between the farmer resource groups were observed for weeding and fertilizer operations in the 3rd season as well. For example, the high resource farms tended to carry out weeding (av. 5 days) and fertilizer application (av. 12 days) earlier than the low resource group and this undoubtedly contributed to the much better crop yields achieved by the HRG in this particular season.
56

Use of small doses of manure and nitrogen fertiliser
Performance of fertility treatments and farmer evaluations in each season Season 1. Application of cattle manure alone produced maize grain yields of 0.18 and 0.44 t ha−1 for the 3 and 6 t ha−1 rates, respectively, in the first cropping season (Figure 3). Addition of a small rate of N fertilizer as top dressing (8.6 kg N ha−1) significantly increased grain yields to 0.32 and 0.62 t ha−1 (P < 0.001) at the two rates of manure application. This represents an 82% and 41% grain yield increase in a season with severe moisture stress. Grain yield did not differ significantly between manure application rates (P = 0.075), and there was no interaction between manure rates and fertilizer treatments. However, maize in the surrounding fields where no manure or fertilizer had been applied produced very little or no grain yield in this season.
0.18
0.44
0.32
0.62
0.0
0.1
0.2
0.3
0.4
0.5
0.6
0.7
3 6
Manure applied (t ha-1)
Gra
in Y
ield
(t h
a-1)
Manure only Manure+Low N
n=5
n=3
n=5
n=3
Figure 3. Mean maize grain yield from Mkhubazi, Tsholotsho, 2001/02 season. The two levels of manure applied represent the low (3 t ha-1) and high (6 t ha-1) resource groups. Error bars represent standard errors of differences between means of the treatments. The observed yield differences in the first season are largely explained in terms of the amount of N applied in the manure and fertilizer treatments (Figure 4). The relationship between yield and N applied suggests that the maize crops were responsive to N inputs, the N applied had an agronomic use efficiency (AUE) of 18 kg grain per kg of N applied, and that manure-N was as readily available to the crops as the fertilizer-N. While the latter may be unexpected, it is probably related to the dry
57

Chapter 3
seasonal conditions such that crop demand for N was weak and readily met from the organic manure source.
0.0
0.2
0.4
0.6
0.8
1.0
0 10 20 30 40 50
N applied (kg ha-1)
Gra
in Y
ield
(t h
a-1)
-2.3*10-4 x2+0.02x+0.1
R2 = 0.13
0.0
0.2
0.4
0.6
0.8
1.0
0 10 20 30 40 50
N applied (kg ha-1)
Gra
in Y
ield
(t h
a-1)
-2.3*10-4 x2+0.02x+0.1
R2 = 0.13
Figure 4. Maize grain yield response to N applied, Mkhubazi 2001/02 season. Farmers evaluated the yield results at the end of the first season during the report back and planning meetings. Both groups of farmers agreed that the application of manure increased grain yield and the yield was even better when the crop was top dressed with nitrogen fertilizer. The farmers however said they needed to repeat the trials, but that they should include a control plot because it was not yet clear how good the technology was against a zero input comparison. It was also agreed that there was need to include the recommended fertilizer practice to see how it would compare with the manure treatments. Season 2. The second season (2002–2003) was very dry (Figure 1) and this resulted in poor maize grain yields, particularly in the LRG farms, which harvested very little grain (Figure 5). Three out of eight farms in the LRG harvested grain yields ranging between 22 kg ha−1 and 93 kg ha−1 ( <50 kg ha−1 on average). Four out of seven farms
58

Use of small doses of manure and nitrogen fertiliser
in the HRG managed to harvest grain and the yields were slightly higher than the yields obtained from the 2001–2002 season. Due to the severe drought conditions, no fertility treatment produced a maize yield significantly greater (P = 0.057) than the control for either resource group. The average grain yield of the control plots in the HRG was 619 kg ha−1, compared with 795 kg ha−1 (manure only), 905 kg ha−1 (manure + N) and 774 kg ha−1 (high D, high N) from the other treatments. The yield differences were related more to the activity calendars followed by the farmers during the season.
0.04 0.06 0.05 0.04
0.62
0.80
0.90
0.77
0.00.10.20.30.40.50.60.70.80.91.0
Control Manure only Manure+Low N High D, high N
Gra
in Y
ield
(t h
a-1)
Low Resource Group High Resource Group
LRG (n=3)HRG (n=4)
Figure 5. Mean maize grain yield, Mkhubazi 2002/03 season. The low resource group (3 t ha-
1) yields were close to zero, mainly due to low rainfall (Figure 1). Error bars represent standard errors of differences between means of the treatments. When the results were discussed with the farmers at the end of the season they all wanted to repeat the trials. However, the farmers also decided to vary the recommended fertilizer treatment to look at combinations of low and high rates of starter and top-dress fertilizers (Table 1). Season 3. As reported earlier, with good rainfall (672 mm), the observed maize yields in the third season were considerably higher than the previous two drought-affected seasons (Figure 6). This is seen in the high grain yields achieved for the control treatment (average 1.26 and 2.76 t ha−1) of each resource group.
59

Chapter 3
1.26
1.96
2.50
1.812.11
3.072.76
3.44
4.28
3.00
3.37
4.05
0.0
0.5
1.0
1.5
2.0
2.5
3.0
3.5
4.0
4.5
5.0
Control Manure only Manure+Low N Low D, low N High D, Low N High D, high N
Gra
in Y
ield
(t h
a-1)
Low Resource Farms High Resource Farms
LRF (n=7)HRF (n=5)
Figure 6. Mean maize grain yield, 2003/04 season, Mkhubazi. Error bars represent standard errors of differences between means of the treatments. Application of manure alone at either 3 or 6 t ha−1, produced significantly higher grain yields (1.96 and 3.44 t ha−1, P = 0.014) compared with the control plots. As in the previous two seasons, top-dressing the manure with 25 kg ha−1 AN increased grain yields relative to manure alone, but this increase was statistically significant only for the HRG farms in this season. In the LRG, manure alone produced an average yield of 1.96 t ha−1 compared to 2.50 t ha−1 when AN was used as top dressing. In the HRG the manure only treatment produced 3.44 t ha−1 while the manure + N treatment produced 4.28 t ha−1. For both resource groups, yields with the recommended fertilizer treatment were not significantly greater than the yields achieved with the manure + AN treatment. As with the maize responses in season 1, the observed yield responses in the third season can be explained largely in terms of the amount of N applied in the manure and fertilizer treatments (Figure 7). However, with the better rainfall and greater N inputs the overall relationship was slightly stronger (R 2 = 0.19 for HRG and R 2 = 0.26 for LRG) reflecting the larger amounts of N applied in the third season compared with seasons 1 and 2. It is striking that high yields in the third season were achieved with no inputs and the maize yields were consistently larger for farmers in the HRG (Figure 7). An explanation for the good yields without inputs is probably the accumulation of N (and other nutrients) in the soil following the restricted crop uptake in the previous two dry seasons. For example, measured nitrate-N amounts in the surface 30 cm of soil at the start of the 2003–2004 season, although relatively small for both sets of farms (8–
60

Use of small doses of manure and nitrogen fertiliser
12 kg NO3-N ha−1), were nevertheless 2–3 times the amount measured at the start of the second cropping season in the same soil layer. The amounts of mineral N in the 0–30 cm soil layer at the start of this season relative to measured grain N of 32–45 kg ha−1 in the control treatments indicates that there must have been significant amounts of readily mineralizable organic N in the soil, or that nitrate-N accumulated below 30 cm, or a combination of these two conditions.
0.0
1.0
2.0
3.0
4.0
5.0
6.0
7.0
0 10 20 30 40 50 60
N applied (kg ha-1)
Gra
in Y
ield
(kg
ha-1
)
Low Resource Group High Resource Group
y = 9*10-4x2 + 0.09x + 2.33
R2 = 0.19
y = 7*10-4x2 + 0.07x + 1.22
R2 = 0.26
Figure 7. Maize grain yield response to N applied, 2003/04 season. The consistently larger maize yields across all treatments for the HRG farmers is most probably related to the more favourable management factors of planting date, weeding and fertilizer applications as described earlier. In addition to the positive effects of management the HRG also benefited from the additional N content from the manure. The higher rate of manure probably improved the availability of other nutrients (base cations and micronutrients) and the soil physical properties. At the end of the third season focus group discussions were carried out to get farmer feedback. When the results were presented all the maize farmers confirmed that manure was a beneficial amendment in their cropping system. This contrasted to earlier findings of Ahmed et al. (1997) who found that 60% of farmers in the Tsholotsho district did not apply available manure to their fields because they perceived negative effects from using
61

Chapter 3
manure; low crop yields and increased weeds combined with constraints in applying manure to croplands. In our study farmers agreed that the application of ammonium nitrate as top dressing was a definite advantage, further increasing their maize grain yields. Farmers expressed satisfaction with the technology and they requested the researchers to source ammonium nitrate fertilizer in affordable small packs and make it available in their local trade stores. They confirmed that their neighbours had also copied the technology having observed the benefits during field days and they were also convinced that the manure/ammonium nitrate technology worked. The group asked if there were other technologies that they could move to because they had gained enough knowledge on manure and fertilizer over the three seasons. Discussion The participatory action research strategy demonstrated an interest by farmers in testing small doses of fertilizer N in combination with manure. The research remained within the resource capacity of the farmers, below the recommended rates that they could not afford. The process combined both research and adoption, a possible measure of the impact of the technologies. Continued evaluation of results with farmers led to the inclusion of large rates and combinations of small and large rates of fertilizer in comparison with the low rates of manure and fertilizer, therefore increasing options for the farmers. The process showed that there is a valid argument in encouraging research to focus on technologies that take into account farmer’s constraints and improve farmer’s capacity to adapt technologies to their own situations (Snapp et al. 2003; Dimes et al. 2004a, b). Grain yield across the seasons was closely related to the rainfall amount and pattern as observed by researchers in other regions of Zimbabwe (Piha 1993; Piha et al. 1998). This is not surprising in this moisture-limited environment. With good rainfall, maize crops responded strongly to the application of the recommended fertilizer treatment, producing the greatest yield for the LRG farms (3.07 t ha−1) and the second largest for the HRG farms (4.06 t ha−1). The yield results in the third season in Mkhubazi were however high for both resource groups compared with the reported average yields of less than 0.6 t ha−1 for cereal grain crops in Zimbabwe (Ahmed et al. 1997). The good yields were mostly explained by the combined response to nitrogen applied and available water from rainfall during the growing season. The application of small rates of starter (Compound D fertilizer) and top-dress fertilizer increased grain yield by an average of 0.40 t ha−1 compared
62

Use of small doses of manure and nitrogen fertiliser
with the control plots. Given the substantial increase in the amount of P added with the recommended Compound D treatment (21 kg P ha−1 compared to 3.5 kg P at the small rate of Compound D), the results suggest that the soils can supply the relatively small demand of P (and K) required to give these relatively small maize yields. The calculated average agronomic nitrogen use efficiencies (AUE) were 53 and 31 kg grain per kg of N applied during the third season for the LRG and HRG farms, respectively. The third season was preceded by two dry seasons, therefore it can be concluded that the good N availability in the third season was due to the N applied, plus extra N probably accumulated in the soil during the previous two seasons. Our results clearly demonstrate that N is the major limiting nutrient on the Kalahari sands in this environment, but there are also clear interactions with other factors as demonstrated by the manure treatments. The AUE increased significantly for the manure only or manure + N fertilizer treatments. For the manure + N fertilizer treatment the AUE values were 58 and 72 kg grain per kg of N applied for the LRG and HRG farms, respectively. There is no clear explanation as to why the manures gave such remarkable AUEs compared with other fertilizers. Previous studies also showed strong responses to manure in Tsholotsho sands and Murwira et al. (2001) reported 2.5 t ha−1 maize yields when applying 3 and 6 t ha−1 of amended pit and heap treated manure. But they did not explain the responses in terms of nutrient supply. In high rainfall areas high responses to manure have also been reported (Murwira et al. 1998; Waddington and Karigwindi 2004). The results from this study have shown that the yield responses were probably not related to P effects, as the soils did not seem to be P limited. Studies carried out in the past attributed the manure effects to an increase in cation availability with manure in soils on granitic sands (Grant 1967). The benefits of manure providing other nutrients are probably also important in the Kalahari sands. In this uncertain rainfall environment the small N doses in combination with manure outperformed high doses of mineral N fertilizer across the three seasons. Similar benefits of N top-dressing with manure application have been found for maize production in Zimbabwe on granitic sands (Grant 1976; Thiessen 1979; Chikowo et al. 2004) and elsewhere in Africa (Carsky et al. 1998; Sherchan et al. 1999; Roose and Barthes 2001). Thus we confirm earlier findings that manure is a good substitute for basal fertilizer in this environment. Our results also indicate that the current blanket recommendations of 52.5 kg N ha−1 are inappropriate for the low rainfall regions and that future recommendations for fertilizers and manure should take into account the wide variability in potential yields.
63

Chapter 3
The fact that grain yield across the seasons was closely related to the rainfall amount and pattern, raises more research questions. How often will the respective fertility responses be likely in this environment, and how can we anticipate such responses? These questions become more difficult as the maize responses were also influenced by management factors such as timing of sowing, fertilizer application and weeding, and that these varied with the two resource groups and also interacted with the rainfall pattern. Clearly, the three years of experimentation are inadequate in this regard but can provide the basis for further exploration of these interacting effects using modelling. The initial experiments (small amounts of manure and fertilizer) were the outcome of using a simulation model with farmers (Carberry et al. 2004), which suggested that under good management conditions small doses of fertilizer and manure would give reliable increases in productivity. The outcome of the experiments showed that the model predictions were reliable. There are food security benefits to farmers when manure and fertilizer are used in small rates. However, there is still need to model the results over a long period to see if the technologies are sustainable in the long run. We are currently testing the models’ capability in reproducing the observed field responses under circumstances of different rainfall, soil and management conditions. In conclusion the work has shown that low input technologies can work through the participation of smallholder farmers. Therefore, there is a need to continue exploring technologies that are targeted to the smallholder farmers, which have the potential to improve their food security. References Ahmed MM, Rohrbach DD, Gono LT, Mazhangara EP, Mugwira L, Masendeke DD,
Alibaba S 1997 Soil fertility management in communal areas of Zimbabwe: current practices, constraints and opportunities for change. Southern and Eastern Africa Region Working Paper No. 6. PO Box 776, ICRISAT, Bulawayo, Zimbabwe, 27 pp
Anderson JM, Ingram JSI 1993 Tropical soil biology and fertility: a handbook of methods, 2nd ed. CAB International, Wallingford UK, 221 pp
Brinn P, Dorward A, Hilhorst T, Keeley J, Scoones I, Sutherland A 1999 Soil fertility management and sustainable rural livelihoods: new approaches to the policy process. Natural Resources Institute, Chatham
64

Use of small doses of manure and nitrogen fertiliser
Buresh RJ, Giller KE 1998 Strategies to replenish soil fertility in African smallholder agriculture. In: Waddington SR, Murwira HK, Kumwenda JDT, Hikwa D, Tagwira F (eds) Soil fertility research for maize-based farming systems in Malawi and Zimbabwe. Proceedings of the Soil Fert Net Results and Planning Workshop held from 7 to 11 July 1997 at Africa University, Mutare, Zimbabwe. Soil Fert Net and CIMMYT-Zimbabwe, Harare, Zimbabwe, pp 13–19
Carberry P, Gladwin C, Twomlow SJ 2004 Linking simulation modeling to participatory research in smallholder farming systems. In: Delve RJ, Probert ME (eds) Modelling nutrient management in tropical cropping systems. ACIAR Proceedings No. 114. ACIAR, Canberra, pp 32–46
Carsky RJ, Nokoe S, Lagoke STO, Kim SK 1998 Maize yield determinants in farmer-managed trials in the Nigerian Northern Guinea Savanna. Exp Agric 34:470–422
Chikowo R, Mapfumo P, Nyamugafata P, Giller KE 2004 Maize productivity and mineral N dynamics following different soil fertility management practices on a depleted sandy soil in Zimbabwe. Agric Ecosyst Environ 102:119–131
Dimes J, Muza L, Malunga G, Snapp S 2004a Trade-offs between investments in nitrogen and weeding: On-farm experimentation and simulation analysis in Malawi and Zimbabwe. In: Friesen DK, Palmer AFE (eds) Integrated approaches to higher maize productivity in the New Millennium: Proceedings of the Seventh Eastern and Southern Africa Regional Maize Conference, 11–15 February, 2001. CIMMYT (International Maize and Wheat Improvement Center) and KARI (Kenya Agricultural Research Institute). Nairobi, Kenya, pp 452–456
Dimes J, Twomlow S, Rusike J, Gerard B, Tabo R, Freeman A, Keatinge JDH 2004b Increasing research impacts through low-cost soil fertility management options for Africa’s drought-prone areas. International Symposium for Sustainable Dry land Agriculture Systems. International Crops Research Institute for the Semi Arid Tropics (ICRISAT) December 2 to 5, 2003. Sahelian Center, Niamey, Niger
Dimes J, Twomlow S, Carberry P 2002a Application of APSIM in smallholder farming systems in the semi-arid tropics. In: Bontkes TS, Wopereis MCS (eds) A practical guide to decision-support tools for smallholder agriculture in sub-Saharan Africa. International Center for Soil Fertility and Agricultural Development (IFDC). Africa Division BP 4483, Lomé Togo, pp 85–99
Dimes J, Shamudzarira Z, Myers RJK 2002b Employing new tools in INRM: linking simulation models and participatory research in smallholder farming systems.
65

Chapter 3
Special Proceedings of INRM workshop. August 28–31, 2001. CIAT, Cali, Colombia
Giller KE, Rowe EC, de Ridder N, Van Keulen H 2006 Resource use dynamics and interactions in the tropics: Scaling up in space and time. Agric Syst 88:8–27
Grant PM (1967) The fertility of sandveld soil under continuous cultivation. Part II: the effect of manure and nitrogen fertilizer on the base status of the soil. Rhod Zam Mal J Agric Res 5:117–128
Grant PM 1976 Peasant farming in infertile sands. Rhodesia Sci News 10:252–256 Hikwa DNP, Mugwira LM, Mushambi CF 2001 Integrated soil fertility development
for resource-poor farmers in Zimbabwe. The Research and Development Strategy beyond 2001. Harare Zimbabwe, Department of Research and Specialist Services, 48 pp
Keating BA, Carberry PS, Hammer GL, Probert ME, Robertson MJ, Holzworth D, Huth NI, Hargreaves JNG, Meinke H, Hochman Z, McLean G, Verburg K, Snow V, Dimes JP, Silburn M, Wang E, Brown S, Bristow KL, Asseng S, Chapman S, McCown RL, Freebairn DM, Smith CJ 2002 The Agricultural Production Systems Simulator (APSIM): its history and current capability. Euro J Agron 18:267–288
Mapfumo P, Giller KE 2001 Soil fertility management strategies and practices by smallholder farmers in semi arid areas of Zimbabwe. Bulawayo, Zimbabwe and Rome, Italy, International Crops Research Institute for the Semi Arid Tropics (ICRISAT) with permission from the Food and Agricultural Organization (FAO), 60 pp
Moyo M 2001 Representative soil profiles of ICRISAT research sites. Chemistry and soil research. Institute Soils Report No A666. AREX, Harare Zimbabwe, 97 pp
Mugwira LM, Murwira HK 1997 Use of cattle manure to improve soil fertility in Zimbabwe: past and current research and future research needs. Soil Fertility Network Research Results CIMMYT Maize Program and Natural Resources Group. Network Research Results. Working Paper No. 2. Harare, Zimbabwe, 33 pp
Mugwira LM, Murwira HK 1998 A review of research on cattle manure as a soil fertility amendment in Zimbabwe: some perspectives. In: Waddington, SR, Murwira HK, Kumwenda JDT, Hikwa D, and Tagwira F (eds) Soil fertility research for maize-based farming systems in Malawi and Zimbabwe. Proceedings of the Soil Fert Net Results and Planning Workshop held from 7 to 11 July 1997 at Africa University, Mutare, Zimbabwe. Soil Fert Net and CIMMYT-Zimbabwe, Harare, Zimbabwe, pp 195–201
66

Use of small doses of manure and nitrogen fertiliser
Murwira HK, Mutiro K, Nhamo N, Nzuma JK 2001 Research results on improving use of cattle manure in Tsholotsho and Shurugwi in Zimbabwe. In: Twomlow SJ, Ncube B (eds) Improving soil management options for women farmers in Malawi and Zimbabwe: Proceedings of a Collaborators Workshop on DFID-supported project Will Women Farmers Invest in Improving their Soil Fertility? Participatory Experimentation in a Risky Environment, 13–15 September 2000, ICRISAT-Bulawayo, Zimbabwe. International Crops Research Institute for the Semi Arid Tropics, Bulawayo, Zimbabwe, pp 57–64
Murwira HK, Tagwira F, Chikowo R, Waddington SR 1998 An evaluation of the agronomic effectiveness of low rates of cattle manure and combinations of inorganic N in Zimbabwe. In: Waddington SR, Murwira HK, Kumwenda JDT, Hikwa D, Tagwira F (eds) Soil fertility research for maize-based farming systems in Malawi and Zimbabwe. Proceedings of the Soil Fert Net Results and Planning Workshop held from 7 to 11 July 1997 at Africa University, Mutare, Zimbabwe. Soil Fert Net and CIMMYT-Zimbabwe, Harare, Zimbabwe, pp 179–182
Nyathi P, Kimani SK, Jama B, Mapfumo P, Murwira HK, Okalebo JR, Bationo A 2003 Soil fertility management in semi arid areas of East and Southern Africa. In: Gichuru MP, Bationo A, Bekunda MA, Goma HC, Mafongoya PL, Mugendi DN, Murwira HM, Nandwa SM, Nyathi P, Swift MJ (eds) Soil fertility management in Africa: a regional perspective. Academy Science Publishers, Nairobi, Kenya, pp 219–252
Okalebo RJ, Gathua KW, Woomer PL 1993 Laboratory methods of soil and plant analysis: a working manual. Soil Science Society of East Africa. Marvel EPZ Nairobi, Kenya
Palm CA, Gachengo CN, Delve RJ, Cadisch G, Giller KE 2001 Organic inputs for soil fertility management in tropical agroecosystems: application of an organic resource database. Agric Ecosyst Environ 83:27–42
Piha MI 1993 Optimizing fertilizer use and practical rainfall capture in a semi-arid environment with variable rainfall. Exp Agric 29:405–415
Piha M, Machikicho J, Pangenyama W 1998 Evaluation of a fertilizer-based soil management package for variable rainfall conditions in communal areas of Zimbabwe. In: Waddington SR, Murwira HK, Kumwenda JDT, Hikwa D, Tagwira F (eds) Soil fertility research for maize-based farming systems in Malawi and Zimbabwe. Proceedings of the Soil Fert Net Results and Planning Workshop held from 7 to 11 July 1997 at Africa University, Mutare, Zimbabwe. Soil Fert Net and CIMMYT-Zimbabwe, Harare, Zimbabwe, pp 223–228
67

Chapter 3
Rohrbach DD 1999 Linking crop simulation modelling and farmers participatory research to improve soil productivity in drought-prone environments. In: Risk management for maize farmers in drought-prone areas of Southern Africa. Proceedings of a Workshop, 1–3 Oct 1997, Kadoma Ranch, Zimbabwe. DF: CIMMYT, Mexico, pp 1–3
Roose E, Barthes B 2001 Organic matter management for soil conservation and productivity restoration in Africa: a contribution from Francophone research. Nut Cycl Agroecosyst 61:159–170
Sanchez PA 2002 Soil fertility and hunger in Africa. Science 295(5562):2019–2020 Shamudzarira Z, Waddington S, Robertson MJ, Keating BA, Mushayi PT, Chiduza C,
Grace P 2000 Simulating N fertiliser response in low-input farming systems 1. Fertiliser recovery and crop response. Risk Management Working Paper Series 00/05, No. 720. CIMMYT, Mexico DF
Sherchan DP, Pilbeam CJ, Gregory PJ 1999 Response of wheat–rice and maize/millet systems to fertilizer and manure applications in the mid-hills of Nepal. Exp Agric 35:1–13
Snapp SS, Mafongoya PL, Waddington S 1998 Organic matter technologies for integrated nutrient management in smallholder cropping systems of southern Africa. Agric Ecosyst. Environ 71:185–200
Snapp SS, Blackie MJ, Donovan C 2003 Realigning research and extension to focus on farmers’ constraints and opportunities. Food Pol 28:349–363
Thiessen RJ 1979 Socio-economic factors involved in the profitable cropping of worked out granite soils in tribal communities. Rhod Agric J 76:27–43
Waddington SR, Karigwindi J 2004 Longer-term contribution of groundnut rotation and cattle manure to the sustainability of maize-legume smallholder systems in sub-humid Zimbabwe. In: Friesen DK, Palmer AFE (eds) Integrated approaches to higher maize productivity in the new millennium: Proceedings of the Seventh Eastern and Southern Africa Regional Maize Conference, 11–15 February 2001, Nairobi Kenya: CIMMYT (International Maize and Wheat Improvement Center) and KARI (Kenya Agricultural Research Institute). pp 338–342
68

CHAPTER 4
Productivity and residual benefits of grain legumes to sorghum grown in rotation under semi-arid conditions in south-western Zimbabwe
Bongani Ncube, Steve J. Twomlow, Mark T. van Wijk, John P. Dimes, Ken E. Giller
(Submitted to Plant and Soil)


4. Productivity and residual benefits of grain legumes to sorghum grown in rotation under semi-arid conditions in south-western Zimbabwe
Abstract The productivity and residual benefits of four grain legumes to sorghum (Sorghum bicolor) grown in rotation were measured under semi-arid conditions over three cropping seasons. Two varieties of each of the grain legumes: cowpea (Vigna unguiculata); groundnut (Arachis hypogaea); pigeonpea (Cajanus cajan); Bambara groundnut (Vigna subterranea), and sorghum were grown in the first season. The same experiment was initiated three times in different, but adjacent fields. In the subsequent season the original plots were split into two, and residues were either removed or incorporated into the subplots at the end of the season. The following season sorghum was planted in all subplots. In 2002/03 (314 mm rainfall) cowpeas produced the largest dry grain yield (0.98 and 1.36 t ha-1) among the legumes. In the wetter 2003/04 season (650 mm rainfall) groundnut varieties had the highest yields (0.76 and 1.02 t ha-1). In 2004/05 (301 mm rainfall) most legume yields were less than 0.5 t ha-1, except for the two pigeonpea varieties. Estimates of % N from N2-fixation from the legumes were 15–50% (2002/03), 16–61% (2003/04) and 29–83% (2004/05). Soil water changes during the legume phase were also related to legume variety. Sorghum grain yield after legumes reached 1.62 t ha-1 in 2003/04, more than double the sorghum after sorghum rotation yields. In 2004/05, sorghum yields after legumes were also higher (up to 1.26 t ha-1) than sorghum after sorghum. Incorporation of crop residues had no additional beneficial effect on sorghum yield in either of the two seasons. The beneficial effect of legumes on yields of the subsequent sorghum crop were more readily explained by improvements in soil nitrogen supply than by the small observed changes in soil water relations in both seasons. Our results demonstrate clear potential for increasing grain legume cultivation in semi-arid environments, which will also have positive effects on sorghum production. Keywords: cereal, food security, nitrogen fixation, residues, soil water
Introduction
In many semi-arid regions of sub-Saharan Africa farmers sow their fields with monocultures of cereal crops such as sorghum (Sorghum bicolor (L.) Moench) and millet (Pennisetum glaucum (L.) R.Br.), with sparse intercropping and irregular crop
71

Chapter 4
rotations. Continuous cultivation with a lack of fallow periods and little input use has resulted in poor and declining soil fertility which is a fundamental impediment to agricultural growth and food production (Donovan and Casey 1998; Wichelns 2006). Fertilizers tend to be expensive, unavailable and beyond the reach of smallholder farmers (Buresh and Giller 1998), who are the majority in the region. Legumes provide these farmers with an important opportunity to diversify their farming systems and improve soil fertility through inputs from N2-fixation. Legumes represent an important source of protein for the poor and have good commercial value (Giller 2001; Snapp et al. 1998; Jeranyama et al. 2000; Mapfumo and Giller 2001). Sorghum and millet are the main small grain cereals in the crop production system of the drier areas of semi-arid southern Africa, including Zimbabwe. The potential yield of sorghum is estimated to be between 1.7 and 4.8 t ha-1 (Reddy et al. 2003), but the average yields of sorghum and millet in Zimbabwe are currently 0.6 t ha-1 or less (Ahmed et al. 1997; Rohrbach et al. 2005). There is need to raise productivity to improve food security in the smallholder farming sector. Currently legumes play a minor role in the cropping systems of the semi-arid environments (Ahmed et al. 1997). Legumes are grown in small areas and they receive less than 5% of the soil fertility inputs (Mapfumo and Giller 2001). A better understanding of the opportunities for, and of the constraints to the inclusion of grain and forage legumes in farming systems under semi-arid conditions of sub-Saharan Africa is required (Mapfumo and Giller 2001; Twomlow 2004). Residual yield benefits to cereal crops from previous grain legumes are well documented in other regions of the tropics, including Africa (e.g. Fujita et al. 1992; Vanlauwe et al. 2001). The positive responses of cereals following legumes have been attributed largely to enhanced availability of nitrogen (N) to the cereal crop (Dakora and Keya 1997; Armstrong et al. 1999; Sanginga 2003). The N contribution to the cereal grown after the legume is largely dependent on how much of the N from the N2-fixing plant is harvested and removed, so that legumes with low N harvest indices have greater potential for soil fertility improvement (Giller and Cadisch 1995). There are studies that attribute the residual benefits of legumes to effects other than nitrogen (Armstrong et al. 1999; Sauerborn et al. 2000; Sanginga 2003). Some studies indicate that soil moisture is an important factor in determining the residual benefits to cereals grown in rotation with legumes (Nielsen and Vigil 2005). Better understanding of the effects of legume–cereal rotations on water relations and N supply is required in order to evaluate the longer-term effects on soil productivity and yield stability in the
72

Legume productivity and residual benefits to sorghum
face of restricted and uncertain rainfall. Improved grain legume productivity has the potential to result in increased cereal production through rotations, which may assist in improving food security. The purpose of the study was: i) to assess the productivity of indigenous and improved grain legumes under semi-arid conditions; ii) assess the water use patterns of the legumes; iii) estimate nitrogen fixation and possible N accumulation in the soil; and iv) assess the residual benefits of the legumes to sorghum grown in rotation in terms of both nitrogen and water dynamics. Materials and Methods Environmental conditions and experimental design Experiments were conducted at Lucydale research site located within the Matopos Research Station farm (28º 30' E, 20º 23' S) about 45 km south of Bulawayo City. The site is about 1380 m above sea level and is dominated by soils classified as Eutric Arenosols (FAO/UNESCO) derived from granite (Moyo 2001). The Zimbabwean soil classification system describes the upper slope of the site as the Banket 5G.2 series consisting of moderately shallow to moderately deep, yellowish red, coarse grained, fersiallitic sandy clay loams. Down slope the soils are of similar depth but are yellowish brown, fersiallitic coarse grained loamy sands and light sandy loams of the Matopos 5G series (Hungwe et al. 1982). These granitic sands are the most common soil type cultivated by smallholder farmers in the communal areas of Zimbabwe (Mapfumo and Giller 2001), though the south-western parts of the country are also dominated by deep Kalahari sands. Eight short to medium duration legume varieties and one medium duration sorghum variety were selected for the experiments based on screening trials done during the previous seasons. Table 1 shows the characteristics of the varieties used in the experiments. Sorghum was used as a reference crop during the legume phase. A randomised complete block design with three replicated blocks was generated using Genstat 6.1. Plot size was 20 × 10 m during the legume phase. The plots were split into two 10 × 10 m subplots during the second season (sorghum phase). Legume phase crop residues (equivalent to plot stover yield in the legume phase) were incorporated into one of the subplots in July (2003/04 season) and October (2004/05 season) while the above-ground residues were removed from the second plot.
73

Chapter 4
Cro
p
Sour
ceA
REX
, M
atop
osA
REX
Har
are
IITA
Nig
eria
Seed
Co
Har
are
Seed
Co
Har
are
ICR
ISA
T K
enya
ICR
ISA
T K
enya
Mar
ket
Bul
away
oM
arke
t B
ulaw
ayo
Gro
wth
hab
it-
Det
erm
inat
eSe
mi
dete
rmin
ate
--
Det
erm
inat
eSe
mi
dete
rmin
ate
--
Dur
atio
n (d
ays)
Med
ium
(1
10-1
20)
Sho
rt (6
0-90
)Sh
ort (
60-7
0)Sh
ort
(70-
90)
Med
ium
(1
40)
Shor
t (12
0)Sh
ort (
120)
unkn
own
unkn
own
Plan
t pop
ulat
ion
(m-2
)8.
86.
66.
611
.111
.110
107.
47.
4
Seed
rate
(kg
ha-1
)8
5050
100
100
5050
5050
caja
nVi
gna
subt
erra
nea
Var
iety
SV 4
CB
CI
86D
719
45 x
30
Mar
oon
Bam
bara
Nya
nda
Nat
al
Com
mon
ICEA
P 00
535
Cre
am
Bam
bara
45 x
30
ICPL
980
91
Spac
ing
(cm
)75
x 1
560
x 2
560
x 2
545
x 2
045
x 2
0 50
x 2
050
x 2
0
Sorg
hum
V
igna
ung
uicu
lata
Arac
his h
ypog
aea
Caj
anus
Tabl
e 1:
Cha
ract
eris
tics a
nd th
e re
spec
tive
agro
nom
ic p
ract
ices
of c
rop
varie
ties u
sed
in th
e ex
perim
ents
at L
ucyd
ale
74

Legume productivity and residual benefits to sorghum
Sequence of experiments The experiments were carried out over three cropping seasons: 2002/03, 2003/04 and 2004/05 (Figure 1). Land preparation started in October with early showers. Planting dates were: 19 December 2002 in the first season, 3 and 4 December 2003 in the second season, and 13 and 14 December 2004 in the third season. The first legume phase experiment was preceded by a millet breeding trial, the second by a one year fallow of the millet breeding trial and the third by a two year grass fallow. Field measurements and crop management Initial soil analysis was conducted to assess phosphorus (P) availability in the soil across the fields before starting the experiments. As P availability was low (<0.1 mg kg-1), a blanket rate of 200 kg ha-1 (18 kg P ha-1) single super phosphate (SSP) was applied and ploughed in to a depth of 0.20 m using a tractor-drawn disc plough prior to planting the legume phase each season. For the 2002/03 season treatment plots, soil was sampled in layers: 0–0.15, 0.15–0.30, 0.30–0.60 and 0.60–0.90 m. For subsequent seasons a single layer, 0.30 m, was sampled. Nutrients analysed in each soil layer were pH (water), organic carbon, total and available P, and total N. The methods used to analyse pH, organic carbon and P were those outlined by Okalebo et al. (1993), whereas nitrate N was analysed using the colorimetric method of Anderson and Ingram (1993). Recommended plant spacing was used (Table 1), based on breeder recommendations: sorghum (Seed Co), cowpea (Madamba et al. 2001), pigeonpea (ICRISAT), Bambara groundnut (Madamba et al. 2001) and groundnut (Nyakanda and Hildebrand 1999). Incorporation of the retained residues was done using a donkey drawn VS 200 mouldboard plough set to work at 0.20 m depth. The use of donkeys is the normal method of ploughing in the smallholder farming sector in western Zimbabwe (Ndlovu et al. 2004).
75

Chapter 4
yvD
ecJa
nFe
bM
arAp
rM
a
Sep
Oct
NovD
ecJa
nFe
bM
arAp
rM
ayJu
nJul
yAug
Sep
Oct
NovD
ecJa
nFe
bM
arAp
rM
ayJu
nJul
yAug
SepO
ctNo
Jun
July
Aug
Year
0202
0202
0303
0303
0303
0303
0303
0303
0404
0404
0404
0404
0404
0404
0505
0505
0505
0505
Fiel
d 1
Fiel
d 2
Fiel
d 3
Mon
thly
rain
fall
(mm
)9
219
6711
066
410
00
00
094
4911
816
743
136
430
00
00
187
126
8031
390
00
00
Legu
mes
Sorg
hum
Sorg
hum
Seas
on 1
Seas
on 2
Seas
on 3
(314
mm
)(6
50 m
m)
Sorg
hum
Legu
mes
(301
mm
)
Legu
mes
Figu
re 1
Seq
uenc
e of
exp
erim
ents
at L
ucyd
ale
acro
ss th
ree
crop
ping
seas
ons.
76

Legume productivity and residual benefits to sorghum
During the sorghum phase of the rotation, sorghum was planted at a spacing of 0.75 × 0.15 m in all the plots that were previously planted with legumes and control sorghum. Sorghum crop residues were removed after harvesting each season. A second sorghum rotation was planted after the first sorghum rotation in field 1 (Figure 1). The planting dates for sorghum were 3 December in the 2002 season and 13 December in 2003. At the end of experimentation there were three seasons of the legume phase on three separate experimental sites, two seasons of sorghum after legume at two of these sites and one legume–sorghum–sorghum sequence on the first year site (Figure 1). Daily rainfall was measured at the field throughout the cropping seasons. Soil water content was measured from the start of the 2002/03 season up to the end of the 2003/04 cropping season using a neutron probe, Wallingford type (Bell 1987). Measurements were taken once a week during the rainy season and once in two weeks during the dry season. Aluminium access tubes (45 mm internal diameter) were installed at the centre of each 10 × 10 m subplot. The depth of each tube varied from plot to plot, depending on whether or not a stony layer was encountered at installation anywhere from a depth of 0.49 to 0.9 m (average 0.68 m at site 1 and 0.70 m at site 2). An additional tube was placed in a water-filled plastic drum for calibration of the probe. Probe counts were taken from the drum prior to, and after, field measurements. Field readings were taken from each access tube at 0.1 m intervals, starting from 0.2 m depth below the soil surface. At each sampling date volumetric soil samples (0.05 m × 0.15 m) were collected from three positions in each plot to determine the volumetric water content of the surface layer (0–0.15 m), which could not be measured accurately using the probe. Neutron probe counts were converted to volumetric soil water content (θ) using the calibration curve for the Wallingford probe for silts, sand and gravels as outlined by Bell (1987). The equation for the curve is:
024.0790.0 −= RWRθ Equation 1
R is the neutron probe count measured in the field and RW is the neutron probe count of the water filled drum. The volumetric soil water content was further converted to millimetres (mm) of soil water in each layer and summed for each treatment plot profile. The presence of rocks in the soil profile caused different offsets between the plots within the same field. To compensate for this variation neutron probe measurements were not used as absolute estimates of soil water content, but the measurements were used to calculate changes in soil water content. A starting value was set on the same date in each plot and changes in water content were calculated with reference to that initial value.
77

Chapter 4
Crops were kept free of weeds, disease and pests throughout each growing season, although a severe outbreak of aphids affected the cowpeas during the 2003/04 cropping season. Days to 50% flowering and initiation of flowering in case of groundnut, were recorded for each crop planted in 2002/03 and 2004/05. At maturity the middle six rows were harvested, with a 1 m border left at each plot end. Grain and stover were separated and sub-samples were taken. The samples were dried at 70 oC to constant weight and re-weighed to determine moisture and calculate yield components. Nitrogen fixation was estimated using the 15N natural abundance method as outlined by Peoples et al. (1989). Samples of legumes and sorghum (grain and stover) were dried in the oven at 70 oC. The samples were then analysed for % N and 15N using a 20-20 stable isotope mass spectrophotometer. 15N was calculated using equation 2:
( ) ( )3663.0
3663.0%1000 15
00015 −×
=NsampleatomN Equation 2
The amount of N fixed was then calculated using equation 3: %N from fixation =100 × δ15Nreferencecrop −δ15Nlegume( ) δ15Nreferencecrop − β⎡
⎣ ⎢ ⎤ ⎦ ⎥ Equation 3
β is the δ15N of the legume when grown with N2 as the sole source of N and 15N reference was N obtained from sorghum grown in the same soils as the legumes (Gathumbi et al. 2002). The β values for groundnut, pigeonpea and cowpea were obtained from literature (Boddey et al. 2000). The β value for groundnut was also used for Bambara groundnut. The amount of N fixed was also calculated using the N difference method. The method assumes that both legumes and the reference plant take up similar N amounts from the soil. Therefore, the difference between total N in the legume and N taken up by the reference plant (sorghum) is estimated to be equal to the total N fixed by the legume. Statistical analysis Grain, stover, N yield and water data from both the legumes and sorghum were first tested for normality before carrying out analysis of variance (ANOVA) in Genstat 8.1. Standard errors of the differences (SED) of variety means are presented. Water data were also analysed using ANOVA.
78

Legume productivity and residual benefits to sorghum
Results Initial soil characteristics The soils at Lucydale were strongly acidic (Table 2). Total nitrogen contents were below the range for sandy clay loams (0.06–0.10%) previously reported for upland soils of medium to low rainfall areas of Zimbabwe (Hungwe et al. 1982). The surface layer nitrate–nitrogen concentrations tended to reflect the preceding cropping activity on the three sites, namely a millet breeding trial in season 1 (high), a fallow after a millet breeding trial in season 2 (less) and a grass fallow in season 3 (least). Table 2 Initial soil characteristics at the start of experimentation in each season
SeasonSoil Depth
(m) pHOrganic carbon
(g kg-1)Available N
(mg kg-1)Total N
(%)Olsen P
(mg kg-1)Total P
(%)
2002/03 0 - 0.15 3.7 7.8 7.3 0.04 12.2 0.10
0.15 - 0.30 3.8 7.5 5.7 0.04 5.8 0.09
0.30 - 0.60 4.8 5.9 1.5 0.03 2.2 0.08
0.60 - 90 5.3 3.3 0.7 0.03 2.0 0.05
2003/04 0 - 0.30 3.8 2.5 3.6 0.06 25.4 0.06
2004/05 0 - 0.30 4.0 4.3 1.4 0.04 0.5 0.01
Number of samples in the 0–0.30 m depth per season = 27 In 2004/05 samples were collected before applying SSP fertilizer Organic carbon was below 1%, and generally similar to that found in larger fields of the smallholder farming areas of Zimbabwe (Mtambanengwe and Mapfumo 2005; Zingore et al. 2006). Seasonal rainfall Rainfall was highly variable over the three annual cropping seasons during which the experiments were carried out. Figure 2 shows cumulative total rainfall measured across the three seasons.
79

Chapter 4
0
100
200
300
400
500
600
700
Augus
t
Septem
ber
Octobe
r
Novem
ber
Decem
ber
Janu
ary
Februa
ryMarc
hApri
lMay
June Ju
ly
Rai
nfal
l (m
m)
2002/2003
2003/2004
2004/2005
Figure 2 Seasonal rainfall at Lucydale from the 2002/03 to the 2004/05 season. The long-term average for Matopos Research Station (weather station) is about 590 mm per annum. The Lucydale site is about 5 km from the Matopos weather station. The seasonal average total rainfall for Matopos of 590 mm over the past 50 years was reached only in the 2003/2004 season. A ‘typical’ rainy season in Matopos begins late October/early November, and ends around April. The 2002/03 season started with light showers in late November 2002. Enough rainfall to allow planting was received by 19 December 2002. After planting the rains were evenly distributed until March after which crops matured under conditions of terminal drying. The 2003/04 season started early in October (total monthly rainfall of 94 mm). As a result planting was done early on 3 and 4 December 2003. In December 2003 alone a total of 118 mm of rainfall was received, whereas 167 mm were received in January 2004 allowing good crop establishment during the critical growth stages. After that the rains were evenly distributed until the end of the season. The last season of experimentation (2004/05) was characterized by erratic rainfall throughout. The season started late and planting was done in mid December (13 and 14). Due to the poor rainfall distribution the planted crops received only 15 mm in the first month of establishment. In January 2005 the rainfall total was 80 mm, but the whole amount fell within one week. Thereafter only a few light showers were received.
80

Legume productivity and residual benefits to sorghum
Legume grain yield Legume grain yields were significantly different across the seasons (P<0.001) and within the seasons (P<0.001) when variety means were compared (Table 3). All grain and stover yield weights are reported as oven dry values. Table 3 Legume grain and stover yield, grain N and stover N, and N yield measured across three seasons at Lucydale
Season Crop VarietyGrain yield
(t ha-1)Stover yield
(t ha-1) Grain N
(%)Stover N
(%) Grain N yield
(kg ha-1)Stover N yield
(kg ha-1)Total N yield
(kg ha-1)
2002/03 Bambara Bambara cream 0.07 3.21 4.2 3.1 3 99 102Bambara Bambara maroon 0.13 3.19 4.4 2.8 5 90 95Groundnut Natal Common 0.47 3.09 3.4 2.8 16 87 103Groundnut Nyanda 0.51 3.64 2.9 2.7 15 98 113Cowpea CBC1 0.98 1.56 4.2 3.5 41 55 96Cowpea 86D 719 1.36 2.09 4.2 3.5 57 74 131Pigeon Pea ICPL 87091 0.11 2.78 3.6 2.7 4 75 79Pigeon Pea ICEAP00535 0.33 2.52 3.7 2.7 12 68 80Sorghum SV4 1.98 3.64 1.6 0.4 32 15 47
2003/04 Bambara Bambara cream 0.38 2.09 3.8 2.1 14 44 58Bambara Bambara maroon 0.58 1.83 3.8 2.2 22 40 62Groundnut Natal Common 0.76 1.98 3.8 2.4 29 48 77Groundnut Nyanda 1.02 1.96 3.8 2.0 39 40 78Cowpea CBC1 0.20 0.33 3.7 3.2 7 10 18Cowpea 86D 719 0.22 1.12 4.5 2.6 10 30 39Pigeon Pea ICPL 87091 0.66 1.71 3.7 2.3 24 39 63Pigeon Pea ICEAP00535 0.53 1.75 3.7 2.6 20 46 66Sorghum SV4*
2004/05 Bambara Bambara cream 0.06 0.97 4.0 2.1 3 21 23Bambara Bambara maroon 0.05 1.09 4.1 1.8 2 20 22Groundnut Natal Common 0.18 0.98 3.8 1.9 7 19 26Groundnut Nyanda 0.37 0.98 3.8 1.9 14 18 33Cowpea CBC1 0.35 1.03 4.0 2.2 14 23 37Cowpea 86D 719 0.46 1.11 3.7 2.2 17 25 42Pigeon Pea ICPL 87091 0.58 1.17 3.3 2.0 19 24 43Pigeon Pea ICEAP00535 0.53 1.33 3.1 1.9 16 25 41Sorghum SV4 0.61 2.18 1.2 0.6 8 13 20
P Values Variety <0.001 <0.001 <0.001 <0.001 <0.001 0.080 0.002Season <0.001 <0.001 NS <0.001 <0.001 <0.001 <0.001Season x Variety <0.001 NS 0.002 NS <0.001 NS 0.076
SED Season x Variety 0.12 0.46 0.27 0.25 4.8 13.65 8.15
* - no yield NS – not significant
Cowpea varieties CBCI (0.98 t ha-1) and 86D 719 (1.36 t ha-1) produced higher grain yields than the other legumes in the 2002/03 season. Groundnut varieties produced about 0.50 t ha-1 each, whereas the Bambara groundnut and pigeonpea had the least yields (0.07 and 0.33 t ha-1). In this first season following a breeding trial, sorghum produced the highest grain yield, 1.98 t ha-1.
81

Chapter 4
In contrast with the 2002/2003 season, the best legume yields were harvested from the two groundnut varieties (Natal Common – 0.76 t ha-1 and Nyanda – 1.02 t ha-1) and the least was from the two cowpea varieties (each <0.25 t ha-1) in the 2003/04 season. The low cowpea yields were attributable to severe aphid attack which proved difficult to control in the wet seasonal conditions. Bambara groundnut and pigeonpea yields ranged from 0.4 to 0.7 t ha-1. Sorghum failed to establish during this season, due to excessive rainfall and soil crusting during the weeks after sowing. Maximum legume yields were lower and significantly different in the 2004/05 season compared to the previous two seasons. The largest yields were produced by the pigeonpea varieties (ICPL 87091 produced 0.58 t ha-1and ICEAP 00535 yielded 0.53 t ha-1). Cowpea (0.35 and 0.46 t ha-1) and the groundnut variety Nyanda (0.37 t ha-1) yielded close to 0.4 t ha-1 of grain, whereas Natal Common and the Bambara cultivars yielded less than 0.2 t ha-1. Sorghum yield was 0.6 t ha-1.
Legume nitrogen content
Grain nitrogen content was significantly different across the legume varieties (P<0.001), while the stover nitrogen content varied between both the legume varieties (P<0.001) and the seasons (P<0.001). Varieties of the same crop generally had similar N content values within a season (Table 3). All legumes contained about 3–4% N in grain in all the three seasons, although stover N values showed a wider range (1.8–3.5%). Cowpea stover contained the highest N concentration in all the three seasons. The lowest N content in stover was measured in the third season in all varieties. Total N yield was highest in 2002/03 and lowest in 2004/05, the same trend as observed in the grain and stover yields. Sorghum yielded the least total N in the two seasons where N was measured. Legume nitrogen fixation The 15N signatures of sorghum (reference plants) were greater than the δ15N signatures of all the legumes (Table 4). However, the short season cowpea variety CBC1 also gave high δ15N signatures. The highest signatures were recorded from the first experiment (2002/03) when the three experiments were compared.
82

Legume productivity and residual benefits to sorghum
Table 4 Legume nitrogen fixation estimates across three seasons at Lucydale
Crop Variety β-value δ15NN from N2-
fixationTotal N in
cropTotal N +
root NTotal N
fixedTotal N fixed (by
difference)
(‰) (%) (kg ha-1) (kg ha-1) (kg ha-1) (kg ha-1)
2003/03Bambara groundnut Bambara cream 0.66 3.82 34 102 133 45 72Bambara groundnut Bambara maroon 0.66 3.06 50 95 124 62 63Groundnut Natal Common 0.66 4.54 19 103 134 25 73Groundnut Nyanda 0.66 3.49 41 113 147 60 86Cowpea CBC1 -1.66 4.41 15 96 125 19 64Cowpea 86D 719 -1.66 4.22 17 131 170 29 109Pigeonpea ICPL 87091 -0.90 3.54 28 79 103 28 42Pigeonpea ICEAP 00535 -0.90 3.69 30 80 104 31 43Sorghum SV4 5.44 47 61
2003/04Bambara groundnut Bambara cream 0.66 2.64 61 58 76 46 50Bambara groundnut Bambara maroon 0.66 3.06 52 62 81 43 55Groundnut Natal Common 0.66 3.58 39 77 100 39 74Groundnut Nyanda 0.66 2.83 56 78 102 57 76Cowpea CBC1 -1.66 4.54 16 18 23 4 -3Cowpea 86D 719 -1.66 1.60 56 39 51 28 25Pigeonpea ICPL 87091 -0.90 2.45 57 63 82 47 56Pigeonpea ICEAP 00535 -0.90 1.93 49 66 86 42 60Sorghum SV4* 5.70 20 26
2004/05Bambara groundnut Bambara cream 0.66 3.86 40 23 30 12 4Bambara groundnut Bambara maroon 0.66 4.09 35 22 28 10 2Groundnut Natal Common 0.66 2.28 66 26 34 22 7Groundnut Nyanda 0.66 1.49 83 33 42 35 16Cowpea CBC1 -1.66 3.54 29 37 48 14 21Cowpea 86D 719 -1.66 2.28 46 42 55 25 28Pigeonpea ICPL 87091 -0.90 3.21 46 43 55 26 29Pigeonpea ICEAP 00535 -0.90 2.77 40 41 54 22 27Sorghum SV4 5.96 20 26
P values Variety 0.004 <0.001 0.092 <0.001 <0.001Season <0.001 <0.001 <0.001 <0.001 <0.001Variety x season 0.012 0.042 0.001 NS NS
SED Variety x season 0.68 12.67 13.47 12.39 9.47
*No sorghum yield, therefore the value is an average of the 2002/03 and 2003/04 values. Root N contribution was estimated at 30 % of the total N2 fixed, based on McNeill et al., 1998.
The amount of N2 fixed also varied across the seasons and varieties (P<0.001) when calculations were done using the 15N natural abundance method. In 2002/03 the highest N2 was fixed by Bambara maroon (50%, translating to 62 kg ha-1 of total N fixed) and the groundnut Nyanda (41%, 60 kg N ha-1). Bambara cream and the two pigeonpea varieties fixed about 30% of their N whereas CBC1 fixed only 15% (lowest). In 2003/04 most legumes fixed 50% or more of their N except Natal Common (39%) and CBC1 (16%). The total amounts of N fixed translated to 40–60 kg ha-1 N except with cowpea. During the 2004/05 season % N from N2-fixation values ranged between 35 and 83%, but the values translated to only 10–35 kg ha-1 of total N fixed due to the lower biomass production in this season.
83

Chapter 4
When the 15N estimates using the natural abundance method were compared with estimates made using the N difference method, values were similar for Bambara groundnut and pigeonpea varieties. However, large differences were observed in the cowpea varieties, particularly in the 2002/03 season. The 15N natural abundance method gave estimates that were very similar to the N difference calculations in the 2003/04 season. Soil water changes during the legume phase Soil water changes during the legume phase were also strongly influenced by legume variety and the wetness (rainfall) of the cropping season. Figure 3 shows changes in water use in plots planted with different legumes across two seasons in two soil layers. All the legume varieties showed similar water use patterns in the upper 0–0.25 m soil layer in 2002/03 and 2003/04, and sorghum also closely followed the same pattern. The changes in water use were stronger in the drier 2002/03 season compared to the wetter 2003/04 season. However, down the soil profile (0–0.55 m) legumes showed different water use patterns (Figure 3b). Legumes used more water during the growing period than sorghum (Figure 3b and 3d). At the end of the growing period (April), varieties such as Nyanda and ICPL 87091 took up significantly more water from greater soil depths (0.55 m) than the other legumes. The change in soil water during the sorghum phase did not show much dependence on the previous legume varieties in the 0–0.25 m soil layer (Figure 4). The soil column in plots previously planted with legumes recharged to almost the same water content as with sorghum at the start of the rainy season in the upper layer. However, in the 0–0.55 m layer some differences were observed. The plots previously planted with the groundnut variety Nyanda showed the lowest recharge (soil water change after the first rains) at the start of the season compared with all other varieties. Thereafter the water changes were very similar for the other legumes except for the slightly larger water content in the cowpea 86D 719 plots. Nyanda plots showed the highest change in soil water. The two groundnut varieties produced the highest total biomass in the 2002/03 legume phase. Removal or incorporation of residues had no measurable effect on the water changes; the values were similar across the legume treatments.
84

Legume productivity and residual benefits to sorghum
1-1
2-2
00
3
1-1
-20
04
1-2
-20
04
1-3
-2004
1-4
-2004
1-5
-200
4
1-6
-200
4
1-7
-200
4
Change in soil water (mm)
-40
-200
20
40
60
Da
te
1-1
-200
3
1-2
-200
3
1-3
-20
03
1-4
-20
03
1-5
-2003
1-6
-2003
Figu
re 3
Cha
nge
in s
oil w
ater
dur
ing
the
legu
me
phas
e of
the
2002
/03
crop
ping
sea
son
(a, b
) and
the
2003
/04
crop
ping
se
ason
(c,
d).
Each
poi
nt i
s an
ave
rage
of
mea
sure
men
ts i
n th
ree
plot
s. Er
ror
bars
rep
rese
nt s
tand
ard
erro
rs o
f di
ffer
ence
s bet
wee
n m
eans
of s
oil w
ater
cha
nges
for t
he v
arie
ties.
Cre
am
Ba
mb
ara
M
aro
on B
am
bara
N
ata
l Com
mon
-40
-200
20
40
60
Nya
nd
a
CB
C1
86D
71
9
ICP
L 8
70
91
ICE
AP
005
35
Leg
um
e c
rop
s 2
002/0
3L
eg
um
e c
rop
s 2
00
3/0
4
a)
b)
c)
d)
SV
4
85
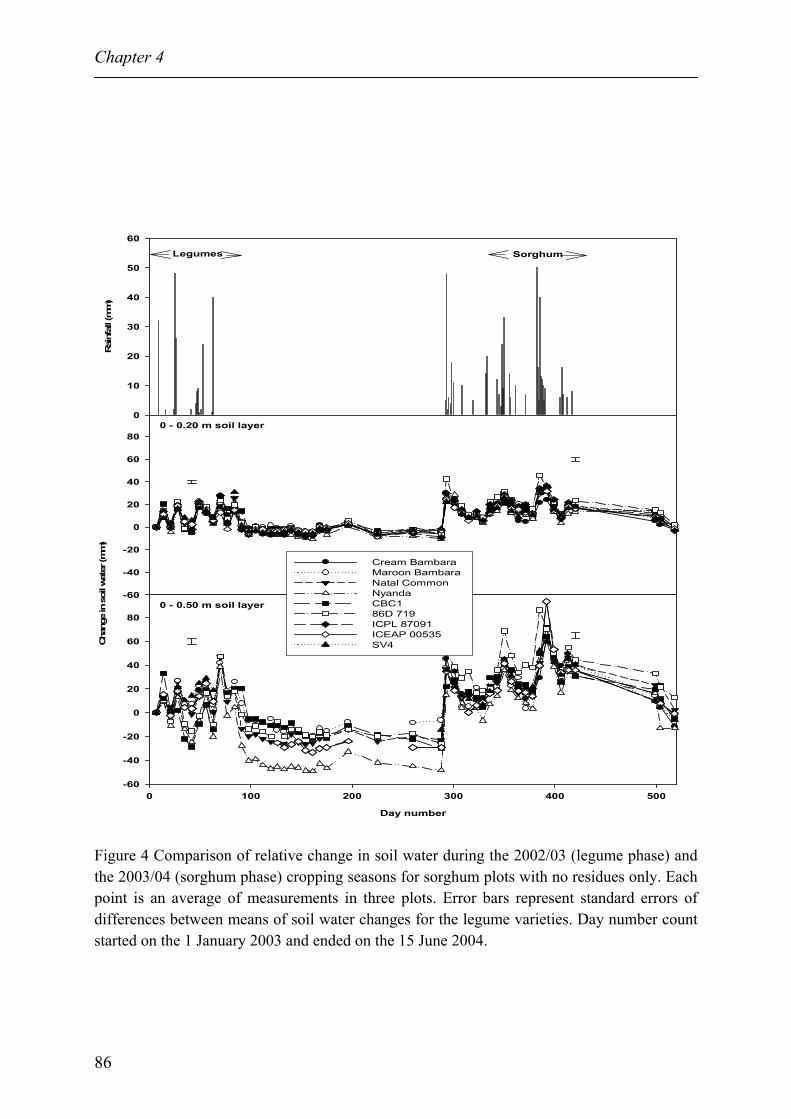
Chapter 4
Rai
nfal
l (m
m)
0
10
20
30
40
50
60
-60
-40
-20
0
20
40
60
80
Day number
0 100 200 300 400 500
Cha
nge
in s
oil w
ater
(mm
)
-60
-40
-20
0
20
40
60
80
Cream Bambara Maroon Bambara Natal Common Nyanda CBC1 86D 719 ICPL 87091 ICEAP 00535 SV4
Legumes Sorghum
0 - 0.20 m soil layer
0 - 0.50 m soil layer
Figure 4 Comparison of relative change in soil water during the 2002/03 (legume phase) and the 2003/04 (sorghum phase) cropping seasons for sorghum plots with no residues only. Each point is an average of measurements in three plots. Error bars represent standard errors of differences between means of soil water changes for the legume varieties. Day number count started on the 1 January 2003 and ended on the 15 June 2004.
86

Legume productivity and residual benefits to sorghum
Nitrogen uptake by sorghum Previous legume varieties had no effect on the % N in sorghum grain harvested in the subsequent season (Table 5). However, there were significant differences (P<0.001) between seasons, and incorporating or removing residues had a weakly significant effect on % N in the grain (P = 0.057). The residue effect could also be attributed to differences between the fields. The % N in stover was not affected by the above factors. Total N yield was more than 20 kg ha-1 in all plots that were previously planted with legumes and less in plots previously planted with sorghum (11–20 kg N ha-1). The differences were significant between varieties (P<0.05) and seasons (P<0.01). Again, residue additions had no effect on the total N yield of sorghum. Table 5 Rotation sorghum grain and stover yield, nitrogen uptake and total N yield across two seasons at Lucydale
Season Previous crop Residues Grain N
(%)Grain Yield
(t ha-1)Grain N (kg ha-1)
Stover N (%)
Stover Yield (t ha-1)
Stover N (kg ha-1)
Total N yield (kg ha-1)
2003/04 Bambara cream + 1.8 0.86 15 0.6 1.76 11 26Bambara maroon + 1.6 0.91 15 0.7 2.30 16 31Natal Common + 1.6 1.62 25 0.6 2.25 14 39Nyanda + 1.6 1.32 21 0.5 3.63 19 41CBC1 + 1.6 0.77 13 0.5 2.28 12 2586D 719 + 1.5 1.59 24 0.5 3.23 16 40ICPL 87091 + 1.7 1.34 23 0.5 3.11 14 37ICEAP00535 + 1.7 1.13 20 0.7 2.88 19 39SV4 + 1.8 0.42 8 0.9 1.35 12 20Bambara cream – 1.5 0.56 9 0.6 2.00 11 20Bambara maroon – 1.6 1.33 21 0.6 2.21 14 35Natal Common – 1.6 0.82 13 0.7 2.54 18 31Nyanda – 1.7 1.28 22 0.5 3.20 15 36CBC1 – 1.5 1.37 21 0.5 3.08 15 3586D 719 – 1.7 1.57 27 0.5 3.09 17 44ICPL 87091 – 1.7 1.21 21 0.7 3.59 23 44ICEAP00535 – 1.6 1.34 22 0.6 2.63 17 38SV4 – 1.5 0.36 6 0.7 0.80 6 11
2004/05 Bambara cream + 1.6 0.73 12 0.7 1.44 10 22Bambara maroon + 1.7 1.17 20 0.5 1.56 8 27Natal Common + 1.4 1.17 17 0.5 1.85 10 27Nyanda + 1.4 1.05 14 0.5 2.02 9 24CBC1 + 1.6 1.02 16 0.5 1.66 8 2486D 719 + 1.5 1.26 19 0.6 1.75 10 28ICPL 87091 + 1.6 1.02 16 0.6 1.93 11 28ICEAP00535 + 1.5 1.06 16 0.6 1.77 11 27SV4 + 1.4 0.77 11 0.5 1.14 6 17Bambara cream – 1.6 0.95 15 0.7 1.54 11 26Bambara maroon – 1.5 1.02 16 0.5 1.85 10 25Natal Common – 1.4 1.09 16 0.5 1.29 7 23Nyanda – 1.4 1.22 17 0.4 2.12 9 26CBC1 – 1.3 0.94 12 0.5 1.63 9 2186D 719 – 1.5 1.03 16 0.6 1.83 11 27ICPL 87091 – 1.5 1.22 18 0.5 1.90 9 27ICEAP00535 – 1.6 0.92 14 0.6 1.75 11 26SV4 – 1.6 0.52 8 0.5 1.05 5 14
P values Variety (V) NS <0.001 0.005 NS <0.001 NS 0.019Residues (R) 0.057 NS NS NS NS NS NSSeason (S) <0.001 NS NS NS <0.001 <0.001 0.002
SED VxRxS 0.11 0.37 6.21 0.16 0.72 6.11 10.87
(+) residues added; (-) residues removed
87

Chapter 4
Grain yield and N uptake of the second sorghum crop There were weakly significant differences between the mean grain yields of the second sorghum crop (P = 0.058) during the 2004/05 cropping, across the previous legumes grown in the 2002/03 season. Sorghum grain yields following the legume treatments ranged from 0.7 to 1.5 t ha-1, whereas that following two consecutive sorghum crops was 0.9 t ha-1 (Table 6). Table 6 Grain and stover yield, nitrogen uptake and total N yield of the second rotation sorghum crop at Lucydale, 2004/05 season
Previous crop Residues Grain N
(%)Grain Yield
(kg ha-1)Grain N (kg ha-1)
Stover N (%)
Stover Yield (kg ha-1)
Stover N (kg ha-1)
Total N yield (kg ha-1)
Bambara cream † 1.5 861 13 0.7 1770 13 26Bambara maroon † 1.7 770 13 0.8 1533 12 26Natal Common † 1.5 762 12 0.8 2287 19 31Nyanda † 1.6 1142 18 0.9 2099 18 37CBC1 † 1.5 1209 19 0.8 2622 22 4086D 719 † 1.7 1322 23 0.9 2791 25 48ICPL 87091 † 1.5 1503 23 1.0 2825 27 50ICEAP00535 † 1.6 937 15 0.9 2241 19 34SV4 † 1.5 940 14 0.9 1999 18 32
Bambara cream – 1.5 860 13 0.5 1907 10 23Bambara maroon – 1.6 868 14 0.7 1697 12 26Natal Common – 1.4 713 10 0.6 1797 10 21Nyanda – 1.5 948 14 0.6 1998 12 26CBC1 – 1.2 1124 14 0.5 2249 11 2586D 719 – 1.6 1080 17 0.7 2632 18 35ICPL 87091 – 1.4 1504 22 0.6 2865 18 40ICEAP00535 – 1.5 1374 21 0.6 3289 21 41SV4 – 1.5 862 13 0.6 2931 19 32
P valuesVariety 0.782 0.058 0.026 0.513 0.061 0.057 0.033Residues 0.190 0.911 0.265 <0.001 0.512 0.008 0.037
The symbols (+) residues added, (-) residues removed indicate residues of the legume crop harvested in 2002/03. The sorghum residues of the 2003/04 crop were all removed. The % N grain values were not dependent on the 2002/03 varieties and residue handling in the second sorghum crop grown in 2004/05 (Table 6). However, stover % N was influenced by residue incorporation or removal two seasons before, during the 2002/03 season. There was generally higher % N in sorghum grain and stover in plots where residues were incorporated than the non-residue plots. As a result there was higher total N yield by sorghum in plots with residues. The yield was significantly different between previous variety (P<0.05) and residue treatments (P<0.05).
88

Legume productivity and residual benefits to sorghum
Discussion Legume yield The need to understand the constraints and opportunities for including grain legumes in rotation with cereals in semi-arid farming systems of Zimbabwe was addressed in our study. The results indicate that there is potential for growing legumes in the semi-arid environments of Zimbabwe. The four improved varieties of legumes that were grown generally gave higher yields than the current yields reported in smallholder farms, although in this experiment P was not limiting. Bambara groundnut is an underutilized and largely unimproved crop which has received little attention from breeding programmes (Azam-Ali et al. 2001; Giller 2001). We used seed of landraces from the local market in our study. It is striking that Bambara groundnut performed so poorly in the two dry seasons (2002/03 and 2004/05), yet Collinson et al. (1996; 2000) suggested that Bambara groundnut is resistant to drought stress. Studies of the crop under semi-arid conditions in Botswana also reported higher grain yields of 0.4 to 1.5 t ha-1 (Karikari and Tabona 2004), though the crop was irrigated at emergence. The poor yields in our study were probably due to a combination of poor seed quality and poor soil moisture availability. Groundnut yields were clearly influenced by the amount and distribution of rainfall during the three seasons of experimentation. The two groundnut varieties consistently yielded 0.4 t ha-1 or more, except in the 2004/5 season when Natal Common yielded only 0.2 t ha-1 (Figure 3). The national average yields of groundnut in Zimbabwe are poor (0.3 t ha-1) (Hildebrand 1996; Nyakanda and Hildebrand 1999). The yields we obtained were substantially better than those obtained with groundnut in farmers’ fields in higher rainfall areas in Zimbabwe (Waddington and Karigwindi 2001; Chikowo et al. 1999). Mupangwa and Tagwira (2005) suggested that the yields could be improved through the use of phosphorus. Phosphorus was not a limiting factor in this study and soil analysis from smallholder farms in southwestern Zimbabwe also indicated that P is probably not a major limiting factor (Ncube et al. 2006). Therefore, it is likely that the poor groundnut yields in southwestern Zimbabwe are not entirely a result of poor soil fertility, as current thinking seems to suggest, but also due to limited water availability. It is possible that water harvesting technologies such as tied ridges may help stabilize yields from groundnut and Bambara groundnut in drier seasons.
89

Chapter 4
Cowpea produced the largest yields in 2002/03 and in another dry season (2004/05). Even with poor distribution of rainfall, cowpea yields were still above the current national average of 0.3 t ha-1 (Nhamo et al. 2003). However, during a wet season (2003/04) cowpea yields were the worst of all the legumes tested, mainly due to aphid damage. High rainfall seasons rarely occur in this environment, therefore such poor cowpea productivity is unusual. Cowpea normally yields well in semi-arid Zimbabwe, which is why it is widely grown by smallholder farmers. Pigeonpea is a relatively new crop in Zimbabwe, although it has been tested by researchers in the country since the early 1990s (Dzowela et al. 1997). Mapfumo and Mtambanengwe (2004) reported average yields of about 0.7 t ha-1 for the short duration variety ICPL 87109 in sub-humid eastern Zimbabwe. Chikowo et al. (2004) reported pod/seed yields of less than 0.5 t ha-1 in the same higher rainfall region. The yield potential of pigeonpea is largely unknown in semi-arid regions of Zimbabwe. However, the two varieties used in this experiment were selected because they had produced high yields of 0.8 (ICPL 87091) and 0.9 (ICEAP 00535) t ha-1 at the Matopos Research Station (Ncube et al. 2003). Wendt and Atemkeng (2004) harvested 0.7 (ICPL 87091) and 0.5 (ICEAP 00535) t ha-1 at the end of the short rainy season in the forest margin area of southern Cameroon. The same pigeonpea varieties evaluated in our study yielded more consistently than the other legumes although the variety ICPL 87091 performed poorly in 2002/03 where it produced 0.11 t ha-1 (Figure 3). Changes in soil water in the legume plots The aim of water measurements was to assess how legumes utilised soil water across seasons, how much water remained at the end of the legume phase, and how much the remaining water contributed to sorghum yield in the subsequent phase. The results of the water studies were not straightforward due to experimental problems. It was difficult to fit access tubes to depths greater than 0.50 m in some plots. The legumes were extracting water beyond this depth and it was impossible to carry out studies to examine rooting patterns due to the stony nature of the soil. The stoniness of the soil led to consistently different offsets in soil water content as measured by the neutron probe, which meant that we could only compare changes in soil water content values rather than the values themselves. Legume water use in the upper 0–0.25 m soil layer varied significantly between legume varieties in 2002/03, but not in the wet 2003/04 season (Figure 3a and 3c).
90

Legume productivity and residual benefits to sorghum
However, in the deeper 0–0.55 m layer differences in water use were more pronounced between the legumes at the end of the season around April/May (Figure 3b). Groundnut varieties caused the largest changes in soil water use in both 2002/03 and 2003/04, especially the Nyanda variety (Figure 4) in both the 0–0.25 m and the 0–0.55 m layers. Nyanda had the most negative water balance at the end of the growing season indicating greater water extraction than the other legumes. This indicates that the variety is able to utilise a lot of water in both dry and wet conditions, which helps to explain its consistently high yield in all seasons (Table 3). The ability of groundnut to utilise more water was probably also related to root morphology. Groundnut has a relatively deep tap root and a well-developed lateral root system, and maximum root depth can be up to 2.5 m in sands (Black et al. 1985; Fageria et al. 1997). Matthews et al. (1988) observed variety differences in the downward movement of the water extraction front of four genotypes of groundnut in Central India. However, they found little explanation of the observed harvest index and dry matter:water ratio when they compared the growth of the genotypes, even though water extraction had been different. Cowpea showed relatively large fluctuations in soil water during the growing period compared with other legumes, especially in 2002/03, but the water content in cowpea later declined to similar amounts as sorghum and Bambara groundnut. Cowpeas were the earliest maturing varieties in this study (60–90 days); this meant that the decline in water use later in the season was associated with a strong reduction in water demand after physiological maturity (Figure 3). Therefore, the cowpeas had a higher potential carryover of water to the next sorghum season compared to other legume varieties. Pigeonpea plots exhibited very small variations in soil water use compared with all other legumes. This was probably due to slow growth and less water demand during the season. Pigeonpea is classified as a low water demanding crop during the early to intermediate growth stages, and as an intermediate water demanding crop at the mature stage (Salako and Tian 2003). These attributes were partly displayed in this study. It is also possible that pigeonpea was drawing water from layers deeper than 0.55 m; hence we could not detect any large variations in water use in the upper soil layers. Sekiya and Yano (2002) concluded that pigeonpea could potentially access water at depths up to 2 m in semi-arid Zambia.
91

Chapter 4
Legume nitrogen accumulation and N2-fixation A high proportion of N that was produced by the legumes was found in the stover in all three seasons. This could be returned to the soil as residues. Legume N accumulation in stover ranged from 55–99 kg ha-1 in 2002/03, 10–48 kg ha-1 in 2003/04 and 18–25 kg ha-1 in the 2004/05 season (Table 3). These amounts were all greater than the amount of N accumulated in sorghum stover during the same period. Chikowo et al. (2003) reported net N addition of 82 and 17 kg ha-1 for pigeonpea and cowpea respectively in a higher rainfall region of Zimbabwe. Rao et al. (1996) harvested 25–93 kg ha-1 N from pigeonpea varieties in semi-arid India, whereas Toomsan et al. (1995) recorded 21–166 kg ha-1 N content from groundnut stover in farmers’ fields in the northeast of Thailand. There is little information on Bambara groundnut N yields, but despite the low grain yield of Bambara groundnut in our study the amounts of N accumulated in stover were substantial in all the three seasons. Using the 15N natural abundance method we estimated that the legumes derived 15–50% of their N from N2 fixation in 2002/03, 16–61% in 2003/04 and 29–83% in the 2004/05 season (Table 4). Chikowo et al. (2004) reported 84% (97 kg ha-1) fixation for pigeonpea and 58% fixation (28 kg ha-1) for cowpea in sub-humid eastern Zimbabwe. Other authors have recorded similar proportions of N for N2-fixation (45–68% in groundnut (Bell et al. 1994; Gathumbi et al. 2002). Total N derived from N2-fixation was 19–22 kg ha-1 in 2002/03, 4–57 kg ha-1 in 2003/04, and 10–35 kg ha-1 in 2004/05. The values were similar to those calculated using the N difference method for most of the legumes in the 2003/04 and 2004/05 seasons, indicating that the 15N natural abundance method and the N difference method could give fairly similar estimates of N2-fixation even under dry conditions. However, the N difference estimates of N2-fixation were much higher in the 2002/03 season, particularly in the cowpea varieties and the groundnut Natal Common. It is not clear why the two methods differed so much in this season for these particular legumes. The differences were caused by high δ15N values measured in samples from these legumes in 2002/03, but it is not clear why these high values arose. The maximum level of N2-fixation could not be reached by the legumes due to limiting environmental conditions in the 2002/03 and 2004/05 seasons, particularly soil moisture stress that occurred during these seasons. N2-fixation is highly sensitive to moisture stress (Ledgard and Steele 1992; Giller 2001). The persistently low N2-
92

Legume productivity and residual benefits to sorghum
fixation by CBC1 was probably also a result of variety characteristics, such as short duration. Rotation sorghum grain yield, water use and nitrogen uptake The sorghum yield response after legumes also showed that there is potential to increase cereal yields using grain legume cereal rotations. The response of sorghum to residual effects of legumes was strongly related to the previous legume variety in 2003/04 (P<0.05). However, during a dry season (2004/05), mean sorghum grain yields were still higher than the sorghum after sorghum yield, but the response was not significant (P = 0.11). The 2004/05 sorghum yields in our study were also slightly lower (but above the current average yield of 0.6 t ha-1), showing the negative effects of lower rainfall (soil moisture). Many studies of residual effects of legumes on cereals attribute the yield benefit to N accumulation during the legume phase, and subsequent uptake by the following cereal (Dakora and Keya 1997; Kouyate et al. 2000; Sanginga 2003). The cowpea variety 86D 719 which had the highest total N yield during the 2002/03 season produced the highest sorghum grain yield in 2003/04. All the legume varieties that accumulated a lot of N during the legume phase resulted in good yields of subsequent sorghum. Some studies have demonstrated that residual effects of legumes cannot be attributed to contributions of N only. Other potential benefits include: a better supply of other nutrients such as cations (Sauerborn et al. 2000); an N sparing effect (Herridge et al. 1995; Armstrong et al. 1997); or arbuscular mycorrhiza infection and the suppression of root nematodes by legumes (Bagayoko et al. 2000). The removal or addition of legume residues had no effect on sorghum yields. This could be due to the below-ground N contribution and fallen leaves from the legumes supplying enough N to meet the requirements of sorghum. The applied residues probably decomposed fast under high temperatures and the extra N from residues may have been lost through leaching at the start of the rainy season. In sorghum total nitrogen yield (uptake) was also significantly different (P<0.05) after legume varieties harvested in the previous season (Table 5). Total N yield by sorghum grown after legumes was up to four times greater than after the sorghum crop.
93

Chapter 4
Previous legumes were able to supply most of the N requirements of sorghum. More than half of the N accumulated was translocated to the sorghum seed. Plots previously planted with legumes were recharged with water to almost the same level after the first rains in the upper 0–0.25 m, and changes in soil water were similar in all plots throughout the sorghum phase (Figure 4). However, in the 0–0.55 m layer some direct effects of legumes on soil water in plots previously planted with 86D 719, which showed the highest recharge during the sorghum phase, were observed. This study attempted to determine whether the legumes had potential soil moisture carryover effects that could benefit the following sorghum. The cowpea variety 86D 719 showed some evidence of a water carryover effect. However, varieties such as Nyanda seemed to take up a lot of water during the legume phase resulting in lower recharge at the start of the season. These differences however were not reflected in sorghum yields. The legumes could have benefited the sorghum indirectly by improving other soil physical characteristics such as infiltration. Hulugalle and Lal (1986) found that growing pigeonpea prior to maize increased maize root growth more than mono-cropped maize. This in turn led to higher maize yields in addition to improved soil chemical and physical properties. Yield of the second sorghum crop after the grain legumes demonstrated that legume residual benefits could last for more than one season. Plots planted with cowpea and pigeonpea in 2002/03 generally produced higher sorghum yields in the second sorghum crop grown in 2004/05. The reasons for such results are not clear but could be related to slow decomposition of roots of the woody varieties such as pigeonpea, resulting in slow N release and better soil characteristics. Overall, the legume benefit to the subsequent sorghum crop appeared to be more readily attributable to nitrogen dynamics, rather than differences in available water remaining after harvesting the legumes. Conclusions Legume yields depended on the legume variety and season characteristics (rainfall amount and distribution) under semi-arid conditions in Zimbabwe. New varieties such as Nyanda, 86D 719, CBC1 and pigeonpea varieties seemed to be well adapted to these dry environments. The legumes were able to fix large proportions of their N from the atmosphere. There was enhanced N available for growth of sorghum in the
94

Legume productivity and residual benefits to sorghum
subsequent season. The yield benefit of the legumes was more related to enhanced N supply by the legumes, than water availability. Legume plots that produced the highest total N yield generally resulted in better sorghum grain yields in the following season. All plots showed similar water recharge at the start of the sorghum phase indicating that the legumes had little impact on water availability. The sustainability of the rotations over the longer term needs further assessment. References Ahmed M M, Rohrbach D D, Gono L, Mazhangara E, Mugwira L, Masendeke D D
and Alibaba S 1997 Soil fertility management in communal areas of Zimbabwe: current practices, constraints and opportunities for change. Results of a diagnostic survey. Southern and Eastern Africa Region. Working Paper no 6.
Anderson J M and Ingram J S I 1993 Tropical Soil Biology and Fertility: A Handbook of Methods, 2nd ed. CAB International, Wallingford, UK. 221 pp
Armstrong R D, McCosker K, Millar G, Kuskopf B, Johnson S, Walsh K, Probert M E and Standley J 1999 Legume and opportunity cropping systems in central Queensland. 2. Effect of legumes on following crops. Aust. J. Agric. Res. 50, 925-936.
Azam-Ali S N, Sesay A, Karikari S K, Massawe F J, Aguilar-Manjarrez J, Bannayan M and Hampson K J 2001. Assessing the potential of an underutilized crop - A case study using bambara groundnut. Exp. Agric. 37, 433-472.
Bagayoko M, Buerkert A, Lung G, Bationo A and Romheld V 2000 Cereal/legume rotation effects on cereal growth in Sudano-Sahelian West Africa: soil mineral nitrogen, mycorrhizae and nematodes. Plant Soil. 218, 103-116.
Bell J P 1987 Neutron probe practice. Report No. 19. Third Edition. Institute of Hydrology, Wallingford, England. pp 51.
Bell M J, Wright G C, Suryantini and Peoples M B 1994 The N2-Fixing Capacity of Peanut Cultivars with Differing Assimilate Partitioning Characteristics. Aust. J. Agric. Res. 45, 1455-1468.
Black C R, Tang D Y, Ong C K, Solon A and Simmonds L P 1985 Effects of soil moisture stress on the water relations and water-use of groundnut stands. New Phyt. 100, 313-328.
Boddey R M, Peoples M B, Palmer B and Dart P J 2000 Use of the N-15 natural abundance technique to quantify biological nitrogen fixation by woody perennials. Nutr. Cycl. Agroecosyst. 57, 235-270.
95
Chapter 4
Buresh R J and Giller K E 1998 Strategies to replenish soil fertility in African smallholder agriculture. p 13-19. In: Waddington S R, Murwira H K, Kumwenda J D T, Hikwa D and Tagwira F (eds). Soil fertility research for maize-based farming systems in Malawi and Zimbabwe. Soil Fertility Network and CIMMYT, Harare, Zimbabwe.
Chikowo R, Tagwira F and Piha M 1999 Agronomic effectiveness of poor quality manure supplemented with phosphate fertiliser on maize and groundnut in a maize-groundnut rotation Afric. Crop Sci. J. 7, 383 - 396.
Chikowo R, Mapfumo P, Nyamugafata P, Nyamadzawo G and Giller K E 2003 Nitrate-N dynamics following improved fallows and maize root development in a Zimbabwean sandy clay loam. Agrofor. Syst. 59, 187-195.
Chikowo R, Mapfumo P, Nyamugafata P and Giller K E 2004 Woody legume fallow productivity, biological N-2-fixation and residual benefits to two successive maize crops in Zimbabwe. Plant Soil 262, 303-315.
Collinson S T, Azam-Ali S N, Chavula K M and Hodson D A 1996 Growth, development and yield of bambara groundnut (Vigna subterranea) in response to soil moisture. J. Agric. Sci. 126, 307-318.
Collinson S T, Sibuga K P, Tarimo A J P and Azam-Ali S N 2000 Influence of sowing date on the growth and yield of Bambara groundnut landraces in Tanzania. Exp. Agric. 36, 1-13.
Dakora F D and Keya S O 1997 Contribution of legume nitrogen fixation to sustainable agriculture in Sub-Saharan Africa. Soil Biol. Biochem. 29, 809-817.
Donovan G and Casey F 1998 Soil Fertility Management in sub-Saharan Africa. World Bank Technical Paper 408. World Bank, Washington, DC, 60 pp.
Dzowela B H, Hove L, Maasdorp B V and Mafongoya P L 1997 Recent work on the establishment, production and utilization of multipurpose trees as a feed resource in Zimbabwe. Animal Feed Sci.Tech. 69, 1-15.
Fageria N K, Baligar V C and Jones C A 1997 Growth and Mineral Nutrition of Field Crops. 2nd edition. New York: M. Dekker. 624p.
Fujita K, Ofosubudu K G and Ogata S 1992 Biological Nitrogen-Fixation in Mixed Legume-Cereal Cropping Systems. Plant Soil 141, 155-175.
Giller K E 2001 Nitrogen Fixation in Tropical Cropping Systems. CAB International, Wallingford, UK.
Giller K E and Cadisch G 1995 Future benefits from biological nitrogen fixation: An ecological approach to agriculture. Plant Soil 174, 255-277.
Gathumbi S M, Cadisch G and Giller K E 2002 N-15 natural abundance as a tool for assessing N-2-fixation of herbaceous, shrub and tree legumes in improved fallows. Soil Biol. Biochem. 34, 1059-1071.
96

Legume productivity and residual benefits to sorghum
Hildebrand G L 1996 The status of technologies used to achieve high groundnut yields in Zimbabwe, p 101-116. In: Achieving high groundnut yields. ICRISAT proceedings of an International workshop, 25-29 August 1995, Shandong Peanut Research Institute, Shandong, China.
Herridge D F, Marcellos H, Felton W L, Turner G L and Peoples M B 1995 Chickpea increases soil N fertility in cereal systems through nitrate sparing and N-2 fixation. Soil Biol. Biochem. 27, 545-551.
Hungwe A, Hopkins M and Garikayi A 1982 The soils of Matopos Research Station, Longsdale-Lucydale Block. Chemistry and Soils Research Institute. Soils Report No. 503. CS/4/4/91.
Hulugalle N R and Lal R 1986 Root-growth of maize in a compacted gravelly tropical Alfisol as affected by rotation with a woody perennial. Field Crop. Res. 13, 33-44.
Jeranyama P, Hesterman O B, Waddington S R and Harwood R R 2000 Relay-intercropping of sunnhemp and cowpea into a smallholder maize system in Zimbabwe. Agron. J. 92, 239-244.
Karikari S K and Tabona T T 2004 Constitutive traits and selective indices of Bambara groundnut (Vigna subterranea (L) Verdc) landraces for drought tolerance under Botswana conditions. Phys. Chem. Earth 29, 1029-1034.
Kouyate Z, Franzluebbers K, Juo A S R and Hossner L R 2000 Tillage, crop residue, legume rotation, and green manure effects on sorghum and millet yields in the semiarid tropics of Mali. Plant Soil. 225, 141-151.
Ledgard S F and Steele K W 1992 Biological nitrogen-fixation in mixed legume grass pastures. Plant Soil 141, 137-153.
Madamba R, Mwashaireni A and Soko T 2001 A guide to pulse production in Zimbabwe. Ministry of Lands, Agriculture and Rural Resettlements. Department of Research and Specialists Services. Zimbabwe Government, Harare.
Mapfumo P and Giller K E 2001 Soil Fertilty Management Strategies and Practices by Smallholder Farmers in Semi Arid Areas of Zimbabwe. International Crops Research Institute for the Semi Arid Tropics (ICRISAT) with permission from the Food and Agricultural Organization (FAO). Bulawayo, Zimbabwe and Rome, Italy. 60p.
Mapfumo P and Mtambanengwe F 2004 Base nutrient dynamics and productivity of sandy soils under maize-pigeonpea potational systems in Zimbabwe. In Managing Nutrient Cycles to Sustain Soil Fertility in Sub-Saharan Africa. André Bationo (ed). pp 225-238. Academy Science Publishers (ASP) in
97

Chapter 4
association with the Tropical Soil Biology and Fertility Institute of CIAT, Nairobi.
Matthews R B, Harris D, Rao R C N, Williams J H and Wadia K D R 1988 The physiological basis for yield differences between 4 genotypes of groundnut (Arachis hypogaea) in response to drought: 1. Dry matter production and water use. Exp. Agric. 24, 191-202.
McNeill A M, Zhu C and Fillery I R F 1998 A new approach for quantifying the benefit from pasture legumes to succeeding wheat. Aust J Agric Res 49, 427-436.
Moyo M 2001 Representative Soil Profiles of ICRISAT Research Sites. Chemistry and Soil Research Institute. Soils Report No. A666. 97pp.
Mtambanengwe F and Mapfumo P 2005 Organic matter management as an underlying cause for soil fertility gradients on smallholder farms in Zimbabwe. Nutr. Cycl. Agroecosyst. 73, 227-243.
Mupangwa W T and Tagwira F 2005 Groundnut yield response to single superphosphate, calcitic lime and gypsum on acid granitic sandy soil. Nutr. Cycl. Agroecosyst. 73, 161-169.
Ncube B, Dimes J P, Twomlow S, Mupangwa W and Giller K E 2006 Raising the productivity of smallholder farms under semi-arid conditions by use of small doses of manure and nitrogen: A case of participatory research (accepted). DOI: 10.1007/s10705-006-9045-7. Nutr. Cycl. Agroecosyst.
Ncube B, Manjala T and Twomlow S 2003 Screening of short duration pigeon pea in Matabeleland. In Grain Legumes and Green Manures for Soil Fertility in Southern Africa: Taking Stock of Progress. Proceedings of a Conference held 8-11 October 2002 at Leopard Rock Hotel, Vumba, Zimbabwe. S R Waddington (ed.) Soil fert Net and CIMMYT-Zimbabwe, Harare, Zimbabwe. pp 75-78.
Ndlovu L R, Bwakara T and Topps J H 2004 The role of donkeys in integrated crop-livestock systems in semi arid areas of Zimbabwe. In: Donkeys, People and Development. A resource book of the Animal Traction Network for Eastern and Southern Africa (ATNESA). Fielding D and Starkey P (eds). pp 188-191. ACP-EU Technical Centre for Agricultural and Rural Cooperation (CTA), Wageningen, Netherlands.
Nhamo N, Mupangwa W, Siziba S, Gatsi T and Chikazunga D 2003 The role of cowpea (Vigna unguiculata) and other grain legumes in the management of soil fertility in the smallholder farming sector of Zimbabwe. In: Waddington S R (ed.) Grain legumes and green manures for soil fertility in Southern Africa: Taking stock of progress. Proceedings of a conference held 8-11 October 2002
98

Legume productivity and residual benefits to sorghum
at the Leopard Rock Hotel, Vumba, Zimbabwe. Soil Fert Net and CIMMYT-Zimbabwe, Harare, Zimbabwe. 246pp.
Nielsen D C and Vigil M F 2005 Legume green fallow effect on soil water content at wheat planting and wheat yield. Agron. J. 97, 684-689.
Nyakanda P N and Hildebrand G L 1999 Recommended groundnut production practices for smallholder farmers in Zimbabwe. Causeway, Harare, Zimbabwe: Department of Research and Specialist Services, Ministry of Lands and Agriculture; and Harare, Zimbabwe: Seed Co Limited. 24pp.
Okalebo R J, Gathua K W and Woomer P 1993 Laboratory Methods of Soil and Plant Analysis: A Working Manual. Soil Science Society of East Africa. Marvel EPZ. Nairobi, Kenya.
Peoples M B, Faizah A W, Rerkasem B and Herridge D F 1989 Methods of evaluating nitrogen fixation by nodulated legumes in the field. Australian Centre for International Agricultural Research, Canberra.
Rao J V D K K, Johansen C, Yoneyama T, Tobita S and Ito O 1996 Estimation of nitrogen fixation by the natural N-15-abundance technique and nitrogen uptake by pigeonpea genotypes of different maturity groups grown in an inceptisol. J. Agron. Crop Sci.-Z. Acker Pflanz. 177, 129-138.
Reddy T Y, Reddy V R and Anbumozhi V 2003 Physiological responses of groundnut (Arachis hypogaea L.) to drought stress and its amelioration: A critical review. Plant Growth. Reg. 41, 75-88.
Rohrbach D D, Mashingaidze A B and Mudhara M 2005 The distribution of relief seed and fertilizer in Zimbabwe. Lessons derived from the 2003/04 season. FAO/ICRISAT, Zimbabwe.
Salako F K and Tian G 2003 Soil water depletion under various leguminous cover crops in the derived savanna of West Africa. Agric. Ecosyst. Environ. 100, 173-180.
Sanginga N 2003 Role of biological nitrogen fixation in legume based cropping systems: a case study of West Africa farming systems. Plant Soil 252, 25-39.
Sauerborn J, Sprich H and Mercer-Quarshie H 2000 Crop rotation to improve agricultural production in sub-Saharan Africa. J. Agron. Crop Sci.-Z. Acker Pflanz. 184, 67-72.
Sekiya N and Yano K 2002 Water acquisition from rainfall and groundwater by legume crops developing deep rooting systems determined with stable hydrogen isotope compositions of xylem waters. Field Crop. Res. 78, 133-139.
Snapp S S, Mafongoya P L and Waddington S 1998 Organic matter technologies for integrated nutrient management in smallholder cropping systems of southern Africa. Agric. Ecosyst. Environ. 71, 185-200.
99

Chapter 4
Toomsan B, McDonagh J F, Limpinuntana V and Giller K E 1995 Nitrogen-fixation by groundnut and soybean and residual nitrogen benefits to rice in farmers fields in Northeast Thailand. Plant Soil 175, 45-56.
Twomlow S J 2004 Increasing the role of legumes in smallholder farming systems - The future challenge, p29-46 In: Serraj R (ed). Symbiotic Nitrogen Fixation: Prospects for Application in Tropical Agroecosystems. Science Publishers, NH, USA
Vanlauwe B, Aihou K, Houngnandan P, Diels J, Sanginga N and Merckx R 2001 Nitrogen management in 'adequate' input maize-based agriculture in the derived savanna benchmark zone of Benin Republic. Plant Soil 228, 61-71.
Waddington S R and Karigwindi J 2001 Productivity and profitability of maize plus groundnut rotations compared with continuous maize on smallholder farms in Zimbabwe. Exp. Agric. 37, 83-98.
Wendt J W and Atemkeng M F 2004 Soybean, cowpea, groundnut, and pigeonpea response to soils, rainfall, and cropping season in the forest margins of Cameroon. Plant Soil 263, 121-132.
Wichelns D 2006 Improving water and fertilizer use in Africa: Challenges, opportunities, and policy recommendations. Background paper prepared for the African Fertilizer Summit, June 9-13, 2006, Abuja, Nigeria. 28 pp.
Zingore S, Murwira H K, Delve R J and Giller K 2006 Influence of nutrient management strategies on soil variability, crop yields and nutrient balances on smallholder farms in Zimbawe. Agric. Ecosyst. Environ.
100

CHAPTER 5
Productivity and residual benefits of grain legumes to sorghum under semi-arid conditions in southern Zimbabwe: Unravelling the effects of water and nitrogen
using a simulation model
Bongani Ncube, John P. Dimes, Mark T. van Wijk, Steve J. Twomlow, Ken E. Giller (Under review: Field Crops Research)


5. Productivity and residual benefits of grain legumes to sorghum under semi-arid conditions in southern Zimbabwe: Unravelling the effects of water and nitrogen using a simulation model
Abstract We assessed how accurately the APSIM model can predict observed legume and rotation sorghum yield and how the model can assist in explaining the mechanism of the residual benefit of legumes to sorghum under dry conditions. The model was used to simulate the measured soil and plant responses in a legume-sorghum rotation experiment conducted at Lucydale, Matopos Research Station in south-western Zimbabwe, between 2002 and 2005. Local climate, measured soil mineral N, soil organic matter (SOC) and water data were used as inputs to the model. Sequences of cowpea (Vigna unguiculata (L.) Walp.), pigeonpea (Cajanus cajan (L.) Millsp.), groundnut (Arachis hypogaea L.) and sorghum (Sorghum bicolor (L.) Moench) were used to simulate the rotations. Existing parameters in the model for cowpea, pigeonpea and sorghum were found to capture the observed phenology, biomass accumulation and grain partitioning of the experimental cultivars reasonably well. In the case of groundnut, new cultivar parameters were constructed and calibrated using the observed harvest index and flowering data. APSIM predicted total biomass and grain yields of the legume phase well. Sorghum yield was also predicted well in rotation after cowpea and groundnut, but the model under-predicted sorghum yield after pigeonpea. The under-predictions were probably due to the exclusion of leaf fall in pigeonpea. Model output on sorghum N and water stresses indicated that the legume-cereal rotation is more driven by soil nitrogen availability than water availability even under semi-arid conditions. Further testing of the model will assist in the understanding of other processes in the legume-cereal rotations in dry environments. Key words: APSIM, nitrogen uptake, N2-fixation, stress factors 1. Introduction Grain legumes are currently grown over small areas and in general contribute only to subsistence needs of smallholder farming systems in Zimbabwe (Mapfumo and Giller, 2001; Rowe and Giller, 2003, Twomlow, 2004), and other southern African countries such as Botswana, Malawi and Zambia. The scarcity of legumes is greatest in semi-arid regions where production of cereal staples such as maize and sorghum takes precedence in utilising farm resources and uncertain low rainfall. Other reasons for the
103

Chapter 5
small areas in Zimbabwe include lack of quality seed, labour and disease constraints, and lack of output markets, so households produce primarily for home consumption (Hildebrand, 1996). Finding ways to establish and increase the area of legumes in the cereal-based cropping systems for dry areas has been identified as a critical research area (Mapfumo and Giller, 2001; Twomlow, 2004). Cereal yields are low due to poor soil fertility management. Smallholder farmers do not apply fertilizer to their crops for complex reasons including poor economic returns and lack of timely input supply. Organic sources of nutrients such as manure are scarce and/or of poor quality as a source of plant nutrients, especially N (Mugwira and Murwira, 1998), and where available are preferentially applied to the cereal grain crop. A possible solution to the soil fertility problem could be through legume-cereal rotations. A better understanding of legume-cereal rotations can give insight on how legumes can contribute to food security through improving and maintaining soil fertility. Achievable yields of grain legumes under semi-arid smallholder farming conditions of Zimbabwe, and, for that matter, similar agro-ecologies in southern Africa, are currently not known, and studies of legume-cereal rotations are also lacking. N2-fixing legumes can have a positive impact on soil fertility by enhancing nitrogen availability and therefore benefiting a cereal crop grown in the subsequent season (Armstrong et al., 1999; Sanginga, 2003). There is need to study how nitrogen supplied by the legumes interacts with factors such as water in order to understand the importance that each factor exerts in the rotation (Chapter 4). Such knowledge will show whether research should focus on increasing nitrogen availability or on other areas such as water management in these dry environments. It is difficult to clearly unravel such information using field experimentation of two or three years only (Chapter 4). The use of relevant crop-soil models can assist in providing answers to these research questions. The Agricultural Production Simulator (APSIM) model is a well-tested model that provides reasonably accurate predictions of crop production in relation to climate, genotype, soil and management factors, whilst addressing long-term resource management issues in farming systems (Keating et al., 2003). APSIM is considered to be one of the most appropriate models for use in tropical soil and crop management (Delve and Probert, 2004). The model is useful in capturing the interactions between climatic conditions, soil types and nutrient dynamics in cereal based farming systems in Africa and Australia (Whitbread et al., 2004). Based on these strengths APSIM was therefore selected as an appropriate model to use in unravelling the effects of water and nitrogen in legume cereal rotations under dry conditions in Zimbabwe. Here we
104

Simulation of legume-sorghum rotations used APSIM to assist in explaining our experimental results on the residual effects of grain legumes on growth and yield of sorghum under semi-arid conditions. Our objectives were, first to test the model by a) modelling the growth and yield of grain legumes; b) modelling the residual effects of the grain legumes on sorghum yield; and second, to use the model to analyse the nitrogen and water stress dynamics in the legume-cereal rotation and to quantify when each of the two factors is limiting in grain production, and hence unravel their effects. Materials and methods Brief overview of the APSIM model The APSIM framework is well documented and described by Keating et al. (2003), and has been tested with observed data under a wide range of conditions (Keating et al., 2003). Performance in Africa has also been reported: simulating N dynamics of manure inputs (Delve and Probert, 2005), maize response to N (Shamudzarira et al. 2000; Shamudzarira and Robertson, 2002; Robertson et al., 2005), some legumes in Malawi (Robertson et al., 2005), weed competition (Keating et al., 1999; Dimes et al., 2002) and water use efficiency (Dimes and Malherbe, 2006) in smallholder farming systems. We have used APSIM Version 5.1 to model results in this study because of the various components that suit our experiment. The model consists of relevant crop modules and N2-fixation for legume crops that were used in our study. The model deals effectively with crop sequencing effects of water and N, especially organic N inputs. The APSIM model also has a surface organic matter (surface OM) module that deals with additions and incorporation of crop residues, and simulates the effects of residue management on water and N balances. The manager modules assist in specifying management events and the model has the ability to re-set the system at key observation points. A gap in previous APSIM applications in Africa has been the limited application of the legume modules in dry areas, and seldom, if ever, assessment of model performance for simultaneous above- and below-ground dynamics, in this case soil water, N uptake and N2-fixation, biomass production and partitioning to grain. Therefore, before we can use APSIM to analyse and understand the water and nitrogen stress effects on sorghum yields under different rotation schemes, the model first has to be tested extensively on these aspects using field experimental data.
105

Chapter 5
Summary of the field experiment Crops Experiments were carried out at the Matopos Research Station (28º 30' E, 20º 23' S) Zimbabwe, at the Lucydale experiment site. The experiments were carried out over 3 cropping seasons 2002/03, 2003/04 and 2004/05, as shown in Figure 1. Legume phase experiments (Experiment 1, Experiment 2 and Experiment 3) were established in each season at different sites in 2 adjoining fields. Two varieties of groundnut (Arachis hypogaea L.), Nyanda and Natal Common, two of cowpea (Vigna unguiculata (L.) Walp), CBC1 and 86D 719, two of pigeonpea (Cajanus cajan (L.) Millsp.), ICPL 87091 and ICEAP 00535 and medium duration sorghum (Sorghum bicolor (L.) Moench), SV4, were planted following recommended plant spacing in 20 x 10 m plots. All plots in legume and sorghum phases received a basal application of P fertiliser (20 kg P ha-1). At harvest, grain and stover samples were collected and dried in the oven at 70 oC to determine yield components. Further, the samples were ground and analysed for % N and 15N using a 20-20 stable isotope mass spectrophotometer. N2-fixation was then determined using the 15N natural abundance method (Boddey et al., 2000) and the N difference method. At the end of each legume phase the plots were split into two 10 x 10 m subplots. In one sub-plot the above-ground harvested residues were removed, while in the other sub-plot the residues were incorporated. In the following season(s) a sorghum crop was planted in all plots. At harvest of the sorghum phase all crop residues were removed. At the end of experimentation there were three legume phases, two legume-sorghum phases and one legume-sorghum-sorghum phase (Figure 1). For further details of the experimental procedures and results see Chapter 4.
106

Simulation of legume-sorghum rotations y
Jun
Jul
y
SepO
ctNo
vDec
Jan
FebM
arAp
rMay
JunJ
ulyAu
gSep
OctN
ovDe
cJa
nFe
bMar
AprM
ayJu
nJuly
AugS
epOc
tNov
Dec
Jan
FebM
arAp
rMa
Aug
Year
0202
0202
0303
0303
0303
0303
0303
0303
0404
0404
0404
0404
0404
0404
0505
0505
0505
0505
Expe
rimen
t 1
Expe
rimen
t 2
Expe
rimen
t 3
Mont
hly ra
infall
(m
m)9
219
6711
066
410
00
00
094
4911
816
743
136
430
00
00
187
126
8031
390
00
00
Sorg
hum
Legu
mes(3
01 m
m)
Legu
mes
Legu
mes
Sorgh
umSo
rghu
m
(314
mm)
(650
mm)
Seas
on 1
Seas
on 2
Seas
on 3
Figu
re 1
. Seq
uenc
e of
exp
erim
ents
acr
oss
thre
e se
ason
s (2
002/
03, 2
003/
04 a
nd 2
004/
05)
at L
ucyd
ale,
Mat
opos
. The
fig
ure
also
sh
ows m
onth
ly a
nd se
ason
al ra
infa
ll re
ceiv
ed a
cros
s the
thre
e se
ason
s.
107

Chapter 5
Soil water A Wallingford neutron probe (Bell, 1987), and the gravimetric method were used to measure soil moisture during both the legume and the sorghum phases. Soil water was measured in Experiment 1 and 2 only. This was done on a weekly basis during the crop period and less often during the dry season. There was a measurement gap in the 2003/04 cropping season due to probe malfunction. Soil depth across experimental areas was highly variable (35-90cm, average of 68 and 70 cm for Experiment 1 and 2, respectively). While there were sufficient measurements to estimate soil water parameters for model input to 70 cm, total soil water in the 0-35cm zone is used for evaluating model performance since this zone was better represented across treatments and time. Set up of the model Soil water and soil characteristics Two soil water descriptions were used to simulate the water balance for the 3 experimental sites. Figure 2 shows the air dry (AD), crop lower limit (LL), drained upper limit (DUL) and saturated water content (SAT) for each soil. In the absence of soil water data in Experiment 3, we have used the Experiment 2 description for both, since the experiments were located in the same field and were adjoining. The plant available water capacity (PAWC) for Experiment 1 soil is 59 mm (0-65cm); and Experiment 2 soil is 53 mm (0-70cm) Soils were described to have evaporation of soil water below the crop lower limit in the surface layer only (Figure 2). Evaporation and runoff coefficients were selected to reflect a tropical environment and the crusting characteristics of the Lucydale soils. For each soil, the first and second stage evaporation coefficients were set at 1 mm and 6mm day-1/2 (Ritchie et al. 1972) and the runoff curve number for bare soil ((Williams and LeSeur 1976) was set to 90. Three separate soil descriptions were used with APSIM to simulate the nitrogen balance of each experiment. Table 1 shows the nitrate-N, organic carbon and bulk density used in modelling the three experiments. The soil C:N ratio for all soils was set at 15.
108

Simulation of legume-sorghum rotations
Experiment 2 and 3
0
100
200
300
400
500
600
700
0.00 0.05 0.10 0.15 0.20 0.25
Soil water (mm)
Soil
dept
h (m
m)
airdry LL DUL SAT SW_25 Nov 03
Experiment 1
0
100
200
300
400
500
600
700
0.00 0.05 0.10 0.15 0.20 0.25
Soil water (mm)
Soil
dept
h (m
m)
airdry LL DUL SAT SW_7 Jan 03
Figure 2. Soil water parameters for the two soils at Lucydale. LL stands for lower limit, DUL for the drained upper limit or field capacity, SAT stands for the saturated profile and SW_7jan03 and SW_25nov03 stand for the measured soil water profile on the 7th of January and the 25th November 2003 respectively.
109

Chapter 5
Table 1 Soil organic carbon used to initialize the three Lucydale soils in APSIM and nitrate-N values used to update the model on measured dates** (see text)
NO3N (ppm) OC (%)
Depth (cm) BD (g cm-3) Expt 1 Expt 2 Expt 3 Expt 1 Expt 2 Expt 30-15 1.66 6.10 3.51 1.41 0.79 0.42 0.42
15-25 1.63 5.41 3.51 1.41 0.75 0.42 0.4225-35 1.6 3.26 1.93* 0.77* 0.67 0.37* 0.37*35-45 1.55 1.12 0.78* 0.31* 0.58 0.32* 0.32*45-55 1.5 1.12 0.78* 0.31* 0.58 0.32* 0.32*55-70 1.45 0.96 0.60* 0.24* 0.44 0.24* 0.24*
* Not measured, values derived from measured surface layer values and normalised distribution of Experiment 1 data. ** NO3-N sampling dates: Experiment 1 – 16 Dec 2002, Experiment 2 and 3 – 25 Nov 2003, 2004 Management and climate The model was set up to run with daily climate inputs from the 1st of November 2002 to the 30th of June 2005. Actual rainfall data measured at Lucydale were used. Temperature and radiation data were obtained from the Meteorological Office climate records at Matopos Research Station (approximately 5 km apart). Simulation of the legume phase experiments was initialised on the 1st of November each year, with soil water in each layer set to crop LL and available mineral N (NO3+NH4-N) set to a low amount (12 kg N ha-1, 0-65cm). Soil nitrate-N and soil water in each layer was subsequently updated on the date of the first observed values in each legume phase experiment (Figure 2 and Table 2). Simulation of the legume-sorghum rotation was continuous from the November 1 starting date for each experiment. Crop management in the model was specified consistent with the experimental procedures. Sowing dates for the legume and sorghum phases in experiment 1 were December 19 in 2002, December 3 in 2003 and December 14 in 2004. For experiment 2 the sowing dates were December 4 in 2003 and December 13 in 2004, while the Experiment 3 sowing date was December 13, 2004. Legume residue incorporation was done on the 23rd October 2003 in Experiment 1, and on the 27 July, 2004 in Experiment 2. Plant populations were measured in 2002/03 season only and these were used as inputs to the model to simulate the Experiment 1 legume phase crops. The observed plant populations were as follows: CBC1 = 11.3, 86D 719 = 12 (high cowpea populations because no thinning operation), ICEAP 00535 = 8, ICPL 87091 = 6.3, Natal Common
110

Simulation of legume-sorghum rotations = 8.3, Nyanda = 5.7 and SV4 = 6.3. The measured pigeonpea and groundnut populations were substantially below the target populations for these 2 crops (10 and 11). Accordingly, the pigeonpea and groundnut cultivars for Experiment 2 and 3 were simulated using the average of the legume cultivars observed in the first season (pigeonpea = 7, groundnut =7), while the cowpea cultivars were simulated using the target population (6.6). In 2003/04, rotation sorghum crops in experiment 1 were simulated using a population of 2 plants m-2 to reflect the observed poor establishment of sorghum in that season. In Experiment 3 legume phase and all rotation crops in 2004/05, sorghum was simulated using a population of 4 plants m-2. Crop parameters For cowpea, pigeonpea and sorghum, simulation of observed phenology and grain partitioning of the experimental cultivars was found to be adequately achieved by selecting from existing cultivar descriptions in APSIM. Hence, APSIM crop parameters for ‘Banjo’ and ‘Red-caloona’ cowpea, ‘short-duration’ pigeonpea and ‘early’ sorghum were selected to describe CBC1 and 86D 719 cowpeas, both ICEAP 00535 and ICPL 87091 pigeonpea and SV4 sorghum, respectively. In the case of groundnut, new cultivar parameters were constructed for Natal Common and Nyanda from existing APSIM cultivars (‘McCubbin’ and ‘Chico’). The thermal time from initiation to flowering and the Harvest Index (HI) increase parameter for each cultivar was calibrated to approximately simulate the respective average observed flowering date and harvest index, across the 3 seasons. Cowpea yields in 2003/04 (Experiment 2) were severely constrained by aphids. In this case, the simulated plant population was manipulated to generate the observed low biomass production. This was deemed necessary in order to more adequately test simulation of the observed N2-fixation and residual N effects on the subsequent sorghum yield. Similarly, the SV4 treatment in Experiment 2 had poor crop establishment and produced no grain in 2003/04. It was simulated with a low plant population (0.5 plants m-2) to simulate some biomass and N uptake in this season and thereby, a lower residual N supply to the following sorghum in 2004/05. Reporting and data analysis The model was set to report all selected data on a daily basis. Total biomass and grain yield were reported on a dry weight basis (0 % moisture content). Elsewhere, Genstat 8.1 was used to analyse observed total biomass and grain yield for both legumes and sorghum (Chapter 4). The root mean square deviation (RMSD) values were calculated
111

Chapter 5
for the comparisons of all observed and predicted data. The RMSD is the weighted difference between predicted and observed. The formula for the calculation is shown by equation 1.
( )5.0
2
⎥⎥⎦
⎤
⎢⎢⎣
⎡
⎟⎟⎠
⎞⎜⎜⎝
⎛ −= ∑
nPO
RMSD Equation 1 Where O and P are the paired observed and predicted yields and n is the number of observations (Hill et al., 2006). Results Soil water Predicted and observed total soil water in the 0-0.35 m soil layer in Experiment 1 and Experiment 2 are shown in Figure 3. As there were no statistically significant differences between treatments in measured soil water profiles in Experiment 1, we have included the measured soil water for the SV4 plots only, and the predicted soil water for a subset of the simulated treatments. For the legume phase in Experiment 1, there was very little difference in predicted water use patterns between the legumes and sorghum, except for the pigeonpea treatment which had the lowest biomass growth and therefore the least water demand. In general, the predicted water use patterns are in line with those observed for sorghum. The reason for lack of difference between legumes and the sorghum in the model is a consequence of the high NO3-N availability (39 kg N ha-1) at the start of this experiment, meaning that the sorghum growth was not overly N stressed relative to the legumes for the moisture availability in this low rainfall season. For the wet 2003/04 season, soil water in Experiment 1 was well predicted in the period preceding sorghum planting (day 275 to day 335). In the subsequent cropping period there was no difference in predicted water use patterns for the sorghum crops following the legume phase treatments, except for sorghum following sorghum between day 425 and 455 which had less predicted water use than sorghum following legumes. In the model, this simulated difference in water use is a consequence of the lower N supply, less biomass production and therefore less water demand compared with sorghum following the legumes.
112

Simulation of legume-sorghum rotations
A) Experiment 1
0.0
10.0
20.0
30.0
40.0
50.0
60.0
70.0
5 35 65 95 125 155 185 215 245 275 305 335 365 395 425 455 485 515 545 575 605
Day from 1 January 2003
Soilw
ater
_0-3
5 cm
(mm
)
Pred_ICEAP 00535 Pred_86D 719 Pred_Natal Common Pred_sorghum Obs_sorghum
Soilwater reset to 1st Observed
Overall RMSD = 15.8legume 2002/03 sorghum (2003/04)Fallow
R2 = 0.58
B) Experiment 2
0.0
10.0
20.0
30.0
40.0
50.0
60.0
70.0
25 45 65 85 105 125 145 165 185 205 225 245
Day from 1 November 2003
Soilw
ater
_0-3
5 cm
(mm
)
Pred_ICEAP 00535 Pred_CBC1 Pred_Natal Common Pred_sorghum
Obs_ICEAP 00535 Obs_CBC1 Obs_Natal Common Obs_sorghum
Soilwater reset to 1st Observed Overall RMSD = 7.1
legumes 2003/04R2 = 0.65
Figure 3. Observed (Obs) and predicted (Pred) soil water simulations in Experiment 1 (A) and Experiment 2 (B) at Lucydale. Experiment 1 measurements cover the period 7 January 2003 to 15 June 2004, while Experiment 2 measurements cover 25 November 2003 to 15 June 2004. Legumes of which results are shown are pigeonpea (ICEAP 00535), cowpea (CBC1) and groundnut (Natal Common). In the sorghum phase, there were also a number of periods where the model over-predicted soil water relative to the observed, for example between day 305 and 335, around day 365 and towards the end of the simulation period. Given the rainfall
113

Chapter 5
patterns during the earlier 2 periods, the degree of drying in the observed values is difficult to understand. One explanation may be water uptake by weed growth. We assumed no weed growth in the simulated rotations, consistent with the experimental protocol. While this was perhaps valid for the drier 2002/03 and 2004/05 seasons, the wet conditions in 2003/04 defied the good intentions of 3 weeding operations. This conclusion is supported by results from an adjoining experiment where in excess of 1000 kg of actively-growing weed biomass was measured at the end of a sorghum crop that had also been weeded on 3 occasions and at about the same time as our experiments. In Experiment 2, there were more obvious differences between the observed water use patterns of the legume and sorghum treatments, albeit with some inconsistencies. For example, the observed soil water for this experiment in Figure 3b shows there is substantial drying of the profile for all treatments from day 45 to 65 when the crop is in the early growth phase following planting on day 35. Whereas, during the relatively dry February period (day 93-121, 43mm rainfall; Figure 1) when the crops are approaching full vegetative growth, there is much less evidence of soil drying. Consequently there are some large discrepancies between the observed and predicted soil water in Experiment 2. In the early vegetative phase, the predicted water use by groundnut far exceeded that of sorghum, cowpea and pigeonpea (but within the extent of the observed data). The lower predicted water use by these 3 crops is in line with their lower biomass production at this time; in sorghum because of the low plant population used in this experiment (0.5 plants m-2), in pigeonpea because of its species related slow establishment, and in cowpea because of the low population used to reflect the effects of aphid damage on biomass production in this season. In the subsequent period (day 85-145), the simulated water use by sorghum and cowpea is much less than that of pigeonpea and groundnut, both of which had the highest biomass production in this season (Figure 5). By day 150, the simulated sorghum, cowpea and groundnut had reached maturity; hence we see only pigeonpea continuing to use soil water beyond this point. However, the simulated maturity date for the pigeonpea (day 204) is 22 days later than when the actual field crop was harvested, suggesting that the crop growth parameters describing the phenology and/or the stress functions affecting phenology of the pigeonpea cultivar can be improved upon.
114

Simulation of legume-sorghum rotations Simulation of crop yields in the legume phase Phenology, total biomass and grain Days to 50% flowering was measured in Experiment 1 and 3. Figure 4 shows the observed and predicted flowering days after sowing (das) in the 2 experiments. No data were collected for sorghum in Experiment 3. In the case of groundnut, the result reflects calibration of the crop input parameters to the observed data.
A) Experiment 1
0
20
40
60
80
100
120
ICPL 87091 ICEAP00535
86D 719 CBC1 NatalCommon
Nyanda Sorghum
Days
afte
r so
win
g
Observed Predicted
RMSD = 8
B) Experiment 3
0
20
40
60
80
100
120
ICPL 87091 ICEAP00535
86D 719 CBC1 NatalCommon
Nyanda Sorghum
Days
afte
r so
win
g
Observed Predicted
RMSD = 29
Figure 4. Observed and predicted flowering days after sowing (das) in Experiment 1 (2002/03) (A) and Experiment 3 (2004/05) (B) at Lucydale. No data available for sorghum in (B). There was good agreement for cowpea flowering in both experiments, and pigeonpea flowering in Experiment 1. The predicted flowering for sorghum in both experiments (about 70 das) is more in line with expectation for this cultivar. In Experiment 3, predicted pigeonpea flowering is 27 days beyond the measured date, at 102 das. This is
115

Chapter 5
the same number of days to flowering predicted by the model in experiment 2. These results suggests that the delayed maturity of the pigeonpea discussed above in relation to soil water use in experiment 2, is a consequence of over-predicting the duration of the vegetative phase. In general, the model gave good prediction of the observed total biomass and grain yield of the legume varieties across the three cropping seasons (Figure 5). The main exception was an under-prediction in total biomass for Nyanda groundnut, and over-prediction of its grain yield, in the 2002/03 season. Prediction of total biomass and grain yield of sorghum in both Experiment 1 and 3 was very close to the observed yields. The simulated cowpea and sorghum yields in 2003/04 in Figure 5 have been influenced by modification of the plant population to capture effects of aphid damage or poor plant stands on biomass production observed in these treatments.
Total Biomassa) 2002/03
0
1000
2000
3000
4000
5000
6000
c) 2004/05
0
1000
2000
3000
4000
5000
6000
ICPL87091
ICEAP00535
86D 719 CBC1 NatalCommon
Nyanda Sorghum
Observed TBMPredicted TBM
b) 2003/04
0
1000
2000
3000
4000
5000
6000
Tota
l bio
mas
s yi
eld
(kg
ha-1)
Graina) 2002/03
0
500
1000
1500
2000
2500
b) 2003/04
0
500
1000
1500
2000
2500
Gra
in y
ied
(kg
ha-1
)
c) 2004/05
0
500
1000
1500
2000
2500
ICPL87091
ICEAP00535
86D 719 CBC1 NatalCommon
Nyanda Sorghum
Observed grain
Predicted grain
Figure 5. Observed and predicted total biomass and grain yield of legumes across three cropping seasons at Lucydale. Error bars represent standard errors of the means of the yields. Sorghum failed to establish in 2003/2004.
116

Simulation of legume-sorghum rotations
0
20
40
60
80
100
120
140
0 20 40 60 80 100 120 140
Measured N uptake (kg ha-1)
Pred
icte
d N
upt
ake
(kg
ha-1
)
Expt 1 Expt 2 Expt 3 sorghum 1:1 line
RMSD = 17
R2 = 0.72
Figure 6. Plot of observed against predicted legume and sorghum nitrogen uptake across three seasons at Lucydale. Experiment represents the seasons as Experiment 1 (2002/03), Experiment 2 (2003/04) and Experiment 3 (2004/05). The cowpea data is excluded in Experiment 2 due to aphid damage. Legume nitrogen uptake The predictions for N uptake by legumes were generally good (RMSD = 17 kg N ha-1) particularly in the 2003/04 (Experiment 2) and the 2004/05 (Experiment 3) seasons (Figure 6). The model also predicted N uptake by sorghum close to that observed in 2002/03 and 2004/05 (the two seasons where comparisons were possible). In Experiment 1, the model under-predicted N uptake for cowpea 86D 719 and the two groundnuts, where the measured values ranged between 102 and 131 kg ha-1. The high N uptake observed for these treatments were due to a combination of high total biomass yields (which the model generally under-predicted, Figure 5) and high N content of legume stover (2.7 – 3.5%N), particularly when compared to that measured in the subsequent years for Experiment 2 (mean 2.5%N) and 3 (mean 2.0%N) (Chapter
117

Chapter 5
4). At the same time, the 97 kg of N taken up by the CBCI variety in Experiment 1 was well predicted by the model, but mainly due to over-prediction of its total aboveground biomass (Figure 5). Where sorghum was simulated with a very low plant population (0.5 plants m-2) in Experiment 2, the simulated N uptake was 8 kg N ha-1. Nitrogen fixation In Chapter 4 we assessed N2-fixation of the legumes in the study using the 15N natural abundance and N difference methods. Figure 7 shows model predictions for N fixation in relation to the earlier reported N fixation estimates, modified here to fixed N in above ground plant components. In the case of the 15N natural abundance method, the model generally over-predicted the N2-fixation by some margin; RMSD = 22 kg N ha-1 (Figure 7a). The N difference method had generally higher estimates, and was more in line with the model predictions as shown by a lower RMSD (16 kg N ha-1, Figure 7b). In particular, there was very good agreement between the model predictions and the difference method for the wet 2003/04 season (Expt. 2). In contrast, there was a consistent over-prediction for the drier 2004/05 season (Expt. 3). The 3 points that are substantially under-predicted by the model in Experiment 1 (Figure 7b) are the same treatments that were discussed above in relation to having very high N uptake relative to the reference sorghum uptake (47 kg N ha-1), which was well predicted by the model (Figure 6).
a) N2-Fixation - 15N natural abundance method
0
15
30
45
60
75
90
0 15 30 45 60 75 90Measured N2-fixation (kg ha-1)
Sim
ulat
ed N
2-fix
atio
n (k
g ha
-1)
Expt1
Expt2
Expt3
1:1 Line
RMSD = 22
b) N2-Fixation - Difference method
0
15
30
45
60
75
90
0 15 30 45 60 75 90Measured N2-fixation (kg ha-1)
Sim
ulat
ed N
2-fix
atio
n (k
g ha
-1)
Expt1Expt2Expt31:1 Line
RMSD = 16
Figure 7. Predicted and measured nitrogen fixation using the 15N natural abundance and the difference methods over 3 seasons at Lucydale. Expt represents the seasons as Experiment.1 (2002/03), Experiment 2 (2003/04) and Experiment 3 (2004/05). The cowpea data is excluded in Experiment 2 due to aphid damage.
118

Simulation of legume-sorghum rotations Simulation of sorghum yields in rotations Sorghum total biomass and grain yield Figure 8 shows the observed and predicted total biomass (TBM) and grain yield for the first sorghum crop following the legumes phase in Experiment 1 (2003/04) and Experiment 2 (2004/05), with removal, or, with incorporation of the crop residues. For the observed grain yield data, variety treatment means were statistically different only in the 2003/04 season (p < 0.05), and there were no significant differences in grain yield between plots with removal and with incorporation of residues in either season (Chapter 4). In 2003/04, the model simulates no difference in total biomass or grain yield of sorghum in response to removal and incorporation of the different legume residues (Figure 8a and 8c). This is consistent with the statistical analysis of the observed yields. For the legume-sorghum rotations, the model generally under-predicted the observed TBM yield of sorghum and consistently over-predicted the observed grain yield. Hence the model simulated a much higher harvest index (0.49) for sorghum than was observed (0.30) in this wet season, and the simulated TBM, grain yield or HI was not responsive to additional inputs of N (via residues) in the legume-sorghum rotation. In contrast, for the sorghum-sorghum rotation, the model simulated a large reduction in both TBM and grain yield with incorporation of sorghum residues compared to its removal. In doing so, the model substantially over-predicted the observed TBM and grain yield of the removal treatment, while predicting observed yields of the incorporation treatment very closely. The simulated HI decreased from 0.5 with removal of residues to 0.4 with incorporation, suggesting that a N stress was simulated where the high C:N ratio sorghum residues (68:1) were incorporated. In contrast, the observed HIs suggested the reverse, 0.31 with removal and 0.36 with incorporation of sorghum residues, but this difference was not statistically significant. In 2004/05, observed and predicted TBM and grain yield of sorghum following legumes, with removal and with incorporation of residues, had lower yields compared to 2003/04 (Figure 8 b & d). This reflects the much lower rainfall in 2004/05 (Figure 1), but also the lower N inputs (for example. N content of incorporated residues in 2003/04 was 55-97 kg N ha-1, whereas in 2004/05, it was 10-47 kg N ha-1). For this season, the predicted TBM of sorghum following cowpea and groundnut is in close agreement with the observed yields, while the predicted grain yields are generally close to, but below the observed grain yields. TBM and grain yield of sorghum
119

Chapter 5
following pigeonpea are substantially under-predicted compared to the observed yields.
a) Experiment 1 Sorghum 1-TBM (2003/04)
0
1000
2000
3000
4000
5000
6000
ICPL 8
7091
ICEAP 00
535
86D 71
9CBC1
Natal C
ommon
Nyand
a
Sorghu
m
ICPL 8
7091
ICEAP 00
535
86D 71
9CBC1
Natal C
ommon
Nyand
a
Sorghu
mTota
l bio
mas
s yi
eld
(kg
ha-1)
Observed Predicted
No residues Incorporated residues
b) Experiment 2 Sorghum 1-TBM (2004/05)
0100020003000400050006000
ICPL 8
7091
ICEAP 00
535
86D 71
9CBC1
Natal C
ommon
Nyand
a
Sorghu
m
ICPL 8
7091
ICEAP 00
535
86D 71
9CBC1
Natal C
ommon
Nyand
a
Sorghu
m
Tota
l bio
mas
s (k
g ha
-1)
Observed Predicted
No residues Incorporated residues
c) Experiment 1 Sorghum 1 Grain (2003/04)
0
500
1000
1500
2000
ICPL 8
7091
ICEAP 00
535
86D 71
9CBC1
Natal C
ommon
Nyand
a
Sorghu
m
ICPL 8
7091
ICEAP 00
535
86D 71
9CBC1
Natal C
ommon
Nyand
a
Sorghu
m
Gra
in y
ield
s (k
g ha
-1)
Observed Predicted
No residues Incorporated residues
d) Experiment 2 Sorghum 1 Grain (2004/05)
0
500
1000
1500
2000
ICPL 8
7091
ICEAP 00
535
86D 71
9CBC1
Natal C
ommon
Nyand
a
Sorghu
m
ICPL 8
7091
ICEAP 00
535
86D 71
9CBC1
Natal C
ommon
Nyand
a
Sorghu
m
Gra
in y
ield
(kg
ha-1)
Observed Predicted
No residues Incorporated residues
Figure 8. Predicted and observed rotation sorghum total biomass (a and b) and grain (c and d) yields following pigeonpea (ICPL 87091 and ICEAP 00535), cowpea (CBC1 and 86D 719), groundnut (Natal Common and Nyanda) and sorghum over two seasons at Lucydale.
120

Simulation of legume-sorghum rotations For sorghum following sorghum, observed and predicted TBM and grain yields were higher in the drier 2004/05 season, except for simulated grain yield in the residues removed treatment (which was over-predicted by the model, Fig 8b). Also, unlike in 2003/04, there is no negative effect of sorghum residue incorporation on simulated TBM and grain yields. The results for this treatment can be explained by the low amount of sorghum residues incorporated this season (800 kg ha-1) compared to 2003/04 (3600 kg ha-1), combined with lower plant N demand under the drier seasonal conditions, such that a N deficit in the soil N supply did not eventuate. Sorghum N uptake The observed and simulated N uptake in the first phase sorghum crops in the 2003/04 and 2004/05 seasons, for incorporated and removed residue treatments is shown in Figure 9. There is much more scatter in the sorghum uptake predictions compared to that simulated for the legume phase crops (Figure 6). Measured N uptake by sorghum showed little difference between plots with and without residues, whereas the model simulated much higher uptake where legume residues were incorporated. Hence the simulated N uptake suggests that the N in the legume residues was readily available, but that the additional N supply had no effect on simulated TBM or grain yield responses in the 2 seasons (Figure 8). Also, prediction of N uptake by sorghum after sorghum is more variable compared to the close predictions achieved for sorghum crops in the legume phase (see Figure 6). Sorghum N uptake was under-predicted by APSIM in both the 2003/04 and the 2004/05 seasons (Figure 9). Measured values of N uptake showed little difference between plots with and without residues, but the model simulated that sorghum in plots with residues took up more N than sorghum in plots where no residues were added.
121

Chapter 5
0
10
20
30
40
50
0 10 20 30 40 50Measured N uptake (kg ha-1)
Pred
icte
d N
upt
ake
(kg
ha-1
)
Expt 1 no residues Expt 2 no residues Expt 1 + residues
Expt 2 + residues 1:1 line
RMSD = 12
Figure 9. Plot of predicted against observed sorghum nitrogen uptake at Lucydale over two cropping seasons (2003/04 and 2004/05). R2 no residues = 0.15, R2 + residues = 0.63. Simulation of the second sorghum rotation The model predicted the total biomass and grain yield of the second sorghum after legumes close to the observed yields in plots that had been planted with cowpeas and groundnuts in the 2002/03 season (Figure 10). However the model generally under-predicted grain and total biomass of sorghum in the plots previously planted with pigeonpea or which had sorghum residues incorporated.
122

Simulation of legume-sorghum rotations
a) Experiment 1 Sorghum 2-TBM (2004/05)
0
1000
2000
3000
4000
5000
ICPL 8
7091
ICEAP 00
535
86D 71
9CBC1
Natal C
ommon
Nyand
a
Sorghu
m
ICPL 8
7091
ICEAP 00
535
86D 71
9CBC1
Natal C
ommon
Nyand
a
Sorghu
m
Tota
l bio
mas
s (k
g ha
-1)
Observed Predicted
No residues Incorporated residues
b) Experiment 1 Sorghum 2-Grain (2004/05)
0
500
1000
1500
2000
ICPL 8
7091
ICEAP 00
535
86D 71
9CBC1
Natal C
ommon
Nyand
a
Sorghu
m
ICPL 8
7091
ICEAP 00
535
86D 71
9CBC1
Natal C
ommon
Nyand
a
Sorghu
m
Gra
in y
ield
(kg
ha-1)
Observed Predicted
No residues Incorporated residues
Figure 10. Predicted and observed second rotation sorghum total biomass and grain yields following pigeonpea (ICPL 87091 and ICEAP 00535), cowpea (CBC1 and 86D 719), groundnut (Natal Common and Nyanda) and sorghum over two seasons at Lucydale. The error bars represent standard errors of difference between means of the previous legume variety and residues. Simulation of nitrogen and water stress in the rotation Analysis of the simulated stress factors on crop growth showed interesting results: the nitrogen and water stress predictions in Experiment 1 across the three cropping seasons are shown under situations with both residue removal (Figure 11) and residue incorporation (Figure 12). When the stress value is 1 the crop experiences no stress and when the value is 0 the crop will be under severe stress.
123

Chapter 5
a) N stress in the rotation - residues removed
0
0.1
0.2
0.3
0.4
0.5
0.6
0.7
0.8
0.9
1D
ecem
ber
Janu
ary
Febr
uary
Mar
ch
Dec
embe
r
Janu
ary
Febr
uary
Mar
ch
Dec
embe
r
Janu
ary
Febr
uary
Mar
ch
Apr
il
2002 2003 2004 2005
Stre
ss
legume-sorghum rotation N stress continuous sorghum N stress
sorghum 1 (2003/04) sorghum 2 (2004/05)legume (2002/03)
b) Water stress in the rotation - residues removed
0
0.1
0.2
0.3
0.4
0.5
0.6
0.7
0.8
0.9
1
Dec
embe
r
Janu
ary
Febr
uary
Mar
ch
Dec
embe
r
Janu
ary
Febr
uary
Mar
ch
Dec
embe
r
Janu
ary
Febr
uary
Mar
ch
Apr
il
2002 2003 2004 2005
Stre
ss
legume-sorghum rotation_water stress continuous sorghum_water stress
legume (2002/03) sorghum 1 (2003/04) sorghum 2 (2004/05)
Figure 11. Nitrogen and water stress predictions in the legume sorghum rotation with residues removed, over three cropping seasons at Lucydale. The open symbols represent plots planted with legumes in 2002/03, while the black symbols represent plots planted with sorghum in 2002/03.
124

Simulation of legume-sorghum rotations
a) N stress in the rotation - residues incorporated
0
0.1
0.2
0.3
0.4
0.5
0.6
0.7
0.8
0.9
1D
ecem
ber
Janu
ary
Febr
uary
Mar
ch
Apr
il
Dec
embe
r
Janu
ary
Febr
uary
Mar
ch
Apr
il
Janu
ary
Febr
uary
Mar
ch
Apr
il
2002 2003 2004 2005
Stre
ss
legume sorghum rotation_N stress contnuous sorghum_N stress
sorghum 1 (2003/04) sorghum 2 (2004/05)legume (2002/03)
b) Water stress in the rotation - residues incorporated
0
0.1
0.2
0.3
0.4
0.5
0.6
0.7
0.8
0.9
1
Dec
embe
r
Janu
ary
Febr
uary
Mar
ch
Apr
il
Dec
embe
r
Janu
ary
Febr
uary
Mar
ch
Apr
il
Janu
ary
Febr
uary
Mar
ch
Apr
il
2002 2003 2004 2005
Stre
ss
legume sorghum rotation water stress continuous sorghum_water stress
legume (2002/03) sorghum 1 (2003/04) sorghum 2 (2004/05)
Figure 12. Nitrogen and water stress predictions in the legume sorghum rotation with residues incorporated over three cropping seasons at Lucydale. The open symbols represent plots planted with legumes in 2002/03, while the black symbols represent plots planted with sorghum in 2002/03. In the first season of planting (legume phase) only the sorghum crop showed slight (0.6) N stress towards the end of the season (Figure 11a and 12a (legume 2002/03)),
125

Chapter 5
whereas both legume and sorghum crops experienced episodes of water stress from 30 days after sowing until the end of the season (Figure 11b and 12b). In the wet 2003/04 season, no moisture stress was simulated for the legume-sorghum or the sorghum-sorghum treatments except briefly in the dry February/March period where legume residues had been incorporated and the higher N supply presumably resulted in higher crop growth and water demand (Figs 11b, 12b, 2003/04) . Accordingly, the model simulated no N stress during crop growth in the legume-sorghum treatment where residues had been incorporated (Figure 12a, 2003/04). Where legume residues had been removed, N stress was simulated late in the sorghum crop and rapidly approached the N stress levels simulated for sorghum-sorghum treatment, which had experienced N stress much earlier in the season and approached 0.4 at crop harvest (Figure 11a, 2003/04). Where sorghum residues were incorporated, the simulated N stress was much more severe, approaching 0.5 at about flowering and 0.2 at harvest (Figure 12a, 2003/04). In the dry 2004/05 season, severe N stress was simulated for the continuous sorghum plots, with the degree of stress continuing to be more extreme where sorghum residues had been incorporated in the 2002/03 season (Figures 11a and 12a, 2004/05). Significantly, no moisture stress was simulated in the continuous sorghum plots in this dry season, except for a brief period in the no residue plots in which the simulated N stress was less (Figures 11b and 12b, 2004/05). In contrast, very high levels of moisture stress were simulated in the legume-sorghum plots, with or without incorporated legume residues. The simulated N stress in the legume-sorghum plots in 2004/05 was delayed appreciably compared to the sorghum-sorghum treatment, but was more severe where legume residues had been removed (0.3) compared to incorporated (0.7). Discussion In this study, we evaluated the performance of APSIM to simulate observed responses of legume-cereal rotations. The model was first used to simulate soil water under various legumes and sorghum. The model was then used to predict total biomass and grain yields of the same crops across three seasons, and also to predict grain yield of sorghum grown in rotation. Finally the model was used to explore nitrogen and water stress dynamics within the legume-cereal rotation. Elsewhere, APSIM has been tested extensively in Australia to predict yields of forage, pasture and grain legumes (Robertson et al., 2002; Whitbread and Clem, 2006; Hill et al., 2006). APSIM has also been tested on pigeonpea extra-short, short and medium duration varieties in India
126

Simulation of legume-sorghum rotations (Robertson et al., 2001). There are no reported APSIM model testing studies of groundnut, pigeonpea and cowpea or sorghum rotations in semi-arid Southern Africa. Our discussion therefore centres on qualifying APSIM’s performance and explaining the additional understanding that comes from using a simulation model in conjunction with experimental data to study the dynamics of a complex cropping system such as legume-cereal rotations in a highly variable rainfall environment. Simulation of soil water Simulation of soil water use by legumes and sorghum crops was generally good for the wet and dry cropping seasons in the two experiments that were simulated (Figure 3). Good prediction of soil water re-charge in the pre-sowing period in 2003/04 season and the dry down of the soil profile by the crop during grain-filling and into the dry season by soil evaporation was also evident for this semi-arid environment. However, over-prediction of observed soil water, especially post-harvest, indicated the need to consider weed growth in simulating the water (and by implication N) balance of sequential cropping systems. The importance of adequate simulation of crop phenology, and thereby crop duration, in simulating the soil water balance was also highlighted in the case of pigeonpea in Experiment 2 (Figure 3b). However, the most encouraging result was how well the model captured the interaction of N supply on crop growth and soil water use. This was illustrated by the lack of a difference in the water use between the legume and sorghum plots in the 2002/03 season where the sorghum had a high starting mineral N supply, and the much higher water use evident for the N fixing groundnut and cowpea in the wet 2003/04 season, where low water use by the sorghum was a response to its lower soil N supply in this moisture-unlimited season. Crop parameters The phenology, biomass accumulation and grain partitioning of the pigeonpea, cowpea and sorghum cultivars used in this experiment were found to be adequately described by selecting from existing cultivar parameters in APSIM. In the case of groundnut, new cultivar parameters were constructed and calibrated using the observed harvest index and flowering data. However, it should be realised that adjustment of the groundnut cultivar growth coefficients done in this study is specific to the results and conditions of this experiment. It has also been suggested that the simulation of the pigeonpea vegetative stage was over-extended, with consequences for the simulation of crop duration and soil water balance. Studies are therefore required to determine the
127

Chapter 5
growth and phenology parameters under controlled, non-stress conditions for proper parameterisation of the African cultivars. Legume yields, N uptake and N2-fixation Legume Yields The model showed good prediction of total biomass and grain yields of the legumes in all three cropping seasons (Figure 5), providing evidence that APSIM was able to capture the effects of very wet and very dry seasons (Figure 1) on crop production quite well. The equally good performance in biomass (RMSD = 643 kg ha-1, R2 = 0.65) and grain (RMSD = 221, R2 = 0.79) prediction is also indicative that biomass accumulation and partitioning to grain is generally well simulated by the legume and sorghum crop modules under these range of conditions. Legume N uptake Results of predicted N uptake of legume crops was generally very good (Figure 6), suggesting that the combined uptake of N via N2-fixation and soil N supply was well simulated by the model. In the absence of any inorganic fertiliser application, the very good prediction of sorghum N uptake in Experiment 1 and 3 (Figure 6) is a strong indicator that the APSIM’s routines for mineral N supply from soil organic matter (and sorghum uptake of that N) perform well for the soil and sorghum growth conditions of this environment. However, in Experiment 1, observed N uptake by legumes in excess of 100 kg N ha-1 was substantially under-predicted by the model. Given the very high soil mineral N at the start of this experiment (39 kg N ha-1); it is possible that the plant N coefficients that allow for luxury consumption of N may need to be adjusted higher. On the other hand, the very high N concentrations measured in legumes this season compared to the other 2 seasons, suggest that this result may also be an experimental artefact. Nevertheless, the case of good prediction of N uptake for the cowpea cultivar (97 kg N ha-1) due to over-prediction of TBM, serves to highlight the value of having multiple plant components measured in order to more rigorously test the accuracy of model predictions. N2-fixation The performance of APSIM to simulate measured N2-fixation in this study varied with the method used to determine N2-fixation. The 15N natural abundance method is generally considered the more reliable analytical approach to determining N2-fixation. In this study, its estimates for N2-fixation in above ground plant materials were substantially lower than those derived by the difference method (Figure 7b). However,
128

Simulation of legume-sorghum rotations the lower natural abundance method estimates in this case would imply inconceivably high N supply from soil organic matter. For example, in Experiment 1, for the observed N uptake (Figure 6) and the proportion of N fixed by the natural abundance method, the implied soil N supply to the legumes is in the order of 56 to 109 kg N ha-1 from a soil with quite low SOC (Table 2) and in a below average rainfall season. For Experiment 2 the implied amounts are lower, but still range as high as 47 kg N ha-1 from a soil with SOC of 0.4%. Only in Experiment 3 is the implied soil N supply in a range (6-25 kg N ha-1) commensurate with expected mineralizing capacity of the soil. The difference method explicitly takes the N supply capacity of the soil into account by using the reference plant (in this case, sorghum) as the bioassay of its supply. In turn, the model simulates the supply of mineral N to the legume taking into account the organic N status of soil layers, its mineralization of N in relation to changing water conditions (along with other factors), the presence of roots in a layer and demand of the legume crop for uptake. N2-fixation is simulated when the soil N supply from all currently accessible layers is unable to meet the N demand for daily biomass production. It is a function of N2-fixation rate (varies according to crop and crop stage), crop biomass and the prevailing water stress conditions for N2-fixation. Hence the model approach is much more aligned to the difference method and its closer agreement with the method’s N2-fixation estimate is therefore understandable, especially in this case as the model was able to predict the N uptake of the sorghum very closely (Figure 7). One conclusion to be drawn from this is that the modelling approach could be used as an alternative method in assessing N2-fixation, with benefits of higher flexibility and lower resource costs, particularly relevant factors for this type of research in the context of Africa’s low capacity. For example, the model could take the role of a non-nodulating legume as the reference plant, by having N2-fixation turned off in the model, but have the same above and below ground growth dynamics and N demand as the target legume, a major drawback when using a crop like sorghum as the reference plant. However, it is also apparent that more model evaluation and development is warranted. For example, it is instructive that the model gave very good predictions of N2-fixation in the wetter 2003/04 season, but consistently over-predicted N2-fixation in the drier 2004/05 season, and that this was accompanied by a general over-prediction of the legume biomass in this experiment (Figure 5). The implications are that simulated N2-fixation was not restrained sufficiently in the dry conditions, allowing
129

Chapter 5
the excess growth to take place. Hence it is possible that the water-stress relationship for simulating N2-fixation may need further evaluation and development. Sorghum yield and N uptake in rotations In this study, APSIM has shown some capability in simulating legume-sorghum rotations in southern Africa. In particular, it performed well in predicting the responses of sorghum biomass and grain yield in rotation with the groundnut and cowpea legumes. Sorghum yields following pigeonpea were however, generally under-predicted. One explanation for this is that the model did not simulate any leaf fall for pigeonpea because the detachment parameter is turned off in the released version of APSIM Version 5.1. We tested turning this parameter on such that 50 % of senesced leaf material was detached from the standing plant (and added to surface organic matter). This did improve simulation of the yields in the following sorghum crop but at the expense of under-predicting the observed total biomass of pigeonpea at the end of the legume phase. In the case of legume residue incorporation and removal, the model performed remarkably well in predicting the observed non-response of biomass or grain yield to the incorporated legume materials. Hence, in Experiment 1 for example, despite the addition of 50 to 100 kg N ha-1 in the incorporated legume residues having C:N ratios (11 to 20) highly favourable to mineralization of N, and under conditions of almost no water limitations, the model simulated no additional biomass or grain yield compared to the residue removed treatment (Figure 8 a and c). However, unlike the observed N uptake, the model predicted that a large proportion of the added N was taken up by the sorghum (Figure 9). One explanation for the lack of response to legume residue incorporation is that the below ground changes in soil organic N supply brought about by the legume crops was sufficient to meet the needs of sorghum growth in this high yielding season, and that these soil changes were adequately captured in the model through additions of legume root material and spared N effects. At the same time, however, the over-prediction of N uptake by the model may be the result of under-predicting NO3 leaching in this high rainfall season. Simulation of sorghum-sorghum responses was more problematic, with the model generally over-predicting sorghum yields in the first rotation sorghum crop, especially with residues removed, and under-predicting sorghum yields in the second rotation (Figure 10). However, interpretation of the simulated responses is made difficult in this case by responses in the observed data that are hard to understand. For example,
130

Simulation of legume-sorghum rotations the C:N ratio of sorghum residues incorporated in Experiment 1 and 2 were in excess of 60:1, yet there was no observed yield differences in the sorghum response (i.e. TBM or grain), between the residue treatments in either season. In the wet 2003/04 season, the model did respond as expected, by simulating lower crop yields for the incorporation treatment as a result of simulated N immobilisation by the high C:N residue additions, but this was completely at odds with the observed results. An important factor in the overall better simulations of legume phase crops compared to the rotation crops is that initial conditions for soil mineral N, soil water and in the case of Experiment 1, the plant population of the crops were known and input into the model. For sorghum in the legume phase, this resulted in very accurate prediction of observed sorghum TBM, grain yield and N uptake in Experiment 1 and 3 (Figure 5 and 6). Simulation of the rotational sorghum yields could be improved if this information had also been known at sowing of these crops, in particular the sorghum populations. Mineral N data at the start of the sorghum rotation crops would also serve to better assess how well the model is simulating inorganic N supply from the soil organic matter and in particular, changes in this supply brought about by the legume phase. Simulation of nitrogen and water stress The model output of N and water stress factors on plant growth was very instructive in better understanding the water, N and plant growth interactions within a cropping season, as well as the residual benefits of legumes interacting with variable seasonal conditions. The model results suggest that the productivity of a legume phase in this environment can overcome the N supply deficits of the low carbon soils for sorghum production in south-western Zimbabwe for up to 2 seasons of sorghum production. Importantly, it (and the experimental results) shows that this can be largely achieved even if the legume stover is removed and used for other purposes such as animal feed. However, the trade-off in this low rainfall environment is that by removing the N constraint, the sorghum crops are much more likely to experience increased water stress. Alternatively, if the N constraint is not removed, then the N stress will greatly limit the use of available moisture, even in a very dry season such as 2004/05 (Figures 11 and 12b, 2004/05)
131

Chapter 5
Conclusions The main objectives of modelling the results of the Lucydale experiment were to assess how accurately the APSIM model would predict the observed legume and rotation sorghum yields. The other objective was to assess how the model could assist in explaining the mechanism of the residual benefit of legumes to sorghum under dry conditions. The results of the study show that APSIM is capable of predicting legume and sorghum yields under semi-arid conditions in Southern Africa. The model gave satisfactory predictions of legume yields across the three cropping seasons, and also gave reasonable predictions of the yields of sorghum grown in the rotation. There is need to further calibrate the model crop parameters such as pigeonpea and groundnut. The APSIM model also gave insight into the dynamics of nitrogen and water in the rotations by showing that the residual benefits of legumes to subsequent sorghum were mainly due to nitrogen, rather than water under these semi-arid conditions. Further testing of the model will assist in understanding the role of processes such as N mineralisation of crop residues in the legume-cereal rotations. References Armstrong R D, McCosker K, Millar G, Kuskopf B, Johnson S, Walsh K, Probert M E
and Standley J 1999 Legume and opportunity cropping systems in central Queensland. 2. Effect of legumes on following crops. Aust J of Agric Res. 50, 925-936.
Bell J P 1987 Neutron probe practice. Report No. 19. Third Edition. Institute of Hydrology, Wallingford, England. pp 51.
Boddey R M, Peoples M B, Palmer B and Dart P J 2000 Use of the N-15 natural abundance technique to quantify biological nitrogen fixation by woody perennials. Nut Cycl Agroecosyt. 57, 235-270.
Delve R J and Probert M E 2004 Modelling nutrient management in tropical cropping systems. Australian Centre for International Agricultural Research (ACIAR), Canberra, AT; Centro Internacional de Agricultura Tropical (CIAT). p. 135-138. (ACIAR proceedings no. 114).
Dimes J and Malherbe J 2006 Climate variability and simulation modelling – challenges and opportunities, In Mgonja MA, Waddington S, Rollin D and Masenya M eds. 2006. Livelihoods in the Limpopo: CGIAR Challenge Program on Water and Food Project No 1. (CPWFPN1): Increased food security and income in the Limpopo basin through intergrated crops, soil fertility and water management options and links to markets. Proceedings of the
132
Simulation of legume-sorghum rotations
CPWFPN1 Inception Workshop, 25-27 Jan 2005, Polokwane. South Africa. PO Box 776, Bulawayo, Zimbabwe: ICRISAT. 132pp.
Dimes J, Muza L, Malunga G and Snapp S 2002 Trade-offs between investments in nitrogen and weeding: On-farm experimentation and simulation analysis in Malawi and Zimbabwe. 7th Eastern and Southern Africa Regional Maize Conference and Symposium on low-Nitrogen and Drought Tolerant - Tolerant Maize Nairobi, Kenya, 11-15th February, 2002.
Hill J O, Robertson M J, Pengelly B C, Whitbread A M and Hall C A 2006 Simulation modelling of lablab (Lablab purpureus) pastures in northern Australia. Aust J Agric Res. 57, 389-401.
Keating B A, Carberry P S, Hammer G L, Probert M E, Robertson M J, Holzworth D, Huth N I, Hargreaves J N G, Meinke H, Hochman Z, McLean G, Verburg K, Snow V, Dimes J P, Silburn M, Wang E, Brown S, Bristow K L, Asseng S, Chapman S, McCown R L, Freebairn D M and Smith C J 2003 An overview of APSIM, a model designed for farming systems simulation. European J Agron 18, 267-288.
Keating B A, Carberry P S and Robertson M J 1999 Simulating N fertiliser responses in low-input farming systems 2. Effects of weed competition. In Donatelli, M., Stockle, C., Villalobus, F., and Villar Mir, J.M. (eds), International Symposium, Modelling Cropping Systems, Proceedings European Soc. For Agronomy, Div. Agroclimatology and Agronomic Modelling, Lleida, Spain, 21-23 June 1999, 205-206.
Mapfumo P and Giller K 2001 Soil Fertilty Management Strategies and Practices by Smallholder Farmers in Semi Arid Areas of Zimbabwe. International Crops Research Institute for the Semi Arid Tropics (ICRISAT) with permission from the Food and Agricultural Organization (FAO). Bulawayo, Zimbabwe and Rome, Italy. 60p.
Mugwira L M and Murwira H K 1998 A review of research on cattle manure as a soil fertility amendment in Zimbabwe: Some perspectives. p. 195–201. In S.R. Waddington et al. (ed.) Soil fertility research for maize-based farming systems in Malawi and Zimbabwe. Soil Fert Net and CIMMYT-Zimbabwe, Harare.
Probert M E, Carberry P S, McCown R L and Turpin J E 1998 Simulation of legume-cereal systems using APSIM. Aust J Agricl Res. 49, 317-327.
Probert M E, Delve R J, Kimani S K and Dimes J P 2005 Modelling nitrogen mineralization from manures: representing quality aspects by varying C:N ratio of sub-pools. Soil Bio. Biochem. 37 279-287.
Ritchie J T 1972 Model for predicting evaporation from a row crop with incomplete cover. Water Resour. Res. 8, 1204–1213.
133

Chapter 5
Robertson M J, Carberry P S, Chauhan Y S, Ranganathan R and O'Leary G J 2001 Predicting growth and development of pigeonpea: a simulation model. Field Crops Res. 71, 195-210.
Robertson M J, Carberry P S, Huth N I, Turpin J E, Probert M E, Poulton P L, Bell M, Wright G C, Yeates S J and Brinsmead R B 2002 Simulation of growth and development of diverse legume species in APSIM. Aust J Agric Res. 53, 429-446.
Robertson M J, Sakala W, Benson T and Shamudzarira Z 2005 Simulating response of maize to previous velvet bean (Mucuna pruriens) crop and nitrogen fertiliser in Malawi. Field Crops Res. 91, 91-105.
Rowe E and Giller K 2003 Legumes for soil fertility in southern Africa: Needs, potential and realities. In ‘Grain Legumes and Green Manures for Soil Fertility in Southern Africa: Taking Stock of Progress’. (ed. SR Waddington). pp. 15-19. (Soil Fert Net-CIMMYT, Harare, Zimbabwe).
Sanginga N 2003 Role of biological nitrogen fixation in legume based cropping systems; a case study of West Africa farming systems. Plant Soil 252, 25-39.
Shamudzarira Z and Robertson M J 2002 Simulating the response of maize to nitrogen fertiliser in semi-arid Zimbabwe. Exp. Agric. 38, 79–96.
Shamudzarira Z, Waddington S R, Robertson M J, Keating B A, Mushayi P T, Chiduza C and Grace P 2000 Simulating N fertiliser response in low-input farming systems 1. Feriliser recovery and crop response. Risk Management Working Paper Series 00/05. Mexico D.F: CIMMYT. No. 720.
Twomlow S J 2004 Increasing the role of legumes in smallholder farming systems - The future challenge, p 29-46. In: Serraj R (ed). Symbiotic Nitrogen Fixation: Prospects for Application in Tropical Agroecosystems. Science Publishers, NH, USA.
Whitbread A, Braun A, Alumira J and Rusike J 2004 Using the agricultural simulation model APSIM with smallholder farmers in Zimbabwe to improve farming practices. In Tropical Legumes for Sustainable Farming Systems in Southern Africa and Australia. Eds A. Whitbread, and B. C. Pengelly, 171-80. ACIAR Proceedings, no. 115. Canberra: Australian Centre for International Agricultural Research. Reprint no. 5035.
Whitbread A M and Clem R L 2006 Graze to grain - measuring and modelling the effects of grazed pasture leys on soil nitrogen and sorghum yield on a Vertisol soil in the Australian subtropics. Aust. J. Agric. Res. 57, 489-500.
Williams J R and LaSeur W V 1976 Water yield model using SCS curve numbers. J. Hydraul. Div. American Society of Civil Engineers. 102 (HY9), 1241-1253.
134

CHAPTER 6
General discussion and conclusions


6. General discussion and conclusions Introduction Smallholder farmers in the semi-arid regions are vulnerable to food insecurity and are faced with continuing soil fertility decline (Chapter 2). There is potential for the smallholder farmers who have access to manure to increase cereal yields using small rates of manure and fertilizer (Chapter 3). The research also showed that it is possible to successfully grow grain legumes under the semi-arid conditions (Chapters 2 and 4), and derive substantial residual yield benefits to sorghum grown after the legumes (Chapter 4). Modelling the legume-sorghum rotation tested the capability of APSIM in modelling crop systems in the semi-arid southern Africa (Chapter 5). The model helped in explaining that the residual benefits of legumes were mainly due to the nitrogen supplied by the previous legume. It is important to analyse the implications of the research findings in order to understand the potential benefits and discuss areas that still need further research. Challenges faced by the semi-arid smallholder farmers Tsholotsho farmers experienced drought in one of the three years (2002/03) of resource flow mapping and at the end of this season all farmers had a grain deficit. In 2003/04 high rainfall occurred and grain production was adequate except in the poorly-resourced farms where a grain deficit still occurred (Chapter 2). The 2004/05 cropping season was also dry. This shows that potentially all farmers are faced with a constant threat of poor rainfall seasons and household food insecurity. Long term average rainfall figures confirm this (Figure 1). The 50 year average annual rainfall for Tsholotsho is 590 mm, according to the national rainfall averages. Drought frequency is estimated at once every 13 to 19 years (Scoones, 2001) in Zimbabwe and the semi-arid regions are usually more affected. Some of the lowest total rainfall records have been recorded recently suggesting a possible change in climate trends. Poor distribution of the already low rainfall is another challenge that the farmers face, and Tsholotsho is prone to the mid-season January dry spell which affects most of southern Zimbabwe.
137

Chapter 6
Tsholotsho seasonal rainfall trends (1962-80 and 1999-2005)
0
200
400
600
800
1000
120061
/62
62/6
3
63/6
4
64/6
5
65/6
6
66/6
7
67/6
8
68/6
9
69/7
0
70/7
1
71/7
2
72/7
2
73/7
4
74/7
5
75/7
6
76/7
7
77/7
8
78/7
9
79/8
0
80/8
1
98/9
9
99/0
0
00/0
1
01/0
2
02/0
3
04/0
4
04/0
5
Season
Tota
l rai
nfal
l (m
m)
Figure 1 Seasonal rainfall trends in Tsholotsho, 1962-1980 and 1999-2005. The dashed line represents the long term average rainfall (590 mm). The data for the period 1981-1998 was missing from the Tsholotsho weather station records. There is big resource endowment gap between the better-resourced and the poorly-resourced farmers in the Tsholotsho system. Better-resourced farmers own large implements such as the plough and a scotch cart (ox-drawn cart). Some medium-resourced farmers own some large implements as well, but the poorly-resourced farmers own no large implements. Better-resourced farmers own more livestock and they are also able to buy fertilizer to apply on their crops in good seasons. Even though the better-resourced farmers seem to be assured of draught power every season they are also vulnerable to reductions in livestock head sizes due to drought and outbreaks of animal diseases. Figure 2 shows trends in livestock numbers of the most common livestock in Tsholotsho district in the last 30 years.
138

General discussion and conclusions
0
20000
40000
60000
80000
100000
120000
140000
1975 1980 1985 1990 1995 2000 2005
Years
Live
stoc
k nu
mbe
r
Cattle Donkeys Goats Sheep
Figure 2 Livestock population trends for Tsholotsho district. Cattle and donkeys play an important role in providing draught power while goats provide income and food security. Source: Information Management Unit and AREX, Ministry of Agriculture, Zimbabwe. In 1992 Zimbabwe suffered a major drought and cattle numbers were reduced from 77 000 to 69 000 for cattle, while goat numbers fell drastically from about 40 000 to about 2000 in Tsholotsho District. In 1995 Tsholotsho experienced another reduction in cattle numbers due to another drought. Since 2000 Tsholotsho goat numbers which had risen to 139 000 have been reduced 101 000 (2005). A combination of factors is responsible for the reduction of both cattle and goat numbers. In 2002/03 Tsholotsho district experienced another drought, but at the start of the season a larger number of both goats and cattle was killed by a cold rain that occurred at the start of the season. Goats are also a source of income for the farmers; therefore the reduction is also due to sales. A reduction in livestock numbers also means a reduction in manure supply for both the better-resourced and medium-resourced farms. Medium-resourced and poorly-resourced farmers have limited means of replenishing soil fertility; therefore these two groups are continuously mining the soil. Low seasonal crop productivity in these two groups is therefore due to poor soil fertility, as also confirmed by the negative partial N balances. The diversity of the farmers in
139

Chapter 6
Tsholotsho means that there cannot be one soil fertility management recommendation to solve all problems in all resource groups. The research therefore assessed some of the options that farmers can adopt to improve food security. The potential benefits of using low rates of manure and fertilizer Participatory on-farm trials with farmers proved to be one option that could assist in improving cereal yields in the semi-arid Tsholotsho system (Chapter 3). Substantial increases in maize yield were observed over three cropping seasons using low rates of manure (3 and 6 t ha-1) and ammonium nitrate fertilizer (25 kg ha-1) that were below the current extension recommendations of 10 t ha-1 and 52 kg N ha-1 respectively. The most encouraging result of this study was the success of the researchers in collaborating with farmers in experimenting on a technology that was traditionally not common within the system. The results demonstrated that there is potential to improve livelihoods of the smallholder farmers in the dry environment, even though the results were applicable only for farmers who have access to manure. In this study the research would be suitable for the better-resourced farmers and some of the medium-resourced farmers. The positive outcome of this research is that ICRISAT has managed to convince Humanitarian Relief efforts in the country to promote small targeted doses of fertilizer – micro-dosing as one of their interventions, and one major fertilizer company to produce fertilizer in small affordable packs. There is currently a small packs fertilizer project being implemented by the organisation (ICRISAT). The main goal is to make fertilizer available in small affordable packs, a request made by the farmers at the end of the participatory experimentation (Chapter 3). Improving legume productivity in the semi-arid regions We also assessed the productivity of legumes both on-farm (Chapter 2) and on-station (Chapter 4). Cowpea and groundnut produced close to 1 t ha-1 of grain under a wet season in Tsholotsho, and cowpea produced above average yields in the other two dry seasons. These yields exceeded the yields obtained by farmers using their own sources of seed. It is therefore possible to produce legumes in the smallholder farms, but there is need to look at the issue of seed supply more closely. Shortage of seed was cited as the major reason for growing small areas of legumes by the farmers who participated in the resource flow mapping (Chapter 2). Legume productivity studies on-station further proved that legumes can produce high yields under the semi-arid environment (Chapter 4). Cowpea and groundnut varieties
140

General discussion and conclusions
gave yields of up to 1 t ha-1. Even newly introduced legumes like pigeonpea performed well. The poor establishment of Bambara groundnut from seed obtained from the market confirmed on-farm findings that the farmers’ legume germplasm was probably no longer viable. Therefore, one way of improving legume productivity in the smallholder farming sector would be to introduce new genetically viable varieties that are suitable for the dry environments. The potential of legume-cereal rotations under semi-arid regions Legume-sorghum rotation experiments showed that sorghum grown after legumes derived benefits that led to increased grain yield. Sorghum grain yields after legumes were more than double the yields of sorghum grown after sorghum (Chapter 4). We originally assumed that the yield benefits from legumes were either due to water remaining in soil after harvesting legumes or nitrogen fixed by the legumes the previous season. An assessment of water availability under the different legumes showed significant differences during the legume growth phase. At the start of the subsequent season (sorghum phase) water recharge was similar under the different legume plots. The assessment of N2-fixation showed that legumes fixed substantial amounts of nitrogen (up to 100 kg ha-1) using the N difference method. The 15N natural abundance method gave lower estimations probably because sorghum was not an appropriate reference plant in the experiment. Further assessment of the legume-sorghum rotations using APSIM showed good prediction of days to flowering, total biomass and grain yield in the legume phase (Chapter 5). The model also predicted the sorghum yields reasonably well. An assessment of the water and N dynamics during the legume phase and sorghum phase indicated that the residual effects of the legumes were driven by nitrogen more than water availability. Fitting the research results into the farming system Currently the farmers in semi-arid Tsholotsho, Mkhubazi are food insecure. There is need to come up with strategies that will improve the food situation, particularly for the poorly-resourced group which faces perennial food shortages. The Food and Agriculture Organisation (FAO) indicate grain requirement of 170 kg person-1 year-1 (Shepherd and Soule, 1998). Currently production of all the three groups of farmers in Mkhubazi is below this requirement. Possible interventions for each resource group are proposed in Tables 1 (Better-resourced), Table 2 (medium-resourced) and Table 3 (poorly-resourced) using the three cereals and legumes, (mainly groundnut) and
141

Chapter 6
resources that farmers have access to. The yield calculations are based on crop yield results observed from the different experiments. A normal rainy season (about 590 mm) is assumed in all situations. Some of these strategies were observed within the farming system during the last two years of interaction with the farmers. Table 1 Proposed strategy for the better-resourced farmer group Better-resourced farm: Total land area = 7 ha, Family size = 9
Current StatusPlot No Crop Area (ha) Fertilizer (kg) Manure (kg) Yield (kg)
1 Pearl millet 4 0 0 10002 Maize 1 50 3000 2803 Sorghum 1.5 0 0 100
Total cereals 6.5 1380Grain/person/year 153
4 Groundnut 0.5 260
Strategy in season 1: Plant about 1/3 of the area with legumesPlot No Crop Area (ha) Fertilizer (kg) Manure (kg) Yield (kg)
1 Pearl millet 2 0 0 5702 Maize 1 50 3500 2803 Sorghum 2 0 0 150
Total cereals 5 1000Grain/person/year 111
4 Groundnut 2 1600
Strategy in season 2: RotationPlot No Crop Area (ha) Fertilizer (kg) Manure (kg) Yield (kg)
4 Sorghum 2 0 0 8002 Pearl millet 1 0 0 8003 Maize 2 50 3500 1000
Total cereals 5 2600Grain/person/year 289
1 Legumes 2 0 0 1600
In the first season 2 ha of land is planted with a hybrid variety of groundnut (Nyanda) and the yield estimates are 800 kg ha-1. Farmers forego a large proportion of cereal grain, but this can be compensated by the sale of groundnut yields. In the second season farmers are likely to gain larger yield of sorghum through rotating with groundnut, and this results in high grain availability per person (289 kg).
142

General discussion and conclusions
Table 2 Proposed strategies for the medium-resourced farmer group Medium-resourced farm: Total land area = 4.5 ha, Family size = 7
Current StatusPlot No Crop Area (ha) Fertilizer (kg) Manure (kg) Yield (kg)
1 Pearl millet 2.5 0 0 7002 Maize 1 0 500 1003 Sorghum 0.5 0 50
Total cereals 4 850Grain/person/year 121
4 Groundnut 0.5 150
Strategy in season 1: Plant about 1/3 of the area with legumesPlot No Crop Area (ha) Fertilizer (kg) Manure (kg) Yield (kg)
1 Pearl millet 2 0 0 6002 Maize 0.5 25 500 4003 Sorghum 0.5 0 0 150
Total cereals 3 1150Grain/person/year 164
4 Groundnut 1.5 1200
Strategy in season 2: RotationPlot No Crop Area (ha) Fertilizer (kg) Manure (kg) Yield (kg)
1 Maize 1.5 25 500 8002 Sorghum 0.5 0 0 3004 Pearl millet 2 0 0 800
Total cereals 4 1900Grain/person/year 271
3 Legumes 0.5 0 0 500
The medium-resourced group has access to small amounts of manure. Ncube et al. (2006) found that farmers were able to buy at least 25 kg of ammonium nitrate fertiliser. Since there is effort to make the fertiliser accessible to the farmers in the area, this group can be encouraged to buy at least 25 kg which they can use to supplement manure in the maize plot. In the second strategy the farmers are also likely to get large grain yields for the season (277 kg per person).
143

Chapter 6
Table 3 Proposed strategies for the poorly-resourced farmer group Poorly-resourced farm: Total land area = 3.5 ha, Family size = 6
Current StatusPlot No Crop Area (ha) Fertilizer (kg) Manure (kg) Yield (kg)
1 Pearl millet 1.5 0 0 3202 Maize 0.1 0 0 203 Sorghum 0.4 0 0 40
Total cereals 2 380Grain/person/year 63Fallow 1
4 Groundnut 0.5 150
Strategy in season 1: Plant about 1/3 of the area with legumesPlot No Crop Area (ha) Fertilizer (kg) Manure (kg) Yield (kg)
1 Pearl millet 1 0 0 2152 Maize 0.5 0 0 1003 Sorghum 0.5 0 0 50
Total cereals 2 365Grain/person/year 61
4 Groundnut 1.5 900
Strategy in season 2: RotationPlot No Crop Area (ha) Fertilizer (kg) Manure (kg) Yield (kg)
1 Maize 1 0 0 2003 Sorghum 0.5 0 0 1004 Pearl millet 1.5 0 0 800
Total cereals 3 1100Grain/person/year 183
2 Legumes 0.5 0 0 500
The poorly-resourced group has to make some changes in their farming approach in order to improve their crop yields. In the first season they would not change their status of cereal grain requirements. However there is potential to produce 1 ton of groundnut that can be sold, and the money can be used to purchase the required cereals. In the second season the poorly-resourced farmers are likely to gain high pearl millet yields through rotating the crop with groundnut resulting in better food security (183 kg per person per year). These strategies will work provided certain conditions are met. The first condition is that farmers should be willing to change. There has been very little research done in the dry regions in the past years. As a result farmers are keen to try new farming ideas as evidenced in the manure and fertilizer experiments (Ncube et al., 2006; Chapter 3).
144

General discussion and conclusions
The labour costs of growing legumes may be high. Farmers need to see the real benefit for them to be able to take up labour intensive crops. Lastly there is need to find ways of making seed available within the farming system. The first step towards this has been collaboration with extension where ICRISAT provided various legume seed varieties and the farmers provided fields for seed multiplication. In addition to this there is need to create markets that will take up the excess legumes produced within the system. Currently there is a large demand for legumes within the system, but in the long run this may change and farmers will need to have access to the external markets for the surplus yields. Future research Zingore et al. (2005) have shown that there is a rapid depletion of organic matter in the first few years of cultivating Kalahari sands, and continuous cultivation without adding any input results in very low organic matter, therefore decline in soil fertility. The Tsholotsho soils have probably lost most organic matter due to continuous cultivation without adding any nutrients, especially under poorly-resourced farms. If no strategies are implemented to replenish organic matter crop productivity will continue to decline. This study has shown that using small quantities of manure and fertilizer results in large increases of maize yield even in these dry conditions. There is need to carry out more research on the use of fertilizer and other organic nutrient sources in these dry environments to provide farmers with more options. The residual benefits of legumes were studied in detail under on-station conditions where other nutrients such as P were not limiting. The legume experiment on farm showed some promising results. There is need to study the legume-cereal rotations under farmer conditions to assess if there are other limits to the system. Closely linked to rotations is the issue of legume seed. It will be important to assess whether local seed systems will be more appropriate, or whether seed should be supplied through the external markets, and if so will farmers be able to buy the seed? The study focused on legume productivity for food security. There is need to assess issues of market linkages for surplus produce. ICRISAT discussions with farmers have shown that farmers are willing to grow new legumes such as pigeonpea if they are assured of the market. Closely linked to markets are issues of quality of produce. Crops such as groundnut have stringent quality requirements because of dangers of toxins.
145

Chapter 6
The research has so far focused on modelling the short term benefits of legumes to sorghum. There is need to simulate the long-term effects the manure/fertilizer experiments and the legume-cereal rotations using APSIM. There is need to also continue developing possible scenarios for interventions into the system and assessing whether these are sustainable in the long term. Models that include the livestock component or whole farm scenarios are also essential in understanding the semi-arid systems such as Tsholotsho. Livestock plays an important role in the systems in providing draught power, food and income. The role of remittances in the system is currently not understood. The use of whole farm system models is therefore required. The use of farm scale approaches such as the NUANCES (Nutrient Use in Animal and Cropping Systems: Efficiency and Scales) framework (Giller et al., 2006) using the FARMSIM (Farm-scale Resource Management SIMulator) model (Tittonell et al. 2007) will assist in creating a better understanding of the system. References Ahmed M M, Rohrbach D D, Gono L, Mazhangara E, Mugwira L, Masendeke D D
and Alibaba S 1997 Soil fertility management in communal areas of Zimbabwe: current practices, constraints and opportunities for change. Results of a diagnostic survey. Southern and Eastern Africa Region. Working Paper no 6. PO Box 776, Bulawayo, Zimbabwe.
Giller K E, Rowe E C, de Ridder N and van Keulen H 2006 Resource use dynamics and interactions in the tropics: Scaling up in space and time. Agric. Syst. 88, 8-27.
Mapfumo P and Giller K E 2001 Soil Fertilty Management Strategies and Practices by Smallholder Farmers in Semi Arid Areas of Zimbabwe. International Crops Research Institute for the Semi Arid Tropics (ICRISAT) with permission from the Food and Agricultural Organization (FAO). Bulawayo, Zimbabwe and Rome, Italy. 60p.
Ncube B, Dimes J P, Twomlow S, Mupangwa W and Giller K E 2006 Raising the productivity of smallholder farms under semi-arid conditions by use of small doses of manure and nitrogen: A case of participatory research Nutr Cycl Agroecosyst. DOI: 10.1007/s10705-006-9045-7
Scoones I 2001 Transforming soils: the dynamics of soil-fertility management in Africa. Pp. 1-44 in: Scoones, I. (ed.) Dynamics and Diversity: Soil Fertility and Farming Livelihoods in Africa. London: Earthscan.
146

General discussion and conclusions
Shepherd K D and Soule M J 1998 Assessment of the economic and ecological impacts of agroforestry and other soil management options on western Kenyan farms using a dynamic simulation model. Agric. Ecosys. Environ. 83, 27 - 42.
Tittonell P, Zingore S, van Wijk M T 2007 Nutrient use efficiencies and crop responses to N, P and manure applications in Zimbabwean soils: Exploring management strategies across soil fertility gradients Field Crops Res. 100 (2-3), 348-368
Zingore S, Manyame C, Nyamugafata P, Giller K E 2005 Long-term changes in organic matter of woodland soils cleared for arable cropping in Zimbabwe. Euro. J. Soil Sci. 56, 727-736
147


Summary Smallholder farmers in Africa are vulnerable to food insecurity and they are faced with continuing soil fertility decline, which continues to reduce crop productivity. The diversity of sites and soils between African farming systems is great. Soil fertility research approaches should therefore be tailored to suit the opportunities and problems encountered in the different climatic regions. This thesis characterizes the semi-arid regions of south-western Zimbabwe and explores some of the strategies that can be used to provide farmers with more options for soil fertility improvement. The farm characteristics of semi-arid Tsholotsho (Mkhubazi) in south-western Zimbabwe were studied using resource flow maps and on-farm experiments. There was great variability within the farming system in terms of farmer wealth status. Better-resourced farmers had more livestock and farm implements, while the poorly-resourced had none. The farming system is largely cereal based (more than 80 % of land was grown with millet, sorghum and maize). Better-resourced farmers produced adequate grain for their food requirements except in the drought year. Poorly-resourced farmers had large grain deficits while the medium-resourced class had smaller deficits. There was inadequate nutrient replacement in all types of farms; hence partial N balances were negative in almost all seasons of mapping. Introducing grain legume-cereal rotations into the system could assist in improving food security. Farmer participatory research experiments showed that there is potential for the smallholder farmers in Tsholotsho who have access to manure to increase cereal yields using small rates of manure and fertilizer. Previously farmers in this region did not apply manure to crops. In 2003–2004, with good rainfall (672 mm), grain yields were high even for the control plots (average 1.2 and 2.7 t ha−1). Maize yields due to manure applications at 3 and 6 t ha−1 were 1.96 and 3.44 t ha−1, respectively. Application of 8.5 kg N ha−1 increased yields to 2.5 t ha−1 with 3 t ha−1 of manure, and to 4.28 t ha−1 with 6 t ha−1 of manure. In dry years manure in combination with N fertilizer increased grain yield by about 0.14 and 0.18 t ha−1. The results showed that there is potential to improve livelihoods of smallholder farmers through the use of small rates of manure and N. The research also showed that it is possible to successfully grow grain legumes under the semi-arid conditions and derive substantial residual yield benefits to sorghum grown after the legumes. New varieties of grain legumes such as Nyanda (groundnut), 86D 719 (cowpea), CBC1 (cowpea) and pigeonpea varieties seemed to be well
149

Summary
adapted to dry environments. The legumes were able to fix substantial proportions of their N from the atmosphere. Sorghum grain yields after legumes reached 1.62 t ha-1 in 2003/04, more than double the yields in the sorghum after sorghum rotation. In 2004/05, sorghum yields after legumes were also higher (up to 1.26 t ha-1) than sorghum after sorghum. An assessment of the water and N dynamics during the legume phase and sorghum phase indicated that the residual effects of the legumes were driven by a strong interaction of nitrogen and water availability. The Agricultural Production SIMulator (APSIM) was used to model the legume-sorghum rotation in order to test it’s capability of simulating cropping systems in the semi-arid southern Africa. The model output of N and water stress factors on plant growth was very instructive in better understanding the water, N and plant growth interactions within a cropping season, as well as the residual benefits of legumes interacting with variable seasonal conditions. The model results suggest that the productivity of a legume phase in this environment can overcome the N supply deficits of the infertile soils for sorghum production in south-western Zimbabwe for up to two seasons of sorghum production. Further research needs include simulation of the long-term effects of the manure/fertilizer experiments and the legume-cereal rotations. Farming system models such as FARMSIM, that is currently being used in the NUANCES (Nutrient Use in Animal and Cropping Systems: Efficiency and Scales) framework can assist us in getting a better understanding of the functioning of smallholder farming systems in semi-arid regions and help us to identify possible developmental pathways for these highly constrained systems.
150

Samenvatting Kleine boeren in Afrika zijn kwetsbaar door voedsel onzekerheid. Ze worden geconfronteerd met een continue daling van de bodemvruchtbaarheid, die ervoor zorgt dat de gewasproductie blijft dalen. De diversiteit van locaties en bodems van de Afrikaanse agrarische systemen is groot. Bodemvruchtbaarheidsonderzoek zou daarom meer toegespitst moeten worden op de lokale situatie om beter te passen bij de mogelijkheden en problemen van de verschillende klimaatsregio’s. Dit proefschrift karakteriseert de semi-aride gebieden in het zuidwesten van Zimbabwe en onderzoekt een aantal van de strategieën die gebruikt zouden kunnen worden om de boeren meer opties te geven voor verbetering van de bodemvruchtbaarheid. De karakteristieken van de boerderijen in het semi-aride Tsholotsho (Mkhubazi) in het zuidwesten van Zimbabwe werden bestudeerd door middel van karteringen van hoe de boer de beschikbare middelen gebruikt en hergebruikt binnen zijn bedrijf, en door middel van experimenten die op de bedrijven zelf werden uitgevoerd. Er was een grote variabiliteit tussen de agrarische bedrijven in termen van rijkdom. Boeren met relatief veel middelen tot hun beschikking hadden meer vee and werktuigen, terwijl arme boeren geen van beiden in hun bezit hadden. Het bedrijfssysteem is grotendeels graan-gebaseerd (op meer dan 80% van het land werd gierst, sorghum en maïs verbouwd). Boeren met relatief veel middelen tot hun beschikking produceerden voldoende graan voor hun eigen voedselvoorziening, behalve in een droog jaar. Arme boeren hadden grote graan tekorten terwijl de midden groep kleinere tekorten had. De nutriënt vervanging was onvoldoende in alle typen bedrijfssystemen; de partiele stikstof balansen waren negatief in bijna alle seizoenen waarin de karteringen waren uitgevoerd. Het introduceren van rotaties van vlinderbloemigen en graangewassen zou kunnen bijdragen aan het verbeteren van de voedselzekerheid. Onderzoeksexperimenten uitgevoerd samen met de boeren lieten zien dat voor de kleine boeren in Tsholotsho met toegang tot het gebruik van dierlijke mest, er mogelijkheden zijn om hun graanproductie te laten toenemen door de toepassing van kleine hoeveelheden dierlijke mest en kunstmest. In het verleden gebruikten boeren in deze regio geen dierlijke mest voor hun gewassen. In het regenseizoen van 2003-2004, met goede regenval (672 mm), waren de graanopbrengsten hoog, zelfs voor de controle plots (gemiddeld 1.2 en 2.7 ton per hectare). De maïsopbrengsten met toepassing van dierlijke mest in hoeveelheden van 3 en 6 ton per hectare waren respectievelijk 1.96 en 3.44 ton per hectare. Toepassing van 8.5 kg N kunstmest per hectare has tot gevolg dat de opbrengst toenam tot 2.5 ton per hectare met 3 ton per
151

Samenvatting
hectare dierlijke mest, en tot 4.28 ton per hectare met 6 ton per hectare dierlijke mest. In droge jaren nam de graanopbrengst met zo’n 0.14 en 0.18 ton per hectare toe als dierlijke mest in combinatie met kunstmest werd toegepast. De resultaten lieten zien dat er mogelijkheden zijn om de levenssituatie van kleine boeren te verbeteren door het gebruik van kleine hoeveelheden dierlijke mest en kunstmest. Het onderzoek liet ook zien dat het mogelijk is om succesvol graan vlinderbloemigen te verbouwen onder semi-aride condities en om substantiële opbrengst verbeteringen te behalen in de sorghum die na de vlinderbloemigen verbouwd werd. Nieuwe variëteiten van vlinderbloemigen zoals Nyanda (pinda), 86D 719 (koeiebonen), CBC1 (koeiebonen) en evenals duivenerwt variëteiten lijken goed aangepast aan droge omgevingen. De vlinderbloemigen waren in staat om substantiële hoeveelheden van hun stikstof vast te leggen vanuit de atmosfeer. De sorghum graan opbrengsten na vlinderbloemigen waren tot 1.62 ton per hectare in 2003/04, meer dan twee keer zoveel als de opbrengsten die behaald werden in sorghum na sorghum rotaties. Een onderzoek naar de water en stikstof dynamiek gedurende de vlinderbloemige fase en de sorghum fase liet zien dat de positieve residu effecten van de vlinderbloemigen veroorzaakt werden door een sterke interactie tussen stikstof en water beschikbaarheden. Het model ‘Agricultural Production SIMulator’ (APSIM) werd gebruikt om de vlinderbloemigen – sorghum rotatie te modeleren. Het model werd getest op zijn geschiktheid om gewassystemen in het semi-aride zuidelijk Afrika te simuleren. De modelresultaten voor de simulatie van stikstof en water tekorten voor plantgroei waren zeer nuttig om zowel de water, stikstof en plantgroei interacties binnen een groeiseizoen beter te begrijpen, als om de positieve residu effecten onder verschillende groeicondities beter te kunnen inschatten. De modelresultaten suggereren dat de productiviteit gedurende een vlinderbloemige fase in deze omgevingen het gebruikelijke tekort aan stikstof voorziening in deze onvruchtbare bodems gedurende de sorghum productie in twee opeenvolgende seizoenen sterk kan verminderen. Verder onderzoek moet de lange termijn effecten van de dierlijke mest/kunstmest experimenten en de vlinderbloemigen/sorghum rotaties kwantificeren. Bedrijfssysteem modellen zoals NUANCES-FARMSIM, dat op dit moment wordt gebruikt in het NUANCES (nutrient gebruik in dierlijke en gewassystemen: efficienties en schalen) programma, kunnen ons helpen om een beter begrip te krijgen van het functioneren van kleine boerenbedrijven in semi-aride gebieden en om mogelijke ontwikkelingsrichtingen te kunnen identificeren voor deze sterk gelimiteerde systemen.
152

Curriculum Vitae
Bongani Ncube was born in Kezi, Matopos, Zimbabwe on November 8, 1969. She did primary education in Kezi and Zvishavane. She did her secondary education at Dadaya High School, and completed her A-level at Northlea High School, Bulawayo in 1991. She then enrolled at the University of Zimbabwe where she studied for a BSc Honours in Agriculture (Soil Science) from 1992 to 1994. From 1995 to 1998 she worked for the Ministry of Environment and Tourism, Department of Natural Resources as an Ecologist. At the same time she did part-time consultancy for PlanAfric a Rural and Urban Planning Consultancy, and also taught part-time at Esigodini Agricultural College. From 1999-2000 she was awarded a Belgian Embassy Scholarship to study for an MSc in Water Resources Engineering and Management at the University of Zimbabwe. Upon completing her MSc in 2002 she then joined the International Crops Research Institute for the Semi-arid Tropics (ICRISAT) as a Scientific Officer. While at ICRISAT she was offered an opportunity to work in a collaborative project on soil fertility management between ICRISAT and Wageningen University in 2002, under the sponsorship of the Netherlands Foundation for Science in the Tropics (WOTRO). Her work has led to the completion of this PhD at Wageningen University.
153

PE&RC PhD Education Statement Form
With the educational activities listed below the PhD candidate has complied with the educational requirements set by the C.T. de Wit Graduate School for Production Ecology and Resource Conservation (PE&RC) which comprises of a minimum total of 22 credits (= 32 ECTS = 22 weeks of activities)
Review of Literature (4 credits)
- Understanding cropping systems in the semi-arid environments of Zimbabwe: options for soil fertility management (2003)
Writing of Project Proposal (5 credits)
- Understanding cropping systems in the semi-arid environments of Zimbabwe: options for soil fertility management (2003)
Post-Graduate Courses (3 credits)
- Soil ecology (PE & RC, 2003) - Introduction to APSIM modelling (ICRISAT, 2004) - Advanced training in APSIM modelling (ICRISAT, 2006)
Deficiency, Refresh, Brush-up and General Courses (7.5 credits)
- Nutrient management (Soil Quality Group, 2003) - Time planning and project management (PE & RC, 2003) - PhD media training (WGS, 2006) - PhD scientific writing (WGS, 2006)
PhD Discussion Groups (3 credits)
- Plant-soil relations (2003) - ICRISAT workshops and seminars (2003-2005)
PE&RC Annual Meetings, Seminars and Introduction Days (0.5 credit)
- PE & RC weekend (2006)
International Symposia, Workshops and Conferences (3 credits)
- Grain legumes and green manures for soil fertility in Southern Africa: taking stock of progress (CIMMYT-Zimbabwe, 2002)
- Combined congress: Soil science society of South Africa, society of crop production, weed science society, society for horticultural sciences, Potchestroom, (2005)
- Tropentag 2006: International research on food security, natural resource management and rural development: Institute of Crop Science and Resource Conservation (University of Bonn, 2006)
154

Funding Financial support for this thesis was received from the Netherlands Foundation for Science in the Tropics (WOTRO) and the International Crops Research Institute for the Semi-arid Tropics (ICRISAT). Additional financial support for printing was provided by the Dr. Judith Zwartz Foundation and the Fonds Landbouw Export-Bureau (LEB Foundation). The author is grateful to these institutions for their generous support. Cover design by the author Photos by the author and Dr. Steve Twomlow
155
