understanding clinical trials - quoetr … clinical trials. ... • natural history of ms and number...
TRANSCRIPT

Understanding Cl in ical Tr ia ls

Introduction and Objectives
Introduction
• This module provides learners with an educational resource that focuses on
understanding both why and how clinical trials are conducted as well as the
importance of clinical trial results
Objectives
• Understand basic concepts of the drug approval process
• Describe the types and variations of clinical trials
• Review outcome measures in multiple sclerosis (MS) clinical trials
• Understand statistical measures
• Understand challenges involved in designing and conducting MS clinical trials
2.

Table of Contents
Chapter 1: Regulatory Pathway
• Food and Drug Administration (FDA) Approval in the United States
• Drug Approval in the European Union
Chapter 2: Types of Clinical Trials
• Overview
• Trial Objectives
Chapter 3: Trial Design and Terminology
• Clinical Trial Planning
• Randomization
• Blinding
• Crossover
• Inclusion/Exclusion Criteria, Baseline Data, and Adverse Effects
Chapter 4: Outcome Measures in MS Trials
• Annualized Relapse Rate (ARR)
• Expanded Disability Status Scale (EDSS)
• Multiple Sclerosis Functional Composite (MSFC)
• Magnetic Resonance Imaging (MRI)
• Quality of Life (QOL) Measures
Chapter 5: Statistical Measures Utilized in MS Clinical Trials
• Statistical Significance
• Statistical Power
• Relative Risk (RR)
• Odds Ratio (OR)
• Survival Analysis, Hazard Ratio (HR), and Confidence Interval
• Intention to Treat
• Mean Compared to Median
• Standard Deviation
Chapter 6: Factors Affecting the Validity and Relevance of
MS Clinical Trial Results
• Short Duration of Trials
• Duration of MS
• Randomization
• Seasonality
• Attrition and Lack of Adherence
• Natural History of MS and Number Needed to Treat (NNT)
• Bias
• Outcome Measures
Summary. 3
© iStock.com/adiekoetter
Chapter 1
Regulatory Pathway

• Drug discovery
• Preclinical testing
• Submit an investigational new
drug application (IND) to FDA
Drug Approval Process
Preclinical1
• Phase I studies
• Phase II studies
• Phase III studies
• Submit new drug application (NDA) to FDA
• Initial NDA review (FDA decides whether to
accept NDA for review)
• Application reviewed
• Receives approval or a complete
response letter
5
Clinical Review1,2 NDA1-3
Imagery provided by iStock
1. PhRMA. http://www.phrma.org/innovation/clinical-trials#sthash.xfkGHNsb.dpuf. Accessed [March 1, 2017].
2. US Food and Drug Administration. http://www.fda.gov/Drugs/ResourcesForYou/Consumers/ucm289601.htm. Accessed [March 1, 2017].
3. Randall B. The U.S. Drug Approval Process: A Primer. Washington, DC: Library of Congress, Congressional Research Service; 2001.

Therapeutic biologic application
(also known as biologic license
application [BLA])1,2
• Required by the FDA for therapeutic
biologic products
• Approval processes for BLAs and NDAs
are essentially the same
• Reviewed by the FDA’s Center for Drug
Evaluation and Research (CDER) and
Center for Biologics Evaluation and
Research (CBER)
Therapeutic Biologic Application
6
Traditional Drug
Treatments2
Biologic
Treatments2
Chemically synthesized Derived from living material
Smaller, well-defined structure Complex structure
NDA BLA
1. US Food and Drug Administration. http://www.fda.gov/Drugs/DevelopmentApprovalProcess/HowDrugsareDevelopedandApproved/ApprovalApplications/
TherapeuticBiologicApplications/default.htm. Accessed [March 1, 2017].
2. US Food and Drug Administration. http://www.fda.gov/Drugs/DevelopmentApprovalProcess/HowDrugsareDevelopedandApproved/ApprovalApplications/
TherapeuticBiologicApplications/ucm113522.htm. Accessed [March 1, 2017].

Therapeutic Biologics
Categories for therapeutic biologics1
• Monoclonal antibodies for in vivo use
• Cytokines, growth factors, enzymes, immunomodulators,
and thrombolytics
• Proteins intended for therapeutic use that are extracted
from animals or microorganisms, including recombinant
versions of these products (except clotting factors)
• Other non-vaccine therapeutic immunotherapies
7
1. US Food and Drug Administration. http://www.fda.gov/Drugs/DevelopmentApprovalProcess/HowDrugsareDevelopedandApproved/ApprovalApplications/TherapeuticBiologicApplications/ucm113522.htm.
Accessed [March 16, 2017].
2. National Multiple Sclerosis Society. http://www.nationalmssociety.org/NationalMSSociety/media/MSNationalFiles/Brochures/Brochure-The-MS-Disease-Modifying-Medications.pdf. Accessed [March 1, 2017].
MS disease-modifying products
considered by FDA to be biologics2
Avonex® (interferon beta-1a)
Betaseron® (interferon beta-1b)
Copaxone® (glatiramer acetate)
Extavia® (interferon beta-1b)
Glatopa® (glatiramer acetate)
Lemtrada® (alemtuzumab)
Plegridy® (peginterferon beta-1a)
Rebif® (interferon beta-1a)
Tysabri® (natalizumab)
Zinbryta® (daclizumab)

Drug approval process
• Similar to drug approval process in the United States
o Begins with a clinical trial process followed by approval to market
and sell the drug
• Two drug approval procedures
1. Centralized1
• Commission approval of a new drug allows a pharmaceutical company
to market its drug in all Member States without having to obtain separate
approval in each Member State
2. Decentralized1,2
• If a product does not meet the requirements for consideration under the
centralized process, the application may be submitted under the
decentralized process
• Allows for simultaneous consideration by Member States that have not
yet approved the product
Drug Approval in the European Union
8
1. European Medicines Agency. http://www.ema.europa.eu/ema/index.jsp?curl=pages/about_us/general/general_content_000109.jsp&mid=WC0b01ac0580028a47&jsenabled=true. Accessed [March 1, 2017].
2. European Medicines Agency. http://www.ema.europa.eu/ema/index.jsp?curl=pages/about_us/general/general_content_000310.jsp&mid=WC0b01ac058074758f. Accessed [March 1, 2017].
3. European Union. http://europa.eu/european-union/about-eu/countries/member-countries_en. Accessed [March 1, 2017].
Member States of
the European Union3
Austria Germany Norway
Belgium Greece Poland
Bulgaria Hungary Portugal
Croatia Ireland Romania
Cyprus Italy Slovakia
Czech Republic Latvia Slovenia
Denmark Lithuania Spain
Estonia Luxemburg Sweden
Finland Malta United Kingdom
France Netherlands

The centralized process is mandatory for all:
• Human medicines for the treatment of HIV/AIDS, cancer,
diabetes, neurodegenerative diseases, autoimmune and
other immune dysfunctions, and viral diseases
• Veterinary medicines for use as growth or yield enhancers
• Medicines derived from biotechnology processes, such
as genetic engineering
• Advanced-therapy medicines, such as gene therapy, somatic
cell-therapy, or tissue-engineered medicines
• Officially designated “orphan medicines” (medicines used for
rare human diseases)
Centralized Process
9
HIV, human immunodeficiency virus.
European Medicines Agency. http://www.ema.europa.eu/ema/index.jsp?curl=pages/about_us/general/general_content_000109.jsp&mid=WC0b01ac0580028a47&jsenabled=true. Accessed [March 1, 2017].
© iStock.com/Oria
Chapter 2
Types of
Clinical Trials
© iStock.com/RTimages

Clinical trials1,2
• “Investigational” trials or experiments conducted in humans during which researchers will test the effects of
a treatment or prevention strategy on pre-specified outcomes
• Determines a treatment’s safety and/or efficacy based on pre-specified outcomes
• Categorized as:
Clinical Trials
11
Retrospective3
• Investigators look at medical records to
determine what happened to 2 or more
groups in the past
Interventional2
• Participants take a drug or undergo therapy
• Investigators record results and events
that occur
Observational2
• Investigators assess health outcomes
and record these observations in the
absence of investigator-induced
intervention
Prospective3
• Investigators follow patients into the
future for various periods
1. Appel LJ. Clin J Am Soc Nephrol. 2006;1(6):1360-1367.
2. ClinicalTrials.gov. https://clinicaltrials.gov/ct2/about-studies/learn#WhatIs. Accessed [March 9, 2017].
3. Boston University School of Public Health. http://sphweb.bumc.bu.edu/otlt/MPH-Modules/EP/EP713_AnalyticOverview/EP713_AnalyticOverview3.html. Accessed [March 9, 2017]. Imagery supplied by iStock

Types of Clinical Trials
12
US Food and Drug Administration. https://www.fda.gov/ForPatients/ClinicalTrials/Types/default.htm. Accessed [March 15, 2017].
Treatment trialsTest experimental treatments, new combinations of drugs, new devices,
or new approaches to surgery or radiation therapy
Prevention trialsSeek better ways to prevent disease in people who have never had the
disease or to prevent a disease from reoccurring
Diagnostic trialsConducted to find better tests or procedures for diagnosing a particular
disease or condition
Screening trials Test the best ways to detect certain diseases or health conditions
Quality of life trials
(or supportive care trials)
Explore ways to improve comfort and quality of life for individuals with
a chronic illness
Genetic studiesImprove prediction of disorders by identifying and understanding the
relationship between genes and illnesses
Epidemiology studies Identify patterns, causes, and control of disorders in groups of people

Benefits
• Provide the strongest evidence supporting cause-effect relationships
• Form the basis for clinical practice and public health policy
• Minimize or eliminate bias and confounding factors
Challenges
• Expensive and time-consuming
• Ethical concerns
• Difficult to recruit patients into study
• Logistically complex
• Many research questions cannot be answered
due to study design restrictions
Benefits and Challenges of Clinical Trials
13
Appel LJ. Clin J Am Soc Nephrol. 2006;1(6):1360-1367. © iStock.com/Terminator3D

Placebo1,2
• Substance with no known treatment value that is given to a study participant
• Made to appear, smell, and/or taste similar to the actual treatment
Placebo-controlled trial• Determines whether a drug of interest is better than a placebo3
• Blinding so that study participants and investigators do not know
who is receiving the active treatment and who is receiving the placebo2
Superiority trial3
• Tests whether a new treatment is superior to the existing treatment,
which may be the current standard of care
• May include placebo-controlled efficacy trials, because the new treatment
is being tested for superiority to placebo
Placebo-Controlled and Superiority Trials
14
1. ClinicalTrials.gov. http://clinicaltrials.gov/ct2/info/glossary#inclusion. Accessed [March 14, 2017].
2. Gordis LM. Assessing the efficacy of preventive and therapeutic measures: randomized trials. In: Epidemiology. 4th ed. Philadelphia, PA: Saunders Elsevier; 2009:chap 7.
3. Appel LJ. Clin J Am Soc Nephrol. 2006;1(6):1360-1367. Imagery supplied by iStock

Non-inferiority Trials
Non-inferiority trial1,2
• Shows that an experimental treatment is not worse than an active control by
more than the equivalence margin
• If non-inferiority is established, a treatment may be preferred based on other
considerations such as easier to use, fewer side effects, less costs, etc2,3
15
1. Snapinn SM. Curr Control Trials Cardiovasc Med. 2000;1(1):19-21.
2. Appel LJ. Clin J Am Soc Nephrol. 2006;1(6):1360-1367.
3. Greene GJ. J Trauma Stress. 2008;21(5):433-439.

Dose Comparison or Dose-Ranging Trial
Method
• Used to determine a reasonable initial dose
• The initial dose is the lowest dose tested that has a
response that is statistically greater than the response
after a placebo test
• Placebo periods may follow the active drug period in
trials designed with more than one active drug period
16
Sheiner LB, et al. Clin Pharmacol Ther. 1989;46(1):63-77. © iStock.com/Jezperklauzen

Method1
• Tests the effects of using 2 or more drugs in combination to determine whether the drugs may work
together and be more effective, or more toxic, than using either drug as monotherapy
Three variations of a combination trial2
1. Combination therapy
• When 2 or more drugs (or a drug plus a immunomodulator or antibody) are administered
together to a patient who had not received any part of the combination previously
2. Add-on therapy
• When 1 drug is administered for some period and then a second drug
is added to the regimen
3. Sequential therapy
• When the first drug that is administered is discontinued before initiation of
therapy with a second agent
Combination Trial
17
1. Miles D, et al. Oncologist. 2002;7(suppl 6):13-19.
2. Powers JH. Clin Infect Dis. 2004;39(suppl 4):S228-S235. © iStock.com/ozgurdonmaz

Method1
• Simultaneously measure exposure and disease status in a given population
• Cannot be used to determine the following
o Whether the exposure preceded or followed the disease
o Cause-and-effect relationship
Advantages2
• Results can be highly generalizable, if the sample is representative of the population of interest
• Inexpensive
• Can be completed quickly
Disadvantages1
• Can only identify patterns or trends in disease occurrence, but cannot differentiate between an
association and a causal effect
Cross-sectional or Prevalence Study
18
1. Gordis LM. Case-control studies and other study designs. In: Epidemiology. 4th ed. Philadelphia, PA: Saunders Elsevier; 2009:chap 10.
2. Aschengrau A, Seage GR III. Overview of epidemiologic study designs. In: Essentials of Epidemiology in Public Health. 2nd ed. Sudbury, MA: Jones and Bartlett Publishers; 2008:135-162.

Method1,2
• Observational study that does not involve an intervention or an attempt to alter the disease course
• Compares patients who have a disease or outcome of interest (cases) with patients who do not have the disease or outcome (controls)
• Retrospective analysis to compare how frequently a specific exposure
to a risk factor is present in each group
Advantages1
• Good for studying rare conditions or diseases
• Less time is needed to conduct the study
• Allows researchers to simultaneously look at multiple risk factors
• Useful as initial study to establish an association
Disadvantages
• Difficult to find a suitable control group1
• Greater chance of bias than experimental studies2
• Difficult to establish temporal relationship between exposure and disease2
Case-Control or Retrospective Study
19
1. Gordis LM. Case-control studies and other study designs. In: Epidemiology. 4th ed. Philadelphia, PA: Saunders Elsevier; 2009:chap 10.
2. Aschengrau A, Seage GR III. Overview of epidemiologic study designs. In: Essentials of Epidemiology in Public Health. Sudbury, MA: Jones and Bartlett Publishers; 2008:135-162.
Diagram of a Case-Control Study
Study individuals
Selected cases Selected controls
Exposed Not exposed Exposed Not exposed

Method1
• Follows prospectively over time one or more populations (or cohorts)
• Determines which patient characteristics or risk factors are associated with the development of a disease or outcome
Advantages2,3
• Easier and less expensive than a randomized controlled trial
• Best way to ascertain both the incidence and natural history of a disorder
• Time sequence between putative cause and outcome is usually clear
• Other outcomes, besides the pre-determined outcomes, are discovered
• May be useful in the study of rare exposures
Disadvantages1,2
• Cohorts can be difficult to identify due to confounding variables
• No randomization, which means an imbalance in patient characteristics could exist
• Blinding or masking is difficult
• Outcome of interest could take time to occur
Cohort, Prospective, or Longitudinal Study
20
1. Gordis LM. Cohort studies. In: Epidemiology. 4th ed. Philadelphia, PA: Saunders Elsevier; 2009:chap 9.
2. Himmelfarb Health Sciences Library. https://himmelfarb.gwu.edu/tutorials/studydesign101/cohorts.html. Accessed [March 30, 2017].
3. Grimes D, Shulz KF. Lancet. 2002;359(9303):341-345.
Diagram of a Prospective Cohort Study
Year: 202520152006
Diseased
Non-
diseased
Diseased
Non-
diseased
Risk
factor(s)
exposed
Risk
factor(s)
non-exposed
Population
at risk
Diseased
Non-
diseased

Nested Case-Control Study
Method
• Hybrids of retrospective
and prospective analyses
• Participants are often selected from
ongoing cohort studies
• Compares the course of individuals
who develop the disease (case) with
those who do not develop the disease
but are at risk of developing the
disease (control)
21
Diagram of a Nested Case-Control Study
Gordis LM. Cohort studies. In: Epidemiology. 4th ed. Philadelphia, PA: Saunders Elsevier; 2009:chap 10.
Do not develop
disease
(controls)
Compare case and control
groups during follow-up
Develop
disease
(cases)
Select population and
collect baseline data

Method
• Uses statistical methods to combine results of individual studies that are focused on related research
Advantages
• Makes it possible to see the results of several studies at one time
• Can see treatment effects in a more diverse population with a larger number of people
• Higher statistical power than individual studies
Disadvantages or weaknesses
• Difficulty in selecting which studies are included or excluded in a meta-analysis
• Not all studies may have subject characteristics and data suitable for inclusion and analysis
• Requires advanced statistical techniques
Meta-analysis
22
Himmelfarb Health Sciences Library. http://himmelfarb.gwu.edu/tutorials/studydesign101/metaanalyses.html. Accessed [March 10, 2017].

Chapter 3
Trial Design and Terminology
© iStock.com/Maridav

Goals of well-designed clinical trials
• Differences observed between different
intervention groups may be attributed to the
treatment under investigation1
• Generalizable results1
o Results are applicable to real people outside
of the study
• Fair to the participants2
• Ethical to the participants2
Clinical Trial Planning
24
1. Jüni P, et al. BMJ. 2001;323(7303):42-46.
2. National Institutes of Health Clinical Center. https://clinicalcenter.nih.gov/recruit/ethics.html. Accessed [March 15, 2017]. © iStock.com/goir

Why are participants randomized?
• To avoid bias on the part of investigators1
o Bias consists of any effect or interference that can affect a clinical trial’s results2
• To facilitate blinding of study investigators and participants1
Goals of randomization1,3
• To produce comparable groups in terms of general participant characteristics
o Characteristics may include age, gender, duration of disease, and disability status
• To conclude that study results are valid and cannot be attributed to assignment arm bias
Randomization
25
Randomization occurs when trial participants are
randomly assigned to a particular treatment arm of a trial,
rather than someone deciding which arm they should be in1
1. Gordis LM. Assessing the efficacy of preventive and therapeutic measures: randomized trials. In: Epidemiology. 4th ed. Philadelphia, PA: Saunders Elsevier; 2009:chap 7.
2. Taber’s Online. https://www.tabers.com/tabersonline/view/Tabers-Dictionary/730664/0/bias?q=bias&ti=0. Accessed [March 15, 2017].
3. Appel LJ. Clin J Am Soc Nephrol. 2006;1(6):1360-1367.
© iStock.com/zentilia

© iStock.com/Kai Wong
Blinding prevents1
• Response bias from patientso The tendency for patients to report symptoms differently, based on the treatment they
are getting
• Behavior changes in patients that will affect the trialo Attrition
o Secretly adding in medication or other therapies if the patient thinks they are
receiving placebo
• Bias on behalf of the people collecting and reporting the data
How is blinding done?1,2
• By randomization
• By making all the interventions received by each arm look identical and be
dosed identically
Blinding
26
Blinding means that investigators and/or participants do not
know which treatment arm a participant is in1
1. Appel LJ. Clin J Am Soc Nephrol. 2006;1(6):1360-1367
2. Gordis LM. Assessing the efficacy of preventive and therapeutic measures: randomized trials. In: Epidemiology. 4th ed. Philadelphia, PA: Saunders Elsevier; 2009: chap 7.

Single-blinded1,2
• Either the investigator or the participant is unaware of which medication the
participant is taking or which intervention they have been exposed to
Double-blinded1,3
• Neither the investigator nor the participant knows which drugs are being taken
• Participants are randomized to one of two or more study groups
• All medications and procedures that are given are designed to look identical
Double-dummy4
• Each group of participants receives one of the active interventions and a placebo
(or dummy) that looks and tastes the same as the other intervention
• Used to compare interventions that are administered by different routes or on
different schedules
Types of Blinding
27
Double-blind trials
are considered the
most objective type of
study and are known
as the “gold standard”
of drug trials5
1. Appel LJ. Clin J Am Soc Nephrol. 2006;1(6):1360-1367.
2. ClinicalTrials.gov. http://clinicaltrials.gov/ct2/info/glossary#inclusion. Accessed [March 14, 2017].
3. Gordis LM. Assessing the efficacy of preventive and therapeutic measures: randomized trials. In: Epidemiology. 4th ed. Philadelphia, PA: Saunders Elsevier; 2009: chap 7.
4. Friedman LM, et al. Protecting the double-blind design. In: Fundamentals of Clinical Trials. 4th ed. New York, NY: Springer; 2010:123-141.
5. US Food and Drug Administration. https://www.fda.gov/AboutFDA/WhatWeDo/History/Overviews/ucm304485.htm#_edn39. Accessed [March 13, 2017].

Single doseSingle dose
Washout
Washout
Visit
Drug A Drug A
Drug B Drug B
RInformed
consentEligibility
1 2 3 4 5
Method1,2
• Allows each patient to act as their own control
• Ensures that patients in different arms of a study are similar enough
to compare results
• May be used to compare the effects of two drugs to one another
• Most appropriate for short-term studies
Two main issues regarding crossover trials1,2
1. Order effects
o When the order in which the treatments
are given impact the outcome
2. Carryover effects
o When beneficial effects and/or negative side
effects carry over from the first treatment
o May be minimized by adequate washout periods
Crossover Study
28
Patients participate in each arm of the
study, usually in random order
Diagram of a Crossover Study
1. Gordis LM. Assessing the efficacy of preventive and therapeutic measures: randomized trials. In: Epidemiology. 4th ed. Philadelphia, PA: Saunders Elsevier; 2009: chap 7.
2. Mills EJ, et al. Trials. 2009;10:27. doi: 10.1186/1745-6215-10-27.

Inclusion/exclusion criteria1
• Characteristics of a person or illness that researchers use to determine who is eligible
to participate
Baseline data1
• Patient information collected before randomization
Adverse effects2
• Any negative changes in health or side effects that occur in a person who participates in a clinical
trial while the patient is receiving a study drug (active drug or placebo) or within a certain
(specified) amount of time after the trial ends
Relevant Terms
29
1. Appel LJ. Clin J Am Soc Nephrol. 2006;1(6):1360-1367.
2. ClinicalTrials.gov. http://clinicaltrials.gov/ct2/info/glossary#inclusion. Accessed [March 13, 2017].

Chapter 4
Outcome Measures
in MS Trials

Disadvantages
• Difficult to compare across studies, as different researchers adopt different methods and
definitions to confirm relapses1
Annualized Relapse Rate
31
Total number of relapses experienced by the group (the treatment or
placebo arm) divided by the person/years at risk1
The most common summary measure of relapses2
1. Inusah S, et al. Mult Scler. 2010;16(12):1414-1421.
2. Lavery AM, et al. Mult Scler Int. 2014;2014:262350. doi: 10.1155/2014/262350.

EDSS1
• Rating system that is used frequently for classifying and standardizing the physical
condition of people with MS in clinical trials
• It is possible to move back and forth on the scale2
• A composite scale based on multiple outcome measures, not on an individual measure1
Calculating the EDSS score3
• Based on neurological testing and examination of 8 functional systems
Advantages3
• Familiar system for researchers
• Researchers and physicians understand the significance of
changes in EDSS
Disadvantages1
• Places emphasis on the ability to walk, when other symptoms
could be impacting a person’s ability to function
• Insensitive to cognitive dysfunction
• Moderate inter-rater reliability
• Not a linear scale
Expanded Disability Status Scale
32
1. Krieger S. Issues in the design and interpretation of multiple sclerosis clinical trials. In: Giesser B, ed. Primer on Multiple Sclerosis. New York, NY: Oxford University Press; 2011:435-450.
2. Kurtzke JF. Neurology. 1983;33(11):1444-1452.
3. National Multiple Sclerosis Society. http://www.nationalmssociety.org/For-Professionals/Researchers/Resources-for-Researchers/Clinical-Study-Measures/Functional-Systems-Scores-%28FSS%29-and-
Expanded-Disab. Accessed [March 13, 2017].
EDSS of Disability Progression
EDSS remains
the gold
standard in
clinical trials for
measuring
physical
impairment
from MS1

A multidimensional clinical outcome measure consisting of 3 components
Advantages
• Dimensions change relatively independently
over time
• Measures are quantitative and standardized
• Easy to administer by a non-medical person
• Inter-rater and test-retest reliability are good
Disadvantages
• Many researchers are unfamiliar with
the MSFC
• Clinical meaning of a 1-point change on the
scale is not as clear as a change on the EDSS
• “Practice effect” can influence test results—
scores tend to improve naturally after
individuals take the tests on separate
occasions
Multiple Sclerosis Functional Composite
33
Fischer JS, et al. Mult Scler. 1999;5(4):244-250.
1
2
3
Timed 25-foot walk
• Measure of leg function and
ambulation
9-hole peg test
• Measure of upper extremity
(arm and hand) function
Paced auditory serial addition test (PASAT)
• Measure of cognitive function that
specifically assesses auditory information-
processing speed and flexibility
Imagery supplied by iStock

Results of MRI scans1
• Provide a measure of disease activity in relapsing-remitting MS
• Show lesions indicative of breakdown of the blood-brain barrier and total
lesion burden
• MRI measures have been used from pilot studies to phase III studies
Advantages2
• More sensitive in identifying disease activity than measures of relapse
• Easily blinded
• Objective and less prone to reporting bias on the part of the patient or
bias on the part of the researchers
• Reliability and reproducibility are generally very good
Disadvantages1
• Disease activity as seen on MRI scans does not correlate exactly with
clinical signs or with disability
Magnetic Resonance Imaging
34
No disease-
modifying agent for
MS has MRI results
data in its indication
1. Daumer M, et al. Neurology. 2009;72(8):705-711.
2. Martinelli Boneschi F, et al. Mult Scler. 2004;10(4):341-347.
© iS
tock.c
om
/denis
ovd

Quality of life scales
• Are included in and required by the FDA for some trials
Health status questionnaire Short Form-36 (SF-36)
• Generic QOL scale covering 8 areas of health
• Used to compare QOL across different diseases
QOL scales for MS
• Multiple Sclerosis Quality of Life-54 (MSQOL-54)
o 54-item scale that incorporates elements of the SF-36
• Multiple Sclerosis Quality of Life Inventory (MSQLI)
o Covers some areas in more detail than the MSQOL-54
o Includes subscales that study particular aspects of MS
Quality of Life Measures
35
Herndon R. Outcome measures in multiple sclerosis. In: Giesser BS, ed. Primer on Multiple Sclerosis. New York, NY: Oxford University Press; 2011:149-155.

Chapter 5
Statistical
Measures Utilized
in MS Clinical Trials
© iStock.com/ondoneye

Statistical significance1,2
• The percent likelihood that a result obtained happened
by chance alone
• Expressed as a probability value (P value)
• Determined by the magnitude of the result and the
sample size
• Does not necessarily suggest clinical significance
• A common cutoff for P values is 0.05
• When there are multiple endpoints, this P value
may be divided among endpoints
• However, in some situations, endpoints are
deemed “exploratory” and cannot be used to
assess statistical significance
Statistical Significance and Statistical Power
37
Statistical power3
• Probability of a statistically significant result
• Increasing the probability of a statistically significant
result is accomplished by increasing the sample size
0.05
P value2
P value >0.05
Not statistically significant
P value ≤0.05
Statistically significant
1. Appel LJ. Clin J Am Soc Nephrol. 2006;1(6):1360-1367.
2. Gordis LM. Randomized trials: some further issues. In: Epidemiology. 4th ed. Philadelphia, PA: Saunders Elsevier; 2009: chap 8.
3. Kirkwood BR, Sterne JA. Calculation of required sample size. In: Essential Medical Statistics. 2nd ed. Malden, MA: Blackwell Science; 2003:413-438.

Relative Risk or Risk Ratio
38
Relative Risk Meaning
1There is no difference in risk between the
2 groups
<1The event is less likely to occur in the
experimental group than in the control group
>1The event is more likely to occur in the
experimental group than in the control group
Gordis LM. Estimating risk: is there an association? In: Epidemiology. 4th ed. Philadelphia, PA: Saunders Elsevier; 2009:chap 11.
Example
Relative Risk =
incidence of disease in exposed population
incidence of disease in non-exposed population
A cohort study reported that 280/1000 people
who chewed gum every day for at least
10 years developed chronic jaw pain, and
48/1000 people who didn’t chew gum
developed chronic jaw pain.
RR =
Incidence of chronic jaw pain in daily gum chewers
=
280
= 5.83Incidence of chronic jaw pain in non-gum chewers
48
This would translate to findings of “people
who chew gum every day for at least 10 years
are 5.83 times more likely to develop chronic
jaw pain than those who do not chew gum.”
© iStock.com/Hogie

Determine if using a computer keyboard for more than 6 hours per day contributes
to hand pain. A case-control study compared 100 people with hand pain to
100 people without hand pain. We find out that 60 of the people with hand pain use a
computer keyboard for more than 6 hours per day, while 20 people with hand pain
use a computer keyboard for less than 6 hours per day. Here is the OR calculation:
Example2
Odds Ratio
39
1. Gordis LM. Estimating risk: is there an association? In: Epidemiology. 4th ed. Philadelphia, PA: Saunders Elsevier; 2009:chap 11.
2. Kirkwood BR, Sterne JA. Comparing two proportions. In: Essential Medical Statistics. 2nd ed. Malden, MA: Blackwell Science; 2003:148-164.
Odds Ratio1 =
Odds that an exposed person
develops disease
Odds that a non-exposed person
develops disease
Odds of hand pain in people using a
computer keyboard for more than
6 hours per day:
60%
=
60%
= 1.5(100%-60%) 40%
Odds of hand pain in people not using a
computer keyboard for more than
6 hours per day:
20%
=
20%
= 0.25(100%-20%) 80%
OR =
1.5= 6 =
The likelihood of hand pain in people using a computer
keyboard for more than 6 hours per day is 6 times higher
than in people not using a computer keyboard for more
than 6 hours per day0.25

Survival analysis1
• Statistical method in which individuals are followed until the occurrence of a predetermined event
• Described in 2 different methods
1. Life tables
• Used when researchers do not know the exact survival time of each individual study participant but do know the total number of study participants who have survived
at a succession of time points
2. Kaplan-Meier estimate of survival curve
• Curve is based on the exact time in the study that each individual study participant reaches the survival end point
• Primarily used to compare the survival patterns of different groups
Hazard ratio2
• Measure of how often a particular event happens in one group compared with how often it happens in another group, over time
• HR = 1 means there is no difference in survival between 2 groups
• HR >1 or HR <1 means that survival was better in one of the groups
95% Confidence interval3
• Range of numbers that represents the upper and lower 95% confidence limits for reported data
Survival Analysis, Hazard Ratio, and Confidence Interval
40
1. Kirkwood BR, Sterne JA. Survival analysis: displaying and comparing survival patterns. In: Essential Medical Statistics. 2nd ed. Malden, MA: Blackwell Science; 2003:272-286.
2. Taber’s Online. http://www.tabers.com/tabersonline/view/Tabers-Dictionary/750370/0/hazard_ratio. Accessed [March 25, 2017].
3. Kirkwood BR, Sterne JA. Confidence interval for a mean. In: Essential Medical Statistics. 2nd ed. Malden, MA: Blackwell Science; 2003:50-57.

Intention to Treat
Method1,2
• Preferred for the analysis of clinical trials
• Individuals are analyzed according to randomized assignment, independent of whether they remain on assigned therapy
• Provides an unbiased assessment of the efficacy of the intervention at the level of adherence that occurred in the trial
Figure is an example of modified intention to treat3
• “Modified” because the study only included patients who received at least 1 dose of study drug
41
Strategy for the analysis of randomized controlled trials that compares
all patients in the treatment arms to which they were originally randomly assigned1
1. Appel LJ. Clin J Am Soc Nephrol. 2006;1(6):1360-1367.
2. Montori VM, Guyatt GH. CMAJ. 2001;165(10):1339-1341.
3. Cohen JA, et al. N Engl J Med. 2010;362(5):402-415.
431 were included in the modified
intention-to-treat and
safety populations
281 were excluded
6 were not treated 2 were not treated 4 were not treated
420 were included in the modified
intention-to-treat and
safety populations
429 were included in the modified
intention-to-treat and
safety populations
426 were assigned to receive
fingolimod, 1.25 mg
426 were assigned to receive
fingolimod, 0.5 mg
435 were assigned to receive
interferon beta-1a
1292 underwent randomization
1573 patients were assessed for eligibility
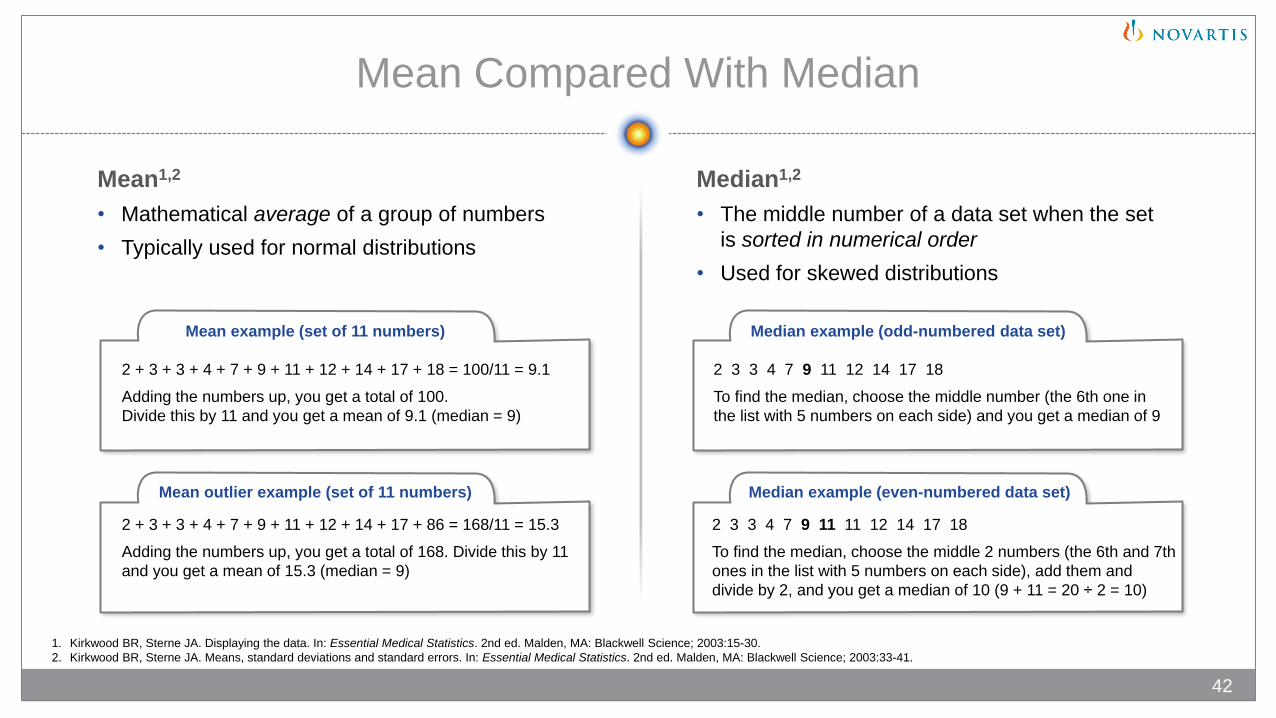
Mean1,2
• Mathematical average of a group of numbers
• Typically used for normal distributions
Mean Compared With Median
42
2 + 3 + 3 + 4 + 7 + 9 + 11 + 12 + 14 + 17 + 18 = 100/11 = 9.1
Adding the numbers up, you get a total of 100.
Divide this by 11 and you get a mean of 9.1 (median = 9)
2 + 3 + 3 + 4 + 7 + 9 + 11 + 12 + 14 + 17 + 86 = 168/11 = 15.3
Adding the numbers up, you get a total of 168. Divide this by 11
and you get a mean of 15.3 (median = 9)
2 3 3 4 7 9 11 12 14 17 18
To find the median, choose the middle number (the 6th one in
the list with 5 numbers on each side) and you get a median of 9
2 3 3 4 7 9 11 11 12 14 17 18
To find the median, choose the middle 2 numbers (the 6th and 7th
ones in the list with 5 numbers on each side), add them and
divide by 2, and you get a median of 10 (9 + 11 = 20 ÷ 2 = 10)
1. Kirkwood BR, Sterne JA. Displaying the data. In: Essential Medical Statistics. 2nd ed. Malden, MA: Blackwell Science; 2003:15-30.
2. Kirkwood BR, Sterne JA. Means, standard deviations and standard errors. In: Essential Medical Statistics. 2nd ed. Malden, MA: Blackwell Science; 2003:33-41.
Median1,2
• The middle number of a data set when the set
is sorted in numerical order
• Used for skewed distributions
Mean example (set of 11 numbers) Median example (odd-numbered data set)
Mean outlier example (set of 11 numbers) Median example (even-numbered data set)

Standard deviation1,2
• Shows how much variance is in the data or
how different the points are from the mean
• For a normal distribution, nearly all values
lie within 3 standard deviations of the mean
Figure of a normal curve
and standard deviations1-3
• Dark blue is +/- 1 standard deviation
from the mean, which is approximately
68% of the set for a normal distribution
• Medium and dark blue are +/- 2 standard deviations from the mean, which is approximately
95% of the set for a normal distribution
• Light, medium, and dark blue are +/- 3 standard deviations from the mean, which is approximately
99% of the set for a normal distribution
Standard Deviation
43
1. Kirkwood BR, Sterne JA. Means, standard deviations and standard errors. In: Essential Medical Statistics. 2nd ed. Malden, MA: Blackwell Science; 2003:33-41.
2. Kirkwood BR, Sterne JA. The normal distribution. In: Essential Medical Statistics. 2nd ed. Malden, MA: Blackwell Science; 2003:42-49.
3. Encyclopedia of Mathematics. http://www.encyclopediaofmath.org/index.php?title=Three-sigma_rule&oldid=17366. Revised February 7, 2011. Accessed [March 25, 2017].

Chapter 6
Factors Affecting the
Validity and Relevance of
MS Clinical Trial Results

1. Krieger S. Issues in the design and interpretation of multiple sclerosis clinical trials. In: Giesser B, ed. Primer on Multiple Sclerosis. New York, NY: Oxford University Press; 2011:435-450.
2. Inusah S, et al. Mult Scler. 2010;16(12):1414-1421.
3. Appel LJ. Clin J Am Soc Nephrol. 2006;1(6):1360-1367.
4. Salvi F, et al. BMC Neurol. 2010;10(105):1-6. doi:10.1186/1471-2377-10-105.
5. Mohr DC, et al. Mult Scler. 1999;5(3):192-197.
6. Kirkwood BR, Sterne JA. Calculation of required sample size. In: Essential Medical Statistics. 2nd ed. Malden, MA: Blackwell Science; 2003:413-428.
Short duration of trials1
• 1 to 2 years’ duration for disease-modifying
agents
• Makes it challenging to detect effectiveness
in prevention of long-term disability
Duration of MS2
• Frequency of relapse tends to diminish the
longer a person has had the diagnosis of MS
o Leads to difficulty interpreting ARR or
other measures of relapse
Randomization3
• Treatment arms not comparable in baseline
characteristics may affect study results
Factors Affecting Validity and Relevance of MS Trial Results
45
Seasonality4
• May impact MS symptoms, relapses,
and the appearance of new lesions
found in serial T2-weighted MRI
Attrition and lack of adherence5,6
• May affect statistical power

Factors Affecting Validity and Relevance of MS Trial Results (cont)
46
Natural history classifications
• 5 classifications of disease course
1. Clinically isolated syndrome (CIS)
2. Relapsing-remitting MS (RRMS)
3. Relapsing-progressive MS (RPMS)
4. Secondary progressive MS (SPMS)
5. Primary progressive MS (PPMS)
• Reliance on only these 5 classifications for
clinical trials limits the generalizability of the
results across the entire MS spectrum and
restricts FDA approval for other subtypes of MS
1. Krieger S. Issues in the design and interpretation of multiple sclerosis clinical trials. In: Giesser B, ed. Primer on Multiple Sclerosis. New York, NY: Oxford University Press; 2011:435-450.
Placebo-controlled trials
• It is difficult to recruit and retain patients
to take placebo because many
approved therapies are available
• Ethical concerns

Common Categories of Bias
47
Krishna R, et al. J Clin Diagn Res. 2010;4:2320-2324.
Selection bias
• Occurs when the groups to
be compared are intended
to be similar but are
actually different
o Volunteer or referral bias
o Nonrespondent bias
o Occurs when those
who do not respond
to a survey differ in
important ways from
those who respond
or participate
o This bias can work in
either direction
Measurement bias
• Can occur when systematic
error is introduced when
data are collected
o Instrument bias
o Insensitive measure bias
o Expectation bias
o Recall or memory bias
o Attention bias
o Verification or workup bias
Intervention (exposure) bias
• Is generally associated with
research that compares
groups
o Contamination bias
o Co-intervention bias
o Timing bias
o Compliance bias
o Withdrawal bias
o Proficiency bias
o When interventions
or treatments are
not equally applied
to the subjects

Relapse reporting by patients1
• Difficulty distinguishing a true relapse from a
pseudoexacerbation
o Relapses are over-reported
• Ignores worsening or new symptoms
o Relapses are underreported
Non-standardized definition and
counting of relapse1
• Studies vary on the definition of relapse
• Interpretation of symptoms differ by examiner
Outcome Measures
48
1. Krieger S, et al. Issues in the design and interpretation of multiple sclerosis clinical trials. In: Giesser BS, ed. Primer on Multiple Sclerosis. 2nd ed. New York, NY: Oxford University Press; 2016:535-552.
2. Martinelli Boneschi F, et al. Mult Scler. 2004;10(4):341-347.
EDSS limitations1
• EDSS may not capture accruing disability in
functional areas besides ambulatory
disability
• Significant amount of inter-observer
variation at the lower end of the scale
MRI measures and clinical correlation2
• MRI measures cannot predict clinically
relevant relapse(s) or long-term disability
outcomes

Drug approval in the United States follows either an NDA process or a BLA process1
• Many pharmaceutical products used in MS require a BLA
Clinical trials determine a treatment’s safety and/or efficacy on pre-specified outcomes2-4
• Trials can be categorized as experimental or observational and prospective or retrospective
Well-designed clinical trials are planned to achieve valid results and eliminate bias5,6
• Trials are also designed to be fair and ethical to the participants7
There is no single ideal measure for MS outcomes
• ARR is a common summary measure of relapses8
• EDSS remains the gold standard in clinical trials for measuring physical impairment from MS9
Statistical significance is the percent likelihood that the result occurred by chance2
• Statistical significance does not necessarily mean clinical significance
In MS trials, evaluating efficacy can be challenging due to the nature of the disease2
• Clinical trial design ensures that results obtained are real and not due to unseen influences or problems in the research protocol
1. US Food and Drug Administration. http://www.fda.gov/Drugs/DevelopmentApprovalProcess/HowDrugsareDevelopedandApproved/ApprovalApplications/TherapeuticBiologicApplications/default.htm. Updated [March 14, 2017]. Accessed
[March 25, 2017].
2. Appel LJ. Clin J Am Soc Nephrol. 2006;1(6):1360-1367.
3. ClinicalTrials.gov. https://clinicaltrials.gov/ct2/about-studies/learn#WhatIs. Accessed [March 9, 2017].
4. Boston University School of Public Health. http://sphweb.bumc.bu.edu/otlt/MPH-Modules/EP/EP713_AnalyticOverview/EP713_AnalyticOverview3.html. Accessed [March 9, 2017].
5. Jüni P, et al. BMJ. 2001;323(7303):42-46.
6. Gordis LM. Assessing the efficacy of preventive and therapeutic measures: randomized trials. In: Epidemiology. 4th ed. Philadelphia, PA: Saunders Elsevier; 2009:chap 7.
7. National Institutes of Health Clinical Center. https://clinicalcenter.nih.gov/recruit/ethics.html. Accessed [March 15, 2017].
8. Lavery AM, et al. Mult Scler Int. 2014;2014:262350. doi: 10.1155/2014/262350.
9. Krieger S. Issues in the design and interpretation of multiple sclerosis clinical trials. In: Giesser B, ed. Primer on Multiple Sclerosis. New York, NY: Oxford University Press; 2011:435-450.
Summary
49
Adap
ted f
rom
iS
tock.c
om
/alm
agam
i

Novartis Pharmaceuticals Corporation
East Hanover, New Jersey 07936-1080 © 2017 Novartis 6/17 XMG-1339454