understanding california home buyers presented by carmen hirciag, mba senior research analyst
TRANSCRIPT

UNDERSTANDING CALIFORNIA HOME BUYERS
Presented byCarmen Hirciag, MBASenior Research Analyst

Survey Methodology
700 telephone interviews and 567 online surveys conducted in February – April 2015
Respondents are home buyers who purchased a home Feb. 2014 – Feb. 2015

THE BUYING EXPERIENCE

Residence Location
Q. County of most recent home purchase?
SoCal 54%
NorCal 14%
Other CA 32%

Distressed Sales Continue Decline
2009 2010 2011 2012 2013 2014 20150%
10%
20%
30%
40%
50%
60%
70%
80%
90%
Regular/Equity REO/Bank Owned Short
Q. Was the home you recently bought a Regular Sale, REO/Bank Owned Property, Short Sale, or another type of sale?

Most Purchases are Single Family Homes
Q. Was the home …?
Single family 87%
Condo/townhouse
13%

Vacation/2nd Home Purchases Increase
2010 2011 2012 2013 2014 2015
0%10%20%30%40%50%60%70%80%90%
100%
Primary residence Investment Vacation/2nd home
Q What was the intended use of the property?

Listing Price Declines 7.9% YTY
2013 2014 2015$0
$50,000
$100,000
$150,000
$200,000
$250,000
$300,000
$350,000
$400,000 $355,000$380,000
$350,000
Median
Q. What was the initial listing price of the home you purchased?

Sale/Listing Prices Equal
Listing Purchase$0
$50,000
$100,000
$150,000
$200,000
$250,000
$300,000
$350,000
$350,000 $350,000Median
Q. What was the price of the home you purchased?

Many Listing > Purchase Prices
2013 2014 20150%
10%
20%
30%
40%
50%
60%
70%
80%
90%
100%
60%49% 44%
4%
5%28%
36%45%
28%
Listing < PurchaseListing = PurchaseListing > Purchase
Q. What was the initial listing price of the home you purchased?
Q. What was the price of the home you purchased?

Many Homes are in the Suburbs
Rural
Close to public transportation
Within walking distance of supermarket
Within walking distance of shopping/restaurants/entertainment
Urban
Suburban
0% 20% 40% 60%
15%
26%
26%
28%
34%
40%
Q. Please describe the location of the home. Select all that apply.

More Buyers Previously Lived with Parents
2011 2012 2013 2014 20150%
10%
20%
30%
40%
50%
60%
70%
80%
90%
100%
49%38%
50%59%
47%
48%54%
38%40%
39%
3%7% 6%
2%12%
Owned RentedLived w/parents Other
Q. What was the living arrangement immediately before your recent home purchase?

Buyers Spending Less Time Considering Purchase Before Contacting Agent
2002
2003
2004
2005
2006
2007
2008
2009
2010
2011
2012
2013
2014
2015
0
5
10
15
20
25
Q. How many weeks did you consider buying a home before contacting a real estate agent? (Asked if agent was used)
Average Weeks

Buyers Spending Less Time Investigating Homes & Neighborhoods Before Contacting Agent
2002
2003
2004
2005
2006
2007
2008
2009
2010
2011
2012
2013
2014
2015
0
5
10
15
20
25
30
Weeks
Q. How many weeks did you spend investigating homes and neighborhoods before contacting a real estate agent?
Average Weeks

The Home Search is Longer than It’s Ever Been
0
2
4
6
8
10
12
14
Average Weeks
Q. Once you found your agent, about how many weeks did you spend looking for a home with your agent? (Asked if agent was used)
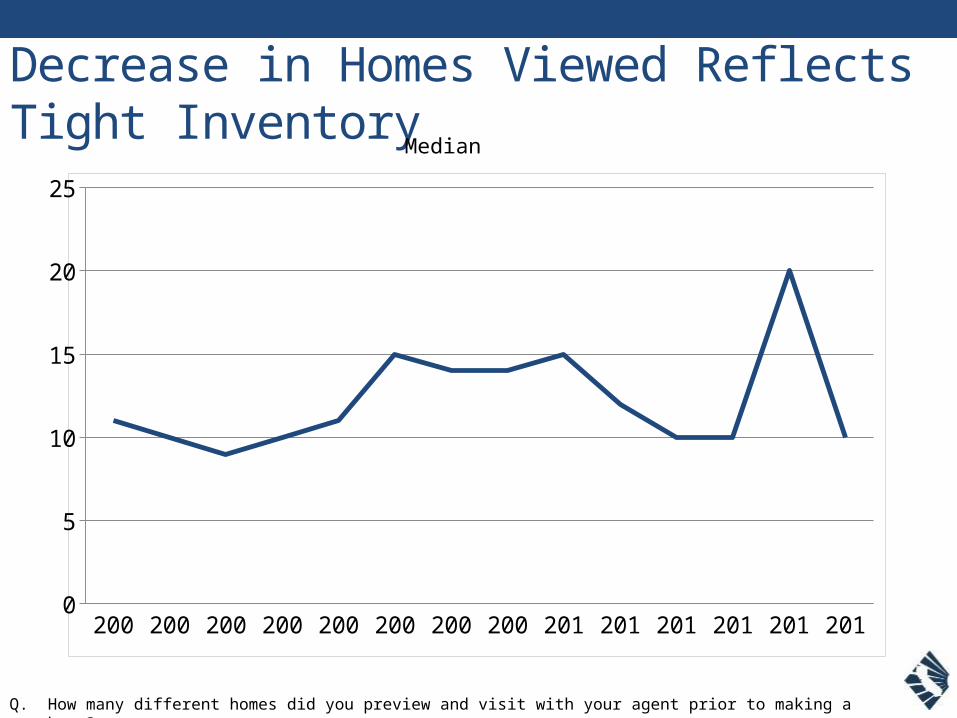
Decrease in Homes Viewed Reflects Tight Inventory
0
5
10
15
20
25
Q. How many different homes did you preview and visit with your agent prior to making a purchase?
Median

Top 5 Reasons for Buying
Desired better/other location
Changed jobs/relocated
Desired larger home
To have a place to live
Tired of renting
8%
11%
12%
14%
15%
Q. What were your main reasons for buying your home?

Buyers Didn’t Purchase Sooner Because…
Q. Why didn’t you buy a home sooner?
Difficulty qualifying for mortgage
Needed to sell current home
Needed to save for down payment
Waited to see when prices would stabilize
Not many good housing options
Waited until finances improved
No real buying urgency
5%
8%
12%
13%
13%
21%
22%

Most Buyers Feel their Home is Worth the Price Paid
Yes 85%
No, price too high 14%
No, price too low 1%
Q. Do you feel the home you purchased is worth the price you paid?

Majority of Buyers Found Home through Agent
Open house
For sale sign
Website
Agent
0% 10% 20% 30% 40% 50% 60%
9%
11%
18%
55%
Q. How did you find the home you purchased?

Buyers Plan to Keep Homes Longer
Q. How long do you plan to keep the property?
2013 2014 20150
5
10
15
20
25
6
8.8
20.1384522370012
Average Years
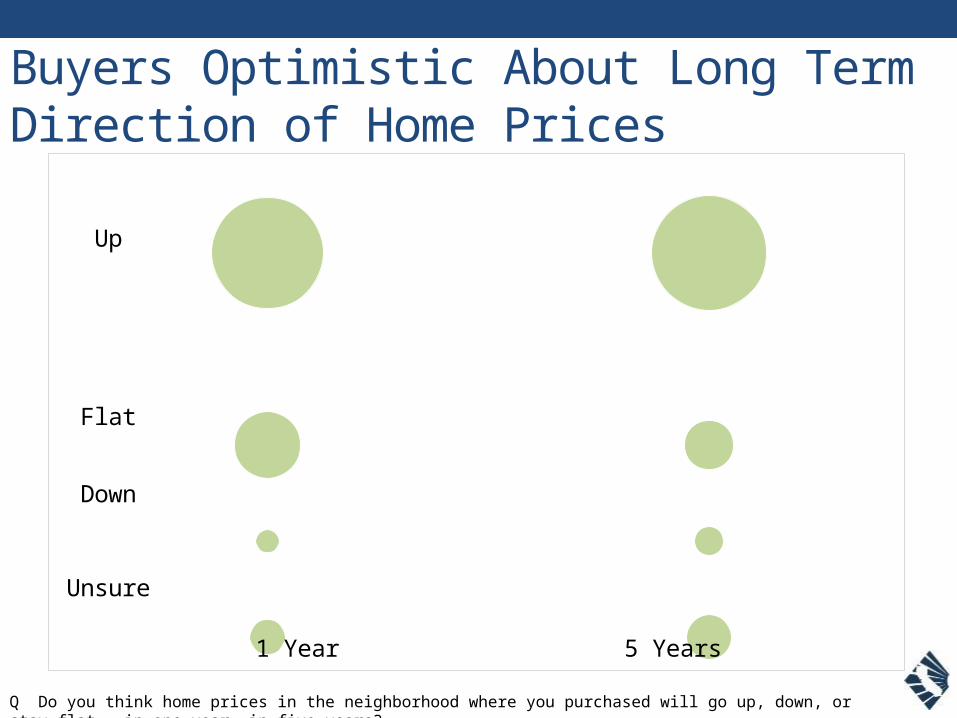
Buyers Optimistic About Long Term Direction of Home Prices
Up
Flat
Unsure
1 Year 5 Years
Down
Q Do you think home prices in the neighborhood where you purchased will go up, down, or stay flat … in one year, in five years?

Fewer Buyers Believe Prices Will Rise in 5 Years
Q Do you think home prices in the neighborhood where you purchased will go up in one year, in five years?
2009 2010 2011 2012 2013 2014 20150%
10%
20%
30%
40%
50%
60%
70%
80%
90%
Up in 1 Yr Up in 5 Yrs

Safety is Most Important in Choosing a Neighborhood
Q Please rate the importance of the following in your decision to purchase a home in the neighborhood where you purchased. (Scale 1-10, 1=not at all important, 10=extremely important)
Category Rating
Safety 8.3Walkability 6.5Quality of schools 6.1Entertainment/cultural activities nearby 5.9Short commute to work 5.6Great restaurants nearby 5.5
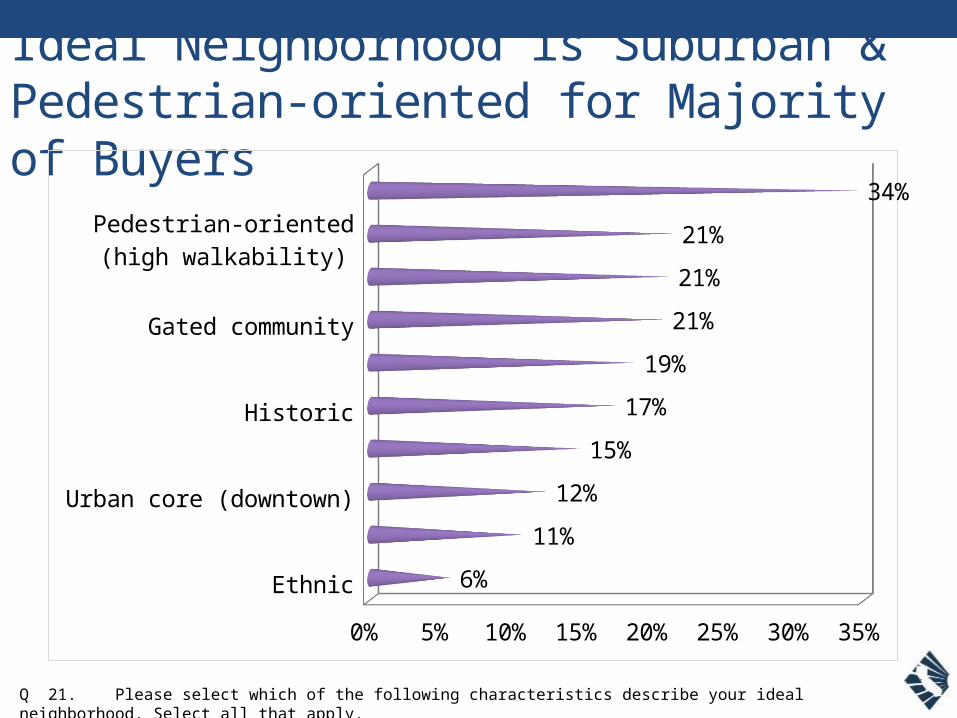
Ideal Neighborhood is Suburban & Pedestrian-oriented for Majority of Buyers
Q 21. Please select which of the following characteristics describe your ideal neighborhood. Select all that apply.
Ethnic
Urban core (downtown)
Historic
Gated community
Pedestrian-oriented (high walkability)
0% 5% 10% 15% 20% 25% 30% 35%
6%
11%
12%
15%
17%
19%
21%
21%
21%
34%

Majority of Buyers are Satisfied with Purchase
Q Are you satisfied with the home you purchased or do you feel like you had to compromise?
75%
13%
12%
SatisfiedSelectd best house given limited supply in desired neigh-borhoodSelected best house in affordable neigh-borhood; prices too high in preferred neighborhood

27
Technology Use

Zillow & Realtor.com are Most Useful Websites in Buying Process
0% 5% 10% 15% 20% 25% 30% 35%
10%
10%
13%
17%
33%
Q. What was the single most useful website that you visited during your home buying process?
Agent

Realtor.com & Zillow Most Useful Websites
2007 2008 2009 2010 2011 2012 2013 2014 20150%
5%
10%
15%
20%
25%
30%
35%
40%
45%
50%
Zillow realtor.com Brokerage Redfin
Q. What was the single most useful website that you visited during your home buying process?

Most Buyers are Using Mobile Devices
2013 2014 20150%
10%
20%
30%
40%
50%
60%
70%
80%
90%
100%
85%91%
85%
Q. Did you use a mobile device in the home buying process?

85% of Buyers Used Mobile Device in Buying Process
95%
• Research homes
28%
• Communicate
20%
• Research neighborhoods
14%
• Take photos of homes/amenities/neighborhoods
13%
10%
• Make calls
Q. How did you use your mobile device in the home buying process? N = 1269

Zillow is Most Useful App
Q. What was the most useful app that you used during the home buying process? N = 1269

Zillow Remains Most Useful App
Q. What was the most useful app that you used during the home buying process?
2014 20150%
5%
10%
15%
20%
25%
30%
35%
40%
45%
Zillow realtor.com Trulia

½ Buyers Who Found Home Online Found it on Zillow or Redfin
0.0% 5.0% 10.0% 15.0% 20.0% 25.0% 30.0% 35.0%
9%
13%
21%
29%
Q. On which website did you find your home?

Zillow Remains #1 Website where Buyers Found Home
2011 2012 2013 2014 20150%
5%
10%
15%
20%
25%
30%
35%
realtor.com Zillow Trulia Redfin
Q. On which website did you find your home?

Social Media Use Declines
2011 2012 2013 2014 20150%
10%
20%
30%
40%
50%
60%
70%
80%
52%
68%75% 77%
35%
Q. Did you use social media (such as Facebook, Twitter, YouTube, etc.) in your home buying process?

Social Media Used for Buying Info & Tips /Suggestions from Friends
Agents' YouTube
Agent's Facebook page
Agent referrals
Neighborhood info
Buying tips, suggestions from friends
Home buying info
0% 5% 10% 15% 20% 25% 30% 35% 40%
17%
26%
27%
30%
31%
35%
Q. How did you use social media (such as Facebook, Twitter, YouTube, etc.) in your home buying process?

35% of Buyers Used Social Media in Buying Process
Q. Which social media websites did you use during your home buying process?

Facebook Remains Top Social Media Site for Buyers
Q. Which social media websites did you use during your home buying process?
2014 20150%
10%
20%
30%
40%
50%
60%
70%
80%
90%
Facebook YouTube Twitter Yelp
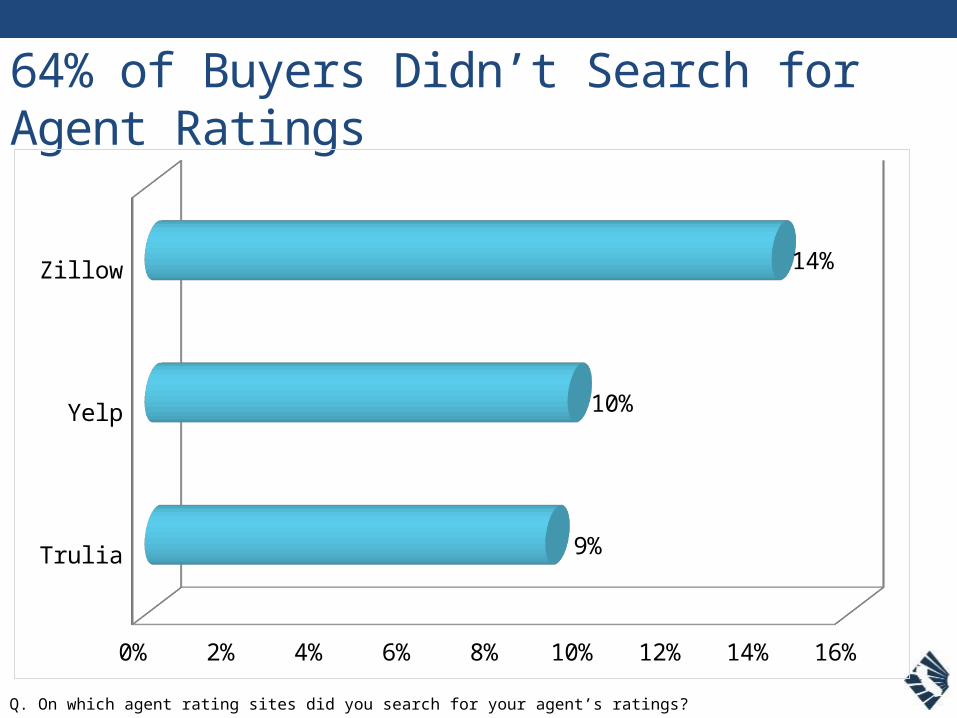
64% of Buyers Didn’t Search for Agent Ratings
Trulia
Yelp
Zillow
0% 2% 4% 6% 8% 10% 12% 14% 16%
9%
10%
14%
Q. On which agent rating sites did you search for your agent’s ratings?

62% of Buyers Didn’t Rate their Agent Online
Trulia
Yelp
Zillow
0% 2% 4% 6% 8% 10% 12% 14% 16%
8%
10%
14%
Q. On which agent rating sites did you rate your agent?

Fewer Buyers Googling their Agent
2007 2008 2009 2010 2011 2012 2013 2014 20150%
10%
20%
30%
40%
50%
60%
70%
80%
Q. Did you Google your agent?
Financing

More Buyers Obtained Financing
2009 2010 2011 2012 2013 2014 2015
0%
10%
20%
30%
40%
50%
60%
70%
80%
90%
100%100%
94%92% 96%
91%
74% 77%
Q. Did you obtain financing for your home purchase?

Nearly ¼ Buyers Paid Cash
Financing 77%
Cash 23%
Q. How did you pay for the home you purchased?

Most Cash Buyers Used Personal Savings or Proceeds from Sale of Previous Residence
Inheritance
Sale of personal assets
Borrowed/gifted
Proceeds from sale/refi of another property
Proceeds from sale of previous residence
Personal savings
0% 10% 20% 30% 40%
12%
13%
17%
18%
28%
40%
Q. If all cash, where did the funds come from? N = 367

Average Down Payment Remains Above 20%
2009 2010 2011 2012 2013 2014 20150%
5%
10%
15%
20%
25%
30%
35%
Average
Q. What was your down payment for the home purchased, in percent of the home value?

Most Buyers Obtain Fixed Rate Loans
Fixed 83%
Ad-justable 13%
Other 1%
Unsure 4%
Q. What type of loan do you have?

Fixed Rate Loans Remain Majority
2009 2010 2011 2012 2013 2014 20150%
10%
20%
30%
40%
50%
60%
70%
80%
90%
100%
69%79% 84%
93% 91% 92%83%
31% 15%16%
7% 8% 8%13%
Fixed Adjustable Other Unsure
Q. What type of loan do you have?

¾ Loans are for 30 Years
20112012
20132014
2015
0%10%20%30%40%50%60%70%80%90%
100%
85% 87%85% 86%
75%
15% 13%15% 14%
17%
Unsure Other 15 Year 30 Year
Q. What was the duration of your loan?

Buyers Have Less Difficulty With Financing
2009 2010 2011 2012 2013 2014 2015
0.01.02.03.04.05.06.07.08.09.0 8.1 8.5
8.0 8.5 8.6
7.1
4.1
Average
Q. Please rate how easy or difficult it was to obtain financing on a scale of 1 to 10 with 1 being very easy and 10 being very difficult.

Majority Think Interest Rates Have Bottomed
Yes 63%
No 37%
Q. Do you think mortgage interest rates have bottomed?

BUYER/AGENT RELATIONSHIP
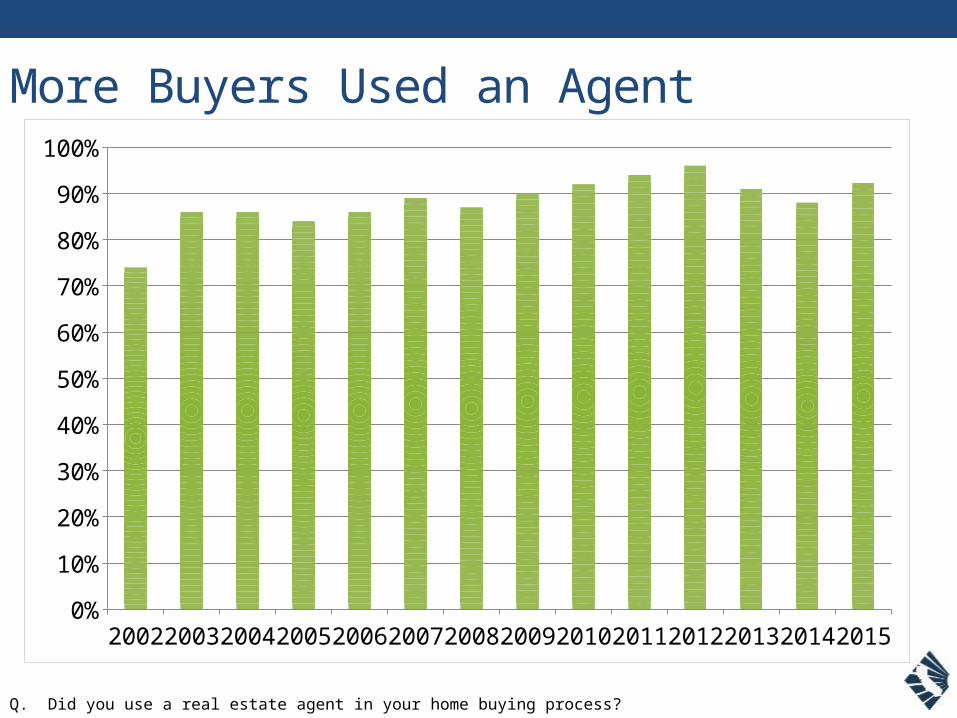
More Buyers Used an Agent
2002
2003
2004
2005
2006
2007
2008
2009
2010
2011
2012
2013
2014
2015
0%
10%
20%
30%
40%
50%
60%
70%
80%
90%
100%
Q. Did you use a real estate agent in your home buying process?

Most Buyers Find Agents through Relationship/Contacts
2002
2003
2004
2005
2006
2007
2008
2009
2010
2011
2012
2013
2014
2015
0%10%20%30%40%50%60%70%80%90%
100%
Relationships/Contacts AdvertisingInternet Other
Q. How did you find your real estate agent?

Majority of Buyers Interviewed > 1 Agent
1 2 3 4 5 6 7 8 9 100%
5%
10%
15%
20%
25%
30%
35%
40%
45% 42%
17%
12%9%
4%3% 3% 4% 3% 3%
# of Agents Interviewed
Q. How many agents did you interview prior to selecting the agent you used in your recent home purchase?

Buyers Continue Interviewing Multiple Agents
2003
2004
2005
2006
2007
2008
2009
2010
2011
2012
2013
2014
2015
0.0
0.5
1.0
1.5
2.0
2.5
3.0
3.5
2.3 2.3 2.4 2.5 2.5 2.4
2.8
2.2
1.8
2.2
3.2 3.1
2.4
Average
Q. How many agents did you interview prior to selecting the agent you used in your recent home purchase?

Being Responsive is Important to Buyers in Selecting an Agent
Knowledgeable/experienced
Negotiating ability
Trustworthy
Previously used agent
Seemed most reponsive
7%
8%
8%
10%
20%
Q. What was the single most important reason for selecting the agent that you used in your recent home purchase?.

Agents Communicate According to Buyer Preference
TelephoneEmail
Text Message In Person
Social media
49%
22%
12% 13%
2%
52%
21%
12% 13%
2%
Preferred Actual
Q. What was your preferred method of communicating with your agent?
Q. How did your agent actually communicate with you?
2003
2004
2005
2006
2007
2008
2009
2010
2011
2012
2013
2014
2015
0%
5%
10%
15%
20%
25%
30%
35%
40%
45%
50%
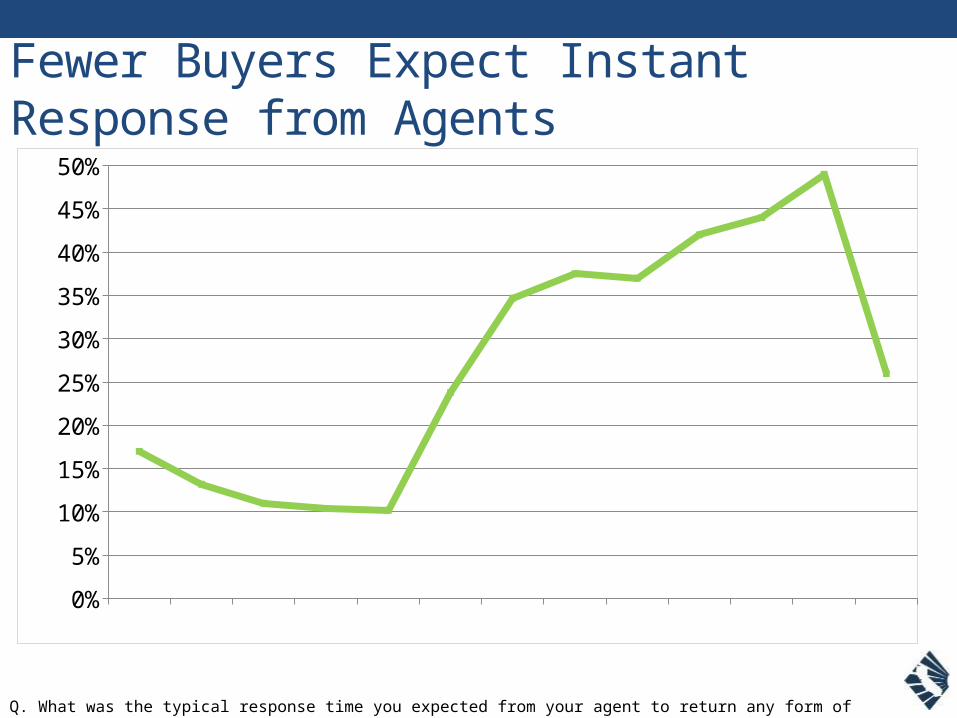
Q. What was the typical response time you expected from your agent to return any form of communication to you?
Fewer Buyers Expect Instant Response from Agents
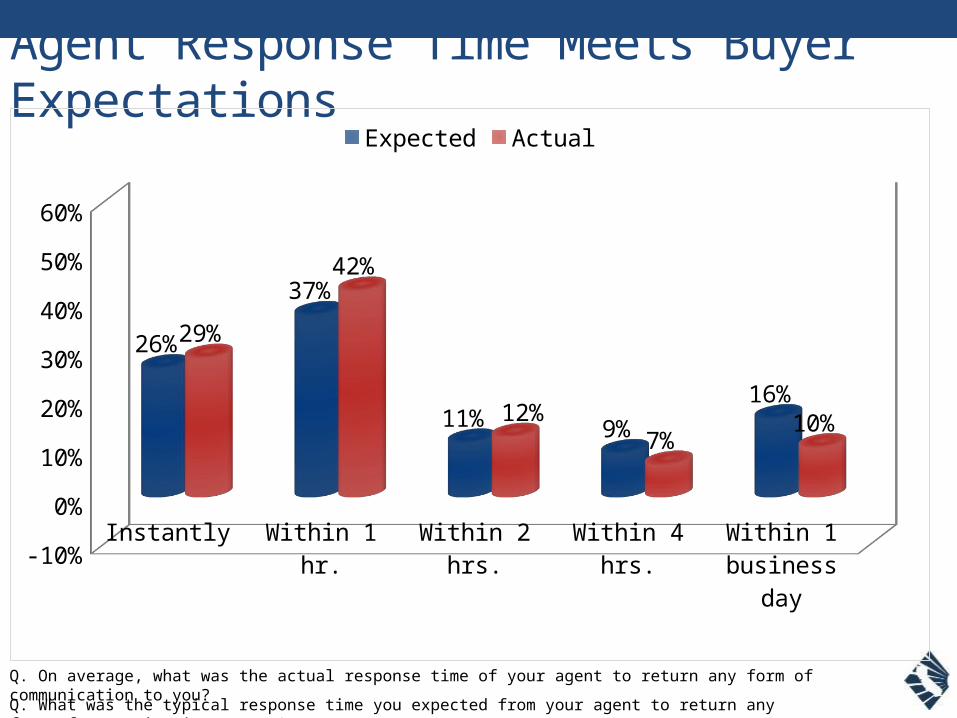
Agent Response Time Meets Buyer Expectations
Instantly Within 1 hr. Within 2 hrs.
Within 4 hrs.
Within 1 business
day-10%
0%
10%
20%
30%
40%
50%
60%
26%
37%
11% 9%
16%
29%
42%
12%7%
10%
Expected Actual
Q. What was the typical response time you expected from your agent to return any form of communication to you?
Q. On average, what was the actual response time of your agent to return any form of communication to you?

Agent Satisfaction Ratings Improve- Average Ratings on 1-5 Scale -
2014
2015
Your real estate agent’s negotiating skills 3.4 4.3
Overall process of finding a home 3.3 4.1
Overall satisfaction with your real estate agent 3.3 4.4
Q. Please rate your degree of satisfaction with the following aspects of your home buying experience on a scale of 1-5, where 1 is “least satisfied” and 5 is “most satisfied”.

Buyer Satisfaction Improves
2005 2006 2007 2008 2009 2010 2011 2012 2013 2014 20151
1.5
2
2.5
3
3.5
4
4.5
5
Process of Finding a Home Satisfaction with Agent
Q. Please rate your degree of satisfaction with the following aspects of your home buying experience on a scale of 1-5, where 1 is “least satisfied” and 5 is “most satisfied”.

Top 5 Reasons for Satisfaction With Agent
Responded fast (26%)
Listened to needs (24%)
Helped find best home (22%)
Worked hard (22%)
Did a good job facilitating transaction (18%)
Q. Why do you have that level of satisfaction with your agent?

Reasons for Dissatisfaction With Agent
Communication problems (5.2%)
Negotiation problems (3.3%)
Agent needed to do better job of monitoring transaction (1%)
Q. Why do you have that level of satisfaction with your agent?

Most Buyers Would Work with Agent Again
2004 2005 2006 2007 2008 2009 2010 2011 2012 2013 2014 2015
88% 87%
50%67% 61% 64% 72%
54% 60%52%
61%
85%
2% 3%
4%
3% 15% 13%11%
11%12% 22%
33%
11%10% 10%
46%30%
25%22% 17%
35% 28% 26%
6% 4%
Unsure No Yes
Q. Would you work with the same agent again?

Most Buyers Would Recommend Agent to Others
Q. Would you recommend your agent to others?
Yes 85%
No 11%
Unsure 4%

WHO IS THE 2014 BUYER?Demographics

38% minorit
y
48 years old
70% marrie
d
55% colleg
e degre
e
Typical CA Home Buyer

1/2 have
children
3 people
82% live with
spouse/ significant
other
8% live with
parents
household income >
$216k
Typical CA Household

Percent of First-time Buyers Rebounds
2002
2003
2004
2005
2006
2007
2008
2009
2010
2011
2012
2013
2014
2015
8% 7%
15%
25%25%
19%19%
38%
46%43%
54%
42%
12%
40%
Q. Was this your first home purchase?

Most Buyers have Not Experienced a Distressed Sale Foreclosure
10%
Short sale 12%
Neither 78%
Q. Have you ever gone through a foreclosure or short sale?

79% of Distressed Sales Occurred After 2007
Q. What year was the foreclosure or short sale?
before 2008
2008 2009 2010 2011 2012 20130
5
10
15
20
25
30
Year
# o
f D
istr
essed
Sale
s

More Repeat Buyers Previously Under Water
Q. Was the outstanding loan balance on your previous home higher than the sale price?
2013 2014 20150%
5%
10%
15%
20%
25%
12%
4%
23%

Buyer Gender
2002
2003
2004
2005
2006
2007
2008
2009
2010
2011
2012
2013
2014
2015
0%
10%
20%
30%
40%
50%
60%
70%
80%
90%
100%
Male Female
Q. What is your gender?

Majority of Buyers are Over 35
2002
2003
2004
2005
2006
2007
2008
2009
2010
2011
2012
2013
2014
2015
0%
20%
40%
60%
80%
100%
Under 25 25-34 35-4445-54 55-64 65+
Q. What is your age?

Buyer Age Slightly Declines
0
5
10
15
20
25
30
35
40
45
50
38 39 39 40 4139 39
37 36 35 35 36
4644
Median Age
Q. What is your age?

Majority of Buyers are White
Other
Black
Asian
Hispanic
White
0% 10% 20% 30% 40% 50% 60% 70%
5%
7%
9%
15%
64%
Q. How would you describe your ethnic background?

Majority of Buyers are Married
married 70%
Single 18%
Other 12%

More than Half of Buyers have College Degrees
High School
Some College
4-Year College Grad
Graduate School
0% 5% 10% 15% 20% 25% 30% 35%
16%
28%
33%
22%
Q. What is the highest level of education you have completed?

Majority of Buyers have Annual Household Income > $75K
< $50,000
$50-000-$74,999
$75,000-$99,999
$100,000-$149,999
$150,000-$199,999
$200,000 +
0% 5% 10% 15% 20% 25%
18%
22%
18%
19%
7%
16%
Q. Which of the following categories best represents you total annual income from all sources?

SO WHAT?Key Conclusions & Opportunities

Buying Process Begins Before Agent is Contacted
4.5 months before
contacting agent
• Considering purchase
3.5 months before
contacting agent
• Investigate homes/ neighborhoods
Target consumers during due diligence
period
• Provide valuable information

Safety is Most Important in Choosing a Neighborhood
Q Please rate the importance of the following in your decision to purchase a home in the neighborhood where you purchased. (Scale 1-10, 1=not at all important, 10=extremely important)
Category Rating
Safety 8.3Walkability 6.5Quality of schools 6.1Entertainment/cultural activities nearby 5.9Short commute to work 5.6Great restaurants nearby 5.5

Buyers Need Most Agent Assistance in Negotiating
Determine comps
Determine affordability
Paperwork
Price negotiation
Find the right home
Negotiate terms of sale
0% 5% 10% 15% 20% 25%
11%
12%
15%
18%
22%
25%
Q. In which part(s) of the transaction did you need the most assistance from your agent?

Top 5 Reasons for Buying
Desired better/other location
Changed jobs/relocated
Desired larger home
To have a place to live
Tired of renting
8%
11%
12%
14%
15%
Q. What were your main reasons for buying your home?

Most useful websitesMost useful apps
Where majority found home
Market on these websites & apps

Communication
Important to buyers in agent selection
• Responsive• Trustworthy• Negotiation
skills• Knowledge /
experience
Communicate better
• Respond immediately
• Market skills effectively
• Communicate according to client preference

What Buyers Would Change About the Home Buying Experience
1. I would have a better market understanding (14%)
2. Process would be faster & easier (9.1%)
3. I’d seek additional assistance with mortgage approval (7.5%)
4. Agent would negotiate better (6.7%)
5. Agent would respond faster (6.4%)
Q. If there was one thing you could change about the home buying experience, what would it be?

Advice to Agents from Buyers
Communicate better (17%)
Communicate according to client preference (12%)
Negotiate better (9.3%)
Understand market better (9%)
Respond faster (7.6%)
Q. What advice would you give to real estate agents to improve the process or the level of service?

The Truth About Homeowners—Why They’re Not Selling
Thursday, June 25, 20152:00 PM - 3:00 PM
To register: WWW.
CAR.ORG/MARKETDATA/VIDEOS
Join us for our next webinar…


NEW MEMBER BENEFIT

MONITOR MINUTE

MORE CONSUMER RESEARCH
You’ll receive:oWebinars on key trends
oSpecial reports on hot topic issueso Interactive graphics
oBig-picture reports and forecasts
http://ccre.car.org/information/
