understanding and modeling flowability of ddgs
TRANSCRIPT
Iowa State University
From the SelectedWorks of Kurt A. Rosentrater
June, 2008
Understanding and Modeling Flowability ofDDGSRumela Bhadra, South Dakota State UniversityKurt A. Rosentrater, United States Department of AgricultureKasiviswanathan Muthukumarappan, South Dakota State University
Available at: https://works.bepress.com/kurt_rosentrater/122/
The authors are solely responsible for the content of this technical presentation. The technical presentation does not necessarily reflect the official position of ASABE, and its printing and distribution does not constitute an endorsement of views which may be expressed. Technical presentations are not subject to the formal peer review process, therefore, they are not to be presented as refereed publications. Citation of this work should state that it is from an ASABE Section Meeting paper. EXAMPLE: Author's Last Name, Initials. Title of Presentation. ASABE Section Meeting Paper No. xxxx. St. Joseph, Mich.: ASABE. For information about securing permission to reprint or reproduce a technical presentation, please contact ASABE at [email protected] or 269-429-0300 (2950 Niles Road, St. Joseph, MI 49085-9659 USA).
An ASABE Meeting Presentation Paper Number:083808
Understanding and Modeling Flowability of DDGS
Rumela Bhadra, ASABE Member
Graduate Research Assistant, South Dakota State University, Brookings, SD 57007.
Kurt A. Rosentrater, ASABE Member Engineer Bioprocess Engineer, USDA-ARS, North Central Agricultural Research Laboratory, Brookings, SD 57006.
K. Muthukumarappan, ASABE Member Engineer Professor, South Dakota State University, Brookings, SD 57007.
Written for presentation at the 2008 ASABE Annual International Meeting
Providence, Rhode Island USA
June 29-July 2, 2008 Abstract. Distillers dried grains with solubles (DDGS), the major coproduct from the corn-based fuel ethanol industry, is primarily used as livestock feed. Due to high protein, fiber, and energy contents, there is a high demand for DDGS. Flowability of DDGS is often hindered due the phenomenon of “caking”. Shipping and handling of DDGS has thus become a major issue due to bridge formation between the DDGS particles. The objective of this investigation was to measure flowability characteristics of DDGS samples from five ethanol plants in the north central region of the U.S. Carr and Jenike tests were performed, and the resulting data were mathematically analyzed using a previously developed empirical model. These results will be presented and discussed. Quantifying DDGS flowability is a necessary step toward overcoming this logistical challenge facing the fuel ethanol industry.
Keywords. Caking, Carr, DDGS, Flowability, Jenike, Properties
2
Introduction Distillers dried grain with solubles, commonly known as DDGS, has been extensively
used as a source of protein for ruminants and non-ruminants for more than two decades. With the exponential growth of the corn-based fuel ethanol industry, it is expected that there will be an increase in supply as well as in demand of DDGS during coming years. It is roughly estimated that for every one bushel (56 lbs) of corn that is converted to ethanol, approximately 17 lbs of DDGS are produced along with 17.6 lbs of ethanol and 18.4 lbs of carbon dioxide (Jaques et al., 2003). DDGS is a storehouse of energy for livestock as it has nearly 35% protein, 30% fiber, some traces of non-fermentable starch, and about 10-12% fat, which accounts for its high energy content. DDGS also has a substantial amount of minerals (e.g., calcium, phosphorous, etc.) and some key essential amino acids like methionine, leucine, etc. (Spiehs et al., 2002). This makes DDGS a very good livestock feed. Due to its increasing demand and benefits, it is becoming increasingly important to ship and handle this product over large distances, generally by railway cars and trucks. It is also essential to store DDGS in large tanks, silos or storage bins for relatively long time periods.
Storage and handling of DDGS has been found to be troublesome due to poor flowability. In fact, it has been reported that due to the flowability problems, shipping DDGS through railway cars or trucks can be very problematic during unloading (Rosentrater, 2006b).Restriction commonly occurs due to the “caking” phenomenon between particles, and thus groups of particles. Due to this caking, also known as “bridging”, there can be substantial economic loss during shipping of DDGS. The particles tend to stick with each other, which results in unwanted agglomeration and adds to cost of DDGS since manpower, machinery, and time will be required to break those agglomerates (Rock and Schwedes, 2005).
Much research has been done with the flowability, handling, and storage characteristics of other granular powders and bulk solids. But there is a great need to understand flowability behavior of DDGS, as there is very little information available to date. Understanding flowability properties, storage properties, physical properties, and related chemical properties, along with their inter-relationships is an important area to study to solve flow problems associated with DDGS. Apart from solving the caking problem in the flowability of DDGS, it is useful to know the physical and flow characteristics of DDGS for long term handling, storage and shipping.
It has also been reported that there can be substantial differences in many physical properties among DDGS samples obtained from commercial plants, and also between batches (collection periods) for a particular plant (Bhadra et al., 2007; Rosentrater, 2006). Thus, not only would understanding the flowability and physical properties be helpful toward solving the flow problem in DDGS, but also elucidating inconsistencies in DDGS samples may be important when dealing with flowability of DDGS.
Flow is defined as the relative movement of bulk particles in proximity to neighboring particles or along the wall of the container or storage tanks (Peleg, 1977). Flowability studies are important to understand and ensure steady and reliable flow of a particular powder or granular solid (Kamath et al., 1994). Flowability problems are often related to physical properties of granular solids. Flowability is not actually a natural material property of a particular product, and being a multidimensional problem, no single test can determine it. Flowability is a combination of the physical properties of materials, environmental factors, processing techniques used for that material’s production, and storage equipment used to store and handle that material (Prescott and Barnum, 2000). Some key factors that influence flowability are moisture, humidity, temperature, pressure, fat, particle size and shape and addition of flow agents.
Moisture is a key parameter when considering the flowability of any organic or granular material. Most agricultural and organic materials have a tendency to lose or to gain moisture
3
with changing environmental factors. Moisture content is an important variable that affects cohesive strength and arching of bulk solids (Johanson, 1978). It has been reported that even small changes in moisture can change the frictional properties of bulk solids very significantly (Marinelli and Carson, 1992). With an increase in moisture it has been reported that compressibility increases, causing flowability problems (Moreyra and Peleg, 1981; Yan and Barbosa, 1997). Moisture can also be coupled with surface properties, and change or influence adherence properties between particles and storage tanks (Hollenbach et al., 1983). Moisture migration and liquid bridge formation could lead to such flowability problems in DDGS. Like moisture content, humidity can also an important factor for flowability in DDGS. It has been found that humidity increases the angle of repose for starch, sucrose and sodium chloride powders (Craik and Miller, 1958).
Temperature also plays an important role in terms of powder flowability. For example, freezing temperatures may result in formation of ice bridges between particles if moisture content is high enough, which will restrict the flow of particles (Irani et al., 1959; Johanson, 1978; Fitzpatrick et al, 2004b). Conversely, fat has been found to play an important role in flow problems too. It was found that high fat content can lead to worse flow conditions for dried soy milk powders (Perez and Flores, 1997). One of the reasons for this could be higher fat content in presence of a higher temperatures may liquefy and thus act as glue between particles. It may be also possible that fat content may itself cause stickiness among the DDGS particles without even changes in temperatures.
Particle size and shape also play vital roles in flowability of powders and granular materials. Particle shapes and size are often adjusted to suit the final requirement and quality for various products. Generally, the smaller the size of the particle, the better the flow, depending upon the product. However it has also been found that a reduction in particle size of powders can make the flowability worse, as this increases particle cohesion due to an increase in surface area per unit mass (Fitzpatrick et al., 2004a, 2004b). It has been found that shear index for general powders, mainly inorganic materials like ceramics, was inversely proportional to volume/surface mean diameter (Farely, 1967; Valentin, 1968). The finer the particle size, the more contact area between particles, which can lead to greater cohesive forces among the particles, which thus causes flowability problems (Marinelli and Carson, 1992).
It has been found that larger particle sizes can increase compressibility in bulk solids, and thus lead to flow problems (Yan and Barbosa, 1997). Particle shape parameters include roundness, sphericity, and surface roughness. Smooth surfaces with higher roundness ratios generally give better flowability in granular materials than surfaces with rough edges. Rough edges on particles may form a type of lock and key system, and thus interlock the neighboring particles, and thus cause flowability problems. Small particles with higher roughness on surfaces may cause more flow problems than larger particles with smooth edges.
Flowability problems may arise due to combined or synergistic affects of influencing factors, such as moisture, humidity, time of storage, fat composition, particle size and shape, compaction pressure distribution, and vibrations during transport. Variations in the levels of these factors may also leads to flowability problems (Rosentrater, 2006b).
Parameters Associated with Flowability and Handling of DDGS
Carr Index Flow Properties
Angle of Repose (AoR)
Angle of repose is defined as the angle formed between the slope of a pile of material with a horizontal plane; this pile has been formed when DDGS or other such powders are dropped from an elevation. Angle of repose of between 25° to 35° generally indicate free-

4
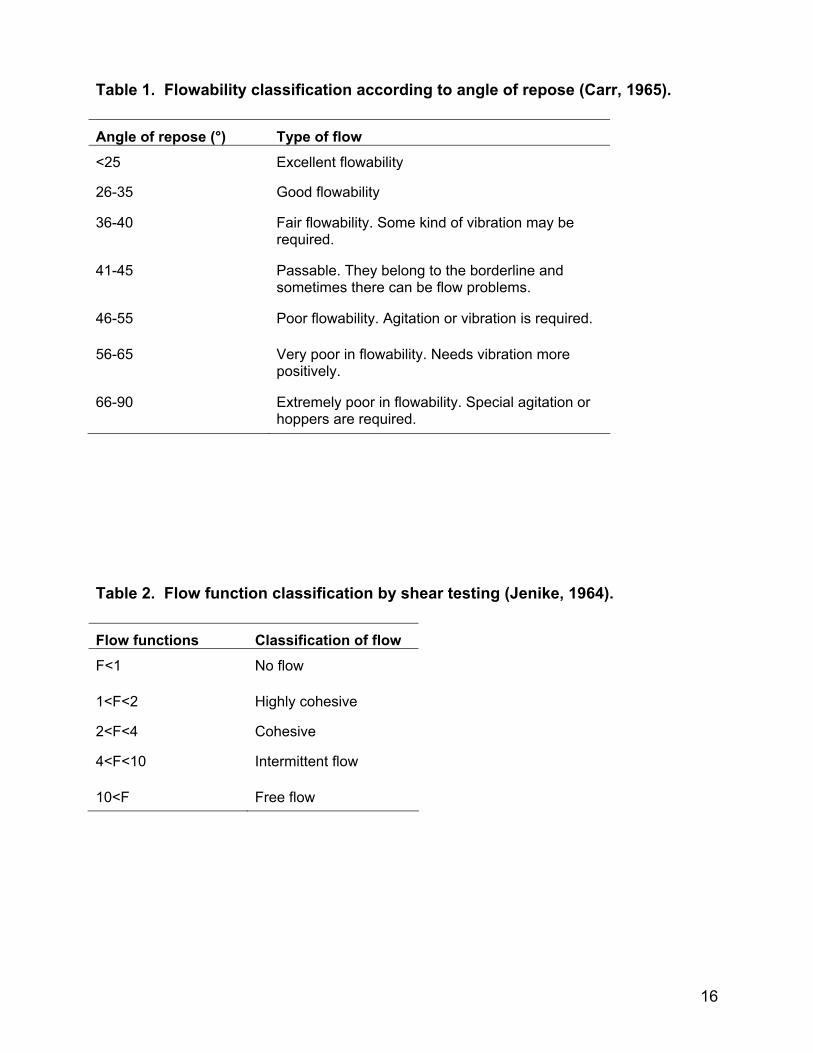
flowing substances (Carr, 1965). Two categories of angle repose can be formed: one during filling, and the other during emptying. The two forms of angle of repose are also important while considering design parameters related to handling and shipping of DDGS. The higher the angle of repose, the greater is the flow problem for a material. Angle of repose is related to flowability of powders or bulk solids, and can be summarized categorically as described in table 1 (Carr, 1965).
Bulk Density
Bulk density provides a measure of the effective capacity for storage bins and silos. This parameter is determined as the mass of granular material that will occupy a specific volume of the storage space. Bulk densities include not only the material volume, but also air space entrapped between the particles. Further, two categories of bulk density include aerated bulk density (or loose bulk density) and packed or (tapped) bulk density. The latter category of bulk density occurs when an external force or pressure has been applied to the mass of the granular solid and it compresses, displacing the entrapped air between particles. Packed (or tapped) density is an actual representation of a material’s bulk density when it is stored in bins or transported over large distances in a rail car.
Hausner Ratio
Hausner Ratio is defined as the ratio of tapped bulk density to the aerated (or apparent) bulk density. Values less than 1.25 typically indicate good flow, whereas values greater than 1.25 generally indicate poor flow (Michael, 2001). Bulk density and Hausner Ratio influence flow functions and design parameters such as arching, rat holing, and flow rate from a hopper as well as equipment structural design (Johanson, 1978).
Compressibility (Cc)
The compressibility of a granular solid is calculated as:
Cc = 100 (PD-AD) / PD (1)
where PD denotes the packed bulk density (kg3/cm) and AD (kg3/cm) is denotes the aerated bulk density for the granular solid, and Cc is denoted as compressibility (%); this parameter qualitatively indicates cohesion among the particles Compressibility less than approximately 18% should indicate good free flowing solids (Carr, 1965).
Angle of Spatula (AoS)
Angle of spatula gives an indication of the internal angle of internal friction for granular solids. It is measured by inserting a flat blade into a pile of powder and then lifting it up. The new angle of repose which the material forms relative to the horizontal plane of the blade gives the measure of the angle of spatula. This simulates movement of supporting surface structures during material handling and shipping. Angles of spatula less than 40° in powders generally indicate less flow problems (Carr, 1965).
Uniformity
Uniformity is the ratio obtained between the width of sieve opening that will pass 60% of the sample to the width of sieve opening that will pass only 10% of the sample. Uniformity thus gives a relative measure of the homogeneity of the size and shape of the material, and has a direct affect on the material’s ability to flow (Carr, 1965). The smaller the uniformity value, the more homogenous the particle shapes are, and typically less the flow problem.
5
After the evaluation of the above properties (i.e., angle of repose through uniformity) (excluding Hausner Ratio), their values are combined to provide an overall flowability index value for the powders or bulk solid under investigation (Carr, 1965).
Angle of Fall (AoF)
The angle of fall is the new angle of repose that is formed after impaction has been applied to the material. Materials, when piled up, give an angle of repose, but particles may dislodge or get disturbed due to vibrations and environmental effects (Carr, 1965).
Angle of Difference (AoD) The angle of difference is calculated by subtracting the angle of fall from the angle of repose. The larger the angle of difference, generally the more flowable the material is (Carr, 1965).
Dispersibility Dispersibility is related to the ability of the material to flood or to disperse. The higher the dispersibility of the material, the more floodable the material is; in other words, it tends to flush easily. This means that the powder or the granular solid material will flow abruptly and sporadically, which is not desirable.
The above properties (angle of fall, angle of difference, and dispersibility, in addition to flowability index) accounts for the total floodability index of the bulk solid, and is computed by summing the individual indices. This leads to the total floodability index (Carr, 1965).
Jenike Shear Testing Properties
Yield Locus (YL) and Effective Yield Locus (EYL) Yield locus (YL) is a plot of failure shear stress versus normal stress for a given consolidating stress, for any kind of general cohesive solid (Fitzpatrick et al., 2004a). For free flowing materials, like sand and gravel, the Mohr stress circle shows a straight envelope which passes through the origin. This envelope is called effective yield locus (EYL) (Jenike, 1964).
Angle of Internal Friction (Φ) The angle of internal friction (in degrees) is the inter-particle friction as the bulk solid tends to slide on itself at the onset of flow (Jenike, 1964). Pressure arises in the solid due to superimposed mass when the solids are placed in channels. At higher pressures, the particles are brought closer and molecular forces develop, causing the solids to consolidate and gain strength. In order to shear such solid systems, the angle of internal friction must be exceeded (Jenike, 1964).
Effective Angle of Internal Friction (δ) During flow, granular solids are constantly exposed to pressures. The major pressure acting on a particle element is denoted by σ1 while the minor pressure is termed σ2. The relationship between these two pressures varies very little with changes in either temperature or pressure for most bulk solids (Jenike, 1964). Their relationship can be expressed as:
σ1 = 1+sin δ (2) σ2 1-sin δ
This equation is called the effective yield function, and the angle is called the effective angle of internal friction. It is the measure of inter-particle kinematic particle friction which exists during steady flow. Generally, this value lies between 30° to 70°. For noncohesive solids, such as sand, which practically have no flowability problems, the angle of internal friction and effective

6
angle of internal friction are the same (i.e., Φ=δ) (Jenike, 1964). Usually it is found that the value of angle of internal friction is less than the effective angle of internal friction for solids which exhibit cohesiveness.
Unconfined Yield Strength (σc) This is a measure of the compressive strength (kPa) of a granular solid (Schulze, 2006). For an exposed particle, the overall forces acting on that particle are zero, but the major pressure acting on the solid particle can be tangential to the particle. If this pressure causes yield, it is termed an unconfined yield pressure (Jenike, 1964). A free flowing noncohesive solid shows an unconfined yield strength value of zero.
Major Consolidation Stress (σ1) A circle which passes through the steady state point (V, S) where V is the normal load and S is the shear force applied in each consolidation during shear test, and is tangent to YL, is called a Mohr circle (Jenike,1964). The point of intersection between the Mohr circle and the stress axis gives the value of major consolidation stress.
Flow Function The ratio of the major consolidation stress (σ1) to unconfined yield strength (σc) is called the flow function of a bulk solid. This is represented in equation 3.
F= σ1 /σc (3)
The flow function is a dimensionless quantity. Jenike (1964) classified flow functions as elucidated in table 2.
Jenike Compressibility Testing (β) Compressibility is measured using material bulk density for various predetermined normal loads, as described by Jenike (1964). The relationship between bulk density (γ, kg/m3), net weight of the material (M, g) and height measured (H, mm) by the compressibility indicator is given as:
γ = (0.3157 M) / H (4)
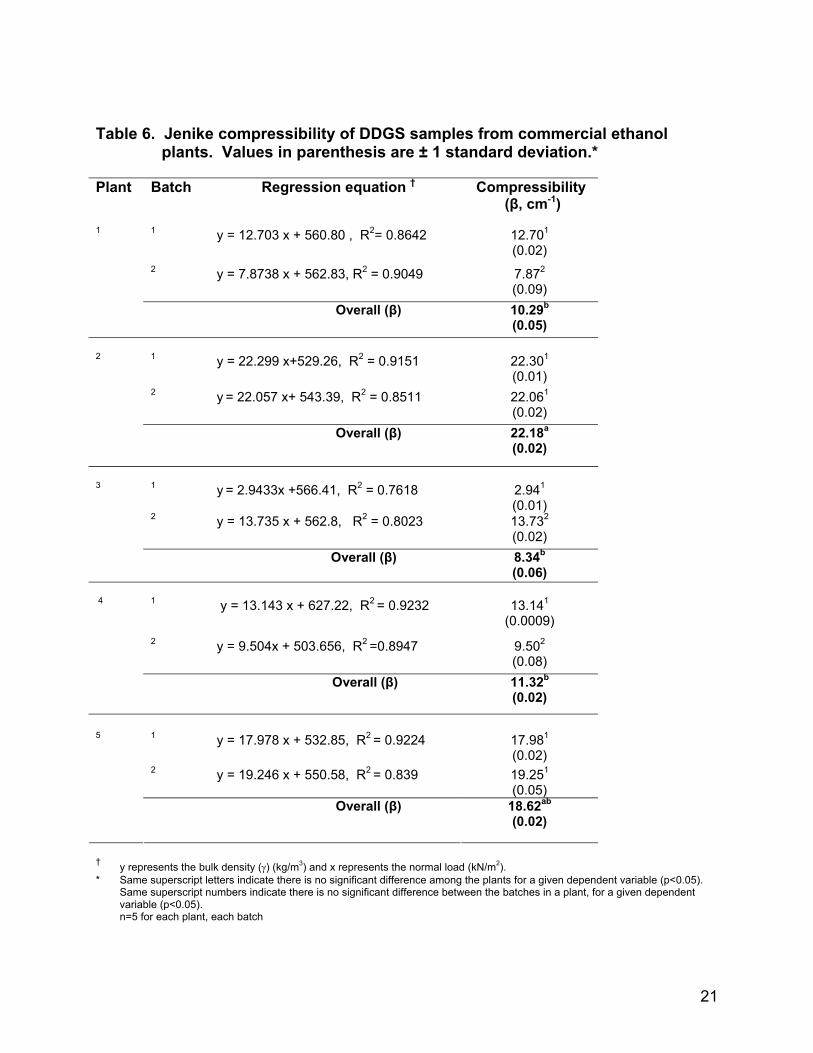
The compressibility of the material is calculated graphically from a linear plot of normal load (kN/m2) versus bulk density (γ, kg/m3). The slope of the line of this plot directly gives the compressibility of the material. Jenike (1964) compressibility and compressibility obtained from Carr (1965) flow properties (Cc) are not the same parameters. Their values will also differ.
Even though some work has been conducted to examine the physical properties of DDGS (Bhadra et al., 2007; Rosentrater, 2006), little work has examined the flow properties of DDGS. Thus, the objective of this present study was to evaluate physical and flow properties, following Carr (1965) and Jenike (1964) methodologies, for DDGS samples collected from several commercial fuel ethanol plants, in order to quantify their behavior.
Materials and Methods
Sample Collection Samples of DDGS were obtained from five commercial ethanol plants across the state of South Dakota, via two separate collection periods. The samples were stored in sealed plastic bags under ambient room conditions (24 ±1°C). Unless noted otherwise, for each of the properties studied, five replications were performed.

7
Physical Properties The soluble content of the DDGS samples were determined using the technique developed by Ganesan et al. (2006a). The moisture content of each sample was determined using AACC standard method 44-19 (1995), by the use of a forced convection laboratory oven (Thelco Precision, Jovan Inc. Wincester, Va.). The geometric mean diameter and geometric standard deviation of DDGS particles were determined using ASAE/ANSI standard S319.3 (2003) using a of Rotap sieve analyzer (model RX-29, Tyler Manufacturing Inc., Mentor, OH).
Carr Index Testing Carr index tests were used to measure the flow properties of the DDGS samples. A powder characteristics tester (Model PTR, Hosokawa Micron Powder systems, Summit, NJ) was used to measure the Carr flow properties (Carr, 1965), following the procedure described by ASTM D6393 (1999). The Carr flow properties included angle of repose, aerated bulk density, packed bulk density, compressibility, uniformity, angle of fall, angle of spatula, angle of fall, angle of difference, and dispersibility. These parameters were then used to determine both the flowability index (which includes angle of repose, compressibility, angle of spatula and uniformity) and floodability index (which is the sum of flowability index, angle of difference, dispersibility and angle of fall).
Jenike Shear Testing Jenike shear testing was performed to obtain the instantaneous shear behavior for each DDGS sample. Five commercial ethanol plants, and two corresponding batches from each, resulted in 10 total samples. Three levels of consolidation were performed for each sample, which resulted in 30 experimental combinations (10 X 3). Each sample was replicated three times, thus giving 90 experimental runs in total for the Jenike analyses.
The Jenike shear cell unit (Model ST-5, Jenike and Johanson Co., Westford, MA) consisted of a base, ring, mold, twisting top, and cover. The ring was made either of stainless steel or aluminum. For level 3 consolidation, the aluminum ring was used; for level 1 and level 2 consolidation, the stainless steel rings were used. The base, ring and mold were placed one over another thus forming the shear cell. All other components were made of stainless steel. DDGS was placed in the shear cell and spread our uniformly, while scrapping off excess material from the cell. The testing procedure consisted of three steps. First was the preconditioning step, where the DDGS sample was preconsolidated by applying between 30 to 60 twists; the number of twists were determined by trial and error, as described by Jenike (1964). The direction of twists were both clockwise and anticlockwise directions. The second steps was called the consolidation step, where the twisting top and mold were removed and then a consolidation weight (W) was being applied to the arrangement. The horizontal shear force was applied on this arrangement, at the rate of 2.7 mm/min. This shear force stopped once steady state had been achieved. This second step helps in reproducing flow with the given stress at the steady state conditions (Ganesan et al., 2005b). A strip chart recorder was attached to this shear cell unit, and was used to record the steady state force. The third step consisted of applying individual shear weights (W i) to the DDGS sample inside the cell. This provided a new set of steady state force ( S i) which were then recorded on the same chart recorder. This step was used to determine the shear stress at failure for the samples. Mohr circles were then plotted for each failure using AutoCAD v.2005 (Autodesk, INC., San Rafael, CA).
Compressibility was determined following ASTM D6683 (2001), using a stainless steel base with 64 mm inside diameter and depth of 19.05 mm. The base was uniformly filled with DDGS sample, and then covered with the stainless steel cover. On top of the cover a weight hanger and indicator holder were placed. The indicator holder was a 25 mm travel dial indicator
8
mounted on a stainless steel holder, which had a counter-bored bottom. For each of the weights placed on the hanger there was change in the indicator reading, which indicated changes in the compressibility of the samples due to weight increase. The relationship between height (H, mm) and bulk density (γ, kg/m3) of the material, which in turn gives the compressibility, was given in equation 4. According to compressibility procedure (Jenike, 1964) this information was plotted, and the resulting slope of the line gives the compressibility.
Statistical Analysis For each property, formal statistical data analyses were completed using Microsoft Excel
v.2003 (Microsoft Corp., Redmond, WA) and SAS software v.8 (SAS Institute, Cary, NC). Analyses included summary statistics, and Least Significant Difference testing (LSD) at 95% confidence level (i.e., α=0.05) was performed to determine differences between the plants, and also between the batches for each particular plant. Correlation analysis among all properties studied was performed to examine relationships between the properties at the 95% significance (i.e., α=0.05) level.
Results and Discussion Physical Properties
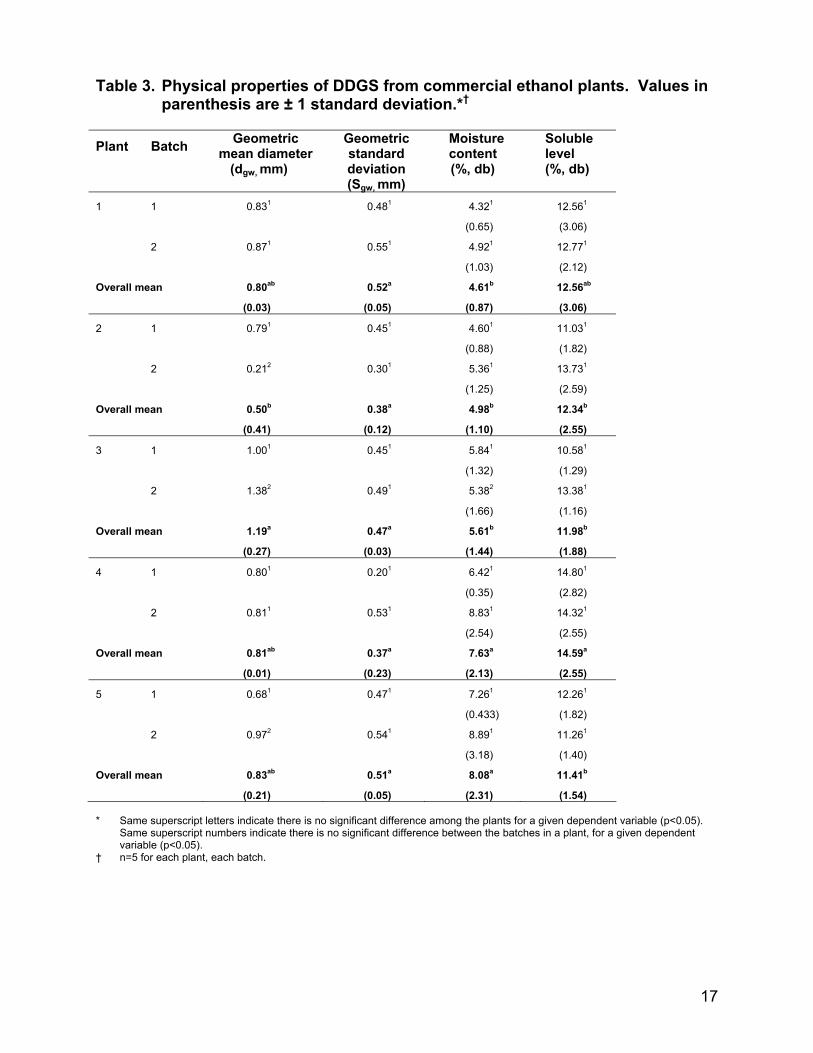
From the physical properties as given in table 3, we can clearly see a classification of DDGS based on particle size. Overall, the largest particles were obtained from plant 3, with an average geometric mean diameter (GMD) of 1.19 mm; while the lowest particle size was obtained from plant 2; which had an average GMD of 0.5 mm. Particle size distribution may exhibit a “shifting” in the bulk mass during transport or discharge. It is a phenomenon where the smaller particles may be discharged earlier from the hopper than the larger particles. It has been found that size segregation may occur in DDGS, which may lead to both uneven physical properties as well as nutrient distribution, and may facilitate “bridging” between the particles due to these localized regions (Ileleji et al., 2007).
Moisture content of the samples was in range of approximately 4% to 9% (db). This range of moisture content appeared to be half compared to the ranges found by Rosentrater (2006a). Our results showed the plant which had the highest moisture content (plant 5) had a low flowability index (table 4), while the plant which had the least moisture levels (plant 1) had a relatively high flowability index (table 4). These results indicate that moisture, as expected a priori, did play an important role in flowability behavior.
Soluble levels were found to range from approximately 10.5 to 14.8% (db). As shown in table 3, plant 3 (batch 2), which had the highest GMD, showed a lower soluble content than plant 4 (batch 1), which was found to have highest soluble level, 14.80% (db). These soluble levels were slightly higher than the values reported by Tjardes and Wright (2002). Solubles, also known as “syrup” in the industry, are relatively high in fat (Buchheit, 2002; Cruz et al., 2005). A higher soluble level in the DDGS, which is thus higher in fat levels, would impact the surface coating on DDGS particles, and may subsequently give rise to larger agglomerated particle sizes, as indicated by our results. The surface nature of the DDGS (onto which the soluble layers are added during drying) may impact how the fat molecules adhere to the surfaces. Fat molecules are relatively smaller in molecular weight than protein (Das, 1992), which facilitates faster penetration within the particles during drying.
There were significant statistical differences observed in the moisture content among the plants, and also between the batches for a given plant. For soluble levels, however, there were no significant difference obtained between the batches for a particular plant, but there were difference among the plants. This was probably due to processing differences, and because the soluble addition process may differ plant-wise, but not so much between batches at a single plant. The moisture content, on the other hand, was found to be different among the plants, and

9
also between the batches for a particular plant. Moisture content is a much more difficult parameter to control due to environmental factors, such as ambient temperature and relative humidity. The noted differences indicate inconsistent processing techniques, not only among the plants, but also in the batches for each plant.
Carr Index Properties Angle of repose was found to range from approximately 35.94° to 41.60°. This is higher than that found in previous work with DDGS (Rosentrater, 2006a), and is greater than the general range of free flowing solids (Rosentrater, 2006b). This range of angle of repose was slightly lower than that found by Ganesan et al. (2006b). Thus, there may be some flow problems associated with the DDGS samples under investigation. Further, it has been reported that there was a trend of increasing angle of repose with increases in moisture and soluble levels (Ganesan et al., 2006b). This indicates that with higher moisture and soluble levels, there may be possible flow problems in the DDGS. However, in our study, as shown in table 4, we observed highest angle of repose in plant 3 (40.12°) which actually had lower moisture and soluble contents compared to plant 4 and plant 5 (table 3). Angle of repose not only depends upon the moisture and soluble content, it is also greatly influenced by particle shape and size. One reason that plant 3 had a higher angle of repose was the greater particle diameter (table 3). According to Carr’s classification (1965), bulk solids with an angle of repose greater than 45° should not flow, and between 40° and 45° may have some flow problems (as elucidated in table 1). There were statistically significant differences observed among the plants. Except for plant 4, there were significant differences observed between the corresponding batches for the other plants.
There were significant differences seen for both types of bulk densities among the ethanol plants and also in their batches. Only for plant 1, however, there were no significant differences for aerated bulk density (table 3). From table 4 we observe the highest packed bulk densities were obtained from plant 4, with an average of 0.61 g/cm3, while the lowest packed bulk densities were obtained from plant 5, with an average of 0.48 g/cm3.These results are very close to the results of aerated and packed bulk densities obtained by Ganesan et al. (2006b) for DDGS with 10% moisture and 10% soluble levels. It was found that plant 4, which had soluble levels of 14.59% (db), also had the highest packed bulk density, which was 0.61 g/cm3. This result was very similar, as predicted by Ganesan et al. (2006b), for 15% (db) soluble levels.
We obtained compressibility values between 2.88% and 7.86 %. The highest compressibility was observed in plant 1, with an overall average value from both batches of 7.56%. The higher the compressibility, greater is the tendency of that material to have flow problems. It has been found that materials with compressibility values greater than 25% were less flowable (Carr, 1965). These compressibility values were somewhat higher than the values obtained by Ganesan et al. (2006b), for all the types of moisture and solubles conditions used in that particular study. From table 4, we also notice that there were significant differences among the plants. There were differences only between the batches of plant 4, but not between the batches of other plants. One of the reasons of this result could be that compressibility is primarily dependent upon particles sizes. Particle sizes were found to vary less between the batches for a particular plant, and more among the plants, as it depends on the milling specifications and processing parameters of each plant.
Angle of spatula (average) was found to range from 51.72° to 66.73° (table 4), . These results were slightly higher than those values found by Ganesan et al. (2006b), for all soluble and moisture levels. Materials with angle of spatula of less than 61° are generally considered to be passable or borderline materials (Carr, 1965) in terms of flowability; whereas less than 60°should have no flow problems. For our samples, plant 2 had higher angle of spatula values compared to the other plants. There were significant differences observed among the plants, and as well between the batches, for all values of angle of spatula.
10
The highest uniformity was found in plant 2, with a value of 2.80 (-). According to Carr (1965) classification, uniformity values less than 6 (-) are generally considered to have excellent flowability.
The total flowability index obtained was in the range of 79.30 to 82.40. The higher the flowability index, the better the material is in terms of flowability. This range of flowability index was slightly higher than the values found by Ganesan et al (2006b). This range of flowability indices for our samples mostly shows good flowability in DDGS, but sometimes a vibrator or bin agitator may be required to increase the flowability. There were significant differences among the plants and as well the batches, indicating inconsistent DDGS product, in terms of flowability.
The angle of fall for the samples in this study was found to be less than 37° (approximately). This lies in a range of values is categorized as “floodable” materials (Carr, 1965). “Floodable” means they will flow sporadically and abruptly. This nature in powders or granular solids is not considered good for flowability. This range of values was slightly less than the values obtained by Ganesan et al., (2006b) for all combinations of solubles and moisture levels. This was quite logical, as our solubles and moisture levels were less than those levels used by Ganesan et al., (2006b). Solubles and moisture levels do effect floodability; higher soluble and moisture may, in fact, act to lubricate the DDGS and thus have a higher “floodable” character in DDGS.
Table 4 shows that we found a wide of dispersibility values .The lowest dispersibility was obtained for plant 2 (7.22%), while the highest value was found in plant 3 (51.4%). For plant 2 and plant 5, the samples fell under the category of fairly floodable. For plant 3, on the other hand, DDGS was found to be very floodable. Typically, the higher the value of dispersibility, the greater is the tendency of that material to flush.
The sum of flow index, angle of fall, angle of difference, and dispersibility gives the floodability index, which characterizes the nature of the material in terms of its ability to “flush”. A floodability index value higher than 60 (-) would require rotary seals or some other type of preventive measures to stop flushing of DDGS (Carr, 1965). Plant 3 showed the highest floodability index (65.27), while plant 2 (55.35) showed the lowest floodability index. This range of floodability index was slightly higher than found by Ganesan et al. (2006) for all combinations of soluble and moisture contents, which indicate that our samples had a higher flushing nature, which may, in fact, affect flow and handling properties.
Jenike Shear Properties
As shown in table 5, we observed a clear trend in the effective angle of friction (δ, °) with an increase in the pressure from level 3 consolidation to level 1 consolidation (which had the highest pressure). For level 1 consolidation, the effective angle of friction (δ) was in the range of 43.00° (plant 5) to 57.00° (plant 2). Level 2 consolidation had a range of 50.67° (plant 4) to 59.33° (plant 2). Level 3 consolidation had a range of values from 48.33° (plant 4) to 61.00° (plant 5). These ranges of values were somewhat higher than those of Ganesan et al. (2007). Typically, the higher the values of effective angle of friction, the greater the chances of having flow problems (Jenike, 1964). Additionally, there were significant differences obtained in the Jenike shear parameters among the plants, and as well as between the batches of particular plants. Increased variability further indicated an increased chance of finding DDGS samples with higher flow problems.
From table 5, we note that angle of internal friction (Φ) was found to range from 32.33°(plant 4) to 47.00° (plant 3) for level 1 consolidation; from 32.67° (plant 1) to 45.00° (plant 5) for level 2 consolidation; and from 25.00° (plant 3) to 54.33° (plant 5) for level 3 consolidation. These ranges of angle of internal friction for each level of consolidation were quite similar to those found Ganesan et al. (2007). For this study, the highest values were found in Plant 5 (8.08%, (db) moisture content and 11.41%, (db) soluble levels) for level 3 consolidation. This

11
was higher than the highest angle of internal friction found by Ganesan et al. (2007) (which occurred at 15% soluble and 10% moisture content), however.
For major consolidating stress (σ1), the highest value was found for plant 4 (28.48 kPa), while the lowest value was obtained for plant 1 (17.75 kPa), as shown in table 5. The highest mean value of major consolidation stress was found to be less than that found by Ganesan et al., (2007), however. To break an arch, the maximum stress must be higher than the yield strength in the granular solid (i.e., σ1 >σc) (Jenike, 1964). A similar kind of relationship was observed in our DDGS samples, which indicates that there may not be any flow problems with our samples.
From table 5, we also observe that, for level one consolidation, the lowest mean unconfined yield strength (σc) was found in plant 3 (4.78 kPa), while the highest mean value was found in plant 2 (18.00 kPa). This indicates that our DDGS samples may have some flow difficulties, as only purely non-cohesive solids (like sand) will have yield strength values of zero (Jenike, 1954). The highest mean value obtained in our results was very similar to that obtained by Ganesan et al. (2007) for 25 % (db) soluble and 10% (db) moisture levels.
The compressibility for each sample was calculated from the plot of bulk density and the applied pressure (figure 1). A summary of compressibility (β, cm-1) values for our DDGS samples, and the resulting linear regression equations between bulk density (γ, kg/m3) and normal load (kN/m2), are provided in table 6. The highest compressibility was found in plant 2 (22.30 cm-1). Often, the more the compressible the material, the more difficult it will flow.
Flow functions for each DDGS sample were then calculated from Jenike shear test results (following Jenike, 1954), the results of which are shown in table 7. As shown, there was not a single DDGS sample that showed a flow function less than 1.0 (which would mean no flow). At level one consolidation, flow function values for plant 2, plant 5, and plant 4 indicated that the DDGS was cohesive or highly cohesive, while plant 1, batch 2 had almost free flow (Jenike, 1964). It should be noted that plant 5 showed the lowest flowability index from the Carr test procedure; which means it may indeed have potential flow problems compared to all other samples. It should also be noted that trends in the flow function values across all consolidation levels varied among plants, and batches within a given plant, which reinforces the point that variability in DDGS may have a strong role in flowability problems.
Property Relationships Pearson product moment correlation analysis (Speigel, 1994) was performed for all the properties in the study (3, 4, 5, and 6). The correlation coefficient for a particular significant level determines how closely the two properties are related to each other in a linear fashion. Out of 1089 possible combinations, only 48 combinations had p values less than α =0.05 (i.e., were significant correlations) and had correlation coefficient (r) values greater than 0.5. Out of these 48 significant combinations, 17 variable combinations had an r value from |0.5| to |0.6|, 21 variable combinations had correlation coefficients from |0.6| to |0.7|, seven combinations had r values from |0.7| to |0.8|, and only three had r values from |0.8| to |1.0|. The ten combinations with r values from |0.7| to |1.0| are given in table 8, and an examination of them provides several insights. Hausner Ratio had a high correlation with Carr compressibility (Cc), which was anticipated because Hausner Ratio consists of tapped density and aerated density, which are measurements that are also used to calculate Cc. The higher the tapped density value compared to aerated bulk density indicates a higher propensity for the particles to compact, which in turn is a function of the DDGS particle shapes and sizes. Floodability Index was very highly correlated to the dispersibility. This is also very reasonable, because dispersibility was part of calculation that determined floodability index (Carr, 1965). However, the results of having a higher correlation of dispersibility with total floodability index may predict that dispersibility is the key property to consider when examining the overall DDGS flowability.
12
In some cases there were significant correlations between Carr and Jenike shear test properties. At level three consolidation, angle of friction and effective angle of friction did show a negative correlation with aerated and packed bulk densities. This result is quite logical, as higher densities indicate higher compactness of the particles, and hence a lower angle of friction between the particles. Unconfined yield stress did show significant correlations between total floodability and dispersibility. Major consolidation stress between various consolidation levels did have some correlation as well. This was quite reasonable, as one level of consolidation differs from other levels only in terms of load addition, but the testing procedures are the same. Geometric standard deviation and GSD also had good correlation with compressibility (Jenike) and Hausner Ratio. These indicate that particle shapes and sizes do play an important role in determining flowability parameters. Overall, correlation results indicate that there were not very strong correlations among many of the properties, and thus one set of experiments (Jenike versus Carr testing) cannot really take the place of the other set when examining flowability behavior. In terms of labor input, skills required, time, and repeatability of the experimental procedure, Jenike shear testing is more complicated than the Carr testing procedure to execute. A strong correlation among the two procedures would have helped to indentify the best possible experimental procedure to assess DDGS flowability.
Flowability Assessment Ganesan et al. (2007a) developed a predictive model for DDGS flowability based on both Jenike and Carr test data simultaneously, and termed it a flowability indicator. The relationship that best described the data can be functionally described as:
(Cc/Dispersibility)(δ/Φ) = f (PBD/ABD) (5)
where Cc represents Carr compressibility, δ represents effective angle of friction, and Φ represents angle of internal friction. It was found that lower values of PBD/ABD typically indicate good flow in DDGS (Ganesan et al., 2007a). Data obtained for our commercial samples were then fitted using this relationship, which yielded a R2 value of 0.8368 for a curvilinear plot. However, for all DDGS sample we found a higher R2 (0.8823) using a linear relationship. Even though the location of data for plant 2, plant 3, and plant 4 falls in the better flow region in the model plot, the range of PBD/ABD was higher in our data compared to Ganesan et al.( 2007a), and actually falls in a bad or potentially problematic flow region. Thus, overall flowability assessment indicates that our DDGS samples had the potential for flow problems. Such results indicate that more studies with large sample sizes are required in this area, to improve the flowability model, and to provide a better understanding of the origin of flowability problems in DDGS.
Conclusions Samples of DDGS from commercial fuel ethanol plants were analyzed for physical and flowability properties. None of the samples studied exhibited completely poor flow behavior, although many did show a propensity for potential problems. Flowability of DDGS was judged based on both Carr and Jenike analyses. Both approaches are useful in determining flow problems in granular solids but it is paradoxical in terms of deciding which set of experimental procedures is optimal for flowability assessment. One can predict lower flowability, while the other may suggest higher flow tendencies for the same samples. Moreover, low correlation coefficients among the Carr and Jenike parameters suggests that one set of experiments can not be totally replaced by the other. Operator choice, experimental design, and sample to be tested are needed for deciding which set of parameters one should measure to quantify flowability. The Jenike shear test procedure depicts real industrial storage and handling situations, but on the other hand, Carr properties are used widely for pharmaceutical powders and are much less time consuming to measure. Added to this, inconsistencies in DDGS

13
between samples and among plants may hinder the possibility of finding adequate correlations between two experimental procedures. In short, flowability is a multivariate field where more research is necessary to totally understand the mechanisms at play in DDGS.
Acknowledgements The authors would like to extend their gratitude to South Dakota State University and USDA-ARS for financial support for this project. The authors would also like to extend their appreciation to the South Dakota Corn Utilization Council (SDCUC) and Agricultural Experimental Station (AES).
References AACC 44-19. 1995. Moisture-air oven method, drying at 135 C. AACC approved methods (9th
ed.). St Paul, MN. ASAE S19.3. 2003. Method of determining and expressing fineness of feed materials by
sieving. ASAE Standards. St Joseph, MI: ASABE. ASTM D6393. 1999. Standard test method for bulk solids characterization by Carr indices.
ASTM Standards, W. Conshohocken. PA. ASTM D6683. 2001. Standard test method for measuring bulk density values of powders and
other bulk solids. ASTM Standards, W. Conshohocken. PA. Bhadra, R., K. Muthukumarappan, and K. A. Rosentrater. 2007. Characterization of chemical
and physical properties of DDGS for value added uses. ASABE Annual Conference. St. Joseph, MI. ASABE paper no: 077009.
Buchheit, J. K. 2002. Distillers dried grains with solubles. Rural Enterprise and Alternative Agricultural Development Initiative Report. Report No:11 I FARRM. Carbondale. IL: Southern Illinois University.
Carr, R. L. Jr. 1965. Evaluating flow properties of solids. Chemical Engineering 72(3): 163-168. Craig, D. J. and B. F. Miller. 1958. The flow properties of powders under humid conditions.
Journal of Pharmacy and Pharmacology 10:136-144. Cruz, C. R., M. J. Brouk, and D. J. Schingoethe. 2005. Lactational response of cows feed
condensed corn distillers solubles. Journal of Dairy Science 88(11): 4000-4006. Das, D. 1992. Biochemistry. 7th edition. Academic Publishers. Calcutta, India. Farely, R., and F. H. H. Valentin. 1968. Effect of particle size upon strength of powders. Powder
Technology 1(6): 344-354. Fitzpatrick, J.J., S. A. Barringer, and T. Iqbal. 2004a. Flow property measurement of food
powders and sensitivity of Jenike’s hopper design methodology to the measured values. Journal of Food Engineering 61(3):399-405.
Fitzpatrick, J. J., T. Iqbal, C, Delaney, T. Twomey, and M. K. Keogh. 2004b. Effect of powder properties and storage conditions on the flowability of milk powders with fat contents. Journal of food Engineering 61(4) 435-444.
Ganesan ,V., K. A. Rosentrater, and K. Muthukumarappan. 2005. Effect of moisture content and soluble levels on the physical and chemical properties of DDGS. ASABE paper no: 056110. St. Joseph MI: ASABE.
Ganesan V., K. A. Rosentrater, K. Muthukumarappan. 2006a. Methodology to determine soluble content in dry grind ethanol coproduct streams. Applied Engineering in Agriculture 22 (6): 899-903.

14
Ganesan V., K. Muthukumarappan, and K. A. Rosentrater. 2007. Flow properties of DDGS with varying soluble and moisture contents using Jenike shear testing. ASABE annual conference ASABE paper no:076063. St. Joseph MI: ASABE.
Ganesan V, K. A. Rosentrater, and K. Muthukumarappan. 2007a. Modeling the flow properties of distillers dried grains with solubles. ASABE paper no:076052. St Joseph, MI: ASABE.
Ganesan, V., K. Muthukumarappan, and K. A. Rosentrater. 2006b. Effect of flow agent addition on physical properties of DDG with varying moisture content and soluble percentages. ASABE paper no: 066076. St. Joseph, MI:ASABE.
Hollenbach, A. M., M Peleg, R. Rufner. 1983. Interparticle surface affinity and bulk properties of conditioned powders. Powder Technology 35: 51-62.
Ileleji, K. E., R. L. Stroshine, and K. S. Prakash. 2005 Segregation during gravity driven discharge of distiller’s grain with solubles. ASASE paper no: 066115 St. Joseph MI: ASABE.
Irani, R. R., C. F. Callis, and T. Lui. 1959. Flow conditioning and anticaking agents. Industrial and Engineering Chemistry 51(10): 1285-1288.
Jaques, K. A., T. P. Lyons, and D. R. Kelsall. 2003. The Alcohol Textbook. Nottingham University Press: Nottingham. UK.
Jenike, A. W. 1964. Storage and flow of solids. Bulletin No. 123. Utah Engineering station. Bulletin of University of Utah.
Johanson, J. R. 1978. “Know your material-how to predict and use the properties of bulk solids”. Chemical Engineering/Date book issue, October 30. pp: 9-17.
Kamath, S., V. M. Puri, and H. B. Manbeck. 1994. Letter: Flow property measurement using Jenike shear cell for wheat flour at various moisture contents and consolidations times. Powder technology 81(3): 293-297.
Marinelli, J. and J. W. Carson. 1992. Solve solids flow problems in bins, hoppers, and feeders. Chemical Engineering Progress 22-28.
Michael, A. E. 2001. Pharmaceutics: The science of dosage form design. 2nd edition. Churchill Livingstone. UK.
Microsoft Excel. 2003. Microsoft. Inc. Moreyra, R., and M. Peleg. 1981. Effect of equilibrium water activity on the bulk properties of
selected food powders. Journal of Food Science 46:1918-1922. Myers, H. R. 1986. Classical and modern regression applications. 2nd edition. Duxbury
publications, CA. USA. Peleg, M. 1977. Flowability of food powders and methods for its evaluation-A review. Journal of
Food Process Engineering 1: 303-328. Perez, M. F. and R. A. Flores. 1997. Particle size of spray dried soymilk. Applied engineering in
Agriculture 13(5): 647-652. Prescott, J. K. and R. A. Barnum. 2000. On powder flowability. Pharmaceutical Technology 60-
84. Rock, M and J. Schwedes. 2005. Investigations on the caking behaviour of bulk solids-
macroscale experiments. Powder Technology 157 (1-3): 121-127. Rosentrater K. A. 2006a. Some Physical properties of Distillers Dried Grain with Solubles.
Applied Engineering in Agriculture 22(4): 589-595. Rosentrater, K. A. 2006b. Understanding distillers dried grain storage, handling, and flowability
challenges. Distillers Grain Quarterly 1(1):18-21. SAS. 1990. SAS User's Guide: Statistics. Ver. 6a. Cary, N.C.: SAS Institute, Inc. Schulze, D. 2006. Storage of powders and bulk solids in silos. Dietmar Schulze.com. Available
online at http://www.dietmer-schulze.de/storagepr.html. Accessed on 9 January, 2008.
15
Spiehs, M. J., M. H. Whitney, and G. C. Shurson. 2002. Nutrient database for distiller’s dried grains with solubles produced from new ethanol plants in Minnesota and South Dakota. Journal of Animal Science 80:2639-2645.
Speigel, M.R. 1994. Statistics. New York: McGraw Hill, Inc. Tjardes, K., and C. Wright. 2002. Feeding corn distiller’s coproduct to beef cattle. Extension
Extra – SDSU Extension Cooperative Service. Available online at: http://agbiopubs.sdstate.edu/articles/ExEx2036.pdf. Accessed on 5 January. 2007.
Yan, H., and G. V. Barbosa-Canovas. 1997. Compression characteristics of agglomerated food powders. Effect of agglomerate size and water activity. Food Science and Technology International 3(5): 351-359.
16
Table 1. Flowability classification according to angle of repose (Carr, 1965).
Angle of repose (°) Type of flow
<25 Excellent flowability
26-35 Good flowability
36-40 Fair flowability. Some kind of vibration may be required.
41-45 Passable. They belong to the borderline and sometimes there can be flow problems.
46-55 Poor flowability. Agitation or vibration is required.
56-65 Very poor in flowability. Needs vibration more positively.
66-90 Extremely poor in flowability. Special agitation or hoppers are required.
Table 2. Flow function classification by shear testing (Jenike, 1964).
Flow functions Classification of flow
F<1 No flow
1<F<2 Highly cohesive
2<F<4 Cohesive
4<F<10 Intermittent flow
10<F Free flow
17
Table 3. Physical properties of DDGS from commercial ethanol plants. Values in parenthesis are ± 1 standard deviation.*†
Plant Batch Geometric
mean diameter (dgw, mm)
Geometric standard deviation (Sgw, mm)
Moisture content (%, db)
Soluble level (%, db)
1 0.831 0.481 4.321
(0.65)
12.561
(3.06)
1
2 0.871 0.551 4.921
(1.03)
12.771
(2.12)
Overall mean 0.80ab
(0.03)
0.52a
(0.05)
4.61b
(0.87)
12.56ab
(3.06)
1 0.791 0.451 4.601
(0.88)
11.031
(1.82)
2
2 0.212 0.301 5.361
(1.25)
13.731
(2.59)
Overall mean 0.50b
(0.41)
0.38a
(0.12)
4.98b
(1.10)
12.34b
(2.55)
1 1.001 0.451 5.841
(1.32)
10.581
(1.29)
3
2 1.382 0.491 5.382
(1.66)
13.381
(1.16)
Overall mean 1.19a
(0.27)
0.47a
(0.03)
5.61b
(1.44)
11.98b
(1.88)
1 0.801 0.201 6.421
(0.35)
14.801
(2.82)
4
2 0.811 0.531 8.831
(2.54)
14.321
(2.55)
Overall mean 0.81ab
(0.01)
0.37a
(0.23)
7.63a
(2.13)
14.59a
(2.55)
1 0.681 0.471 7.261
(0.433)
12.261
(1.82)
5
2 0.972 0.541 8.891
(3.18)
11.261
(1.40)
Overall mean 0.83ab
(0.21)
0.51a
(0.05)
8.08a
(2.31)
11.41b
(1.54) * Same superscript letters indicate there is no significant difference among the plants for a given dependent variable (p<0.05). Same superscript numbers indicate there is no significant difference between the batches in a plant, for a given dependent
variable (p<0.05). † n=5 for each plant, each batch.

18
Table 4. Carr Index properties of DDGS from commercial ethanol plants. Values in parenthesis are ± 1 standard deviation.*
Processing Plant 1 2 3 4 5 Batch Batch Batch Batch Batch Properties 1 2 Overall
mean 1 2 Overall
mean 1 2 Overall
mean 1 2 Overall
mean 1 2 Overall
mean AOR (°)
35.942
(1.37) 40.621
(0.34) 38.28b
(2.64) 37.762
(0.74) 41.601
(1.41) 39.68a
(2.22) 39.482
(0.64) 40.761
(0.85) 40.12a
(0.98) 37.261
(1.04) 38.981
(1.28) 38.12b
(1.43) 39.821
(1.41) 38.722
(1.04) 39.27ab
(1.31) ABD (g/cm3)
0.491
(0.01) 0.511
(0.01) 0.50c
(0.01) 0.542
(0.02) 0.591
(0.03) 0.57ab
(0.04) 0.551
(0.01) 0.542
(0.00) 0.55b
(0.01) 0.601
(0.01) 0.552
(0.02) 0.58a
(0.03) 0.471
(0.01) 0.442
(0.01) 0.46d
(0.48) PBD (g/cm3)
0.542
(0.01) 0.551
(0.01) 0.54c
(0.01) 0.562
(0.00) 0.611
(0.03) 0.59ab
(0.04) 0.581
(0.01) 0.562
(0.01) 0.57b
(0.01) 0.621
(0.01) 0.592
(0.02) 0.61a
(0.02) 0.501
(0.01) 0.472
(0.00) 0.48d
(0.01) Hausner Ratio (-)
1.091
(0.03) 1.081
(0.00) 1.08b
(0.02) 1.041
(0.04) 1.031
(0.01) 1.04a
(0.02) 1.041
(0.01) 1.041
(0.02) 1.04a
(0.01) 1.031
(0.01) 1.082
(0.01) 1.06a
(0.03) 1.051
(0.01) 1.061
(0.01) 1.05a
(0.01) Cc (%)†
7.861
(2.09) 7.291
(0.01) 7.56a
(1.43) 3.601
(3.16) 3.271
(1.10) 3.44c
(2.24) 3.811
(0.71) 3.911
(1.43) 3.86bc
(1.07) 2.882
(1.31) 7.461
(0.90) 5.17b
(2.64) 4.851
(1.66) 5.531
(1.17) 5.19b
(1.15) AOS (before) (°)
58.022
(1.53) 50.721
(2.90) 54.37a
(4.43) 64.401
(1.35) 60.442
(2.39) 62.42a
(2.78) 60.482
(0.36) 64.541
(3.51) 62.51a
(3.18) 63.401
(2.76) 60.122
(3.79) 61.76a
(3.57) 60.681
(3.37) 60.801
(1.22) 60.74a
(2.39) AOS (after) (°)
55.022
(1.54) 58.721
(2.72) 56.87a
(2.85) 59.741
(3.99) 58.801
(0.89) 59.30a
(2.77 64.701
(2.22) 52.122
(1.58) 58.41a
(6.88) 60.741
(3.37) 55.542
(2.71) 58.14a
(3.98) 56.581
(4.54) 57.581
(2.50) 57.08a
(3.50) AOS (average) (°)
56.721
(0.35) 51.722
(1.43) 54.22c
(2.81) 66.731
(3.04) 59.672
(1.47) 63.20a
(4.35) 62.891
(0.85) 58.302
(2.04) 60.60b
(2.38) 62.011
(3.10) 57.812
(1.49) 59.91b
(3.18) 58.771
(1.83) 59.221
(1.66) 59.00b
(1.66) Uniformity (-)
2.001
(0.00) 2.801
(0.00) 2.40b
(0.42) 2.801
(0.00) 2.801
(0.00) 2.80a
(0.00) 2.301
(0.00) 1.202
(0.00) 1.75c
(0.58) 2.801
(0.00) 2.801
(0.00) 2.80a
(0.00) 2.002
(0.00) 2.401
(0.00) 2.20b
(0.21) Total Flowability Index(-)
81.401
(0.89) 81.001
(0.00) 81.20a
(0.63) 82.401
(0.96) 80.802
(0.84) 81.60a
(1.20) 80.802
(0.84) 82.101
(1.14) 81.45a
(1.17) 82.001
(0.71) 79.402
(1.29) 80.70ab
(1.69) 79.801
(0.76) 79.301
(0.45) 79.55b
(0.64) Angle of fall (°)
33.362
(0.98) 38.261
(0.88) 35.81a
(2.73) 31.842
(1.00) 35.281
(1.54) 33.56b
(2.19) 32.042
(1.26) 39.981
(1.16) 36.01a
(4.34) 31.402
(1.29) 33.941
(0.79) 32.56b
(1.59) 36.001
(0.43) 34.742
(1.42) 35.37a
(1.19) Angle of difference (°)
2.381
(0.76) 2.561
(0.70) 2.47c
(0.70) 5.921
(0.89) 6.401
(1.88) 6.16a
(1.41) 7.441
(0.97) 0.882
(0.52) 4.16bc
(3.53) 5.861
(0.89) 5.041
(0.67) 5.45ab
(0.86) 4.181
(1.66) 3.981
(1.02) 4.08bc
(1.30) Dispersibility (%)
40.921
(4.58) 37.781
(2.97) 39.35b
(4.00) 45.171
(4.50) 55.532
(2.50) 50.35a
(3.50) 51.401
(2.46) 38.042
(3.11) 44.59a
(7.39) 48.201
(2.80) 36.402
(3.15) 42.30ab
(2.50) 42.802
(2.00) 38.181
(3.89) 40.24b
(15.79) Flowability index (-)
25.001
(0.00) 25.001
(0.00) 25.00a
(0.00) 25.001
(0.00) 25.001
(0.00) 25.00a
(0.00) 25.001
(0.00) 25.001
(0.00) 25.00a
(0.00) 25.001
(0.00) 25.001
(0.00) 25.00a
(0.00) 25.001
(0.00) 25.001
(0.00) 25.00a
(0.00) Total Floodability Index (-)
63.601
(3.78) 63.41
(3.13) 63.50a
(3.27) 53.252
(0.64) 57.451
(1.84) 55.35b
(2.57) 70.201
(0.45) 60.701
(2.41) 65.27a
(5.27) 70.201
(1.15) 62.102 (0.65)
66.15a
(4.36) 48.602
(1.52) 64.601
(1.52) 56.85b
(8.55)
* Same superscript letters indicate there is no significant difference among the plants for a given dependent variable (p<0.05). Same superscript numbers indicate there is no significant difference between the batches in a plant, for a given dependent variable (p<0.05). n=5 for each plant, each batch. † Compressibility by Carr (1965) test procedure.

19
Table 5. Jenike shear testing properties of DDGS from commercial ethanol plants. Values in parenthesis are ± 1 standard deviation.*
Plant Batch Effective angle of
friction (δ, °)
Angle of internal friction (Φ, °)
Unconfined yield strength
(σc, kPa )
Major consolidating stress
(σ1, kPa )
Level I consolidation 1 52.331
(2.52) 39.671
(1.53) 6.861
(1.73) 31.311
(3.62) 1
2 45.002
(2.00) 39.001
(2.00) 3.232
(0.30) 17.752
(1.04) Overall mean 48.67bc
(4.50) 39.33ab
(1.63) 5.05c
(2.28) 24.53a
(7.80) 1 53.001
(1.00) 32.672
(2.08) 18.001
(1.98) 25.772
(0.73) 2
2 57.001
(2.65) 39.001
(1.73) 15.491
(2.10) 27.771
(0.77) Overall mean 55.00a
(2.83) 35.83ab
(3.87) 16.74a
(2.29) 26.77a
(1.28) 1 51.001
(1.00) 47.001
(3.61) 4.781
(1.37) 26.621
(2.90) 3
2 49.331
(2.08) 33.002
(1.73) 4.981
(1.34) 22.651
(2.71) Overall mean 50.17b
(1.72) 40.00a
(8.07) 4.88c
(1.22) 24.64a
(3.32) 1 42.331
(1.15) 35.001
(2.65) 8.211
(1.15) 28.481
(1.09) 4
2 47.331
(2.52) 32.331
(3.06) 8.691
(1.99) 28.381
(3.31) Overall mean 44.83c
(3.25) 33.67b
(2.94) 8.45b
(1.48) 28.43a
(2.21) 1 43.002
(1.73) 32.672
(0.58) 8.691
(0.54) 28.501
(0.70) 5
2 53.001
(1.00) 43.331
(2.89) 8.611
(2.40) 26.421
(2.50) Overall mean 48.00bc
(5.62) 38.00ab
(6.13) 8.65b
(1.56) 27.46a
(2.00) Level 2 consolidation
1 1 57.331
(2.52) 32.672
(4.51) 2.192
(0.54) 4.932
(0.13) 2 49.672
(2.52) 39.001
(3.61) 3.551
(0.30) 8.771
(0.23) Overall mean 53.50bc
(4.76) 35.83b
(5.04) 2.87bc
(0.84) 6.85b
(2.11) 2 1 59.331
(2.08) 46.001
(2.65) 6.541
(0.36) 9.511
(1.07) 2 58.671
(2.52) 38.332
(2.89) 6.561
(0.66) 10.401
(1.19) Overall mean 59a
(2.10) 42.17a
(4.88) 6.55a
(0.47) 9.96a
(1.12) 3 1 55.331
(1.53) 42.671
(0.58) 1.521
(0.78) 8.651
(2.21) 2 49.672
(0.58) 44.001
(1.00) 1.641
(0.36) 7.921
(1.57) Overall mean 52.50c
(3.27) 43.33a
(1.03) 1.58d
(0.55) 8.28b
(1.76) 4 1 50.671
(1.53) 38.001
(3.61) 2.321
(0.71) 5.872
(0.12) 2 53.671
(2.52) 46.001
(1.00) 1.851
(1.36) 8.091
(2.34) Overall mean 52.17c
(2.48) 42.00a
(4.98) 2.08c
(1.01) 6.98b
(1.92)

20
* Same superscript letters indicate there is no significant difference among the plants for a given dependent variable (p<0.05). Same superscript numbers indicate there is no significant difference between the batches in a plant, for a given dependent
variable (p<0.05). n=5 for each plant, each batch.
5 1 57.331
(2.08) 43.671
(2.89) 3.441
(0.72) 7.491
(0.33) 2 55.331
(2.89) 45.001
(2.65) 4.031
(0.52) 7.661
(0.38) Overall mean 56.33b
(2.50) 44.33a
(2.58) 3.74b
(0.64) 7.57b
(0.33)
Level 3 consolidation 1 1 58.331
(1.53) 40.671
(4.73) 0.901
(0.22) 1.481
(0.18) 2 57.671
(2.08) 40.671
(4.04) 1.141
(0.17) 1.571
(0.06) Overall mean 58.0a
(1.67) 40.67b
(3.93) 1.02a
(0.22) 1.53a
(0.13) 2 1 57.331
(1.53) 48.671
(3.21) 0.711
(0.20) 1.741
(0.20) 2 59.001
(3.61) 37.672
(2.52) 1.191
(0.29) 2.241
(0.46) Overall mean 58.17a
(2.64) 43.17b
(6.55) 0.95ab
(0.35) 1.99a
(0.42) 3 1 53.671
(1.53) 37.001
(1.00) 1.241
(0.07) 1.691
(0.11) 2 56.001
(2.65) 25.002
(2.00) 0.971
(0.72) 2.951
(1.25) Overall mean 54.83b
(2.32) 31.00c
(6.72) 1.11ab
(0.48) 2.32a
(1.05) 4 1 48.332
(2.08) 40.001
(2.00) 0.451
(0.03) 1.861
(0.14) 2 54.671
(2.08) 42.331
(0.58) 0.441
(0.12) 1.831
(0.24) Overall mean 51.50c
(3.94) 41.17b
(1.83) 0.45b
(0.08) 1.85a
(0.18) 5 1 59.331
(1.53) 50.001
(3.00) 0.661
(0.23) 1.632
(0.05) 2 61.001
(1.73) 54.331
(3.21) 0.751
(0.11) 1.951
(0.07) Overall mean 60.17a
(1.72) 52.17a
(3.66) 0.71b
0.17 1.79a
(0.18)
21
Table 6. Jenike compressibility of DDGS samples from commercial ethanol plants. Values in parenthesis are ± 1 standard deviation.*
Plant Batch Regression equation † Compressibility
(β, cm-1)
1 y = 12.703 x + 560.80 , R2= 0.8642 12.701
(0.02) 2 y = 7.8738 x + 562.83, R2 = 0.9049 7.872
(0.09)
1
Overall (β) 10.29b
(0.05)
1 y = 22.299 x+529.26, R2 = 0.9151 22.301
(0.01) 2 y = 22.057 x+ 543.39, R2 = 0.8511 22.061
(0.02)
2
Overall (β) 22.18a
(0.02)
1 y = 2.9433x +566.41, R2 = 0.7618 2.941
(0.01) 2 y = 13.735 x + 562.8, R2 = 0.8023 13.732
(0.02)
3
Overall (β) 8.34b
(0.06)
1 y = 13.143 x + 627.22, R2 = 0.9232 13.141
(0.0009) 2 y = 9.504x + 503.656, R2 =0.8947 9.502
(0.08)
4
Overall (β) 11.32b
(0.02)
1 y = 17.978 x + 532.85, R2 = 0.9224 17.981
(0.02) 2 y = 19.246 x + 550.58, R2 = 0.839
19.251
(0.05)
5
Overall (β) 18.62ab
(0.02)
† y represents the bulk density (γ) (kg/m3) and x represents the normal load (kN/m2). * Same superscript letters indicate there is no significant difference among the plants for a given dependent variable (p<0.05).
Same superscript numbers indicate there is no significant difference between the batches in a plant, for a given dependent variable (p<0.05). n=5 for each plant, each batch

22
Table 7. Jenike shear testing flow functions for DDGS samples from commercial ethanol plants. Values in parenthesis are ± 1 standard deviation.*
Plant Batch Level one
consolidation Level two consolidation
Level three consolidation
1 1 4.562 2.252 1.641
2 5.351 2.471 1.382
Overall mean 4.96b
(0.56) 2.36c
(0.16) 1.51d
(0.18) 2 1 1.432 1.451 2.451
2 1.791 1.591 1.882
Overall mean 1.61e
(0.25) 1.52e
(0.10) 2.17c
(0.40) 3 1 5.571 5.691 1.362
2 4.552 4.832 3.041
Overall mean 5.06a
(0.72) 5.26a
(0.61) 2.20c
(1.19) 4 1 3.471 2.532 4.131
2 3.271 4.371 4.161
Overall mean 3.37cd
(0.14) 3.45b
(1.30) 4.15a
(0.02) 5 1 3.281 2.181 2.471
2 3.072 1.902 2.601
Overall mean 3.18d
(0.15) 2.04d
(0.20) 2.54b
(0.09) * Same superscript letters indicate there is no significant difference among the plants for a given dependent variable (p<0.05). Same superscript numbers indicate there is no significant difference between the batches in a plant, for a given dependent
variable (p<0.05). n=5 for each plant, each batch

23
Table 8. Significant Pearson linear correlation coefficients (r) between physical, Carr and Jenike shear test properties (α = 0.05).
Property relationship r value p value Hausner Ratio * Cc -0.9648 <0.0001
β * Geometric mean diameter -0.7631 0.01
Angle of difference * Angle of fall -0.7127 <0.0001
Hausner Ratio * Geometric standard deviation -0.7074 0.0221
Geometric standard deviation * Aerated bulk density -0.7035 0.0232
Geometric standard deviation * Cc 0.7104 0.0213
Angle of spatula (before impact) * Angle of spatula (average) 0.7545 <0.0001
Major consolidation stress (level 1) * Major consolidation stress (level 2)
0.7944 <0.0001
Dispersibility * Total Floodability Index 0.9269 <0.0001
Aerated bulk density * Packed bulk density 0.9698 <0.0001

24
Figure 1. Compressibility of DDGS from commercial ethanol plants (n=5 for each plant, each batch).
Plant 1, Batch 1y = 12.703x + 560.8
R2 = 0.8642
0
100
200
300
400
500
600
700
800
0 2 4 6 8 10 12 14
Normal load (kN/m2)
Bul
k Den
sity
(kg/
m3 )
Plant 1, Batch 2y = 7.8738x + 562.83
R2 = 0.9049
0
100
200
300
400
500
600
700
800
0 2 4 6 8 10 12 14
Normal load (kN/m 2)
Bul
k Den
sity
(kg/
m3 )
Plant 2, Batch 1 y = 22.299x + 529.26R2 = 0.9151
0
100
200
300
400
500
600
700
800
0 2 4 6 8 10 12 14
Normal load (kN/m2)
Bul
k Den
sity
(kg/
m3 )
Plant 2, Batch 2 y = 22.057x + 543.39R2 = 0.8511
0
100
200
300
400
500
600
700
800
0 2 4 6 8 10 12 14
Normal load (kN/m2)
Bul
k Den
sity
(kg/
m3 )
Plant 3, Batch 1
y = 2.9433x + 566.41R2 = 0.7618
0
100
200
300
400
500
600
700
800
0 2 4 6 8 10 12 14
Normal load ( kN/m 2)
Bul
k Den
sity
( kg
/m3 )
Plant 3, Batch 2y = 13.735x + 562.8
R2 = 0.8023
0
100
200
300
400
500
600
700
800
0 2 4 6 8 10 12 14
Normal load (kN/m 2)
Bul
k Den
sity
(Kg/
m3 )
Plant 4, Batch 1y = 13.143x + 627.22
R2 = 0.9232
0
100
200
300
400
500
600
700
800
0 2 4 6 8 10 12 14
Normal load (kN/m2)
Bul
k D
ensi
ty (K
g/m
3 )
Plant 4, Batch 2
y = 9.5044x + 503.56R2 = 0.8947
0
100
200
300
400
500
600
700
800
0 2 4 6 8 10 12 14
Normal load( KN/m2)
Gam
ma
(kg/
m3 )
Plant 5, Batch 1 y = 19.246x + 550.58R2 = 0.839
0
100
200
300
400
500
600
700
800
0 2 4 6 8 10 12 14
Normal load (kN/m2)
Bul
k D
ensi
ty (K
g/m
3 )
Plant 5, Batch 2y = 17.978x + 532.85
R2 = 0.9224
0
100
200
300
400
500
600
700
800
0 2 4 6 8 10 12 14
Normal load (kN/m2)
Bul
k D
ensi
ty (k
g/m
3 )

25
y = 2E-11e21.531x
R2 = 0.8368
y = 3.4629x - 3.4854R2 = 0.8823
0.00
0.05
0.10
0.15
0.20
0.25
0.30
0.35
1.02 1.03 1.04 1.05 1.06 1.07 1.08 1.09 1.10
PBD/ABD (-)
C C/D
ispe
rsib
ility
* δ/φ
(-)
Plant 4 Plant 3
Plant 5
Plant 1
Plant 2
Figure 2. Flowability indicator level, following the relationships developed by Ganesan et al. (2007a).