understand - book flights | find hotels and car rental |
TRANSCRIPT

AT THE EMIRATES GROUP, MUCH OF OUR PROGRESS IS ROOTED IN THE ABILITY OF OUR PEOPLE
TO UNDERSTAND HOW THE WORLD FITS TOGETHER. IT’S NOT JUST ABOUT OUR CUSTOMERS AND
INDUSTRY. IT’S ALSO ABOUT THE OUTSIDE FACTORS THAT INFLUENCE BOTH – THINGS LIKE GLOBAL
ECONOMICS, TRADE AND POLITICS, SHIFTING POPULATIONS, DIVERSITY AND SUSTAINABILITY.
SOME CALL IT UNDERSTANDING THE BIG PICTURE. WE CALL IT UNDERSTANDING OUR FUTURE.
UNDERSTAND

HiS HigHNESS SHEikH MoHAMMED biN RASHiD Al MAkToUM
VICE PRESIDENT AND PRIME MINISTER OF THE UAE AND RULER OF DUBAI
The evolving global marketplace and development of new hubs for
business, finance and culture demand flexibility and innovation.
This dynamic growth calls for enhanced aviation and transport
infrastructure to link communities and businesses, develop
environmental sustainability and expand economic development.
The Emirates Group, in parallel with the UAE and Dubai, is meeting
today’s global challenges by taking an open, transparent approach
to growth based on the UAE’s open skies policy, which promotes
competition and free enterprise.
We are confident that both Emirates and dnata are well positioned
for continued future growth and success.

Emirates is the world’s fastest growing international airline. Its main activity is the provision of commercial air transportation services.
dnata is one of the largest combined air services providers in the world and the largest travel management services company in the UAE. Its main activities are the provision of cargo and ground handling, catering, information
technology and travel services.
Emirates and dnata are independent entities and do not form a group as defined by International Financial Reporting Standards. However, these entities are under common management. Therefore, in the Management Review section of this document, they are together referred to as the Emirates Group.
FINANCIAL HIGHLIGHTS 6
ANNUAL REVIEW BY THE CHAIRMAN 8
AND CHIEF EXECUTIVE
THE LEADERSHIP TEAM 12
UNDERSTANDING A WORLD IN FLUX 14
UNDERSTANDING HOW ECONOMIES WORK 16
UNDERSTANDING MEANINGFUL THINGS 20
UNDERSTANDING RISK AND REWARD 22
UNDERSTANDING THE VALUE OF NEW IDEAS 26
UNDERSTANDING OTHER POINTS OF VIEW 28
UNDERSTANDING OUR RESPONSIBILITIES 32
UNDERSTANDING TOMORROW 34
KEY EVENTS 36
OUR WORLD TODAY 40
THE EMiRATES gRoUp
CONTENTS
FiNANCiAl iNFoRMATioN
EMIRATES FINANCIAL COMMENTARY 44
DNATA FINANCIAL COMMENTARY 52
EMIRATES INDEPENDENT AUDITOR’S REPORT 57
AND CONSOLIDATED FINANCIAL STATEMENTS
DNATA INDEPENDENT AUDITOR’S REPORT 99
AND CONSOLIDATED FINANCIAL STATEMENTS
ADDiTioNAl iNFoRMATioN
EMIRATES TEN-YEAR OVERVIEW 132
DNATA TEN-YEAR OVERVIEW 134
GROUP COMPANIES OF EMIRATES 136
GROUP COMPANIES OF DNATA 137
GLOSSARY 138

5
Emirates group Financial Highlights 2011-12 2010-11 % change
Revenue and other operating income* AED m 67,394 57,224 17.8
Operating profit AED m 2,606 5,943 (56.2)
Operating margin % 3.9 10.4 (6.5) pts
Profit attributable to the Owner AED m 2,310 5,951 (61.2)
Profit margin % 3.4 10.4 (7.0) pts
Cash assets AED m 17,586 16,056 9.5
Total assets** AED m 84,127 71,402 17.8
2010-11 figures have been re-classified to conform with the current year's presentation. * After eliminating inter company income/expense of AED 1,893 million in 2011-12 (2010-11 : 1,413 million). ** After eliminating inter company receivables/payables of AED 78 million in 2011-12 (2010-11 : 88 million).
Percentages and ratios are derived based on the full figure before rounding.
The financial year of the Emirates Group is from 1 April to 31 March. Throughout this report all figures are in UAE Dirhams (AED) unless otherwise stated. The exchange rate of the Dirham to the US Dollar is fixed at 3.67.
Emirates Financial Highlights 2011-12 2010-11 % change
Revenue and results
Revenue and other operating income AED m 62,287 54,231 14.9
Operating profit AED m 1,813 5,443 (66.7)
Operating margin % 2.9 10.0 (7.1) pts
Profit attributable to the Owner AED m 1,502 5,375 (72.1)
Profit margin % 2.4 9.9 (7.5) pts
Return on shareholder's funds % 7.2 28.4 (21.2) pts
Financial position and cash flow
Total assets AED m 77,086 65,090 18.4
Cash assets AED m 15,587 13,973 11.6
Net debt (including aircraft
operating lease) equity ratio % 162.1 127.6 34.5 pts
EBITDAR AED m 10,735 13,437 (20.1)
EBITDAR margin % 17.2 24.8 (7.6) pts
Airline operating statistics
Passengers carried number '000 33,981 31,422 8.1
Cargo carried tonnes '000 1,796 1,767 1.6
Passenger seat factor % 80.0 80.0 -
Overall capacity ATKM million 35,467 32,057 10.6
Available seat kilometres ASKM million 200,687 182,757 9.8
Aircraft number 169 148 14.2
Employee data
Average employee strength number 42,422 38,797 9.3
FiNANCiAl HigHligHTS
43,266
43,455
54,231
38,810
2008-09
2009-10
2010-11
2011-12 62,287
2007-08
Revenue and other operating income in AED m
686
3,538
5,375
5,020
1,502
Profit attributable to the Owner in AED m
2008-09
2009-10
2010-11
2011-12
2007-08

dnata Financial Highlights 2011-12 2010-11 % change
Revenue and results
Revenue and other operating income AED m 7,000 4,406 58.9
Operating profit AED m 793 500 58.6
Operating margin % 11.3 11.3 -
Profit attributable to the Owner AED m 808 576 40.3
Profit margin % 11.5 13.1 (1.6) pts
Return on shareholder's funds % 23.7 18.0 5.7 pts
Financial position
Total assets AED m 7,119 6,400 11.2
Cash assets AED m 1,999 2,083 (4.0)
key operating statistics
Aircraft handled number 253,434 232,585 9.0
Cargo handled tonnes '000 1,543 1,494 3.3
Meals uplifted number '000 52,186 11,743 344.4
Employee data
Average employee strength number 20,275 17,971 12.8
3,181
3,160
4,406
2,585
7,000
Revenue and other operating income in AED m
2008-09
2009-10
2010-11
2011-12
2007-08
507
613
576
305
808
Profit attributable to the Owner in AED m
2008-09
2009-10
2010-11
2011-12
2007-08

His HigHness sHeikH AHmed bin sAeed Al mAktoum
Chairman & Chief exeCutive emirates airline & Group
Another profitable year, and a demanding oneThe 2011-12 financial year fully tested
our understanding of our markets and
the ability to grow our businesses. The
economic environment was hampered by
the on-going Eurozone debt crisis and a
slowly rebounding global economy. Our
most significant challenge was the high
price of jet fuel, which has remained
uncharacteristically above US$100/
barrel since February 2011. As a result,
fuel costs now represent 40 per cent of
our total costs, which means we spent
an additional US$1.6 billion (AED 5.9
billion) over the last financial year which
directly impacts our bottom line. Other
major challenges included sustained
geopolitical turmoil in Africa and the
Middle East and several natural disasters.
Throughout it all, we continued to follow
our proven business model.
Because of this, I am pleased to say
2011-12 was our 24th consecutive year
of profit for the Emirates Group, and the
best year ever for dnata.
Strong business growthOur performance never waned in
2011-12. Revenue for the Emirates Group
reached a new high, climbing to US$18.9
billion (AED 69 billion), a 21 per cent
increase over the previous year. Some of
this increase is attributable to improved
passenger yields reflecting increased fuel
prices, whilst some of it is also due to
higher traffic volumes. dnata’s standout
financial performance was another
contributing factor, and a very positive
one, adding US$1.9 billion (AED 7 billion)
to our top line.
Net profit for the Emirates Group was
US$629 million (AED 2.3 billion), this
was 61 per cent less than the last
financial year, reflecting the impact
higher fuel costs had on our business.
Had fuel prices remained the same as
last year, our annual net profit would
have again soared to a new record high.
Despite the high cost of fuel, we made
the business decision not to pass this
on to our passengers for nearly one
year. We also continued to provide our
customers with the renowned products
and services for which the Emirates
brand is synonymous.
Even with the elevated fuel price, our
key metrics revealed solid growth
for 2011-12. We carried 34 million
passengers and flew to 122 destinations
in 72 countries. Measured in Revenue
Passenger Kilometres (RPKM),
passenger traffic carried was up 10 per
cent from the year before. Despite our
sizeable growth in capacity, we were still
able to retain a Passenger Seat Factor of
80 per cent, which is consistent with the
results of the previous year.
Air Cargo World ranked Emirates SkyCargo
as the world’s leading carrier as measured
by international scheduled freight tonnage
7

carried. Despite a shrinking air cargo
market, our 2011-12 cargo volumes were
up 2 per cent, helped by our network
expansion into Africa and South America.
Despite the challenges, year end
2011-12 still finds us in a strong
financial position. Our cash on hand is
US$4.8 billion (AED 17.6 billion)
compared to US$4.4 billion
(AED 16 billion) last year. Our diverse
investor base continues to have
confidence in our business model.
We have successfully secured funding
through the issuance of a new bond
worth US$1 billion (AED 3.67 billion)
to finance aircraft still on order.
Based on our ever expanding fleet,
which increased by a record number
of 22 aircraft last year, and the
rapidity at which we add international
destinations, Emirates remains the
fastest growing airline in the world. And
it remains one of the most profitable in
the industry.
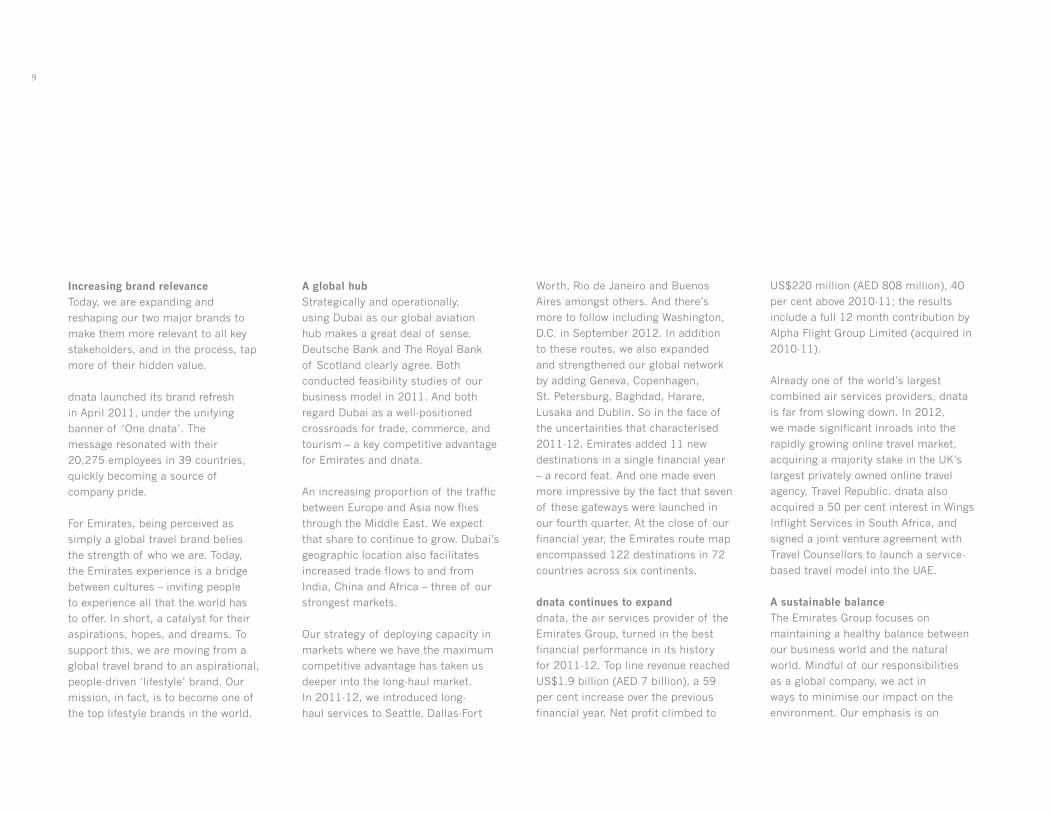
increasing brand relevance Today, we are expanding and
reshaping our two major brands to
make them more relevant to all key
stakeholders, and in the process, tap
more of their hidden value.
dnata launched its brand refresh
in April 2011, under the unifying
banner of ‘One dnata’. The
message resonated with their
20,275 employees in 39 countries,
quickly becoming a source of
company pride.
For Emirates, being perceived as
simply a global travel brand belies
the strength of who we are. Today,
the Emirates experience is a bridge
between cultures – inviting people
to experience all that the world has
to offer. In short, a catalyst for their
aspirations, hopes, and dreams. To
support this, we are moving from a
global travel brand to an aspirational,
people-driven ‘lifestyle’ brand. Our
mission, in fact, is to become one of
the top lifestyle brands in the world.
A global hub Strategically and operationally,
using Dubai as our global aviation
hub makes a great deal of sense.
Deutsche Bank and The Royal Bank
of Scotland clearly agree. Both
conducted feasibility studies of our
business model in 2011. And both
regard Dubai as a well-positioned
crossroads for trade, commerce, and
tourism – a key competitive advantage
for Emirates and dnata.
An increasing proportion of the traffic
between Europe and Asia now flies
through the Middle East. We expect
that share to continue to grow. Dubai’s
geographic location also facilitates
increased trade flows to and from
India, China and Africa – three of our
strongest markets.
Our strategy of deploying capacity in
markets where we have the maximum
competitive advantage has taken us
deeper into the long-haul market.
In 2011-12, we introduced long-
haul services to Seattle, Dallas-Fort
Worth, Rio de Janeiro and Buenos
Aires amongst others. And there’s
more to follow including Washington,
D.C. in September 2012. In addition
to these routes, we also expanded
and strengthened our global network
by adding Geneva, Copenhagen,
St. Petersburg, Baghdad, Harare,
Lusaka and Dublin. So in the face of
the uncertainties that characterised
2011-12, Emirates added 11 new
destinations in a single financial year
– a record feat. And one made even
more impressive by the fact that seven
of these gateways were launched in
our fourth quarter. At the close of our
financial year, the Emirates route map
encompassed 122 destinations in 72
countries across six continents.
dnata continues to expand dnata, the air services provider of the
Emirates Group, turned in the best
financial performance in its history
for 2011-12. Top line revenue reached
US$1.9 billion (AED 7 billion), a 59
per cent increase over the previous
financial year. Net profit climbed to
US$220 million (AED 808 million), 40
per cent above 2010-11; the results
include a full 12 month contribution by
Alpha Flight Group Limited (acquired in
2010-11).
Already one of the world’s largest
combined air services providers, dnata
is far from slowing down. In 2012,
we made significant inroads into the
rapidly growing online travel market,
acquiring a majority stake in the UK’s
largest privately owned online travel
agency, Travel Republic. dnata also
acquired a 50 per cent interest in Wings
Inflight Services in South Africa, and
signed a joint venture agreement with
Travel Counsellors to launch a service-
based travel model into the UAE.
A sustainable balance The Emirates Group focuses on
maintaining a healthy balance between
our business world and the natural
world. Mindful of our responsibilities
as a global company, we act in
ways to minimise our impact on the
environment. Our emphasis is on
9

exploring new approaches to growing
our business, whilst using fewer
resources and creating less waste
and pollution. All of this is detailed in
the Emirates Group 2010-11 annual
environmental report – the first of a
continuing annual series.
Although we’ve put comprehensive
programmes for industrial and office
recycling in place, we realise the most
significant contribution we can make,
whether on the ground or in the air,
is reducing fuel consumption and
emissions. By design, we operate one
of the youngest and most eco-efficient
fleets in the world. Nonetheless, we
work closely with Airbus and Boeing,
refining and adding greater efficiency
to the passenger aircraft still to be
delivered, which total 223.
Focused on long-term goals History tells us that economic and
political instability are cyclical in nature.
We not only understand the significance
of that point, we understand its
application to our business. We look
beyond the short term to focus on
strategies that will sustain us over time.
In 2011-12 we continued to invest in
our eco-efficient, wide-bodied global
aircraft fleet, increasing seat capacity
across our network by 10 per cent
over last financial year (measured in
Available Seat Kilometres). We also
ordered 50 Boeing 777s for US$18
billion with options for an additional 20
aircraft valued at US$8 billion. At the
time, it was the largest order in Boeing’s
history. Emirates is the largest operator
of Boeing 777s – with a fleet of 102,
16 of which were delivered this year
including Boeing’s milestone 1000th
777. Our fleet of 21 Airbus A380s is
also the largest in the world, six of them
delivered within this fiscal year.
Understanding what comes next The effects of the challenges faced in
2011-12 will be felt well into the current
financial year. Emirates’ and dnata’s focus
remains on meeting these challenges
whilst maintaining our high product and
service standards. Our customers expect
it, and quite frankly, we demand it.
The International Air Transport
Association (IATA) predicts fuel prices will
remain above US$100/barrel throughout
2012 – kept there by the on-going political
instability and increased demand from
China and other countries.
Compounding that, the EU Emissions
Trading Scheme, a cap and trade system
to reduce greenhouse gasses, was applied
to airlines for the first time in January
2012. Many in our industry are wondering
if all of this is the “new normal”. If it is,
our business model and clear-sighted
management style will enable us to
operate successively within it.
We’ll continue to face internal pressures,
as well. Some of the same factors
that set Emirates apart also test our
efficiency – like handling the continuous
delivery of new aircraft and dealing with
the increased seat capacity they bring.
The challenges are not Emirates’ alone.
Every day, dnata’s ground handling
service now helps facilitate the movement
of approximately 9,300 passengers
through Dubai International Airport in a
remarkable 1.5 hour timespan. As the
numbers of passengers increase, so will
the logistics of handling them.
From our perspective, these are not
insurmountable challenges. It is all part
of being a global business leader in the
21st century. It is business as usual for
Emirates and dnata. We are confident
about our people, business model,
infrastructure and brands. We don’t
retreat when the economy slows. We
build. We are positive about our future.
From my perspective, there’s only one
place we can go in 2012-13: up.
My sincere thanks to everyone on our
global team for your hard work and
winning performance.
Ahmed bin Saeed Al Maktoum

HH Sheikh Ahmed bin Saeed Al Maktoum Chairman & Chief Executive
Emirates Airline & Group
Sir Maurice Flanagan kbEExecutive Vice Chairman
Emirates Airline & Group
Tim Clark President
Emirates Airline
gary Chapman President
Group Services & dnata
THE lEADERSHip TEAM
KEY TO THE EMIRATES GROUP SUCCESS HAS BEEN THE CONTINUITY OF ITS MANAGEMENT TEAM, MANY OF
WHOM HAVE BEEN WITH THE AIRLINE SINCE ITS CREATION. THE LEADERSHIP TEAM ITSELF HAS 275 YEARS OF
EXPERIENCE BETWEEN THEM BUILDING THE EMIRATES AIRLINE AND GROUP.
11

Ali Mubarak Al SooriExecutive Vice President
Chairman’s Office, Facilities
& Project Management &
Non Aircraft P&L
Thierry AntinoriExecutive Vice President
Passenger Sales Worldwide,
Emirates Airline
Adel Ahmad Al Redha Executive Vice President
Engineering & Operations,
Emirates Airline
Abdulaziz Al Ali Executive Vice President
Human Resources,
Emirates Group
Nigel Hopkins Executive Vice President
Service Departments,
Emirates Group
ismail Ali Albanna Executive Vice President
dnata
New dynamics, new connections As new markets emerge, new
opportunities appear. Our global route
map has grown by nearly 40 per cent
in the last five years alone. Connected
through the Emirates network of more
than 120 destinations worldwide, new
gateways are immediately viable –
increasing traffic, trade, and commerce.
Africa is a good example. With our newly
launched flights to Lusaka and Harare,
Emirates' cargo capacity into and out of
the continent is expected to reach over
6,000 tonnes a week.
Responding to demandLondon, Paris, New York, Hong Kong
– Emirates flies to these and other
traditional centres of commerce and
tourism. Then again, we fly just as
frequently to emerging markets like
Guangzhou, Mumbai, Beijing, Moscow
and São Paulo. And we connect with
other cities that have strong potential
for growth.
Emirates launched 11 new destinations
in 2011-12 – the most ever in a financial
year. Emirates flights now go to Geneva,
Copenhagen, St. Petersburg, Baghdad,
Rio de Janeiro, Buenos Aires, Dublin,
Lusaka and Harare, Dallas-Fort Worth
and Seattle.
Responding to growing demand in our
existing markets, we increased the
seat capacity or frequency to 34 of our
destinations. To London, for instance,
we will increase our A380 service to four
times daily, up from three. From July
2012, four out of five of our daily flights
into Heathrow will be served by this
popular aircraft, increasing seat capacity
to the destination by 10.7 per cent.
The right infrastructure for growthDubai, where Emirates and dnata are
based, is considered the crossroads
of Asia, the Middle East and Europe.
It’s situated eight hours or less from
75 per cent of the world’s population.
And it handles between four to five
million passengers monthly, thanks, in
part, to dnata’s professional ground
handling services.
Establishing the ultramodern Dubai
International Airport as our aviation
hub has proved advantageous. It not
only facilitates existing travel flows, but
also stimulates new demand across the
Emirates network – especially from North
and South America.
UNDERSTANDiNg A WoRlD iN FlUX
THE WORLD IS ON THE MOVE. NEW REGIONS OF COMMERCE ARE EMERGING - CREATING NEW CITIES AND
EXPANDING ESTABLISHED ONES. RURAL-URBAN MIGRATION CONTINUES TO INCREASE. EXPATRIATE POPULATIONS
ARE GROWING AND THEIR NEEDS ARE CHANGING. PATTERNS OF TRADE ARE RESHIFTING. PERSONAL ASPIRATIONS
ARE GROWING. AT EMIRATES AND DNATA, WE UNDERSTAND THE BUSINESS IMPLICATIONS OF IT ALL.
13


UNDERSTANDiNg HoW ECoNoMiES WoRk
EMERGING ECONOMIES IN BRAzIL, INDIA, CHINA, AFRICA AND SOUTH EAST ASIA ARE DRIVING THE NEED FOR
NEW, EFFICIENT WAYS TO CONNECT MORE GLOBALLY WITH THE WORLD. BY OPENING NEW PASSENGER AND
CARGO DESTINATIONS, EMIRATES IS HELPING TO MEET THIS NEED, AS EACH NEW GATEWAY CREATES NEW TRADE
OPPORTUNITIES AND ROUTES.
A new Silk Road The Silk Road was the main trade
route that connected Asia to Europe
and Africa in the late Middle Ages.
Today, a new ‘Silk Road’ has sprung
up, connecting China, Hong Kong,
India, Singapore and Africa to Dubai
and trading partners around the
world. Instead of desert caravans,
however, the new Silk Road relies on
Emirates, Emirates SkyCargo and
dnata’s cargo handling.
A catalyst for global tradeLaunching a new Emirates destination
does more than transport passengers
from one point to another. It also
opens trade opportunities that didn’t
exist before. For example, in 2011-12,
we launched direct flights from Dubai
to Rio de Janeiro and Buenos Aires.
Combined with our existing service
to São Paulo, Emirates and Emirates
SkyCargo are now able to link these
three points in South America with
trading partners around the world.
What’s more, Brazil is a manufacturing
centre for many Japanese automakers.
So in addition to serving their supply
chains, we also serve their executives
and engineers with daily flights to
Tokyo and Osaka via Dubai.
Connecting Africa to the worldEmirates helps facilitate the growing
trade between the African continent
and the rest of the world – connecting
businesses in 22 African nations
to our network of more than 120
destinations, whilst also providing
increased opportunities for key
trading partners, such as China and
India. Our global connections also
play a role in making pharmaceuticals
and other consumer goods more
accessible to emerging markets.
An important link in the supply chainEmirates SkyCargo and dnata's cargo
teams play essential roles in their
customers’ supply chains. SkyCargo is the
go-to air freight company for big loads,
like the 36 tonne rudder part Emirates
SkyCargo transported from Seoul to
Dubai, the heaviest single item it has
ever carried. SkyCargo helps maximise
customers’ efficiency with SkyChain,
an award-winning cargo management
solution from Emirates Group IT service
company, Mercator. This end-to-end
system gives customers a range of real-
time logistics technology solutions, as
well as finance and revenue information,
from booking to final delivery. SkyCargo
also invests heavily in the constant
improvement of Cool Chain technology,
this year adding new unit load devices
that provide precise temperature control
when shipping pharmaceuticals and other
perishable goods.
15


UNIVERSAL VALUESUnderstanding is a connection point to people, a bridge to common groUnd

UNDERSTANDiNg MEANiNgFUl THiNgS
OURS IS A CUSTOMER-CENTRIC VIEW. WHETHER THE CUSTOMER IS A BUSINESS PASSENGER, TRAVEL AGENT,
CARGO MANAGER, OR HOLIDAY TRAVELLER, OUR FOCUS IS ON THE CONTINUOUS IMPROVEMENT OF THE
CUSTOMER EXPERIENCE ACROSS THE MORE THAN FIFTY BRANDS THAT MAKE UP THE EMIRATES GROUP.
beyond customer service Most companies strive for exceptional
customer service. The companies
of the Emirates Group focus beyond
customer service, actively seeking a
more meaningful exchange because we
understand the importance of customer
engagement. We follow a simple strategy:
exceed customer expectations. We
understand the customer’s opinion is the
only one that matters. So it’s never what
we think, it’s how we make customers feel
about their Emirates or dnata experience.
It’s an empathetic point of view shared
on all levels. For instance, dnata baggage
handlers are trained to understand that
luggage is more than just luggage. It
also represents a critical component
in a family’s enjoyable holiday or an
executive’s successful business trip.
Continuous refinementEmirates’ and dnata’s business models
are ‘works in progress’, continuously
changing and adapting as we identify
ways to improve our products and
services. In 2011-12, Emirates refreshed
its First Class and Business Class
services. This included retraining 5,000
cabin crew professionals on a more
flexible inflight presentation style,
switching from a trolley service to a more
personal hand delivery and upgrading
18 tonnes of white china. To enhance
the customer experience even more, we
continually work with Airbus and Boeing
aircraft designers to improve, refine and
optimise the aircraft of the future.
Adding inflight connectivity Looking at things from the customers’
point of view makes us more sensitive to
their changing expectations. Passengers
today want more than entertainment;
they also want to be connected 24/7.
So in 2011, Emirates rolled out Wi-Fi
connectivity as a new feature on the 21
aircraft in our A380 fleet. Passengers can
now connect their Wi-Fi enabled devices
to our inflight network for browsing,
email, and social networking. Of course,
they can also enjoy our ice inflight
entertainment system, with up to 1,300
channels of entertainment from movies
to TV shows, as well as music, podcasts
and games. Small wonder then, it was
again voted ‘World’s Best Airline Inflight
Entertainment’ at the 2011 Skytrax World
Airline Awards. That makes seven years
in a row. Plus, we were voted ‘World’s
Best Overall Passenger Experience’ in the
Passenger Choice Awards.
Delivering a continuum of good service Emirates and dnata understand how
to build customer relationships.
To strengthen the bond with their
business customers, dnata announced
it will invest more than US$70 million
(AED 257 million) internationally in
projects that help provide services
that exceed customers’ expectations.
The investment will support dnata
operations in many of its businesses
internationally. Included are new, more
efficient ground-support equipment
and a decision support system that
provides a real-time view of the
workload on hand, helping dnata
achieve optimal operational efficiency
for its customers.
18


UNDERSTANDiNg RiSk AND REWARD
WE OPERATE IN FLUCTUATING TIMES: AN UNSTEADY GLOBAL ECONOMIC RECOVERY, STUBBORNLY HIGH FUEL
PRICES, GEOPOLITICAL INSTABILITY. AT THE EMIRATES GROUP, WE UNDERSTAND THE CHALLENGES AS WELL
AS THE OPPORTUNITIES THESE FACTORS CAN CREATE. BUT WE DON’T LET THEM INTERFERE WITH DELIVERING
qUALITY PRODUCTS AND SERVICES TO OUR CUSTOMERS.
Continuing to growBusiness cycles tell us that for every
trough there’s a rebounding peak. Put in
simpler terms, challenging times do not
last forever. So rather than compromise
the customer experience in a downturn,
we focus, instead, on following our
business model and adding more value to
the customer experience.
In 2011-12, Emirates and dnata continued
to execute growth strategies – taking
delivery of 22 new aircraft, investing in
new ground handling equipment, acquiring
a stake in companies like Travel Republic
and Wings Inflight Services, launching
joint ventures with companies such as
Travel Counsellors, hiring and training
more pilots and cabin crew, opening new
passenger lounges in San Francisco,
Istanbul and Colombo and even upgrading
our Chauffeur Drive service for First Class
passengers in our hometown.
A future guided by experience The 11 new destinations added in
2011-12 didn’t happen by accident.
They’re the result of rigorous planning
processes that follow stringent
economic criteria and months of
detailed market analyses. Potential new
destinations to our network must show
market viability and passenger benefit.
Our past experience in launching other
passenger and cargo destinations helps
us refine our future forecasts, enabling us
to evaluate future market opportunities
in a timely, accurate manner. Our well-
structured implementation plan allows us
to launch a new route in a short period
of time. Often, we can go from decision-
making for a new destination to the
inaugural flight in as little as nine months.
building a solid baseTo help stimulate forward-bookings for
the year ahead, Emirates launched a
special promotion in the first two weeks
of January 2012, discounting long-term
airfares to over 100 cities. The results
helped build brand loyalty, drawing
many first-time Emirates passengers.
Overall traffic to our website almost
doubled during the promotional period,
and remained higher afterwards.
Real-time decision makingOur understanding is gained from solid
experience. At Emirates and dnata, it
guides our swift decision-making process,
helping us manage business on the move.
It’s a major reason why Emirates is now
the fastest growing airline in the world.
In December 2011, Emirates became
the first airline in the world to take
delivery of five wide-body aircraft in
a brief four-week span. To maximise
revenue, each aircraft had to be airborne
in commercial service within nine hours
of delivery, complete with new cabin
and flight crews.
Our quick response time also helps
generate incremental business. For
example, we add frequency and new
equipment on an ad hoc basis for sporting
events, pilgrimages, and other major
holidays, such as the Chinese New Year.
When passenger demand increased just
three weeks after launching our Dublin-
Dubai route, we announced an upgrade to
a higher capacity aircraft – just as we did
on 12 other routes.
20


ESSENTiAl TRUTHSWITH UNDERSTANDING COMES CLARITY - THE ABILITY TO SEE THINGS AS THEY ARE

UNDERSTANDiNg THE VAlUE oF NEW iDEAS
THE EMIRATES GROUP’S AWARD-WINNING IT DEPARTMENT EXPLORES EVERY NEW TECHNOLOGY, ADAPTING
AND DEVELOPING INNOVATIVE SOLUTIONS AND APPS THAT INCREASE INTERNAL EFFICIENCY OR ENHANCE THE
qUALITY OF THE CUSTOMER SERVICE EMIRATES AND DNATA PROVIDE.
Customer-focused technologyWe understand passengers want more
control over their travel plans. In
2011-12, Emirates launched several
innovative services designed to make
travel easier for them. Travellers who
visit the Emirates website can now book
their hotel, rental car and airline tickets
on one integrated booking reference.
And our new Connection Search on-line
planning tool allows leisure, business
and corporate travellers to build
itineraries combining Emirates flights
with low-cost airline connections outside
the Emirates network. Our mobile
boarding pass gives many passengers
the convenient option of receiving their
boarding pass on their smartphones or
other internet-enabled mobile devices
– an efficiency boost for us and a time
saver for them.
The mobile website was also rebuilt
in-house resulting in a faster and
improved customer experience,
gaining a 57 per cent increase in
mobile check-in for flights.
A portal for the futureUp until two years ago, managing air
cargo was a repetitive, paper-intensive
process. Then dnata launched Calogi, a
secure internet service portal that allows
the airfreight community – airlines,
agents, freight forwarders and government
authorities – to seamlessly interact in an
effortless, paperless environment.
Calogi’s digital solutions support the
entire airfreight process, from scheduling
to air waybill management to shipment
tracking. Calogi recently welcomed
National Air Cargo Group, a leading US
based air cargo provider as a new user. By
the end of 2011-12, Calogi had increased
its total user base to more than 500
companies and 1,500 discrete users.
dnata enters online travel According to market research firm
Euromonitor International, online travel
and tourism is poised to “experience
solid growth” over the next five years. To
capitalise on this rising internet-based
trend, dnata acquired a majority stake
in Travel Republic, the largest privately
owned online travel agency in the UK.
It’s a good fit. Travel Republic’s annual
turnover for 2011 was more than 40 per
cent higher than the previous year. Going
forward, dnata plans to grow its online
business by using its existing global travel
network to offer a broader range of price-
competitive destinations and packages.
Mercator receives global recognition Mercator develops cutting-edge
technology solutions for the aviation
industry. Integrated solutions range
from loyalty programmes and CRM
to financial management and cargo/
logistics. SkyChain, its cargo IT solution,
was voted World’s Best at the 2011 Air
Cargo Week World Air Cargo Awards. In
2011-12, AviancaTaca Holding, Latin
America’s second largest airline holding
company, implemented SkyChain across
its four airlines: TACA, Aerogal, TAMPA
Cargo, and Avianca’s international
cargo. Now, all four airfreight operations
seamlessly share shipping information
across a single system.
23


UNDERSTANDiNg oTHER poiNTS oF ViEW
THE EMIRATES GROUP IS A MICROCOSM OF THE WORLD, ITSELF - A COSMOPOLITAN, MULTICULTURAL
ENVIRONMENT THAT BRINGS TOGETHER TALENTED PEOPLE FROM AROUND THE GLOBE. IT’S A DIVERSITY THAT
CONTRIBUTES TO OUR UNIqUE UNDERSTANDING OF THE WORLD.
A common vision When it comes to recruiting at the
Emirates Group, Human Resources
knows no boundaries. We go where
the talent is, looking for bright,
motivated people who are also
capable of challenging the status
quo. Why the last part? Because
challenging established ideas
remains an integral part of our
business model.
Hiring is not a simple yes/no
decision. We use a sophisticated
recruitment model, with assessment
tools and normative values proven
across more than 165 different
nationalities. To support our planned
growth for 2012-13, we are recruiting
more than 4,500 new cabin crew
and pilots. Yet, no matter how many
new people we add, or how many
different languages we speak (127 at
last count), we continue to share a
common vision for success.
New communication channels In addition to traditional advertising
channels, Emirates and dnata are
also using social media sites in an
ancillary role to promote our brands
and attract potential new hires. In
simple terms, we are creating ‘buzz’
about our companies, inviting everyone
to join in the conversation. We want to
get people talking about us in positive
ways, and in the process, develop brand
ambassadors for both companies.
The approach is working. In 2011,
Emirates advertised 4,000 cabin crew
jobs on a leading European online
music site, reaching nearly 10 million
users. The results: a 30 per cent
increase in applicants.
A future based on understandingHuman Resources at the Emirates
Group is not only focused on recruiting
outstanding individuals, but also on
engaging them. That process starts
with gaining a better understanding
of people’s needs and aspirations.
One thing we’ve learned from all of
this is that people function best in a
supportive environment. So, we are
constantly exploring ways to save time
and boost productivity. Even little things
help. For instance, employees based
in Dubai can now manage most of
their visa requirements at the Service
Centre in our headquarters building,
eliminating the time and hassle of
having to make an outside trip.
Attracting more UAE nationalsEmployees of the Emirates Group
represent 167 nationalities. Included
in that total, of course, are UAE
nationals. But, as a Dubai-based
company, we’d like to see more. To
help make that a reality, Emirates
and dnata have created on-the-job
training programmes specifically
designed for UAE nationals to
encourage new recruits.
25


globAl pERSpECTiVESTHE MORE UNDERSTANDING, THE WIDER THE VIEW, THE CLOSER THE WORLD

UNDERSTANDiNg oUR RESpoNSibiliTiES
AS A GLOBAL LEADER IN AVIATION AND TRAVEL, AS WELL AS A CITIzEN OF THE WORLD, THE EMIRATES GROUP
UNDERSTANDS AND TAKES ITS ENVIRONMENTAL RESPONSIBILITIES SERIOUSLY. OUR MISSION IS TO MAKE
SUSTAINABILITY AND ECO-EFFICIENCY THE CORNERSTONES OF ALL EMIRATES GROUP OPERATIONS.
Age and weight matterIt’s an engineering fact: the newer the
aircraft and the more efficient its engines,
the less greenhouse gases it emits.
Emirates understands this. We have always
operated one of the youngest, quietest,
lightest, most fuel-efficient international
fleets in the world, with an average age of
6.5 years (compared to the global average
of 13 years). In 2011-12, we maintained
our fleet’s average age by introducing 22
new aircraft into service.
Age is only one factor that improves the
CO2 efficiency of Emirates passenger
flights. Weight is another. So, we’re
constantly adding new materials and
technology that help reduce aircraft weight,
which in turn, reduces fuel burn.
Finding a better wayShorter routes reduce CO2 emissions.
In 2011-12, Emirates trialled four new
waypoints across the Mid-Atlantic. They
increased crossing segments to the
Europe/South American (EUR/SAM)
corridor and introduced more entry and
exit points to and from the Atlantic Ocean
Random Routing Area (AORRA) airspace –
all of which saves time and fuel burn.
Emirates also flew a demonstration flight
carrying the UAE Delegation to the 2011
United Nations Framework Convention
on Climate Change in Durban, South
Africa. Through close coordination
with air navigation providers in seven
countries between the UAE and South
Africa, Emirates used pioneering air
and ground procedures to reduce flight
emissions. Compared to the same
aircraft following a conventional flight
plan, this demonstration flight reduced
CO2 emissions by five tonnes.
Responsible asset management Part of responsible asset management is
a suitable disposal strategy for when it’s
replaced. So when we replaced the china
used in our premium cabins, we knew
what to do with the old crockery. Instead
of sending it to a landfill, we placed 18
tonnes of it on the Gulf floor in the waters
off Dubai. The reason: to encourage new
populations of Gulf pearl oysters to grow.
The china covered 100 square metres
and provides a better substrate for young
oysters to attach themselves to, rather
than the sandy Gulf bottom.
going paperlessIt stands to reason; the best way to
reduce paper waste is to not use any.
Emirates and dnata continue to find
efficient electronic solutions for paper-
intensive processes. Emirates SkyCargo
announced that electronic air waybills
(e-AWBs) are now being used for 100 per
cent of shipments from its Dubai hub.
dnata has reduced paper consumption by
two-thirds, simply by distributing weekly
reports electronically. Calogi, our online air-
cargo portal, offers subscribers complete
e-freight solutions. Emirates Finance
switched to nearly 100 per cent electronic
banking, eliminating wasteful paper flow
from more than 80 outstations, worldwide.
It all adds up.
28


UNDERSTANDiNg ToMoRRoW
THE EMIRATES GROUP UNDERSTANDS THE PROMISE AND CHALLENGE THAT TOMORROW BRINGS. WE ARE NOW
POSITIONING OUR COMPANIES AND BRANDS TO MEET THOSE CHALLENGES HEAD-ON, WHILE TAKING FULL
ADVANTAGE OF OUR OPPORTUNITIES.
Experience the brandThe Emirates brand encompasses
more than flying from one destination
to another. Today, it is defined by the
entire customer experience. As always,
we’re making certain the experience is
an exceptional one. To the world, the
Emirates brand increasingly reflects a
lifestyle to aspire to, a sophisticated
yet forward-thinking lifestyle – one that
lives in tomorrow. Emirates Corporate
Communications has been working on
realigning the Emirates brand as the
company continues its evolution from a
travel brand to a global lifestyle brand.
By the time you read this, our new brand
platform 'Hello Tomorrow' will have been
launched – the first step in our mission
to become one of the world’s top
lifestyle brands.
one dnata After a period of unprecedented growth,
including the acquisition of Alpha Flight
Group Limited last financial year, dnata
has emerged as one of the world’s largest
combined air services providers. On top of
that, dnata had its strongest financial year
ever in 2011-12. Clearly, it was time for
the dnata brand to catch up.
In April 2011, dnata launched a
successful global brand refresh and
realignment. In order to realise its new
company vision to become the world's
most admired air services provider,
a new corporate mission and set
of values were unveiled at the same
time as a new visual identity. The
reinvigorated dnata identity has been
rolled out to most dnata companies
and remote offices, where it’s been
met with tremendous approval.
dnata’s internal message – 'One dnata' –
is designed to unify and create a sense
of belonging amongst more than 20,000
employees in 39 countries. dnata’s
external brand message – “to deliver
the promises our customers make to
their customers” – resonates well with
stakeholders.
Meeting tomorrow’s challenges As in 2011-12, there will be plenty of
challenges to understand in the next
financial year. Uncertainty surrounds them
all. How long will the cost of fuel remain
high? When will the global economic crisis
begin to fade? Where will the tumultuous
aftermath of the Arab Spring take us?
What new natural disasters will strike?
And perhaps the most important question
of all: is this the new normal?
Whilst we don’t know all the answers,
we know how to plan for their potential
outcomes. Our understanding of the world
is a 20/20 view. We have the people,
vision, systems and most importantly,
the experience to use that understanding
to our advantage. We are ready to face
whatever tomorrow brings.
We understand tomorrow.
30


Emirates SkyCargo marked a
milestone with its inaugural 100 per
cent paperless freighter flight between
Nairobi, Kenya and Amsterdam,
the Netherlands.
Shanghai welcomed its first
scheduled Airbus A380 service, making
the city the third Emirates A380
destination in China.
dnata unveiled a new company
philosophy and visual branding
after undergoing a global brand
realignment following unprecedented
growth worldwide.
The Emirates Group announced its
23rd consecutive year of profit for the
financial year 2010-11 with a record
performance of US$1.6 billion (AED 5.9
billion) net profit (despite a challenging
business climate).
Skywards was voted the Middle East’s
Leading Airline Rewards Programme at
the 2011 World Travel Awards.
Emirates announced the successful
close of its US$ ‘Reg S’ bond issue at
US$1 billion (AED 3.67 billion).
Emirates linked two renowned
international hubs with the inaugural
flight of its Dubai-Geneva service.
Emirates launched mobile boarding
passes for customers, creating an
efficient, stress-free, paperless
travel experience.
Emirates temporarily suspended
services to Cote D’Ivoire when political
unrest closed all land, air and
sea borders.
Calogi added an on-line Charges
Correction Advice (CCA) solution to its
paper-free range of products and services.
1ST QUARTER
APRIL TO JUNE 2011
32
Four quarters make a whole world of
difference. Some of the highlights from
the Emirates Group in the past year.
Group
Emirates
dnata

Emirates’ ice inflight entertainment
system was awarded ‘World’s Best
Airline Inflight Entertainment’ for the
seventh year in a row at the 2011
Skytrax World Airline Awards. The
awards are based on voting by over
18.8 million passengers from 100
different nationalities.
Emirates-CAE Flight Training (ECFT),
the joint venture between Emirates Group
and CAE, announced the opening of a
second training facility in Dubai. The new
facility will provide additional training
capacity for airline pilots and aviation
maintenance technicians.
Civil unrest in the city of Sanaa, resulted
in the temporary suspension of Emirates
operations into and out of Yemen.
Emirates signed an interline
agreement with leading Nigerian
carrier Arik Air, making it easy for
customers to access a wide range
of points across Nigeria and
West Africa.
Emirates announced a deal to
become the Partner and Official Airline
of the world’s most successful football
club, Real Madrid.
Emirates announced an agreement
to become the new naming rights
sponsor for The Australian Open for
the next three years.
Emirates launched its non-stop daily
service to Copenhagen, its first passenger
service to Scandinavia.
The Emirates Group released its first
comprehensive environmental report,
a study that revealed the airline’s
carbon dioxide emissions efficiency
was 26 percent better than the global
airline average.
Emirates signed a sponsorship
agreement becoming the Official Partner
and Official Airline of the zain Saudi
Professional League.
Emirates SkyCargo launched the
inaugural service of its Far East and
Australasia freighter route. Operated by
a Boeing 777 freighter, the new weekly
service flies Dubai-Singapore-Sydney-
Hong Kong-Dubai.
Wolgan Valley Resort & Spa was ranked
second in the Overseas Leisure Hotel
category in the Australasia and South
Pacific region at the prestigious 2011
Condé Nast UK Traveller Readers’
Travel Awards.
Emirates.com hit a record high in flown
revenue sales for July 2011. Of the total
overall revenue for the airline, 13.4 per
cent (US$155 million or AED 569 million)
was produced through the online sales
channel on the back of increased yield.
2ND QUARTER
JULY TO SEPTEMBER 2011
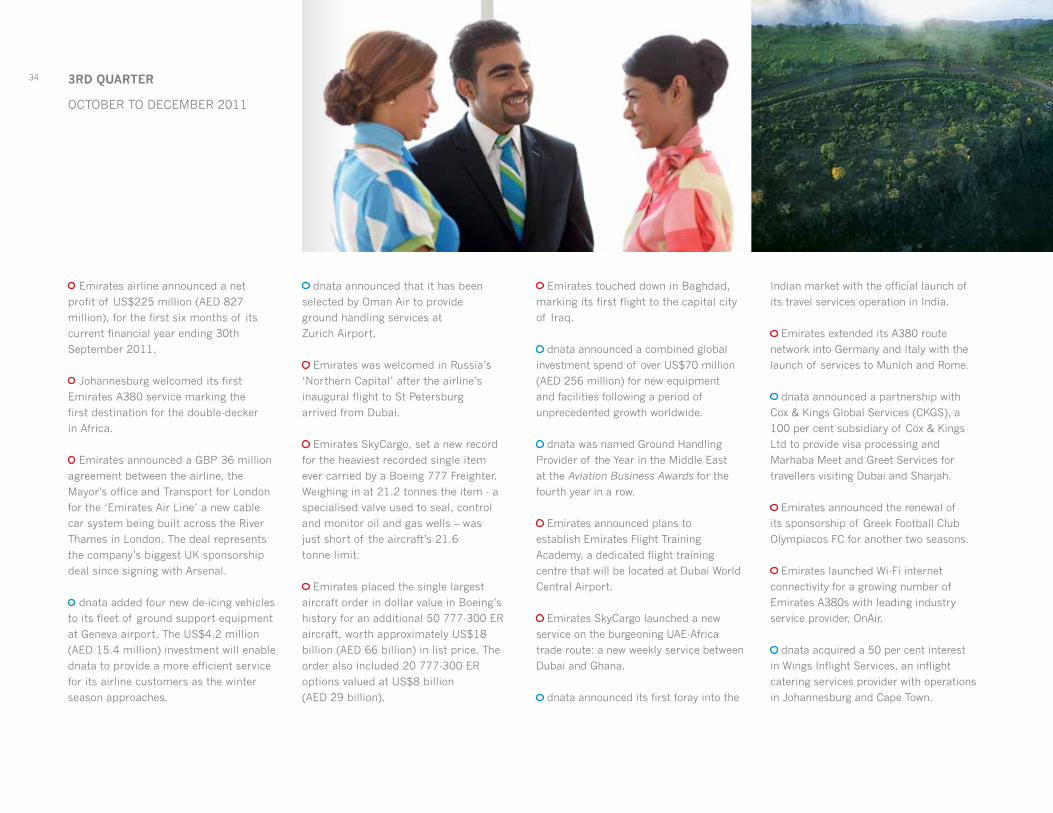
Emirates airline announced a net
profit of US$225 million (AED 827
million), for the first six months of its
current financial year ending 30th
September 2011.
Johannesburg welcomed its first
Emirates A380 service marking the
first destination for the double-decker
in Africa.
Emirates announced a GBP 36 million
agreement between the airline, the
Mayor’s office and Transport for London
for the ‘Emirates Air Line’ a new cable
car system being built across the River
Thames in London. The deal represents
the company’s biggest UK sponsorship
deal since signing with Arsenal.
dnata added four new de-icing vehicles
to its fleet of ground support equipment
at Geneva airport. The US$4.2 million
(AED 15.4 million) investment will enable
dnata to provide a more efficient service
for its airline customers as the winter
season approaches.
dnata announced that it has been
selected by Oman Air to provide
ground handling services at
zurich Airport.
Emirates was welcomed in Russia’s
‘Northern Capital’ after the airline’s
inaugural flight to St Petersburg
arrived from Dubai.
Emirates SkyCargo, set a new record
for the heaviest recorded single item
ever carried by a Boeing 777 Freighter.
Weighing in at 21.2 tonnes the item - a
specialised valve used to seal, control
and monitor oil and gas wells – was
just short of the aircraft’s 21.6
tonne limit.
Emirates placed the single largest
aircraft order in dollar value in Boeing’s
history for an additional 50 777-300 ER
aircraft, worth approximately US$18
billion (AED 66 billion) in list price. The
order also included 20 777-300 ER
options valued at US$8 billion
(AED 29 billion).
Emirates touched down in Baghdad,
marking its first flight to the capital city
of Iraq.
dnata announced a combined global
investment spend of over US$70 million
(AED 256 million) for new equipment
and facilities following a period of
unprecedented growth worldwide.
dnata was named Ground Handling
Provider of the Year in the Middle East
at the Aviation Business Awards for the
fourth year in a row.
Emirates announced plans to
establish Emirates Flight Training
Academy, a dedicated flight training
centre that will be located at Dubai World
Central Airport.
Emirates SkyCargo launched a new
service on the burgeoning UAE-Africa
trade route: a new weekly service between
Dubai and Ghana.
dnata announced its first foray into the
Indian market with the official launch of
its travel services operation in India.
Emirates extended its A380 route
network into Germany and Italy with the
launch of services to Munich and Rome.
dnata announced a partnership with
Cox & Kings Global Services (CKGS), a
100 per cent subsidiary of Cox & Kings
Ltd to provide visa processing and
Marhaba Meet and Greet Services for
travellers visiting Dubai and Sharjah.
Emirates announced the renewal of
its sponsorship of Greek Football Club
Olympiacos FC for another two seasons.
Emirates launched Wi-Fi internet
connectivity for a growing number of
Emirates A380s with leading industry
service provider, OnAir.
dnata acquired a 50 per cent interest
in Wings Inflight Services, an inflight
catering services provider with operations
in Johannesburg and Cape Town.
34 3RD QUARTER
OCTOBER TO DECEMBER 2011

Emirates became the first airline to
operate a scheduled Airbus A380 service
to Kuala Lumpur.
Emirates extended its South
American network with the launch of
inagural flights to Buenos Aires and
Rio de Janeiro.
dnata acquired a majority stake in
Travel Republic the largest privately
owned online travel agency in the UK. The
deal represents one of dnata’s biggest
business transactions in the company’s
52 year history.
Marhaba, the premium Meet and
Greet service for passengers at Dubai
International Airport celebrated its
20th anniversary.
Emirates landed in the Emerald Isle
with the launch of its inaugural service
to Dublin.
Dubai Desert Conservation Reserve
(DDCR), the first and largest protected
wildlife conservation area in the UAE,
announced the start of a new long-
term research expedition programme in
partnership with Biosphere Expeditions.
Emirates extended its reach into Africa
with the launch of a new linked service to
Lusaka and Harare.
Emirates announced a renewed
sponsorship agreement with Hamburg SV
until June 2015, highlighting its on-going
commitment to Germany and to sports
around the world.
Emirates launched its new Dallas-
Fort Worth service, the fifth gateway for
Emirates in the United States of America.
Emirates officially inaugurated its
dedicated customer contact centre in the
Outsource zone Dubai.
Mercator developed a fully integrated
Cargo Revenue Management Solution
in partnership with US based Revenue
Technology Services (RTS).
Emirates opened its first airport lounge
on the US West Coast, at San Francisco
International Airport (SFO). The new
lounge represents a US$4 million (AED
14.7 miilion) investment in the area.
In partnership with the United States
Tennis Association, Emirates announced
a global integrated sponsorship of the
US Open and US Open Series. As part of
the agreement, Emirates will become the
Official Airline of the US Open and the
title sponsor of the Emirates Airline US
Open Series.
Calogi added another paper-free
feature to their range of supply chain
products, with a new solution to simplify
the courier business.
Latin America’s second largest airline
holding company, AviancaTaca Holding,
became the latest customer to go live
with Mercator’s SkyChain cargo solution.
Emirates launched the first direct
air bridge between the Middle East
and America’s Pacific Northwest as its
inaugural service from Dubai arrived at
Seattle-Tacoma International Airport. This
marks Emirates’ eleventh new destination
for the 2011-12 financial year.
Emirates celebrated the unveiling
of the 1,000th Boeing 777 during a
special event at the manufacturer’s
plant in Everett, Washington State. The
landmark aircraft is the 102nd to join
the airline’s Boeing 777 fleet.
Emirates SkyCargo won the
Platinum Award (Air Cargo Carrier
– 800,000 or more tonnes) at the
prestigious Air Cargo Excellence
Awards 2012.
Emirates Group received the award
for Excellence in Financial Reporting at
The ICAEW Middle East Accountancy &
Finance Excellence Awards.
dnata unveiled a new, high quality
uniform which has been created for
more than 20,000 staff worldwide.
4TH QUARTER
JANUARY TO MARCH 2012
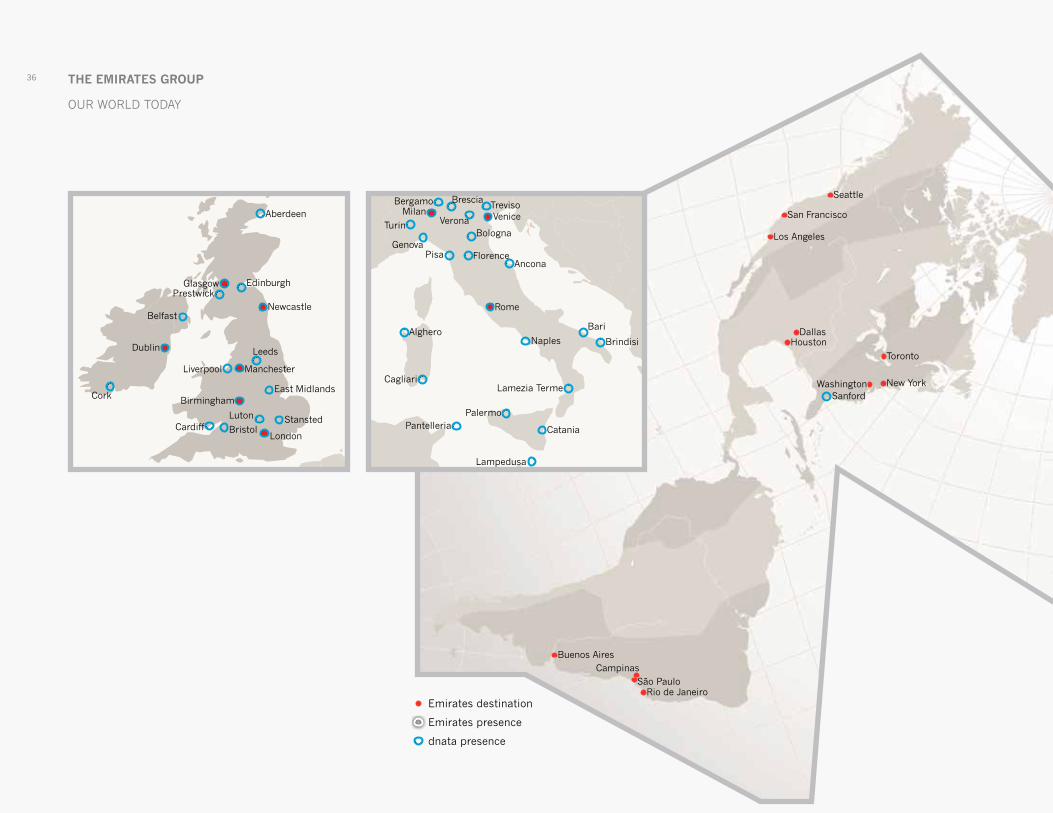
THE EMiRATES gRoUp
OUR WORLD TODAY
Emirates destination
Emirates presence
dnata presence
36
Aberdeen
Glasgow
Newcastle
Dublin
Manchester
Birmingham
London
Edinburgh
Belfast
BristolCardiff
Liverpool
StanstedLuton
East Midlands
Prestwick
Alghero
Cagliari
PantelleriaPalermo
Catania
VeniceMilan
Rome
Lampedusa
Lamezia Terme
Brindisi
Bari
Naples
AnconaPisa
GenovaFlorence
Bologna
Treviso
Turin
Brescia
Verona
Bergamo
Rio de JaneiroSão Paulo
CampinasBuenos Aires
New York
Toronto
DallasHouston
Los Angeles
San Francisco
Seattle
WashingtonSanfordCork
Leeds

HamburgDüsseldorf
FrankfurtMunich
Mauritius
Bahrain
DohaDubai
Abu Dhabi
AjmanRas Al Khaimah
Sharjah
Fujairah
Melbourne
LauncestonCanberra
SydneyCoolangatta
Townsville
Darwin
Perth
Christchurch
Auckland
Adelaide
Hobart
Suva
Wolgan Valley
JakartaKuala Lumpur
SingaporeBangkok
GuangzhouHong Kong
TaipeiBeijing
Almaty
Bagram
Malé
Seychelles
Colombo
Shanghai
Seoul
OsakaTokyo
Kabul
Moscow
Istanbul
AthensLarnaca
Tripoli
MaltaTunis
Casablanca
St.Petersburg
Addis Ababa
Dubai
ErbilTehran
Baghdad
Basra
Kuwait
Al Medinah
Amman
Beirut
Cairo
Damascus
Jeddah
Muscat
Sanaa
Yanbu
Salalah
Peshawar
IslamabadLahore
Delhi
KarachiAhmedabad
Hyderabad Chennai
KolkattaKathmandu
Phuket
Bengaluru
MumbaiKozhikodeThiruvananthapuram
Kochi
Riyadh
zaragozaMadrid
Bucharest
GenevaNice
zurich
Barcelona
Liege
Paris
Dhaka
Amsterdam
NairobiEldoret
Entebbe
Dar es Salaam
Durban
Johannesburg
Harare
Lilongwe
Lusaka
Cape Town
Luanda
Lagos
AccraAbidjan
Dakar
zanzibar
PragueVienna
Sofia
GothenburgCopenhagen
Lisbon
Manila
Brisbane
Khartoum
Ho Chi Minh City
Al Khobar
Jubail
Dammam

UNDERSTANDiNg pERFoRMANCE38

FINANCIAL INFORMATION
EMIRATES FINANCIAL COMMENTARY 44
DNATA FINANCIAL COMMENTARY 52
EMIRATES INDEPENDENT AUDITOR’S REPORT 57
AND CONSOLIDATED FINANCIAL STATEMENTS
DNATA INDEPENDENT AUDITOR’S REPORT 99
AND CONSOLIDATED FINANCIAL STATEMENTS
ADDITIONAL INFORMATION
EMIRATES TEN-YEAR OVERVIEW 132
DNATA TEN-YEAR OVERVIEW 134
GROUP COMPANIES OF EMIRATES 136
GROUP COMPANIES OF DNATA 137
GLOSSARY 138
The eMIRATes GROup
CONTENTS

Emirates continued unabated with its growth plans during the year by adding 22 aircraft to its fleet and expanding its route network by eleven new destinations despite the challenging environment in the airline industry.
pROFITAbILITy
In its 24th consecutive year of profitable operations, Emirates profit attributable to the Owner stood at AED 1,502 million, 72.1% lower than last year’s record profit of AED 5,375 million. Despite a healthy growth in revenues, Emirates result was adversely impacted by an increased jet fuel bill due to significantly higher rates.
Emirates profit margin at 2.4% (2010-11: 9.9%) represented a positive result in a challenging year marked by the significant increase in jet fuel cost, political unrest in the Middle East and African regions and volatile exchange rates due to the global economic situation.
Emirates operating profit, lower at AED 1,813 million (2010-11: AED 5,443 million), was the result of operating costs growing faster than the increase in revenues. This resulted in an operating margin of 2.9% (2010-11: 10%).
Consequently, the return on shareholder’s funds was impacted in these difficult economic conditions and stood at 7.2% (2010-11: 28.4%).
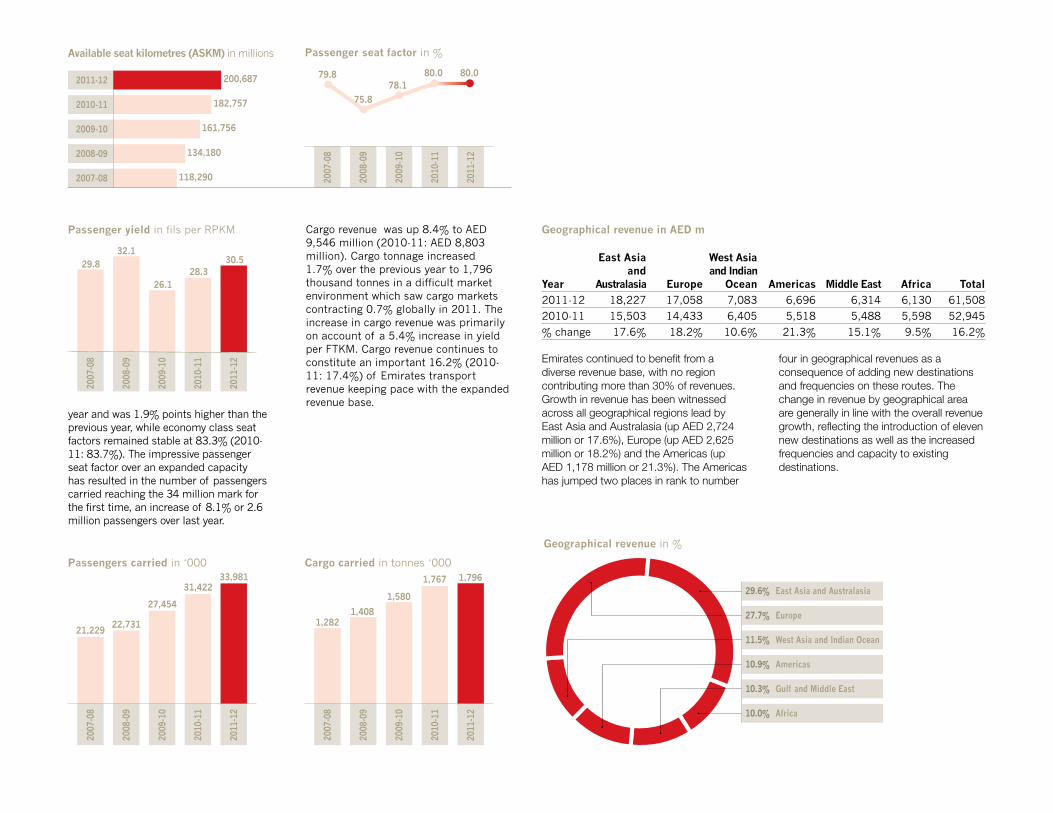
Revenue crossed the AED 60 billion mark for the first time growing 16.2% to AED 61,508 million (2010-11: AED 52,945 million). Transport revenue rose faster than the growth in capacity buoyed by a robust increase in passenger revenue and stood at AED 58,828 million, an improvement of 16.5% over the last financial year (2010-11: AED 50,511 million). Passenger (including excess baggage) and cargo revenue continued to account for 95.6% (2010-11: 95.4%) of total revenue.
Passenger revenue surged 18.2% or AED 7,535 million over the previous year to AED 48,950 million, the result of a 9.8% growth in RPKM and a 7.7% higher yield per RPKM. Passenger seat factor at 80% matching exactly last year’s figure was an achievement in itself given a 9.8% increase in ASKMs. Premium class seat factor continued its upward trend for a second
eMIRATes
FINANCIAL COMMENTARY
44
Profit margin in %
2007
-08
2008
-09
2009
-10
2011
-12
2010
-11
12.9
1.6 2.4
9.98.1
Return on shareholder’s funds in %
33.8
4.4 7.2
28.421.6
2007
-08
2008
-09
2009
-10
2011
-12
2010
-11
Operating profit in AED m
4,451
2,278
5,443
3,565
2007
-08
2008
-09
2009
-10
2010
-11
1,813
2011
-12
Development of revenue in AED bn
36.442.5
52.9
42.5
2007
-08
2008
-09
2009
-10
2010
-11
61.5
2011
-12
ReveNue 2011-12 2010-11 % change AED m AED m
Passenger 48,950 41,415 18.2
Cargo 9,546 8,803 8.4
Excess baggage 332 293 13.3 Transport revenue 58,828 50,511 16.5
Sale of goods 2,017 1,774 13.7
Destination and leisure 245 226 8.4
Other 418 434 (3.7) Total 61,508 52,945 16.2
Profit attributable to the Owner in AED m
5,020
686
5,375
3,538
2007
-08
2008
-09
2009
-10
2010
-11
1,502
2011
-12
Passenger seat factor in %
79.8
75.8
80.080.078.1
2007
-08
2008
-09
2009
-10
2011
-12
2010
-11
Geographical revenue in AeD m
east Asia West Asia and and Indian year Australasia europe Ocean Americas Middle east Africa Total
2011-12 18,227 17,058 7,083 6,696 6,314 6,130 61,508
2010-11 15,503 14,433 6,405 5,518 5,488 5,598 52,945
% change 17.6% 18.2% 10.6% 21.3% 15.1% 9.5% 16.2%
Geographical revenue in %
29.6% East Asia and Australasia
27.7% Europe
11.5% West Asia and Indian Ocean
10.9% Americas
10.3% Gulf and Middle East
10.0% Africa
1,2821,408
1,767
1,580
Cargo carried in tonnes ‘000
2007
-08
2008
-09
2009
-10
2010
-11
1,796
2011
-12
year and was 1.9% points higher than the previous year, while economy class seat factors remained stable at 83.3% (2010-11: 83.7%). The impressive passenger seat factor over an expanded capacity has resulted in the number of passengers carried reaching the 34 million mark for the first time, an increase of 8.1% or 2.6 million passengers over last year.
Emirates continued to benefit from a diverse revenue base, with no region contributing more than 30% of revenues. Growth in revenue has been witnessed across all geographical regions lead by East Asia and Australasia (up AED 2,724 million or 17.6%), Europe (up AED 2,625 million or 18.2%) and the Americas (up AED 1,178 million or 21.3%). The Americas has jumped two places in rank to number
four in geographical revenues as a consequence of adding new destinations and frequencies on these routes. The change in revenue by geographical area are generally in line with the overall revenue growth, reflecting the introduction of eleven new destinations as well as the increased frequencies and capacity to existing destinations.
Passenger yield in fils per RPKM
29.832.1
28.326.1
2007
-08
2008
-09
2009
-10
2010
-11
30.5
2011
-12
Passengers carried in ‘000
21,22922,731
31,422
27,454
2007
-08
2008
-09
2009
-10
2010
-11
33,981
2011
-12
Cargo revenue was up 8.4% to AED 9,546 million (2010-11: AED 8,803 million). Cargo tonnage increased 1.7% over the previous year to 1,796 thousand tonnes in a difficult market environment which saw cargo markets contracting 0.7% globally in 2011. The increase in cargo revenue was primarily on account of a 5.4% increase in yield per FTKM. Cargo revenue continues to constitute an important 16.2% (2010-11: 17.4%) of Emirates transport revenue keeping pace with the expanded revenue base.
2011-12 200,687
Available seat kilometres (ASKM) in millions
118,290
134,180
2007-08
2008-09
2009-10
2010-11 182,757
161,756

eMIRATes46
Unit costs in fils per ATKM
101 10495 9794
151163
147166136
2007
-08
2008
-09
2009
-10
2011
-12
2010
-11
Employee cost as % of total operating costs
2011-12 13.1 86.9
2007-08
2008-09
2009-10
2010-11
15.9
14.3
15.6
84.1
85.7
84.4
15.9 84.1
Employee cost Operating costs
Unit cost Unit cost excluding jet fuel
expeNDITuRe
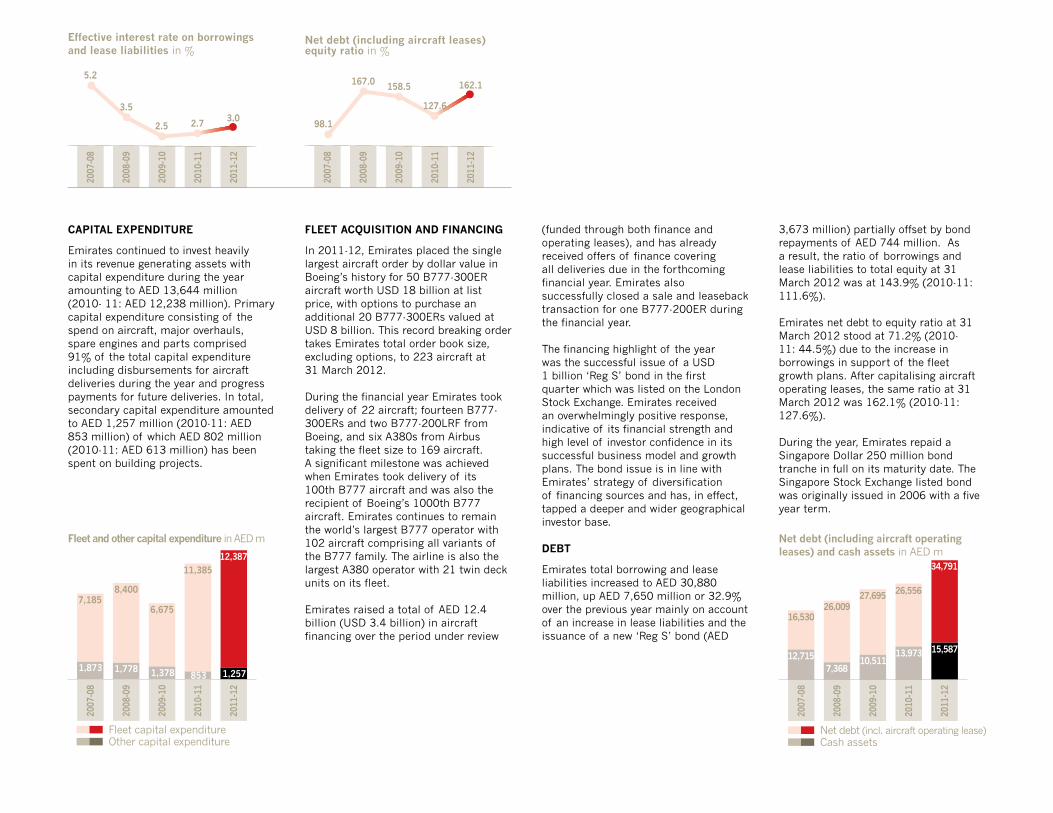
Emirates operating costs rose faster than the growth in revenue and at AED 60,474 million were 24% or AED 11,686 million higher than the previous year predominantly on account of substantially higher jet fuel costs and airline direct operating costs. The proportion of jet fuel costs to total operating cost at 40.2% is the highest in Emirates’ history, well over the previous high of 35.2% witnessed in 2008-09.
Airline employee numbers grew 11.2% on the back of a 10.6% growth in capacity. Overall employee costs were up 4.2% or AED 321 million which is not proportionate to the increase in employee numbers mainly due to a higher charge in the last financial year towards the Emirates Group employee profit share scheme. This second largest
cost element of Emirates constituted 13.1% of operating costs (2010-11: 15.6%).
The rise in direct operating costs (handling, in-flight costs, overflying, landing and parking and aircraft maintenance) of AED 1,656 million or 18.3% was on account of rate increases and an increase in activity levels. The 23% increase in in-flight catering costs
was also the result of upgrading the product offering. The higher depreciation charge (up AED 453 million or 12.6%) is mainly on account of an increase in aircraft fleet and related assets. In addition, corporate overhead expenses were up AED 892 million primarily from accounting for currency exchange losses, higher credit card related charges from a growth in on-lines sales and added training costs for flight deck crew.
Jet fuel costs at AED 24,292 million (2010-11: AED 16,820 million) comprised the highest ever share of operating costs at 40.2% (2010-11: 34.5%). The increase in cost is the result of a 31.9% escalation in average jet fuel price per US gallon and a 9.5% increase in quantity uplifts. These factors have resulted in a 30.5% increase in fuel cost per ATKM.
The increase in jet fuel costs has impacted the unit cost of the airline which has grown significantly by 12.4% to 166 fils per ATKM (2010-11: 147 fils per ATKM). Excluding jet fuel costs, unit costs have marginally increased by 2.4% to 97 fils per ATKM (2010-11: 95 fils per ATKM).
Operating costs 2011-12 2010-11 % change 2011-12 % of operating AED m AED m costsJet fuel 24,292 16,820 44.4 40.2Employee 7,936 7,615 4.2 13.2Aircraft operating leases 4,788 4,317 10.9 7.9Depreciation 4,053 3,600 12.6 6.7Sales and marketing 4,023 3,862 4.2 6.7Handling 3,584 3,137 14.2 5.9In-flight catering and related costs 2,836 2,305 23.0 4.7Overflying 1,878 1,620 15.9 3.1Office accommodation and IT costs 1,450 1,281 13.2 2.4Aircraft maintenance 1.296 1,030 25.8 2.1Landing and parking 1,128 974 15.8 1.9Cost of goods sold 926 839 10.4 1.5Amortisation 81 77 5.2 0.1Corporate overheads 2,203 1,311 68.0 3.6 Total operating costs 60,474 48,788 24.0 100.0
Operating costs in AED m
34,359
40,988
48,788
39,890
2007
-08
2008
-09
2009
-10
2010
-11
60,474
2011
-12
Jet fuel cost as % of operating cost
32.0 35.2 40.2
68.0 64.8 59.8
34.5
65.5
29.9
70.1
2007
-08
2008
-09
2009
-10
2011
-12
2010
-11
Jet fuel cost Other operating cost

The airline’s capacity measured in terms of ATKM rose 10.6% to 35,467 million tonne-kilometers (2010-11: 32,057 million tonne-kilometers) with the resultant traffic or RTKM growing at a slower pace to 23,672 million tonne-kilometers (2010-11: 22,078 million tonne-kilometers). Consequently the overall load factor achieved was 66.7% which is 2.2 percentage points lower than the previous year (2010-11: 68.9%) reflecting the moderate growth in cargo tonnage.
With 21 flagship A380 aircraft in the fleet at 31 March 2012, Emirates continues to be the largest operator of this superjumbo. With the aircraft returning load and seat factors well
above the network average, both in the premium and economy cabins, the A380 fleet remains the aircraft of choice amongst our discerning customers. The A380 fleet now serves a total of fifteen destinations on our network.
Four new airport lounges were opened across the network in San Francisco, Istanbul, Colombo and a fourth new lounge in Dubai. This takes the total number of Emirates dedicated airport lounges to 32.
Aircraft departures increased by 6.2% to 142,129 (2010-11: 133,772) with the increase in traffic coming principally from:• introduction of new passenger services
to eleven new destinations – Geneva and Copenhagen launched in the first half; St. Petersburg, Baghdad, Rio de Janeiro, Buenos Aires, Dublin, Lusaka, Harare, Dallas and Seattle launched in the second half of the financial year.
• increased frequencies to several existing destinations, including Manchester, Hamburg, Frankfurt, Hong Kong, Khartoum, Lahore and Tunis.
• increased capacity to several existing destinations with bigger aircraft mainly Luanda, Zurich, Madrid, Milan as well as A380 services to Munich, Rome, Shanghai, Kuala Lumpur and Johannesburg.
2011-12 122
Destination cities
99
99
2007-08
2008-09
2009-10
2010-11 111
102
CApACITy, TRAFFIC AND LOAD FACTOR
2011-12 2010-11 % change
Capacity (ATKM) million 35,467 32,057 10.6
Load carried (RTKM) million 23,672 22,078 7.2
Load factor % 66.7 68.9 (2.2) pts
Break even load factor % 65.9 63.6 2.3 pts
Overall and breakeven load factor in %
2007
-08
2008
-09
2009
-10
2010
-11
64.1
66.865.1
64.1 63.6
68.9
2011
-12
65.9
66.7
64.4
66.8
Breakeven load factor Overall load factor
Available tonne kilometres (ATKM)in millions and number of aircraft
22,07824,397
32,05728,526109
127
14814220
07-0
8
2008
-09
2009
-10
2010
-11
35,467
169
2011
-12
Available tonne kilometres (ATKM) Number of aircraft
Aircraft departures
101,709109,477
133,772123,055
2007
-08
2008
-09
2009
-10
2010
-11
142,129
2011
-12

eMIRATes48
EBITDAR margin in %
25.1
19.2
24.824.5
2007
-08
2008
-09
2009
-10
2010
-11
17.2
2011
-12
CAsh pOsITION
Emirates generated AED 8,107 million (2010-11: AED 11,004 million) of cash from operating activities, impacted by the lower profitability. However this must be considered against the backdrop of the record AED 11,004 million achieved last year and it remains as the third highest cash ever generated from operating activities in Emirates’ history. As a consequence, the operating cash margin stood at 13.0% (2010-11: 20.3%).
Cash generated from operations was adequate to finance the investment in property, plant and equipment of AED 6,800 million and along with the additional AED 4,278 million invested in short terms bank deposits constituted the majority of the AED 10,566 million (2010-11: AED 5,092 million) net cash used in investing activities. The lower AED 201 million (2010-11: AED 5,046 million) net cash used in financing activities was the result of the proceeds from the US Dollar bond issue offsetting the cash used in this activity.
As a result, cash assets which include short term bank deposits were up by AED 1,614 million or 11.6% to a healthy AED 15,587 million at 31 March 2012 and are expected to be sufficient to cover all requirements due in the next financial year when supplemented by our aircraft and corporate financing programme. The available cash balance represents a healthy and stable ratio of cash assets to revenue and other operating income at 25% (2010-11: 25.8%).
Emirates cash profit from operations (or EBITDAR) for the year ended 31 March 2012 was AED 10,735 million or 17.2 % of revenue and other operating income. Although down from the record highs of the previous year (2010-11: AED 13,437 million), it remains the second highest level ever achieved. EBITDAR for the year equated to more than 12 months of debt service and lease rentals, including periodic principal and interest payments on aircraft financing and bond issues.
Cash generated from operating activities in AED m
7,335
5,016
11,004
8,328
2007
-08
2008
-09
2009
-10
2010
-11
8,107
2011
-12
Cash assets in AED m
12,715
7,368
15,587
10,511
2007
-08
2008
-09
2009
-10
2011
-12
13,973
2010
-11
EBITDAR in AED m
9,7308,286
13,437
10,638
2007
-08
2008
-09
2009
-10
2010
-11
10,735
2011
-122,660
201
10,566
8,107
Cash flow in AED m
Net increase in cash and cash equivalents andshort term bank deposits
Net cash used in financing activ ties
Net cash used ininvesting activ ties
Net cash generated fromoperating activ ties
InflowUtlisation
Operating cash margin in %
18.9
11.6
20.319.2
2007
-08
2008
-09
2009
-10
2010
-11
13.0
2011
-12
Effective interest rate on borrowingsand lease liabilities in %
5.2
3.5
2.72.5
2007
-08
2008
-09
2009
-10
2010
-11
3.0
2011
-12
Net debt (including aircraft leases)equity ratio in %
98.1
167.0
127.6
158.5
2007
-08
2008
-09
2009
-10
2010
-11
162.1
2011
-12
Net debt (including aircraft operatingleases) and cash assets in AED m
16,53026,009
26,556
12,7157,368
13,973
27,695
10,511
2007
-08
2008
-09
2009
-10
2010
-11
34,791
15,587
2011
-12
Fleet capital expenditure Other capital expenditure
Net debt (incl. aircraft operating lease) Cash assets
CApITAL expeNDITuRe
Emirates continued to invest heavily in its revenue generating assets with capital expenditure during the year amounting to AED 13,644 million (2010- 11: AED 12,238 million). Primary capital expenditure consisting of the spend on aircraft, major overhauls, spare engines and parts comprised 91% of the total capital expenditure including disbursements for aircraft deliveries during the year and progress payments for future deliveries. In total, secondary capital expenditure amounted to AED 1,257 million (2010-11: AED 853 million) of which AED 802 million (2010-11: AED 613 million) has been spent on building projects.
FLeeT ACquIsITION AND FINANCING
In 2011-12, Emirates placed the single largest aircraft order by dollar value in Boeing’s history for 50 B777-300ER aircraft worth USD 18 billion at list price, with options to purchase an additional 20 B777-300ERs valued at USD 8 billion. This record breaking order takes Emirates total order book size, excluding options, to 223 aircraft at 31 March 2012.
During the financial year Emirates took delivery of 22 aircraft; fourteen B777-300ERs and two B777-200LRF from Boeing, and six A380s from Airbus taking the fleet size to 169 aircraft. A significant milestone was achieved when Emirates took delivery of its 100th B777 aircraft and was also the recipient of Boeing’s 1000th B777 aircraft. Emirates continues to remain the world’s largest B777 operator with 102 aircraft comprising all variants of the B777 family. The airline is also the largest A380 operator with 21 twin deck units on its fleet.
Emirates raised a total of AED 12.4 billion (USD 3.4 billion) in aircraft financing over the period under review
(funded through both finance and operating leases), and has already received offers of finance covering all deliveries due in the forthcoming financial year. Emirates also successfully closed a sale and leaseback transaction for one B777-200ER during the financial year.
The financing highlight of the year was the successful issue of a USD 1 billion ‘Reg S’ bond in the first quarter which was listed on the London Stock Exchange. Emirates received an overwhelmingly positive response, indicative of its financial strength and high level of investor confidence in its successful business model and growth plans. The bond issue is in line with Emirates’ strategy of diversification of financing sources and has, in effect, tapped a deeper and wider geographical investor base.
DebT
Emirates total borrowing and lease liabilities increased to AED 30,880 million, up AED 7,650 million or 32.9% over the previous year mainly on account of an increase in lease liabilities and the issuance of a new ‘Reg S’ bond (AED
3,673 million) partially offset by bond repayments of AED 744 million. As a result, the ratio of borrowings and lease liabilities to total equity at 31 March 2012 was at 143.9% (2010-11: 111.6%).
Emirates net debt to equity ratio at 31 March 2012 stood at 71.2% (2010-11: 44.5%) due to the increase in borrowings in support of the fleet growth plans. After capitalising aircraft operating leases, the same ratio at 31 March 2012 was 162.1% (2010-11: 127.6%).
During the year, Emirates repaid a Singapore Dollar 250 million bond tranche in full on its maturity date. The Singapore Stock Exchange listed bond was originally issued in 2006 with a five year term.
Fleet and other capital expenditure in AED m
7,1858,400
12,387
6,675
1,873 1,778 1,2571,378
2007
-08
2008
-09
2009
-10
2011
-12
11,385
853
2010
-11

Revenue per airline employee in AED ‘000
1,7962011-12
1,625
1,492
1,738
1,459
2007-08
2008-09
2009-10
2010-11
Capacity per airline employee in ATKM ‘000
1,0542011-12
934
870
1,059
994
2007-08
2008-09
2009-10
2010-11
eMIRATes50
CuRReNCy, INTeResT RATe RIsk AND FueL pRICe RIsk
Emirates continued to target a balanced portfolio approach, whilst still taking advantage of market movements, with a view to hedging around half of its interest rate and currency risk exposures, using prudent hedging solutions including swaps and options. Emirates borrowings and lease liabilities (net of cash) including aircraft operating leases, at 31 March 2012, comprised 89% on a fixed interest rate basis with the balance 11% on floating interest rates.
A one percentage point increase in interest rates would increase the interest charge and the operating lease charge (net of interest income) during the next financial year by AED 28.8 million (2010-11: AED 26 million). At 31 March 2012, Emirates borrowings and lease liabilities carried an effective interest rate of 3.0% (2010-11: 2.7%).
Emirates proactively managed its currency exposure by using prudent hedging solutions including currency swaps, options and natural hedges through outflows denominated in Pound sterling, Euro, Australian dollars, New Zealand dollars, Japanese yen, Indian rupees and South African rand. For the year ended 31 March 2012, hedging coverage in these currencies were between 27% and 50%.
Jet fuel cost is Emirates’ most significant operating cost, accounting for 40.2% and 34.5% of the total operating costs in its 2012 and 2011 financial years respectively. Emirates has a dynamic approach to managing fuel price risk based upon a continuous assessment of the market. During the 2012 financial year the strategy was to remain largely un-hedged, reflecting a view that the balance of risk was considered greater to the downside given historically high price levels and the backdrop of global economic uncertainty.
eMpLOyee sTReNGTh AND pRODuCTIvITy
The average workforce rose by 3,625 or 9.3% to 42,422.
The average number of employees in the airline grew by 3,376 (11.2%) to 33,634 with the bulk of the growth coming from
cabin and flight deck crew, the result of adding 22 aircraft to the fleet including the additional crew complement necessary to operate to four new ultra-long haul destinations. The growth in airline staff based at the outstations was primarily the result of adding eleven new destinations during the year.
Productivity figures are impacted in part due to the ramp up in staff numbers to cater to the growth which came mainly in the second half of the financial year and the substantial growth planned for the next financial year. Employee productivity for the airline, measured in terms of revenue per employee rose 3.3% to AED 1.8 million (2010-11: AED 1.7 million), while capacity per airline employee was flat at ATKM 1,054 thousand (2010-11: ATKM 1,059 thousand). The load carried per airline employee stood at RTKM 704 thousand (2010-11: RTKM 730 thousand).
Fixed vs floating interest rate ratio in %
6861
1132 3989
17
83
2007
-08
2008
-09
2009
-10
2010
-11
1189
2011
-12
Average workforce
6,527
7,7758,539
23,65028,037
30,258
7,966
28,686
2007
-08
2008
-09
2009
-10
2010
-11
8,788
33,634
2011
-12
Fixed interest debt Floating interest debt
2011-12 2010-11uAe
Cabin crew 13,277 11,715
Flight deck crew 2,845 2,434
Engineering 2,241 2,083
Other 9,911 9,086
28,274 25,318
Overseas stations 5,360 4,940
Total emirates 33,634 30,258
subsidiary companies 8,788 8,539
Average employee strength 42,422 38,797
Employees in Emirates Employees in subsidiaries
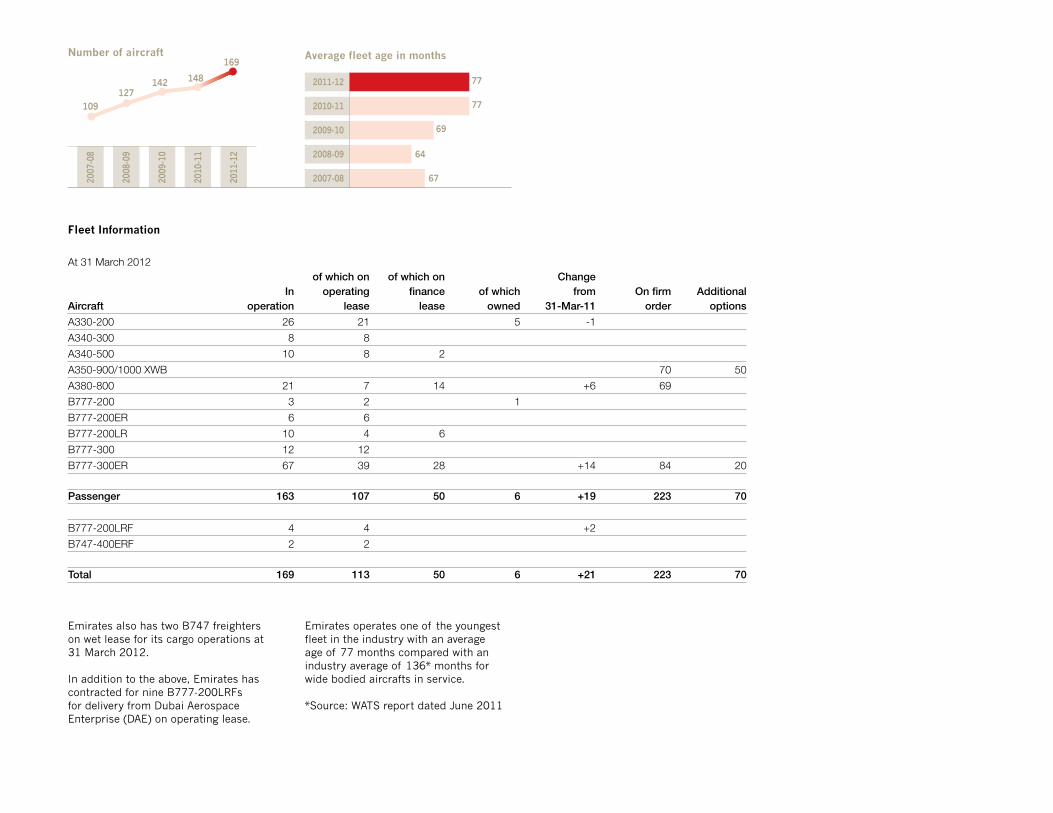
Emirates also has two B747 freighters on wet lease for its cargo operations at 31 March 2012.
In addition to the above, Emirates has contracted for nine B777-200LRFs for delivery from Dubai Aerospace Enterprise (DAE) on operating lease.
Emirates operates one of the youngest fleet in the industry with an average age of 77 months compared with an industry average of 136* months for wide bodied aircrafts in service.
*Source: WATS report dated June 2011
Number of aircraft
109127
14814220
07-0
8
2008
-09
2009
-10
2010
-11
169
2011
-12
Average fleet age in months
772011-12
67
64
77
69
2007-08
2008-09
2009-10
2010-11
Fleet Information
At 31 March 2012 of which on of which on Change In operating finance of which from On firm AdditionalAircraft operation lease lease owned 31-Mar-11 order options
A330-200 26 21 5 -1
A340-300 8 8
A340-500 10 8 2
A350-900/1000 XWB 70 50
A380-800 21 7 14 +6 69
B777-200 3 2 1
B777-200ER 6 6
B777-200LR 10 4 6
B777-300 12 12
B777-300ER 67 39 28 +14 84 20
Passenger 163 107 50 6 +19 223 70
B777-200LRF 4 4 +2
B747-400ERF 2 2
Total 169 113 50 6 +21 223 70
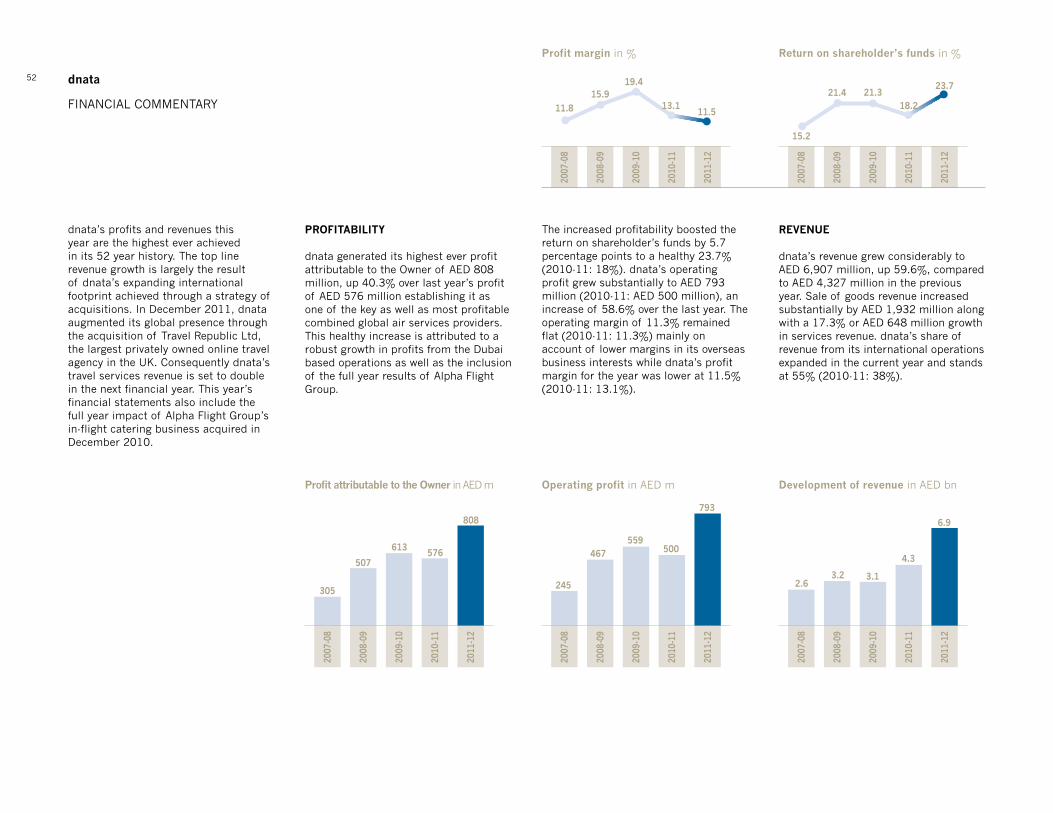
dnata
FINANCIAL COMMENTARY
52
Profit margin in %
11.8
15.913.1
19.4
2007
-08
2008
-09
2009
-10
2010
-11
11.5
2011
-12
Return on shareholder’s funds in %
15.2
21.418.2
21.3
2007
-08
2008
-09
2009
-10
2010
-11
23.7
2011
-12
dnata’s profits and revenues this year are the highest ever achieved in its 52 year history. The top line revenue growth is largely the result of dnata’s expanding international footprint achieved through a strategy of acquisitions. In December 2011, dnata augmented its global presence through the acquisition of Travel Republic Ltd, the largest privately owned online travel agency in the UK. Consequently dnata’s travel services revenue is set to double in the next financial year. This year’s financial statements also include the full year impact of Alpha Flight Group’s in-flight catering business acquired in December 2010.
pROFITAbILITy
dnata generated its highest ever profit attributable to the Owner of AED 808 million, up 40.3% over last year’s profit of AED 576 million establishing it as one of the key as well as most profitable combined global air services providers. This healthy increase is attributed to a robust growth in profits from the Dubai based operations as well as the inclusion of the full year results of Alpha Flight Group.
The increased profitability boosted the return on shareholder’s funds by 5.7 percentage points to a healthy 23.7% (2010-11: 18%). dnata’s operating profit grew substantially to AED 793 million (2010-11: AED 500 million), an increase of 58.6% over the last year. The operating margin of 11.3% remained flat (2010-11: 11.3%) mainly on account of lower margins in its overseas business interests while dnata’s profit margin for the year was lower at 11.5% (2010-11: 13.1%).
ReveNue
dnata’s revenue grew considerably to AED 6,907 million, up 59.6%, compared to AED 4,327 million in the previous year. Sale of goods revenue increased substantially by AED 1,932 million along with a 17.3% or AED 648 million growth in services revenue. dnata’s share of revenue from its international operations expanded in the current year and stands at 55% (2010-11: 38%).
Profit attributable to the Owner in AED m
305
507576
613
2007
-08
2008
-09
2009
-10
2010
-11
808
2011
-12
Operating profit in AED m
245
467 500559
2007
-08
2008
-09
2009
-10
2010
-11
793
2011
-12
Development of revenue in AED bn
2.63.2 3.1
4.3
2007
-08
2008
-09
2009
-10
2010
-11
6.9
2011
-12
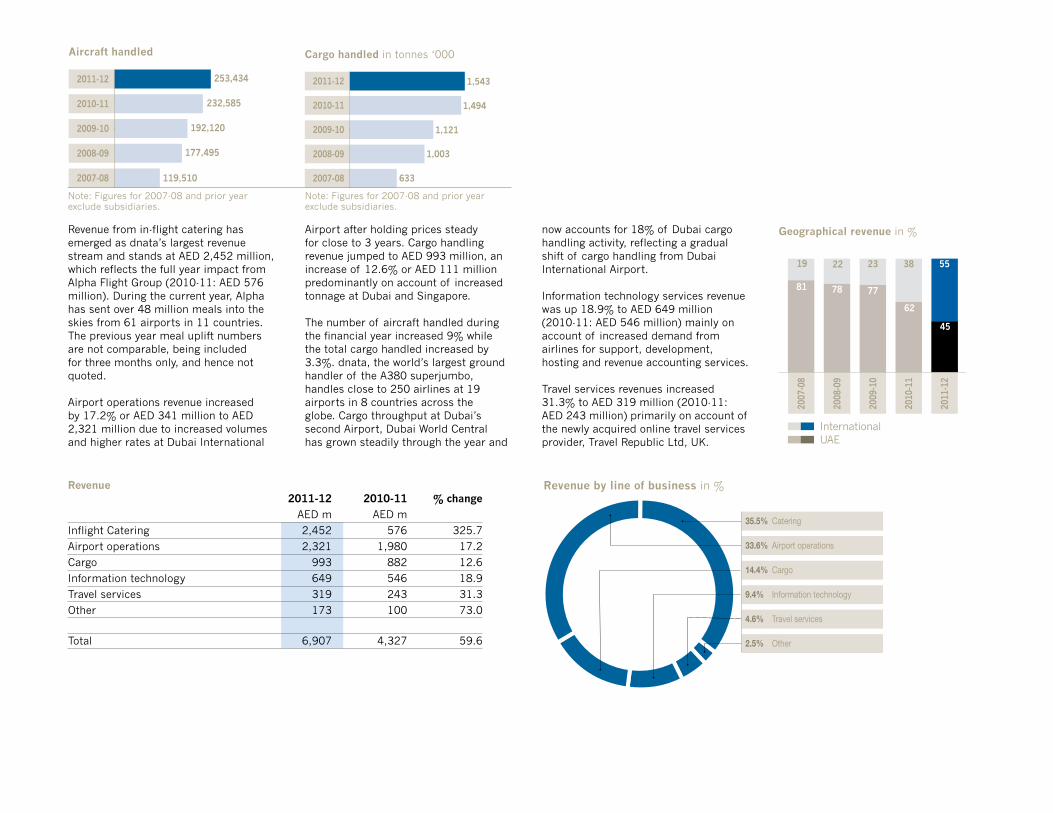
2010-11
Aircraft handled
119,510
177,495
2007-08
2008-09
2009-10 192,120
232,585
2011-12 253,434
633
1,003
1,494
1,121
Cargo handled in tonnes ‘000
2010-11
1,5432011-12
2007-08
2008-09
2009-10
Note: Figures for 2007-08 and prior year exclude subsidiaries.
Note: Figures for 2007-08 and prior year exclude subsidiaries.
Revenue from in-flight catering has emerged as dnata’s largest revenue stream and stands at AED 2,452 million, which reflects the full year impact from Alpha Flight Group (2010-11: AED 576 million). During the current year, Alpha has sent over 48 million meals into the skies from 61 airports in 11 countries. The previous year meal uplift numbers are not comparable, being included for three months only, and hence not quoted.
Airport operations revenue increased by 17.2% or AED 341 million to AED 2,321 million due to increased volumes and higher rates at Dubai International
Airport after holding prices steady for close to 3 years. Cargo handling revenue jumped to AED 993 million, an increase of 12.6% or AED 111 million predominantly on account of increased tonnage at Dubai and Singapore.
The number of aircraft handled during the financial year increased 9% while the total cargo handled increased by 3.3%. dnata, the world’s largest ground handler of the A380 superjumbo, handles close to 250 airlines at 19 airports in 8 countries across the globe. Cargo throughput at Dubai’s second Airport, Dubai World Central has grown steadily through the year and
now accounts for 18% of Dubai cargo handling activity, reflecting a gradual shift of cargo handling from Dubai International Airport.
Information technology services revenue was up 18.9% to AED 649 million (2010-11: AED 546 million) mainly on account of increased demand from airlines for support, development, hosting and revenue accounting services.
Travel services revenues increased 31.3% to AED 319 million (2010-11: AED 243 million) primarily on account of the newly acquired online travel services provider, Travel Republic Ltd, UK.
Revenue 2011-12 2010-11 % change
AED m AED m
Inflight Catering 2,452 576 325.7
Airport operations 2,321 1,980 17.2
Cargo 993 882 12.6
Information technology 649 546 18.9
Travel services 319 243 31.3
Other 173 100 73.0
Total 6,907 4,327 59.6
Revenue by line of business in %
35.5% Catering
33.6% Airport operations
14.4% Cargo
9.4% Information technology
4.6% Travel services
2.5% Other
Geographical revenue in %
81 78
3819 22
62
23
77
2007
-08
2008
-09
2009
-10
2010
-11
55
45
2011
-12
International UAE

54
2,340
2,714
3,906
2,601
Operating costs in AED m
2010-11
6,2072011-12
2007-08
2008-09
2009-10
45.7 54.32011-12
Employee costs as % of total operating costs
47.652.4
50.449.6
52.0 48.0
53.3 46.7
2010-11
2007-08
2008-09
2009-10
Employee cost Operating costs
expeNDITuRe
dnata’s operating costs at AED 6,207 million were up 58.9% or AED 2,301 million (2010-11: AED 3,906 million) principally on account of the full year impact from Alpha Flight Group and the newly acquired travel services business. There was also a general increase in costs in line with the increase in revenues.
Employee costs at AED 2,838 million (2010-11: AED 2,032 million) continue to dominate and comprised 45.7% (2010-11: 52.0%) of dnata’s operating costs. The increase in employee costs of AED 806 million primarily results from the full year impact of 4,500 employees in Alpha Flight Group. Employee costs at the Singapore and Switzerland operations were up 30% on average, while Dubai employee costs grew moderately by 6.1% mainly due to
a higher charge in the last financial year towards the Emirates Group employee profit share scheme.
The AED 120 million or 20.6% increase in airport operations and cargo – other direct costs to AED 702 million primarily reflects additional costs incurred in line with our commitment to further enhance service quality for our customers at Dubai International Airport as well as increase in activity levels in Singapore.
The increase in the cost of goods sold, AED 868 million, resulted from the full year impact of the catering business while the increase in office accommodation costs (AED 166 million) and corporate overheads (AED 182 million) stems primarily from the full year impact of Alpha Flight as well as the inclusion of Travel Republic.
Operating costs 2011-12 2010-11 % change
AED m AED m
Employee 2,838 2,032 39.7
Cost of goods sold 1,109 241 360.2
Airport operations and cargo - other direct costs 702 582 20.6
Office accommodation 382 216 76.9
Depreciation and amortisation 347 260 33.5
Information technology infrastructure costs 264 198 33.3
Operating lease rentals 59 53 11.3
Corporate overheads 506 324 56.2
Total 6,207 3,906 58.9
Operating costs in %
45.7% Employee
17.9% Cost of goods sold
11.3% Airport operations and cargo - other direct costs
8.2% Corporate overheads
6.2% Office accommodation
5.5% Depreciation and amortisation
4.3% Information technology infrastructure costs
0.9% Operating lease rentals
dnata

CAsh pOsITION
dnata’s cash generated from operating activities is significantly higher by 29.5% at AED 1,167 million (2010-11: AED 901 million) on account of the increase in profitability.
Operating cash margin remained strong at 16.7%, though lower than the previous year (2010-11: 20.4%) on
account of the strong top line growth in revenues.
Cash assets also remained robust at AED 1,999 million (2010-11: AED 2,083 million) despite payouts of AED 243 million towards the acquisition of the travel services business, dividend of AED 500 million to the Owner as well as AED 135 million towards the previous years’ profit share to employees.
eMpLOyee sTReNGTh AND pRODuCTIvITy
During the year in review, the average workforce increased by 2,304 or 12.8% to 20,275. The average staff count of the Dubai operation rose 14% to 10,879 (2010-11: 9,544) while the average number of employees in the subsidiaries grew 11.4% to 9,396. As a consequence, 46.3% (2010-11: 46.9%) of the workforce is based internationally, outside Dubai.
Productivity measured in terms of revenue per employee has risen 9.3% to AED 353 thousand from AED 323 thousand in 2010-11. The number for the current year has been normalised due to the addition of Travel Republic in Dec 2011.
A breakdown of the average number of employees by category is as follows:
The number of aircraft handled during the year increased 9% to 253,434 (2010-11: 232,585). The growth stems from a 9% growth in aircraft handled at Dubai International Airport and a 23.2% growth in Singapore. Productivity measured in terms of man hours per aircraft turn stood at 132 (2010-11: 122), impacted by additional man hours deployed at Dubai to enhance the quality of service.
Cargo handled during the year grew at a slower pace due to the global economic situation and was up 3.3% to 1,543 thousand tonnes (2010-11: 1,494 thousand tonnes) mainly from increased volumes in Dubai and Singapore. Productivity measured in terms of cargo handled per man hour rose marginally by 2.1% to 289 kgs (2010-11: 283 kgs).
241
256
323
266
Revenue per employee in AED ‘000
2010-11
3532011-12
2007-08
2008-09
2009-10
Operating cash margin in %
20.9
15.1
20.4
24.220
07-0
8
2008
-09
2009
-10
2010
-11
16.7
2011
-12
Note: Figures for 2007-08 and prior year exclude subsidiaries.
employee strength
2011-12 2010-11Airport operations 7,461 6,300 Cargo handling 914 847 Information technology 1,214 1,084 Travel services 790 799 Other 500 514
Total dnata (parent co.) 10,879 9,544
Subsidiaries 9,396 8,427
Average employee strength 20,275 17,971Cash generated from
operating activities in AED m
540481
901
764
2007
-08
2008
-09
2009
-10
2010
-11
1,167
2011
-12
Cash assets in AED m
1,383 1,350
2,0831,982
2007
-08
2008
-09
2009
-10
2010
-11
1,999
2011
-12
Average workforce
2,667 2,580
8,427
8,973 9,854 9,544
3,673
9,625
2007
-08
2008
-09
2009
-10
2010
-11
9,396
10,879
2011
-12
Employees in dnata Employees in subsidiaries

Report on the consolidated financial statements
We have audited the accompanying consolidated financial statements of Emirates and its subsidiaries (together referred to as “Emirates”), which comprise the consolidated statement of financial position as of 31 March 2012 and the consolidated income statement, consolidated statement of comprehensive income, consolidated statement of changes in equity and consolidated statement of cash flows for the year then ended, and a summary of significant accounting policies and other explanatory notes.
Management’s responsibility for the consolidated financial statements
Management is responsible for the preparation and fair presentation of these consolidated financial statements in accordance with International Financial Reporting Standards, and for such internal control as management determines is necessary to enable the preparation of consolidated financial statements that are free from material misstatement, whether due to fraud or error.
Auditor’s responsibility
Our responsibility is to express an opinion on these consolidated financial statements based on our audit. We conducted our audit in accordance with International Standards on Auditing. Those Standards require that we comply with ethical requirements and plan and perform the audit to obtain reasonable assurance whether the consolidated financial statements are free from material misstatement.
An audit involves performing procedures to obtain audit evidence about the amounts and disclosures in the consolidated financial statements. The procedures selected depend on the auditor’s judgement, including the assessment of the risks of material misstatement of the consolidated financial statements, whether due to fraud or error.
In making those risk assessments, the auditor considers internal control relevant to the entity’s preparation and fair presentation of the consolidated financial statements in order to design audit procedures that are appropriate in the circumstances, but not for the purpose of expressing an opinion on the effectiveness of the entity’s internal control. An audit also includes evaluating the appropriateness of accounting policies used and the reasonableness of accounting estimates made by management, as well as evaluating the overall presentation of the consolidated financial statements.
We believe that the audit evidence we have obtained is sufficient and appropriate to provide a basis for our audit opinion.
Opinion
In our opinion, the accompanying consolidated financial statements present fairly, in all material respects, the financial position of Emirates as of 31 March 2012, and its financial performance and its cash flows for the year then ended in accordance with International Financial Reporting Standards.
PricewaterhouseCoopers2 May 2012
Warwick HuntRegistered Auditor Number 643 Dubai, United Arab Emirates
eMIRATes
INDEPENDENT AUDITOR’S REPORT TO THE OWNER OF EMIRATES
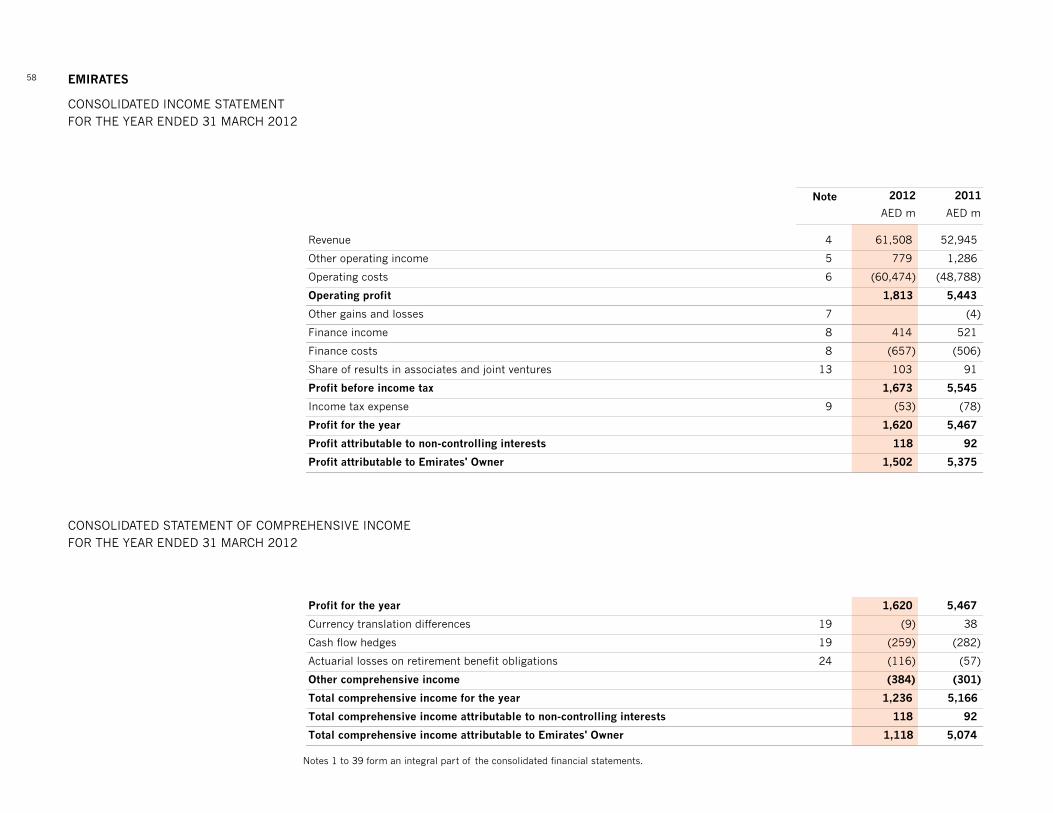
eMIRATes
CONSOLIDATED INCOME STATEMENTFOR THE YEAR ENDED 31 MARCH 2012
CONSOLIDATED STATEMENT OF COMPREHENSIVE INCOMEFOR THE YEAR ENDED 31 MARCH 2012
58
Notes 1 to 39 form an integral part of the consolidated financial statements.
Note 2012 2011
AED m AED m
Revenue 4 61,508 52,945
Other operating income 5 779 1,286
Operating costs 6 (60,474) (48,788)
Operating profit 1,813 5,443
Other gains and losses 7 (4)
Finance income 8 414 521
Finance costs 8 (657) (506)
Share of results in associates and joint ventures 13 103 91
Profit before income tax 1,673 5,545
Income tax expense 9 (53) (78)
Profit for the year 1,620 5,467
Profit attributable to non-controlling interests 118 92
Profit attributable to Emirates' Owner 1,502 5,375
OR E E R E
Revenue 1 5 8 2 945
Other opera ing ncom 5 86
e ati g costs 6 474 788
Ope ating p o 1,813 443
ther ga ns and osses 7 (4
F nance nco e 414 521
Finance costs 8 657) 506)
Sha e of esu ts in 103 91
Profit be ore income ta 673 45
Income tax expense (53 (78
Profit for the year 1,620 5,467
Currency translation differences 19 (9) 38
Cash flow hedges 19 (259) (282)
Actuarial losses on retirement benefit obligations 24 (116) (57)
Other comprehensive income (384) (301)
Total comprehensive income for the year 1,236 5,166
Total comprehensive income attributable to non-controlling interests 118 92
Total comprehensive income attributable to Emirates' Owner 1,118 5,074

eMIRATes
CONSOLIDATED STATEMENT OF FINANCIAL POSITIONAS AT 31 MARCH 2012
Notes 1 to 39 form an integral part of the consolidated financial statements.
Sheikh Ahmed bin Saeed Al-MaktoumChairman and Chief Executive
Timothy ClarkPresident
Note 2012 2011
AED m AED m
ASSETSNon-current assets
Property, plant and equipment 11 49,198 39,848
Intangible assets 12 902 901
Investments in associates and joint ventures 13 430 386
Advance lease rentals 14 370 384
Loans and other receivables 15 917 1,704
Derivative financial instruments 33 69 -
Deferred income tax asset 27 10 -
51,896 43,223 Current assets
Inventories 16 1,469 1,290
Trade and other receivables 17 8,126 6,481
Derivative financial instruments 33 8 123
Short term bank deposits 31 8,055 3,777
Cash and cash equivalents 31 7,532 10,196
25,190 21,867
Total assets 77,086 65,090
Note 2012 2011
AED m AED m
EQUITY AND LIABILITIES
Capital and reserves
Capital 18 801 801
Retained earnings 21,256 20,370
Other reserves 19 (833) (565)Attributable to Emirates' Owner 21,224 20,606 Non-controlling interests 242 207 Total equity 21,466 20,813
Non-current liabilities
Borrowings and lease liabilities 20 26,843 20,502
Retirement benefit obligations 24 631 479
Deferred revenue 25 1,074 930
Deferred credits 26 350 401
Deferred income tax liability 27 - 2
Trade and other payables 28 - 31
Derivative financial instruments 33 957 642
29,855 22,987
Current liabilities
Trade and other payables 28 20,601 17,551
Income tax liabilities 36 22
Borrowings and lease liabilities 20 4,037 2,728
Deferred revenue 25 915 792
Deferred credits 26 136 136
Derivative financial instruments 33 40 61
25,765 21,290
Total liabilities 55,620 44,277
Total equity and liabilities 77,086 65,090
The consolidated financial statements were approved on 2 May 2012 and signed by:
S i S o y
i i g

eMIRATes
CONSOLIDATED STATEMENT OF CHANGES IN EQUITYFOR THE YEAR ENDED 31 MARCH 2012
60
CapitalOther
reservesRetained earnings Total
Non-controlling
interests
Total equity
AED m AED m AED m AED m AED m AED m
1 April 2010 - as reported earlier 801 (321) 16,794 17,274 201 17,475
Effect of change in accounting policy (Note 38) - - (34) (34) - (34)
1 April 2010 - as restated 801 (321) 16,760 17,240 201 17,441
Currency translation differences - 38 - 38 - 38
Cash flow hedges - (282) - (282) - (282)
Actuarial losses on retirement benefit obligations - - (57) (57) - (57)
Other comprehensive income - (244) (57) (301) - (301)
Profit for the year - - 5,375 5,375 92 5,467
Total comprehensive income for the year - (244) 5,318 5,074 92 5,166
Dividends - - (1,708) (1,708) (86) (1,794)
Transactions with owners - - (1,708) (1,708) (86) (1,794)
31 March 2011 801 (565) 20,370 20,606 207 20,813
Currency translation differences - (9) - (9) - (9)
Cash flow hedges - (259) - (259) - (259)
Actuarial losses on retirement benefit obligations - - (116) (116) - (116)
Other comprehensive income - (268) (116) (384) - (384)
Profit for the year - - 1,502 1,502 118 1,620
Total comprehensive income for the year - (268) 1,386 1,118 118 1,236
Dividends - - (500) (500) (83) (583)
Transactions with owners - - (500) (500) (83) (583)
31 March 2012 801 (833) 21,256 21,224 242 21,466
Attributable to Emirates' Owner
Notes 1 to 39 form an integral part of the consolidated financial statements.
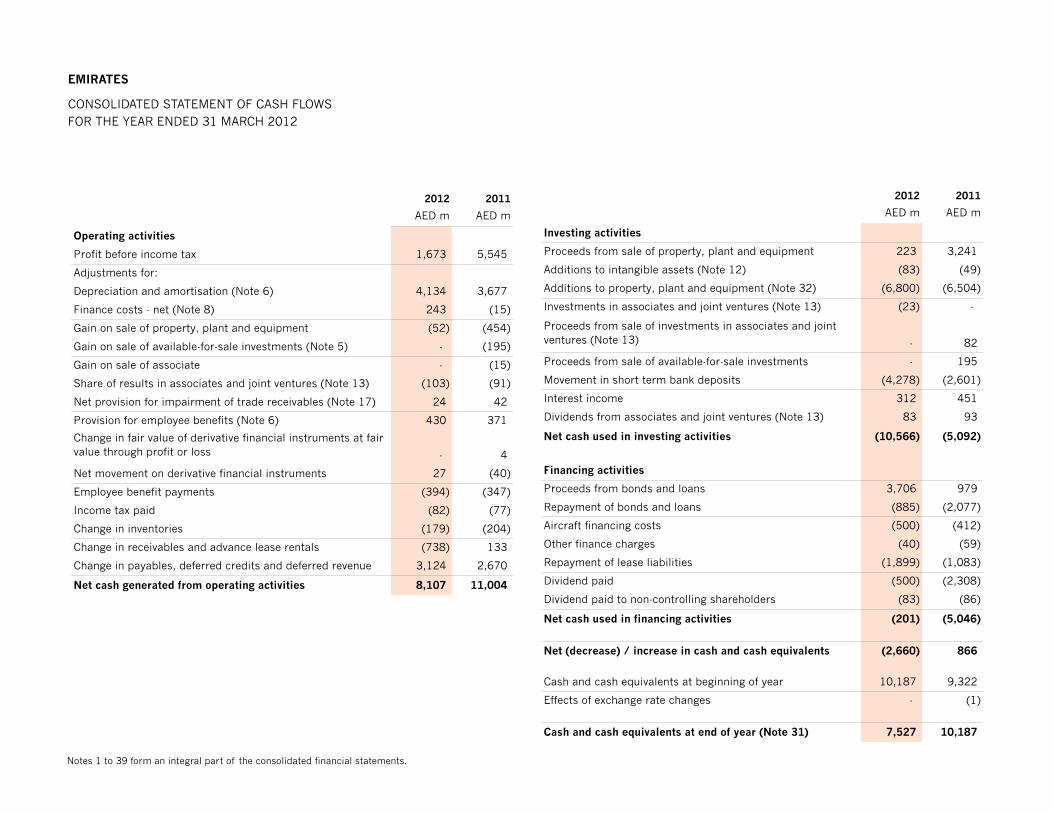
eMIRATes
CONSOLIDATED STATEMENT OF CASH FLOWSFOR THE YEAR ENDED 31 MARCH 2012
Notes 1 to 39 form an integral part of the consolidated financial statements.
2012 2011
AED m AED m
Operating activities
Profit before income tax 1,673 5,545
Adjustments for:
Depreciation and amortisation (Note 6) 4,134 3,677
Finance costs - net (Note 8) 243 (15)
Gain on sale of property, plant and equipment (52) (454)
Gain on sale of available-for-sale investments (Note 5) - (195)
Gain on sale of associate - (15)
Share of results in associates and joint ventures (Note 13) (103) (91)
Net provision for impairment of trade receivables (Note 17) 24 42
Provision for employee benefits (Note 6) 430 371
Change in fair value of derivative financial instruments at fairvalue through profit or loss - 4
Net movement on derivative financial instruments 27 (40)
Employee benefit payments (394) (347)
Income tax paid (82) (77)
Change in inventories (179) (204)
Change in receivables and advance lease rentals (738) 133
Change in payables, deferred credits and deferred revenue 3,124 2,670
Net cash generated from operating activities 8,107 11,004
2012 2011
AED m AED m
Investing activities
Proceeds from sale of property, plant and equipment 223 3,241
Additions to intangible assets (Note 12) (83) (49)
Additions to property, plant and equipment (Note 32) (6,800) (6,504)
Investments in associates and joint ventures (Note 13) (23) -
Proceeds from sale of investments in associates and joint ventures (Note 13) - 82
Proceeds from sale of available-for-sale investments - 195
Movement in short term bank deposits (4,278) (2,601)
Interest income 312 451
Dividends from associates and joint ventures (Note 13) 83 93
Net cash used in investing activities (10,566) (5,092)
Financing activities
Proceeds from bonds and loans 3,706 979
Repayment of bonds and loans (885) (2,077)
Aircraft financing costs (500) (412)
Other finance charges (40) (59)
Repayment of lease liabilities (1,899) (1,083)
Dividend paid (500) (2,308)
Dividend paid to non-controlling shareholders (83) (86)
Net cash used in financing activities (201) (5,046)
Net (decrease) / increase in cash and cash equivalents (2,660) 866
Cash and cash equivalents at beginning of year 10,187 9,322
Effects of exchange rate changes - (1)
Cash and cash equivalents at end of year (Note 31) 7,527 10,187

eMIRATes
NOTES TO THE CONSOLIDATED FINANCIAL STATEMENTSFOR THE YEAR ENDED 31 MARCH 2012
62
1. General information
Emirates comprises Emirates and its subsidiaries. Emirates was incorporated, with limited liability, by an Emiri Decree issued by H. H. Sheikh Maktoum bin Rashid Al-Maktoum on 26 June 1985 and is wholly owned by the Investment Corporation of Dubai, a Government of Dubai entity. Emirates commenced commercial operations on 25 October 1985 and is designated as the International Airline of the UAE. Emirates is incorporated and domiciled in Dubai, UAE. The address of its registered office is Emirates Group Headquarters, PO Box 686, Dubai, UAE. The main activities of Emirates comprise:
• commercial air transportation which includes passenger, cargo and postal carriage services
• wholesale and retail of consumer goods
• in-flight and institutional catering
• hotel operations
2. Summary of significant accounting policies
A summary of the significant accounting policies, which have been applied consistently in the preparation of these consolidated financial statements, is set out below.
Basis of preparation The consolidated financial statements have been prepared in accordance with International Financial Reporting Standards (IFRS) and IFRIC interpretations. The consolidated financial statements are prepared under the historical cost convention except for those financial assets and financial liabilities that are measured at fair value as stated in the accounting policies below.
Standards, interpretations and amendments to published standards that are not yet effective, have not been early adopted and are relevant to Emirates’ operations At the date of authorisation of these consolidated financial statements, certain new standards, interpretations and amendments to the existing standards have been published that are mandatory for accounting periods commencing after 1 April 2012 or later periods, but have not been early adopted. Management is currently assessing the following standards, interpretations and amendments which are likely to have an impact on Emirates’ operations: • IAS 1 (revised), Presentation of Financial Statements (effective from 1 July 2012) • IAS 19 (revised), Employee Benefits (effective from 1 January 2013) • IAS 28 (revised), Investments in Associates and Joint Ventures (effective from 1
January 2013) • IFRS 10, Consolidated Financial Statements (effective from 1 January 2013) • IFRS 11, Joint Arrangements (effective from 1 January 2013) • IFRS 12, Disclosure of Interest in Other Entities (effective from 1 January 2013) • IFRS 13, Fair value Measurement (effective from 1 January 2013) • IFRS 9, Financial Instruments (effective from 1 January 2015) Basis of consolidation Subsidiaries are those entities (including special purpose entities) in which Emirates has the power to govern the entity’s operating and financial policies generally accompanying a shareholding of more than one half of the voting rights. Subsidiaries are consolidated from the date on which control is transferred to Emirates and are de-consolidated from the date that control ceases. Inter-company transactions, balances and unrealised gains and losses arising on transactions between Emirates and subsidiaries are eliminated.
2. Summary of significant accounting policies (continued) The acquisition method of accounting is used to account for the acquisition of subsidiaries. The consideration transferred for the acquisition of a subsidiary is the fair values of the assets transferred and the liabilities incurred to the former owners of the acquiree. Acquisition-related costs are expensed as incurred. Identifiable assets, including intangible assets acquired, liabilities and contingent liabilities incurred or assumed in a business combination, are measured initially at their fair values at the acquisition date. Any non-controlling interest in the acquiree is recognised on an acquisition-by-acquisition basis, either at fair value or at the non-controlling interest’s proportionate share of the recognised amounts of acquiree’s identifiable net assets. Transactions with non-controlling interests that do not result in loss of control are accounted for as equity transactions. The difference between fair value of any consideration paid and the relevant share acquired of the carrying value of net assets of the subsidiary is recorded in equity. Gains or losses on disposals to non-controlling interests are also recorded in equity. Associates are those entities in which Emirates has significant influence but not control, generally accompanying a shareholding of between 20% and 50% of the voting rights. Investments in associates are accounted for by applying the equity method and include goodwill (net of accumulated impairment loss, if any) identified on acquisition. Joint ventures are contractual arrangements which establish joint control. Investments in jointly controlled entities are accounted for by applying the equity method. All material unrealised gains and losses arising on transactions between Emirates and its associates and joint ventures are eliminated to the extent of Emirates’ interest. Accounting policies of subsidiaries, associates and joint ventures have been changed where necessary to ensure consistency with Emirates’ accounting policies. When control or significant influence ceases, the retained interest in the entity is remeasured to fair value as at that date, with the change in the carrying amount recognised in profit or loss. The fair value is the initial carrying amount for the purposes of subsequently accounting for the retained interest as an associate, joint venture or financial asset. In addition, any amounts previously recognised in other comprehensive income in respect of that entity are accounted for as if the related assets or liabilities have been directly disposed of. This could result in amounts previously recognised in other comprehensive income being reclassified to profit or loss. If the ownership in an associate is reduced but significant influence is retained, only a proportionate share of the amounts previously recognised in other comprehensive income is reclassified to profit or loss.
Revenue Passenger and cargo sales are recognised as revenue when the transportation is provided. Revenue documents (e.g. tickets or airway bills) sold but unused are held in the consolidated statement of financial position under current liabilities as passenger and cargo sales in advance. Unused flight documents are recognised as revenue based on their terms and conditions and historical trends. Revenue from sale of goods is recognised when risks and rewards of ownership are transferred to the customer and are stated net of discounts and returns. Other revenue is recognised net of discounts when services are rendered. Interest income is recognised on a time proportion basis using the effective interest method.
Liquidated damages Income from claims for liquidated damages is recognised in the consolidated income statement when a contractual entitlement exists, amounts can be reliably measured and receipt is virtually certain. When such claims do not relate to a compensation for loss of income or towards incremental operating costs, the amounts are taken to the consolidated statement of financial position and recorded as a reduction in the cost of the related asset. Foreign currency translation Emirates’ consolidated financial statements are presented in UAE Dirhams (AED), which is also the parent company’s functional currency. Subsidiaries determine their own functional currency and items included in the financial statements of these companies are measured using that functional currency. Foreign currency transactions are translated into the functional currency at the exchange rates prevailing at the transaction dates. Monetary assets and liabilities denominated in foreign currencies are translated into the functional currency at the exchange rates prevailing at the end of the reporting period. The resultant foreign exchange gains and losses, other than those on qualifying cash flow hedges deferred in other comprehensive income, are recognised in the consolidated income statement.
Income and cash flow statements of subsidiaries are translated into UAE Dirhams at average exchange rates for the year that approximate the cumulative effect of rates prevailing on the transaction dates and their assets and liabilities are translated at the exchange rates ruling at the end of reporting period. The resulting exchange differences are recognised in other comprehensive income.

eMIRATes64
2. Summary of significant accounting policies (continued) Share of results in associates and joint ventures are translated into UAE Dirhams at average exchange rates for the year. Translation differences relating to investments in subsidiaries, associates, joint ventures and monetary assets and liabilities that form part of a net investment in a foreign operation, are recognised in other comprehensive income. When investments in subsidiaries, associates or joint ventures are disposed of, the translation differences held in equity are recognised in the consolidated income statement as part of the gain or loss on sale. Goodwill and fair value adjustments arising on the acquisition of a foreign entity are treated as assets and liabilities of the foreign entity and translated at the exchange rates prevailing at the end of reporting period.
Emissions liability Under the European Union Emissions Trading Scheme (“ETS”) regulations, effective 1 January 2012, airlines with flights originating or landing in the European Union member states must monitor their CO2 emissions, annually report them and are obliged every year to return an amount of emission allowances to the government that is equivalent to their CO2 emissions in that year. Emirates is allocated an initial emission allowance free of charge under the scheme and has an obligation to return any excess emission over the free allowance through the purchase of additional allowances. An expense is recognised on actual usage and is measured on the basis of the estimated weighted average cost expected to be incurred for the annual reporting period under the ETS.
Taxation The tax expense for the period comprises current and deferred tax. Taxation is provided for as and when the liability arises except where management is of the opinion that exemption from such liability will ultimately be granted by the relevant authorities in the countries concerned. Deferred income tax is provided in full, using the liability method, on temporary differences arising between the tax bases of assets and liabilities and their carrying amounts in the consolidated financial statements. However, deferred income tax is not accounted for if it arises from initial recognition of an asset or liability in a transaction other than a business combination that at the time of the transaction affects neither accounting nor taxable profit or loss. Also deferred tax liabilities are not recognised if they arise from the initial recognition of goodwill in a business combination. Deferred income tax is determined using tax rates (and laws) that have been enacted or substantially enacted at the end of reporting period and are expected
to apply when the related deferred income tax asset is realised or the deferred income tax liability is settled. Deferred income tax assets are recognised only to the extent that it is probable that future taxable profit will be available against which the temporary differences can be utilised. Property, plant and equipment Property, plant and equipment is stated at cost less accumulated depreciation. Cost consists of purchase cost, together with any incidental expenses of acquisition. Subsequent costs are included in the asset’s carrying amount or recognised as a separate asset, as appropriate, only when it is probable that future economic benefits associated with the item will flow and the cost can be measured reliably. Repairs and maintenance are charged to the consolidated income statement during the period in which they are incurred. Land is not depreciated. Depreciation on other items of property, plant and equipment is calculated using the straight-line method to allocate their cost, less estimated residual values, over the estimated useful lives of the assets or the lease term, if shorter. The estimated useful lives and residual values are: Aircraft – new 15 years (residual value 10%) Aircraft – used 5 - 8 years (residual value 10 - 20%) Aircraft engines and parts 5 - 15 years (residual value 0 - 10%) Buildings 15 - 20 years Other property, plant and equipment
3 - 15 years or over the lease term, if shorter
Major overhaul expenditure is depreciated over the shorter of the period to the next major overhaul, the remaining lease term or the useful life of the asset concerned. The residual values and useful lives are reviewed, and adjusted if appropriate, at the end of each reporting period. An impairment review is carried out whenever events or changes in circumstances indicate that the carrying amount may not be recoverable. When the carrying amount of an asset is greater than its estimated recoverable amount, it is written down immediately to its estimated recoverable amount and is reviewed at the end of each reporting period for possible reversal of the impairment loss. For the purpose of assessing impairment, assets are grouped at the lowest levels for which there are separately identifiable cash flows (cash generating units).

2. Summary of significant accounting policies (continued) Capital projects are stated at cost. When the asset is ready for its intended use, it is transferred from capital projects to the appropriate category under property, plant and equipment and depreciated. Gains and losses on disposals are determined by comparing proceeds with the carrying amount and are recognised in the consolidated income statement. Borrowing costs Borrowing costs directly attributable to the acquisition, construction or production of qualifying assets are added to the cost of the assets until such time the assets are substantially ready for their intended use. Where funds are borrowed specifically for the purpose of obtaining a qualifying asset, any investment income earned on temporary surplus funds is deducted from borrowing costs eligible for capitalisation. In the case of general borrowings, a capitalisation rate, which is the weighted average rate of general borrowing costs, is applied to the expenditure on qualifying assets and included in the cost of the asset. All other borrowing costs are recognised as an expense when incurred. Manufacturers' credits Emirates receives credits from manufacturers in connection with the acquisition of certain aircraft and engines. Depending on their nature, these credits are either recorded as a reduction to the cost of the related aircraft and engines or reduced from ongoing operating expenses. Where the aircraft are held under operating leases, these credits are deferred and reduced from the operating lease rentals on a straight-line basis over the period of the related lease as deferred credits. Finance and operating leases Where property, plant and equipment have been financed by lease agreements under which substantially all of the risks and rewards incidental to ownership are transferred to Emirates, they are classified as finance leases. Finance leases are capitalised at the commencement of the lease at the lower of the present value of the minimum lease payments or the fair value of the leased asset. The corresponding lease obligations are included under liabilities. Lease payments are treated as consisting of capital and interest elements. The interest element is charged to the consolidated income statement over the lease term so as to produce a constant periodic rate of interest on the remaining balance of the liability. Property, plant and equipment acquired under finance leases are depreciated in accordance with Emirates’ policies.
Leases, where a significant portion of risks and rewards of ownership are retained by the lessor, are classified as operating leases. Lease rental charges, including advance rentals in respect of operating leases, are charged to the consolidated income statement on a straight-line basis over the period of the lease. Profits arising on sale and leaseback transactions resulting in operating leases are recognised in the consolidated income statement to the extent that the sale proceeds do not exceed the fair value of the assets concerned. Any excess of sale proceeds over the fair value is accounted for as deferred credit and amortised over the lease term. In the case of profits arising on sale and leaseback transactions resulting in finance leases, the excess of sale proceeds over the carrying amount is deferred and amortised over the lease term. Lease classification is made at the inception of the lease. Lease classification is changed only if, at any time during the lease, the parties to the lease agreement agree to change the provisions of the lease (without renewing it) in a way that it would have been classified differently at inception had the changed terms been in effect at that time. The revised agreement is considered as a new agreement and accounted for prospectively over the remaining term of the lease. Goodwill Goodwill represents the excess of the consideration transferred over the fair value of the share of the net identifiable assets at the date of acquisition. Goodwill is tested for impairment annually or more frequently if events or changes in circumstances indicate a potential impairment and is carried at cost less accumulated impairment losses. For the purpose of impairment testing, goodwill is allocated to cash generating units or group of cash generating units that are expected to benefit from the business combination in which the goodwill arose. An impairment loss is recognised when the carrying value of the cash generating unit exceeds its recoverable amount. Impairment losses on goodwill are not reversed. Gains and losses on the disposal of an entity include the carrying amount of goodwill relating to the entity sold. Other intangible assets Intangible assets are capitalised at cost only when future economic benefits are probable. Cost includes the purchase price together with any directly attributable expenditure.

eMIRATes66
2. Summary of significant accounting policies (continued) An impairment review is carried out whenever events or changes in circumstances indicate that the carrying amount may not be recoverable. When the carrying amount of an intangible asset is greater than its estimated recoverable amount, it is written down immediately to its estimated recoverable amount and is reviewed at the end of each reporting period for possible reversal of the impairment loss. For the purpose of assessing impairment, assets are grouped at the lowest levels for which there are separately identifiable cash flows (cash generating units). Intangible assets are amortised on a straight-line basis over their estimated useful lives which are: Service rights 15 years Trade names 20 years Contractual rights 15 years Computer software 5 years Available-for-sale financial assets Available-for-sale financial assets are non-derivative financial assets that are either designated in this category or not classified as loans and receivables, held-to-maturity financial assets or financial assets at fair value through profit or loss. Such investments are initially recognised in the consolidated statement of financial position on the trade date at fair value including transaction costs. Assets in this category are included in non-current assets unless management intends to dispose of the investment within 12 months from the end of reporting period. The investments are derecognised when rights to receive cash flows have expired or have been transferred along with substantially all the risks and rewards of ownership. Quoted investments are subsequently measured at their fair value based on quoted bid prices. Unrealised gains and losses arising from a change in fair value are recognised in other comprehensive income until the investment is sold or impaired, at which time the cumulative gain or loss previously recognised in equity is included in the consolidated income statement. At the end of each reporting period, an assessment is made whether there is any objective evidence of impairment. In such instances, the cumulative loss - measured as the difference between the acquisition cost and the current fair value, less impairment loss previously recognised in the consolidated income statement - is reclassified from equity to the consolidated income statement.
Held-to-maturity financial assets Non-derivative financial assets with fixed or determinable payments and fixed maturity that management has the intent and ability to hold to maturity are recognised in the consolidated statement of financial position on the trade date as held-to-maturity financial assets. Such investments are initially recognised at fair value including transaction costs and are carried at amortised cost using the effective interest method. The investments are derecognised when rights to receive cash flows have expired or have been transferred along with substantially all the risks and rewards of ownership. At the end of each reporting period, an assessment is made whether there is any objective evidence of impairment. Where necessary, the carrying amount is written down through the consolidated income statement to the present value of expected future cash flows discounted at the effective interest rate computed at initial recognition. Loans and receivables Loans and receivables are non-derivative financial assets with fixed or determinable payments that are not quoted in an active market. Such amounts are initially recognised at fair value including transaction costs and carried at amortised cost using the effective interest method. The amounts are derecognised when rights to receive cash flows have expired or have been transferred along with substantially all the risks and rewards of ownership. At the end of each reporting period, an assessment is made whether there is any objective evidence of impairment. Where necessary, the carrying amount is written down through the consolidated income statement to the present value of expected future cash flows discounted at the effective interest rate computed at initial recognition. Derivative financial instruments Derivative financial instruments are initially recognised at fair value on the date a derivative contract is entered into and are subsequently remeasured at their fair value. Derivatives are designated either as a hedge of the fair value of a recognised asset or liability or of a firm commitment (fair value hedge) or a hedge of the exposure to variability in cash flows that is attributable to a particular risk associated with a recognised asset or liability or a highly probable forecast transaction (cash flow hedge). Fair values are obtained from quoted market prices or dealer quotes for similar instruments, discounted cash flow models and option pricing models as appropriate. All derivatives are carried as assets when fair value is positive and as liabilities when fair value is negative.

2. Summary of significant accounting policies (continued) Emirates’ criteria to account for a derivative financial instrument as a hedge include:
• formal documentation of the hedging instruments, hedged items, hedging objective, strategy and basis of measuring effectiveness all of which are prepared prior to applying hedge accounting; and
• documentation showing that the hedge effectiveness is assessed on an ongoing basis and is determined to have been highly effective in offsetting the risk of the hedged item throughout the reporting period.
Changes in the fair value of derivatives that are designated and qualify as fair value hedges and that are highly effective are recorded in the consolidated income statement, along with any changes in the fair value of the hedged asset or liability that are attributable to the hedged risk. This accounting treatment is discontinued when the fair value hedging instrument expires or is sold, terminated or exercised, or the hedge no longer meets the criteria for hedge accounting. Changes in the fair value of derivatives that are designated and qualify as cash flow hedges and that prove to be highly effective in relation to the hedged risk, are recognised in other comprehensive income. When the forecasted transaction results in the recognition of an asset or of a liability, the gains and losses previously deferred in equity are transferred from equity and recognised in profit or loss in the same period during which the asset or liability affects profit or loss. In all other cases, amounts deferred in equity are transferred to the consolidated income statement in the period during which the forecasted transaction affects the consolidated income statement and are presented in the same line item as the gains and losses from hedged items. When a cash flow hedging instrument expires or is sold, terminated or exercised, or when a hedge no longer meets the criteria for hedge accounting under IAS 39, any cumulative gain or loss existing in equity at that time is retained in equity and is ultimately recognised in the consolidated income statement when the forecasted transaction occurs. If a forecasted transaction is no longer expected to occur, the cumulative gain or loss that was reported in equity is immediately transferred to the consolidated income statement. The gain or loss on the ineffective portion is recognised in the consolidated income statement. Changes in the fair value of derivative instruments that do not qualify for hedge accounting are recognised immediately in the consolidated income statement.
Inventories Inventories are stated at the lower of cost and estimated net realisable value. Cost is determined on the weighted average cost basis with the exception of consumer goods inventory which is determined on a first-in-first-out basis. Trade receivables Trade receivables are initially recognised at fair value and subsequently measured at amortised cost using the effective interest method, less provision for impairment. Where there is objective evidence of amounts that are not collectible, a provision is made for the difference between the carrying amount and the present value of the estimated future cash flows, discounted at the original effective interest rate. Borrowings
Borrowings are recognised initially at fair value, net of transaction costs incurred. Borrowings are subsequently stated at amortised cost with any difference between the proceeds (net of transaction costs) and the redemption value recognised in the consolidated income statement over the period of the borrowings using the effective interest method. Retirement benefit obligations
Emirates operates or participates in various end of service benefit plans, which are classified either as defined contribution or defined benefit plans. A defined contribution plan is a pension scheme under which Emirates pays fixed contributions and has no legal or constructive obligation to pay further contributions if the fund does not hold sufficient assets to settle the benefits relating to the employees service in the current and prior periods. Contributions to the pension fund are charged to the consolidated income statement in the period in which they fall due. A defined benefit plan is a plan which is not a defined contribution plan. The liability recognised in the consolidated statement of financial position for a defined benefit plan is the present value of the defined benefit obligation at the end of the reporting period less the fair value of plan assets at that date. The defined benefit obligation is calculated by independent actuaries using the projected unit credit method. The present value of the defined benefit obligation is determined by discounting estimated future cash outflows using market yields at the end of the reporting period of high quality corporate bonds that have terms to maturity approximating to the estimated term of the post-employment benefit obligations.
eMIRATes68
2. Summary of significant accounting policies (continued) Actuarial gains and losses arising from changes in actuarial assumptions and experience adjustments are recognised in equity through other comprehensive income in the period in which they arise. Frequent flyer programme
Emirates operates a frequent flyer programme that provides a variety of awards to programme members based on a mileage credit for flights on Emirates and other airlines that participate in the programme. Members can also accrue miles by utilising the services of non-airline programme participants. Emirates accounts for award credits as a separately identifiable component of the sales transaction in which they are granted. The consideration in respect of the initial sale is allocated to award credits based on their fair value and is accounted for as a liability (deferred revenue) in the consolidated statement of financial position. The fair value is determined using estimation techniques that take into account the fair value of awards for which miles could be redeemed. Miles accrued through utilising the services of programme partners and paid for by the participating partners are also accounted for as deferred revenue until they are utilised. In these instances, a liability is not recognised for miles that are expected to expire. Revenue is recognised in the consolidated income statement only when Emirates fulfils its obligations by supplying free or discounted goods or services on redemption of the miles accrued. Trade payables Trade payables are recognised initially at fair value and subsequently measured at amortised cost using the effective interest method. Derecognition of financial assets and financial liabilities Financial assets are derecognised only when the contractual rights to the cash flows expire or substantially all the risks and rewards of ownership are transferred along with the contractual rights to receive cash flows. Financial liabilities are derecognised only when they are extinguished i.e. when the obligations specified in the contract are discharged or cancelled or expire.
Cash and cash equivalents Cash and cash equivalents comprise cash, liquid funds with an original maturity of three months or less. Other bank deposits with maturity less than a year are classified as short term bank deposits. Bank overdrafts are shown within current borrowings and lease liabilities in the consolidated statement of financial position.
Dividend distribution Dividend distribution to Emirates’ Owner is recognised as a liability in the consolidated financial statements in the period in which the dividends are approved.
Segment reporting Operating segments are reported in a manner consistent with the internal reporting provided to the chief operating decision maker. The chief operating decision maker makes strategic decisions and is responsible for allocating resources and assessing performance of the operating segments.

3. Critical accounting estimates and judgements In the preparation of the consolidated financial statements, a number of estimates and associated assumptions have been made relating to the application of accounting policies and reported amounts of assets, liabilities, income and expense. The estimates and associated assumptions are assessed on an ongoing basis and are based on historical experience and other factors, including expectations of future events that are believed to be reasonable under the circumstances. The following discussion addresses the accounting policies that require subjective and complex judgements, often as a result of the need to make estimates. Depreciation of property, plant and equipment Management assigns useful lives and residual values to property, plant and equipment based on the intended use of assets and the economic lives of those assets. Subsequent changes in circumstances such as technological advances or prospective utilisation of the assets concerned could result in the actual useful lives or residual values differing from initial estimates. Management has reviewed the residual values and useful lives of major items of property, plant and equipment and determined that no adjustment is necessary. Taxation Income tax liabilities are not provided for when management is of the opinion that exemption from income tax will ultimately be granted by the relevant authorities in the concerned jurisdictions. In making its judgement, management considers the status of discussions with the relevant authorities in different countries, the existence of reciprocal exemptions or of a memorandum of understanding. The resolution of issues is not always within the control of management and is often dependant upon external parties. When, due to a change in circumstances, it is unlikely that a tax exemption will be obtained, the income tax liability is fully provided for on a conservative basis until a resolution is reached or the final tax outcome is determined.
Frequent flyer programme Emirates accounts for award credits as a separately identifiable component of the sales transaction in which they are granted. The consideration in respect of the initial sale is allocated to award credits based on their fair value and is accounted as a liability (deferred revenue) in the consolidated statement of financial position. Estimation techniques are used to determine the fair value of mile credits and reflect the weighted average of a number of factors i.e. fare per sector, flight upgrades and partner rewards. A rolling 12 month historical trend forms the basis of the calculations. Adjustments to the fair value of miles are also made for miles not expected to be redeemed by members and the extent to which the demand for an award cannot be met for the dates requested. A level of judgement is exercised by management due to the diversity of inputs that go into determining the fair value of miles. It is also difficult to present the sensitivity of a change in the value of one or set of the inputs given the complexity of the workings.

eMIRATes70
4. Revenue2012 2011
AED m AED m
Services
Passenger 48,950 41,415
Cargo 9,546 8,803
Excess baggage 332 293
Destination and leisure 245 226
Hotel operations 155 148
Others 263 286
59,491 51,171
Sale of goods
Consumer goods 1,081 957
In-flight catering 482 395
Food and beverage 454 422
2,017 1,774
61,508 52,945
5. Other operating income
Other operating income includes AED 194 m (2011: AED 209 m) from liquidateddamages, AED 69 m (2011: AED 479 m) being the gain on sale and leaseback ofaircraft, aircraft engines and parts, AED Nil (2011: AED 195 m) being the gain onsale of available-for-sale financial assets, AED Nil (2011: AED 5 m) being net foreignexchange gain and income from ancilliary services and activities incidental toEmirates' operations is AED 516 m (2011: AED 398 m).
6. Operating costs
2012 2011
AED m AED m
Jet fuel 24,292 16,820
Employee (see (a) below) 7,936 7,615
Aircraft operating leases (see (b) below) 4,788 4,317
Depreciation (Note 11) 4,053 3,600
Sales and marketing 4,023 3,862
Handling 3,584 3,137
In-flight catering and related costs 2,836 2,305
Overflying 1,878 1,620
Office accommodation and IT costs 1,450 1,281
Aircraft maintenance 1,296 1,030
Landing and parking 1,128 974
Cost of goods sold 926 839
Amortisation (Note 12) 81 77
Corporate overheads (see (c) below) 2,203 1,311
60,474 48,788
(a) Employee costs include AED 430 m (2011: AED 371 m) in respect of post-employment benefits and AED Nil (2011: AED 770 m) in respect of an employeeprofit share scheme.
(b) Aircraft operating lease charges include AED 361 m (2011: AED 433 m) inrespect of "wet" leases of freighter aircraft.
(c) Corporate overheads include non-aircraft operating lease charges amounting toAED 474 m (2011: AED 451 m) and a net foreign exchange loss of AED 356 m (2011:Nil).

7. Other gains and losses
8. Finance income and costs
2012 2011
AED m AED m
Finance income
Interest income on short term bank deposits 336 448
Related parties (Note 35) 76 68
Other finance income 2 5
414 521
Finance costs
Aircraft financing costs (559) (444)
Interest charges on borrowings (95) (59)
Other finance costs (3) (3)
(657) (506)
Other gains and losses represent changes in the fair value of financial instruments atfair value through profit and loss. As part of its programme of managing jet fuelcosts, Emirates uses certain derivatives that do not qualify for hedge accounting.
Finance costs of AED 209 m (2011: AED 84 m) were capitalised during the year usinga weighted average capitalisation rate of 4.1% (2011: 2.4%).
9. Income tax expense
2012 2011
AED m AED m
The components of income tax expense are:
Current tax expense 65 80
Deferred tax credit (Note 27) (12) (2)
53 78
Emirates has secured tax exemptions by virtue of double taxation agreements andairline reciprocal arrangements in most of the jurisdictions in which it operates.Therefore, the income tax expense relates only to certain overseas stations whereEmirates is subject to income tax. Providing information on effective tax rates istherefore not meaningful.

eMIRATes72
10. Segment information
Emirates' management monitors the operating results of its business units for thepurpose of making decisions about resource allocation and performance assessment.The airline business unit, which provides commercial air transportation includingpassenger and cargo services, is the main reportable segment.
Other segments include wholesale and retail of consumer goods, food and beverageoperations and hotel operations. As none of these segments meet the quantitativethresholds for determining reportable segments under IFRS 8, Operating segments,these are categorised as "all other segments".
The performance of airline, in-flight catering and other segments is evaluated basedon net profit or loss and is measured consistently with profit for the year in theconsolidated financial statements.
Segment revenue is measured in a manner consistent with that in the consolidatedincome statement, with the exception of notional revenues from staff leave passageand duty travel which are included in total segment revenue under the airlinesegment but adjusted against operating costs when preparing the consolidatedfinancial statements. This adjustment is presented in the reconciliation. Thebreakdown of revenue from external customers by nature of business activity isprovided in Note 4.
Segment assets include inter-segment loans and receivables, which are eliminated onconsolidation. This consolidation adjustment is represented in the reconciliation.
The in-flight catering operation qualifies as a reportable segment in the current year.Prior year numbers are restated for comparative purposes.
The segment information for the year ended 31 March 2012 is as follows:
AirlineIn-flight catering
All other segments
Recon-ciliation Total
AED m AED m AED m AED m AED m
Total segment revenue 59,596 1,733 1,596 (124) 62,801
Inter-segment revenue - 1,251 42 - 1,293
Revenue from external customers 59,596 482 1,554 (124) 61,508
Segment profit for the year 1,176 301 143 - 1,620
Finance income 438 4 1 (29) 414
Finance costs (651) (6) 29 (29) (657)
Income tax expense (93) - 40 - (53)
Depreciation and amortisation (3,949) (68) (117) - (4,134)
Share of results in associates and joint ventures - - 103 - 103
Segment assets 71,908 1,789 4,385 (996) 77,086
Investments in associates and joint ventures - - 430 - 430
Additions to property, plant and equipment 12,955 120 486 - 13,561
Additions to intangible assets 79 - 4 - 83
Additions to advance lease rentals 93 - - - 93
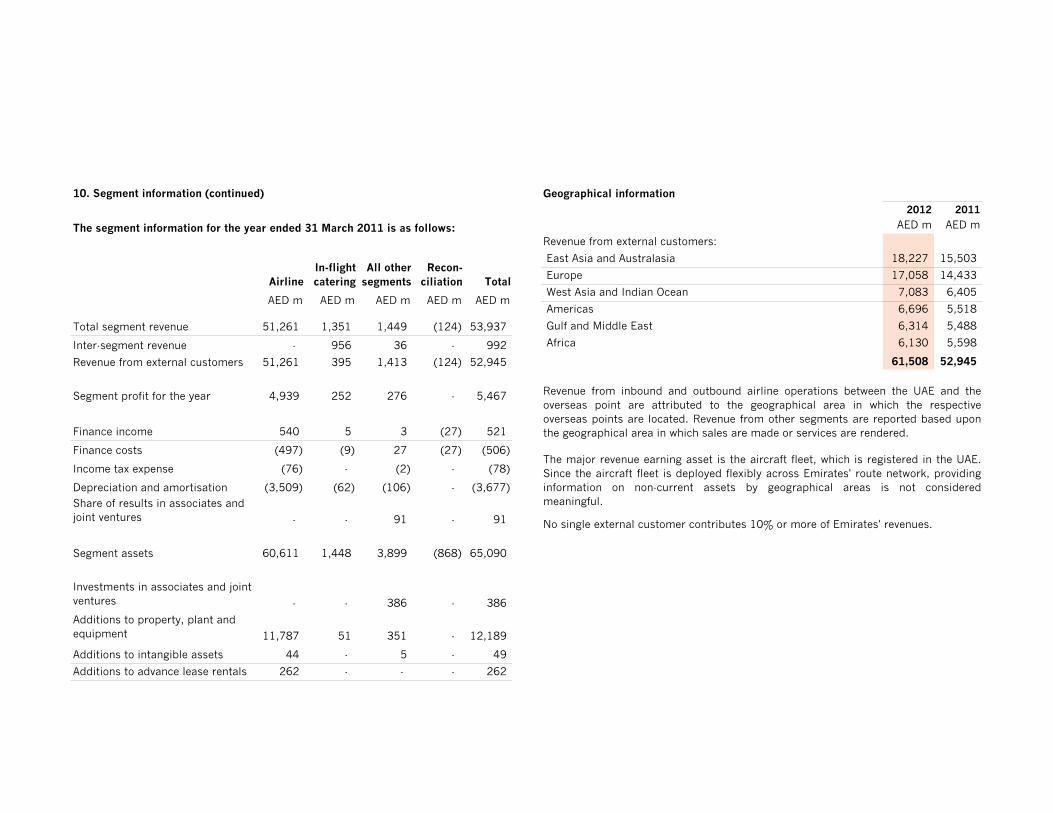
10. Segment information (continued)
The segment information for the year ended 31 March 2011 is as follows:
AirlineIn-flight catering
All other segments
Recon-ciliation Total
AED m AED m AED m AED m AED m
Total segment revenue 51,261 1,351 1,449 (124) 53,937
Inter-segment revenue - 956 36 - 992
Revenue from external customers 51,261 395 1,413 (124) 52,945
Segment profit for the year 4,939 252 276 - 5,467
Finance income 540 5 3 (27) 521
Finance costs (497) (9) 27 (27) (506)
Income tax expense (76) - (2) - (78)
Depreciation and amortisation (3,509) (62) (106) - (3,677)
Share of results in associates and joint ventures - - 91 - 91
Segment assets 60,611 1,448 3,899 (868) 65,090
Investments in associates and joint ventures - - 386 - 386
Additions to property, plant and equipment 11,787 51 351 - 12,189
Additions to intangible assets 44 - 5 - 49
Additions to advance lease rentals 262 - - - 262
Geographical information
2012 2011
AED m AED m
Revenue from external customers:
East Asia and Australasia 18,227 15,503
Europe 17,058 14,433
West Asia and Indian Ocean 7,083 6,405
Americas 6,696 5,518
Gulf and Middle East 6,314 5,488
Africa 6,130 5,598
61,508 52,945
No single external customer contributes 10% or more of Emirates' revenues.
Revenue from inbound and outbound airline operations between the UAE and theoverseas point are attributed to the geographical area in which the respectiveoverseas points are located. Revenue from other segments are reported based uponthe geographical area in which sales are made or services are rendered.
The major revenue earning asset is the aircraft fleet, which is registered in the UAE.Since the aircraft fleet is deployed flexibly across Emirates' route network, providinginformation on non-current assets by geographical areas is not consideredmeaningful.
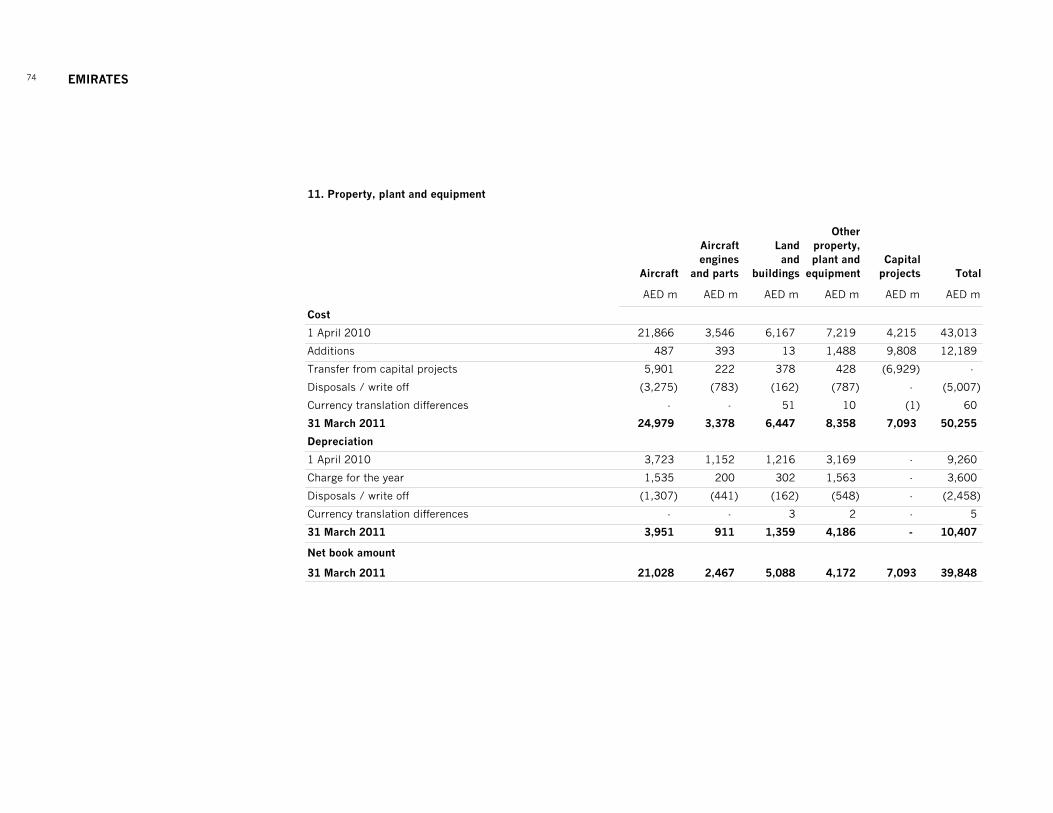
eMIRATes74
11. Property, plant and equipment
Aircraft
Aircraft engines
and parts
Land and
buildings
Otherproperty,
plant and equipment
Capital projects Total
AED m AED m AED m AED m AED m AED m
Cost
1 April 2010 21,866 3,546 6,167 7,219 4,215 43,013
Additions 487 393 13 1,488 9,808 12,189
Transfer from capital projects 5,901 222 378 428 (6,929) -
Disposals / write off (3,275) (783) (162) (787) - (5,007)
Currency translation differences - - 51 10 (1) 60
31 March 2011 24,979 3,378 6,447 8,358 7,093 50,255
Depreciation
1 April 2010 3,723 1,152 1,216 3,169 - 9,260
Charge for the year 1,535 200 302 1,563 - 3,600
Disposals / write off (1,307) (441) (162) (548) - (2,458)
Currency translation differences - - 3 2 - 5
31 March 2011 3,951 911 1,359 4,186 - 10,407
Net book amount
31 March 2011 21,028 2,467 5,088 4,172 7,093 39,848

11. Property, plant and equipment (continued)
Aircraft
Aircraft engines
and parts
Land and
buildings
Otherproperty,
plant and equipment
Capital projects Total
AED m AED m AED m AED m AED m AED m
Cost
1 April 2011 24,979 3,378 6,447 8,358 7,093 50,255
Additions - 201 16 1,629 11,715 13,561
Transfer from capital projects 8,069 312 970 408 (9,759) -
Disposals / write off (459) (23) (1) (586) - (1,069)
Currency translation differences - - 3 1 (5) (1)
31 March 2012 32,589 3,868 7,435 9,810 9,044 62,746
Depreciation
1 April 2011 3,951 911 1,359 4,186 - 10,407
Charge for the year 1,698 211 349 1,795 - 4,053
Disposals / write off (345) (16) (1) (552) - (914)
Currency translation differences - - - 2 - 2
31 March 2012 5,304 1,106 1,707 5,431 - 13,548
Net book amount
31 March 2012 27,285 2,762 5,728 4,379 9,044 49,198
Capital projects include pre-delivery payments of AED 6,165 m (2011: AED 4,995 m) in respect of aircraft (Note 29) due for deliverybetween 2012 and 2024.
Land of AED 306 m (2011: AED 306 m) is carried at cost and is not depreciated.
Property, plant and equipment includes capitalised interest amounting to AED 209 m (2011: AED 84 m) using a weighted averagecapitalisation rate of 4.1% (2011: 2.4%).
The net book amount of property, plant and equipment includes AED 25,479 m (2011: AED 19,497 m) in respect of aircraft heldunder finance leases.
The net book amount of aircraft, aircraft engines and parts includes an amount of AED 1,125 m (2011: AED 1,209 m) in respect ofassets provided as security against term loans.

eMIRATes76
12. Intangible assets
GoodwillService rights
Tradenames
Contractual rights
Computer software Total
AED m AED m AED m AED m AED m AED m
Cost
1 April 2010 564 162 19 19 496 1,260
Additions - - - 5 44 49
Disposals / write off - - - - (1) (1)
Currency translation differences - - - 3 - 3
31 March 2011 564 162 19 27 539 1,311
Amortisation and impairment
1 April 2010 7 55 1 1 269 333
Amortisation for the year - 10 1 2 64 77
Disposals / write off - - - - (1) (1)
Currency translation differences - - - 1 - 1
31 March 2011 7 65 2 4 332 410
Net book value
31 March 2011 557 97 17 23 207 901

GoodwillService rights
Tradenames
Contractual rights
Computer software Total
AED m AED m AED m AED m AED m AED m
Cost
1 April 2011 564 162 19 27 539 1,311
Additions - - - - 83 83
Disposals / write off - - - - (1) (1)
31 March 2012 564 162 19 27 621 1,393
Amortisation and impairment
1 April 2011 7 65 2 4 332 410
Amortisation for the year - 11 1 2 67 81
31 March 2012 7 76 3 6 399 491
Net book value
31 March 2012 557 86 16 21 222 902
Computer software includes an amount of AED 80 m (2011: AED 52 m) in respect of projects under implementation.
Cash generating unit LocationReportable segment
Gross margin
Terminal growth
Discount rate
2012 2011AED m AED m % % %
Consumer goods UAE Others 159 159 25 4 12
In-flight catering UAE In-flight catering 369 369 35 4 12
Food and beverages UAE Others 25 25 21 3 10
Food and beverages Australia Others 4 4 20 3 12
557 557
For the purpose of testing goodwill for impairment, the recoverable amounts for cash generating units have been determined on thebasis of value-in-use calculations using cash flow forecasts approved by management covering a three year period. The keyassumptions used in the value-in-use calculations include a risk adjusted pre-tax discount rate, growth rates based onmanagement's expectations for market development and historical gross margins. The growth rate does not exceed the long termaverage growth rate for the markets in which the cash generating units operate. The goodwill allocated to the cash generating unit, orgroup of cash generating units, and the key assumptions used in the value-in-use calculations are as follows:
Goodwill
12. Intangible assets (continued)
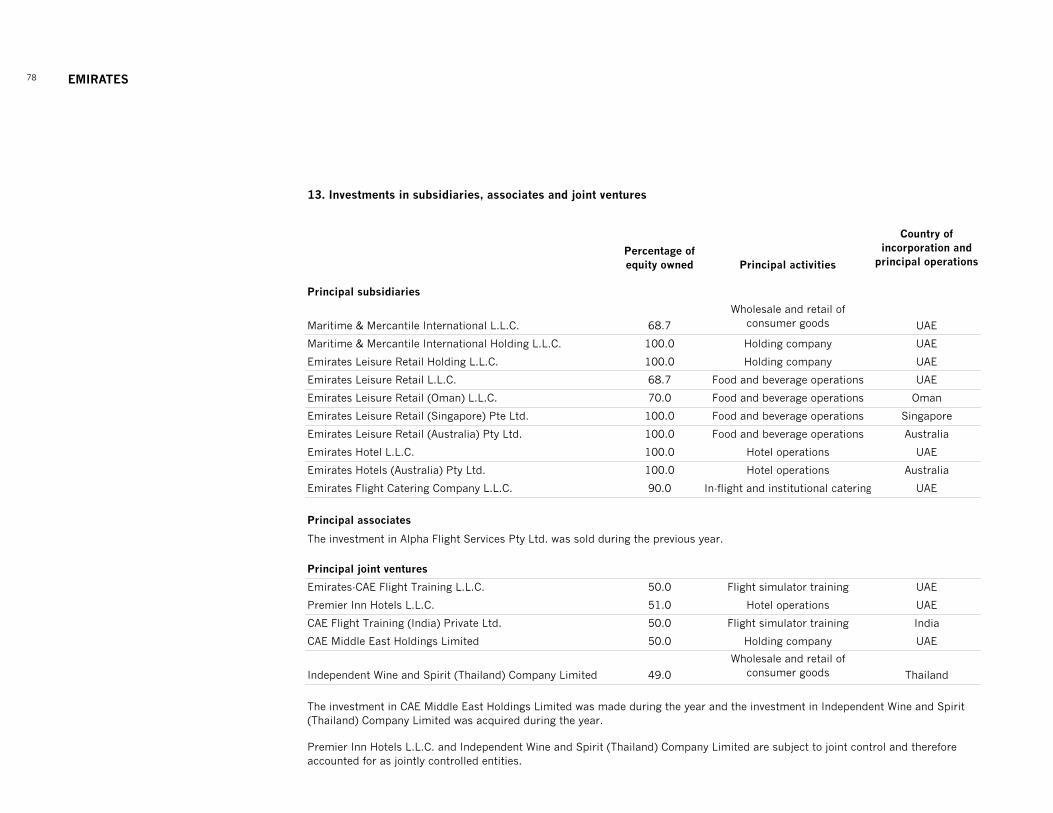
eMIRATes78
13. Investments in subsidiaries, associates and joint ventures
Percentage of equity owned Principal activities
Country ofincorporation and
principal operations
Principal subsidiaries
Maritime & Mercantile International L.L.C. 68.7
Wholesale and retail of consumer goods UAE
Maritime & Mercantile International Holding L.L.C. 100.0 Holding company UAE
Emirates Leisure Retail Holding L.L.C. 100.0 Holding company UAE
Emirates Leisure Retail L.L.C. 68.7 Food and beverage operations UAE
Emirates Leisure Retail (Oman) L.L.C. 70.0 Food and beverage operations Oman
Emirates Leisure Retail (Singapore) Pte Ltd. 100.0 Food and beverage operations Singapore
Emirates Leisure Retail (Australia) Pty Ltd. 100.0 Food and beverage operations Australia
Emirates Hotel L.L.C. 100.0 Hotel operations UAE
Emirates Hotels (Australia) Pty Ltd. 100.0 Hotel operations Australia
Emirates Flight Catering Company L.L.C. 90.0 In-flight and institutional catering UAE
Principal associates
The investment in Alpha Flight Services Pty Ltd. was sold during the previous year.
Principal joint ventures
Emirates-CAE Flight Training L.L.C. 50.0 Flight simulator training UAE
Premier Inn Hotels L.L.C. 51.0 Hotel operations UAE
CAE Flight Training (India) Private Ltd. 50.0 Flight simulator training India
CAE Middle East Holdings Limited 50.0 Holding company UAE
Independent Wine and Spirit (Thailand) Company Limited 49.0
Wholesale and retail of consumer goods Thailand
Premier Inn Hotels L.L.C. and Independent Wine and Spirit (Thailand) Company Limited are subject to joint control and therefore accounted for as jointly controlled entities.
The investment in CAE Middle East Holdings Limited was made during the year and the investment in Independent Wine and Spirit (Thailand) Company Limited was acquired during the year.

Movement of investments in associated companies and joint ventures
2012 2011
AED m AED m
Balance brought forward 386 461
Investments during the year 10 -
Acquisition 13 -
Share of results 103 91
Dividends (83) (93)
Currency translation differences 1 9
Disposal during the year - (82)
Balance carried forward 430 386
2012 2011
AED m AED m
Total assets 390 382
Total liabilities 112 114
Net assets 278 268
Revenue 572 938
Profit for the year 169 176
13. Investments in subsidiaries, associates and joint ventures (continued)
Summarised financial information in respect of the associates is set out below:
The carrying value of the investments in associates amounted to AED 91 m (2011:AED 91 m) and the share of results amounted to AED 71 m (2011: AED 76 m).
2012 2011
AED m AED m
Non-current assets 588 550
Current assets 82 74
Non-current liabilities 278 274
Current liabilities 53 55
Total income 176 135
Total expense 144 120
14. Advance lease rentals
2012 2011
AED m AED m
Balance brought forward 480 283
Additions during the year 93 262
Charge for the year (99) (65)
Balance carried forward 474 480
Advance lease rentals will be charged to the consolidated income statement as follows:
Within one year (Note 17) 104 96
Total over one year 370 384
Summarised financial information in respect of Emirates' share in jointly controlledentities is set out below:
Advance lease rentals are non-refundable in the event of the related lease beingterminated prior to its expiry.
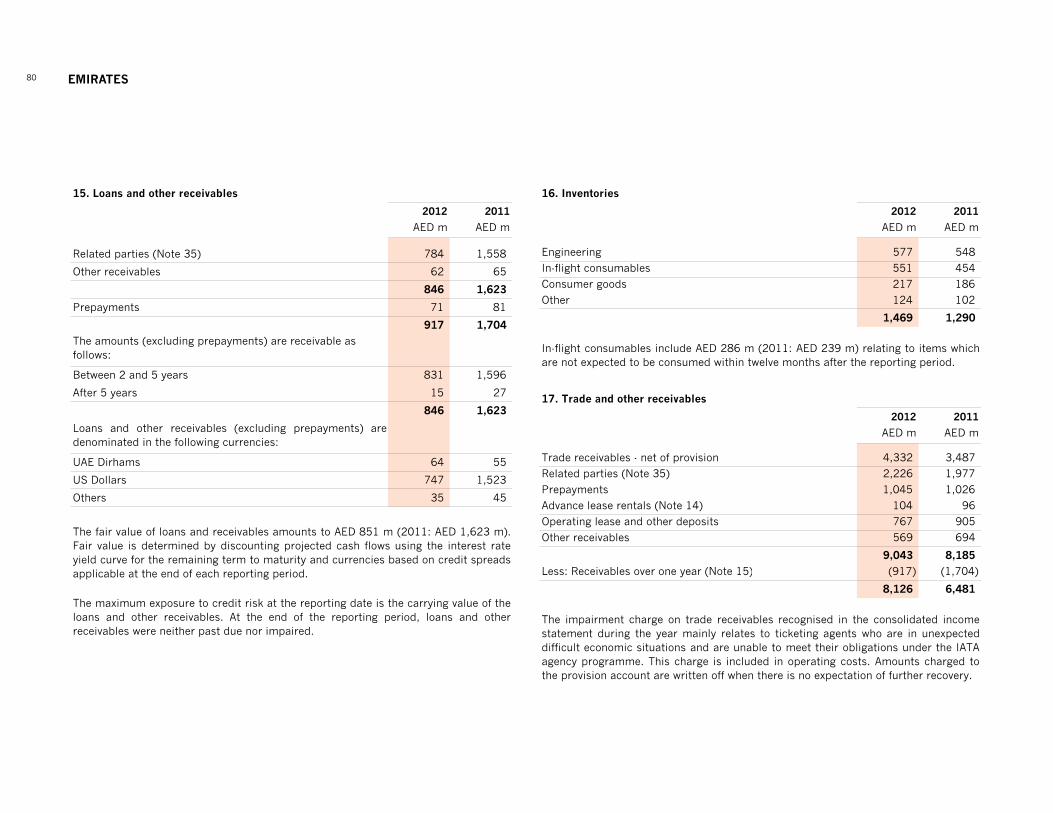
eMIRATes80
15. Loans and other receivables
2012 2011
AED m AED m
Related parties (Note 35) 784 1,558
Other receivables 62 65
846 1,623
Prepayments 71 81
917 1,704
The amounts (excluding prepayments) are receivable as follows:
Between 2 and 5 years 831 1,596
After 5 years 15 27
846 1,623
Loans and other receivables (excluding prepayments) aredenominated in the following currencies:
UAE Dirhams 64 55
US Dollars 747 1,523
Others 35 45
The fair value of loans and receivables amounts to AED 851 m (2011: AED 1,623 m).Fair value is determined by discounting projected cash flows using the interest rateyield curve for the remaining term to maturity and currencies based on credit spreadsapplicable at the end of each reporting period.
The maximum exposure to credit risk at the reporting date is the carrying value of theloans and other receivables. At the end of the reporting period, loans and otherreceivables were neither past due nor impaired.
16. Inventories
2012 2011
AED m AED m
Engineering 577 548
In-flight consumables 551 454
Consumer goods 217 186
Other 124 102
1,469 1,290
17. Trade and other receivables
2012 2011
AED m AED m
Trade receivables - net of provision 4,332 3,487
Related parties (Note 35) 2,226 1,977
Prepayments 1,045 1,026
Advance lease rentals (Note 14) 104 96
Operating lease and other deposits 767 905
Other receivables 569 694
9,043 8,185
Less: Receivables over one year (Note 15) (917) (1,704)
8,126 6,481
In-flight consumables include AED 286 m (2011: AED 239 m) relating to items whichare not expected to be consumed within twelve months after the reporting period.
The impairment charge on trade receivables recognised in the consolidated incomestatement during the year mainly relates to ticketing agents who are in unexpecteddifficult economic situations and are unable to meet their obligations under the IATAagency programme. This charge is included in operating costs. Amounts charged tothe provision account are written off when there is no expectation of further recovery.

17. Trade and other receivables (continued)
2012 2011
AED m AED m
Balance brought forward 122 90
Charge for the year 66 76
Unused amounts reversed (42) (34)
Amounts written off as uncollectible (9) (13)
Currency translation differences (2) 3
Balance carried forward 135 122
The other classes of trade and other receivables do not contain impaired assets.
The maximum exposure to credit risk of current trade and other receivables at thereporting date is the carrying value of each class of receivables.
Movements in the provision for impairment of trade receivables are as follows:
Ageing of receivables that are past due but not impaired is as follows:
2012 2011
AED m AED m
Below 3 months 292 275
3-6 months 41 19
Above 6 months 104 109
437 403
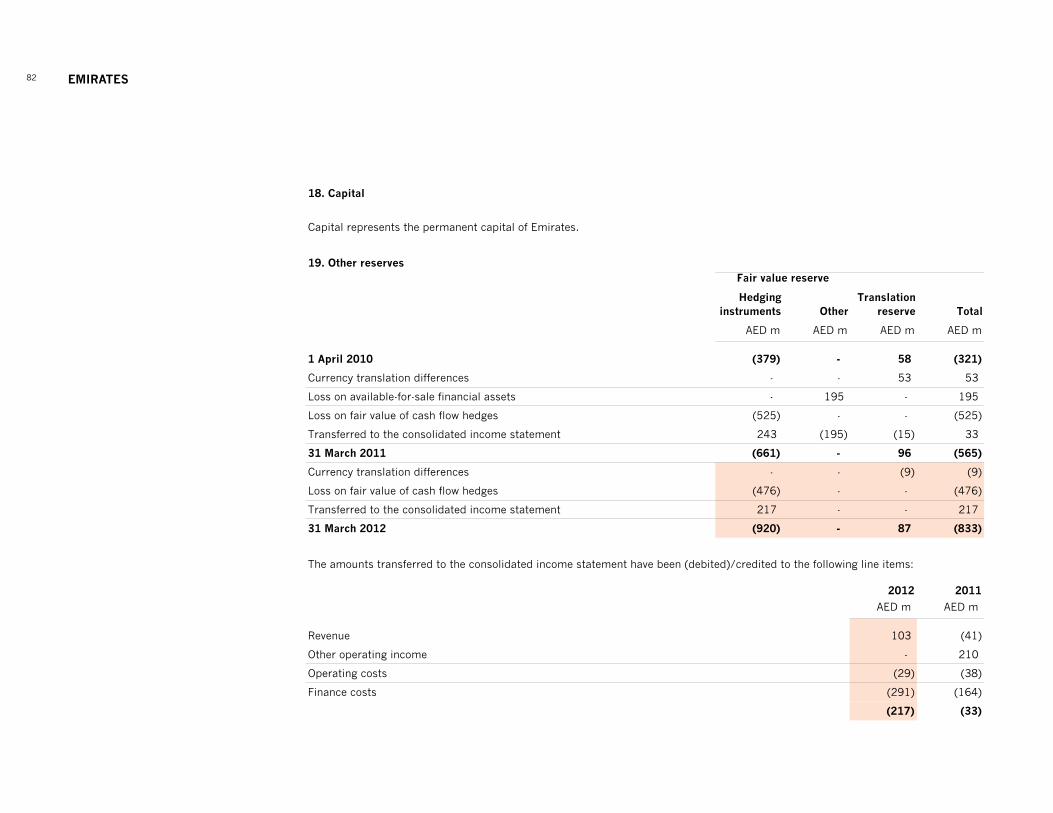
eMIRATes82
18. Capital
Capital represents the permanent capital of Emirates.
19. Other reserves
Hedging instruments Other
Translation reserve Total
AED m AED m AED m AED m
1 April 2010 (379) - 58 (321)
Currency translation differences - - 53 53
Loss on available-for-sale financial assets - 195 - 195
Loss on fair value of cash flow hedges (525) - - (525)
Transferred to the consolidated income statement 243 (195) (15) 33
31 March 2011 (661) - 96 (565)
Currency translation differences - - (9) (9)
Loss on fair value of cash flow hedges (476) - - (476)
Transferred to the consolidated income statement 217 - - 217
31 March 2012 (920) - 87 (833)
The amounts transferred to the consolidated income statement have been (debited)/credited to the following line items:
2012 2011
AED m AED m
Revenue 103 (41)
Other operating income - 210
Operating costs (29) (38)
Finance costs (291) (164)
(217) (33)
Fair value reserve
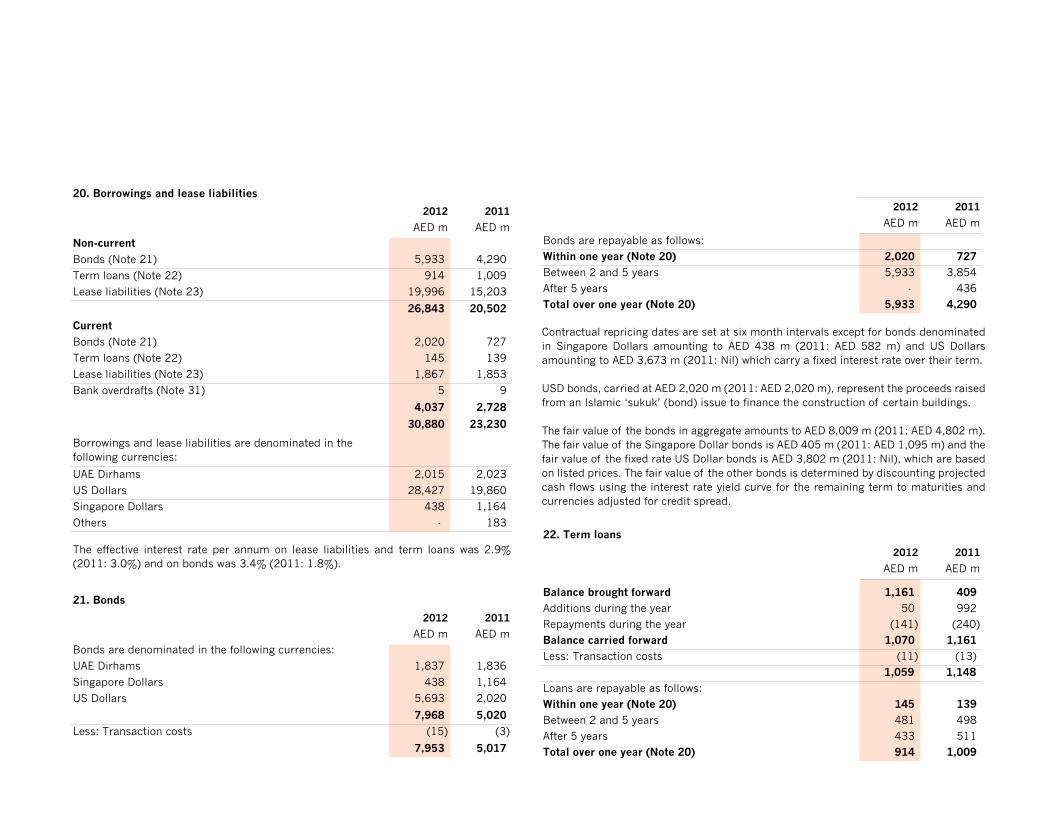
20. Borrowings and lease liabilities
2012 2011
AED m AED m
Non-current
Bonds (Note 21) 5,933 4,290
Term loans (Note 22) 914 1,009
Lease liabilities (Note 23) 19,996 15,203
26,843 20,502
Current
Bonds (Note 21) 2,020 727
Term loans (Note 22) 145 139
Lease liabilities (Note 23) 1,867 1,853
Bank overdrafts (Note 31) 5 9
4,037 2,728
30,880 23,230
UAE Dirhams 2,015 2,023
US Dollars 28,427 19,860
Singapore Dollars 438 1,164
Others - 183
21. Bonds
2012 2011
AED m AED m
Bonds are denominated in the following currencies:
UAE Dirhams 1,837 1,836
Singapore Dollars 438 1,164
US Dollars 5,693 2,020
7,968 5,020
Less: Transaction costs (15) (3)
7,953 5,017
Borrowings and lease liabilities are denominated in the following currencies:
The effective interest rate per annum on lease liabilities and term loans was 2.9%(2011: 3.0%) and on bonds was 3.4% (2011: 1.8%).
2012 2011
AED m AED m
Bonds are repayable as follows:
Within one year (Note 20) 2,020 727
Between 2 and 5 years 5,933 3,854
After 5 years - 436
Total over one year (Note 20) 5,933 4,290
22. Term loans
2012 2011
AED m AED m
Balance brought forward 1,161 409
Additions during the year 50 992
Repayments during the year (141) (240)
Balance carried forward 1,070 1,161
Less: Transaction costs (11) (13)
1,059 1,148
Loans are repayable as follows:
Within one year (Note 20) 145 139
Between 2 and 5 years 481 498
After 5 years 433 511
Total over one year (Note 20) 914 1,009
Contractual repricing dates are set at six month intervals except for bonds denominated in Singapore Dollars amounting to AED 438 m (2011: AED 582 m) and US Dollars amounting to AED 3,673 m (2011: Nil) which carry a fixed interest rate over their term.
USD bonds, carried at AED 2,020 m (2011: AED 2,020 m), represent the proceeds raised from an Islamic ‘sukuk’ (bond) issue to finance the construction of certain buildings.
The fair value of the bonds in aggregate amounts to AED 8,009 m (2011: AED 4,802 m). The fair value of the Singapore Dollar bonds is AED 405 m (2011: AED 1,095 m) and the fair value of the fixed rate US Dollar bonds is AED 3,802 m (2011: Nil), which are based on listed prices. The fair value of the other bonds is determined by discounting projected cash flows using the interest rate yield curve for the remaining term to maturities and currencies adjusted for credit spread.

eMIRATes84
22. Term loans (continued)
2012 2011
AED m AED m
UAE Dirhams 175 189
US Dollars 884 959
23. Lease liabilities
Finance leases
2012 2011
AED m AED m
Gross lease liabilities:
Within one year 2,481 2,390
Between 2 and 5 years 10,413 7,671
After 5 years 13,453 11,238
26,347 21,299
Future interest (4,484) (4,243)
Present value of finance lease liabilities 21,863 17,056
Within one year (Note 20) 1,867 1,853
Between 2 and 5 years 8,039 5,549
After 5 years 11,957 9,654
Total over one year (Note 20) 19,996 15,203
The present value of finance lease liabilities is repayable as follows:
Contractual repricing dates are set at three to six month intervals. Term loansamounting to AED 895 m (2011: AED 973 m) are secured on aircraft, aircraft enginesand parts.
The fair value of the term loans amounts to AED 1,045 m (2011: AED 1,129 m). Thefair value is determined by discounting projected cash flows using the interest rateyield curve for the remaining term to maturities and currencies adjusted for creditspread.
Loans are denominated in the following currencies:
2012 2011
AED m AED m
US Dollars 21,863 16,878
Others - 178
Operating leases
2012 2011
AED m AED m
Future minimum lease payments are as follows:
Aircraft fleet 32,497 28,832
Other 2,276 2,444
34,773 31,276
Within one year 5,148 4,485
Between 2 and 5 years 18,317 16,807
After 5 years 11,308 9,984
34,773 31,276
The lease liabilities are secured on the related aircraft and aircraft engines. In theevent of these finance leases being terminated prior to their expiry, penalties arepayable. Had these leases been cancelled at 31 March 2012, the penalties wouldhave been AED Nil (2011: AED 64 m).
The fair value of lease liabilities amounts to AED 21,297 m (2011: AED 16,377 m).The fair value is determined by discounting projected cash flows using the interestrate yield curve for the remaining term to maturities and currencies adjusted forcredit spread.
In the event of the aircraft leases being terminated prior to their expiry, penalties arepayable. Had these leases been cancelled at 31 March 2012, the penalties wouldhave been AED 459 m (2011: AED 414 m).
The present value of finance lease liabilities are denominated in the following currencies:

23. Lease liabilities (continued)
24. Retirement benefit obligations
The liabilities recognised in the consolidated statement of financial position are:
2012 2011
AED m AED m
Funded scheme
Present value of defined benefit obligations 1,251 1,099
Less: Fair value of plan assets (1,236) (1,087)
15 12
Unfunded scheme
Present value of defined benefit obligations 616 467
631 479
In accordance with the provisions of IAS 19, management has carried out an exerciseto assess the present value of its defined benefit obligations at 31 March 2012, inrespect of employees' end of service benefits payable under relevant local regulationsand contractual arrangements. The assessment assumed expected salary increasesaveraging 5.0% (2011: 5.0%) and a discount rate of 5.0% (2011: 6.0%) per annum.The present values of the defined benefit obligations at 31 March 2012 werecomputed using the actuarial assumptions set out above.
Liability recognised in the consolidated statement of financial position
Emirates is entitled to extend certain aircraft leases for a further period of one to sixyears at the end of the initial lease period. Further, Emirates is entitled to purchasethirteen out of one hundred and thirteen (2011: fifteen out of one hundred and three)aircraft under these leases.
In addition, Emirates has nine (2011: seven) Boeing aircraft contracted on operatingleases for delivery between April 2012 and March 2016.
(i) Funded scheme
The movement in the fair value of the plan assets are as follows:
2012 2011
AED m AED m
Balance brought forward 1,087 851
Contributions received 195 170
Benefits paid (55) (41)
Change in fair value 9 107
Balance carried forward 1,236 1,087
The liability of AED 15 m (2011: AED 12 m) represents the amount that will not besettled from plan assets and is calculated as the excess of the present value of thedefined benefit obligation for an individual employee over the fair value of theemployee's plan assets at the end of the reporting period.
Senior employees based in the UAE participate in a defined benefit provident schemeto which Emirates contributes a specified percentage of basic salary based upon theemployee’s grade and duration of service. Amounts contributed are invested in atrustee administered scheme and accumulate along with returns earned oninvestments. Contributions are made on a monthly basis irrespective of fundperformance and are not pooled, but are separately identifiable and attributable toeach participant. The fund comprises a diverse mix of managed funds and investmentdecisions are controlled directly by the participating employees.
Benefits receivable under the provident scheme are subject to vesting rules, which aredependent upon a participating employee's length of service. If at the time anemployee leaves employment, the accumulated vested amount, including investmentreturns, is less than the end of service benefits that would have been payable to thatemployee under relevant local regulations, Emirates pays the shortfall amountdirectly to the employee. However, if the accumulated vested amount exceeds the endof service benefits that would have been payable to an employee under relevant localregulations, the employee receives between seventy five and one hundred percent oftheir fund balance. Vested assets of the scheme are not available to Emirates or itscreditors in any circumstances.

eMIRATes86
24. Retirement benefit obligations (continued)
(ii) Unfunded schemes
The movement in the defined benefit obligation is as follows:
2012 2011
AED m AED m
Balance brought forward - as reported earlier 354
Effect of change in accounting policy (Note 38) 34
Balance brought forward - as restated 467 388
Current service cost 65 61
Interest cost 20 17
116 57
Payments made during the year (52) (56)
Balance carried forward 616 467
End of service benefits for employees who do not participate in the provident schemeor other defined contribution plans follow relevant local regulations, which are mainlybased on periods of cumulative service and levels of employees’ final basic salaries.The liability recognised in the consolidated statement of financial position is thepresent value of the defined benefit obligation at the end of the reporting period.
Contributions received include the transfer of accumulated benefits from unfundedschemes. Emirates expects to contribute approximately AED 222 m for existing planmembers during the year ending 31 March 2013.
Actuarial gains and losses and expected return on plan assets are not calculatedgiven that investment decisions relating to plan assets are under the direct control ofparticipating employees.
Payments made during the year include the transfer of accumulated benefits toEmirates’ funded scheme.
Actuarial losses
The cumulative amount of actuarial losses recognised in other comprehensive incomeis AED 207 m (2011: AED 91 m).
The total amount recognised in the consolidated income statement is as follows:
2012 2011
AED m AED m
Defined benefit plan
Funded scheme
Contributions expensed 188 159
3 2
191 161
Unfunded scheme
Current service cost 65 61
Interest cost 20 17
85 78
Defined contribution plan
Contributions expensed 154 132
Recognised in the consolidated income statement 430 371
25. Deferred revenue
26. Deferred credits
2012 2011
AED m AED m
Balance brought forward 537 622
Net additions during the year 97 109
Recognised during the year (148) (167)
Transferred to property, plant and equipment - (27)
Balance carried forward 486 537
Net change in the present value of defined benefit obligations over plan assets
Deferred revenue relates to the frequent flyer programme and represents the fair value of outstanding award credits. Revenue is recognised when Emirates fulfills its obligations by supplying free or discounted goods or services on the redemption of the award credits.
Deferred revenue is classified within current and non-current liabilities based on the expected redemption pattern.

26. Deferred credits (continued)
2012 2011
AED m AED m
Deferred credits will be recognised as follows:
Within one year 136 136
Over one year 350 401
27. Deferred income tax
2012 2011
AED m AED m
Deferred income tax asset 10 -
Deferred income tax liability (2)
10 (2)
Balance brought forward (2) (4)
Credited to the consolidated income statement (Note 9) 12 2
Balance carried forward 10 (2)
Deferred credits transferred to property, plant and equipment are consequent to achange in the classification of certain aircraft from an operating lease to a financelease.
The deferred income tax asset is on account of unused tax losses.
Deferred tax assets and liabilities are offset when there is a legally enforceable rightto offset current tax assets against current tax liabilities and when the deferred taxesrelate to the same income tax authority. The analysis of the deferred tax asset andthe deferred tax liability is as follows:
The movement in the deferred income tax account is as follows:
A deferred tax asset has not been recognised in respect of carried forward tax lossesamounting to AED 1,869 m (2011: AED 1,620 m).
28. Trade and other payables
2012 2011
AED m AED m
Trade payables and acc uals 10,521 10,112
Related parties (Note 35) 622 390
Passenger and cargo sales in advance 9 458 7 080
20,601 17,582 Less: Payables over one year - (3 )
20,601 17,551
D m D
Within one year
Over one y ar 350 401
ED m ED m
Deferred income tax liabi
(2)
Bal nc
Credi ed to he consolida 12 2
Balance a ed fo ward 10 2
change he c ssification of ce tain a c a t ro an operati g l ase to a finan elease
to offset cu e t tax ass ts aga s cu e t x ia i ities a d w en t e d fe ed xesr a e to th same ncome tax autho ty he ana ys s f th de e ed tax asse andt e d e ed ax lia lity is s l s:
follows:
a oun ng to ED 1 869 m ( 011 AED 1, 20
ED m ED m
5 1
Related pa t es (No e 35) 622 90
Passen er and ca go a e 458 080
0,601 7,582 (31
551
29. Commitments
Capital commitments
2012 2011
AED m AED m
Authorised and contracted:
Aircraft fleet 163,489 140,145
Non-aircraft 2,021 1,451
Joint ventures 116 66
165,626 141,662
Authorised but not contracted:
Non-aircraft 4,683 2,429
Joint ventures 30 61
4,713 2,490
170,339 144,152
Financial year Aircraft
2012 - 2013 32
Beyond 2012 - 2013 191
In addition, options are held on fifty Airbus and twenty Boeing aircraft.
Commitments have been entered into for the purchase of aircraft fordelivery as follows (Note 11):
h f
The carrying value of trade and other payables over one year approximate their fair value.

eMIRATes88
29. Commitments (continued)
Operational commitments
2012 2011
AED m AED m
Sales and marketing 1,881 1,347
30. Guarantees
2012 2011
AED m AED m
370 357
31. Short term bank deposits and cash and cash equivalents
2012 2011
AED m AED m
Bank deposits 14,284 12,753
Cash and bank 1,303 1,220
Cash and bank balances 15,587 13,973
Less: Short term bank deposits - over 3 months (8,055) (3,777)
7,532 10,196
Bank overdraft (Note 20) (5) (9)
7,527 10,187
Cash and bank balances earned an effective interest rate of 2.6% (2011: 3.6%) perannum.
Cash and cash equivalents as per the consolidated statement of cash flows
Performance bonds and letters of credit provided by bankers in the normal course of business
Cash and cash equivalents as per the consolidated statement of financial position
32. Cash outflow on property, plant and equipment
2012 2011
AED m AED m
Payments for property, plant and equipment 13,561 12,189
Less: Assets acquired under finance leases (6,761) (5,685)
6,800 6,504
For the purposes of the consolidated statement of cash flows, cash outflow onproperty, plant and equipment is analysed as follows:

33. Derivative financial instruments
DescriptionTerm AED m Term AED m
Non-current assets
Cash flow hedge
Currency swaps and forwards 2012-2017 69 -
69 - Current assets
Cash flow hedge
Currency swaps and forwards 8 53
Fair value through profit and loss
Jet fuel price futures and options - 70
8 123 Non-current liabilities
Cash flow hedge
Interest rate swaps 2012-2023 (830) 2011-2021 (552)
Currency swaps and forwards 2012-2016 (127) 2011-2017 (90)
(957) (642)
Current liabilities
Cash flow hedge
Interest rate swaps (1) (4)
Currency swaps and forwards (39) (57)
(40) (61)
The notional principal amounts outstanding are:
2012 2011
AED m AED m
Interest rate contracts 11,715 6,822
Currency contracts 4,082 4,998
Fuel price contracts - 4,297
20112012
Gains on account of terminated interest rate derivatives amounting to AED 3 m(2011: AED 19 m) will enter into the determination of profit during 2012.
The maximum exposure to credit risk at the reporting date is the fair value of thederivative assets in the consolidated statement of financial position.
The full fair value of the derivative instrument is classified as non-current if theremaining maturity of the hedged item is more than 12 months as at the end of thereporting period.
Net losses on account of terminated currency derivatives amounting to AED 3 m(2011: AED 27 m) will enter into the determination of profit between 2012 and 2017.

eMIRATes90
34. Classification of financial instruments
The accounting policies for financial instruments have been applied to the line items below:
DescriptionLoans and
receivables
Derivative financial
instruments
Financial liabilities at
amortised cost Total
AED m AED m AED m AED m
2011
Assets
Loans and other receivables (excluding prepayments) 1,623 - - 1,623
Derivative financial instruments - 123 - 123
Trade and other receivables (excluding prepayments and advance lease rentals) 5,440 - - 5,440
Short term bank deposits 3,777 - - 3,777
Cash and cash equivalents 10,196 - - 10,196
Total 21,036 123 - 21,159
Liabilities
Borrowings and lease liabilities - - 23,230 23,230
Trade and other payables (excluding passenger and cargo sales in advance and other non financial liabilities) - - 9,665 9,665
Derivative financial instruments - 703 - 703
Total - 703 32,895 33,598
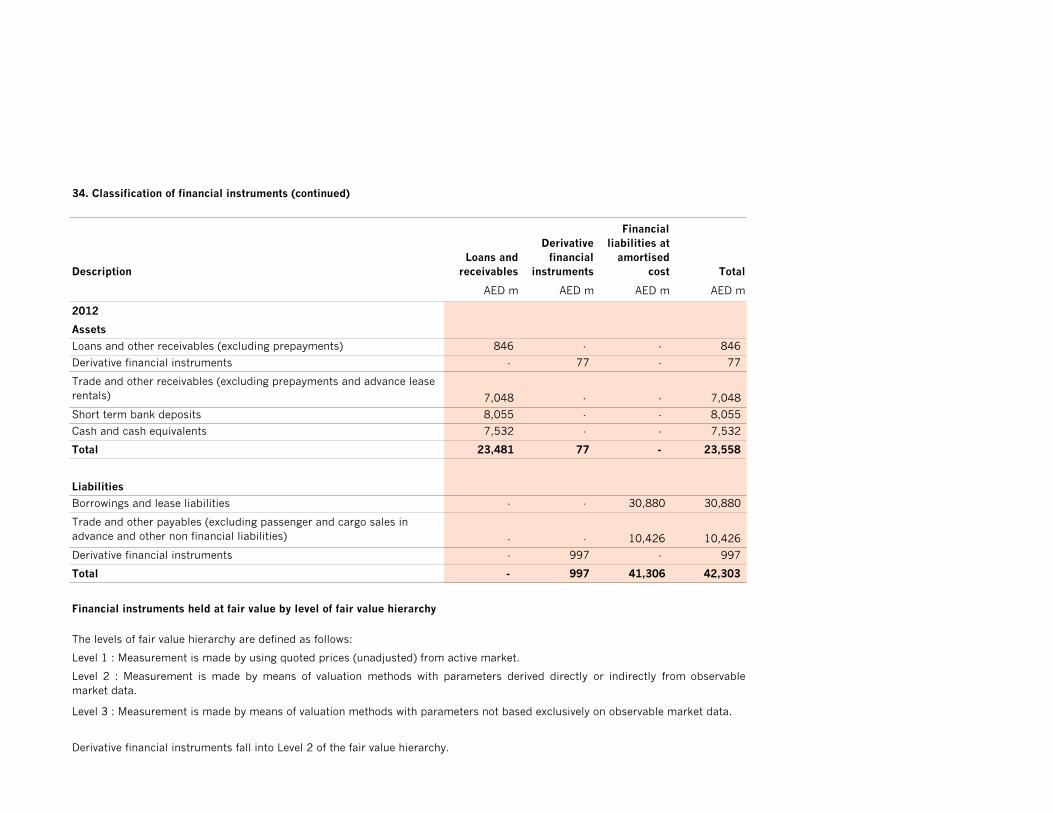
34. Classification of financial instruments (continued)
DescriptionLoans and
receivables
Derivative financial
instruments
Financial liabilities at
amortised cost Total
AED m AED m AED m AED m
2012
Assets
Loans and other receivables (excluding prepayments) 846 - - 846
Derivative financial instruments - 77 - 77
Trade and other receivables (excluding prepayments and advance lease rentals) 7,048 - - 7,048
Short term bank deposits 8,055 - - 8,055
Cash and cash equivalents 7,532 - - 7,532
Total 23,481 77 - 23,558
Liabilities
Borrowings and lease liabilities - - 30,880 30,880
Trade and other payables (excluding passenger and cargo sales in advance and other non financial liabilities) - - 10,426 10,426
Derivative financial instruments - 997 - 997
Total - 997 41,306 42,303
Financial instruments held at fair value by level of fair value hierarchy
The levels of fair value hierarchy are defined as follows:
Level 1 : Measurement is made by using quoted prices (unadjusted) from active market.
Level 2 : Measurement is made by means of valuation methods with parameters derived directly or indirectly from observablemarket data.
Level 3 : Measurement is made by means of valuation methods with parameters not based exclusively on observable market data.
Derivative financial instruments fall into Level 2 of the fair value hierarchy.
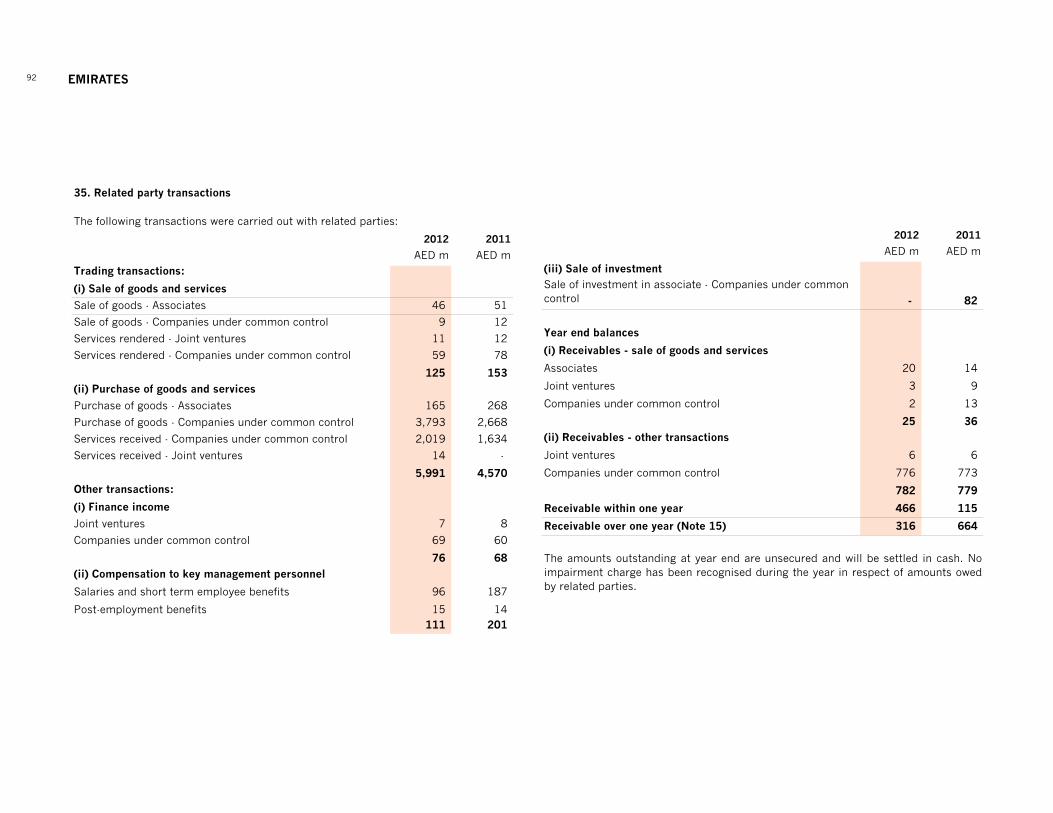
eMIRATes92
35. Related party transactions
The following transactions were carried out with related parties:
2012 2011
AED m AED m
Trading transactions:
(i) Sale of goods and services
Sale of goods - Associates 46 51
Sale of goods - Companies under common control 9 12
Services rendered - Joint ventures 11 12
Services rendered - Companies under common control 59 78
125 153
(ii) Purchase of goods and services
Purchase of goods - Associates 165 268
Purchase of goods - Companies under common control 3,793 2,668
Services received - Companies under common control 2,019 1,634
Services received - Joint ventures 14 -
5,991 4,570
Other transactions:
(i) Finance income
Joint ventures 7 8
Companies under common control 69 60
76 68
(ii) Compensation to key management personnel
Salaries and short term employee benefits 96 187
Post-employment benefits 15 14 111 201
2012 2011
AED m AED m
(iii) Sale of investmentSale of investment in associate - Companies under common control - 82
Year end balances
(i) Receivables - sale of goods and services
Associates 20 14
Joint ventures 3 9
Companies under common control 2 13
25 36
(ii) Receivables - other transactions
Joint ventures 6 6
Companies under common control 776 773
782 779
Receivable within one year 466 115
Receivable over one year (Note 15) 316 664
The amounts outstanding at year end are unsecured and will be settled in cash. Noimpairment charge has been recognised during the year in respect of amounts owedby related parties.

35. Related party transactions (continued)
2012 2011
AED m AED m
(iii) Payables - purchase of goods and services (Note 28)
Associates 29 30
Companies under common control 570 360
599 390
(iv) Other payables (Note 28)
Parent company 23 -
(iv) Loans
Joint ventures 83 96
Companies under common control 1,331 1,062
1,414 1,158 Movement in the loans were as follows:
Balance brought forward 1,158 604
Additions during the year 608 571
Repayments during the year (346) (18)
Currency translation differences (6) 1
Balance carried forward 1,414 1,158
Receivable within one year 948 265
Receivable over one year (Note 15) 466 893
Receivables from and loans to companies under common control relate togovernment entities, which are unrated. Management is of the opinion that theamounts are fully recoverable.
The effective interest rate on the loans was 3.8% (2011: 5.2%) per annum.
2012 2011
AED m AED m
(v) Loans and advances to key management personnel
Balance brought forward 4 6
Additions during the year 6 3
Repayments during the year (5) (5)
Balance carried forward 5 4
Receivable within one year 3 3
Receivable over one year (Note 15) 2 1
In addition to the above, Emirates has also entered into transactions with othergovernment controlled entities in the normal course of business. The amountsinvolved are, both individually and in aggregate, not significant.
Loans and advances are interest free and repayable over a period up to sixty months.Emirates has the right to recover outstanding loans and advances against the finaldues payable to the employees.
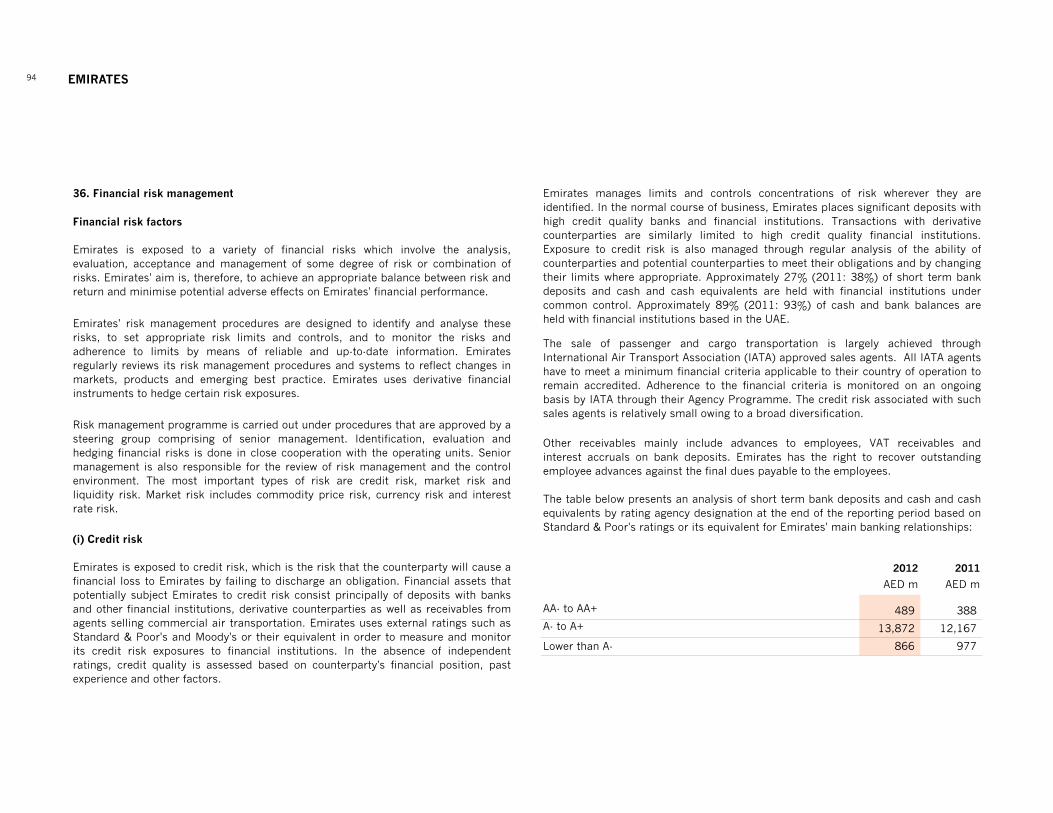
eMIRATes94
36. Financial risk management
Financial risk factors
(i) Credit risk
Emirates is exposed to a variety of financial risks which involve the analysis,evaluation, acceptance and management of some degree of risk or combination ofrisks. Emirates' aim is, therefore, to achieve an appropriate balance between risk andreturn and minimise potential adverse effects on Emirates' financial performance.
Emirates' risk management procedures are designed to identify and analyse theserisks, to set appropriate risk limits and controls, and to monitor the risks andadherence to limits by means of reliable and up-to-date information. Emiratesregularly reviews its risk management procedures and systems to reflect changes inmarkets, products and emerging best practice. Emirates uses derivative financialinstruments to hedge certain risk exposures.
Risk management programme is carried out under procedures that are approved by asteering group comprising of senior management. Identification, evaluation andhedging financial risks is done in close cooperation with the operating units. Seniormanagement is also responsible for the review of risk management and the controlenvironment. The most important types of risk are credit risk, market risk andliquidity risk. Market risk includes commodity price risk, currency risk and interestrate risk.
Emirates is exposed to credit risk, which is the risk that the counterparty will cause afinancial loss to Emirates by failing to discharge an obligation. Financial assets thatpotentially subject Emirates to credit risk consist principally of deposits with banksand other financial institutions, derivative counterparties as well as receivables fromagents selling commercial air transportation. Emirates uses external ratings such asStandard & Poor's and Moody's or their equivalent in order to measure and monitorits credit risk exposures to financial institutions. In the absence of independentratings, credit quality is assessed based on counterparty's financial position, pastexperience and other factors.
2012 2011
AED m AED m
AA- to AA+ 489 388 A- to A+ 13,872 12,167
Lower than A- 866 977
Emirates manages limits and controls concentrations of risk wherever they areidentified. In the normal course of business, Emirates places significant deposits withhigh credit quality banks and financial institutions. Transactions with derivativecounterparties are similarly limited to high credit quality financial institutions.Exposure to credit risk is also managed through regular analysis of the ability ofcounterparties and potential counterparties to meet their obligations and by changingtheir limits where appropriate. Approximately 27% (2011: 38%) of short term bankdeposits and cash and cash equivalents are held with financial institutions undercommon control. Approximately 89% (2011: 93%) of cash and bank balances areheld with financial institutions based in the UAE.
The sale of passenger and cargo transportation is largely achieved throughInternational Air Transport Association (IATA) approved sales agents. All IATA agentshave to meet a minimum financial criteria applicable to their country of operation toremain accredited. Adherence to the financial criteria is monitored on an ongoingbasis by IATA through their Agency Programme. The credit risk associated with suchsales agents is relatively small owing to a broad diversification.
The table below presents an analysis of short term bank deposits and cash and cashequivalents by rating agency designation at the end of the reporting period based onStandard & Poor's ratings or its equivalent for Emirates' main banking relationships:
Other receivables mainly include advances to employees, VAT receivables andinterest accruals on bank deposits. Emirates has the right to recover outstandingemployee advances against the final dues payable to the employees.

36. Financial risk management (continued)
(ii) Market risk
Jet fuel price risk
Currency risk
Emirates is in a net payer position with respect to the US Dollar and in a net surplusposition for other currencies. Currency surpluses are converted to US Dollar and UAEDirham funds. Currency risks arise mainly from Emirates' revenue earning activitiesin UK Pounds, Euro, Australian Dollars and Japanese Yen. Currency risks are hedgedusing forwards and options, as appropriate, as well as by way of a natural hedgebetween foreign currency inflows and outflows.
Emirates is exposed to market risk, which is the risk that the fair value or future cashflows of a financial instrument will fluctuate because of changes in market prices.Market risk comprises three types of risk - jet fuel price risk, currency risk andinterest rate risk.
Emirates is exposed to volatility in the price of jet fuel and closely monitors the actualcost against the forecast cost. To manage the price risk, Emirates utilises commodityfutures and options to achieve a level of control over higher jet fuel costs so thatprofitability is not adversely affected. The hedging activity during the year was notsignificant.
Emirates is exposed to the effects of fluctuation in the prevailing foreign currencyexchange rates on its financial position and cash flows. Exposure arises due toexchange rate fluctuations between the UAE Dirham and other currencies generatedfrom Emirates revenue earning and borrowing activities. Long term debt obligationsare mainly denominated in UAE Dirhams, the functional currency or in US Dollars towhich the UAE Dirham is pegged. Currency exposure exists on the Singapore Dollarbond, the summarised quantitative data for which is available in Note 21. Seniormanagement monitors currency positions on a regular basis.
Interest rate risk
Sensitivity analysis of market risk
Effect onprofit
Effect onequity
Effect onprofit
Effect onequity
AED m AED m AED m AED mInterest cost- 100 basis pointsUAE Dirhams 8 8 21 21 US Dollars 119 (381) 76 (209)Singapore Dollars 1 1 6 6 Others - (13) - (21)
128 (385) 103 (203)+ 100 basis pointsUAE Dirhams (8) (8) (21) (21)US Dollars (119) 381 (76) 209 Singapore Dollars (1) (1) (6) (6)Others - 13 - 21
(128) 385 (103) 203
The following sensitivity analysis shows how profit and equity would change if themarket risk variables had been different at the end of the reporting period with allother variables held constant and has been computed on the basis of assumptionsand indices used and considered by other market participants.
Emirates is exposed to the effects of fluctuations in the prevailing levels of interestrates on borrowings and investments. Exposure arises from interest rate fluctuationsin the international financial markets with respect to interest cost on its long termdebt obligations, operating lease rentals and interest income on its cash surpluses.The key reference rates based on which interest costs are determined are LIBOR,EIBOR for UAE Dirhams and SIBOR for Singapore Dollars. Summarised quantitativedata is available in Note 20 for interest cost exposures.
2012 2011
Borrowings taken at variable rates expose Emirates to cash flow interest rate riskwhile borrowings issued at fixed rates expose Emirates to fair value interest rate risk.Emirates targets a balanced portfolio approach, whilst nevertheless taking advantageof opportune market movements, by hedging around half of its net interest rateexposure going forward, using appropriate hedging solutions including interestswaps. Variable rate debt and cash surpluses are mainly denominated in UAEDirhams and US Dollars.
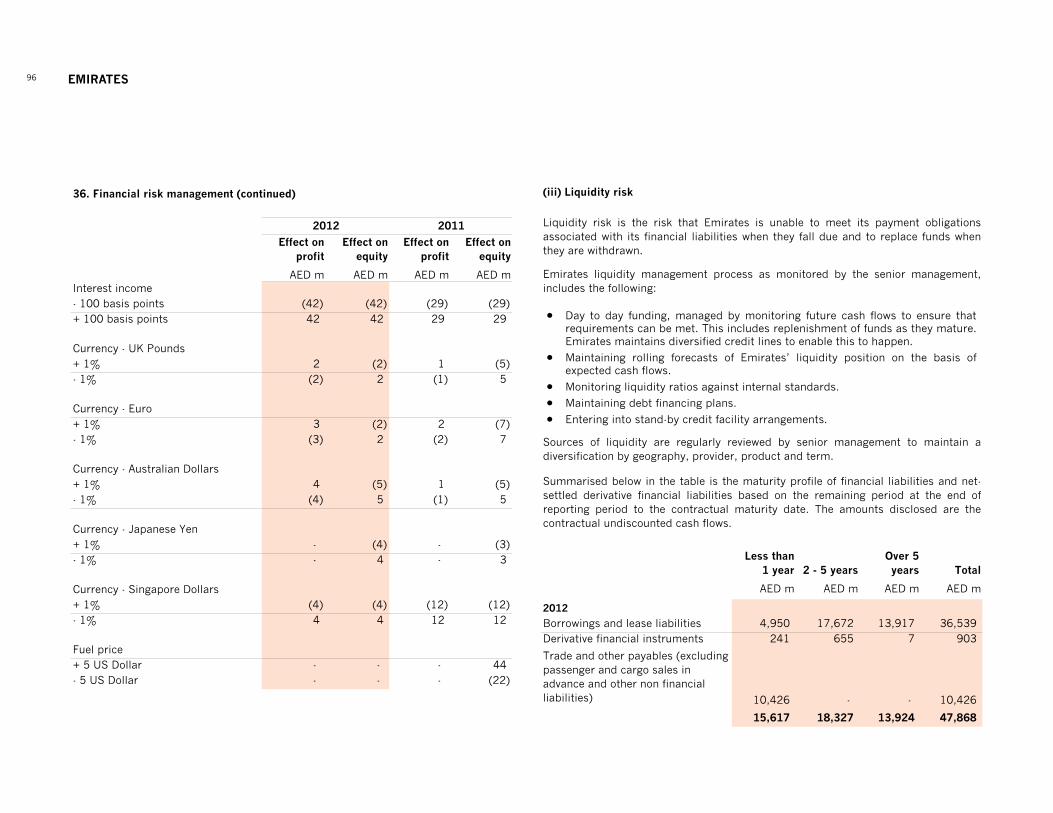
eMIRATes96
36. Financial risk management (continued)
Effect onprofit
Effect onequity
Effect onprofit
Effect onequity
AED m AED m AED m AED mInterest income- 100 basis points (42) (42) (29) (29)+ 100 basis points 42 42 29 29
Currency - UK Pounds+ 1% 2 (2) 1 (5)- 1% (2) 2 (1) 5
Currency - Euro+ 1% 3 (2) 2 (7)- 1% (3) 2 (2) 7
Currency - Australian Dollars+ 1% 4 (5) 1 (5)- 1% (4) 5 (1) 5
Currency - Japanese Yen+ 1% - (4) - (3)- 1% - 4 - 3
Currency - Singapore Dollars+ 1% (4) (4) (12) (12)- 1% 4 4 12 12
Fuel price+ 5 US Dollar - - - 44 - 5 US Dollar - - - (22)
20112012
(iii) Liquidity risk
Less than1 year 2 - 5 years
Over 5 years Total
AED m AED m AED m AED m
2012
Borrowings and lease liabilities 4,950 17,672 13,917 36,539 Derivative financial instruments 241 655 7 903
Trade and other payables (excluding passenger and cargo sales in advance and other non financial liabilities) 10,426 - - 10,426
15,617 18,327 13,924 47,868
Sources of liquidity are regularly reviewed by senior management to maintain adiversification by geography, provider, product and term.
Emirates liquidity management process as monitored by the senior management,includes the following:
Liquidity risk is the risk that Emirates is unable to meet its payment obligationsassociated with its financial liabilities when they fall due and to replace funds whenthey are withdrawn.
Summarised below in the table is the maturity profile of financial liabilities and net-settled derivative financial liabilities based on the remaining period at the end ofreporting period to the contractual maturity date. The amounts disclosed are thecontractual undiscounted cash flows.
• Day to day funding, managed by monitoring future cash flows to ensure thatrequirements can be met. This includes replenishment of funds as they mature.Emirates maintains diversified credit lines to enable this to happen.
• Maintaining rolling forecasts of Emirates’ liquidity position on the basis ofexpected cash flows.
• Monitoring liquidity ratios against internal standards.
• Maintaining debt financing plans.
• Entering into stand-by credit facility arrangements.

36. Financial risk management (continued)
Less than1 year 2 - 5 years
Over 5 years Total
AED m AED m AED m AED m
2011
Borrowings and lease liabilities 3,196 12,523 12,328 28,047 Derivative financial instruments 299 335 (24) 610
Trade and other payables (excluding passenger and cargo sales in advance and other non financial liabilities) 9,634 31 - 9,665
13,129 12,889 12,304 38,322
37. Capital management
Emirates also monitors capital on the basis of a gearing ratio which is calculated asthe ratio of borrowings and lease liabilities, net of cash to total equity. In 2012 thisratio was 71.2% (2011: 44.5%) and if aircraft operating leases are included, thesame ratio was 162.1% (2011: 127.6%).
Emirates' objective when managing capital is to safeguard its ability to continue as agoing concern in order to provide returns for its Owner and to maintain an optimalcapital structure to reduce the cost of capital.
Emirates monitors the return on Owner's equity, which is defined as the profitattributable to the Owner expressed as a percentage of average Owner's equity.Emirates seeks to provide a better return to the Owner by borrowing and takingaircraft on operating leases to meet its growth plans. In 2012, Emirates achieved areturn on Owner's equity funds of 7.2% (2011: 28.4%) in comparison to an effectiveinterest rate of 3.0% (2011: 2.7%) on borrowings.
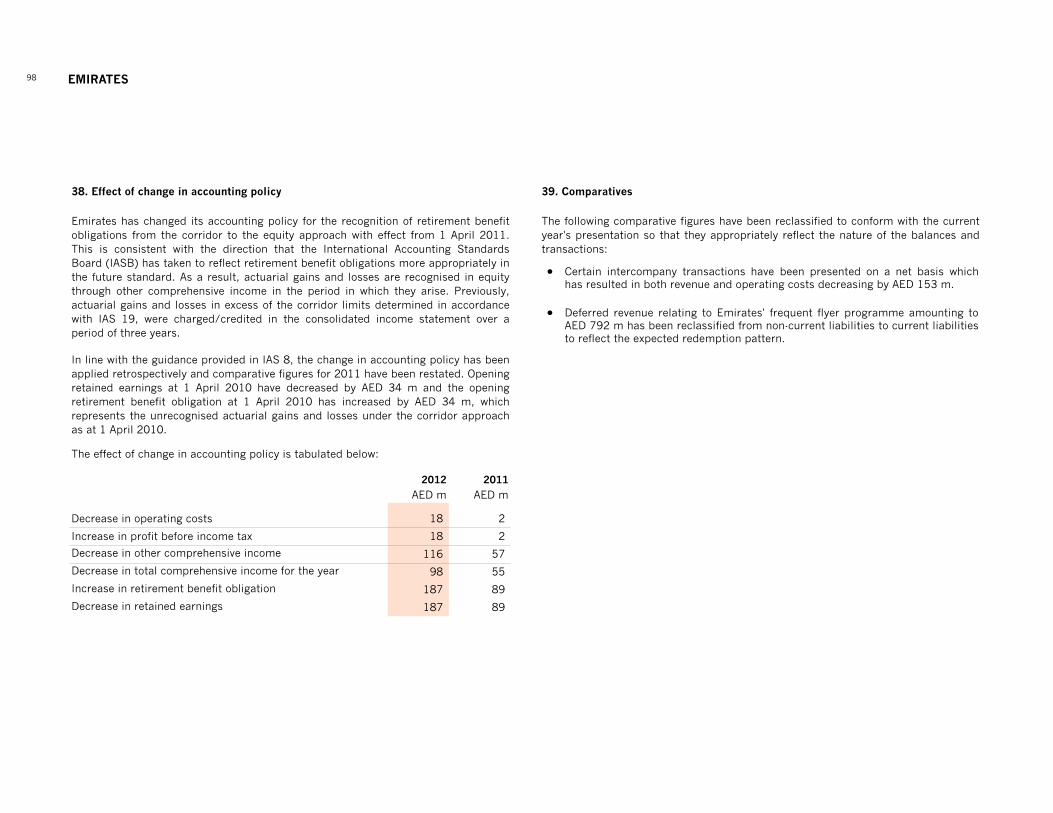
eMIRATes98
38. Effect of change in accounting policy
2012 2011
AED m AED m
Decrease in operating costs 18 2
Increase in profit before income tax 18 2
116 57
98 55
187 89
187 89
Emirates has changed its accounting policy for the recognition of retirement benefitobligations from the corridor to the equity approach with effect from 1 April 2011.This is consistent with the direction that the International Accounting StandardsBoard (IASB) has taken to reflect retirement benefit obligations more appropriately inthe future standard. As a result, actuarial gains and losses are recognised in equitythrough other comprehensive income in the period in which they arise. Previously,actuarial gains and losses in excess of the corridor limits determined in accordancewith IAS 19, were charged/credited in the consolidated income statement over aperiod of three years.
In line with the guidance provided in IAS 8, the change in accounting policy has beenapplied retrospectively and comparative figures for 2011 have been restated. Openingretained earnings at 1 April 2010 have decreased by AED 34 m and the openingretirement benefit obligation at 1 April 2010 has increased by AED 34 m, whichrepresents the unrecognised actuarial gains and losses under the corridor approachas at 1 April 2010.
Decrease in total comprehensive income for the year
The effect of change in accounting policy is tabulated below:
Decrease in other comprehensive income
Increase in retirement benefit obligation
Decrease in retained earnings
39. Comparatives
The following comparative figures have been reclassified to conform with the currentyear's presentation so that they appropriately reflect the nature of the balances andtransactions:
• Certain intercompany transactions have been presented on a net basis whichhas resulted in both revenue and operating costs decreasing by AED 153 m.
• Deferred revenue relating to Emirates' frequent flyer programme amounting to
AED 792 m has been reclassified from non-current liabilities to current liabilitiesto reflect the expected redemption pattern.

Report on the consolidated financial statements
We have audited the accompanying consolidated financial statements of dnata and its subsidiaries (together referred to as “dnata”), which comprise the consolidated statement of financial position as of 31 March 2012 and the consolidated income statement, consolidated statement of comprehensive income, consolidated statement of changes in equity and consolidated statement of cash flows for the year then ended, and a summary of significant accounting policies and other explanatory notes.
Management’s responsibility for the consolidated financial statements
Management is responsible for the preparation and fair presentation of these consolidated financial statements in accordance with International Financial Reporting Standards, and for such internal control as management determines is necessary to enable the preparation of consolidated financial statements that are free from material misstatement, whether due to fraud or error.
Auditor’s responsibility
Our responsibility is to express an opinion on these consolidated financial statements based on our audit. We conducted our audit in accordance with International Standards on Auditing. Those Standards require that we comply with ethical requirements and plan and perform the audit to obtain reasonable assurance whether the consolidated financial statements are free from material misstatement.
An audit involves performing procedures to obtain audit evidence about the amounts and disclosures in the consolidated financial statements. The procedures selected depend on the auditor’s judgement, including the assessment of the risks of material misstatement of the consolidated financial statements, whether due to fraud or error.
In making those risk assessments, the auditor considers internal control relevant to the entity’s preparation and fair presentation of the consolidated financial statements in order to design audit procedures that are appropriate in the circumstances, but not for the purpose of expressing an opinion on the effectiveness of the entity’s internal control. An audit also includes evaluating the appropriateness of accounting policies used and the reasonableness of accounting estimates made by management, as well as evaluating the overall presentation of the consolidated financial statements.
We believe that the audit evidence we have obtained is sufficient and appropriate to provide a basis for our audit opinion.
Opinion
In our opinion, the accompanying consolidated financial statements present fairly, in all material respects, the financial position of dnata as of 31 March 2012, and its financial performance and its cash flows for the year then ended in accordance with International Financial Reporting Standards.
PricewaterhouseCoopers2 May 2012
Warwick HuntRegistered Auditor Number 643 Dubai, United Arab Emirates
dnata
INDEPENDENT AUDITOR’S REPORT TO THE OWNER OF dnata

100 dnata
CONSOLIDATED INCOME STATEMENTFOR THE YEAR ENDED 31 MARCH 2012
CONSOLIDATED STATEMENT OF COMPREHENSIVE INCOMEFOR THE YEAR ENDED 31 MARCH 2012
Notes 1 to 29 form an integral part of the consolidated financial statements.
Note 2012 2011
AED m AED m
Revenue 4 6,907 4,327
Other operating income 93 79
Operating costs 5 (6,207) (3,906)
Operating profit 793 500
Finance income 6 42 85
Finance costs 6 (34) (17)
Share of results in associates and joint ventures 10 68 24
Profit before income tax 869 592
Income tax expense 7 (32) (11)
Profit for the year 837 581
Profit attributable to non-controlling interests 29 5
Profit attributable to dnata's Owner 808 576
te 0 0
D m m
Reven 4 6 07 4 327
Othe o e a ing 93 79
O e ti co ts 5 07 06
O e ti g p 793 5
F nance ncome 6 42 85
F nance cost (34 (17
Sha resu ts in 68 24
Profit be ore inco 869 592
Income tax expense 32 1
Profit for th year 837 581
CONSOL DA ED
Profit for the year 837 581
Currency translation differences 2 141
Net investment hedge 16 (9) (38)
Actuarial losses on retirement benefit obligations 15 (47) (25)
Share of other comprehensive income in associates 10 - (37)
Other comprehensive income (54) 41
Total comprehensive income for the year 783 622
Total comprehensive income attributable to non-controlling interests 28 6
Total comprehensive income attributable to dnata's Owner 755 616
N t 1 9 f i f t t f i l

dnata
CONSOLIDATED STATEMENT OF FINANCIAL POSITIONAS AT 31 MARCH 2012
Notes 1 to 29 form an integral part of the consolidated financial statements.
Sheikh Ahmed bin Saeed Al-MaktoumChairman and Chief Executive
Gary ChapmanPresident
d t
Note 2012 2011
AED m AED m
ASSETS
Non-current assets
Property, plant and equipment 8 1,184 1,132
Intangible assets 9 2,036 1,458
Investments in associates and joint ventures 10 477 435
Advance lease rentals 11 27 28
Trade and other receivables 13 15 -
Loans to related parties 25 1 1
Deferred income tax assets 18 20 18
3,760 3,072
Current assets
Inventories 12 87 88
Trade and other receivables 13 1,259 1,157
Income tax asset 14 -
Short term bank deposits 23 481 586
Cash and cash equivalents 23 1,518 1,497
3,359 3,328
Total assets 7,119 6,400
Note 2012 2011
AED m AED m
EQUITY AND LIABILITIES
Capital and reserves
Capital 14 63 63
Retained earnings 3,513 3,099
Other reserves 38 47
Attributable to dnata's Owner 3,614 3,209
Non-controlling interests 69 73
Total equity 3,683 3,282
Non-current liabilities
Borrowings and lease liabilities 16 600 674
Retirement benefit obligations 15 331 257
Trade and other payables 19 154 -
Other provisions 17 42 36
Deferred income tax liabilities 18 148 148
1,275 1,115
Current liabilities
Trade and other payables 19 1,991 1,821
Other provisions 17 20 23
Borrowings and lease liabilities 16 135 140
Income tax liabilities 15 19
2,161 2,003
Total liabilities 3,436 3,118
Total equity and liabilities 7,119 6,400
The consolidated financial statements were approved on 2 May 2012 and signed by:

102 dnata
CONSOLIDATED STATEMENT OF CHANGES IN EQUITYFOR THE YEAR ENDED 31 MARCH 2012
Capital Capital reserve
Translationreserve
Retainedearnings Total
Non-controlling
interestsTotal
equityAED m AED m AED m AED m AED m AED m AED m
1 April 2010 - as reported earlier 63 1 (46) 3,176 3,194 - 3,194
Effect of change in accounting policy (Note 29) - - 9 (95) (86) - (86)
1 April 2010 - as restated 63 1 (37) 3,081 3,108 - 3,108
Currency translation differences - - 140 - 140 1 141
Net investment hedge (Note 16) - - (38) - (38) - (38)
Actuarial losses on retirement benefit obligations (Note 15) - - - (25) (25) - (25)
Share of other comprehensive income in associates net of deferred tax (Note 10) - - (4) (33) (37) - (37)
Other comprehensive income - - 98 (58) 40 1 41
Profit for the year - - - 576 576 5 581
Total comprehensive income - - 98 518 616 6 622
Non-controlling interest on acquisition of subsidiary (Note 27) - - - - - 146 146
Acquired from non-controlling interest - (15) - - (15) (67) (82)
Dividends - - - (500) (500) (12) (512)
Transactions with owners - (15) - (500) (515) 67 (448)
31 March 2011 63 (14) 61 3,099 3,209 73 3,282
Currency translation differences - - 1 - 1 (1) -
Transfer to consolidated income statement - - 2 - 2 - 2
Net investment hedge (Note 16) - - (9) - (9) - (9)
Actuarial losses on retirement benefit obligations (Note 15) - - - (47) (47) - (47)
Share of other comprehensive income in associates net of deferred tax (Note 10) - - (3) 3 - - -
Other comprehensive income - - (9) (44) (53) (1) (54)
Profit for the year - - - 808 808 29 837
Total comprehensive income - - (9) 764 755 28 783
Dividends - - - (350) (350) (32) (382)
Transactions with owners - - - (350) (350) (32) (382)
31 March 2012 63 (14) 52 3,513 3,614 69 3,683
Attributable to dnata's Owner
Capital reserve includes the difference between the carrying value of the non-controlling interest acquired and the fair value of the consideration paid.
Notes 1 to 29 form an integral part of the consolidated financial statements.

2012 2011
AED m AED m
Operating activities
Profit before income tax 869 592
Adjustments for:
Depreciation and amortisation (Note 5) 347 260
Finance income - net (Note 6) (8) (68)
Amortisation of advance lease rentals (Note 11) 1 1
Share of results in associates and joint ventures (Note 10) (68) (24)
Net loss on sale / dilution of investment in associates (Note 10) 5 -
Gain on sale of property, plant and equipment (3) (4)
Net provision for impairment of trade receivables (Note 13) 9 13
Provision for employee benefits (Note 5) 120 71
Employee benefit payments (90) (60)
Income tax paid (62) (38)
Change in inventories 4 11
Change in trade and other receivables (114) (115)
Change in trade and other payables 157 262
Net cash generated from operating activities 1,167 901
2012 2011
AED m AED m
Investing activities
Additions to property, plant and equipment (Note 8) (320) (158)
Additions to intangible assets (Note 9) (33) (58)
Proceeds from sale of property, plant and equipment 17 11
Investments in associates and joint ventures (Note 10) (13) (5)
Dividends from associates and joint ventures (Note 10) 26 18
Proceeds from sale of an associate 8 -
Acquisition of subsidiary (Note 27) (200) (543)
Deferred consideration paid (43) -
Acquisition of non controlling interest - (82)
Loans to related parties - net (Note 25) (16) (16)
Movement in short term bank deposits 105 (584)
Finance income 38 84
Net cash used in investing activities (431) (1,333)
Financing activities
Net movement in term loans (Note 16) (166) (64)
Net lease liabilities 14 (3)
Finance cost (34) (17)
Dividend paid to non controlling interest (32) (12)
Dividend paid (500) -
Net cash used in financing activities (718) (96)
Net increase / (decrease) in cash and cash equivalents 18 (528)
Cash and cash equivalents at beginning of year 1,465 1,982
Effects of exchange rate changes 9 11
Cash and cash equivalents at end of year (Note 23) 1,492 1,465
dnata
CONSOLIDATED STATEMENT OF CASH FLOWSFOR THE YEAR ENDED 31 MARCH 2012
Notes 1 to 29 form an integral part of the consolidated financial statements.
dnata
NOTES TO THE CONSOLIDATED FINANCIAL STATEMENTSFOR THE YEAR ENDED 31 MARCH 2012
104
1. General information dnata comprises dnata (“the parent company”) and its subsidiaries. dnata was incorporated in the emirate of Dubai, UAE with limited liability, under an Emiri Decree issued by H.H. Sheikh Maktoum bin Rashid Al-Maktoum on 4 April 1987. On that date, the total assets and liabilities of Dubai National Air Travel Agency were transferred to dnata, with effect from 1 April 1987, for nil consideration. dnata is wholly owned by the Investment Corporation of Dubai, a Government of Dubai entity. dnata is incorporated and domiciled in Dubai, UAE. The address of its registered office is Dnata Travel Centre, PO Box 1515, Dubai, UAE. The main activities of dnata comprise:
• aircraft handling and engineering services
• handling services for export and import cargo
• inflight catering
• information technology services
• representing airlines as their general sales agent
• travel agency and other travel related services 2. Summary of significant accounting policies A summary of the significant accounting policies, which have been applied consistently in the preparation of these consolidated financial statements, is set out below. Basis of preparation The consolidated financial statements have been prepared in accordance with and comply with International Financial Reporting Standards and IFRIC interpretations. The consolidated financial statements are prepared under the historical cost convention.
Standards, interpretations and amendments to published standards that are not yet effective, have not been early adopted and are relevant to dnata’s operations At the date of authorisation of these consolidated financial statements, certain new standards, interpretations and amendments to the existing standards have been published that are mandatory for accounting periods commencing after 1 April 2012 or later periods, but have not been early adopted. Management is currently assessing the following standards, interpretations and amendments which are likely to have an impact on dnata’s operations: • IAS 1 (revised), Presentation of Financial Statements (effective from 1 July 2012) • IAS 19 (revised), Employee Benefits (effective from 1 January 2013) • IAS 28 (revised), Investments in Associates and Joint Ventures (effective from
1 January 2013) • IFRS 10, Consolidated Financial Statements (effective from 1 January 2013) • IFRS 11, Joint Arrangements (effective from 1 January 2013) • IFRS 12, Disclosure of Interest in Other Entities (effective from 1 January 2013) • IFRS 13, Fair value Measurement (effective from 1 January 2013) • IFRS 9 Financial Instruments (effective from 1 January 2015)
Basis of consolidation Subsidiaries are those entities in which dnata has the power to govern the entity’s operating and financial policies generally accompanying a shareholding of more than one half of the voting rights. Subsidiaries are consolidated from the date on which control is transferred to dnata and are de-consolidated from the date on which control ceases. Inter-company transactions, balances and unrealised gains and losses arising on transactions between dnata and subsidiaries are eliminated.

2. Summary of significant accounting policies (continued) The acquisition method of accounting is used to account for the acquisition of subsidiaries. The consideration transferred for the acquisition of a subsidiary is the fair value of assets transferred and the liabilities incurred to the former owners of the acquiree. Acquisition-related costs are expensed as incurred. Identifiable assets, including intangible assets acquired, liabilities and contingent liabilities, if any incurred or assumed in a business combination, are measured initially at their fair values at the acquisition date. Any non-controlling interest in the acquiree is recognised on an acquisition-by-acquisition basis, either at fair value or at the non-controlling interest’s proportionate share of the recognised amounts of acquiree’s identifiable net assets. Transactions with non-controlling interests that do not result in loss of control are accounted for as equity transactions. For purchases from non-controlling interests, the difference between any consideration paid and the relevant share acquired of the carrying value of the net assets of the subsidiary is recorded in equity. Gains or losses on disposal to non-controlling interests are also recorded in equity. Associates are those entities in which dnata has significant influence but not control, generally accompanying a shareholding between 20% and 50% of the voting rights. Investments in associates are accounted for by applying the equity method and include goodwill (net of accumulated impairment loss, if any). Joint ventures are contractual arrangements which establish joint control. Investments in jointly controlled entities are accounted for by applying the equity method and include goodwill (net of accumulated impairment loss, if any). All material unrealised gains and losses arising on transactions between dnata and its associates and joint ventures are eliminated to the extent of dnata’s interest. Accounting policies of subsidiaries, associates and joint ventures have been changed where necessary to ensure consistency with dnata’s accounting policies. When control or significant influence ceases, the retained interest in the entity is remeasured to fair value as at that date, with the change in the carrying amount recognised in profit or loss. The fair value is the initial carrying amount for the purposes of subsequently accounting for the retained interest as an associate, joint venture or financial asset. In addition, any amounts previously recognised in other comprehensive income in respect of that entity are accounted for as if the related assets and liabilities have been directly disposed of. This could result in amounts previously recognised in other comprehensive income being reclassified to profit or loss. If the ownership in an associate is reduced but significant influence is retained, only a proportionate share of the amounts previously recognised in other comprehensive income is reclassified to profit or loss.
Revenue Revenue from airport operations and cargo services is stated net of value-added taxes, rebates and discounts, and is recognised on the performance of services. Revenue from information technology services is recognised as services are rendered for time-and-material contracts and as per the percentage-of-completion method with reference to the stage of completion for software implementation services. Revenue from travel services includes commission earned from the sale of air and land arrangements and is recognised on the completion of sale. Revenue from sale of goods is recognised when the risks and rewards of ownership are transferred to the customer and is stated net of discounts. Interest income is recognised on a time proportion basis using the effective interest method. Foreign currency translation dnata’s consolidated financial statements are presented in UAE Dirhams (AED), which is also the parent company’s functional currency. Subsidiaries determine their own functional currency and items included in the financial statements of these companies are measured using that functional currency. Foreign currency transactions are translated into the functional currency, at exchange rates approximating to those ruling on the transaction dates. Monetary assets and liabilities denominated in foreign currencies are translated into the functional currency at exchange rates ruling at the end of the reporting period. The resultant foreign exchange gains and losses are recognised in the consolidated income statement. Income statements and cash flows of subsidiaries are translated into UAE Dirhams at average exchange rates for the year that approximate the cumulative effect of rates prevailing on the transaction dates and their assets and liabilities are translated at the exchange rates ruling on the end of the reporting period. The resulting exchange differences are recognised in other comprehensive income. Share of results in associates and joint ventures are translated into UAE Dirhams at average exchange rates for the year. Translation differences relating to investments in associates, joint ventures, subsidiaries and foreign currency borrowings that provide a hedge against a net investment in a foreign entity and monetary assets and liabilities that form part of net investment in foreign operation are classified as a translation reserve in equity through other comprehensive income until the disposal of the investment, when the translation differences are recognised in the consolidated income statement as part of the gain or loss on sale.

dnata106
2. Summary of significant accounting policies (continued) Goodwill and fair value adjustments arising on the acquisition of a foreign entity are treated as assets and liabilities of the foreign entity and translated at the exchange rates ruling on the end of the reporting period. Property, plant and equipment Property, plant and equipment is stated at cost less accumulated depreciation. Cost consists of purchase cost, together with any incidental expenses of acquisition. Subsequent costs are included in the asset’s carrying amount or recognised as a separate asset, as appropriate, only when it is probable that future economic benefits associated with the items will flow and the cost can be reliably measured. Repairs and maintenance are charged to the consolidated income statement during the period in which they are incurred. Land is not depreciated. Depreciation is calculated on other items of property, plant and equipment so as to write off the cost of property, plant and equipment on a straight line basis over the estimated useful life of the assets concerned. The estimated useful lives are: Buildings 5 - 33 years Leasehold property shorter of useful life or lease term Plant and machinery 4 - 15 years Office equipment and furniture 3 - 6 years Motor vehicles 5 years The assets’ residual values and useful lives are reviewed, and adjusted if appropriate, at the end of each reporting period. An impairment review is carried out whenever events or changes in circumstances indicate that the carrying amount may not be recoverable. When the carrying amount of property, plant and equipment is greater than its estimated recoverable amount, it is written down immediately to its estimated recoverable amount and is reviewed at the end of each reporting period for possible reversal of the impairment charges. For the purpose of assessing impairment, assets are grouped at the lowest levels for which there are separately identifiable cash flows (cash generating units).
Capital projects are stated at cost. When the asset is ready for its intended use, it is transferred from capital projects to the appropriate category under property, plant and equipment and depreciated in accordance with dnata’s policies. Gains and losses on disposal are determined by comparing proceeds with the carrying amount and recognised in the consolidated income statement. Goodwill Goodwill represents the excess of the consideration transferred over the fair value of dnata’s share of the identifiable net assets acquired in its subsidiaries at the date of acquisition. Goodwill is tested annually for impairment or more frequently if events or changes in circumstances indicate a potential impairment and carried at cost less accumulated impairment loss. For the purpose of impairment testing, goodwill is allocated to cash generating units or group of cash generating units that are expected to benefit from the business combination in which the goodwill arose. An impairment loss is recognised when the carrying value of the cash generating unit exceeds its recoverable amount. Impairment loss on goodwill is not reversed. Gains and losses on disposal of an entity include the carrying amount of goodwill relating to the entity sold. Other intangible assets Computer software is capitalised at cost only when future economic benefits are probable. Cost includes purchase price together with any directly attributable expenditure. In the case of internally developed computer software, development expenditure is capitalised if costs can be measured reliably, the product is technically and commercially feasible, future economic benefits are probable, and there exists an intent and ability to complete the development and to use or sell the asset. Other research and development expenditure not meeting the criteria for capitalisation are recognised in the consolidated income statement as incurred. Customer relationships and contractual rights are recognised on acquisition at fair values.

2. Summary of significant accounting policies (continued) An impairment review is carried out whenever events or changes in circumstances indicate that the carrying amount may not be recoverable. When the carrying amount of an intangible asset is greater than its estimated recoverable amount, it is written down immediately to its estimated recoverable amount and is reviewed at the end of each reporting period for possible reversal of the impairment loss. For the purpose of assessing impairment, assets are grouped at the lowest levels for which there are separately identifiable cash flows (cash generating unit or group of cash generating units). Intangible assets are amortised on a straight-line basis over the estimated useful lives, which are: Trade names 10 years Computer software 3 - 5 years Customer relationships 3 - 5 years Contractual rights over the term of the rights Loans and receivables Loans and receivables are non-derivative financial assets with fixed or determinable payments that are not quoted in an active market. Such amounts are initially recognised at fair value including transaction costs and carried at amortised cost using the effective interest method. The amounts are derecognised when rights to receive cash flows have expired or have been transferred along with substantially all the risks and rewards of ownership. At the end of each reporting period, an assessment is made whether there is any objective evidence of impairment. Where necessary the carrying amount is written down through the consolidated income statement to the present value of expected future cash flows discounted at the effective interest rate computed at initial recognition. Finance and operating leases Where property, plant and equipment have been financed by lease agreements under which substantially all of the risks and rewards incidental to ownership are transferred to dnata, they are classified as finance leases. Finance leases are capitalised at the commencement of the lease at the lower of the present value of the minimum lease payments or the fair value of the leased asset. The corresponding lease obligations are included under liabilities. Lease payments are treated as consisting of capital and interest elements. The interest element is charged to the consolidated income
statement over the lease term so as to produce a constant periodic rate of interest on the remaining balance of the liability. Property, plant and equipment acquired under finance leases are depreciated in accordance with dnata’s policies. Leases, where a significant portion of risks and rewards of ownership are retained by the lessor are classified as operating leases. Lease rental charges, including advance rentals in respect of operating leases, are charged to the consolidated income statement on a straight-line basis over the period of the lease. Inventories Inventories are stated at the lower of cost and estimated net realisable value. Cost is determined on the weighted average cost basis except for food and beverage inventory which is determined on a first-in-first-out basis. Trade receivables Trade receivables are initially recognised at fair value and subsequently measured at amortised cost using the effective interest method less provision for impairment of these receivables. Where there is objective evidence of amounts that are not collectible, a provision is made for the difference between the carrying amount and the present value of estimated future cash flows discounted at the effective interest rate. Borrowings Borrowings are recognised initially at fair value, net of transaction costs incurred. Borrowings are subsequently stated at amortised cost with any difference between the proceeds (net of transaction costs) and the redemption value recognised in the consolidated income statement over the period of the borrowings using the effective interest method. Provisions Provisions are recognised when dnata has a present legal or constructive obligation as a result of past events, it is probable that an outflow of resources will be required to settle the obligation and the amount can be reliably estimated. Provisions are measured at the present value of the expenditures expected to settle the obligation using a pre-tax rate that reflects current market assessments of the time value of money and risks specific to the obligation. The increase in the provision due to passage of time is recognised as interest expense.
dnata108
2. Summary of significant accounting policies (continued) Retirement benefit obligations dnata operates or participates in various end of service benefit plans, which are classified either as defined contribution or defined benefit plans. A defined contribution plan is a pension scheme under which dnata pays fixed contributions and has no legal or constructive obligation to pay further contributions if the fund does not hold sufficient assets to settle the benefits relating to the employees service in the current and prior periods. Contributions to the pension fund are charged to the consolidated income statement in the period in which they fall due. A defined benefit plan is a plan which is not a defined contribution plan. The liability recognised in the consolidated statement of financial position for a defined benefit plan is the present value of the defined benefit obligation at the end of the reporting period less the fair value of plan assets at that date. The defined benefit obligation is calculated by independent actuaries using the projected unit credit method. The present value of the defined benefit obligation is determined by discounting estimated future cash outflows using market yields at the end of the reporting period of high quality corporate bonds that have terms to maturity approximating to the estimated term of the post-employment benefit obligations. Actuarial gains and losses arising from changes in actuarial assumptions and experience adjustments are recognised in equity through other comprehensive income in the period in which they arise. Current and deferred income taxes The current income tax charge is calculated on the basis of the tax laws enacted or substantively enacted at the end of the reporting period in the countries where dnata’s subsidiaries operate and generate taxable income. Deferred income tax is provided in full, using the liability method, on temporary differences arising between the tax bases of assets and liabilities and their carrying amounts in the consolidated financial statements. However, deferred income tax is not accounted for if it arises from initial recognition of an asset or liability in a transaction other than a business combination that at the time of the transaction affects neither
accounting nor taxable profit or loss. Also deferred tax liabilities are not recognised if they arise from the initial recognition of goodwill in a business combination. Deferred income tax is determined using tax rates (and laws) that have been enacted or substantively enacted in the jurisdiction of the individual companies by the end of the reporting period and are expected to apply when the related deferred income tax liability is settled or the deferred income tax asset is realised. Deferred income tax is provided on temporary differences arising on investments in subsidiaries and associates, except where the timing of the reversal of the temporary difference is controlled by dnata and it is probable that the temporary difference will not reverse in the foreseeable future. Deferred income tax assets are recognised to the extent that it is probable that future taxable profit will be available against which the temporary differences can be utilised. Deferred income tax assets and liabilities are offset when there is a legally enforceable right to offset current income tax assets against current income tax liabilities and when the deferred income tax assets and liabilities relate to income taxes levied by the same taxation authority on either the same taxable entity or different taxable entities where there is an intention to settle the balances on a net basis. Trade payables Trade payables are recognised initially at fair value and subsequently measured at amortised cost using the effective interest method. Cash and cash equivalents Cash and cash equivalents comprise all cash and liquid funds with an original maturity of three months or less. Other bank deposits with maturity less than a year are classified as short term bank deposits. Bank overdrafts, if any, are shown within current liabilities in the consolidated statement of financial position.
Dividend distribution Dividend distribution to dnata’s Owner is recognised as a liability in the consolidated financial statements in the period in which the dividends are approved.

3. Critical accounting estimates and judgements In the preparation of the consolidated financial statements, a number of estimates and associated assumptions have been made relating to the application of accounting policies and reported amounts of assets and liabilities and income and expense. The estimates and associated assumptions are assessed on an ongoing basis and are based on historical experience and other factors, including expectations of future events that are believed to be reasonable under the circumstances. The following discussion addresses the accounting policies that require subjective and complex judgements, often as a result of the need to make estimates. Valuation of intangible assets on acquisition For each acquisition management assesses the fair value of intangible assets acquired. The instance where individual fair values of assets in a group are not reliably measurable, a single asset comprising goodwill is recognised. Where an active market does not exist for an intangible asset, fair values are established using valuation techniques e.g. discounting future cash flows from the asset. In the process, estimates are made of the future cash flows, the useful life and the discount rate based on management’s experience and expectation at the time of acquisition. Depreciation of property, plant and equipment Management assigns useful lives and residual values to property, plant and equipment based on the intended use of assets and the economic lives of those assets. Subsequent changes in circumstances such as technological advances or prospective utilisation of the assets concerned could result in the actual useful lives or residual values differing from initial estimates. Management has reviewed the residual value and useful lives of major items of property, plant and equipment and determined that no adjustment is necessary. Amortisation of intangible assets Management assigns useful lives and residual values to intangible assets based on the intended use of the assets, the underlying contractual or legal rights and the historical
experience. Subsequent changes in circumstances such as technological advances, changes in the terms of the underlying contracts or prospective utilisation of the assets concerned could result in the useful lives or residual values differing from initial estimates. Management has reviewed the residual values and useful lives of major intangible assets and determined that no adjustment is necessary. Impairment of investment in associates and joint ventures (equity accounted investments) Management applies the guidance in IAS 39 to identify if potential impairment exists for its equity accounted investments. At the end of each reporting period, an assessment is made whether there is any objective evidence of impairment. In such instances, the investment is subject to an impairment test by comparing the carrying amount to the recoverable amount of the asset. Considering the long term nature of these investments, the recoverable amount is determined based on value-in-use calculations. Calculating the value-in-use implies obtaining cash flow forecasts from the management of the equity accounted investments. Publicly listed companies often operate under restrictions due to the applicable listing regulations on disclosure of information to a selective group of shareholders. Thus, for such investments management develops its own estimated cash flows using publicly available data or analyst forecasts, as appropriate. Impairment of goodwill Determining whether goodwill is impaired requires an estimation of the value-in-use of the cash generating units to which goodwill has been allocated. The value-in-use calculation requires management to estimate the future cash flows expected to arise from the cash generating unit and a suitable discount rate in order to calculate present value. The estimates made in arriving at the value-in-use calculation are set out in note 9.
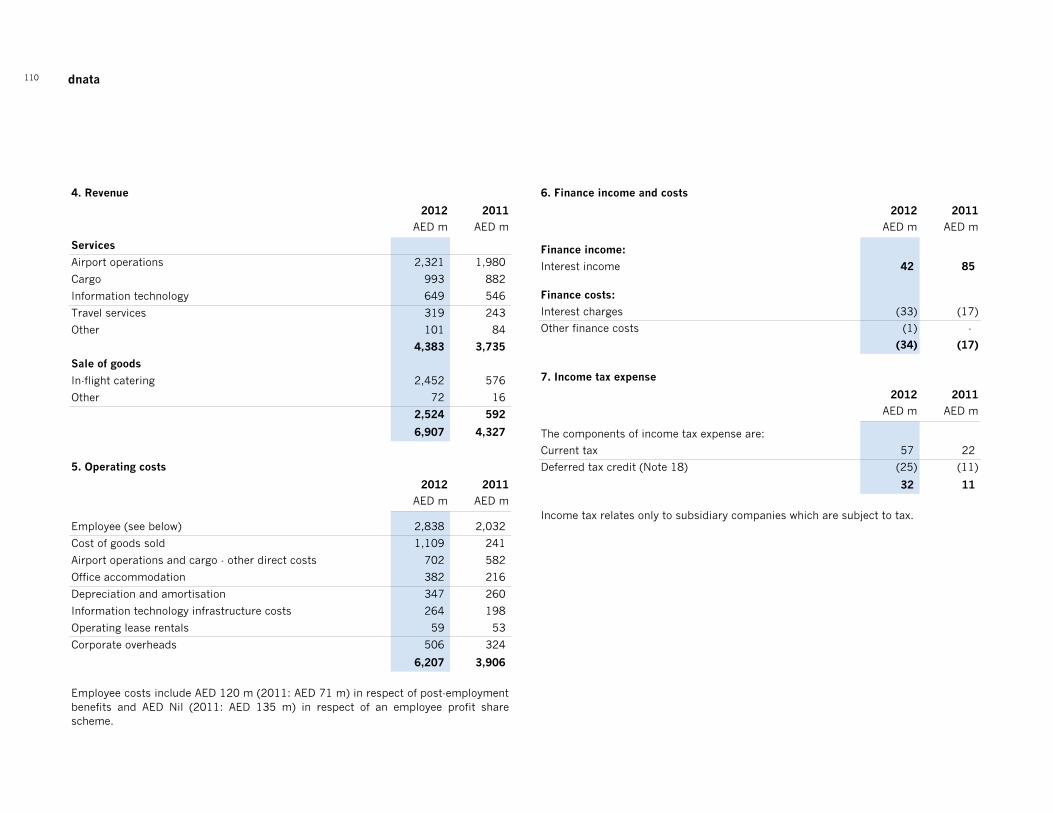
dnata110
4. Revenue
2012 2011
AED m AED m
Services
Airport operations 2,321 1,980
Cargo 993 882
Information technology 649 546
Travel services 319 243
Other 101 84
4,383 3,735
Sale of goods
In-flight catering 2,452 576
Other 72 16
2,524 592
6,907 4,327
5. Operating costs
2012 2011
AED m AED m
Employee (see below) 2,838 2,032
Cost of goods sold 1,109 241
Airport operations and cargo - other direct costs 702 582
Office accommodation 382 216
Depreciation and amortisation 347 260
Information technology infrastructure costs 264 198
Operating lease rentals 59 53
Corporate overheads 506 324
6,207 3,906
Employee costs include AED 120 m (2011: AED 71 m) in respect of post-employmentbenefits and AED Nil (2011: AED 135 m) in respect of an employee profit sharescheme.
6. Finance income and costs
2012 2011
AED m AED m
Finance income:
Interest income 42 85
Finance costs:
Interest charges (33) (17)
Other finance costs (1) -
(34) (17)
7. Income tax expense
2012 2011
AED m AED m
The components of income tax expense are:
Current tax 57 22
Deferred tax credit (Note 18) (25) (11)
32 11
Income tax relates only to subsidiary companies which are subject to tax.

8. Property, plant and equipment
Land, buildings
andleaseholdproperty
Plantand
machinery
Office equipment
and furniture
Motorvehicles
Capitalprojects Total
AED m AED m AED m AED m AED m AED m
Cost
1 April 2010 519 648 910 33 4 2,114
Acquisition (Note 27) 398 453 56 15 4 926
Additions 6 40 79 3 30 158
Transfer from capital projects 5 3 1 - (9) -
Disposals / write off - (11) (41) (2) - (54)
Currency translation differences 37 30 2 (1) 1 69
31 March 2011 965 1,163 1,007 48 30 3,213
Depreciation
1 April 2010 131 495 711 23 - 1,360
Acquisition (Note 27) 182 312 44 11 - 549
Charge for the year 28 64 95 4 - 191
Disposals / write off - (10) (35) (2) - (47)
Currency translation differences 8 19 - 1 - 28
31 March 2011 349 880 815 37 - 2,081
Net book amount
31 March 2011 616 283 192 11 30 1,132

dnata112
8. Property, plant and equipment (continued)
Land, buildings
andleaseholdproperty
Plantand
machinery
Office equipment
and furniture
Motorvehicles
Capitalprojects Total
AED m AED m AED m AED m AED m AED m
Cost
1 April 2011 965 1,163 1,007 48 30 3,213
Acquisition (Note 27) - - 6 - - 6
Additions 28 136 131 6 19 320
Transfer from capital projects 3 - 13 - (16) -
Disposals / write off - (36) (52) (2) (6) (96)
Currency translation differences (4) (3) (3) - 1 (9)
31 March 2012 992 1,260 1,102 52 28 3,434
Depreciation
1 April 2011 349 880 815 37 - 2,081
Acquisition (Note 27) - - 3 - - 3
Charge for the year 57 87 102 5 - 251
Disposals / write off - (33) (47) (2) - (82)
Currency translation differences (1) (2) - - - (3)
31 March 2012 405 932 873 40 - 2,250
Net book amount
31 March 2012 587 328 229 12 28 1,184
The net book amount of property, plant and equipment includes AED 61 m (2011: AED 41 m) in respect of plant and machineryheld under finance leases.
Land of AED 20 m (2011: AED 19 m) is carried at cost and is not depreciated.
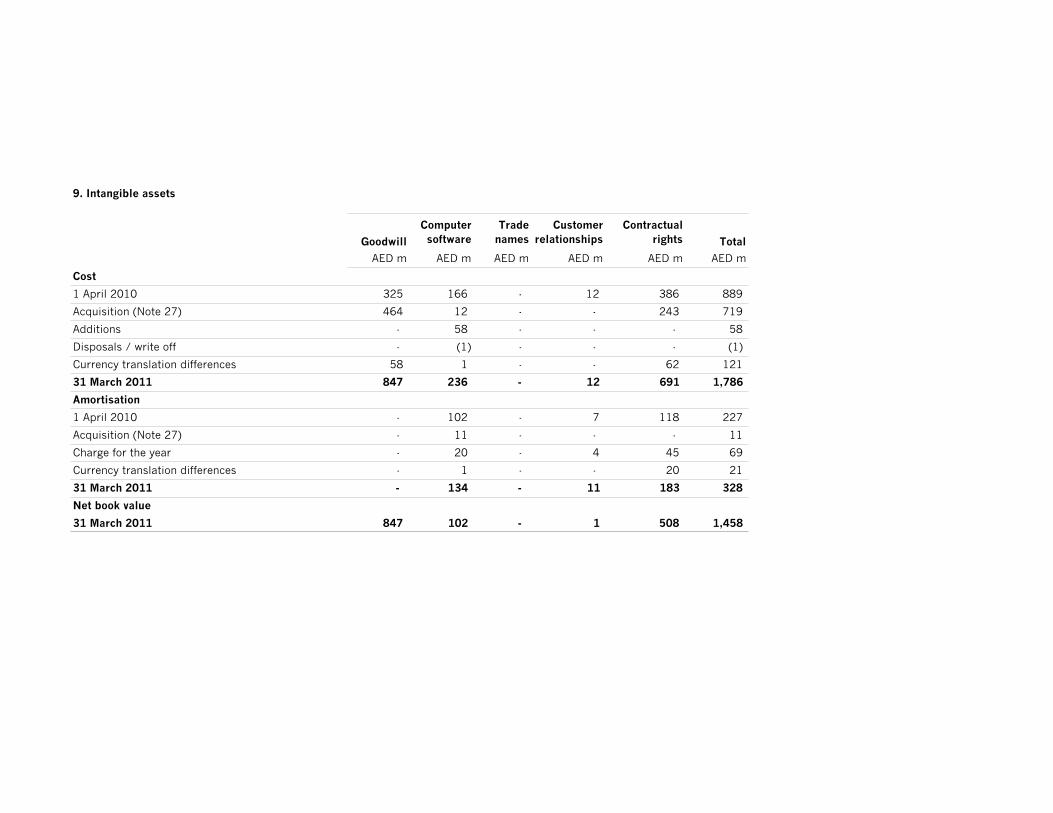
9. Intangible assets
Goodwill
Computersoftware
Trade names
Customerrelationships
Contractualrights Total
AED m AED m AED m AED m AED m AED m
Cost
1 April 2010 325 166 - 12 386 889
Acquisition (Note 27) 464 12 - - 243 719
Additions - 58 - - - 58
Disposals / write off - (1) - - - (1)
Currency translation differences 58 1 - - 62 121
31 March 2011 847 236 - 12 691 1,786
Amortisation
1 April 2010 - 102 - 7 118 227
Acquisition (Note 27) - 11 - - - 11
Charge for the year - 20 - 4 45 69
Currency translation differences - 1 - - 20 21
31 March 2011 - 134 - 11 183 328
Net book value
31 March 2011 847 102 - 1 508 1,458
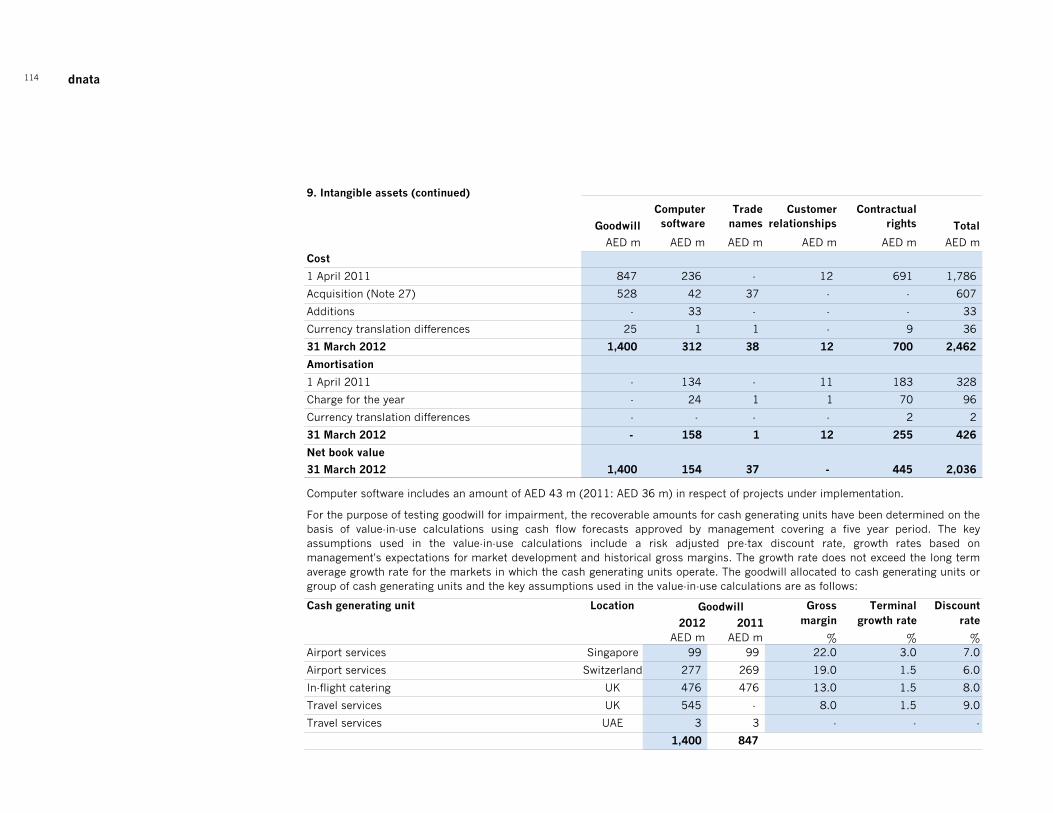
dnata
9. Intangible assets (continued)
114
Goodwill
Computersoftware
Trade names
Customerrelationships
Contractualrights Total
AED m AED m AED m AED m AED m AED m
Cost
1 April 2011 847 236 - 12 691 1,786
Acquisition (Note 27) 528 42 37 - - 607
Additions - 33 - - - 33
Currency translation differences 25 1 1 - 9 36
31 March 2012 1,400 312 38 12 700 2,462
Amortisation
1 April 2011 - 134 - 11 183 328
Charge for the year - 24 1 1 70 96
Currency translation differences - - - - 2 2
31 March 2012 - 158 1 12 255 426
Net book value
31 March 2012 1,400 154 37 - 445 2,036
Cash generating unit Location Gross Terminal Discount
2012 2011 margin growth rate rate
AED m AED m % % %Airport services Singapore 99 99 22.0 3.0 7.0
Airport services Switzerland 277 269 19.0 1.5 6.0
In-flight catering UK 476 476 13.0 1.5 8.0
Travel services UK 545 - 8.0 1.5 9.0
Travel services UAE 3 3 - - -
1,400 847
Computer software includes an amount of AED 43 m (2011: AED 36 m) in respect of projects under implementation.
For the purpose of testing goodwill for impairment, the recoverable amounts for cash generating units have been determined on thebasis of value-in-use calculations using cash flow forecasts approved by management covering a five year period. The keyassumptions used in the value-in-use calculations include a risk adjusted pre-tax discount rate, growth rates based onmanagement's expectations for market development and historical gross margins. The growth rate does not exceed the long termaverage growth rate for the markets in which the cash generating units operate. The goodwill allocated to cash generating units orgroup of cash generating units and the key assumptions used in the value-in-use calculations are as follows:
Goodwill

10. Investments in subsidiaries, associates and joint ventures
Principal subsidiaries
Percentageof equityowned Principal activities
Country ofincorporation and
principal operations
Dnata Travel (UK) Ltd. 100 Travel agency United Kingdom
Dnata Inc. 100 Aircraft handling services PhilippinesDnata International Airport Services Pte Ltd. 100 Holding company Singapore
dnata Singapore Ltd. 100 Aircraft handling and catering services Singapore
MMI Travel L.L.C. 100 Travel agency United Arab Emirates
Dnata Gmbh 100 Holding company Austria
dnata Switzerland AG 100 Aircraft handling services Switzerland
Al Hidaya Travel WLL 90 Travel agency Bahrain
Cleopatra WLL 90 Travel agency Bahrain
Dnata Aviation Services Ltd. 100 Holding company United Kingdom
dnata Limited 100 Aircraft handling services United Kingdom
Incorporated during the previous year:
Mercator Asia Ltd. 100 Information technology services Thailand
Dnata for Airport Services Ltd. 100 Aircraft handling services Iraq
Dnata Catering Services Ltd. 100 Holding company United Kingdom
Acquired during the previous year:
Alpha Flight Group Ltd. 100 In-flight catering services United Kingdom
Alpha Flight UK Ltd. 100 In-flight catering services United Kingdom
Alpha Services Pty Limited 100 In-flight catering services Australia
Alpha Flight Services BV 100 In-flight catering services Netherlands
Alpha Flight Ireland Limited 100 In-flight catering services Ireland
Alpha Airport Services EOOD 100 In-flight catering services Bulgaria
Alpha Flight a.s 100 In-flight catering services Czech Republic
Alpha Flight U.S L.L.C. 100 In-flight catering services United States of America
Alpha Rocas SA 64.2 In-flight catering services Romania
Alpha Flight Services UAE 49 In-flight catering services United Arab Emirates
Jordan Flight Catering Company Ltd. 35.9 In-flight catering services Jordan
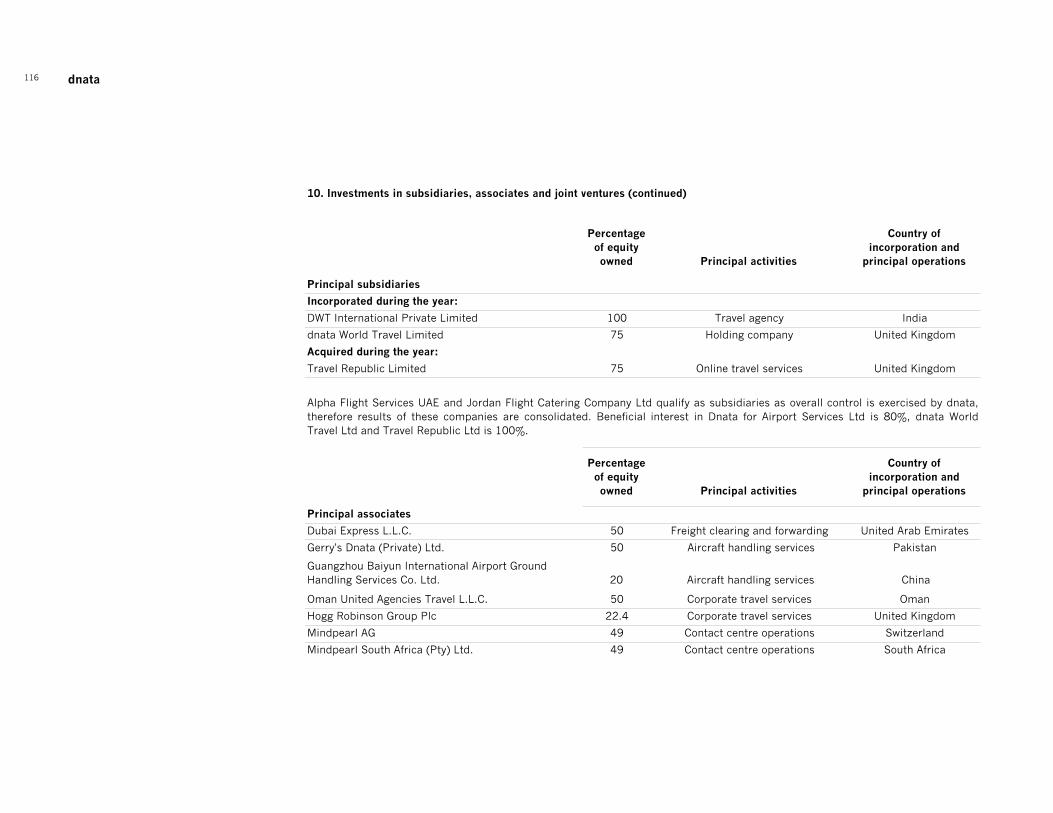
dnata116
10. Investments in subsidiaries, associates and joint ventures (continued)
Percentageof equityowned Principal activities
Country ofincorporation and
principal operations
Principal subsidiaries
Incorporated during the year:
DWT International Private Limited 100 Travel agency India
dnata World Travel Limited 75 Holding company United Kingdom
Acquired during the year:
Travel Republic Limited 75 Online travel services United Kingdom
Percentageof equityowned Principal activities
Country ofincorporation and
principal operations
Principal associates
Dubai Express L.L.C. 50 Freight clearing and forwarding United Arab Emirates
Gerry's Dnata (Private) Ltd. 50 Aircraft handling services Pakistan
Guangzhou Baiyun International Airport Ground Handling Services Co. Ltd. 20 Aircraft handling services China
Oman United Agencies Travel L.L.C. 50 Corporate travel services Oman
Hogg Robinson Group Plc 22.4 Corporate travel services United Kingdom
Mindpearl AG 49 Contact centre operations Switzerland
Mindpearl South Africa (Pty) Ltd. 49 Contact centre operations South Africa
Alpha Flight Services UAE and Jordan Flight Catering Company Ltd qualify as subsidiaries as overall control is exercised by dnata,therefore results of these companies are consolidated. Beneficial interest in Dnata for Airport Services Ltd is 80%, dnata WorldTravel Ltd and Travel Republic Ltd is 100%.

10. Investments in subsidiaries, associates and joint ventures (continued)
Percentageof equityowned Principal activities
Country ofincorporation and
principal operations
Principal joint ventures
PAL PAN Airport Logistics L.L.C. (formerly Dnata-PWC Airport Logistics L.L.C.) 50 Logistics services United Arab Emirates
dnata Travel Limited 70 Travel agency Saudi Arabia
Transguard Group L.L.C. 100 Security services United Arab Emirates
Toll Dnata Airport Services 50 Aircraft handling services Australia
Dunya Travel L.L.C. 50 Travel agency United Arab Emirates
SDV (UAE) L.L.C. 25.5 Logistics services United Arab Emirates
Najm Travel 50 Travel agency Afghanistan
Al Tawfeeq Travels L.L.C 50 Travel agency Qatar
Acquired during the previous year:
Servair Air Chef srl 50 In-flight catering services Italy
Acquired during the year:
Wings Inflight Services (Pty) Ltd. 50 In-flight catering services South Africa
Although the percentage of equity owned in dnata Travel Limited is 70% and SDV UAE LLC is 25.5% they are subject to joint control.The beneficial interest in Transguard Group L.L.C is 50% and is subject to joint control. Investment in Xian Dnata Aviation ServicesCo. Ltd was divested during the year.

dnata118
Movement of investments in associates and joint ventures
2012 2011
AED m AED m
Balance brought forward - as reported earlier - 483
Effect of change in accounting policy (Note 29) - (87)
Balance brought forward - as restated 435 396
Acquisition (Note 27) - 45
Investments during the year 13 5
Share of results 68 24
Share of other comprehensive income - (37)
Dividends (26) (18)
Disposal / dilution during the year (11) -
Currency translation differences (2) 20
Balance carried forward 477 435
10. Investments in subsidiaries, associates and joint ventures (continued)
The financial statements of an associate have been drawn from 1 January 2011 to 31December 2011 to comply with the accelerated reporting timetable of dnata. For thepurpose of applying the equity method of accounting and disclosures, the financialstatements as drawn above have been used and appropriate adjustments have beenmade, where necessary, for the effect of significant events between 1 January 2012and 31 March 2012.
The carrying value of the investments in associates amounted to AED 158 m (2011:AED 148 m) and the share of results amounted to AED 36 m (2011: AED 22 m). Theinvestments in associates and joint ventures include a quoted investment, the fairvalue of which amounts to AED 294 m (2011: AED 243 m) at the end of the reportingperiod.
2012 2011
AED m AED m
Total assets 3,349 3,467
Total liabilities 2,759 2,955
Net assets 590 512
Revenue 2,678 2,410
Profit for the year 141 40
2012 2011
AED m AED m
Non-current assets 369 301
Current assets 279 274
Non-current liabilities 72 82
Current liabilities 257 206
Total income 820 596
Total expense 788 594
Summarised financial information in respect of associates is set out below:
Summarised financial information in respect of dnata's share in joint ventures are set out below:

11. Advance lease rentals
2012 2011
AED m AED m
Balance brought forward 28 26
Charge for the year (1) (1)
Currency translation differences - 3
Balance carried forward 27 28
12. Inventories
2012 2011
AED m AED m
Plant and machinery - spares and consumables 19 18
Food and beverage 47 54
Other 21 16
87 88
13. Trade and other receivables
2012 2011
AED m AED m
Trade receivables - net of provision 792 717
Prepayments 106 89
Related parties (Note 25) 176 156
Deposits and other receivables 200 195
1,274 1,157
Less: Receivable over one year (15) -
1,259 1,157
The impairment charge on trade receivables recognised in the consolidated incomestatement during the year mainly relates to commercial, travel agency and airlinecustomers who are in unexpected difficult economic situations and are unable tomeet their obligations. This charge is included in operating costs. Amounts chargedto the provision account are written off when there is no expectation of furtherrecovery.
2012 2011
AED m AED m
Balance brought forward 45 25
Acquisition - 9
Charge for the year 20 25
Unused amounts reversed (11) (12)
Amounts written off as uncollectible (4) (4)
Currency translation differences (1) 2
Balance carried forward 49 45
2012 2011
AED m AED m
Below 3 months 310 329
3-6 months 25 22
Above 6 months 56 61
391 412
14. Capital
Capital represents the permanent capital of dnata.
The maximum exposure to credit risk of current trade and other receivables at thereporting date is the carrying value of each class of receivable mentioned above.
The other classes of trade and other receivables do not contain impaired assets.
Movements in the provision for impairment of trade receivables are as follows:
Ageing of receivables that are past due but not impaired is as follows:

dnata120
15. Retirement benefit obligations
2012 2011
AED m AED m
Funded scheme
Present value of defined benefit obligations 126 135
Less: Fair value of plan assets (116) (126)
10 9
Unfunded scheme
Present value of defined benefit obligations 321 248
Liability recognised in consolidated statement of financial position 331 257
(i) Funded scheme
Plan 1
In accordance with the provisions of IAS 19, management has carried out an exerciseto assess the present value of its defined benefit obligations at 31 March 2012, inrespect of employees' end of service benefits payable under relevant local regulationsand contractual arrangements.
Senior employees based in the UAE participate in a defined benefit provident schemeto which dnata contributes a specified percentage of basic salary based upon theemployee’s grade and duration of service. Amounts contributed are invested in atrustee administered scheme and accumulate along with returns earned oninvestments. Contributions are made on a monthly basis irrespective of fundperformance and are not pooled, but are separately identifiable and attributable toeach participant. The fund comprises a diverse mix of managed funds andinvestment decisions are controlled directly by the participating employees.
The liabilities recognised in the consolidated statement of financial position are:
2012 2011
AED m AED m
Present value of funded defined benefit obligations 72 61
Fair value of plan assets 67 58 5 3
The assessment of the present value of defined benefit obligations assumed expectedsalary increases averaging 5.0% (2011: 5.0%) and a discount rate of 5.0% (2011:6.0%) per annum. The present values of the defined benefit obligations at 31 March2012 were computed using the actuarial assumptions set out above.
Benefits receivable under the provident scheme are subject to vesting rules, whichare dependent upon a participating employee's length of service. If at the time anemployee leaves employment, the accumulated vested amount, including investmentreturns is less than the end of service benefits that would have been payable to thatemployee under relevant local regulations, dnata pays the shortfall amount directlyto the employee. However, if the accumulated vested amount exceeds the end ofservice benefits that would have been payable to an employee under relevant localregulations, the employee receives between seventy five and one hundred percent oftheir fund balance. Vested assets of the scheme are not available to dnata or itscreditors in any circumstances.
The present value of obligation and fair value of plan assets are as follows:
The liability of AED 5 m (2011: AED 3 m) represents the amount that will not besettled from plan assets and is calculated as the excess of the present value of thedefined benefit obligation for an individual employee over the fair value of theemployee's plan assets at the end of the reporting period.
Contributions received include the transfer of accumulated benefits from unfundedschemes.
Actuarial gains and losses and expected returns on plan assets are not calculatedgiven that investment decisions relating to plan assets are under the direct control ofparticipating employees.
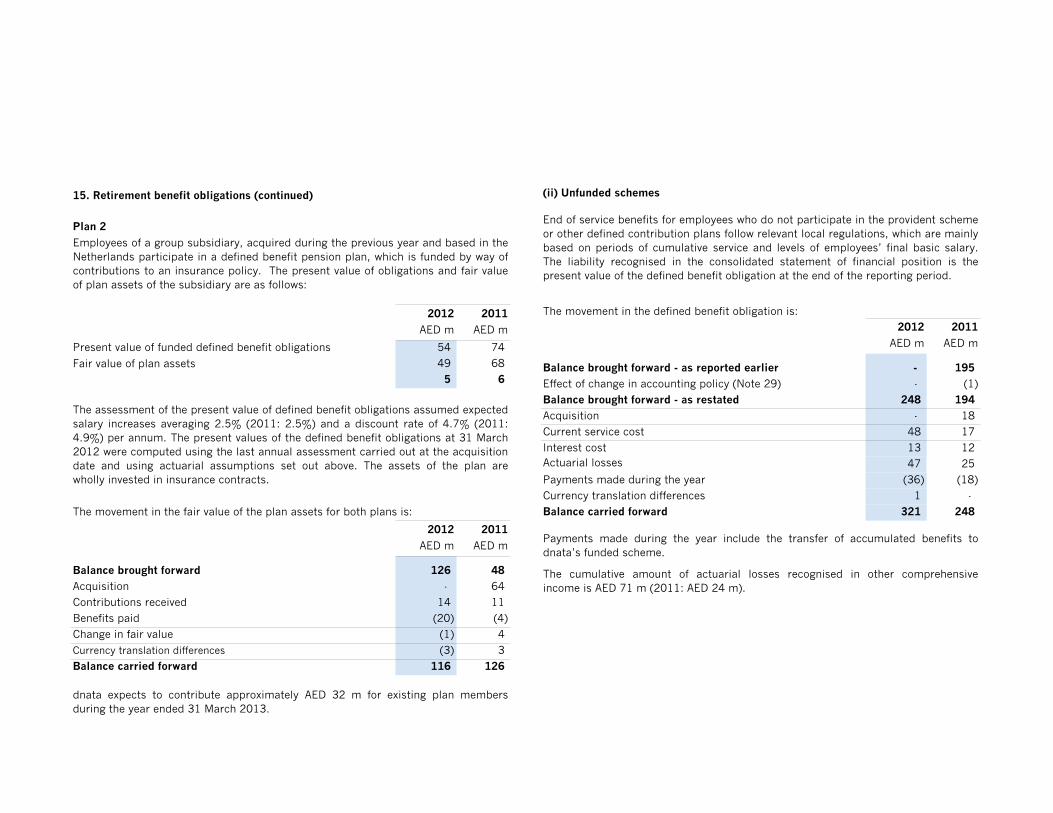
15. Retirement benefit obligations (continued)
Plan 2
2012 2011
AED m AED m
Present value of funded defined benefit obligations 54 74
Fair value of plan assets 49 68
5 6
The movement in the fair value of the plan assets for both plans is:
2012 2011
AED m AED m
Balance brought forward 126 48
Acquisition - 64
Contributions received 14 11
Benefits paid (20) (4)
Change in fair value (1) 4
Currency translation differences (3) 3
Balance carried forward 116 126
The assessment of the present value of defined benefit obligations assumed expectedsalary increases averaging 2.5% (2011: 2.5%) and a discount rate of 4.7% (2011:4.9%) per annum. The present values of the defined benefit obligations at 31 March2012 were computed using the last annual assessment carried out at the acquisitiondate and using actuarial assumptions set out above. The assets of the plan arewholly invested in insurance contracts.
Employees of a group subsidiary, acquired during the previous year and based in theNetherlands participate in a defined benefit pension plan, which is funded by way ofcontributions to an insurance policy. The present value of obligations and fair valueof plan assets of the subsidiary are as follows:
dnata expects to contribute approximately AED 32 m for existing plan membersduring the year ended 31 March 2013.
(ii) Unfunded schemes
The movement in the defined benefit obligation is:
2012 2011
AED m AED m
Balance brought forward - as reported earlier - 195
Effect of change in accounting policy (Note 29) - (1)
Balance brought forward - as restated 248 194
Acquisition - 18
Current service cost 48 17
Interest cost 13 12
47 25
Payments made during the year (36) (18)
Currency translation differences 1 -
Balance carried forward 321 248
End of service benefits for employees who do not participate in the provident schemeor other defined contribution plans follow relevant local regulations, which are mainlybased on periods of cumulative service and levels of employees’ final basic salary.The liability recognised in the consolidated statement of financial position is thepresent value of the defined benefit obligation at the end of the reporting period.
Actuarial losses
Payments made during the year include the transfer of accumulated benefits todnata’s funded scheme.
The cumulative amount of actuarial losses recognised in other comprehensiveincome is AED 71 m (2011: AED 24 m).

dnata122
15. Retirement benefit obligations (continued)
2012 2011
AED m AED m
Defined benefit planFunded scheme
Contributions expensed 10 9
3 -
13 9
Unfunded scheme
Current service cost 48 17
Interest cost 13 12
61 29
Defined contribution plan
Contributions expensed 46 33
Recognised in the consolidated income statement 120 71
16. Borrowings and lease liabilities
2012 2011
AED m AED m
Non-current
Term loans 568 658
Lease liabilities 32 16
600 674
Current
Term loans 98 97
Lease liabilities 11 11
Bank overdrafts (Note 23) 26 32
135 140
735 814
Net change in the present value of defined benefit obligations over plan assets
The total amount recognised in the consolidated income statement is as follows:2012 2011
AED m AED m
Sterling Pound 341 378
Swiss Francs 267 274
Singapore Dollars 122 162
Others 5 -
(a) Term loans
2012 2011
AED m AED m
Movement in the term loans are as follows:
Balance brought forward 760 445
Acquisitions 63 315
Repayments (166) (64)
Currency translation differences 12 64
669 760
Unamortised transaction costs (3) (5)
Balance carried forward 666 755
Term loans are repayable as follows:
Within one year 98 97
Between 2 and 5 years 458 523
After 5 years 110 135
Total over one year 568 658
Loans are denominated in the following currencies:
Sterling Pound 292 319
Swiss Francs 252 274
Singapore Dollars 122 162
A term loan amounting to AED 123 m (2011: AED 163 m) is secured by a charge onthe shares of Changi International Airport Services (International) Pte Ltd. (asubsidiary of Dnata International Airport Services Pte Ltd.) and dnata Singapore Ltd.A corporate guarantee has also been provided by dnata for the total value of the termloans.
Borrowings and lease liabilities are denominated in the following currencies:

16. Borrowings and lease liabilities (continued)
(b) Lease liabilities
2012 2011
AED m AED m
Gross lease liabilities:
Within one year 11 13
Between 2 and 5 years 31 18
After 5 years 5 -
47 31
Future interest (4) (4)
Present value of finance lease liabilities 43 27
Within one year 11 11
Between 2 and 5 years 28 16
After 5 years 4 -
Total over one year 32 16
Sterling Pound 28 27
Swiss Francs 15 -
The lease liabilities are secured on the related plant and machinery.
The carrying amount of lease liabilities approximates its fair value. The fair value isdetermined by discounting projected cash flows using the interest rate yield curve forthe remaining term to maturities and currencies adjusted for credit spread.
The present value of finance lease liabilities is repayable as follows:
The present value of finance lease liabilities are denominated in the following currencies:
Contractual repricing dates are set at six month intervals. The effective interest rateon the term loans was 2.9% (2011: 2.7%) per annum. The carrying amounts of theterm loans approximate their fair value. The fair value is determined by discountingprojected cash flows using the interest rate yield curve applicable to differentmaturities and currencies adjusted for contractual pricing.
The term loan in Swiss Francs is designated as a hedge of the net investment indnata Switzerland AG. The foreign exchange gain or loss on translation of the loan atthe end of the reporting period is recognised in the translation reserve in equity.
17. Other provisions
Dilapi-dations
Onerous contracts Others Total
AED m AED m AED m AED m
1 April 2011 30 10 19 59
Additions 6 - - 6
Charge to the income statement 1 - 2 3
Unused amounts reversed - (1) (5) (6)
Unwinding of discount 2 1 - 3
Used during the year (2) (2) - (4)
Currency translation differences 1 - - 1
31 March 2012 38 8 16 62
Provisions are expected to be used as follows:
2012 2011
AED m AED m
Within one year 20 23
Over one year 42 36
31 March 2012 62 59
The provision for dilapidations represents an estimate of the costs of restoringcertain leasehold ties to their original condition at the end of the lease termdiscounted at the applicable weighted average cost of capital.
The provision for onerous contracts represents an estimate of unavoidable net costsaccruing on contracts, discounted at the applicable weighted average cost of capital.

dnata124
18. Deferred income tax
2012 2011
AED m AED m
Deferred income tax assets 20 18
Deferred income tax liabilities (148) (148)
(128) (130)
The movement in the deferred tax account is as follows:
Balance brought forward (130) (83)
Acquisition (Note 27) (20) (47)
Credited to the consolidated income statement (Note 7) 25 11
Currency translation differences (3) (11)
Balance carried forward (128) (130)
Deferred tax assets and liabilities are offset when there is a legally enforceable rightto offset current tax assets against current tax liabilities and when the deferred taxesrelate to the same income tax authority. The offset amounts are as follows:
Deferred income tax liabilities
Property, plant and
equipmentIntangible
assets Other Total
AED m AED m AED m AED m
1 April 2010 (35) (55) (2) (92)
Acquisition (Note 27) (8) (49) - (57)
Credited to the consolidated income statement 2 9 - 11
Currency translation differences (4) (7) - (11)
31 March 2011 (45) (102) (2) (149)
Acquisition (Note 27) - (20) - (20)
Credited to the consolidated income statement 5 17 - 22
Currency translation differences (1) (3) - (4)
31 March 2012 (41) (108) (2) (151)
Deferred income tax assets
Tax losses Provisions Other Total
AED m AED m AED m AED m
1 April 2010 1 1 7 9
Acquisition (Note 27) 10 - - 10
Currency translation differences 1 - (1) -
31 March 2011 12 1 6 19 Charged to the consolidated income statement (1) - 4 3 Currency translation differences - - 1 1
31 March 2012 11 1 11 23
The movements in deferred tax assets and liabilities during the year, without takinginto consideration the offsetting of balances within the same tax jurisdiction, are asfollows:
A deferred tax asset has not been recognised in respect of carried forward tax losses amounting to AED 91 m (2011: AED 86 m).

19. Trade and other payables
2012 2011
AED m AED m
Trade payables and accruals 1,354 1,066
Related parties (Note 25) 66 27
Employee leave pay 91 93
Airlines 103 113
Customer deposits 27 22
Dividend payable 350 500
Other payables 154 -
2,145 1,821
Less: Payable over one year 154 -
1,991 1,821
20. Operating leases
2012 2011
AED m AED m
Less than 1 year 65 46
Between 2 and 5 years 167 122
After 5 years 301 264
533 432
Future minimum lease payments under non-cancellable operating leases are as
The non-current portion represents the deferred consideration and contingentconsideration for acquisition of a subsidiary company (Note 27).
21. Capital commitments
2012 2011
AED m AED m
Authorised and contracted 110 74
Authorised but not contracted 478 403
588 477
22. Guarantees
2012 2011
AED m AED m
Guarantees provided by dnata's bankers in the normal course of business 84 68
23. Short term bank deposits, cash and cash equivalents
2012 2011
AED m AED m
Short term bank deposits 1,462 1,894
Cash and bank 537 189
Cash and bank balances 1,999 2,083
Less: Short term bank deposits over 3 months (481) (586)Cash and cash equivalents as per the consolidated statement of financial position 1,518 1,497
Bank overdraft (Note 16) (26) (32)
Cash and cash equivalents as per the consolidated statement of cash flows 1,492 1,465
Short term bank deposits, cash and cash equivalents yield an effective interest rateof 2.0% (2011: 4.0%) per annum.
follows:

dnata126
24. Classification of financial instruments
The accounting policies for financial instruments have been applied to the following:
DescriptionLoans and
receivables
Financial liabilities at
amortised cost Total
AED m AED m AED m
2011
Assets
Loans to related parties (non-current) 1 - 1
Trade and other receivables (excluding prepayments) 1,068 - 1,068
Short term bank deposits 586 - 586
Cash and cash equivalents 1,497 - 1,497
Total 3,152 - 3,152
Liabilities
Borrowings and lease liabilities - 814 814
Trade and other payables (excluding customer deposits) - 1,799 1,799
Total - 2,613 2,613
2012
Assets
Loans to related parties (non-current) 1 - 1
Trade and other receivables (excluding prepayments) 1,168 - 1,168
Short term bank deposits 481 - 481
Cash and cash equivalents 1,518 - 1,518
Total 3,168 - 3,168
Liabilities
Borrowings and lease liabilities - 735 735
Trade and other payables (excluding customer deposits) - 2,118 2,118
Total - 2,853 2,853

25. Related party transactions
The following transactions were carried out with related parties:
Trading transactions
2012 2011
AED m AED m
(i) Sale / purchase of goods and services
Sale
Sale of goods - Companies under common control 336 103
Services rendered - Associates 14 14
Services rendered - Joint ventures 6 10
Services rendered - Companies under common control 1,581 1,308
1,937 1,435
Purchase
Purchase of goods - Companies under common control 78 113
Services received - Associates - 1
Services received - Joint ventures 140 122
Services received - Companies under common control 45 38
263 274
(ii) Year end balances arising from sale / purchase of goods and / or services
Receivables from related parties (Note 13)
Associates 4 3
Joint ventures 13 15
Companies under common control 99 95
116 113
Payables to related parties (Note 19)
Joint ventures 21 17
Companies under common control 45 10
66 27
The amounts outstanding at year end are unsecured and will be settled in cash.
Other transactions
2012 2011
AED m AED m
(i) Compensation to key management personnel
Salaries and short-term employee benefits 20 29
Post-employment benefits 3 3
23 32
(ii) Loans
Associates 8 6
Joint ventures 53 38
61 44
Movement in the loans were as follows:
Balance brought forward 44 26
Additions 16 31
Currency translation differences 1 2
Repayments - (15)
Balance carried forward 61 44
Within one year (Note 13) 60 43
Total over one year 1 1
(iii) Purchase of shares from non controlling interest
2012 2011AED m AED m
Companies under common control - 82
The loans earned effective interest of 5.5% (2011: 6.5%) except for loans amountingto AED 1 m (2011: AED 1 m) which were interest free.
In addition to the above, dnata has also entered into transactions with othergovernment controlled entities in the normal course of business. The amountsinvolved are, both individually and in aggregate, not significant.

dnata128
26. Financial risk management
(i) Market risk
Interest rate risk
dnata has limited exposure to financial risks by virtue of the nature of its operations.In the areas where financial risks exist, the aim is to achieve an appropriate balancebetween risk and return and minimise potential adverse effects on dnata’s financialposition.
dnata’s risk management procedures are designed to identify and analyse theserisks, to set appropriate risk limits and controls and to monitor the risks andadherence to limits by means of reliable and up-to-date information. dnata reviews itsrisk management procedures and systems on a regular basis to reflect changes inmarkets.
Risk management is carried out by Corporate Treasury under procedures that areapproved by a steering group comprising of senior management. Corporate Treasuryidentifies and evaluates opportunities for hedging financial risks in close cooperationwith the operating units. Senior management is also responsible for the review of riskmanagement and the control environment. The various financial risk elements arediscussed below.
Market risk is the risk that the fair value or future cash flows of a financial instrumentwill fluctuate because of changes in market prices. The market risks relevant todnata’s operations are interest rate risk and currency risk.
dnata is exposed to the effects of fluctuations in the prevailing levels of interest rateson its long term borrowings and cash surpluses placed on short term deposits. Cashsurpluses are primarily held in UAE Dirhams and US Dollars to which the UAE Dirhamis pegged.
Long term borrowings have been taken at variable rates and thus expose dnata tocash flow interest rate risk. No hedging cover is taken due to the stable interest rateenvironment that exists in the countries where the loans are contracted. The keyreference rates based on which interest costs are determined are CHF LIBOR forSwiss Francs, GBP LIBOR for Sterling Pounds and SIBOR for Singapore Dollars.Summarised quantitative data is available in Note 16 for interest cost exposures.
Currency risk
Sensitivity analysis of market risk
Effect onprofit
Effect onequity
Effect onprofit
Effect onequity
AED m AED m AED m AED m
Interest cost- 100 basis pointsSingapore Dollars 2 2 2 2 Swiss Francs 3 3 3 3 Sterling Pounds 3 3 1 1
8 8 6 6 + 100 basis pointsSingapore Dollars (2) (2) (2) (2)Swiss Francs (3) (3) (3) (3)Sterling Pounds (3) (3) (1) (1)
(8) (8) (6) (6)Interest income- 100 basis points (2) (2) (1) (1)+ 100 basis points 2 2 1 1 Currency - Singapore Dollars+ 1% - (1) - (2)- 1% - 1 - 2 Currency - Swiss Francs+ 1% - (3) - (3)- 1% - 3 - 3
2012 2011
dnata is exposed to the effects of fluctuation in the prevailing foreign currencyexchange rates on its long term debt obligations denominated in Singapore Dollars,Swiss Francs and Sterling Pounds. Cash flows from the Singapore, Switzerland andUnited Kingdom operations are adequate to meet the repayment schedules.
The following sensitivity analysis shows how profit and equity would change if themarket risk variables had been different at the end of the reporting period with allother variables held constant and has been computed on the basis of assumptionsand indices used and considered by other market participants.
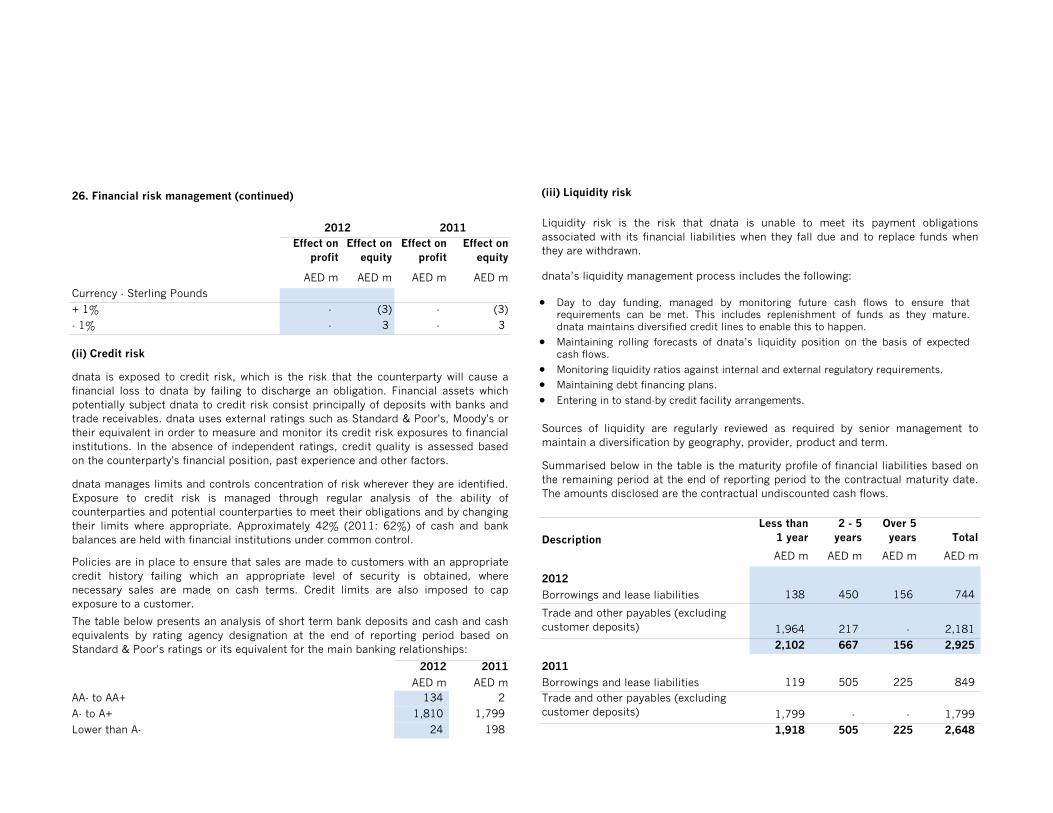
26. Financial risk management (continued)
Effect onprofit
Effect onequity
Effect onprofit
Effect onequity
AED m AED m AED m AED m
Currency - Sterling Pounds
+ 1% - (3) - (3)
- 1% - 3 - 3
(ii) Credit risk
2012 2011
AED m AED mAA- to AA+ 134 2
A- to A+ 1,810 1,799
Lower than A- 24 198
Policies are in place to ensure that sales are made to customers with an appropriatecredit history failing which an appropriate level of security is obtained, wherenecessary sales are made on cash terms. Credit limits are also imposed to capexposure to a customer.
The table below presents an analysis of short term bank deposits and cash and cashequivalents by rating agency designation at the end of reporting period based onStandard & Poor's ratings or its equivalent for the main banking relationships:
2012 2011
dnata is exposed to credit risk, which is the risk that the counterparty will cause afinancial loss to dnata by failing to discharge an obligation. Financial assets whichpotentially subject dnata to credit risk consist principally of deposits with banks andtrade receivables. dnata uses external ratings such as Standard & Poor's, Moody's ortheir equivalent in order to measure and monitor its credit risk exposures to financialinstitutions. In the absence of independent ratings, credit quality is assessed basedon the counterparty's financial position, past experience and other factors.
dnata manages limits and controls concentration of risk wherever they are identified.Exposure to credit risk is managed through regular analysis of the ability ofcounterparties and potential counterparties to meet their obligations and by changingtheir limits where appropriate. Approximately 42% (2011: 62%) of cash and bankbalances are held with financial institutions under common control.
(iii) Liquidity risk
Description
Less than 1 year
2 - 5 years
Over 5 years Total
AED m AED m AED m AED m
2012
Borrowings and lease liabilities 138 450 156 744
Trade and other payables (excluding customer deposits) 1,964 217 - 2,181
2,102 667 156 2,925
2011
Borrowings and lease liabilities 119 505 225 849
Trade and other payables (excluding customer deposits) 1,799 - - 1,799
1,918 505 225 2,648
Sources of liquidity are regularly reviewed as required by senior management tomaintain a diversification by geography, provider, product and term.
Summarised below in the table is the maturity profile of financial liabilities based onthe remaining period at the end of reporting period to the contractual maturity date.The amounts disclosed are the contractual undiscounted cash flows.
Liquidity risk is the risk that dnata is unable to meet its payment obligationsassociated with its financial liabilities when they fall due and to replace funds whenthey are withdrawn.
dnata’s liquidity management process includes the following:
• Day to day funding, managed by monitoring future cash flows to ensure that requirements can be met. This includes replenishment of funds as they mature. dnata maintains diversified credit lines to enable this to happen.
• Maintaining rolling forecasts of dnata’s liquidity position on the basis of expected cash flows.
• Monitoring liquidity ratios against internal and external regulatory requirements.
• Maintaining debt financing plans.
• Entering in to stand-by credit facility arrangements.

dnata130
27. Business combinations
AED m
3
79
9
147
(63)
(20)
(148)
7
7
528
535
(147)
Less: Deferred consideration (110)
(78)
200
The goodwill is attributable to the profitability of the acquired business and expectedsynergies with existing travel services business. The acquisition of Travel Republicwill allow dnata to capitalise on the increasing popularity of online travel booking.
Cash outflow on acquisition
Less: Cash and cash equivalents acquired
Fair value of net assets acquired
Total purchase consideration
On 28 December 2011, dnata acquired 100% beneficial interest in Travel RepublicGroup, through its wholly owned subsidiary dnata World Travel Limited (DWTL).Travel Republic is an online travel services company operating in the UnitedKingdom, Ireland and Spain.
Current liabilities
dnata's share of net assets acquired
Cash and cash equivalents
Other current assets
Contingent consideration is payable after 5 years from the acquisition date and isbased on growth in EBITDA and free cash less outstanding debts. The amount hasbeen estimated based on management's long term plan for the business.
Costs of acquisition amounting to AED 9 m is included under operating costs.
Less: Contingent consideration
Goodwill (Note 9)
Deferred tax liabilities (Note 18)
Intangible assets (Note 9)
Borrowings and lease liabilities
Property, plant and equipment (Note 8)
The assets and liabilities arising from and recognised on acquisition of the subsidiaryare as follows:
AED m
Property, plant and equipment (Note 8) 377
Intangible assets (Note 9) 244
Investment in associates and joint ventures (Note 10) 45
Deferred tax assets (Note 18) 10
Other current assets 383
Cash and cash equivalents 55
(341)
Retirement benefit obligations (Note 15) (24)
(58)
Deferred tax liabilities (Note 18) (57)
Current liabilities (354)
Fair value of net assets acquired 280
(146)
134
464
598
Less: Cash and cash equivalents acquired (55)
Cash outflow on acquisition 543
The acquired business contributed revenue of AED 72 m and a profit of AED 5 mfrom the acquisition date to 31 March 2012. If the acquisition had taken place at thebeginning of the year, the revenue and profit would have been AED 223 m and AED20 m respectively.
Goodwill (Note 9)
Total purchase consideration
dnata's share of net assets acquired
Borrowings and lease liabilities
Other provisions (Note 17)
Less: Non-controlling interests
The assets and liabilities arising from and recognised on acquisition of the subsidiaryare as follows:
In the previous year, dnata acquired 100% of the shares in Alpha Flight GroupLimited (Alpha), through its wholly-owned subsidiary Dnata Catering ServicesLimited. Alpha is a leading international in-flight catering business operating at 61airports in 11 countries. The acquired business contributed revenue of AED 465 mand loss of AED 5 m from the acquisition date to 31 March 2011.
dnata will combine the online travel services strength of Travel Republic with itsglobal travel network to offer a broader range of destinations whilst maintaining thesame high-quality customer experience.

28. Capital management
29. Effect of change in accounting policy
In line with the guidance provided in IAS 8, the change in accounting policy has been applied retrospectively. Opening balance sheet and comparative figures have been restated.
dnata monitors the return on equity which is defined as profit for the year expressedas a percentage of average equity. dnata seeks to provide a higher return to theOwner by resorting to borrowings to finance its acquisitions. In 2012, dnata achieveda return on equity of 23.7% (2011: 18.0%) in comparison to an effective interest rateof 2.9% (2011: 2.7%) on borrowings.
dnata has changed its accounting policy for the recognition of retirement benefitobligations from the corridor to the equity approach with effect from 1 April 2011.This is consistent with the direction that the International Accounting StandardsBoard (IASB) has taken to reflect retirement benefit oblligations more appropriatelyin the future standard. As a result, actuarial gains and losses are recognised in equitythrough other comprehensive income in the period in which they arise. Previouslyactuarial gains and losses in excess of the corridor limits determined in accordancewith IAS 19, were charged / credited in the consolidated income statement over aperiod of three years.
As reported earlier
Effect of change
As restated
AED m AED m AED mInvestment in associates and joint ventures 483 (87) 396 Retirement benefit obligations 198 (1) 197 Total equity 3,194 (86) 3,108
2012 2011AED m AED m
Increase in share of results in associates and joint ventures 8 16
Increase in profit before income tax 8 16
Decrease in other comprehensive income 44 56
Decrease in total comprehensive income for the year 36 40
Decrease in investment in associates and joint ventures 100 102
Increase in retirement benefit obligation 71 24
Decrease in retained earnings 171 126
The effect of change in accounting policy for the current and previous year istabulated below:
The effect of change in accounting policy as at 1 April 2010 is as below:

132 eMIRATesTEN-YEAR OVERVIEW
Consolidated income statement 2011-12 2010-11 2009-10 2008-09 2007-08 2006-07 2005-06 2004-05 2003-04 2002-03
Revenue and other operating income AED m 62,287 54,231 43,455 43,266 38,810 29,173 22,658 17,909 13,116 9,514
Operating costs AED m 60,474 48,788 39,890 40,988 34,359 25,834 20,006 15,290 11,368 8,513
- of which jet fuel AED m 24,292 16,820 11,908 14,443 11,005 7,525 5,445 3,279 1,633 998
- of which employee costs AED m 7,936 7,615 6,345 5,861 5,475 4,024 3,187 2,701 2,254 1,749
Operating profit AED m 1,813 5,443 3,565 2,278 4,451 3,339 2,652 2,619 1,749 1,001
Profit attributable to the Owner AED m 1,502 5,375 3,538 686 5,020 3,096 2,475 2,407 1,574 907
Consolidated statement of financial position
Non-current assets AED m 51,896 43,223 36,870 31,919 27,722 22,530 17,018 12,219 8,438 7,485
Current assets AED m 25,190 21,867 18,677 15,530 18,790 15,428 14,376 11,499 9,900 6,594
- of which bank deposits and cash AED m 15,587 13,973 10,511 7,168 10,360 9,123 9,199 7,328 6,455 4,213
Total assets AED m 77,086 65,090 55,547 47,449 46,512 37,958 31,394 23,719 18,338 14,079
Total equity AED m 21,466 20,813 17,475 15,571 16,843 13,170 10,919 8,112 5,013 3,818
- of which equity attributable to the Owner AED m 21,224 20,606 17,274 15,412 16,687 13,040 10,788 7,962 4,897 3,709
Non-current liabilities AED m 29,855 22,987 19,552 17,753 14,206 14,210 10,616 8,927 8,101 6,385
Current liabilities AED m 25,765 21,290 18,520 14,125 15,463 10,578 9,859 6,680 5,224 3,876
Consolidated statement of cash flows
Cash flow from operating activities AED m 8,107 11,004 8,328 5,016 7,335 5,765 4,106 4,009 2,555 2,252
Cash flow from investing activities AED m (10,566) (5,092) (577) 1,896 (8,869) (4,749) (5,049) (2,638) (1,086) (619)
Cash flow from financing activities AED m (201) (5,046) (2,982) (5,085) (3,820) (198) 867 (487) 893 (489)
Net change in cash and cash equivalents AED m (2,660) 866 4,769 1,827 (5,354) 818 (76) 885 2,362 1,144
Other financial data
Net change in cash and cash equivalents and short term bank deposits
AED m 1,614 3,462 3,343 (3,192) 1,237 (76) 1,871 873 2,242 1,089
EBITDAR AED m 10,735 13,437 10,638 8,286 9,730 7,600 5,970 5,331 3,764 2,487
Borrowings and lease liabilities AED m 30,880 23,230 19,605 16,512 13,717 13,338 11,247 8,142 7,620 6,050
Less: Cash assets AED m 15,587 13,973 10,511 7,368 12,715 11,594 9,828 7,645 6,605 4,261
Net debt AED m 15,293 9,257 9,094 9,144 1,002 1,744 1,419 497 1,015 1,789
Capital expenditure AED m 13,644 12,238 8,053 10,178 9,058 5,388 4,528 3,115 1,409 1,573
Notes :
2.Comparative figures are restated, where applicable, according to IFRS rules i.e. only the immediately preceding year's figures are restated and figures beyond that year have not been amended.
1.The ten-year overview has been extracted from the audited financial statements which have been drawn up in compliance with IFRS. New Standards and amendments to existing IFRS have been adopted on the effective dates applicable to Emirates.
eMIRATesTEN-YEAR OVERVIEW
Key ratios 2011-12 2010-11 2009-10 2008-09 2007-08 2006-07 2005-06 2004-05 2003-04 2002-03
Operating margin 2.9 10.0 8.2 5.3 11.5 11.4 11.7 14.6 13.3 10.5
Profit margin 2.4 9.9 8.1 1.6 12.9 10.6 10.9 13.4 12.0 9.5
Return on shareholder's funds 7.2 28.4 21.6 4.4 33.8 26.0 26.4 37.4 36.6 27.3
EBITDAR margin 17.2 24.8 24.5 19.2 25.1 26.1 26.3 29.8 28.7 26.1
Cash assets to revenue and other operating income % 25.0 25.8 24.2 17.0 32.8 39.7 43.4 42.7 50.4 44.8
Net debt equity ratio 71.2 44.5 52.0 58.7 5.9 13.2 13.0 6.1 20.2 46.9
% 162.1 127.6 158.5 167.0 98.1 116.1 111.9 116.6 175.2 185.5
% 324.1 197.6 260.3 313.9 169.9 201.2 204.6 177.4 233.3 284.8
% 3.0 2.7 2.5 3.5 5.2 5.7 4.5 3.5 3.7 3.8
Fixed to float debt mix 89:11 89:11 83:17 61:39 68:32 63:37 63:37 67:33 56:44 45:55
Airline Operating Statistics
Performance Indicators
Yield Fils per RTKM 251 232 211 254 236 216 203 192 181 169
Unit cost Fils per ATKM 166 147 136 163 151 129 122 111 107 111
Unit cost excluding jet fuel Fils per ATKM 97 95 94 104 101 90 88 86 91 97
Breakeven load factor 65.9 63.6 64.4 64.1 64.1 59.9 60.2 58.0 59.0 65.4
Fleet
Aircraft 169 148 142 127 109 96 85 69 61 46
Average fleet age 77 77 69 64 67 63 61 55 46 36
Production
Destination cities 122 111 102 99 99 89 83 76 73 64
Overall capacity 35,467 32,057 28,526 24,397 22,078 19,414 15,803 13,292 10,207 7,350
Available seat kilometres 200,687 182,757 161,756 134,180 118,290 102,337 82,009 68,930 54,657 41,337
Aircraft departures 142,129 133,772 123,055 109,477 101,709 92,158 79,937 72,057 58,763 45,452
Traffic
Passengers carried 33,981 31,422 27,454 22,731 21,229 17,544 14,498 12,529 10,441 8,503
Passenger seat kilometres 160,446 146,134 126,273 101,762 94,346 77,947 62,260 51,398 40,110 31,661
Passenger seat factor 80.0 80.0 78.1 75.8 79.8 76.2 75.9 74.6 73.4 76.6
Cargo carried 1,796 1,767 1,580 1,408 1,282 1,156 1,019 838 660 525
Overall load carried 23,672 22,078 19,063 15,879 14,739 12,643 10,394 8,649 6,629 5,145
Overall load factor 66.7 68.9 66.8 65.1 66.8 65.1 65.8 65.1 64.9 70.0
Employee
Average employee strength 33,634 30,258 28,686 28,037 23,650 20,273 17,296 15,858 12,804 10,507
Revenue per employee 1,796 1,738 1,459 1,492 1,625 1,431 1,285 1,104 993 884
%
%
%
%
%
Net debt (including aircraft operating leases) equity ratio
RTKM million
%
number
months
%
number
ATKM million
ASKM million
Net debt (including aircraft operating leases) to EBITDAR
Effective interest rate on borrowings and lease liabilities
number
AED '000
%
number
number '000
RPKM million
tonnes '000

134 dnataTEN-YEAR OVERVIEW
Consolidated income statement 2011-12 2010-11 2009-10 2008-09 2007-08 2006-07 2005-06 2004-05 2003-04 2002-03
Revenue and other operating income AED m 7,000 4,406 3,160 3,181 2,585 1,996 1,734 1,390 1,079 942
Operating costs AED m 6,207 3,906 2,601 2,714 2,340 1,700 1,444 1,149 920 818
- of which employee costs AED m 2,838 2,032 1,387 1,347 1,227 993 863 700 577 502
- of which cost of goods sold AED m 1,109 241 35 40 30 33 32 13 nil nil
- of which airport operations & cargo - other direct costs AED m 702 582 442 391 234 75 n/a n/a n/a n/a
Operating profit AED m 793 500 559 467 245 296 290 241 159 124
Profit attributable to the Owner AED m 808 576 613 507 305 360 324 260 174 142
Consolidated statement of financial position
Non-current assets AED m 3,760 3,072 1,934 1,984 1,950 1,107 863 935 313 269
Current assets AED m 3,359 3,328 2,704 1,963 1,992 1,846 1,580 1,141 1,039 875
- of which bank deposits and cash AED m 1,999 2,083 1,982 1,350 1,383 1,403 1,099 843 834 701
Total assets AED m 7,119 6,400 4,638 3,947 3,942 2,953 2,442 2,076 1,352 1,144
Total equity AED m 3,683 3,282 3,194 2,553 2,180 1,823 1,453 1,126 866 721
- of which equity attributable to the Owner AED m 3,614 3,209 3,194 2,553 2,180 1,823 1,453 1,126 866 721
Non-current liabilities AED m 1,275 1,115 672 697 845 460 464 480 136 124
Current liabilities AED m 2,161 2,003 772 697 917 670 526 470 350 299
Consolidated statement of cash flows
Cash flow from operating activities AED m 1,167 901 764 481 540 531 423 370 295 265
Cash flow from investing activities AED m (431) (1,333) 391 (71) (1,420) (373) (129) (638) (120) 10
Cash flow from financing activities AED m (718) (96) (73) (68) 224 (46) (40) 281 (40) (40)
Net cash flow for the year AED m 18 (528) 1,082 342 (656) 113 254 12 135 234
Other financial data
Cash assets AED m 1,999 2,083 1,982 1,350 1,383 1,403 1,228 972 834 701
Notes :
1. The ten-year overview has been extracted from the audited financial statements which have been drawn up in compliance with IFRS. New Standards and amendments to existing IFRS have been adopted on the effective dates applicable to dnata.
3.Effective 2006-07 "airport operations and cargo - other direct costs" are reported as a separate line item within operating costs. Prior to that year, such costs are reflected as not available or "n/a" and they were reported under the corporate overheads line.
2.Comparative figures are restated, where applicable, according to IFRS rules i.e. only the immediately preceding year's figures are restated and figures beyond that year have not been amended.

dnataTEN-YEAR OVERVIEW
Key ratios 2011-12 2010-11 2009-10 2008-09 2007-08 2006-07 2005-06 2004-05 2003-04 2002-03
Operating margin % 11.3 11.3 17.7 14.7 9.5 14.8 16.7 17.3 14.7 13.1
Profit margin % 11.5 13.1 19.4 15.9 11.8 18.0 18.7 18.7 16.1 15.0
Return on shareholder's funds % 23.7 18.0 21.3 21.4 15.2 22.0 25.2 26.1 21.9 21.2
Employee
Average employee strength number 20,275 17,971 13,298 12,434 11,640 9,832 9,860 9,607 7,325 6,392
Revenue per employee* AED '000 353 323 266 256
Performance Indicators
Airport
Aircraft handled* number 253,434 232,585 192,120 177,495
Cargo handled* tonnes '000 1,543 1,494 1,121 1,003
Man hours per turn hours 132 122 115 124
Aircraft handled per employee* number 21 20 18 17 17 18
Cargo handled per man hour kgs 289 283 277 241
Cargo handled per employee* kgs '000 611 564 552 512 478 492
Catering
Meals uplifted number '000 52,186 11,743
* Figures for 2007-08 and prior years exclude subsidiaries.
633 535 503 458 406 399
119,510 109,648 101,607 93,004 79,932 69,322
241 210 176 155 150 151

136 eMIRATesGROUP COMPANIES OF EMIRATES
emirates emirates emirates
Air Transportation and related services
In-flight and institutional catering services Consumer goods
emirates
Hotel operations and food and beverage operations
Note: Percentages indicate benef cial interest in the company. Legal share holding may be different. Group companies of associated companies and joint ventures have been excluded.
100% The High Street LLC (UAE)
50% Emirates – CAE Flight Training LLC (UAE)
50% CAE Flight Training (India) Pvt Ltd
50% CAE Middle East Holdings Ltd (UAE)
90% Emirates Flight Catering Co. LLC (UAE) 100% Maritime and Mercantile International Holding LLC (UAE)
68.7% Maritime and Mercantile International LLC (UAE)
100% Maritime and Mercantile International Maldives Pvt Ltd
50% MMI Tanzania Pvt Ltd
49% Independent Wine and Spirit (Thailand) Co. Ltd
40% Zanzibar Maritime and Mercantile International Co. Ltd
100% Duty Free Dubai Ports FZE (UAE)
100% Harts International Retailers (M.E.) FZE (UAE)
100% Harts International LLC (UAE)
100% Maritime and Mercantile International FZE (UAE)
50% Oman United Agencies LLC
50% Sirocco FZCO (UAE)
49% Fujairah Maritime and Mercantile International LLC (UAE)
100% Emirates Hotel LLC (UAE)
100% Emirates Hotels (Australia) Pty Ltd
100% Emirates Hotels (Seychelles) Ltd
51% Premier Inn Hotels LLC (UAE)
100% Emirates Leisure Retail (Holding) LLC (UAE)
100% Emirates Leisure Retail (Australia) Pty Ltd
100% Emirates Leisure Retail (Singapore) Pte Ltd
70% Emirates Leisure Retail (Oman) LLC
68.7% Emirates Leisure Retail LLC (UAE)
100% Community Club Management FZE (UAE)

dnataGROUP COMPANIES OF dnata
dnata dnata / dnata World Travel
Cargo and ground handling Travel services
dnata
Catering
dnata
Freight forwarding services
dnata
Others
* Also provides catering serv ces.** Held through Mountainf eld Investments (Pty Ltd).
Note: Percentages indicate beneficial interest in the company. Legal share holding may be different. Group companies of assoc ated compan es and joint ventures have been excluded.
100% Dnata International Airport Services Pte Ltd (Singapore)
100% Dnata Aviation Services GmbH (Austria)
100% Dnata Inc. (Phillippines)
100% Dnata Aviation Services Ltd (UK)
80% Dnata Airport Services Kurdistan Ltd (Cayman Islands)
50% Toll Dnata Air Services Pty Ltd (Australia)
50% Gerry’s Dnata (Private) Ltd (Pakistan)
100% dnata Ltd (UK)
100% Dnata for Airport Services Ltd (Iraq)
100% Dnata Gmbh (Austria)
100% Dnata Switzerland AG
30% GVAssistance SA (Switzerland)
100% CIAS International Pte Ltd (Singapore)
100% dnata Singapore Pte Ltd (Singapore)*
20% Guangzhou Baiyun International Airport Ground Handling Services Co. Ltd (P. R. China)
100% MMI Travel LLC (UAE)
100% Dnata World Travel Limited (UK)
100% Dnata Travel (UK) Limited
100% DWT International Pvt Ltd (India)
90% Al Hidaya Travel & Tourism WLL (Bahrain)
90% Cleopatra International Travel WLL (Bahrain)
50% Al Tawfeeq Travel (Dnata Travels) LLC (Qatar)
70% dnata Travel Limited (Saudi Arabia)
50% Dunya Travel LLC (UAE)
50% Najm Travels LLC (Afghanistan)
49% Mindpearl Group Ltd (Cayman Islands)
22.4% Hogg Robinson Group Plc (UK)
50% Oman United Agencies Travel LLC
100% Travel Technology Investments Limited (UK)
100% Travel Republic Holdings Limited (UK)
100% Travel Republic Limited (UK)
100% Haddon Blake Limited (UK)
100% Dnata Catering Services Ltd (UK)
100% Alpha Flight Group Ltd (UK)
50% Wings Inflight Services (Pty Ltd)** (South Africa)
100% Alpha Flight US Inc
100% Alpha Inflight US LLC
100% Alpha Flight Ireland Ltd
100% Alpha Flight Services BV (Netherlands)
100% Alpha Flight a.s. (Czech Republic)
100% Alpha Flight UK Ltd
100% Alpha-Airfayre Ltd (UK)
100% Alpha Heathrow Ltd (UK)
100% Airfayre Heathrow Ltd (UK)
100% Alpha Airport Services EOOD (Bulgaria)
100% Alpha Flight Italia srl (Italy)
64.2% Alpha Rocas SA (Romania)
50% Servair Air Chef srl (Italy)
49% Alpha Flight Services UAE LLC
35.87% Jordan Flight Catering Company Ltd
100% Alpha Flight Services Pty Ltd (Australia)
100% Mercator Asia Co. Ltd (Thailand)
50% Transguard Group LLC (UAE)
50% Dubai Express LLC (UAE)
25.5% SDV UAE LLC
50% PAL PAN Airport Logistics LLC (UAE)
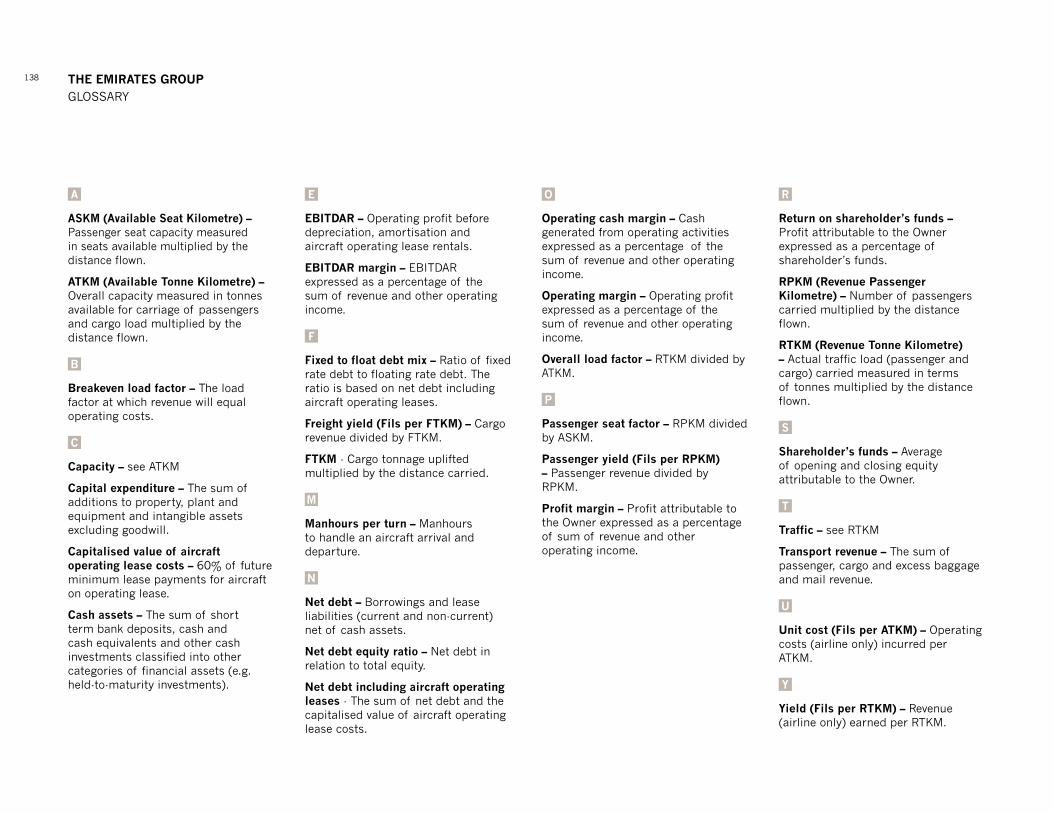
138
A
AskM (Available seat kilometre) – Passenger seat capacity measured in seats available multiplied by the distance flown.
ATkM (Available Tonne kilometre) – Overall capacity measured in tonnes available for carriage of passengers and cargo load multiplied by the distance flown.
b
breakeven load factor – The load factor at which revenue will equal operating costs.
C
Capacity – see ATKM
Capital expenditure – The sum of additions to property, plant and equipment and intangible assets excluding goodwill.
Capitalised value of aircraft operating lease costs – 60% of future minimum lease payments for aircraft on operating lease.
Cash assets – The sum of short term bank deposits, cash and cash equivalents and other cash investments classified into other categories of financial assets (e.g. held-to-maturity investments).
e
ebITDAR – Operating profit before depreciation, amortisation and aircraft operating lease rentals.
ebITDAR margin – EBITDAR expressed as a percentage of the sum of revenue and other operating income.
F
Fixed to float debt mix – Ratio of fixed rate debt to floating rate debt. The ratio is based on net debt including aircraft operating leases.
Freight yield (Fils per FTkM) – Cargo revenue divided by FTKM.
FTkM - Cargo tonnage uplifted multiplied by the distance carried.
M
Manhours per turn – Manhours to handle an aircraft arrival and departure.
N
Net debt – Borrowings and lease liabilities (current and non-current) net of cash assets.
Net debt equity ratio – Net debt in relation to total equity.
Net debt including aircraft operating leases - The sum of net debt and the capitalised value of aircraft operating lease costs.
O
Operating cash margin – Cash generated from operating activities expressed as a percentage of the sum of revenue and other operating income.
Operating margin – Operating profit expressed as a percentage of the sum of revenue and other operating income.
Overall load factor – RTKM divided by ATKM.
p
passenger seat factor – RPKM divided by ASKM.
passenger yield (Fils per RpkM) – Passenger revenue divided by RPKM.
profit margin – Profit attributable to the Owner expressed as a percentage of sum of revenue and other operating income.
R
Return on shareholder’s funds – Profit attributable to the Owner expressed as a percentage of shareholder’s funds.
RpkM (Revenue passenger kilometre) – Number of passengers carried multiplied by the distance flown.
RTkM (Revenue Tonne kilometre) – Actual traffic load (passenger and cargo) carried measured in terms of tonnes multiplied by the distance flown.
s
shareholder’s funds – Average of opening and closing equity attributable to the Owner.
T
Traffic – see RTKM
Transport revenue – The sum of passenger, cargo and excess baggage and mail revenue.
u
unit cost (Fils per ATkM) – Operating costs (airline only) incurred per ATKM.
y
yield (Fils per RTkM) – Revenue (airline only) earned per RTKM.
The eMIRATes GROupGLOSSARY

P.O. BOX 686, DUBAI,UNITED ARAB EMIRATES emirates.com ekgroup.com
P.O. BOX 1515, DUBAI, UNITED ARAB EMIRATES dnata.com