undaf results matrix – ghana - undp | united nations ...web.undp.org/execbrd/word/gha - undaf...
TRANSCRIPT

UNDAF Results Matrix – Ghana
Thematic area 1: Agricultural Modernization and Food Security (with focus on Nutrition)
National Development Priority: ACCELERATED AGRICULTURAL MODERNISATION
- IMPROVED AGRICULTURAL PRODUCTIVITY- INCREASED AGRICULTURAL COMPETITIVENESS AND ENHANCED INTEGRATION INTO DOMESTIC AND INTERNATIONAL MARKETS- NUTRITION AND FOOD SECURITY
Support to MDGs: MDG 1, with close linkages to MDGs 2, 4, 5 and 6
Outcomes Indicators , Baseline, Target Means of Verification Risks and Assumptions Role of Partners Indicative Resources (US$)
UN agency US$
Outcome 1: An additional 15% of medium and smallholder farmers1 (including 50 %women farmers2); in at least 5 regions; have access to MoFA approved3; and timely, agricultural extension services and access to markets by 2016.
Indicators:
% change of medium and smallholder farmers (including women) with access to MoFA approved agricultural extension services and markets in at least 5 regions of operation.
Baseline:
Number of registered small and medium holder farmers in Ghana (Source: Farmer registration database (MoFA), to be completed in 2012)
MoFA Annual Reports
Farmer Registration Database (MoFA) (to be completed 2012)
FAO and WFP project reports, field mission reports and assessment reports.
Planned WFP survey of numbers of small and medium holder farmers
Risks
- Natural disasters and weather.
- Budget constraints to timely purchase and distribution of inputs by government
- Decrease in donor contributions for Ghana.
- Inadequate extension services and personnel;
- Low numbers of female extension officers.
- International market trends and vulnerabilities.
MoFA:
Coordination and Facilitation
Development of Farmer Registration database by 2012.
Provide extension services resources (human, physical, financial)
Ministry of Finance:
WFP
FAO
UNAIDS
UNIFEM
1.75m
4.0m
1 Medium and small holder farmers are those on 5 – 10 and 2 – 3 acres respectively2 Farmers is defined as all forms of primary production (livestock, crops, fisheries, forestry)
3 MoFA approved refers to services in line with the government’s strategy / policy documents
UNDAF Results Matrix: Option 2 (Outcomes and Outputs) – Nov 23

36% of medium and small holders have access to extension services (Source: SEND Ghana report 2009).
% with access to market now (Source: WFP Baseline survey to be completed)
Targets:
Additional 15% of medium and smallholder farmers, 50% of whom are women, with access to extension services and markets.
with access to market. - Existing/ Change of government priorities on food and agriculture.
- Farmers ownership (or lack thereof) of land. Farmers are hesitant to improve practices due to insecurity of land tenure arrangements.
Assumptions
- That there are MoFA approved, adequate extension services available.
- During the project’s implementation special efforts to be made to include women’s small holder farmers.
Timely release of agriculture related funding for MoFA.
Farmer’s Groups:
Active participation.
Implementation.
NGOs:
Relevant and aligned advocacy.
Assistance with implementation.
Donors and development partners:
Funding and technical assistance.
Output 1.1: By 2016, agricultural inputs4 are made available to an additional 15%
Medium / smallholder farmers in at least 5 regions.
Indicators:
- % change of smallholder/low income farmers received agricultural inputs.
- % increase in agricultural productivity for those farmers part of the program.
- The number of regions that achieve the 15% increase in access to markets and agricultural services.
Baseline:
- MoFA Annual Reports- Farmer Registration
Database (MoFA) (to be completed 2012)
- FAO and WFP project reports, field mission reports and assessment reports.
Risks
- Availability of inputs for distribution programs
- Farmer registration database not yet complete.
Assumptions
- Farmers use the inputs provided appropriately (quantity used, timing of use)
- Inputs are delivered in a timely manner.
MoFA:
Coordination and Facilitation
Provision of resources relating to extension services (human, physical, financial)
Farmer’s Groups:
Active participation.
Implementation.
NGOs:
Relevant and aligned
4 Considered items such as fertilizer, improved seed, agrochemicals, etc.
UNDAF Results Matrix: Option 2 (Outcomes and Outputs) – Nov 23

- 36% smallholder/medium farmers have access to inputs (Source: SEND Ghana report 2009).
Targets: (timescales - annual)
- Additional 15% farmers with access to inputs
- Interventions in at least 5 regions.
- Collaboration with research institutes for improved seeds
- Inputs are readily available on the market for the UN agencies to buy.
advocacy.
Assistance with implementation.
Donors and development partners:
Funding and technical assistance.
Research institute for seed research: Ongoing implementation of their research.
Output 1.2: 1,350
agricultural extension
agents and researchers have increased capacity to reach out to medium and smallholder farmers by 2016
Indicators:
- Number of extension agents within MoFA, and researchers that receive capacity building training.
Baseline:
- 300 extension agents and researchers trained in 2008-2009 (FAO internal sources)
Targets:
- 270 extension agents and researchers per year, receive capacity building training.
Means of Verification
Project reports
Field mission reports
Quarterly progress reports (MoFA; FAO)
District reports (MoFA)
Risks
- Trainees do not apply acquired knowledge
- High level of staff attrition
Assumptions
- As 1.1 above.
MoFA:
Coordination and Facilitation
Provide extension services resources (human, physical, financial)
Farmer’s Groups:
Active participation.
Implementation.
NGOs:
Relevant and aligned advocacy.
Assistance with implementation.
INGOs and other donors and development partners.
Funding and technical assistance.
UNDAF Results Matrix: Option 2 (Outcomes and Outputs) – Nov 23

Research institute for seed research: ongoing implementation of their research.
Output 1.3: Additional 10% of small and medium farmers have adopted Good Agricultural Practices (GAP) by 2016.
Indicators:
- Adoption rate of GAP among farmers as measured by FAO
Baseline:
- 20% of small and medium holder are using GAP (FAO internal sources and monitoring)
Targets:
- Additional 10% adoption rate by 2016
- As per output 1.2 Risks:
Inadequate access to appropriate technologies (availability) to implement GAP)
Farmers ownership (or lack thereof) of land. Farmers are hesitant to improve practices due to insecurity of land tenure arrangements.
Assumptions
Small and medium holders understand GAP
Good facilitations from extension agents
Small and medium holders have the capacity to adopt GAP (willing to adopt, financial capacity etc.)
Availability of demonstration farms.
Role of Partners: (as per output 1.2)
Output 1.4: Maize, soya bean, rice, and cowpea value chains for medium and smallholder farmers
Indicators:
- Number of actors along the specified value chains strengthened
Means of verification
As per output 1.3
Risks:
That local prices are higher than imported parity prices (WFP will not buy locally under
Role of partners:
Farmer Based
UNDAF Results Matrix: Option 2 (Outcomes and Outputs) – Nov 23

are strengthened in the major production areas by 2016.
- Quantity of maize and rice commodities locally purchased from small and medium holder farmers under P4P and traditional local procurement.
- Number of training workshops conducted for actors along the value chain.
Baseline:
- 25 Actors
- 35,000 metric tonnes over 2006 – September 2010 (total purchases including rice and maize) Source: WFP
- Number of training workshops conducted along the value chain: 100
Targets:
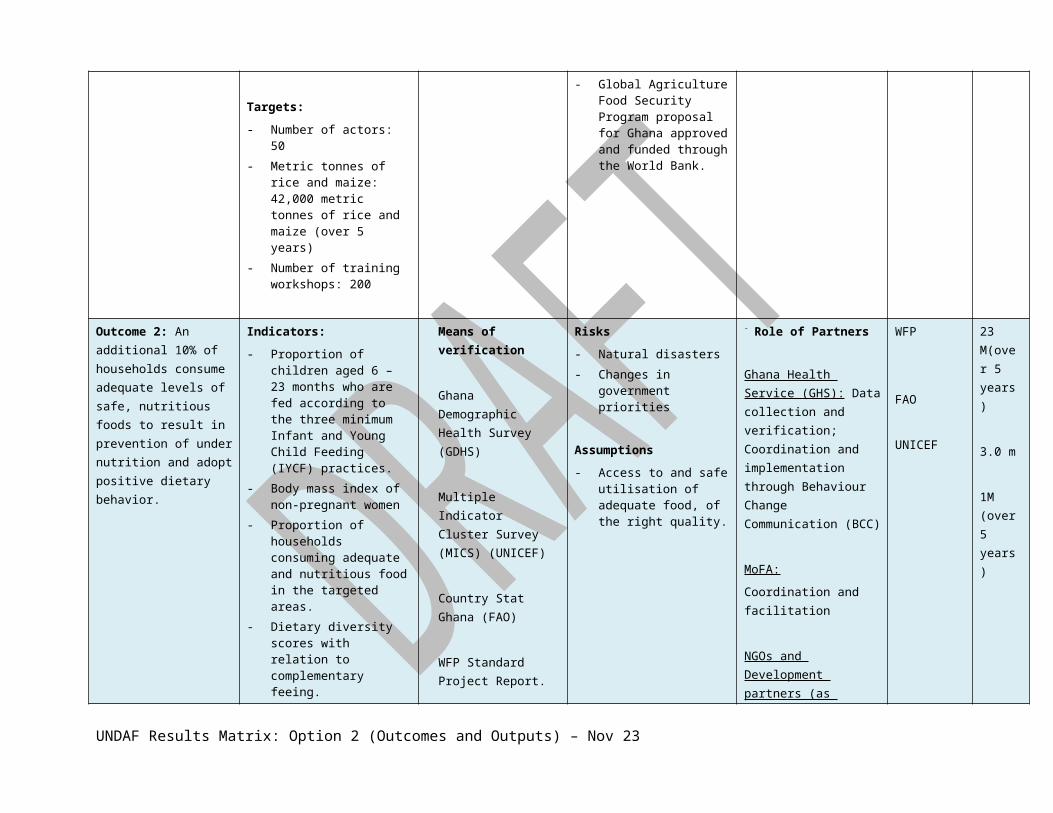
- Number of actors: 50- Metric tonnes of rice and
maize: 42,000 metric tonnes of rice and maize (over 5 years)
- Number of training workshops: 200
P4P reports by WFP
WFP reports on quantities of purchases under traditional procurement activities.
traditional local procurement)
Poor quality of the food available for purchase.
Assumptions:
- Effective and sustained participation by actors.
- National Buffer Stock continues to buy from the farmers
- School Feeding Programme continues to buy locally
- Block Farming System continue to remain in place
- Global Agriculture Food Security Program proposal for Ghana approved and funded through the World Bank.
Organisations (FBOs): Encourage and coordinate participation by farmers
Ministry of Agriculture: implementing the block farming program
Ministry of Local Government and Rural Development: Implementation of school feeding program.
Outcome 2: An additional 10% of households consume adequate levels of safe, nutritious foods to result in prevention of under nutrition and adopt positive dietary behavior.
Indicators:
- Proportion of children aged 6 – 23 months who are fed according to the three minimum Infant and Young Child Feeding (IYCF) practices.
- Body mass index of non-pregnant women
- Proportion of households
Means of verification
Ghana Demographic Health Survey (GDHS)
Multiple Indicator Cluster Survey (MICS) (UNICEF)
Risks
- Natural disasters- Changes in government
priorities
Assumptions
- Access to and safe utilisation of adequate food, of the right quality.
- Role of Partners
Ghana Health Service (GHS): Data collection and verification; Coordination and implementation through Behaviour Change Communication (BCC)
WFP
FAO
UNICEF
23 M(over 5 years)
3.0 m
1M (over 5
UNDAF Results Matrix: Option 2 (Outcomes and Outputs) – Nov 23

consuming adequate and nutritious food in the targeted areas.
- Dietary diversity scores with relation to complementary feeing.
Baseline:
- 36.2% of children are adequately fed (Source: DHS 2008).
- 8.6% of non-pregnant women (aged 15-49) have a BMI <18.5 (Source: DHS 2008)
- 68% of households consuming safe food
- Baseline dietary diversity = 68%
Targets:
- 70% of children adequately fed.
- 5% of non-pregnant women (15 – 49) have BMI <18.5
- Household target: 78%- Dietary diversification score
target: 78%
Country Stat Ghana (FAO)
WFP Standard Project Report.
MoFA:
Coordination and facilitation
NGOs and Development partners (as above).
years)
Output 2.1: National nutrition policy is developed by 2013.
Indicators:
- Timeliness of completion of policy document.
- Validation of National Nutrition policy by Government.
Baseline:
- No policy at present (2010)Targets:
- Policy developed by 2013- Policy validated by 2016
Means of verification:
- Policy document exists.
Risks:
Insufficient commitment by stakeholders
Assumptions
- Government policy priorities do not change.
Role of partners:
Ministry of Health:
- Selection of consultants
- Development of terms of reference, and
- Provide guidance for the process.
Other donor partners
- Financial and technical
UNDAF Results Matrix: Option 2 (Outcomes and Outputs) – Nov 23
support- Inputs for draft policy
development
Media: To raise public awareness
Output 2.2: The current Food Security and Nutrition Monitoring System (FSNMS), as well as other data collection systems, are expanded to cover at least 5 regions in the country by 2016.
Indicators:
- Number of regions for which monthly FSNM bulletins are produced for partners
Baseline:
- Bulletins for 3 northern regions
Targets:
- Bulletins for at least 5 regions.
Means of Verification:
Availability of the monthly bulletins.
Risks
Disruption in the data collection.
High turnover of Government partners.
Assumptions
Commitment from stakeholders.
Continued funding by donors.
Role of partners
MoFA; Ghana Statistical Service (GSS); Ministry of Health (MoH):
Provide data from sentinel sites and communities.
Data validation for bulletin.
Savannah Agricultural Research Institute (SARI) :
GIS support; and data validation.
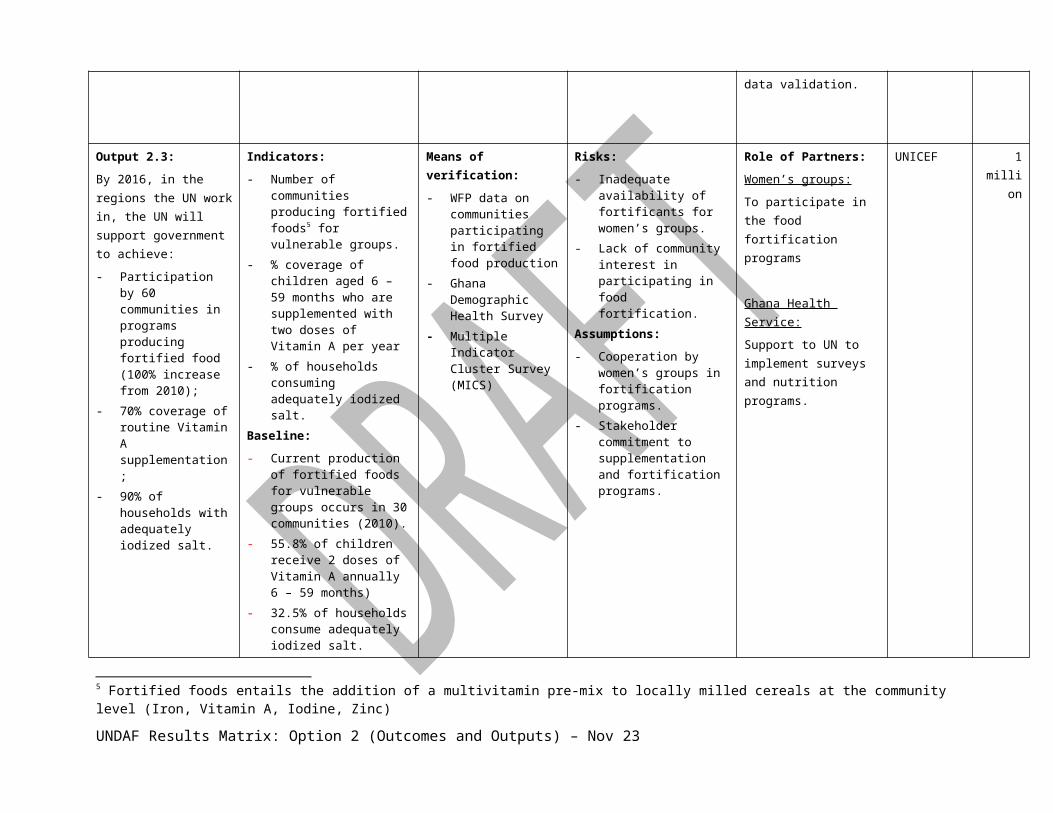
Output 2.3:
By 2016, in the regions the UN work in, the UN will support government to achieve:
- Participation by 60 communities in programs producing fortified food (100%
Indicators:
- Number of communities producing fortified foods5 for vulnerable groups.
- % coverage of children aged 6 – 59 months who are supplemented with two doses of Vitamin A per year
- % of households consuming adequately iodized salt.
Means of verification:
- WFP data on communities participating in fortified food production
- Ghana Demographic Health Survey
- Multiple Indicator Cluster Survey (MICS)
Risks:
- Inadequate availability of fortificants for women’s groups.
- Lack of community interest in participating in food fortification.
Assumptions:
- Cooperation by women’s
Role of Partners:
Women’s groups:
To participate in the food fortification programs
Ghana Health Service:
Support to UN to implement surveys and
UNICEF 1 million
5 Fortified foods entails the addition of a multivitamin pre-mix to locally milled cereals at the community level (Iron, Vitamin A, Iodine, Zinc)
UNDAF Results Matrix: Option 2 (Outcomes and Outputs) – Nov 23

increase from 2010);- 70% coverage of
routine Vitamin A supplementation;
- 90% of households with adequately iodized salt.
Baseline:
- Current production of fortified foods for vulnerable groups occurs in 30 communities (2010).
- 55.8% of children receive 2 doses of Vitamin A annually 6 – 59 months)
- 32.5% of households consume adequately iodized salt.
Targets:
- To increase production of fortified foods (by the UN) by 100% to 60 communities participating in production of fortified foods.
- To increase coverage of routine supplementation in children under 1 (of Vitamin A) to 70%
- 90% households to have iodized salt in their homes.
groups in fortification programs.
- Stakeholder commitment to supplementation and fortification programs.
nutrition programs.
Output 2.4:
In the targeted areas (the three northern regions), by 2016: there will be a 10% increase (50% will be women) in the number of food producers and processors that have access to knowledge and skills, to enhance production of fortified food and iodized salt.
Indicators:
- % increase in number. of women producers/processors of fortified products
- Number of people with knowledge and skills.
Baseline:- Survey of number of people
in the program to be done and provided by 2011.
- No of women in the program
Targets:
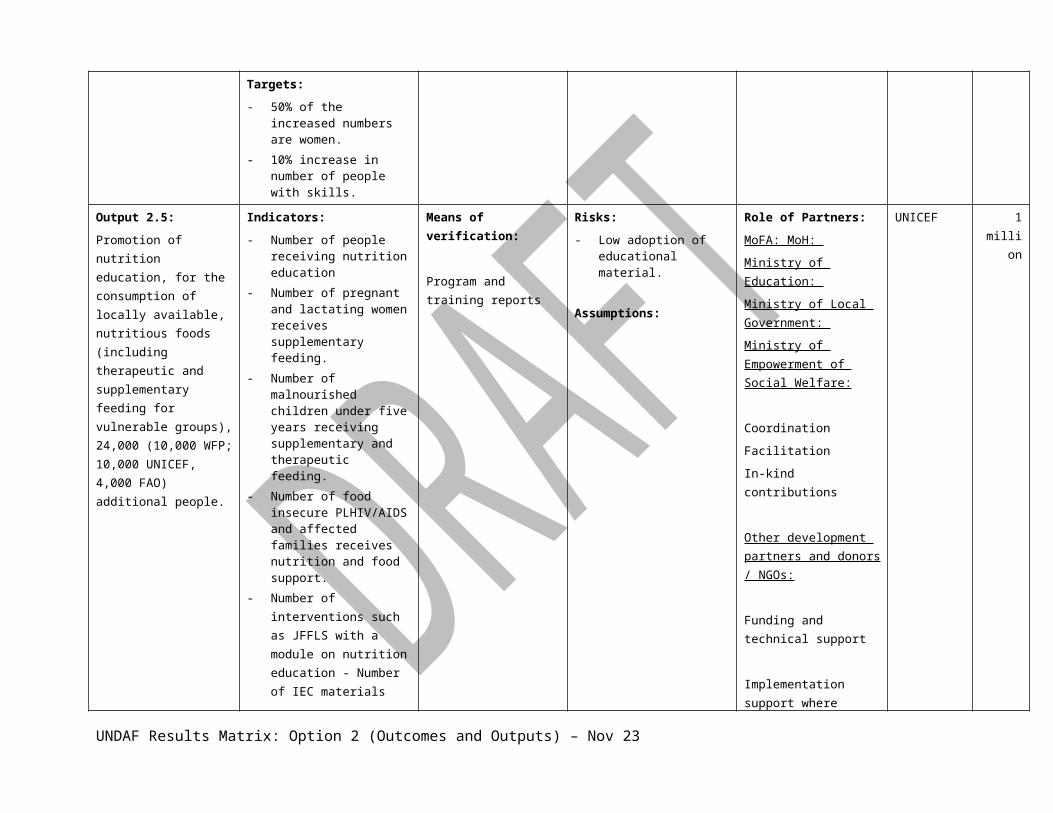
- 50% of the increased
Means of verification:
- WFP survey data on projects
Risks:
- Low levels of interest by communities
- Groups separating Assumptions:
- That a survey will be conducted to determine the current baseline numbers of people, and their gender.
- That the private sector will show interest in the program.
Role of Partners:
Private sector:
Provision of support for groups through finance and animation.
UNDAF Results Matrix: Option 2 (Outcomes and Outputs) – Nov 23

numbers are women.- 10% increase in number of
people with skills.
Output 2.5:
Promotion of nutrition education, for the consumption of locally available, nutritious foods (including therapeutic and supplementary feeding for vulnerable groups), 24,000 (10,000 WFP; 10,000 UNICEF, 4,000 FAO) additional people.
Indicators:
- Number of people receiving nutrition education
- Number of pregnant and lactating women receives supplementary feeding.
- Number of malnourished children under five years receiving supplementary and therapeutic feeding.
- Number of food insecure PLHIV/AIDS and affected families receives nutrition and food support.
- Number of interventions such as JFFLS with a module on nutrition education - Number of IEC materials
Baseline:
Number of people receiving nutrition education:
- 10,000 pregnant and lactating mothers receiving supplementary feeding (WFP).
- 36,000 children receiving supplementary feeding (WFP).
- Number of food insecure PLHIV/AIDS and families receiving nutrition and food support
- 2000 if children under therapeutic feeding?
Means of verification:
Program and training reports
Risks:
- Low adoption of educational material.
Assumptions:
Role of Partners:
MoFA: MoH:
Ministry of Education:
Ministry of Local Government:
Ministry of Empowerment of Social Welfare:
Coordination
Facilitation
In-kind contributions
Other development partners and donors / NGOs:
Funding and technical support
Implementation support where required.
UNICEF 1 million
UNDAF Results Matrix: Option 2 (Outcomes and Outputs) – Nov 23
(UNICEF).- Base line figure for JFFLS
(FAO) = 3000Targets:
- 10,000 pregnant and lactating mothers.
- 36,000 children for supplementary feeding.
- UNICEF: additional 10,000 children receiving supplementary feeding
- FAO target: 4,000 people for JFFLS (additional 1,000 from baseline)
Output 2.6:
Through the provision of technical training, tools, and resources the UN improves the capacity of service providers to deliver nutrition interventions, by 2016.
Indicators:
- Number of recipients of technical training sessions (knowledge)
- Resources committed to service providers ($)
- Number of service providers receiving tools.
Baselines:
Training:- WFP: 300 counterparts
trained - FAO:1500 counterparts
trained- UNICEF: 400 counterparts
trained.
Resources- WFP Resources: $300,000
USD. - UNICEF Resources: $200,000
USD- FAO Resources: $100,000
Means of verification:
Training reports (technical assistance)
Financial reports (resources)
Program reports (tools delivered)
Risks:
- Low levels of interest by service providers
- Service providers do not have sufficient human resources to implement technical training recommendations.
- Decrease in donor contributions for Ghana.
Assumptions:
Service providers are implementation partners
Role of Partners:
MoFA, MoH, Ministry of Education;
Coordination and facilitation
Private sector / food industry
Support in the implementation, including awareness.
International NGOs, Donors: Technical support
WFP
UNICEF:
500,000
1 million
UNDAF Results Matrix: Option 2 (Outcomes and Outputs) – Nov 23

USDService Providers Receiving Tools:- WFP: 1 (GHS)- FAO: 4 (GHS, Codex Contact
Point, SHEP Coordinators)- UNICEF: 1 (GHS) Targets:
Training:
- WFP: 500 counterparts trained
- UNICEF:1000- FAO: 2500 (1000 extra from
baseline of 1500)
Resource commitment:- WFP Resources: 500,000
$USD- FAO: 300,000 $USD- UNICEF: 400,000 $USD
Service providers receiving tools:- WFP: 2 (GHS and MOFA) - FAO: 2 - UNICEF:1 (GHS)
UNDAF Results Matrix: Option 2 (Outcomes and Outputs) – Nov 23
Thematic area 2: Sustainable environment, energy and human settlements
National Development Priority: SUSTAINABLE NATURAL RESOURCE MANAGEMENT ENERGY AND HUMAN SETTLEMENTS
- Climate variability and change - Biodiversity - Water Resources and Sanitation - Natural Disasters, Risks and Vulnerability - Urban Development and Management - Housing/Shelter - Slum Upgrading and Prevention
Support to MDGs: MDG 7
Outcomes
Indicators , Baseline, Target Means of Verification
Risks and Assumptions
Role of Partners Indicative Resources (US$)
UN agency US$
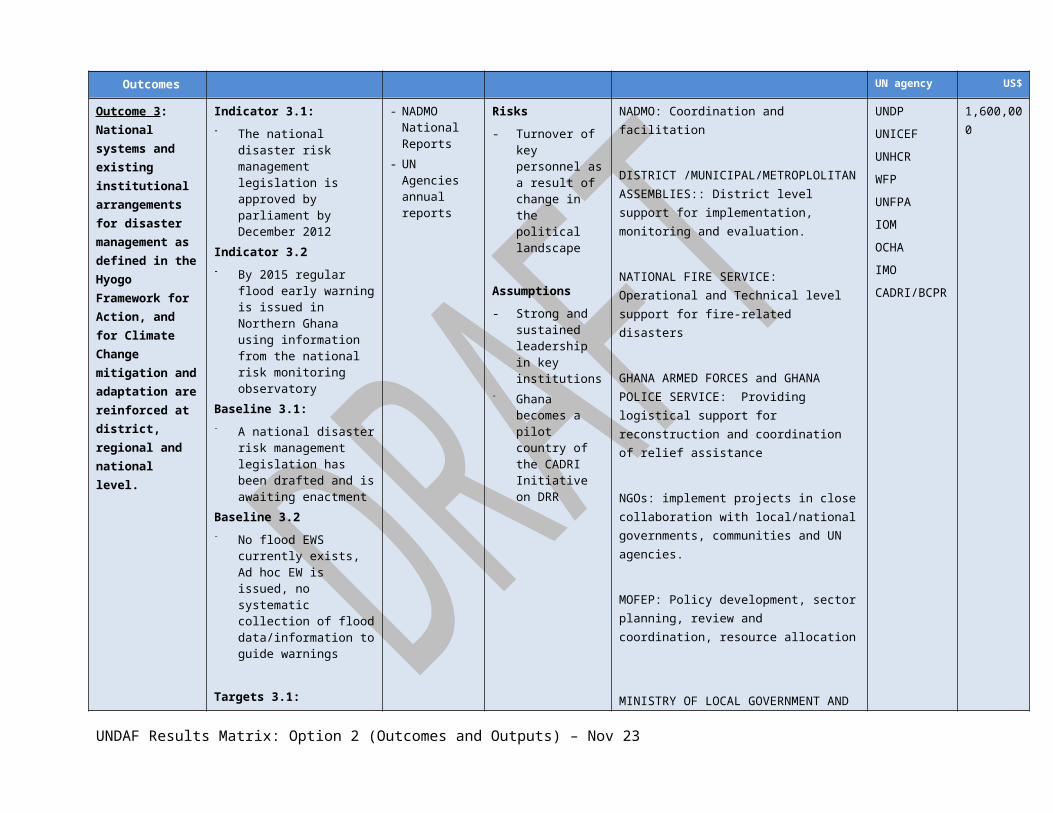
Outcome 3: National systems and existing institutional arrangements for disaster management as defined in the Hyogo Framework for Action, and for Climate Change mitigation and adaptation are reinforced at
Indicator 3.1:
- The national disaster risk management legislation is approved by parliament by December 2012
Indicator 3.2
- By 2015 regular flood early warning is issued in Northern Ghana using information from the national risk monitoring observatory
Baseline 3.1:
- NADMO National Reports
- UN Agencies annual reports
Risks
- Turnover of key personnel as a result of change in the political landscape
Assumptions
- Strong and sustained leadership in key institutions
- Ghana becomes a
NADMO: Coordination and facilitation
DISTRICT /MUNICIPAL/METROPLOLITAN ASSEMBLIES:: District level support for implementation, monitoring and evaluation.
NATIONAL FIRE SERVICE: Operational and Technical level support for fire-related disasters
GHANA ARMED FORCES and GHANA POLICE SERVICE: Providing logistical support for reconstruction and coordination of relief
UNDP
UNICEF
UNHCR
WFP
UNFPA
IOM
OCHA
IMO
CADRI/BCPR
1,600,000
UNDAF Results Matrix: Option 2 (Outcomes and Outputs) – Nov 23

district, regional and national level.
- A national disaster risk management legislation has been drafted and is awaiting enactment
Baseline 3.2
- No flood EWS currently exists, Ad hoc EW is issued, no systematic collection of flood data/information to guide warnings
Targets 3.1:
- By June 2011 a national technical review committee is established by NADMO to review and align the draft legislation to the constitution
- By December 2011, the report of the national technical review committee is validated through national consultations
- By December 2011 relevant Parliamentary bodies are trained in DRM
- By June 2012, the draft legislation is approved by Parliament
Targets 3.2
- By December 2011 a technical and information process for issuing flood warnings in Northern Ghana from national Observatory data is designed and approved by Government
- By December 2012 selected staff of NADMO, GMET and EPA are trained in the use
pilot country of the CADRI Initiative on DRR
assistance
NGOs: implement projects in close collaboration with local/national governments, communities and UN agencies.
MOFEP: Policy development, sector planning, review and coordination, resource allocation
MINISTRY OF LOCAL GOVERNMENT AND RURAL DEVELOPMENT: Policy development, sector planning, review and coordination.
EPA: Sector planning, review and coordination, resource allocation, institutional and system development, capacity development
UNDAF Results Matrix: Option 2 (Outcomes and Outputs) – Nov 23

of flood risk data for EWIndicator 3.3:
- The number of coordinating meetings held and the level of seniority represented
Indicator 3.4: - The speed with which early
warning signals are analyzed and translated into responsive actions.
- % increased in resources allocated to disaster risk management
- Baselines:-there are national risk and disaster management bodies in place (NADMO, Ministry of the Interior) with clear mandates
-The national strategy for disaster risk management has been formulated
-Institutions are challenged to design and implement speedy and accurate responses in disaster risk management
-Current budget allocated to DRM
Targets:
- Ministry of the Interior, NADMO, MMDAs, NPC, UNCT, Parliament, the disaster risks prone communities in the Northern Ghana and lower Volta basin- xxx Coordination meetings- xxx Timely responses to disaster situations
UNDAF Results Matrix: Option 2 (Outcomes and Outputs) – Nov 23

Output 3.1: National policies and strategies on Disaster Risk Reduction, with emphasis on budget allocation to disaster prone districts, are in place and operationalized by 2014.
Indicators:
By 2014, the percentage of district assemblies funds in 50 disaster prone areas allocated for DRR activities increase to 5% of total district budget
Baseline:
- No national policy on Disaster management
Targets:
- 5% of District Annual Budget allocated towards DRR in Number of Districts in disaster prone areas.
- Budgetary allocation data from MOFEP
- District level financial accounts and reports
Risks
- District Assembly may not comply with the NADMO Bill stipulation of 5% budget allocation towards DRR.
Assumptions
- NADMO Bill is passed
NADMO: Lead national institution for Coordination/ facilitation; monitoring and evaluation; , institutional and system development, expansion and mainstreaming of DRR , advocacy, capacity development
MOFEP: Policy development, sector planning, review and coordination, resource allocation
MINISTRY OF LOCAL GOVERNMENTAND RURAL DEVELOPMENT: Policy development, sector planning, review and coordination.
: Operational planning, technical supervision and support, monitoring and evaluation, coordination and facilitation, capacity development
UNFPA
UNDP 300,000
Output 3.2:
A national risk monitoring observatory is established for providing early warning information by 2016.
Indicators:
- Establishment of data base on multisectoral indicators on disasters at GMET
Baseline:
- National risk monitoring observatory is not available
Targets:
- Data base on multisectoral indicators on disasters developed
- Fully functional national risk monitoring observatory established
- Existence of the national risk monitoring observatory
Risks
- Availability of funds
Assumptions
- Other agencies strengthen the other components of early warning systems
- Ghana becomes pilot country of the CADRI/BCPR Initiative on DRR
GMET: use outcomes of studies and analysis reports to prepare policies and plans
NADMO: Lead national institution for Coordination/ facilitation; monitoring and evaluation, institutional and system development, expansion and mainstreaming of DRR , advocacy, capacity development
EPA: Sector planning, review and coordination, resource allocation, institutional and system development, capacity development
UNDP
CADRI 700,000
UNDAF Results Matrix: Option 2 (Outcomes and Outputs) – Nov 23

Output 3.3:
A national strategy to raise public awareness on disaster risk reduction in primary and secondary schools and for improving building safety and protection of critical facilities is in place by 2013.
Indicators:
- Existence of National Strategy
- Number of schools in the 4 Metropolitan Assemblies integrating DRR into school curricula
- % of critical facilities in the 4 Metropolitan Assemblies constructed according to building codes with appropriate hazard-resistant features
Baseline:
- National Disaster Management Strategy in place
Targets:
- National Strategy in Place- 50 schools in the 4
Metropolitan Assemblies have integrated DRR into school curricula
- 100% of critical facilities in the 4 Metropolitan Assemblies constructed according to building codes with appropriate hazard-resistant features
- National Strategy document produced by NADMO
- School curricula of the 4 Metropolitan Assemblies
- Building permits and minutes of planning committees of Metropolitan Assemblies
- Surveys to verify the respect of building rules on DRR
Risks
- Overloaded school curricula
- Not enforcement of building rules and regulations
Assumptions
- A wider strategy for general public is developed and being implemented
- Existence of a National Building Code incorporating DRR
NADMO: Lead national institution for Coordination/ facilitation; monitoring and evaluation, institutional and system development, expansion and mainstreaming of DRR , advocacy, capacity development
DISTRICT /MUNICIPAL/METROPLOLITAN ASSEMBLIES: Operational planning, technical supervision and support, monitoring and evaluation, coordination and facilitation, capacity development
MINISTRY OF LOCAL GOVERNMENT: Policy development, sector planning, review and coordination,
MINISTRY OF EDUCATION: Policy development, sector planning, review and coordination, resource allocation, institutional and system development, effective service provision models, advocacy, capacity development
UNDP 300,000
Output 3.4:
The institutional capacities (assessment, coordination and information management) of NADMO and other MDAs are reinforced for
Indicators:
- NADMO simulates the contingency plans for flood, earthquakes, oil spillage and pandemics at least once annually by 2016
- % of population affected by disaster reached by NADMO, MDAs and UN agencies within the timeframes specified in the
- Documentation (reports, audiovisuals, attendance sheets)of the joint simulation exercises
- NADMO Situational Reports
Risks
- Staff turnoverAssumptions
- Staff to be trained is readily available
- Effective coordination and communication among NADMO, MDAs and UN is
NADMO: Lead national institution for Coordination/ facilitation; monitoring and evaluation, institutional and system development, expansion and mainstreaming of DRR , advocacy, capacity development.
MINISTRY OF INTERIOR: Policy development, sector planning, review and coordination
UNFPA
WFP
UNDP 300,000
UNDAF Results Matrix: Option 2 (Outcomes and Outputs) – Nov 23
preparedness and response to man-made and natural disasters
National Contingency Plan- Number of people affected
by natural/man-made disasters receiving relief items
Baseline:
- NADMO, national and regional platforms on DRR, Contingency Plans and National Disaster Management Policy are in place
- UN Interagency Contingency Plan is in place
- Monthly production EW information
.
Targets:
- 8 joint simulation exercises conducted
- 70% of the population affected by disaster reached by NADMO, MDAs and UN Agencies within the timeframes specified in the National Contingency Plan
- 100% of people severely affected by disaster receiving emergency assistance
- UN SITREPS in place. MEST: Policy development, sector planning, review and coordination
MINISTRY OF TRANSPORT: Policy development, sector planning, review and coordination
MOH – Ghana Health Service: Implementation , coordination ,policy and strategic support for health- related disaster
EPA: Sector planning, review and coordination, resource allocation, institutional and system development, capacity development
GHANA ARMED FORCES AND GHANA POLICE SERVICE: Providing logistical support for reconstruction and coordination of relief assistance.
NATIONAL FIRE SERVICE: Operational and Technical level support for fire-related disasters
NGOs: Implementation of projects in close collaboration with local/national governments, communities and UN agencies
Output 3.5 Capacity of the National Climate Change Committee for policy development, participation in international negotiations,
Indicators:
- Number of climate change policies developed.
- Number of international negotiation meetings attended by national counterpart.
- Two capacity building reports for national climate
- Climate change policy documents
- Briefs on attending international negotiations
- Papers and presentations
Risks
- Changes in political leadership
- Capacity dissipation due to turn-over of NCC members
MEST: Policy development, sector planning, review and coordination
EPA: Sector planning, review and coordination, resource allocation, institutional and system development, capacity development
UNDP 200,000
UNDAF Results Matrix: Option 2 (Outcomes and Outputs) – Nov 23

coordination and harmonization of sectoral strategies on climate change strengthened by 2016
change committee members each year
Baseline:
- National Climate Change Committee established.
- Coordination of national climate change strategies remains weak and disjointed.
- Participation of national climate committee in international negotiations is limited
Targets:
- 4 climate change policies developed
- 3 international meetings attended per year
- 2 capacity building supports for national climate change member supported per year.
made at international meetings
Assumptions
- Continued support from political leadership
- NCC members available to receive to attend international negotiations
NDPC: Coordination and capacity development
MOH: Coordination the integration of climate change and Health into sectoral programmes/plans
MINISTRY OF ENERGY: Coordination of energy-intensive services into climate change programmes/ plans
NATIONAL CLIMATE CHANGE COMMITTEE: Reviews of national climate change policies including coordination of sectoral climate change programmes
Output 3.6 Mainstreaming of climate change mitigation and adaptation into relevant sectors and 80 district plans enhanced by 2014.
Indicators:
- Number of climate resilient plans developed and implemented each year.
- Number of capacity development programmes established operationalorganised
- Number of demonstration climate-smart projects
- Schemes for flood protection walls, reforestation, tree planting, dug out dams, rehabilitation of assets
- Climate smart-plans
- Reports on supported capacity development programmes
- Proposal on climate-smart demonstration projects
- Financial budget for demonstration
Risks
- Turnover rate of staff
- Regular flow of funds
- Limited technical capacity
- Changes in political or technical leadership
- Lack of capacity for scaling up
- Potential conflicts with other sector
MEST: Policy development, sector planning, review and coordination
EPA: Sector planning, review and coordination, resource allocation, institutional and system development, capacity development
NDPC: Coordination and capacity development
MOH: Coordination the integration of climate change and Health into sectoral programmes/plans
WFP
UNDP 400,000
UNDAF Results Matrix: Option 2 (Outcomes and Outputs) – Nov 23
damaged/affected by climate change through food for work in the 3 northern regions
- Number of water conservation projects developed through food for work in the 3 northern regions
Baseline:
- Mainstreaming of climate change into national, sector and district plan in 10 pilot districts.
- Preparation of national climate change adaptation strategy
- Development of sector-specific mitigation assessment
- List of Nationally Appropriated Mitigation Actions developed
- Preparation of low carbon development growth plan
- Greenhouse gas inventory estimates developed,
Targets:
- 20 climate-smart plans developed for relevant sectors and district assemblies each year.
- Two capacity development programmes on climate compatible planning organised for twenty relevant MDAs and districts assemblies supported.
projects or district programmes
Assumptions
- Buy-in from political leadership
- Build on existing related-initiatives
- Staff will be available for training
- Environmental governance in Ghana remains consistent
- Local private financial entities will be on-board
MINISTRY OF ENERGY: Coordination of energy-intensive services into climate change programmes/ plans
FORESTRY COMMISSION: Sector planning, review and coordination, resource allocation, institutional and system development, capacity development
MINISTRY OF AGRICULTURE; Sector planning, review and coordination, resource allocation, institutional and system development, capacity development
DISTRICT/MUNICIPAL/METROPOLITAN ASSEMBLIES: Operational planning, technical supervision and support, monitoring and evaluation, coordination and facilitation, capacity development
UNDAF Results Matrix: Option 2 (Outcomes and Outputs) – Nov 23

- Support development and implementation of five climate-smart demonstration projects in five districts.
- 1 rural climate-enterprise incubator hub developed and established.
Output 3.7 The capacity of the Ministry of Finance and Economic Planning (MOFEP) and private sector (like banks and industries) to mobilize and access international funds on climate change mitigation and adaptation developed by 2013.
Indicators:
- Number of implemented capacity development programmes.
- Number of MoFEP and private sector staff supported to attend international climate financing events each year.
- No of CDM projects approved
- National budget guidelines on accessing international funding for climate change adaptation developed
Baseline:
- Limited capacity of MoFEP and private sector to access international funds.
- Knowledge of MoFEP and private sector on the nuances of international climate financing is limited
- Budget guidelines for climate change under preparation
Targets:
- Capacity development reports
- Number of staff attended international climate financing events and their reports
- Budget request for MoFEP
Risks
- Changes in political leadership
- High turnover of trained staff
Assumptions
- Availability of staff to be trained.
- Support from political leadership
- Buy in from private sector
MOFEP: Policy development, sector planning, review and coordination, resource allocation
MEST: Policy development, sector planning, review and coordination
EPA: Policy development, sector planning, review and coordination
PRIVATE SECTOR: Project development, implementation and provision of financial incentives
UNDP 200,000
UNDAF Results Matrix: Option 2 (Outcomes and Outputs) – Nov 23

- Three round capacity development programmes for MoFEP and private sector in climate financing supported.
- Two staff from MoFEP and private sector supported to partake in international climate financing events.
- Provide technical and financial MoFEP to establish or reorient institutional set-up dedicated to facilitate access to new streams of climate financing.
Output 3.8 Biodiversity and land management issues, with a special focus on marine ecosystems and afforestation, assessed and integrated at the national and local level
Indicators:
- No. of people benefiting from climate adaptation and mitigation (afforestation, water conservation)
- degree of integration of EIA and Sea into district development plans
- deforestation rates
- land degradation rates
- ecological integrity of coastal lagoons
- National budget expenditure on Environment and natural resource sector
Baselines:
- 90,00 people benefiting from afforestaion activities
- District level plans
- Remote sensing/forest surveys
- remote sensing/ground surveys
- Assessment reports using RAMSAR Ecological Character Criteria
- National
- District Assemblies have capacity to deliver
- Political will to enforce measures to stop illegal logging
- Political will to enforce measures to stop land degradation
- Change in attitudes and behavior in the of management plastic bags and waste
EPA: Policy development, sector planning, review and coordination
DISTRICT/MUNICIPAL/METROPOLITAN ASSEMBLIES: Operational planning, technical supervision and support, monitoring and evaluation, coordination and facilitation, capacity development
MMDAs: Policy development, sector planning, implementation, review and coordination
ACADEMIA: Research, review of reports, and training
WFP
UNDP 250,000
UNDAF Results Matrix: Option 2 (Outcomes and Outputs) – Nov 23

- Deforestation rate 65,000 ha/yr
- 69% of the total land surface of Ghana prone to severe or very severe soil erosion
- Up to 7kg of Beach litter (Marine Debris) mainly plastics per 100m2
- National Budget Expenditure on the Environment and Natural Resource sector under 0.5%
Targets:
- 50 district development plans fully integrating SEA prepared by 2014
- Deforestation rates to decrease by 30% by 2014
- Land Degradation rates to decrease by 15% by 2014
- 50% reduction of Beach litter by 2012
- Expenditure on Environment and Natural Resources sector increased to 1% of Budget
Budget figures
- Political will to commit funds to the Environment and Natural Resources sector
Outcomes Indicators , Baseline, Target Means of Verification
Risks and Assumptions Role of Partners Indicative Resources (US$)
UN agency US$
UNDAF Results Matrix: Option 2 (Outcomes and Outputs) – Nov 23

Outcome 4: Low Income/Slum and Disaster Prone Communities including women have improved livelihoods through better access to affordable and sustainable housing, skills training, and participatory urban planning and management.
Indicators:
- Upgraded slum communities and reduced incidences of new slum communities
- New sustainable buildings developed to replace existing buildings of poor technology and materials
- People with increased access Livelihood opportunities
Baseline:
- Communities have at least 10% housing destruction by heavy rains due to poor building technology
- Very low income generating and economic development activities in communities
- Non existent low-income housing finance systems
Targets:
- A low-income housing fund established and fully functioning with easy and efficient accessibility to low-income earners, especially the urban poor
- Community trained and assisted to develop and implement better layouts
- All buildings in community redeveloped using sustainable technologies, upon training
- % change in growth and extent of upgrading of slums existing slums and the number of newly formed ones
- number /% increase of replaced buildings in disaster prone communities
- number of people/groups/communities with increased access to Livelihood opportunities.
Risks
- Change in sector MMDAs as a result of change in government.
Assumptions
- GoG will include related programs in national and local level programming and budgets
- Communities will provide the necessary support to ensure the projects’ success
- The current political will for Housing is sustained
- Institutional changes and reorganisation will not affect the housing sector
- GoG (National and local levels) to monitor project implementation to ensure its success and also provide financial and material support to communities as necessary
- NGO/CBOs to implement projects in close collaboration with local/national governments, communities and UN agencies.
UN-HABITAT
UNDP
UNHCR
IOM
UNIFEM
WFP
IMO
1,6 mio p.a.
1.4mio p.a.
200,000 p.a.
400,000 p.a.
200,000 p.a.
200,000 p.a.
UNDAF Results Matrix: Option 2 (Outcomes and Outputs) – Nov 23

Output 4.1: Urban Development and National Housing Policies, together with National Housing Strategic Plan published and widely disseminated by 2014
Indicators:
- Policy reviewed and approved by cabinet.
- National housing policy published
- National housing policy disseminated
Baseline:
-Non-existence of a comprehensive housing policy
Targets:
State and non-state actors use policy document
Indicators:
-Housing strategic plan approved by cabinet
-Housing Strategic plan published and disseminated.
-Public sensitized on National Housing Strategic Plan
Baseline: Non-existence of housing strategic plan
Target: National housing strategic plan in place
Indicators:
- Urban Policy formulated and approved by cabinet.
- National urban policy published
- National urban policy disseminated with the urban development sector and
-National housing Policy
-Sector Plans
-Medium term development plans
-NDPC guidelines for MMDAs
- Housing strategic plan
- Public knowledge on housing strategic plan-National Urban Policy
-Sector Plans
-Medium term development plans
-NDPC guidelines for MMDAs
Risks
- Delay in cabinet approval
Assumptions
- State and non-state actors to use document
- Government’s approval for draft policy.
-Government budget
Assumption
-Ministry of Water Resources works and housing to comply with housing strategic plan.
-Annual government budget allocation for implementation
-Capacity of housing directorate staff to lead implementation.
State and non-state actors use urban development policyGovernment’s approval for draft urban development policy.
- Housing Directorate of the Ministry of Water Resources Works and Housing leads the policy review and dissemination processes.
- Slum dwellers, the Coalition of NGOs and individual CSOs in human settlements participate in the review process
- National, Regional and district level sector MDAs are involved in organising and participating in stakeholder consultations.
-Sector DPs and NGOs provide financial and technical support
- Slum dwellers, the Coalition of NGOs and individual CSOs in human settlements participate in the national housing strategic plan development process
- National, Regional and district level sector MDAs are involved in organising and participating in stakeholder consultations
Urban Development unit leads the policy formulation and dissemination processes.
-Government (Ministry of Local Government and Rural Development to budget annually for the Urban Development Unit.
-Sector DPs to provide financial and technical assistance to Urban Development Unit.
- National, Regional and district level sector MDAs are involved in organising and participating in stakeholder consultations
-Urban poor groups to participate in the policy formulation process.
UN-HABITAT
UNDP
UNIFEM
UNDAF Results Matrix: Option 2 (Outcomes and Outputs) – Nov 23

outside the sector
Baseline:
-Non-existence of a comprehensive urban policy
Targets:
State and non-state actors use policy document
UNDAF Results Matrix: Option 2 (Outcomes and Outputs) – Nov 23

Output 4.2 Knowledge and skills for effective housing delivery, the use of sustainable low cost/local building materials and technology, as well as low cost housing financing opportunities generated.
Indicators: staff receiving training- Policy monitoring tools
developed and used.- Program monitoring tools
developed and used.- Monitoring reports produced
-Baseline: inadequate knowledge and skills of housing directorate staff
-Targets:Housing directorate staff have improved knowledge and skills in policy and program monitoring for effective housing delivery
Indicators:
- target groups and communities trained in the building processes using locally available building materials and improved building technology
-individuals trained
- artisans trained in applying improved building material and technology
- Households replacing their current ramshackle houses, with low cost sustainable building materials.
-communities using low cost sustainable building materials
Baseline:
Lack of knowledge and skills in the use of Low cost/Local sustainable
- No of staff receiving training
- Policy monitoring reports
- Program monitoring reports
- no of communities using low cost sustainable building materials
- No of households using low cost sustainable building materials.
- Number of artisans trained in applying
- no of target groups trained
- number of housing financial institutions engaged
- number low income housing products developed
- number of low
Assumption.
-Housing directorate staff will not be transferred to other ministries or department
Assumption
-Willingness of communities to use low cost/local sustainable building materials and technology.
Assumption
-Willingness of housing financial institutions to develop low income housing products.
-Sector DPs and NGOs provide financial and technical support
- Government (Ministry of Water Resources Works and Housing )budgets annually for the housing directorate
- Government (MMDAs) to budget annually to support households with some building equipment and materials and monitoring of projects
- Households and communities to provide labour Partner Sector
- NGOs, through relevant Project Cooperation Agreements implement activities partnership with Government and UN agencies
Sector DPs to provide financial and technical assistance to promote initiatives.
-National, Regional and District MDAs plan and implement field monitoring activities and hold review meetings
- Government (Ministry of Water Resources, Works and Housing) to promote and support the establishment of a sustainable low-income housing fund/products
- Private sector (housing financial institutions) to collaborate with government, DPs and UN agencies.
- Government to budget for low income housing
UN-HABITAT
UNDP
UNIFEM
IOM
UNHCR
UNDAF Results Matrix: Option 2 (Outcomes and Outputs) – Nov 23

Output 4.3: Human Settlements policy developed and implemented for refugees, asylum seekers and other minority migrant population by 2015
Indicators:
- Policy formulated and approved by cabinet.
- Human settlements policy published
- Human settlements policy disseminated
Baseline:
-Non-existence of a human settlements policy
Targets:
- State and non-state actors use policy document
- Human Settlements policy.
- NDPC guidelines
- Sector plans- Medium
Term development plans
-
- State and non-state actors to use document
- Government’s approval for draft policy.
- Government to lead the Human Settlements Policy process.
UNHCR
Outcomes Indicators , Baseline, Target Means of Risks and Role of Partners Indicative Resources (US$)
UNDAF Results Matrix: Option 2 (Outcomes and Outputs) – Nov 23

Verification Assumptions UN agency US$
Outcome 5: An additional 2.5% of the population have sustainable use of improved drinking water and sanitation services and practice the three key hygiene behaviors by 2016
Indicators:
- % increase in target population aware of the 3 behaviors
- % of Population practicing HWWS
- % of Population Open defecation Free (ODF)
- % of Population practicing household water treatment and safe storage
- % of people with using improved sanitation facilities
- % of schools with improved sanitation and water facilities
- % of people using improved drinking water sources
Baseline:
- As few as 4% of mothers engaged in HWWS after defecation, and only 2% after cleaning a child’s bottom (Scott et al., 2007).
- About 43% of mothers or caregivers washed their hands with soap after defecation, 18.3% before eating, 10.9% before feeding the child, 7.4% before preparing food and 2% after cleaning child’s buttocks.
- Sanitation (Total): 13%- Schools: Unknown: - Water (Total): 82%Targets:
- Additional 2.5 million
- NDHS- MICS- CWSA annual
reports- EHSD progress
reports- Sector annual
reports- Country Status
Overviews- Global Annual
Assessment of Sanitation and Drinking Water (GLAAS) Reports
Risks
- Cultural barriers may militate against the expected rate of positive behaviour adoption by communities towards hygiene and sanitation
- The SWA Compact is not fully implemented
- The absorptive capacity of MDAs and MMDAs remains low
- The next government does not prioritise sanitation
- Uneven application of community-led approaches to total sanitation resulting in considerable inertia to improved sanitation technology uptake
- Flooding continue to be an annual event resulting in diversion of programming capacity
Assumptions
- GOG have the commitment and provide adequate resources to
- The Government of Ghana will lead the initiative on water and sanitation service delivery and hygiene behaviour change through the Environmental Health and Sanitation Directorate and the Community Water and sanitation Agency.
- Development partners such as USAID, DANIDA and the World Bank will provide financial and technical assistance to promote the initiative. Local NGOs and CBOS/ FBOs will promote sanitation and hygiene behaviour and social change initiatives at the community level.
- Partner Sector NGOs, through relevant Project Cooperation Agreements (PCAs) implement activities partnership with Government and UN agencies
UNICEF
UN Habitat
36,000,000
UNDAF Results Matrix: Option 2 (Outcomes and Outputs) – Nov 23
people practice three key hygiene behaviours by 2016
- A 2.5% increase in hand washing with soap and safe excreta disposal by 2016
- Sanitation (Total): > 16%- Schools: 15%- Water (Total): > 84.5%
Sanitation and Water priorities.
- GoG fulfils its commitments for improved sanitation and drinking water
- The decentralisation process will result in consolidated MMDA structures with clear focus on well coordinated sanitation service delivery
- Communities and Households respond to non-subsidy triggering mechanisms to stop open defecation practices
- Cultural barriers do not millitate against the expected rate of adoption by communities of improved sanitation facilities
Output 5.1: ( Enabling Environment) Sector institutions at national, regional and district levels are better able to plan, implement, coordinate, monitor, evaluate and report on
Indicators:
- Sector Strategic Plans for sanitation and water in Place
- Sector coordination arrangement at all levels
- Sector MIS delivering periodic data and annual reports
- Disseminated SSDP
- Periodic Sector reports
- Sector annual reports
- Country Status Overviews
- Global Annual
Risks
- The current tendency for the decoupling of the water and sanitation sector is not sufficiently resolved and clarified
- The Government of Ghana through the sector MDAs leads and coordinates the development of an enabling environment for decentralised and sustainable pro-poor services within the context of evolving SWAP process
- Development Partners (DPs) provide technical and financial support and continue align with government systems and to harmonise their approaches
UNICEF
UN Habitat
UNV
WHO
4,000,000
UNDAF Results Matrix: Option 2 (Outcomes and Outputs) – Nov 23

sustainable Sanitation and Water services by 2016
- Poor urban areas mapped in other regional capitals as done in Accra by PURC
Baseline:
- No Strategic Plans- National level coordination
system- District Monitoring and
Evaluation SystemTargets:
- Sector Strategic Development Plan Operational
- Regional and District level coordination in place
- Fully effective Sector MIS- Kumasi, Sekondi-Takoradi
and Tamale mapped by 2013
Assessment of Sanitation and Drinking Water (GLAAS) Reports
- Mapping reports
- A change in government results in major changes affecting existing sector MDAs
Assumptions
- Institutional reorganisation and changes in mandate will not affect the SWA sector
- Sector MDAs and MMDAs and their concerned departments have adequate resources, capacity and commitment to carry out their duties and responsibilities in an effective and efficient manner and will receive adequate government funding for staff and operational costs
- The current level of political support for Sanitation and Water is sustained
- Ministry of Water Resources Works Housing will take the initiative on mapping of poor urban areas with PURC
- Non-governmental organisations be involved in the implementation of activities through project cooperation agreements
UNDAF Results Matrix: Option 2 (Outcomes and Outputs) – Nov 23

Output 5.2: An additional 2.5% of population adopt improved hygiene practices of hand washing with soap, safe excreta disposal and household water treatment and safe storage by 2016
Indicators:
- % increase in target population aware of the 3 behaviours
- % of Population practicing HWWS
- % of Population Open defecation Free (ODF)
- % of Population practicing household water treatment and safe storage
Baseline:
- As few as 4% of mothers engaged in HWWS after defecation, and only 2% after cleaning a child’s bottom (Scott et al., 2007).
- About 43% of mothers or caregivers washed their hands with soap after defecation, 18.3% before eating, 10.9% before feeding the child, 7.4% before preparing food and 2% after cleaning child’s buttocks.
Targets:
- Additional 0.5 million people practice three key hygiene behaviours by 2016
- A 2.5% increase in hand washing with soap and safe excreta disposal by 2016
- NDHS- MICS- CWSA annual
reports- EHSD progress
reports- Sector annual
reports- Country Status
Overviews- Global Annual
Assessment of Sanitation and Drinking Water (GLAAS) Reports
Risks
- Cultural barriers may militate against the expected rate of positive behaviour adoption by communities towards hygiene and sanitation
Assumptions
- GOG have the commitment and provide adequate resources to SWA priorities.
- The Government of Ghana will lead the initiative on hygiene behaviour change through the Environmental Health and Sanitation Directorate and the Community Water and sanitation Agency.
- Development partners such as USAID, DANIDA and the World Bank will provide financial and technical assistance to promote the initiative. Local NGOs and CBOS/ FBOs will promote hygiene behaviour and social change initiatives at the community level.
- Partner Sector NGOs, through relevant Project Cooperation Agreements (PCAs) implement activities partnership with Government and UN agencies
UNICEF
UN Habitat
5,000,000
Output 5.3: Water and Sanitation Services An additional 2.5% of the population sustainably use improved drinking
Indicators:
- % of people with using improved sanitation facilities
- % of schools with
- NDHS- MICS- CWSA annual
reports- WHO/UNICEF JMP
Risks
- The SWA Compact is not fully implemented
- The absorptive
- EHSD leads the implementation of improved sanitation Initiatives with CWSA support.
- CWSA leads the implementation of the improved drinking water supply component with support of the EHSD.
UNICEF
UN Habitat
25,000,000
UNDAF Results Matrix: Option 2 (Outcomes and Outputs) – Nov 23

water and sanitation facilities by 2016
Contributing UN agencies: UNICEF, UN Habitat, WHO
improved sanitation and water facilities
- % of people using improved drinking water sources
Baseline:
- Sanitation (Total): 13%- Schools: Unknown: - Water (Total): 82%Targets:
- Sanitation (Total): > 16%- Schools: 15%- Water (Total): > 84.5%
progress reports- EHSD progress
reports- Sector annual
reports- Country Status
Overviews- Global Annual
Assessment of Sanitation and Drinking Water (GLAAS) Reports
capacity of MDAs and MMDAs remains low
- The next government does not prioritise sanitation
- Uneven application of community-led approaches to total sanitation resulting in considerable inertia to improved sanitation technology uptake
- Flooding continue to be an annual event resulting in diversion of programming capacity
Assumptions
- GoG fulfils its commitment for improved sanitation and drinking water
- The decentralisation process will result in consolidated MMDA structures with clear focus on well coordinated sanitation service delivery
- Communities and Households respond to non-subsidy triggering mechanisms to stop open
- Water Resources Commission leads the implementation of the Climate Change component
- Development partners offer financial and technical assistance
- MMDAs own the initiative and implement, monitor and evaluate the initiative using the Assembly structures
- Private sector engages in sanitation marketing
UNV
UNDAF Results Matrix: Option 2 (Outcomes and Outputs) – Nov 23

defecation practices
- Cultural barriers do not militate against the expected rate of adoption by communities of improved sanitation facilities
UNDAF Results Matrix: Option 2 (Outcomes and Outputs) – Nov 23

Thematic area 3: Human development and productive capacity for improved social service
National Development Priority: HUMAN DEVELOPMENT, PRODUCTIVITY AND EMPLOYMENT - Bridging equity gaps in access to health care and nutrition services - Human Resources Development for the Health Sector - Improving governance and strengthen efficiency in health service delivery - Improving access to quality Maternal and Child Health Services - Intensifying prevention and control of non-communicable and communicable diseases - HIV AND AIDS/STI/TB - Increasing Equitable Access to and Participation in Quality Education - Bridging the Gender Gap in Access to Education - Improving the Management of Education Service Delivery - Integrating essential knowledge and life skills into school curriculum - Social Protection and the review of the national social protection framework
Linkage to MDGs: All MDGsOutcomes Indicators , Baseline, Target Means of Verification Risks and Assumptions Role of Partners Indicative Resources (US$)
UN agency US$
Outcome 6: Women and children have improved and equitable access to and utilization of quality, high impact maternal, neonatal and child health and nutrition interventions
Contributing UN agencies: xx
Indicators:
- i. Proportion of children under 1year vaccinated against measles
- ii. Proportion of births attended by skilled health personnel
- iii. Prevalence of underweight in children under 5 years
- Xx Proportion of obstetric complications managed within EmONC facilities among the total number of intended births.
- Successful implementation of the MDG Acceleration
- DHS 2008- DHS 2013- MICS 2013- GHS Annual
reports - CHAG Annual
report
Risks
- Weak inter-sectoral collaboration. Xx
- Xx
Assumptions
- Optimal harmonisation of UN assistance to GoG
- - Xx
- MoH- MLGRD- MESW- MOWAC- MoI- MoE- MoCC- GAC- CSOs/FBOs - Bilaterals - Multilaterals - Xx- Xx
UNDAF Results Matrix: Option 2 (Outcomes and Outputs) – Nov 23

Framework (MAF)Baseline:
--- 2011 MICS- Xx
Targets:
- Xx
Output 6.1 Strengthened capacity of healthcare providers in at least four most deprived regionsto deliver comprehensive MNCH, PMTCT and ASRH interventions by 2016.
Indicators:
- 1. % of targeted health workers trained to deliver comprehensive MNCH, PMTCT and ASRH 2. Proportion of health facilities providing integrated PMTCT services
- 3. Proportion of health facilities equipped as planned
- Proportion of facilities providing YFS
Baseline: 2.1 - 33%
- XxTargets:
- 2.1 – 90%
- GHS Annual reports- Programme specific
annual reviews- CHAG Annual report-
Risks
- Inadequate numbers inequitable distribution of Service providers
- Verticalisation (sub optimal integration) of programmes and services
Assumptions
- Xx
- Xx- Xx
Output 6.2 Coverage of High impact MNCH and nutrition interventions scaled up at facility and community levels
Indicators:
- 1. Proportion of children who receive appropriate treatment for malaria, diarrhea and pneumonia
- 2. Proportion of children 6-59 months who received vitamin A in the last 6 months
- Risks
- XxAssumptions
- Xx
- Xx- Xx
UNDAF Results Matrix: Option 2 (Outcomes and Outputs) – Nov 23

1. Proportion of Children 6-59 months receiving therapeutic feeding at facility level and supplementary feeding at community level
2. Proportion of pregnant women that received 4 ANC according to the norms among the total of intended pregnant women
-Baseline:
- XxTargets:
- Xx
Output 6.3 Increased awareness, demand for and utilization of high impact MNCH and nutrition interventions among all segments of population including men
Indicators: 1. EBF rate
2. % of children under 5 years sleeping under bed nets
3. Proportion of women receiving the prescribed number of post natal visits
4. Proportion of pregnant women receiving health and nutrition education.
5. Proportion of men who accompany their wives to health facilities and received information on MNCH and Nutrition education.
- DHS 2008- DHS 201
Risks
- XxAssumptions
- Xx
- Xx- Xx
UNDAF Results Matrix: Option 2 (Outcomes and Outputs) – Nov 23

- Xx4.Baseline:
- XxTargets:
6. Xx
Output 6.4 Strengthened national institutional and technical capacity to increase awareness, availability and utilisation of family planning services.
Indicators: 1. Contraceptive prevalence rate
2 CYP3 Adolescent Birth
Rate 4 Unmet need for
family planning - Xx
Baseline:
- XxTargets:
5 Xx
- DHS 2008- DHS 2013
Risks
- XxAssumptions
- Xx
- Xx- Xx
Output 6.5 Strengthened and harmonized national systems for data collection, management, and utilization of MNCH interventions.
Indicators:
Timeliness and Completeness of DHIMS
M&E group to assist with additional indicators.
- XxBaseline:
- XxTargets:
6 Xx
- GHS Annual reports- CHAG Annual report-
Risks
- XxAssumptions
- Xx
- Xx- Xx
Output 6.6 Strengthened capacity to plan and coordinate implementation of MNCH strategies at national and sub-national level
Indicators: NB. Talk to NDPC
- XxBaseline:
- XxTargets:
7 Xx
- Risks
- XxAssumptions
- Xx
- Xx- Xx
UNDAF Results Matrix: Option 2 (Outcomes and Outputs) – Nov 23
Outcomes Indicators , Baseline, Target
Means of Verification Risks and Assumptions
Role of Partners Indicative Resources (US$)
UN agency
US$
Outcome 7: The most disadvantaged and vulnerable groups across Ghana benefit from at least four social services in an integrated social protection system.
Contributing UN agencies: FAO, ILO, IOM, UNAIDS, UNDP, UNESCO, UNICEF, WFP
Indicators:
- programme- Number of social
services and safety nets promgrames integrated into the social protection system.
- % of districts covered by the integrated social protection system.
- % of most disadvantaged and vulnerable groups benefit from integrated social protection.(groups to be defined)
Baseline:
- Number of social services and safety net programmes integrated in social protection: 4
- % of districts covered by integrated social protection system: ?% % of most disadvantaged and vulnerable groups benefit from
- Risks
-Inadequate Social Protection budget
-Change in GoGs priority for Social Protection
Assumptions
- A working coordination mechanism which facilitates joint decision making
- Government of Ghana allocates adequate resources
- MESW, Min of food and Agriculture, Ministry of Finance, Ministry of Education, Ministry of Women and Children Affairs, Ministry of Health, Ghana AIDS Commission
FAO
ILO
UNAIDS
UNDP
UNICEF
WFP
IOM
UNESCO
UNDAF Results Matrix: Option 2 (Outcomes and Outputs) – Nov 23

integrated social protection: ?%
Targets:
1. Number of social services and safety nets programme integrated in social protection: 8
2. % of districts covered by integrated social protection system:?%
- % of most disadvantaged and vulnerable groups benefit from integrated social protection:?%
Output 7.1: By 2013 the National Social Protection Policy is operational and includes a minimum package of social protection services (including emergency standards by 2015) based on a common targeting mechanism
Indicators:
- # of MDAs using the common targeting mechanism for selection of beneficiaries
- % of people affected by emergencies each year covered by the minimum package for emergencies
Baseline:
- XxTargets:
- Xx
- Risks
-Inadequate Social Protection budget
-Change in GoGs priority for Social Protection
Assumptions
- A working coordination mechanism which facilitates joint decision makingGovernment of Ghana allocates adequate resources
- MESW, Min of food and Agriculture, Ministry of Education, , Ministry of Health, NADMO
- Regional Departments of Key Ministries
- Dept of Community Development and DSW at district levels
FAO
UNAIDS
UNDP
UNICEF
WFP
Output 7.2: Social Welfare Service providers (MDAs, CSOs,
Indicators:
- % of districts complying with
- Risks
- Service providers work
-MESW, Min of food and Agriculture,
FAO
UNAIDS
UNDAF Results Matrix: Option 2 (Outcomes and Outputs) – Nov 23

NGOs ) across Ghana deliver efficient, coordinated, social welfare services (including in emergencies) to the poorest and most vulnerable groups
Contributing UN agencies: FAO, ILO, IOM UNAIDS, UNDP, UNESCO, UNICEF, WFP
minimum standards for social welfare services
Baseline:
- Xx- XxTargets:
- Xx- Xx
in silos
Assumptions
- Coordination platforms available at all levels
Ministry of Education, Ministry of Women and Children Affairs, Ministry of Health, Ghana AIDS Commission
UNDP
UNESCO UNICEF
WFP
Output 7.3: Vulnerable and marginalized groups across Ghana empowered to access and utilize safety net programmes, social welfare and HIV/AIDS services.
Contributing UN agencies: FAO, ILO, IOM UNAIDS, UNDP, UNESCO, UNICEF, WFP
Indicators:
- % increase in PLHIV utilizing social welfare services
- % increase in OVC utilizing social welfare services
- % of people in the lowest quintile registered in NHIS
- % of OVC below 15 yrs in the lowest quintile benefitting from LEAP
- % of elderly people in the lowest quintile benefitting from LEAP
- % of disabled people in the lowest quintile benefitting from LEAP
- % of school going children below 15yrs in the lowest quintile benefitting from free school uniform
- District reports from DAs
Annual report, assessment, survey, WFP Special Project Report (SPR), monitoring report.
Risks
- Natural disasters overload the social welfare system affecting their ability to respond
- Change in government priorities.
Assumptions
- Donors’ commitment.
- Government’s commitment
MESW, MoH, MOE, Ministry of Local Government and Rural Development, Ghana Aids Commission, National AIDS Control Programme: Coordination, implementation
Donors: funding, technical support.
FAO
ILO
IOM
UNAIDS UNDP UNESCO UNICEF
WFP
UNDAF Results Matrix: Option 2 (Outcomes and Outputs) – Nov 23

- % of school going children below 15 in the lowest quintile benefitting from free school feeding programme
- Proportion of primary school pupils benefitting from free school meals in the three Northern regions and millennium project village.
- Proportion of girls receiving take-home rations (THR) in the three northern regions.
- # of girls receiving scholarships in the three northern regions.
- Proportion of children and pregnant and lactating women receiving free nutrition support in the three Northern regions.
- Proportion of food insecure PLHIV and affected families receiving free nutrition and food support in the three Northern region and Millennium Village Project.
-
UNDAF Results Matrix: Option 2 (Outcomes and Outputs) – Nov 23

Baseline:
- XxTargets:
- Xx
Output 7.4: Scaled up national response to Gender Based Violence, Sexual and Reproductive Health and HIV Prevention
Indicators: Advocacy and communication strategy for GBV, SRH and HIV developed
Baseline:
Targets:
-
- Risks
- XxAssumptions
- Xx
- Xx- Xx
Output 7.5: By 2013 a functional National Child Protection system as part of an integrated social protection system facilitates a coordinated and planned response to child protection including during emergencies.
Indicators: 1. National Child Protection Policy
2.The National Plan of Action (NPA) for the Elimination of the Worst Forms of Child Labour in Ghana is operational
3.The Ghana Child Labour Monitoring System operational in 14 districts
4. Emergency Child protection response plan operational
Baseline:
- NPA approved by Cabinet
Targets:
- National level
1.Reports of the National Multi Sectoral Committee on Child Protection
2. Reports of the National Steering Committee on Child Labour (NSC-CL) and its 3 sub-committees
3.District Assembly Reports
ILO reports
Risks
1.Technical infrastructures might not be immediately sufficient to support the GCLMS
Assumptions
1 Government of Ghana allocates adequate resources for child protection services2.Partners maintain a balanced interest in the fight against any form of child labour3.Stability and high commitment of GoG4.The GCLMS is utilised by all the partners involved
-MOWAC, MESW, Ministry of Justice, DSW, DoC, NGOs
- MESW: coordination role
- 27 members of the NSC-CL: effective collaboration for the implementation of the NPA
ILO
UNICEF
IOM
USD1 million
USD 3 million
USD500,000
UNDAF Results Matrix: Option 2 (Outcomes and Outputs) – Nov 23

5.The GCLMS database is maintained by partners
Output 7.6: By 2015 Child Protection service providers (MDAs, CSOs, NGOs) across Ghana deliver efficient, coordinated, gender appropriate child protection services to orphans and vulnerable children, including ‘at-risk’ groups.
- % of districts complying with minimum standards for child protection services
- Child Protection referral service operational at all levels
Baseline:
- NPA for OVC- NPA for WFCL- Child Abuse network- 4 functioning
Regional NetworksTargets:
National level, Regional and Community level
-Reports of Monitoring Committees
-DOVVSU database
-Database on OVC
Risks
- Service providers work in silos
Assumptions
1 Government of Ghana allocates adequate resources for child protection services2.Coordination platforms available at all levels
-MESW,
Ministry of Women and Children Affairs, DOVVSU
Ministry of Education
ILO
IOM
UNAIDS
UNICEF
USD600,000USD300,000
USD 3 million
Outcomes Indicators , Baseline, Target
Means of Verification Risks and Assumptions Role of Partners Indicative Resources (US$)
UN agency US$
Outcome 8: Strengthened and scaled up national multi-sectoral, decentralized AIDS response to achieve Universal Access targets
Indicators: No of Sectors and MMDAs plans and budgets reflecting gender outcomes
Baseline:
2009/10 APRs
Targets:
- Sector and MMDAs APRs and budgets
Risks
- High Staff attrition rate especially at decentralized levels
- Administrative changes and political interferences in the coordination and management of the
Ghana AIDS Commission: Coordination of multi-sectoral HIV and AIDS response
Ministry of Health: Development of health sector response plans, policies and
UNAIDS
UNICEF
UNFPA
UNIFEM
WFP
UNDP
UNDAF Results Matrix: Option 2 (Outcomes and Outputs) – Nov 23

Outcomes Indicators , Baseline, Target
Means of Verification Risks and Assumptions Role of Partners Indicative Resources (US$)
UN agency US$
by 2016. All MDAs and 50% MMDAs
AIDS response. - “Donor fatigue”Assumptions
- National gender and Children’s Policy will be reviewed and costed by 2011x
strategies
Ministry of Employment and Social Welfare Ministry of Women and Children Affairs, Ministry of Justice Parliamenent, Commission of Human Rights and Administrative Justice, Ghana Police Ministry of Chieftaincy and Cultural Affairs: Develop, implement and monitor sectoral plan
Civil Society: Active participation in implementation
UN agencies
Funding and technical assistance
ILO
IOM
UNESCO
WHO
FAO
Output 8.1: A costed operational plan to guide the implementation of the National Strategic Plan
Indicators:
- Operational plan for 2011-2013 with key activities and implementing
- 1. HIV and AIDS operational plan
- 2. Reports on HIV
Risks
- High Staff attrition rate at decentralized levels
Ghana AIDS Commission:
- Develop costed national operational plan
UNAIDS
UNICEF
UNDAF Results Matrix: Option 2 (Outcomes and Outputs) – Nov 23

Outcomes Indicators , Baseline, Target
Means of Verification Risks and Assumptions Role of Partners Indicative Resources (US$)
UN agency US$
for HIV and AIDS developed by 2011 and implemented by 2012
Lead Agency: UNAIDS
partners available by 2011
- Terms of reference for implementing agencies developed and contracts awarded by 2012
Baseline: In 2011, xxx of ministries and MDAs have HIV and AIDS plans implemented on the basis of the operational plan
Targets: by 2013, All key ministries and MDAs at national, sub national level have HIV and AIDS plans implemented on the basis of the operational plan
and AIDS activities of implementing agencies.
- Political instability- “Donor fatigue”
Assumptions
- Increased and sustained political will at the highest level to address the threat pose by HIV&AIDS
- Adequate resources mobilized to develop and implement HIV and AIDS Operational plan for the implementation of the 2011-2015 NSP.
- Provides adequate guidance and timely funding support for implementing partners
Ministries
-Develop costed sectoral HIV and AIDS operational plan
-Implement and monitor the implementation progress
Civil Society:
-Implement and monitor the programmes
UN agencies
Funding and technical assistance
UNFPA
WFP
ILO
UNESCO
WHO
UNDP
Output 8.2: By 2013, Civil Society Organizations, Opinion leaders, Media personnel and health care providers are better able to plan, implement, monitor and evaluate
Indicators:
- % of women and men aged 15-49 years reporting use of condoms during last high risk sex
- % MARPs reporting consistent condom use during sex
- Survey report
- Reports on HIV and AIDS activities of implementing agencies
Risks
- Inadequate allocation of resources for decentralized response
Assumptions
- Commitment of
Ghana AIDS Commission, Ministry of local government , Regional and district councils , Ministry of Health and Ghana Health Services, Ministry of Women and Children Affairs :
Provide necessary inputs and ensure coordination as well as
UNFPA
Contributing UN agencies
UNAIDS, UNICEF, IOM,
ILO UNESCO
UNDAF Results Matrix: Option 2 (Outcomes and Outputs) – Nov 23

Outcomes Indicators , Baseline, Target
Means of Verification Risks and Assumptions Role of Partners Indicative Resources (US$)
UN agency US$
prevention interventions for most at risk populations (including young MARPs) and other vulnerable groups based on evidence in three most affected regions.
Lead Agency: UNFPA
- Number of MARPS who received HIV test in the last months and know their results.
Baseline:
- 25% condom use for female and 45% condom use for men
- TBD for MARPS using condoms
- 38% for HIV testing and counseling
Targets:
- 37% for female and 67% for male on condom use
- 80% of MARPS using condoms
- 90% of MARPs tested and know their results
implementing partners,
- Reduced stigma, discrimination and homophobia against sexual minorities
- Functioning regional technical support units
identification of key partners
Organize and facilitate capacity development sessions
UN agencies
Funding and technical assistance
UNIFEM
Output 8.3: A national plan to coordinate the capacity development of judiciary, law enforcement agencies, parliamentarians and human rights institutions/organizations to protect and promote the rights of infected and affected by HIV established by end
Indicators:
- National costed capacity development plan available for implementation by 2012
- No of trainings/ Sensitization workshops organized for judiciary, police and parliamentarians and civil society on
National costed capacity development plan.
Reports on training conducted for the target group.
Risks
-Widespread stereotypes among Judiciary and other agencies on human rights among marginalized population groups
Assumptions
Ghana AIDS Commission, Ministry of Justice, Ghana Police, Ministry of Interior, Parliament, CHRAJ
provide necessary inputs for the capacity development plan
Provide a list of key officials to
UNDP
UNAIDS UNFPA UNICEF
ILO
UNESCO UNIFEM
UNDAF Results Matrix: Option 2 (Outcomes and Outputs) – Nov 23
Outcomes Indicators , Baseline, Target
Means of Verification Risks and Assumptions Role of Partners Indicative Resources (US$)
UN agency US$
of 2012 and implemented by 2013.
Lead Agency: UNDP
human rights related to HIV by 2013.
Baseline:
- No costed capacity development plan available (2010)
- 0 trainings/sensitization workshops
Targets:
- Costed National costed capacity development plan
- 10 trainings/sensitization workshops
Availability of resources to implement capacity development plan for target group.
Cooperation from target group to participate in capacity development programme.
be trained
UN agencies
Funding and technical assistance
Output 8.4: By 2014, skills of health care providers in three most affected regions to increase access and uptake of ART, care and support and HIV/TB services enhanced.
Lead Agency: WHO
Indicators:
- No. of health care providers trained on ART, HIV/TB, care and support.
- No. of health facilities providing ART, care and support services.
- Number of HIV-positive patients to be screened for TB in HIV care or treatment settings
Baseline:
- Xxx health care providers trained on ART in 2010
- Xxx health care providers trained on
Training reports
Health facility reports/statistics on ART, HIV/TB, care and support services provided.
Risks
-Inadequate allocation of resources for capacity building
Assumptions
Willingness of health care providers to work with enhanced skills.
Ministry of Health:
- Operational planning for ART HIV/TB service delivery points, technical supervision and support, monitoring and evaluation, and capacity development
Ghana AIDS Commission,
Development of care and support policy and guidelines, coordination, monitoring and evaluation
Civil Society:
implementation of care and
WHO
UNICEF UNAIDS UNFPA
WFP
UNDAF Results Matrix: Option 2 (Outcomes and Outputs) – Nov 23

Outcomes Indicators , Baseline, Target
Means of Verification Risks and Assumptions Role of Partners Indicative Resources (US$)
UN agency US$
HIV/TB in 2010- Xxx health care
providers trained in HIV care and support in 2010
- 138 (267)health facilities provide ART treatment in 2010
- 34308 HIV-positive patients to be screened for TB in HIV care or treatment settings in 2010
Targets:
- Xxx health care providers trained on ART in 2014
- Xxx health care providers trained on HIV/TB in 2014
- Xxx health care providers trained in HIV care and support in 2014
- 267 health facilities provide ART treatment in 2014
- 91745 HIV-positive patients to be screened for TB in HIV care or treatment settings in 2014
support programmes
UN agencies
Funding and technical assistance
UNDAF Results Matrix: Option 2 (Outcomes and Outputs) – Nov 23
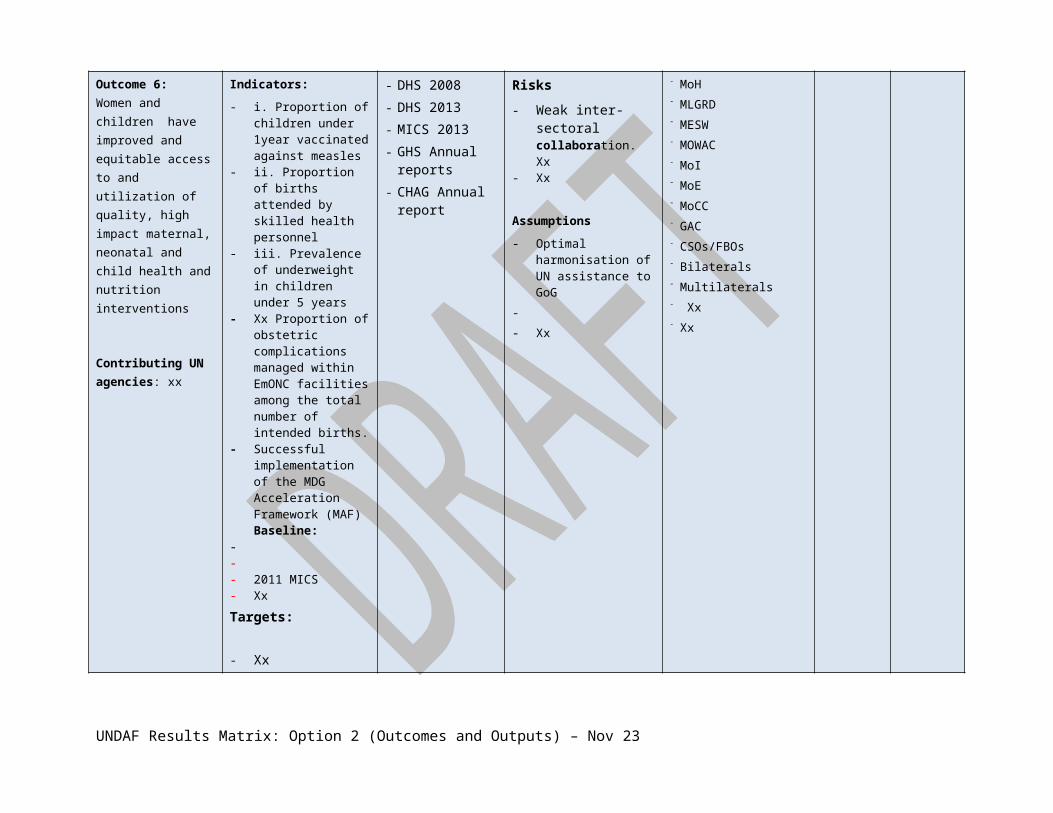
Outcomes Indicators , Baseline, Target
Means of Verification Risks and Assumptions Role of Partners Indicative Resources (US$)
UN agency US$
Outcome 9: Socioeconomically excluded and disadvantaged groups have increased access to education services and demonstrate increased attainment in literacy, numeracy and life skills
Contributing UN agencies: UNICEF, UNESCO, WFP, UNHCR, ILO
Indicators:1) % of children aged 6-14 attending school disaggregated by sex, location, and economic quintile2) % of G6 students attaining proficiency level in National Educational Assessment (NEA)3) Adult literacy rate4) # of children and young people enrolling in technical and vocational skills development (TVSD) programmesBaseline:1) 2008 (GDHS) Male-79%; Female-79%Q1-64%; Q2-78%; Q3-82%; Q4-86%; Q5-90%Rural-75%; Urban-85%2) 2009 (NEA)English: Male 36%, Female 36%, Total 36%Math: Male 16%, Female 11%, Total 14%3) 2008 (GDHS)
Male: 77%Female: 63%Total: 70%
4) 2009/10 – Enrolment in TVET institutions under MOE: 20,694Targets:1) 2016 - At least 80% for Q1 group and at least 90% for all other groups2) 2016 – NEA proficiency
1) GDHS, MICS, EMIS2) NEA report3) GDHS, MICS4) COTVET report, EMIS
MoE Annual Education Sector Performance Report for all indicators
Risks- Change of key staff at
MoE/GES could hinder systematic and consistent policy formulation and implementation
Assumptions- GOG continued priority
on and sufficient budget allocation to the education sector
- MOE/GES continued priority and efforts on the reduction of inequalities and disparities and the improvement of the quality of teaching and learning based on the ESP 2010-2020
- Availability of reliable and timely data on out-of-school children with appropriate disaggregation
- MOE/GES continued implementation and analysis of the national sample learning assessment systems (NEA)
- Clear national standards for life skills established
National MOE/GES: Policy development, sector planning, review and coordination, resource allocation, institutional and system development, expansion and mainstreaming of effective service provision models, advocacy, capacity developmentRegional and District Authorities: Operational planning, technical supervision and support, monitoring and evaluation, coordination and facilitation, capacity developmentSchools: Provision of quality education services, community mobilisation, awareness raisingDPs/NGOs: Complementary and harmonised financial and technical support for infrastructure development, capacity development, advocacy and community mobilisation
UNICEF
UNESCO
WFP
UNHCR
ILO
UNFPA
UNDAF Results Matrix: Option 2 (Outcomes and Outputs) – Nov 23

rate English: 70%Math: 70%
3) 2016 – Adult literacy rate Total: 85%4) 2015/16 – TVET Enrolment: TBD
Output 9.1 The needs of out-of-school children, especially those with special needs and OVCs, systematically assessed and addressed through formal, complementary and inclusive education programmes in 10 deprived districts
Contributing UN agencies: UNICEF, UNESCO
Indicators:1) Availability of national inclusive education policy with costed plan2) The proportion of out-of-school children (OOSC) aged 6-143) School readiness (KG NER and Primary NAR)Baseline:1) No inclusive education policy available2) and 3) 2009/10 (EMIS)% OOSC/KG NER/Primary NARAfram Plains (ER): 33%/45%/65%Savelugu Nanton (NR): 54%/76%/70%K.E.E.A (CR): 26%/46%/59%Garu/Timpane (UER): 26%/47%/71%Lambussie-Karni (UWR): 38%/45%/65%10 more districts to be identified in 2011Targets:1) Inclusive education policy developed2) 2016 - Reduce the proportion of out-of-school children aged 6-14 by at least 70% in all 10 districts3) 2016 - At least 80% for
1) MoE reports2) EMIS3) EMIS
MoE Annual Education Sector Performance Report for all indicators
Risks- Change of key staff at
MoE/GES could delay the implementation of the complementary basic education inclusive education and ECCD policies
Assumptions- MoE/GES ownership
and commitment to consolidate and expand effective complementary, inclusive and early childhood education programmes remains high
- DP and NGO support harmonised under the complementary basic education, inclusive education and ECCD policies
- Classroom construction and other infrastructure improvement to be supported by other DPs/NGOs
National MOE/GES/DOC/MOWAC: Finalisation of complementary education and inclusive education policy and action plan, overall monitoring and assessment of out-of-school children, evaluation of complementary, inclusive and early childhood education programmes, resource allocation, expansion and mainstreaming of effective serviceprovision models, advocacy, capacity development, and IEC materials developmentRegional and District Authorities: Technical support and coordination for implementation of complementary, inclusive and early childhood education programmes, monitoring and evaluation of the programmes, local media and awareness activities, capacity development
Schools: Provision of quality complementary, inclusive and early childhood education services, community mobilisation, enrolment campaignsDPs/NGOs/CBOs/FBOs:
UNICEF
UNESCO
UNDAF Results Matrix: Option 2 (Outcomes and Outputs) – Nov 23
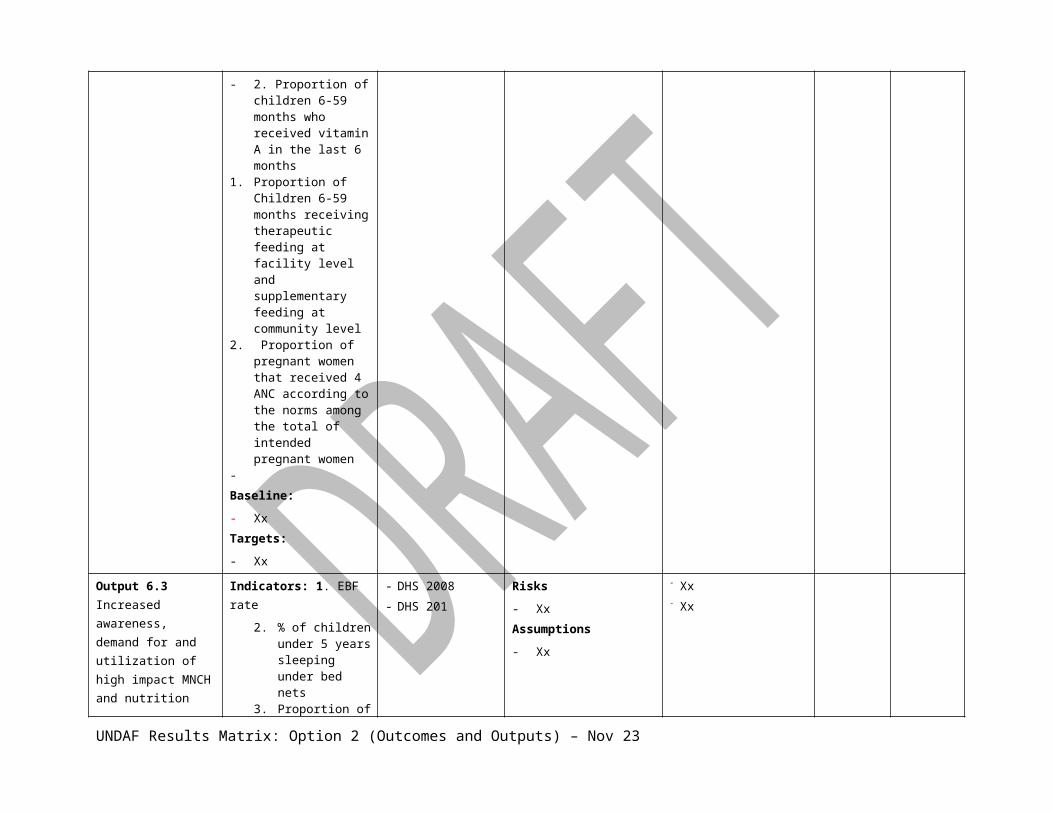
NER and 90% for NAR in all 10 districts
Complementary and harmonised financial and technical support for the implementation of complementary, inclusive and early childhood education programmes, community mobilisation, Interpersonal Communication (IPC) activities, IEC materials development, advocacy and community mobilisation
Output 9.2 Formal, alternative, accelerated basic education or vocational and skills training services expanded to include former child labourers in 14 districts
Contributing UN agencies: ILO
Indicators:The number of working children aged 5-17 withdrawn and prevented from child labour and integrating education or vocational training services in the 11 districtsBaseline:0Targets:5,000 children aged 5-17
The Ghana Child Labour Monitoring System (see Output 12.3 under Social Protection Outcome Group)
Assumptions- Anti poverty and
education programmes gradually expand available education, employment and income generation alternatives to child labour starting in project interventions zones
- The various actors working on the question of child labour in the targeted countries, sectors and communities agree to share information, seek collaboration and coordinate their efforts.
Ministry of Education: Coordination role and responsible for mainstreaming child labour into the education and vocational training system.
Selected NGOs: Implementation of the programmes in the 14 districts
ILO
Output 9.3 National and sub-national capacity developed to provide appropriate and relevant education services for children in emergency situations in affected locations.
Contributing UN
Indicators:1) % of refugee children attending school2) % of IDP children attending school3) # of children receiving emergency school feedingBaseline:1) TBD2) TBD
MOE/GES reports Assumptions- Refugee children of
school going age repatriate to country of origin.
- New influx of refugee children from neighbouring countries.
- Government, DPs/NGOs provide
National MOE/GES, NADMO: Preparation of emergency preparedness and response plan, overall monitoring and assessment of education in emergency, resource allocation, advocacy, capacity developmentRegional and District Authorities: Technical support
UNHCR
UNICEF
WFP
UNDAF Results Matrix: Option 2 (Outcomes and Outputs) – Nov 23

agencies: UNHCR, UNICEF, WFP
3) TBDTargets:1) TBD2) TBD3) TBD
timely, sufficient and appropriate support in the provision of education services for children in emergency situations
and coordination for the provision of education services in emergency situations, monitoring and evaluation of the programmes, capacity development Schools: Provision of quality education services, community mobilisation, enrolment campaignsDPs/NGOs: Complementary and harmonised financial and technical support for the provision of education services in emergency situations, community mobilisation and enrolment campaigns
Output 9.4: National capacity enhanced to plan and implement well co-ordinated and targeted pro-poor interventions such as school feeding, take-home rations and girls’ scholarship to facilitate access for school-aged children from deprived regions
Contributing UN agencies: WFP, UNICEF
Indicators:1) Use of single registry as a common targeting mechanism2) # of schools receiving school feeding programme3) # of students receiving school feeding programme4) # of girls receiving take-home rations (THR)5) # of girls receiving scholarships6) Attendance rate (boys and girls): number of school days in which boys and girls attend classes as percent of total number of school days in the target communities7) Enrolment (boys and girls): Average annual rate of change in number of boys and girls enrolled in the target communities
- MOE/GES reports- WFP Annual
Standard Project Report
Risks- Staff turnover could
delay project implementation
Assumptions- Government committed
to the implementation of Country Programme Action Plan
- Other national level interventions on deworming and school health are implemented to complement the realization of the full benefits of school feeding.
- Government assistance to the programme will not decease severely during the period of implementation
- Government would put in place a school
Key Ministries and Government Agencies at national, regional and district levels (i.e. MLGRD, GSFP secretariat, MOE/GES, MoFA, MOH/GHS, MOESW, and MOWAC): Policy development, development of a common targeting mechanism based on the single registry, planning and implementation, advocacy, coordination and monitoring.
DPs/NGOs (i.e. Dutch Embassy, World Bank, USAID, Send Foundation, MVP, etc): Support with funding, planning, capacity development, implementation and monitoring
Private Sector: Implementation, partnership,
WFP
UNICEF
UNDAF Results Matrix: Option 2 (Outcomes and Outputs) – Nov 23

8) Gender Parity index at JHS level in the target communitiesBaseline:1) 2010 – Single registry not available2) 2010 – 496 schools in the 3 Northern Regions and MVP in Ashanti Region3) 2010 – 151,626 students in the 3 Northern Regions and MVP in Ashanti Region4) 2010 – 10,000 girls for THR in the Northern Region5) 2010 – 16 girls receive scholarship in the 3 northern regions6) 90%7) 20%8) 0.82Targets:1) 2016 - Single registry applied to all pro-poor incentive programmes2) 600 schools3) 188,000 school children4) 30,000 girls on THR 5) 30 girls receive scholarship6) 97%7) 40%8) 1.00
feeding policy to clarify roles of all line Ministries
- Targeting under take-home ration and school feeding components are well focused to reach the most vulnerable districts/schools
and capacity development
Communities: Support for awareness generation, participation and implementation
Media: Advocacy, partnerships, information dissemination, awareness creation and monitoring
Output 9.5National and sub-national capacity enhanced to improve educational quality through a child-friendly school system and life skills education
Indicators:1) % of primary schools (including KGs) meeting minimum CFS standards2) % of JHS with HIV Alert Status3) % of out of school youth aged 15-24 demonstrating
1) National, Regional, District CFS reports2) MOE/GES reports3) Special survey4) GDHS, MICS5) EMIS6) MOE/GES reports
Risks- Change of key staff at
MoE/GES could delay the implementation of quality improvement initiatives including CFS, life skills education, and teacher development
National MOE/GES: Development/consolidation of CFS, school health education and life skills programmes including the HIV Alert programme, and accredited in-service teacher training programme, upgrading of
UNICEF
UNESCO
UNDAF Results Matrix: Option 2 (Outcomes and Outputs) – Nov 23

programmes including HIV/AIDS education
Contributing UN agencies: UNICEF, UNESCO, UNFPA
comprehensive knowledge of HIV/AIDS 4) % of young men and women aged 15-24 with comprehensive knowledge of HIV and AIDS5) Availability of comprehensive, timely and reliable EMIS6) Availability of accredited in-service teacher training programmes
Baseline:1) To be established in 2011 2) To be established in 20113) To be established in 20114) 2008 (GDHS) Males: 34% Females: 28%5) 2010 - Not available6) 2010 – Not availableTargets:1) 2016 - 70% 2) 2016 - 100%3) 10% increase in baseline by 20164) TBD5) 2013 - Comprehensive, timely and reliable EMIS available6) 2014 - Accredited in-service programmes in place
programmes- Inability to raise enough
funds to respond to quality needs
Assumptions- MoE/GES ownership
and commitment to improve the quality of education remains high.
- Other DP and NGO support harmonised under the government leadership
- Classroom construction and other infrastructure improvement to be supported by other DPs/NGOs
EMIS, resource allocation, institutional and system development, impact assessment of programmes, capacity development, and IEC/IPC materials/activities developmentNational Youth Council and Adolescent health Division (GHS): Policy implementation, coordination and monitoring of out-of-school life skills education activities.Regional and District Authorities: Technical support and coordination for programme implementation, technical supervision and support for schools, monitoring and evaluation of programmes, capacity development Schools: Implementation of CFS, life skills education and other quality interventionDPs/NGOs: Complementary and harmonised financial and technical support for the implementation of quality improvement interventionsNGOs, especially PPAG, CEDEP, Theatre for a Change, Ananse Reach Concept, Curious Minds and informal sector: Advocacy, social mobilisation and BCC Academic institutions especially University of Cape Coast, UDS and KNUST: research, evaluation, interest group analysisMedia: Advocacy, partnerships and features
UNDAF Results Matrix: Option 2 (Outcomes and Outputs) – Nov 23

NGOs, especially PPAG, CEDEP, Theatre for a Change, Ananse Reach Concept, Curious Minds and informal sector: Advocacy, social mobilisation and BCC Academic institutions especially University of Cape Coast, UDS and KNUST: research, evaluation, interest group analysisMedia: Advocacy, partnerships and features
Output 9.6COTVET and REO/DEO capacity enhanced to develop and implement TVET Action Plan
Contributing UN agencies: UNESCO
Indicators:1) Availability of costed TVET Action Plan 2) # of districts implementing TVET Action PlanBaseline:1) Costed Action Plan not available2) NoneTargets:1) Costed Action Plan developed2) At least 5 districts
1) TVET Action Plan2) COTVET reports
Assumptions- MoE and COTVET
commitment to implementing TVET policy and to expanding TVET facilities.
- Development partners willing to support development of technical skills.
MOE, COTVET: Data collection; analysis of market needs for TVET skills; review studies and participation in policy simulation exercises, counselling regarding career choices, with focus of TVSD.DPs/NGOs: Allocation of funding
UNICEF
UNESCO
UNFPA
Output 9.7GES Non-Formal Education Division has key competencies and adequate resources to implement functional adult literacy education programmes.
Contributing UN agencies: UNESCO
Indicators:# of districts implementing functional literacy programmesBaseline:NoneTargets:At least 5 districts
GES/NFED reports Assumptions- More resources are
mobilized to support the development of adult literacy programmes.
NFED: development of functional literacy programmes; training of functional literacy providers
CSOs: Provision of functional literacy programmes, advocacy and promotion of the reading campaign movement; provision of supplementary reading materials
UNICEF
UNESCO
UNFPA
UNDAF Results Matrix: Option 2 (Outcomes and Outputs) – Nov 23
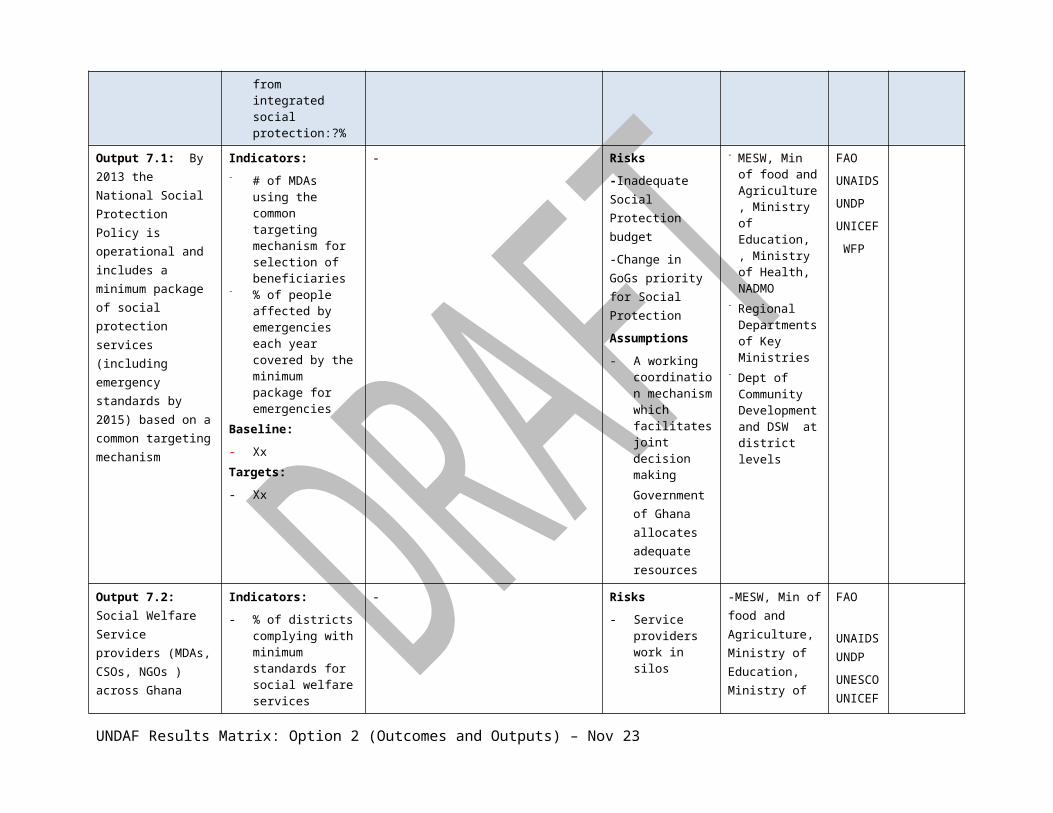
UNDAF Results Matrix: Option 2 (Outcomes and Outputs) – Nov 23

Thematic area 4: Transparent and Accountable Governance
National Priority: TRANSPARENT AND ACCOUNTABLE GOVERNANCE
ENABLING ENVIRONMENT FOR EFFECTIVE PLAN PREPARATION AND IMPLEMENTATION
MONITORING AND EVALUATION
- DEEPENING THE PRACTICE OF DEMOCRACY AND INSTITUTIONAL REFORM
- STRENGTHENING LOCAL GOVERNANCE AND DECENTRALIZATION
- WOMEN AND GOVERNANCE - FIGHTING CORRUPTION AND ECONOMIC CRIMES - ENHANCING RULE OF LAW & JUSTICE - ENSURING PUBLIC SAFETY & SECURITY - IMPROVING ACCESS TO RIGHTS & ENTITLEMENT - PROMOTION OF NATIONAL CULTURE FOR DEVELOPMENT - STRENGTHENING DOMESTIC AND INTERNATIONAL RELATIONS (PARTNERSHIP) FOR DEVELOPMENT - PROMOTING EVIDENCE-BASED DECISION MAKING - MANAGING MIGRATION FOR NATIONAL DEVELOPMENT - DEVELOPING CAPACITIES OF KEY PLANNING AGENCIES
- M&E INSTITUTIONAL ARRANGEMENTS UNDER THE GSDSA
MDG Goal: Supports all MDGs
Outcomes Indicators , Baseline, Target
Means of Verification Risks and Assumptions Role of Partners Indicative Resources (US$)
UN agency US$
Outcome 10:
Key national institutions of democracy facilitate decentralisation and participatory governance, promoting peace, human security
Indicators:
-The levels of representation of women, vulnerable groups participating in governance processes.-The percentage of local assemblies that consult
- Statistical data from the Ghana Statistical service
- APRM local governance reports
- National gazette- Policy document- Reports from the
Risks
- Local elite and political capture
- Turnover of key personnel in the justice delivery institutions
Funding
GoG, DDF, GTZ, DANIDA, CIDA, EU, The Netherlands, AFD
Technical Expertise
UNDP UNICEF UNESCO UNFPA UNIFEM
FAO
WFP
UNDAF Results Matrix: Option 2 (Outcomes and Outputs) – Nov 23

and justice with an equity focus on vulnerable groups by 2016
Contributing UN agencies: UNDP, UNICEF, UNESCO, UNFPA, UNIFEM, FAO, WFP
their constituencies and report on their results using participatory approach.-Number of policies, laws and regulatory instruments introduced to improve the justice delivery.-The regularity in the meetings of the High Level Dialogue on justice delivery.-Percentage of public that have confidence and believe that justice delivery has improved Baseline:
-Existing guidelines on decentralisation but not effectively implemented
-Divergence of opinion regarding decentralization
-Local governance sub-structures not yet able to assume and effectively exercise their functions.
-Several government institutions populate the justice system. Their mandates are complementary yet weakness in their coordination and specific institutional capacity constraints hamper the delivery of justice.
Targets:
-MLGRD, MMDAs, the Economic and Organised
high level dialogue- Research studies- Citizen satisfaction
surveys
Assumptions
- Government prioritizes and follows through the decentralization policy
- The government will remain committed to improving the justice delivery system
Academia, training institutions, local and regional CSOs, Ghana Bar Association
UNDAF Results Matrix: Option 2 (Outcomes and Outputs) – Nov 23

Crime Office, Traditional Leaders, Electoral Commission, NCCE, CSOs.-xxxx Women representatives in decision making bodies- xxx District Assemblies reported to consult their constituencies.-Ministry of Justice and AGs Department, CHRAJ, Judicial Service, Ministry of the interior, Independent Governance Institutions, CSO networks
Output 10.1 Key Technical and operational capabilities (i.e investigation, crime detection, information management etc) set up in the Economic and Organised Crime Office
Indicators:
-the quantum of budgetary allocation by government to set HR and administrative process
-number of operational manuals, procedures and guidelines in place
Baseline:
-the SFO is undergoing restructuring to become Economic and Organised Crime Office. The new office will enhance the quality of investigations, the speed of crime detection, and the management of information related to economic crime.
Targets: -Structures, human
- Government budget- Existing manuals
Risks
- Lack of political support- Insufficient budgetary
allocationAssumptions
- Continuous government commitment to set up the EOCO, strengthen anti-corruption provisions and enforcement.
Technical Expertise
- Academia, local and regional CSOs,
Funding: GoG, Un Agecnies, UNDP
UNDP
UNODC
UNDAF Results Matrix: Option 2 (Outcomes and Outputs) – Nov 23

resources, and administrative procedures clearly defined, in place and operational- xxx Amount of budget allocation- xxxx Procedures, guidelines and policies produced.
Output 10.2 Mechanisms put in place to ensure that women and vulnerable groups are informed about their rights and supported to participate actively in decision making processes
Indicators:
- percentage increase in number of women in leadership and decision making processes
- number of trainings sessions, workshops to sensitize women and vulnerable groups on their rights
-number of advocacy and IEC materials disseminated and events organized
Baseline:,
-Socio-cultural and economic conditions of women and vulnerable groups have limited their awareness and ability to uphold their rights.
- existing institutional support structures are weak and poorly resourced
-low participation of women and vulnerable groups in decision making and leadership
-Parliamentary records
- MOWAC records
-GSS records
-Training and workshop report
Risks
- Resistance to affirmative action
Assumptions
- the government pushes for gender sensitive reforms
- Continuing interest by women to take up positions
Funding: GoG, UNCT, DANIDA, CIDA, EU, WB, Royal Netherlands Embassy, DfID
Advocacy: MOWAC, media, CSOs, UNCT
UNDAF Results Matrix: Option 2 (Outcomes and Outputs) – Nov 23

Targets:
-DOVVSU, MOWAC, Ghana federation of the disable, National Council on Persons with Disability, Parliamentary caucus for women, CSOs, NGOs,
-xxxx Women in decision making positions
-xxx seminars, workshops, traning sessions organized
- xxxx advocacy and IEC materials produced.
Output 10.3the Electoral Commission and related institutions take a leading role in promoting trust, dialogue and partnership to hold free, fair and violence-free national and district elections
Indicators:
- Regularity of IPAC meetings
- Items on the agenda- Level of compliance
with decisions of the IPAC
Baseline:
- An institutionalized forum for inter-party dialogue exist yet mistrust among major political parties is high
Targets
-EC, CSOs, NCCE, Political Parties, media
-xxx meetings of IPAC
- Items of the agenada of IPAC
- xxxx decisions of IPAC
Reports on elections
IPAC report
Risks
Disruption resulting from change in commissioners
Assumptions
The EC will continue to be receptive of suggestions from stakeholders
Funding (core): GoG
Funding (non-core): EU, CIDA
UNDP
UNDAF Results Matrix: Option 2 (Outcomes and Outputs) – Nov 23

implemented.
Output 10.4
Locally elected officials and traditional authorities have a framework of consultations, dialogue and coordinated decision making to foster accountability
Indicators:
- Number and regularity of consultations among MMDAs and constituents including traditional authorities (TA)
- Level of satisfaction of citizens about their involvement in decision making
Baseline: inadequate involvement of traditional authorities and citizens in local governance and decision making. This is a source of tension and conflicting messages in relation to local governance issues
Targets:
-MMDAs, National and Regional Houses of Chiefs, MLGRD, CSOs
- xxx MMDAs initiate actions aimed at consultations with TAs
- xxx Citizen satisfaction surveys are conducted per year.
- Meeting reports
- Citizen satisfaction surveys
Risks
- Politicization of traditional leadership
- Inadequate and irregular flow of funds
Assumptions- Elected officials and
traditional leaders see the value of working collaboratively
Funding: GoG, GTZ, DANIDA, EU, DfID, the Netherlands, CIDA, USAID
Output 10.5 Indicators: - The Ministry of Local Government and
Risks Funding: UNDP
UNDAF Results Matrix: Option 2 (Outcomes and Outputs) – Nov 23

Advocacy is conducted to support the lower level government structures to fully engage in decision making and allocation of resources for fiscal decentralisation
1. Number of recommendations implemented from reviews conducted on decentralisation
2. Number of active networks of assembly members formed to advocate for improved fiscal decentralisation
Baseline:
The Local Government Act caters for the involvement of the local structures in decision making. However, in practice, the District Assemblies are not empowered to participate and their influence is still little, and the processes involved remain significantly top down
Targets:
-MGLRD, Parliament, District Assembly Common Fund, MOFEP, NDPC, MMDAs, CSOs
Rural Development report
- Records of the Department of Social Welfare of the Ministry of Employment and Social Welfare
- Lack of political will to get reforms implemented
Assumptions- CSO advocacy initiatives
are supported by an increased civic engagement at the local level
GoG, WB, DANIDA, GTZ, EU, The Netherlands, CIDA, USAID, DfID
Champion:
Office of the President
Output 10.6
Mechanisms of coordination amongst the decentralized structures (RCCs, DAs, Decentralized Department) are functional and enable transparent and accountable practices.
Indicators:
- the scores on the Functional Organizational Assessment Tool (FOAT)-the time spent in responding to queries and complains from the public
-the timeliness of response to issues between the MMDAs and ministry
- . -
Risks
Assumptions
-
UNDAF Results Matrix: Option 2 (Outcomes and Outputs) – Nov 23

Baseline:
-weak operational coordination, supervision and monitoring system in the decentralized system and this leads to poor delivery and accountability for results. The budget processes are not robust and streamlined.
Target
-MLGRD, MMDAs, RCCs
Output 10.7
Citizen participation and engagement is promoted through the application of e-governance systems
Indicators
-Number of citizens using IT means to communicate on administrative and governance issues.
-Reduction in the cost of e-governance services
Baselines
-Communication using electronic means in Ghana has significantly increased. While internet is yet to reach the remote rural communities the mobile phones have widely spread to the remotest rural areas. There is still a challenge to take full advantage of IT opportunities to address governance issues as a result of literacy and language constraints.
Targets
UNDAF Results Matrix: Option 2 (Outcomes and Outputs) – Nov 23

-Public-Private partnerships, IT firms,
Output 10.8
Learnings from the experience of CSOs are consolidated and documented to inform policy debate on decentralisation and accountability.
Indicators
-number of CSOs joining the National Umbrella
-the number of good practices documented and disseminated
-number of substantive contributions by CSOs to public policy debate.
-number of CSOs undertaking specialized trainings, e.g budget analysis
-increase in the membership of CSOs
Baseline
-there is a vibrant CSO sector in the country. In the absence of a common front or platform for coordination the CSOs movement remains fragmented. However, there is a growing evidence of successful practices with impact at both the community and policy levels.
Targets
-CSOs, Ministry of Employment and Social Welfare , Local Governance Network, Peace Building
-
UNDAF Results Matrix: Option 2 (Outcomes and Outputs) – Nov 23
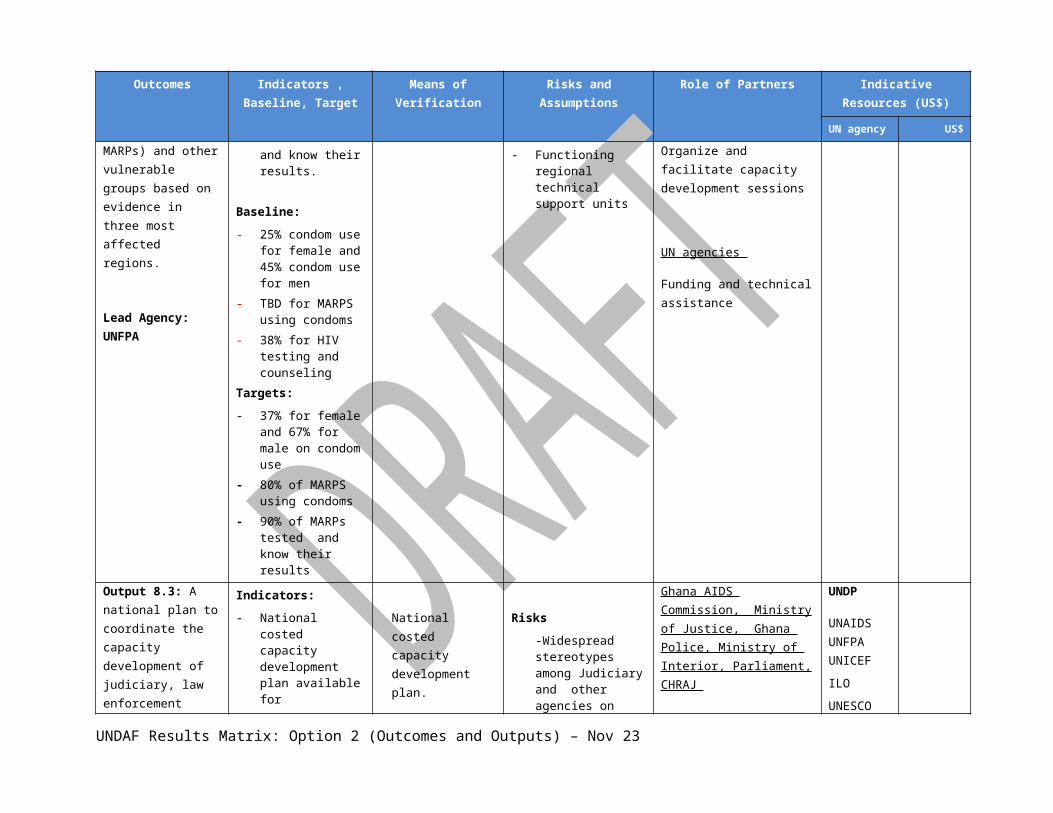
Networks, Democratic Governance Networks, Governance Think tanks, Academia, Faith based organizations, gender networks
Output 10.9The reforms of the justice sector completed and roles and responsibilities of the different agencies clarified and properly coordinated
Indicators:
- number of reforms completed
- Reduction in prisons congestions
- speed at which the police and AGs Department handle cases
-A policy on access to justice for children
-A well resourced functional juvenile justice system
-Access to legal aid for children
-Speed with which Juvenile cases are disposed of
Baseline:
- -the justice delivery system employs manual and other approaches that are not responsive to prevailing circumstances.
-challenges include poor case management, poor coordination of
- Reports of the Ministry of Justice
- Reports of human rights organisations
- Police records- Reports of the
Juvenile Justice Administration
Risks
- Silos culture of the justice delivery institutions
Assumptions
- The high level dialogue holds together institutions in the justice delivery system
Funding:
GoG, GTZ, DANIDA, CIDA, EU, The Netherlands, AFD
Technical Expertise:
Academic and training institutions, CSOs, Ghana Bar Association
UNDP
UNICEF USD 1 million
UNDAF Results Matrix: Option 2 (Outcomes and Outputs) – Nov 23

prosecution amongst the Police and AG’s Department and lack of alternative sentencing which has resulted in prison congestion amongst others
--Proposed reforms include decoupling of the AG’s Department from the Ministry of Justice
Targets:
-the Ministry of justice, the Ministry of the Interior ( the Police, Prisons Service) Judicial Service, CHRAJ, Legal Aid Scheme, the Ghana Bar Association
Output 10.10
Key Personnel of the Justice delivery sector are trained in essential skills and processes to deliver effectively and efficiently under the reformed justice system
Indicators:
-Number of attorneys trained in specialized areas -number of specialized training modules developed and trainings conducted for attorneys -increased public confidence in the professional handling of cases by state attorneys-Key personnel of Juvenile Justice system deliver efficient legal services for children
-Child victims and witnesses treated at par with international standards on access to
- Training reports- Participants lists- Training manuals- Citizen
satisfaction surveys
Risks
- Brain drain-Assumptions
- Conditions of service continually improves and contributes to the retention of qualified professionals in the field of justice
Funding:
GoG, Commonwealth Secretariat
Technical Expertise:
Training firms
UNDP
UNICEF USD 1.5 million
UNDAF Results Matrix: Option 2 (Outcomes and Outputs) – Nov 23

justice for children
Baseline:
-presently there is a paucity of qualified professionals to perform the roles of prosecution, case investigations, law administration and other functions pertaining to the delivery of justice.
Targets:
-in-service training for attorneys in specialised area-the School of Law and Faculties of Law.
Output 10.11
Citizens especially vulnerable groups sensitised on their rights and duties in relation to the justice system
Indicators:
-number of functional literacy resources with the focus on human rights.-levels of budget allocations to civic education programmes.
Baseline:-the unstructured civic education programmes result in low awareness by vulnerable groups on their rights and means to access justice. Support services to resolve this issue are limited or ineffective. Targets:
-NCCE, CSOs MOWAC,
- Adult literacy and IEC materials
- National and local budgets
Risks
- Lack of interest in rights and civic education programmes
Assumptions
- The government increases its budgetary allocation to NCCE to undertake its Constitutional mandate
Funding: GoG UNICEF
UNDP UNESCO UNFPA UNIFEM
USD 1 million
UNDAF Results Matrix: Option 2 (Outcomes and Outputs) – Nov 23

NCPD, Media, FBOs, Ministry of Justice and AG’s Department
Output 10.12
A well resourced functional justice system provides Improved access to justice for vulnerable groups, in particular for children, and efficient service delivery including juvenile justice
Indicators:
- A policy on access to justice for children
- Access to legal aid for children
- Speed with which Juvenile cases are disposed of
- Percentage increase of children accessing the justice system
- Key personnel of Juvenile Justice system deliver efficient legal services for children
- Child victims and witnesses treated at par with international standards on access to justice for children
Baseline:
- Under resourced juvenile justice administration.
Targets:
- xx- xx
- Reports of the Ministry of Justice
- Reports of human rights organisations
- Police records- Reports of the
Juvenile Justice Adminstration
Risks
- Silos culture of the justice delivery institutions
Assumptions
- The high level dialogue holds together institutions in the justice delivery system
Dept of Social Welfare
MoJ
Ghana Police
DOVVSU
Legal Aid Board
UNICEF 3,000,000
Output 10.13: MOWAC capacity enhanced to coordinate and monitor the implementation of the gender policy and the national action plan and to report on
Indicators:
1 1. No of sectors with gender policies and action plans
2 2. No of districts with gender action plans
3 3. Timely submission
- 1. MOWAC APR- 2. National APR- 3. Reports on
implementation of International treaties and conventions (MDGs, CEDAW, BPFA,
Risks
- Staff attrition- Ethnic violence in
districts
Assumptions
- Political will to
- MOWAC,MDAs MMDAs, Quasi Government institutions, Academia, Private sector including CSOs, Parliament, Cabinet
Output 23.1: MOWAC capacity enhanced to coordinate and monitor the implementation of the gender
UNDAF Results Matrix: Option 2 (Outcomes and Outputs) – Nov 23

international treaties on Gender Equality and Women Empowerment in collaboration with key stakeholders
of 4. 4 key reports prepared and disseminated by 2016
Baseline: xxx of MDAs (2010) with gender policies and action plans
- Xxx districts with gender action plans
Targets: All MDAs and 50% of MMDAs
-
AWD). promote gender mainstreaming
- Adequate resources allocated to implement gender mainstreaming in MDAs and MMDAs
policy and the national action plan and to report on international treaties on Gender Equality and Women Empowerment in collaboration with key stakeholders
Output 10.14: By 2013, a National Action Plan (NPA) for implementing the National Gender Policy is in place with inputs from all MDAs and other key stakeholders
Indicators: National Action Plan printed and disseminated
Baseline: MOWAC Sector Medium Term Plan 2010-2013 and 2005 National gender Policy
Targets: NPA to be available in print by 2012
- National Action Plan Risks:
The Gender policy will not be reviewed in 2011
Assumptions
- MDAs will be capable of contributing to the preparation of the NPA Xx
MOWAC , MDAs, CSOs and other stakeholders
-
Output 10.15: Updated Affirmative Action (AA) policy guidelines disseminated by MOWAC by 2014
Indicators: Updated AA Policy guidelines
Baseline: 1998 AA policy guideline and APRM report
Targets: Updated AA Policy guidelines by 2014
- Xx
- MOWAC APR Risks
- MOWAc will not have the capacity and the resources to push through an updated and disseminate the AA guidelines Xx
Assumptions
- AA policy guidelines will be adopted by government
MOWAC, Electoral Commission, Cabinet Parliament and CSOs
Output 10.16: Strategic alliances with the private sector,
Indicators: No. of partnerships established
- MOUs and MOWAC APR
Risks
- An MOU is not legally binding and parties
- MOWAC (DOW) identifies potential partners within the Private sector
UNDAF Results Matrix: Option 2 (Outcomes and Outputs) – Nov 23
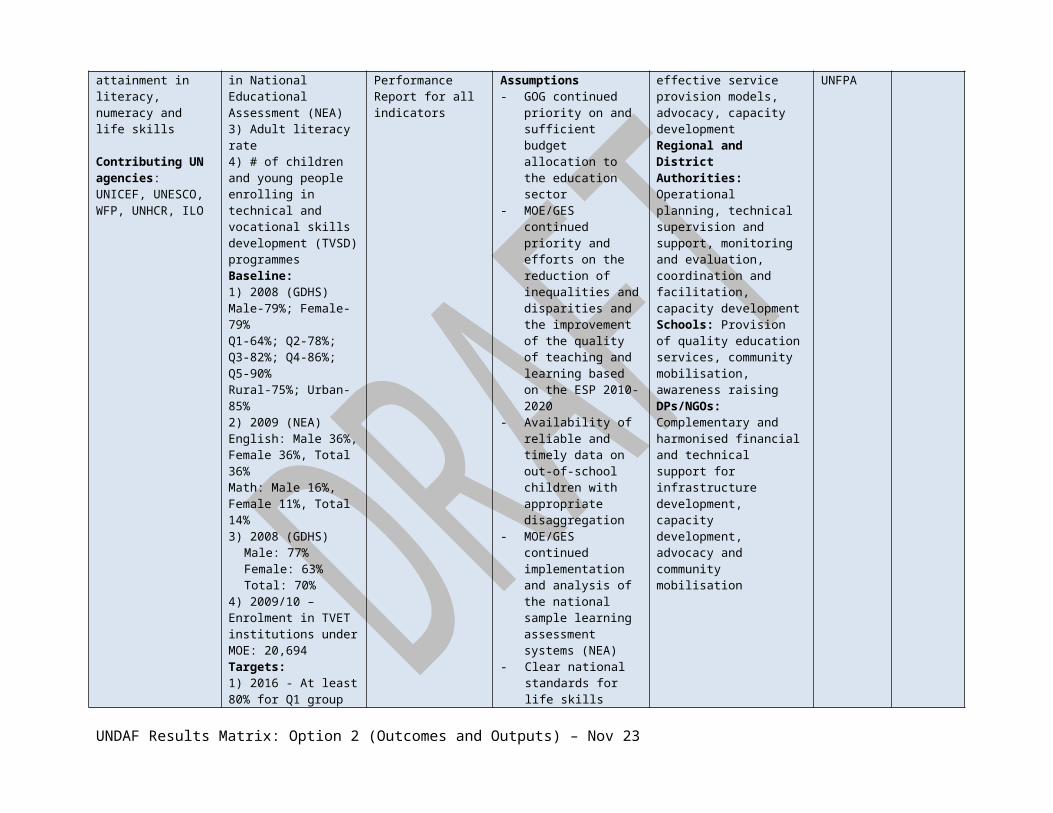
NGOs/CSOs leaders established for advocacy and resource mobilisation to enable MOWAC to address poverty reduction, gender equality and women’s empowerment by 2014
Baseline: 0
Targets: 2 MOUs signed
-
may not fulfill their commitments
Assumptions
- MOWAC is interested in partnerships for resource mobilisation
including NGOs and CSOs for partnerships
Output 10.17
The National Peace Council is restructured and resourced to conduct assessment and to design conflicts management responses
Indicators:
- The percentage increase in the number of conflicts prevented, resolved or mediated by the NPC.
- Number of assessments conducted by NPC that feed into conflict prevention
- Regular and accurate update of information amongst NPC structures
Baseline:
-the process of legal institutionalization of the National Peace Council is under way.
-the law institutionalizing the NPC will strengthen its mandate and inform its operational structures
-Regional Peace councils have been set up in only 4 Regions of Ghana out of 10
Programme and project reports and evaluations
Government and CSO (academia and media) publications.-quarterly reports submitted
Assessments and mapping of conflict risks conducted in number of regions
Risks
-Political interference in the functioning of the NPC
-appointment of unqualified staff,
Assumptions
- The Government will continue to take the NPC as a priority.
Funding:
GoG, UNDP, DFID, BCPR, Swiss Cooperation, SIDA,
Technical Expertise
Academia, local and regional CSOs, UNDP, BCPR
Advocacy
Parliament, CSOs, Media, Peace promoters/ambassador s
UNDP
UNDAF Results Matrix: Option 2 (Outcomes and Outputs) – Nov 23

--weak coordination mechanisms between the agencies and the human resources constraints within the NPC (professional skills, mediation, conflict management, negotiation)
Targets:
- Xxx New staff structure for NPC
- Xxx Staff training in specialised skills
- Xxx Operationalise coordination mechanisms
- Xxx f conflicts prevented or resolved /mediated
- Xx x Assessments conducted
Output 10.18
UNCT has mainstreamed conflict prevention in programming.
Indicators:
-frequency of consultations and discussions on conflict sensitive approaches by heads of agencies
-harmonized conflict sensitive programming guide in place
Baseline:
-No Ghana UNCT wide guidelines for conflict sensitive programming
Targets:
-harmonization and
- Joint programming documents.
- Reports on joint integrated planning meetings
- Joint assessment reports
RISKS- Silos culture within
UNCTAssumptions
- Government will continue to insist on UN to Deliver as One
All UN Agencies
UNDAF Results Matrix: Option 2 (Outcomes and Outputs) – Nov 23

adaptation of existing conflict sensitive programming tools for UNCT by 2013
- Xxx Coordination meetings held
- Xxx Guidelines produced
Output 10.19
Legislators and policy makers are conflict -sensitive and mainstream it in policies and laws at national and local levels.
Indicators:
-number of laws and policies reviewed for conflict sensitive
-Number of training sessions to the leaders of parliamentary committees
-number and quality of research papers or reports by the Research Department of Parliament.
Baseline:
-overlaps and gaps in legislations in some thematic areas
-laws and policies are not backed by adequate and conflict sensitive research and analyses
Targets:
- Train leaders of parliamentary committees in conflict sensitive programming
- Review xxxx laws and
- The government gazette, parliamentary hansard
- Training report, - Research papers
published
Risks
- Repercussions of high turnover of parliamentarian due to elections
Assumptions
- Conflicts are not politicized along ethnic and party lines
Research and development: academic institutions, research department of Parliament, governance think tanks
Dissemination of information: media, parliamentary press corps
UNDAF Results Matrix: Option 2 (Outcomes and Outputs) – Nov 23

policies- Xxx training session
for Lead Parliamentarians
- Produce xxxx research papers.
UNDAF Results Matrix: Option 2 (Outcomes and Outputs) – Nov 23

Outcomes Indicators , Baseline, Target
Means of Verification Risks and Assumptions Role of Partners Indicative Resources (US$)
UN agency US$
Outcome 11: MDAs, the National Population Council, local Governments and CSOs have effectively developed, funded, coordinated and implemented national and sectoral policies, plans and programmes aimed at reducing poverty and inequalities, and promoting inclusive socio-economic growth by 2016.
Indicators:
Number of Development Policies and Plans that are informed by disaggregated socio-economic data
Number of MDAs implementing Public Sector Reform Agenda
MDAs implementing programme-based budgeting
Number of evaluations
Number of analytical studiesProportion of population below the poverty lineHDI value
No. Of state and non-state actors participating in socio-economic development processes at the local levelPercentage of population in districts living below the poverty line (disaggregated by gender)
- New Population Policy
Targets:
- All MDAs and
- Ghana Living Standard Survey
- MDG Report- Human
Development Reports
- Annual Progress Reports
- Sector Reports - GhanaInfo- Public hearing
records on district assembly plans
- District Human Development Report
- District Medium Term Plans
- District revenue reports
- Population policies approved by Parliament
Risks
- Global Shocks- Conflict - Change in government
and/or policy direction - Negative impact of
climate change
Assumptions
- Effective partner and collaboration with government
- HD sectors achieve targets
- Political stability - Government
commitment to use disaggregated data for development policy, planning and management.
- Government commitment to the implementation of decentralization agenda
- Effective Delivering as One UN, including timely release of funds from UN agencies
- NDPC-, MOFEP, GSS, MESW, MOWAC, MOTI, MOFA, NPC, MOT, MOCC, MOH, MOE.
- MDAs use outcomes of studies and analysis reports to prepare policies, plans and budgets
- MDAs adopt PBB format and processes to formulate budgets after 2011
- MLGRD, MoFEP, Selected MMDAs, Selected Communities, Private Sector, CSOs, Local Government Services
- Related to population: NPC, MOWAC and GHS, MOFEP, NDPC. In collaboration with the above listed Ministries and agencies, NPC is to lead the coordination of the implementation of the national population policy
UNDP
UNFPA
UNICEF
UNESCO
IOM
WHO
WFP
UNDAF Results Matrix: Option 2 (Outcomes and Outputs) – Nov 23

Outcomes Indicators , Baseline, Target
Means of Verification Risks and Assumptions Role of Partners Indicative Resources (US$)
UN agency US$
relevant CSOs- All MDAs begin
implementing PBB by end of 2012
- At least 25.8% 0.5
- Minimum of 42 Districts
- A new National Population Policy is produced by 2016
Baseline:
- None- None- Two MDAS piloting
PBB- None- 28.5% (MDGR 2010)- 0.467- A 1994 Population
Policy revised from the original 1969 Policy
Output 11.1: Data information management system collects and makes available gender, location, age, etc socio-economic data for evidence- based policy
Indicators:
4 Number of data sets disaggregated by the agreed parameters.
Baseline:
- NoneTargets:
- Ghana Living Standard Survey
- MDG Report- Human
Development Reports
- Annual Progress Reports
Risks
- Staff attrition - Shift in government
policy focusAssumptions
- Government commitment to use disaggregated data for
- Xx- Xx
UNDAF Results Matrix: Option 2 (Outcomes and Outputs) – Nov 23
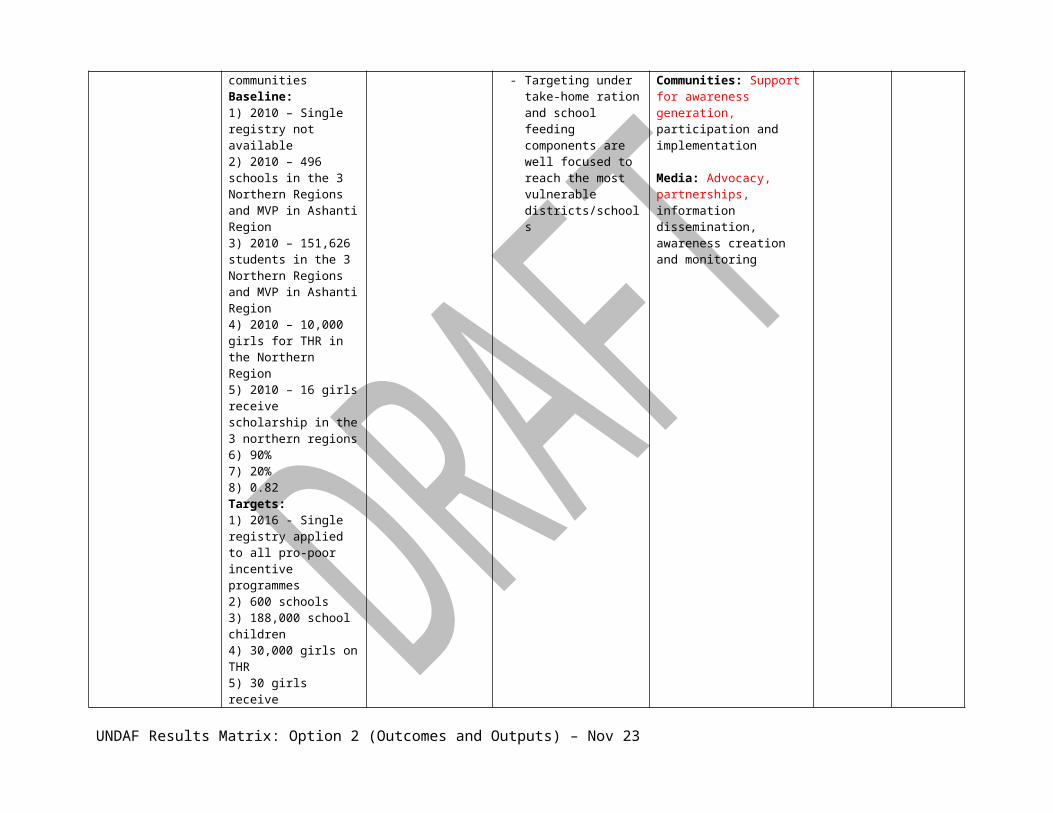
Outcomes Indicators , Baseline, Target
Means of Verification Risks and Assumptions Role of Partners Indicative Resources (US$)
UN agency US$
making and management - All data sets disaggregated by agreed minimum parameters
- Sector Reports - GhanaInfo
development policy, planning and management.
Output 11.2: Provide support and/or make available policy advice and advocacy to MDAs supported by regular evidence-based analytical work
Indicators:
5 Number of relevant analytical works/ study reports prepared and disseminated
6 Inter-disciplinary and sectoral dialogue and dissemination platforms created
Baseline:
- XxTargets:
Xx
- -
Output 11.3: National institutions equipped with data, information and skills for development policy formulation, planning, economic and resource management.
Indicators:
7 Proportion of GAP SP implemented
8 No. of MDAs that have implemented Public Sector Reform agenda
9 Number of MDAs implementing Programme Based Budgeting
10Baseline: TBD
- Xx
- Staff attrition from the MDAs
- Sector / MDA Budget proposals
Work environment facilitates use of skills for management of data management system
- GSS, MoFEP, NDPC, Parliament, Office of President
UNDAF Results Matrix: Option 2 (Outcomes and Outputs) – Nov 23

Outcomes Indicators , Baseline, Target
Means of Verification Risks and Assumptions Role of Partners Indicative Resources (US$)
UN agency US$
Targets: TBD
Xx
Output 11.4:
Technical and financial capacities of at least 42 local governments across the country strengthened to plan and deliver socio-economic services and promote economic development and gainful employment by 2016.
Indicators:
- Percent increased in employment rate in the selected MMDAs.
- Proportion of heads of household and contributing family workers in gainful employment (disaggregated by gender).
- Number of MMDAs with LED and MDG-focused Medium Term Development Plan
- Percentage of youth and women in gainful employment.
- Number of Medium Term Development Plans that are CAP-focused
- Number of multi-stakeholder LED platform operational.
Baseline:
-Targets:
- MMDAs Annual Progress Reports
- District Human Development Report
- MMDAs Medium Term Development Plans
Risks
- Staff Attrition- Conflict (chieftaincy,
land, ethnic, religious)-Assumptions
- Effect Implementation of Local Government Service LI
- Private sector and communities taking advantage of opportunities created.
- Strong political commitment and leadership.
- Xx- Xx
Output 11.5: Disadvantaged
Indicators: - -
UNDAF Results Matrix: Option 2 (Outcomes and Outputs) – Nov 23

Outcomes Indicators , Baseline, Target
Means of Verification Risks and Assumptions Role of Partners Indicative Resources (US$)
UN agency US$
communities in the 42 selected districts are able to participate in the planning, delivery, and management of socio-economic services and economic development by end 2015.
- Number of communities with community action plans
- Number of community action plans implemented
- Percentage of youth and women in gainful employment Proportion of heads of household and contributing family workers in gainful employment
Baseline:
-Targets:
Output 11.6: Legal and regulatory framework to attract private sector investment and participation in local economic development are put in place in the target districts by 2014.
Indicator:
- The progress of legal and regulatory framework development
Baseline:
- ?
Target:
- The framework is approved and passed Cabinet
- The Framework- Meeting reports
Risk:
Change of government and change of policy direction
Assumptions:
-Process Participatory
-Policy framework attractive/acceptable to all partners private sector
-
-
Output 11.7: Harmonized approach to
Indicator:
- Fiscal
- Physical presence of the secretariat.
Risks:
In ability of the two key
-
UNDAF Results Matrix: Option 2 (Outcomes and Outputs) – Nov 23

Outcomes Indicators , Baseline, Target
Means of Verification Risks and Assumptions Role of Partners Indicative Resources (US$)
UN agency US$
fiscal decentralization put in place by 2014.
Decentralization fully operational in the selected MMDAs
- Unified fiscal decentralization established
- Number of MMDAs receiving direct development budget from national level.
Baseline:
Fiscal decentralization currently being run by two separate institutions (MoFEP & MLGRD).
Target:
One unified body implementing the fiscal decentralization agenda.
- ministries to work together.
Assumptions:
Strong government commitment to fiscal decentralization agenda.
Output 11.8: alternative financial sources for district economic development established in 10 pilot districts by end 2016.
Indicators:
- Number of pilot MMDAs with alternative financial sources for implantation of LED strategies
Baseline:
- Zero (0)Targets:
- LED implementation reports Assumption:
Transparent and accountable financial management systems in place.
-
Output 11.9: National level Inter-sectoral and
LED Advisory Council and Technical Committee
- Reports and minutes of meetings
Assumption
Commitment and capacity to
-
UNDAF Results Matrix: Option 2 (Outcomes and Outputs) – Nov 23

Outcomes Indicators , Baseline, Target
Means of Verification Risks and Assumptions Role of Partners Indicative Resources (US$)
UN agency US$
interagency coordination put in place for improved service delivery and local economic development by 2015.
operational.
National LED Platform operational.
UN Delivering as One in support of LED
Inter Agency Theme Group on Local Level Development established
- M&E Reports--
deliver as one by UN and Government
Donor support for the DaO agenda
Output 11.10 Partnerships developed between the private sector and Ghanaian Diaspora and the 42 selected districts by 2016
Indicators:
- Number of private sector and Diaspora investments per MMDA.
- Size of invest (value) per district
- Number of PPPs established by type.
Baseline:
Target:
Project and M&E Projects
DHDR
Annual District Progress Reports
PPP projects
Risks
Failure of private sector and opportunities to take up the opportunities created.
Assumptions
National and level have capacity to create enabling environment
-
Output 11.11
An updated National Population Policy is formulated by NPC to adequately address population and
Indicators:
- A National Population Policy incorporating current and emerging issues.
Next national development policy framework
-Approved
Risks
- Inadequate staff capacity
Assumptions
- Stable political environment
NPC, will to prepare a justification as well as lead the advocacy for the revision of the Population policy with all relevant stakeholders.
UNDAF Results Matrix: Option 2 (Outcomes and Outputs) – Nov 23

Outcomes Indicators , Baseline, Target
Means of Verification Risks and Assumptions Role of Partners Indicative Resources (US$)
UN agency US$
development issues. - A National Population Action Plan
- National Population Programme Coordination Framework
Baseline:
- 1994 Revised National Population Policy
- 1994 Population Action Plan
Targets:
- Revised National Population Policy by 2014
- Population Action Plan by 2016
- National Population Programme Coordination Framework by 2014
National Population Policy by government
- Action Plan andCoordination Framework produced by NPC
- M&E Reports from NPC
- Macroeconomic stability (inflation)
NPC will also lead the development of the national population action plan as well as the framework for the coordination of the implementation of the plan
Futures Group,
NDPC, MOH, GHS, GSS, MLGRD, MEST, MOE, GES, MOFA, DAs, MESW
The above ministries and agencies make relevant inputs into the revision of the national population policy as well the development of both the action plan and the coordination framework
Output 11.12
National Population Council has adequate and competent human resources to coordinate population programmes at national, regional and district levels by 2016.
Indicators:
-Staff establishment for the National Secretariat and 10 Regional Offices defined
-Staff recruited to take defined roles
-Staff trained in Population and Development
- Training Workshop Reports
- NPC Annual Reports
- Institutional and Technical Assessment Report
Risks
- staff turnover after being trained
- Timely released of funds from UN supporting agencies for training
Assumptions
partners :
NPC,
RIPS, ISSER, Centre for Social Policy Analysis, GIMPA, KNUST, MOFEP to undertake training of required staff;
UNDAF Results Matrix: Option 2 (Outcomes and Outputs) – Nov 23
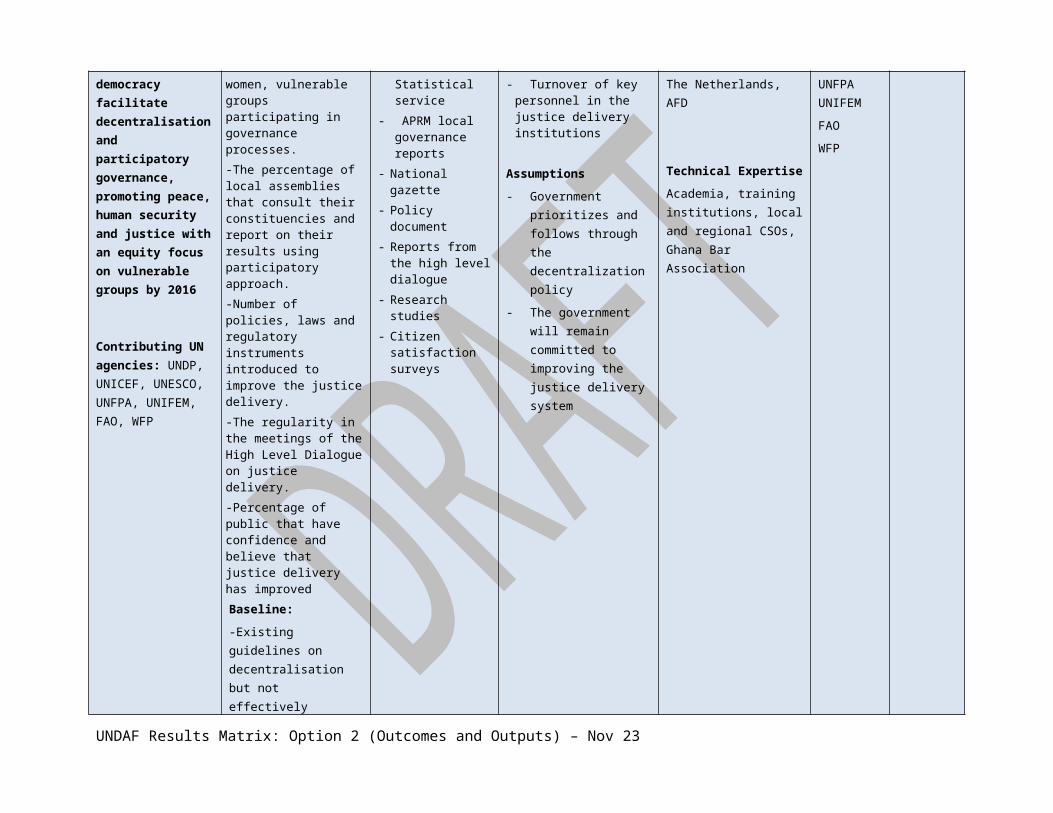
Outcomes Indicators , Baseline, Target
Means of Verification Risks and Assumptions Role of Partners Indicative Resources (US$)
UN agency US$
Baseline:
- 2010 NPC technical staff of 34 is inadequate in both number and skills mix
Targets:
-50 technical staff to be trained by 2016
-Establishment defined by 2012
- Staff recruited
Output 11.13 Strengthened National Population Council to effectively coordinate family planning activities at community, district, regional and national levels
Indicators:
- Measurable and time bound action plans for national, regional district levels drawn up;
- Regular monthly, quarterly and annual coordination meetings established
Baseline:
- Existing Roadmap for FP not time-bound and clearly targeted to the different levels
- Targets:- Action plans for all
the three levels
- NPC Annual reports
- Sector Annual Plans and Reports
- Ineffective harmonization of the activities of public and private sector agencies in implementing family planning programmes
partners :
NPC, MOFEP, GHS, MOH, MOE, GES, MOFA, MOWAC, GMA
UNDAF Results Matrix: Option 2 (Outcomes and Outputs) – Nov 23

Outcomes Indicators , Baseline, Target
Means of Verification Risks and Assumptions Role of Partners Indicative Resources (US$)
UN agency US$
being implemented by 2016
- Regular meetings established by end of 2012
Output 11.14
Improved policy environment for coordinating migration and development activities by 2016
Government partners: Ministry of Interior, NPC, Immigration Services, Ministry of Foreign Affairs and regional Integration, NDPC,
Indicators:
- National Migration and Development Policy.
- Relevant sector plans incorporating migration issues
Baseline:
- Existing sector policies on migration
Targets:
- National Migration and Development Policy by 2016
National and migration development policy
- Inadequate data on migration
- Full cooperation of all stakeholders and partners
Outcomes Indicators , Baseline, Target
Means of Verification
Risks and Assumptions Role of Partners Indicative Resources (US$)
UN agency US$
Outcome 12:
By 2016, GoG policy, planning and budgeting processes at both, national and sub-national level, are evidence-based, informed by functional RBM and
Indicators:
11 All MDAs have robust planning and M&E strategies that follow the Planning and M&E guidelines
12 50% of MMDAs have planning and M&E
- Reports of key Evaluations, studies and Surveys
- Formal routine data submissions from MDAs to
Risks
- Lack of resources, both financial and human, to fully implement the proposed activities
- Timely and continuous release of funds from Government and DPs
- The NDPC will continue to strengthen the M&E function whose key objectives is: tracking progress and results of the medium-term development plan (results matrix), coordinating MDAs and
UNICEF
UNDP
UNFPA
WHO
FAO
UNESCO
3,000,000
UNDAF Results Matrix: Option 2 (Outcomes and Outputs) – Nov 23

M&E systems, with a focus on disaggregated population and development data.
Contributing UN agencies: UNDP, UNFPA, UNICEF, WHO, UNESCO, WFP, FAO, UNIFEM
strategies that follows the Planning and M&E guidelines
13 NDPC, all MDAs and 50% of MMDAs prepare Annual Reports consistent with AR Guidelines, and disseminates them on a timely basis
14 Proportion of MDAs plans and budgets that are evidence based, gender and child sensitive
15 Number of Evaluations conducted through consultations with partners and TWGs
16 All data from the census, surveys and routine sources, to the extent possible are disaggregated by sex, age, income, geography and other variables
17 Ghanainfo and IMIS databases are updated with current data on a regular basis
- Planning guidelines incorporate process of integration of population variables
- Manuals on integration of population variables for national and sub national levels produced/improved.
GSS and NDPC for Annual Reporting
- Setoral M&E plans, budgets and annual reports
- NDPC monitoring framework, Annual and Mid-term reports
- GhanaInfo and IMIS databases
- SMTDPs and reports
to support M&E and statistics activities
- High staff turnover within the government hinders systematic capacity development
- Non-availability of relevant district data
Assumptions
- The Reform agenda to improve the functioning of GSS is implemented
- Increased funding for strengthening M&E and Statistics in the country from national budgetary allocation
- Data collection methods increasingly allow adequate disaggregation by sex, geography and other variables to provide equity-focus
- National and local authorities and institutions committed to data driven/evidence based policy development and decision-making
- NDPC will position itself strategically to influence Cabinet, Parliament, MDAs,
MMDAs to regularly track progress of the Sector and district plans, build capacity in M&E and address constraints in resources allocated to M&E and statistics.
- The Ghana Statistical Service (GSS) and MDAs will continue to roll-out the National Statistical Development Plans, in order to strengthen the national statistics system and address data issues
- Development partners (DPs) will provide complementary and harmonized technical and financial support and continue to align with government systems and harmonise their approaches
- Academic Institutions will conduct further data analysis, operational research, studies, evaluations, capacity building to strengthen the use of evidence in the country
- Non-governmental organizations will work closely with citizens on advocacy and community mobilization to ensure citizens hold duty-bearers accountable for development and poverty reduction
- NPC uses data
UNIFEM
UNDAF Results Matrix: Option 2 (Outcomes and Outputs) – Nov 23

Baseline:
- Xxx
- Current level of integration of population variables in the GSGDA,18 sector, and 170 district plans
Targets:
- Xxx
-Next National Development Policy Framework
-All 18 sectors and 170 district level plans
incorporating population and development linkages by 2016
MMDAs and other stakeholders to spearhead the planning and M&E processes
- MoF will facilitate the implementation of programme-based budgeting
- Stable political environment
- Macroeconomic stability (inflation)
Institute of Local Government Studies, UD S, UCC, GIMPA, NDPC,KNUST,RIPS, GSS, PIP, NDPC, NPC, ISSER, Centre for Migration Studies
Output 12.1: The Ghana Statistical Service (GSS) and key sectors and agencies have enhanced capacities to collect, analyze and utilize disaggregated information (sex, age, geography, target populations, and other relevant variables) on a timely basis
Indicators:
18 Key National Surveys identified in the long-term survey calendar (supported by UN) are conducted and results disseminated within one year of data collection
19 Key MDAs collect, analyze and report on data from routine data sources on an annual basis
20 All data from the census, surveys and
- Published Survey reports
- Formal routine data submissions from MDAs to GSS and NDPC for Annual Reporting
- GhanaInfo and IMIS databases
Risks
- Lack of resource to fully operationalize the long-term survey plan
- Timely and continuous release of funds from contributing UN agencies to support surveys
- High staff turnover within the government hinders systematic capacity development
Assumptions
- Government, through MoF, NDPC, GSS and other MDAs/MMDAs – policy formulation, resource mobilization, allocation, implementation and monitoring of the medium-term development plan, capacity building and skills development at all levels
- The Ghana Statistical Service (GSS) and MDAs will continue to roll-out the National Statistical
UNICEF
UNDP
UNFPA
WHO
FAO
UNESCO
2,500,000
UNDAF Results Matrix: Option 2 (Outcomes and Outputs) – Nov 23

routine sources, to the extent possible are disaggregated by sex, age, income, geography and other variables
21 Ghanainfo and IMIS databases are updated with current data on a regular basis
Baselines:
- 2010 National Census ongoing and will be completed in 2012
- MICS 2011 results available in 2012
- Survey Calendar identifies key survey for 2010-2025. These includes GLSS (2012), DHS (2013), Labourforce Survey/Child Labour (2012)
- GhanaInfo has outdated data for lack of regular supply of routine data;
- IMIS suffers from same problem as GhanaInfo in relation to primary data;
Targets: (timescales - annual)
- Complete census analysis by 2012
- Results of 2011 MICS released
- Key surveys DHS, GLSS, Labourforce conducted as per
- The Reform agenda to improve the functioning of GSS is implemented
- Increased funding for data strengthening in the country from national budgetary allocation
- Data collection methods used increasingly allow adequate disaggregation by sex, geography and other variables to provide equity-focus
-
Development Plans, in order to strengthen the national statistics system and address data issues
- Development partners (DPs) will provide complementary and harmonized technical and financial support and continue to align with government systems and harmonise their approaches
- Non-governmental organizations will utilize information generated for their advocacy and community mobilization work
UNDAF Results Matrix: Option 2 (Outcomes and Outputs) – Nov 23

schedule- Carry out EmONC
survey 2015- MoH, MoE produce
annual statistics report (???)
- Undertake SPA 2014 - GhanaInfo and IMIS
databases updated quarterly
Output 12.2: Strengthened capacity at national and sub-national levels to coordinate, facilitate, plan, monitor and evaluate policies and plans that are responsive to the needs of the people and incorporate priority population, poverty and development linkages (Government’s medium-term development plan by 2013, and new Govt plan, 2014+)
Indicators:
22 All MDAs have robust planning and M&E strategies that follows the Planning and M&E guidelines
23 50% of MMDAs have planning and M&E strategies that follows the Planning and M&E guidelines
24 All MDAs and 50% of MMDAs prepare Annual Reports consistent with AR Guidelines
25 M&E strategy for Social Protection developed
26 NDPC prepares the Annual Progress Report and disseminates it on a timely basis
27 Proportion of MDAs plans and budgets that are evidence based, gender and child sensitive
28 Number of evaluations
- Setoral plans, budgets and annual reports
- NDPC monitoring framework, Annual and Mid-term reports
- Evaluation Reports
Risks
- Lack of resources, both financial and human, to fully implement the proposed activities
- High staff turnover within the government hinders systematic capacity development
Assumptions
- Government commitment and political will to implement the National plans and systems
- National and local authorities and institutions committed to data driven/evidence based policy development and decision-making
- NDPC will position itself strategically to influence Cabinet, Parliament, MDAs, MMDAs and other stakeholders to
- The NDPC will continue to strengthen the M&E function whose key objectives is: tracking progress and results of the medium-term development plan (results matrix), Coordinating MDAs and MMDAs to regularly track progress of the Sector and district plans, build capacity in M&E and address constraints in resources allocated to M&E and statistics.
- Development partners (DPs) will provide complementary and harmonized technical and financial support and continue to align with government systems and harmonise their approaches
- Academic Institutions – further data analysis, operational research, studies, evaluations, capacity building
- Non-governmental
UNICEF
UNDP
UNFPA
WHO
FAO
UNESCO
500,000
UNDAF Results Matrix: Option 2 (Outcomes and Outputs) – Nov 23

conducted through consultations with partners and TWGs
29Baseline:
- XxTargets: (timescales - annual)
Xx
spearhead the planning and M&E processes
organizations will work closely with citizens on advocacy and community mobilization to ensure citizens hold duty-bearers accountable for development and poverty reduction
Output 12.3: Joint M&E strategy for Delivering as One by all participating UN agencies developed to assess progress towards the achievement of the stated outcomes in UNDAF
Indicators:
30 A common IMEP (Integrated Monitoring and Evaluation Plan) for the UN is prepared
31 Annual Reviews conducted with Government and other partners
32 Annual Report on status of implementation prepared
33 UN M&E Group convenes meetings on a Quarterly basis to discuss progress on UNDAF implementation
34 GhanaInfo/IMIS database updated and re-launched half/yearly
.
Baseline:
- XxTargets: (timescales - annual)
- UN IMEP- Annual Review
Reports- Minutes of
Quarterly meetings
- Government through NDPC, GSS and MDAs/MMDAs, work closely with the UN to ensure a harmonized and coordinated approach to implementation
UNICEF
UNDP
UNFPA
WHO
FAO
UNESCO
500,000
UNDAF Results Matrix: Option 2 (Outcomes and Outputs) – Nov 23

Xx
Output 12.4:
Strengthened capacity of national institutions, sector ministries and district assemblies to integrate population variables into national development policies and programmes by 2016.
Indicators:
- The sequel to the GSGDA have integrated population variables
- Number of sector and district plans integrating population variables
Baseline:
- Current level of integration of population variables in the GSGDA,18 sector, and 170 district plans
Targets:
- 50% of districts with integrated population and development variables in their plans
- All sector plans have integrated population and development variables
-The extant national policy framework and plans
-Sector plans
-District plans
Risk
-Attrition rate of trained staff;
Availability of logistics- Availability of district
data
NPC produces relevant fact sheets; NDPC ensures use of manuals and guidelines;
GSS produces censuses and sample surveys,
Research and Teaching Institutions undertake relevant research (Institute of Local Government Studies, University for Development Studies,
University of Cape Coast, GIMPA, KNUST, RIPS);
UNFPA
UNICEF
UNDP
WFP
UNESCO
Output 12.5:
Strengthened statistical and data institutions to produce timely, accurate, and reliable age, sex, gender and spatially disaggregated population and development data for policies and plans at all levels.
Indicators:
- Ghana and Demographic Health Survey (GDHS) final reports
- District, Regional and National Population Profiles
- Policy Briefs and Fact Sheets
Baseline:
- Fact Sheets- Policy Briefs and
Reports- Sector Reports - NPC Annual
Plans
partners GSS, PIP, RIPS, ISSER, Centre for Migration Studies
UNDAF Results Matrix: Option 2 (Outcomes and Outputs) – Nov 23

- 2008 GDHS final report- 2000 Population and
Housing Census - Sector Annual Reports
and Plans
Targets:
- 2013 GDHS- 80 District Population
Profiles by 2016- 10 publications each of
Population and Development Policy Briefs and Fact Sheets by 2016.
Output 12.6: GSS, MDAs, MMDAs and Gender Statistics Working Group (GSWG) increase knowledge for collecting, analysing and utilising sex/gender disaggregated data (S/GDD) for evidence based planning and M&E
Indicators: sex disaggregated data in M&E plans in MDAs and MMDAs
Baseline: 2009 M&E plans (no.)
Targets:All MDAs and 50% MMDAs
-
- Sector and MMDAs APR reflect sex disaggregated data
Risks
- GSS will not be able sustain the GSWG
Assumptions
- from 2011, MDAs and MMDS will start preparing and implementing M&E plans
- MDAs amd MMDAs to collect and use S/GDD GWSG to provide technical support
Output 12.7: By 2013, a decentralized National M & E system for HIV and AIDS, with harmonized resource tracking in place.
Lead Agency: UNAIDS
Indicators:
- M& E operational plan available for implementation by 2011.
- No. of districts with functional M&E systems by 2013.
- No. of regions and districts submitting quarterly HIV reports using country
M & operational plan.
District reports on M& E activities conducted.
Risks:
- High Staff attrition rate at the district level
-Insufficient funds to implement, M&E at the lowest level
. Assumptions:
-Adequate resources are allocated for the national M&E system
Ghana AIDS Commission:
Coordination, capacity development, development of tools and guidelines
Ministry of Health /Ghana health Service:
Monitor the Health sector
UNAIDS
UNICEF UNFPA WHO
UNDAF Results Matrix: Option 2 (Outcomes and Outputs) – Nov 23

Response Information system (CRIS).
- Expenditure tracking tool developed and incorporated with CRIS.
-Existence of relevant infrastructure
-Commitment at the district and regional level to implement the M&E plan.
response, capacity building, HIV estimation and projection, HIV surveillance and drug resistance monitoring
UNDAF Results Matrix: Option 2 (Outcomes and Outputs) – Nov 23