unclassified iiiilfflffllfflffllf apr user's e f ... · unclassified security classification...
TRANSCRIPT
AD-A108 736 BDM CORP MCLEAN VA Fia IqlUSER'S GUIDE FOR LOGATAK. A SIMULATION MODEL TO ANALYZE LOOIS--Frf.,,
APR 81 E J BITINAS. W F LYNCH DNAOOI"?9-C-nOSRUNCLASSIFIED BDM/W-81-079-TR DNA-6505H NL"IIIIlfflffllfflffllfIIIIIIIIIIIIIIhEEEIIIIEEEEEEEEIIEIIEEEEIIIIIEEIIIIEIIEEEIIIIIIIIIIIIIIfllfll.

PPc -. ~2
HH O
M IP o k q U M- i lI N ii 1:P

LEVE VDNA 6505H
A USER'S GUIDE FOR LOGATAKA Simulation Model to Analyze Logistic Network Distribution
) and Interdiction
BDM Corporation
1 7915 Jones Branch Drive
McLean, Virginia 22102
15 April 1981
Handbook
CONTRACT No. DNA 001-79-C-0086
APPROVED FOR PUBLIC RELEASE;DISTRIBUTION UNLIMITED.
THIS WORK SPONSORED BY THE DEFENSE NUCLEAR AGENCYUNDER RDT&E RMSS CODE 8380079464 V99QAXNL12401 H2590D.
DTICSEL ECTE
C -.) Prepared for DOEC 2 2 WL&. Director
DEFENSE NUCLEAR AGENCY Dr Washington, D. C. 20305
81 12 22 015

Destroy this report when it is no longerneeded. Do not return to sender.
PLEASE NOTIFY THE DEFENSE NUCLEAR AGENCY,ATTN: STTI, WASHINGTON, D.C. 20305, IFYOUR ADDRESS IS INCORRECT, IF YOU WISH TOBE DELETED FROM THE DISTRIBUTION LIST, ORIF THE ADDRESSEE IS NO LONGER EMPLOYED BYYOUR ORGANIZATION.
UNCLASSIFIEDSECURITY CLASSIFICATION OF THIS PAGE ( "hen Dote Entered)
REPORT DOCUMENTATION PAGE BEFORE COMPLETING FORMI. REPORT NUMBER 2. GOVT ACCESSION NO, 3. RECIPIENT*S CATALOG NUMBER
DNA 6505H jV
4. TITLE (and Subtitle) 5. TYPE OF REPORT & PERIOD COVERED
A USER'S GUIDE FOR LOGATAK HandbookA Simulation Model to Analyze Logistic NetworkDistribution and Interdiction 6. PERFORMING ORG. REPORT NUMBER
BDM/W-81-079-TR7. AUTHOR(s) 8. CONTRACT OR GRANT NUMBER(&)
E. J. BitinasW. F. Lynch, Jr. DNA 001-79-C-0086
9. PERFORMING ORGANIZATION NAME AND ADDRESS 10. PROGRAM ELEMENT. PROJECT, TASK
BDM Corporati on AREA & WORK UNIT NUMBERS
7915 Jones Branch DriveMcLean, Virginia 22102 Subtask V99QAXNL124-01
1. CONTROLLING OFFICE NAME AND ADDRESS 12. REPORT DATE
Director 15 April 1981Defense Nuclear Agency 13 NUMBER OF PAGES
Washington, D.C. 20305 13014 MONITORING AGENCY NAME & ADDRESS(If different from Controlling Office) 15. SECURITY CLASS (of this report)
UNCLASSIFIED
ISa. DECL ASSI FICATION 'DOWNGRADINGSCHEDULE
N/A16. DISTRIBUTION STATEMENT (of this Report)
Approved for public release; distribution unlimited.
17. DISTRIBUTION STATEMENT (of the abstract entered in Block 20, if different from Report)
18. SUPPLEMENTARY NOTES
This work sponsored by the Defense Nuclear Agency under RDT&E RMSS CodeB380079464 V99QAXNL.12401 H2590D.
19. KEY WORDS (Continue on reverse side if necessary and identify by block number)
Computer Simulation InterdictionLOGATAK MAWLOGSTransportation Model TargetingLogistics System Model
[20. ABSTRACT (Contfnue on reverse side It necessary and identify by block number)
This user's guide describes the LOGATAK computer simulation model and itsapplications. The model is a transportation network simulation by whichlogistics and combat forces are moved throughout a theater of operations.Interdiction strategies are tested using the model to determine vulnera-bilities in the transportation system and evaluate the effectiveness ofinterdiction against forces and resupply. The model was originally devel-oped in 1977 by the BDM Corporation based on the MAWLOGS (Model of the .....
DD I 1473 EDITION OF I NOV 65 IS OBSOLETE UNCLASSIFIEDSECURITY CLASSIFICATION OF THIS PAGE (When Dat Entered)

UNCLASSIFIEDSECURITY CLASSIFICATION OF THIS PAGE("Whan Date Entered)
20. ABSTRACT (Continued)
Army Worldwide Logistics) modeling system. Since then, a number of improve-ments and enhanced capabilities have been made, resulting in an effectiveinterdiction analysis tool.
Accession For
NTIS G7A&IDIIC TAB 0lUnennounced 0Justification
Distribution/
Availability Codes
A vail and/ort Special A
UNCLASSIFIEDSECURITY CLASSIFICATION OF THIS PAGEften Data Entered)

TABLE OF CONTENTS
Chapter Page
TABLE OF CONTENTS 1
LIST OF ILLUSTRATIONS 5
LIST OF TABLES 7
GENERAL DESCRIPTION 9
1. Purpose and Use 9
1.1 LOGATAK 91.2 DAMSEL 10
2. General Characteristics 11 j
2.1 LOGATAK 112.2 DAMSEL 14
3. Activities Simulated 15
3.1 Supply Structure 153.2 Transportation Network 16
4. Computer System Requirements 16
II SCENARIO DESIGN 17
1. Introduction and Purpose 172. Operational Plan 18
2.1 Objectives of the Force Subjected toInterdictive Attack 18
2.2 Detailed Operational Plan 182.3 Geographic Locale of Operation 18
3. Military Units 19
3.1 Designations 193.2 Initial Stockage 193.3 Types of Activity 193.4 Supply Consumption Rates 203.5 Unit Locations 203.6 Unit Moves 20

TABLE OF CONTENTS (CONTINUED)
Chapter Page
4. Supplies 22
4.1 Classes of Supply 224.2 Priorities 224.3 Quantitative Description of Classes ijf
Supply 22
5. Supply Bases 23
5.1 Designation of Supply Bases 235.2 Initial Stockages 235.3 Forwarding of Supply Demand Orders 235.4 Movements and Locations 23
III DAMSEL: INPUTS AND OUTPUTS 25
1. Inputs 25
1.1 Deck Structure 251.2 Link Alterations 251.3 Terminal Alterations 281.4 Data Selection 281.5 Job Control 31
2. Output 31
2.1 General 312.2 Printed Output 312.3 Permanent File Output 36
IV LOGATAK INPUTS 45
I. General Description 452. Model Parameters 453. Transportation Network 504. Supply Parameters 55
4.1 ***ALL Node Data 554.2 FSB Node Data 584.3 ASB Node Data 584.4 DSB Node Data 584.5 INITP Data Deck 63
5. Delay Distributions 636. Activating Demand Generation 63
2

TABLE OF CONTENTS (CONTINUED)
Chaoter Page
7. Changing the Network 698. Changing Distributions 699. Changing Supply Parameters 6910. Scheduling Network AttacKs 7411. Scheduling Supply Point Attacks 7712. Scheduling Communications Jamming 7713. Restart Input Deck 7714. CDC Control Cards 85
V LOGATAK REPORTS 89
1. General Description 892. Files Status 893. Reports for Supply Nodes 90
3. 1 Demand Generation Nodes Report 903.2 Intermediate Supply Nodes Report 90
4. Transportation System Report 975. Permanent Attributes Report 1036. SAVRUN for Restart 1037. Event Trace 103
VI OPERATING STRATEGY 107
1. General 1072. Scenario 1073. Input Data 1094. Running the Model ill5. Analyzing the Model Results 112
VII FORCE MOVEMENT OPTION 115
1. intruducticn and Purpose 1152. Input Data for Force Movcm-nt 116
2.1 Unit Organizations 1162.2 Parent Unit Movement 116
3. Interdiction 116
3.1 Target Set Concept 1203.2 Basic Repair Groups 1203.3 Attack Execution 120
3

TABLE OF CONTENTS (CONTINUED)
Chapter Page
4. Other Model Additions 120
4.1 Queue Report 120
4.2 Target Status Report 120
4.3 Attack Effects Report 120
5. operating Strategy 126
4

LIST OF ILLUSTRATIONS
Figure Page
LOGATAK Simulation Model 12
II-I LOGATAK Network 21
III-1 DAMSEL Input Data Deck 26
111-2 DAMSEL Program File Creation Job Control 33
111-3 DAMSEL Execution Job Control 34
111-4 Library Alterations Summary 35
111-5 DAMSEL Data Selection List 37
111-6 DAMSEL: Selected Terminals 38
111-7 DAMSEL: Selected Links 39
111-8 DAMSEL: Selection Summary 40
111-9 Transportation Network Data Library 41
III-10 DAMSEL: Data Formatted for LOGATAK 42
IV-I Input Setup for LOGATAK Model 46
IV-2 Input Setup for RDNET Module 54
IV-3 Input Setup for INITP Module 64
IV-4 Restart Deck Card Setup 84
IV-5 Update and Load Model Control Cards 86
IV-6 Control Cards to Execute the Model and Savethe Restart File 87
IV-7 Control Cards to Restart the Model 88
V-l Random Variables Parameters Sample Report 93
V-2 File Contents Sample Report 94
V-3 Demand Generation Nodes Sample Report 95

LIST OF ILLUSTRATIONS (CONTINUED)
Chapter Page
V-4 Intermediate Supply Node Sample Report 96
V-5 Sample Network Link Report 98
V-6 Sample Network Terminal Report 99
V-7 Sample Terminal Workloads Report 100
V-8 Sample Link Workloads Report 101
V-9 Sample Mode Utilization Report 102
V-10 Sample Permanent Attributes Report 104
V-ll Sample Page from Event Trace 106 |
6$

LIST OF TABLES
Table Page
1-I LOGATAK Model T3
II-I Link Data Card Formats 27
[II-2 Terminal Data Cara Formats 29
:11-3 Selection Data Card Formats IZ
111-4 DAMSEL: File Utilization 32
IV-l Model Parameter Card Formats 47
IV-2 ZINIT Subnodes Which Can Be ScheduledExogenously 51
IV-3 RDNET Data Card Formats 52
IV-4 INITP Data Card Formats 56
IV-5 SICOM Attributes 59
IV-6 FSB Node Data Card Attributes 60
IV-7 ASB Node Data Card Attributes 61
IV-8 DSB Node Data Card Attributes 62
IV-9 INPAR Data Card Formats 65
IV-10 File Data Card Formats 68
IV-11 CHNET Data Card Formats 70
IV-12 CHPAR Data Card Formats 71
IV-13 CHPRM Data Card Formats 75
IV-14 ATACK Data Card Formats 76
IV-15 ATSUP Data Card Formats 78
IV-16 CCCUB Data Card Formats 79
IV-17 LOGATAK Card Format For Restart 81
7

LIST OF TABLES (CONTINUED)
Table Page
IV-18 Restart File Identification Cara Format 32
IV-.9 Restart Control Parameters Card Format REGASP) 83
V-1 Transportation Shipment Attributes 91
V-2 CHNET, ATACK, Rebuild Event Attributes 2
VII-l SICOM Attributes Force Movement Option 117
VII-2 Parent Unit Organization Data Card Format 118
VII-3 Parent Unit Division Data Card Format 119
VII-4 Target Set Data Card Format 121
VII-5 Basic Repair Group Data Card Format 122
VII-6 Attack Target Set Data Card Format 123
VII-7 Additional ZINIT Subnodes Which Can Be ScheduledExogenously 125
8

CHAPTER I
GENERAL DESCRIPTION
This document is a user's guide to the LOGATAK simulation model and
the DAMSEL data base program. The first chapter orovides a general des-
cription of the programs and their uses. The second chaoter 'escribes now
a user specifies a particular scenario which will be used in the rr l
analysis. Chapter III describes the DAMSEL data management and seleccLon
program in detail. Chapter IV describes the input data for the LOGATAK
model, including deck structures and card formats. The reports produced by
the LOGATAK model are described and examples are shown in Chapter V. The
operating strategy for running the model and analyzing the results is
discussed in Chapter VI. Chapter VII treats expanded force movement and
interdiction options.
1. PURPOSE AND USE
1.1 LOGATAK
The LOGATAK simulation model was developed to assess the impact
of interdiction on a logistic network and to aid in developing attack
strategies on the network. The model represents a multi-echelon supply
system connected by a multi-mode transportation network. The movement of
shipments throughout the network is simulated over time to permit the
analysis of traffic flows and overloads. The model utilizes the available
transportation capability to move all shipments and chooses alternate
routes if overloads or attacks reduce the capability.
The model was designed to handle a wide range of scenarios and
transportation networks. The user can select any geographic area that is
covered by the data base and specify the location of supply bases and the
movement of units over the area selected. Varying demand patterns may be
specified to represent changing conditions on the battlefield. The demands
from units in different locations drive the model to satisfy the movement
requirements over the transportation network.
9

The normal mode of operation for the LOGATAK model 4s a baseline
,'un during wnich no interdiction is performed, foilowed by a series of runs
to test var'ous attack strategies. A comparative analysis can then be per-formed on the system response under iarying conditions. The model also
includes a target allocation algorithm (TARGAA) which aids in determining
Preferred attacK strategies.
1.2 DAMSEL
Program DAMSEL was developed as an effective means of cata man-
agement and data selection. It serves as an interface between the logis-
tical data base and the LOGATAK simulation model. It performs this
function in both directions, i.e., taking data from the data library and
converting to the proper formats for LOGATAK, and by providing convenient
printed output enabling the analyst to reference the LOGATAK results back
to the logistical data base.
In its role as data manager, program DAMSEL performs four basic
tasks: (1) adds, (2) deletes, (3) updates and (4) orders. The program can
add new data to or delete data from the library. DAMSEL also has the
capability of updating one or more variables of a particular data entry in
the library. These three tasks are all carried out while keeping the data
ordered according to a specified arrangement. The ordering of the data in
the library enables DAMSEL to operate more efficiently in selecting sec-
tions of data for analysis.
The other main function of DAMSEL is to select data from the data
library as requested by the analyst. Because the data library can be quite
extensive, and because computer core restrictions limit the amount of data
which can fit into the machine with LOGATAK, it becomes necessary to select
only the data which is pertinent to the analysis being performed. Once the
appropriate data has been selected from the data library it is transformed
into the proper format for LOGATAK. This data, ready for use by LOGATAK,
is stored on a permanent file. The printed output of DAMSEL provides a
cross-reference between the logistic data base entries and their
corresponding LOGATAK format.
10
" r t-.'

2. GENERAL CHARACTERISTICS
2.1 LOGATAK
The LOGATAK model is a discrete-event, stochastic simulation
model consisting of supply demand generator nodes, intermediate stocKage
points, supply source nodes, and a multi-mode transportation networK
connecting these nodes. The flow of shipments in response to demands from
the supply nodes is simulated over time on the transportation networK."
Overload of the transportation network causes queue buildups and rerouting
of shipments. Losses and impairments in the network due to attack at any
time create similar effects, thus hampering the transportation system's
ability to respond to the demands. The basic measures of effectiveness in
the model are: the percent of materiel demanded which is received, the
response time experienced, the intermediate inventory levels, and the
resource utilization and workloads in the transportation network.
Figure I-I shows the basic inputs and outputs for the model. The
user defines the transportation network (with the help of DAMSEL), the
scenario, and the initial stockage levels. The model is then run and
transportation workloads and demand satisfaction are reported. Optional
attacks can be specified by the user or by TARGAA to disrupt the network
and effect the outcome. A general description of LOGATAK inputs and out-
puts is given in Table 1-1. A complete specification is provided in
Chapters IV and V.
The model is a sophisticated simulation model with complex logic
to handle the many decisions arising from traffic routing and overload
rerouting. The model enables the user to study the interactions between
many shipments in a multi-mode transportation network under a wide range of
conditions. In addition, conditions in the network can be altered during
the model run by such outside forces as attacks and weather. The model
then adjusts to the new conditions and the traffic flow during the transi-
tion period can be studied.
The model program is written in the FORTRAN language and is
currently operational on a Control Data Corporation CYBER 73 computer
II n'

C= ~ ~ L0
-- c
0,0
LLJJ
mat CDI---L
LLJ cl_0co -o
12J

TABLE I-I. LOGATAK MODEL
INPUTS OUTPUTS
NETWORK DESCRIPTION SUPPLY STATUS BY NODE/CLASSLINK AND TERMINAL SPECS QUANTITY ORDEREDMODE QUANTITY RECEIVEDLENGTH QUANTITY DUE-INRATE OF TRAVEL DURATION OF DUE-INSCAPACITY TRANSPORTATION STATUSTIME TO REBUILD NETWORK CHARACTERISTICS
* SCENARIO NETWORK WORKLOADSTIME PHASED DEMANDS FOR EACH LINK/TERMINALLOCATION OF DIVISIONS AVERAGE LOADPRIORITY OF DIVISIONS PEAK LOAD
* INITIAL STOCKAGE AT SUPPLY TOTAL THRUPUTPOINTS QUEUE BUILDUPS
* ATTACKS ATTACK RESULTSWHEREWHEN
13
I.

IZ
system (equivalent to the large CDC 6000 series comnuters). The Program is
a aynamic simulation model that can handle data changes during execution.The model has a restart capability so that a run may be stopped at any time
and restarted from that pioint in simulation time after analysis of theoutput. The model also has event trace and transaction file capabilities.The trace allows the user to verify that the logical decisions are beingmade properly within the model. The transaction file permits post-modelrun analysts and graphing of the results.
2.2 DAMSEL
Program DAMSEL was developed in order to provide a smooth trans-ition between the data base and the LOGATAK simulation. It was firstconsidered only as a tool to ease in formatting the data for use inLOGATAK; however, its greatest task became that of managing the data baseitself. Because of the size of the data base and the limitations of corerequirements from LOGATAK, only portions of the data base could be utilized
at any one time. Therefore it was necessary to have a means of "selecting"
segments of data from the full data base to provide input for a LOGATAKinvestigation. DAMSEL was developed as a preprocessor program for thelogistics data base.
It was determined early on that some trade offs were necessarybetween data base and LOGATAK because of computer size and corerestrictions. The result of one trade off was the sectoring of data.Because of this trade a preprocessing program was needed to convert datafrom its map/sector form to the proper LOGATAK format and numberingsequence.
DAMSEL is written in FORTRAN IV in modular form. The subroutinesrepresent the major operations of the simulation, namely, data managementand data selection. The main (or executive) program acts as controllersetting the proper conditions and calling the appropriate operations.
The heart of the program is the data base library and manipula-tions of same. To ease the data selection process discussed previously the
data library is ordered with respect to caded data identification numbers.This order must be maintained whenever a new data library is created. To
14
accomplisn this, changes to the data base must be presorted and submitted
in proper order. This presort requirement eases programming operations ana
eliminates the need for numerous passes through the data library file.
The program requires as many as eight input/output files
depending upon what functions are being performed. Two files are utilized
for the data library. Four files are needed for the select functionincluding two working files and two output files to feed LOGATAK. The
remaining files are the basic input and output to the program.
The entire DAMSEL program consists of approximately 600 state-
ments. Its compilation time is less than ten seconds on a CDC 6000 Series
Computer utilizing 18,000 words of core.
3. ACTIVITIES SIMULATED
3.1 Supply Structure
The supply users in the model are simulated as nodes representing
military units or aggregations of units which generate demands for various
classes of supply over time (based on the scenario being modeled). Inter-
mediate stockage points in the model receive demands from the user nodes
and either fill the demands from inventory or pass the demands to a higher
echelon. These stockage points maintain inventory levels by orderingreplenishments from a higher echelon. The source of materiel in the model
is represented by nodes that fill all demands from the lower echelon supply
nodes. Fill delays may be represented at these nodes to indicate back-
orders and stock availability problems.
One or more supply classes may be represented at each supply node
in the model. There is no fixed maximum on the number of classes of
materiel other than computer core storage limitations. Example supply
classes are ammunition, packaged POL, and bulk POL.
The geographic locations of supply nodes may change over time
during the model run. Special classes of materiel may be defined to
represent movement over the transportation network of unit equipment and
personnel.
15

3.2 Transportation Network
The transportation function 4n LOGATAK is simulated by followingthe movement of discrete shipments over time on a terminal-link network.Up to six modes of travel can be included in a network including air, sea,rail, road, pipeline, and transshipment between modes. Shipments arerouted through the network from source to user terminals based on thecurrent status of the network, the priority and the size of the shipment.The loading on the terminals and links is measured and delays associatedwith travel time, terminal operations, and queueing are used to determinedelivery time.
The terminals and links of the transportation network are
assigned vulnerability factors and rebuild times. Any element of thenetwork may be attacked at any time during the model run. The model cal-
culates the reduction in capacity and the time it will take to rebuild the9element. Shipments are rerouted, utilizing the remaining capacity in anetwork after an attack.
4. COMPUTER SYSTEM REQUIREMENTS
The LOGATA( model program is written in the FORTRAN language and iscurrently operating on a Control Data Corporation 6000 series computer.The program is designed on the modular principle and contains over350 subprograms. The current configuration of the model requires92,600 words of core storage to execute. This configuration can handle up
to 20 demand generators, 5 intermediate stockage points, 5 supply sources,300 terminals, and 600 links. It also includes the program TARGAA in the
same core overlay with the model.
The running time for the model varies depending on the scenario, thetransportation network, and the activity being represented. An estimated
range for a large application is 10 to 20 minutes of central processor time
for a CDC CYBER 73.
16

/
CHAPTER fI
SCENARIO DESIGN
1. INTRODUCTION AND PURPOSE
This chapter describes a number of factors whicn must be con-
siderea in the design of a s-.nario for use in the LOGATAK moael. This
scenario must serve a numuer of different purposes: it must describe the
general operating plan of the military units and their supporting logistics
system which is to be iubjected to interdiction; it must convert that
operational plan into specific detailed movements of the military
units; it must identify and describe the classes of supplies which flow
through the logistics sYstem; and, it must describe the supply bases which
process these supplies. In considering all of these factors in detail, it
must be remembered that computer core is limited, and only data which is of
significance to the results of the model exercise should be contained in
the scenario. The scenario design must seek a middle ground between two
extremes. On the one hand, it cannot be so detailed that the computer bogs
down with superfluous information and cannot complete the desired model
run, while on the other hand, the scenario must not be so aggregated that
factors important to the answer are omitted and the final results thereby
preordained. A more detailed discussion of the trade-offs involved in
making this balance is contained in Chapter VI, Operating Strategy.
Another important point which should be kept in mind during the scenario
design is the necessity of using data formats that are compatible with the
LOGATAK program. These formats are described in detail in Chapter III,
DAMSEL (Data Management and Selection System), and Chapter IV, LOGATAK
Inputs.
17

2. OPERATIONAL PLAN
2.1 Objectives oif the Force Subjected to Interaictive Attack
The first step in preparing an operational plan is to ciearlydefine and outline the objectives desired by the side subjected to inter-dictive attack. These objectives include whether the operation is offen-sive, defensive, or a combination, the tactics (in general terms) used toachieve these objectives, the desired rate of movement of the forward edgeof the battle area (FEBA), and the geographic objectives of the operation.
2.2 Detailed Operational Plan
The overall objectives of the force subjected to interdictionmust be expanded into a detailed operational plan which describes the units
contained within this force, and the operations which these units conductagainst their enemy, as a function of time during the scenario. For exam-
pie, which of the units are to be in the front line and which in reserve,what types of tactics will the units use, and at what times will specialreserves be employed? Since different military forces generally have
different doctrines with respect to these matters, it is important toresearch the operational doctrines of the military force being described,in order to maintain a desirable degree of realism.
2.3 Geographic Locale of Operation
In describing the overall operational plan, the locality in which
the operation is to take place must be defined, and the geographic detailsof this location must be examined in the context of the tactical opera-tions. The presence of geographical features such as rivers, mountainranges, etc. are significant not only to the operation of the logisticssystem to be interdicted, but also to the tactical movements of the mili-tary units being supported by that logistics system. The detailed opera-
tional plan must reflect the presence of geographical features by takingadvantage of these features in both attack and defense, as a field com-mander would do.
18

3. MILITARY UNITS
3.1 Designations
The military unit organization of the force to be interdictedmust be defined in order to generate the desired set of logistic demandgenerators. It may be necessary, if computer facilities are not secure, to
develop a set of coded designations of the units involved to maintainsecurity. By either actual or coded designation, however, every demandgenerator involved in the scenario must be individually identified by adesignation compatible with the LOGATAK model input format.
3.2 Initial Stockage
The initial stockage of each designated demand generator andsupply base, in each type of supply to be used in the model, must bedefined. The initial stockage is the level of supply available at thebeginning of the scenario run, and reflects the "cushion" available to theunit or base against running out of supplies before the logistics systemcan replace consumption.
3.3. Types of Activity
For every unit of time in the scenario, e.g. , day, the type ofactivity of each demand generator must be defined. Most major countries
have published reports which define the consumption rates of variousclasses of supplies for various types of activity, such as attack againstdefended positions, meeting engagements, hasty defense, etc. The types ofactivity defined for each demand generator should correspond as much aspossible with the doctrine definitions of activity in order to facilitatethe determination of consumption rates. The types of activity for eachdemand generator can generally be selected from a review of the detailedoperational plan. In the interest of reality, if an unusual type of activ-
ity is contemplated which does not correspond to any predefined doctrine, a
new designation of activity should be adopted.
19

3.4 Supply Consumption Rates
The consumption rates tor eacn class of uppties and the fre-
quency of orders of these supplies must be defined for each demand gene-
rator in the scenario. As previously indicated, standard military logistic
doctrine texts are very helpful in determining consumption rates for typi-
cal units engaged in standard types of activity. If the analyst believes
that the scenario under consideration does not correspond to a standara
classification, however, he should use consumption rates and frequency of
orders which he feels are realistic in the particular case. The consump-
tion rates and frequency of orders must be defined in a format compatible
with the LOGATAK model input requirements.
3.5 Unit Locations
The location of each military unit (demand generator) must be
identified each time that the unit moves, and the length of time at each
location must be defined. A location of a military unit is generally out
in the field, not coincident with any fixed node in the transportation
network of the area. The fixed node through which supplies will be sent to
the unit field location must be identified, and the temporary transporta-
tion link between the military unit location and the fixed node must be
described. This description should include length, capacity, and rate of
travel. It is necessary to define all successive locations of a given unit
for the duration of the scenario so the simulation model can forward sup-
plies to the new unit location if the unit moves while its supplies are in
transit in the logistics system. Figure II-1 shows a sample network with
successive locations for three tank units in the field tied into the exist-
ing transportation network.
3.6 Unit Moves
Depending on whether a particular unit is located in the forward
battle area or in the rear area of the logistic network, the movement of a
unit from one location to another may create a significant additional load
upon a logistic network. The movements of military units which compete for
use of the available capacity of a transportation link with the movements
of supplies must be carefully accounted for, as military unit moves can
20

cc!
Cal
21

easily become the most serious load on the logistics net. Sucn unit moves
snould receive attention during the scenario design to make sure that
ieality is preserved and artificial Dottlenecks ire not created in the
system.
4. SUPPLIES
4.1 Classes of Supply
The LOGATAK model will accommodate a large number of classes of
supply within the existing model structure. Typical classes of supply are
ammunition of various types and POL. Although the capability for handling
many types of supplies is present, the analyst should remember that each
additional class of supply accounted for in the model consumes an addi-
tional amount of computer core capacity and thus reduces the aoility to
consider other aspects of the problem. The classes of supply used in the
model exercise should be restricted to those which have a significant
effect on the total load in the logistics system, and classes of supply
consisting of only a minor fraction of the total can usually be disregarded
without affecting the final answer significantly.
4.2 Priorities
The LOGATAK model will accept the designation of different levels
of delivery priority for different classes of supply and of users. The
assignment of priority should be made after careful consideration of the
operational plan, and the effect on the combat units of a shortage of each
class of supply.
4.3 Quantitative Description of Classes of Supply
Each class of supply must be defined according to the weight and
cubage associated with a unit amount. For supplies such as ammunition and
POL, these numbers may be obtained from standard references.
22

5. SUPPLY BASES
5.1 Designation of Supply Bases
As -in the case of military units, the selection of supply oases
must be based on the oest available information concerning the types of
supplies to be hanalea and the logistic doctrines of the particular force
invoived. If computer security is a oroDlem, supply bases may be given
coded designations in the same manner as military units.
5.2 Initial Stockages
In the same manner as military units, the initial stockage of
each class of supply available at each supply base must be defined. The
levels of initial stockage for each level of supply should be consistent
with the logistic doctrine with the force involved, as well as the degree
of advance preparation assumed before the scenario begins.
5.3 Forwarding of Supply Demand Orders
The LOGATAK model permits the forwarding of supply demand orders
from a supply base to another base at a higher echelon, if the f-r,.t bas
to receive the order is unable to fill it. Each intermediate s,:pply base
in the scenario must be associated with the designation of its next higher
echelon supply base, to which the unfilled orders are referred.
5.4 Movements and Locations
In the same manner as military units, the location of each inter-
mediate and source supply base must be identified for each time interval of
the scenario. If the supply base moves during the scenario, the time of
the move must be identified. Supply bases are usually located closer to
the nodes in the fixed transportation network than are military units, but
they may still be located a short distance from the nearest transportation
terminal node, and the length, capacity and average rate of speed of the
connecting link to the terminal node must be specified. Supply bases are
frequently tied simultaneously to more than one type of transportation
terminal, for example, highway and rail. If a supply base is tied to more
than one mode of transportation, the links connecting the supply base to
23
OWN
each type of terminal node must be independent!y specified. Figure 11-1
shows supply bases located in a transportation network.
I
24

CHAPTER III
DAMSEL: INPUTS AND OUTPUTS
1. INPUTS
1. 1 Deck Structure
Inputs to program DAMSEL are concerned with its two basic func-tions; (1) altering the data base library, and (2) selecting data from thelibrary for analysis. The first function is further divided into twotasks; (1) alterations to link data and (2) alterations to terminal data.These two tasks together with data selection comprise the major blocks ofinput to program DAMSEL. Any individual input block or combination ofblocks may be used for a single DAMSEL run. However input blocks must be
in the order shown in Figure II1-i and each block may be used only one perrun. If a particular input block is not being utilized it is not includedin the input data deck.
1.2 Link Alterations
The first data block to appear, if needed, is link alterations.The formats for these cards are shown in Table 111-1. The number of link
cards is not constrained, however they must be ordered according to theirfirst terminal number with the smallest number first. Links which aredefined by the same first terminal number are grouped together with nofurther ordering being necessary.
There are three link alterations which can be performed by DAMSEL
and are indicated in card column five.
CC5 DAMSEL OPERATION
BLANK ADD LINK DATA TO LIBRARY
0 DELETE LINK DATA FROM LIBRARY
C CHANGE ONE OR MORE VARIABLES OF
DEFINED LINK IN LIBARY
25

ALTERATIONST
FigreIlli.DASEL It DtDc
TERMIRL TEM 26
ALTERRTION

TABLE lll-1. LINK DATA CARD FORMATS
FIRST CARD
CC I - CC 5 A5 ENTER CHG (LEFT JUSTIFIED)CC 6 - CCIO A5 ENTER LINK (LEFT JUSTIFIED)CCll - CC80 7OX BLANK
LINK DEFINING CARDS
CC l - CC 4 A4 CARD NAME - LINKCC 5 Al PROGRAM INSTRUCTION
(C, D, OR BLANK)CC 6 - CC1O A5 LINK TYPE (RAIL, HWY, TRANS, AIR)CClI - CC20 110 TERMINAL NUMBERCC21 - CC3O IlO TERMINAL NUMBERCC31 - CC35 15 ROUTE NUMBERCC36 - CC45 F1O.3 LINK LENGTHCC46 - CC55 F1O.3 CAPACITY OF LINKCC56 - CC6O F5.O VULNERABILITY FACTORCC61 - CC65 F5.O TIME TO REBUILDCC66 - CC7O F5.O RATE OF TRAVELCC71 - CC77 7X BLANKCC78 - CC80 A3 RIVER CODE
LAST CARD
CC 1 - CC 5 A5 ENTER LINK (LEFT JUSTIFIED)CC 6 - CCIO A5 ENTER END (LEFT JUSTIFIED)CCli - CC80 70X BLANK
27

The last operation requires two link cards. The first card must define the
link exactly as it appears in the present data base. The following cara
provides the new values for the variables to be chianged. Only the var-
ables in CC21-CC80 may be changed. A value of -1, -1., or blank as appro-
priate for integer, real, or alpha format can be used to indicate no change
of this variable.
1.3 Terminal Alterations
This is the second block of input data unless there are no link
alterations being made in which case this block is first. The formats for
this block are presented in Table 111-2. Here also the number of terminal
cards is unconstrained. The terminal cards must be ordered by terminal
number beginning with the smallest number.Similarly to the link data, card column five indicates the opera-
tion to be performed.
CC5 DAMSEL OPERATION
BLANK ADD TERMINAL DATA TO LIBRARY
D DELETE TERMINAL DATA FROM LIBRARY
C CHANGE ONE OR MORE VARIABLES OF
OEFINED TERMINAL IN LIBARY
Unlike link data only one card is needed to change the variables for a
terminal. In addition all variables must be specified including those that
are not changed.
1.4 Data Selection
The data selection block of input is last allowing the data
library to be altered before data is selected. The formats for these data
cards are given in Table 111-3. The sector data cards identify the sets of
data to be selected from the data library. Each data set is defined by a
five digit number. The first four digits uniquely define a sector and the
units digit defines the mode of operation of data desired. All modes for a
28

TABLE 111-2. TERMINAL DATA CARD FORMATS
FIRST CARD
CC 1- CC 5 A5 ENTER CHG (LEFT JUSTIFIED)CC 6 - CC0O A5 ENTER TERM (LEFT JUSTIFIED)CCII - CC80 70X BLANK
TERMINAL DEFINING CARDS
CC -CC 4 A4 CARD NAME - TERMCC 5 Al PROGRAM INSTRUCTION
(C, D, OR BLANK)CC 6 - CC1O A5 TYPE OF TERMINAL (RAIL, HWY, AIR)CCl1 - CC30 A20 TERMINAL NUMBERCC31 - CC40 I10 CODED TERMINAL NUMBERCC41 - CC50 FIO.3 TERMINAL CAPACITYCC51 - CC55 F5.0 VULNERABILITY FACTORCC56 - CC60 F5.0 TIME TO REBUILDCC61 - CC63 13 INDEX OF CONSOLIDATION DELAYCC64 - CC66 13 INDEX OF LOADING DELAYCC67 - CC69 13 INDEX OF THROUGHPUT DELAYCC70 - CC72 13 INDEX OF UNLOADING DELAYCC73 - CC80 8X BLANK
LAST CARD
CC 1 - CC 5 A5 ENTER TERM (LEFT JUSTIFIED)CC 6 - CC1O A5 ENTER END (LEFT JUSTIFIED)CCll - CC80 70X BLANK
29

TABLE III-3. SELECTION DATA CARD FORMATS
FIRST CARD
CC 1 - CC 6 A6 ENTER SELECTCC 7 - CC80 74X BLANK
STATISTICAL INDICES CARD
CC 1 - CC 2 12 AVERAGE WEIGHT OF SHIPMENTS ONLINK (3)
CC 3 - CC 4 12 TOTAL WEIGHT OF SHIPMENTS OVERLINK (1)
CC 5 - CC 6 12 AVERAGE CAPACITY OF LINK (3)CC 7 - CC 8 !2 AVERAGE WEIGHT OF SHIPMENTS IN
TERMINAL (3)CC 9 - CC1O 12 TOTAL WEIGHT OF SHIPMENTS
PASSING THROUGH TERMINAL (1)CCl - CC12 12 TOTAL WEIGHT OF SHIPMENTS
DELIVERED FROM TERMINALS (1)CC13 - CC14 12 AVERAGE CAPACITY OF TERMINAL (3)CC15 - CC16 12 AVERAGE NUMBER OF SHIPMENTS IN
ARRIVAL QUEUE (3)CC17 - CC18 12 AVERAGE NUMBER OF SHIPMENTS IN
DEPARTURE QUEUE (3)CC19 - CC80 62X BLANK
THIRD CARD
CC I - CC 5 15 NUMBER OF SECTORS (DATA SETS)TO BE SELECTED
CC 6 - CCIO F5.1 NUMBER OF HOURS OF TRAVEL PERSIMULATION TIME PERIOD
CC11 - CC15 I5 NUMBER OF TERMINALS RESERVED FORSCENARIO DEFINITION IN LOGATAK
CC16 - CC20 F5.1 NUMBER OF SIMULATION TIMEPERIODS PER DAY
CC21 - CC80 60X BLANK
SECTOR (DATA SET) CARDS
CC I - CClO 110 SECTOR (DATA SET) IDENTIFICATIONNUMBERS IN INCREASING ORDER
CC11 - CC8O 110
CC71 - CC8o
30
... -'-----"/11I-I----- ,# -r --

sector can b~e specified oy a zero in the units digit. All data set identi-
fier numbers must be ordered beginning with the smailest number. A nega-
tive identifier number causes all associated link data to have a negativecapacity indicating the link is inactive. In addition information on theinactive links is stored on a separate file to be punched. These resulting
punched cards can be utilized by the LOGATAK user to "turn on" the inactive
links.
1.5 Job Control
Eight files are accessed by DAMSEL as indicated on the programcard. Utilization of the files is shown in Table 111-4.
The DAMSEL program is currently operating on a Control DataCorporation 6000 series computer. The UPDATE program for maintaining and
updating source decks on libraries in compressed symbolic format is uti-lized in the operation of DAMSEL. Figure 111-2 shows the control cardsused to place the DAMSEL program on the new program library.
The job control cards necessary for program execution once theprogram is on the library is shown in Figure 111-3. Temporary alterationsto the DAMSEL program may be made as needed via the UPDATE procedures.
2. OUTPUT
2.1 General
Program DAMSEL provides direct output in two basic forms;
(1) printed, and (2) permanent file. The printed output informs the ana-
lyst what operations the program has performed and provides a catalog ofthe data when selected for analysis. Output which will be used again by
DAMSEL or is formatted for use by LOGATAK is stored on permanent files.2.2 Printed Output
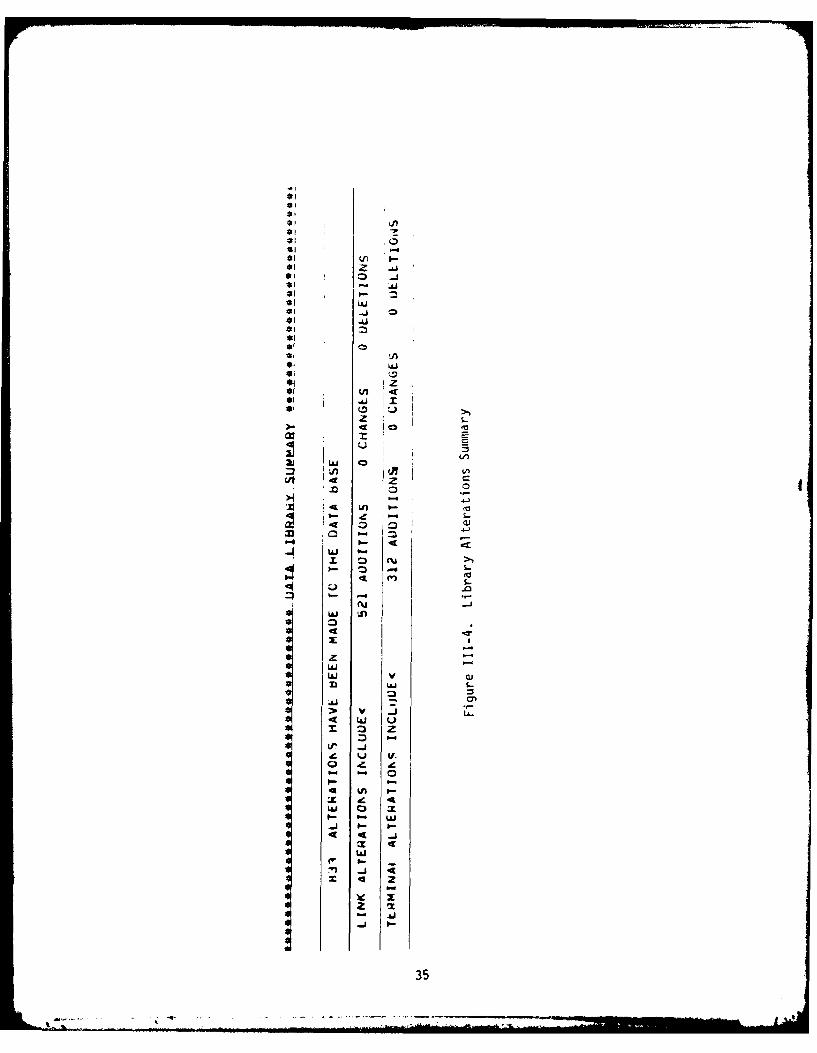
2.2.1 Data Library Alterations
When alterations are made to the data library a printed summaryof the alterations is provided. An example of this output is shown inFigure 111-4.
31

TABLE 111-4. DAMSEL: FILE UTILIZATION
FILE NO. UTILIZATION
2 DATA LIBRARY3 WORKING FILE4 WORKING FILE5 CARD INPUT6 PRINTED OUTPUT8 TERMINALS & LINKS SELECTED
& FORMATTED9 "TURN ON" FOR INACTIVE LINKS
10 NEW DATA LIBRARY(IF CREATED)
32
-....,,, .. I ..

(JOB CARD)REQUEST,NEWPL,*PF,UPDATE(P,N,F)CATALOG(NEWPL,DAMSEL PROGRAM, ID=LGKAV)FTN(I=COMPILE)7/8/9 END-OF-RECORD*DECK DAMSEL
(DAMSEL PROGRAM INSERTED HERE)6/7/8/9 END-OF- INFORMATION
Figure 111-2. DAMSEL Program File Creation Job Control
33
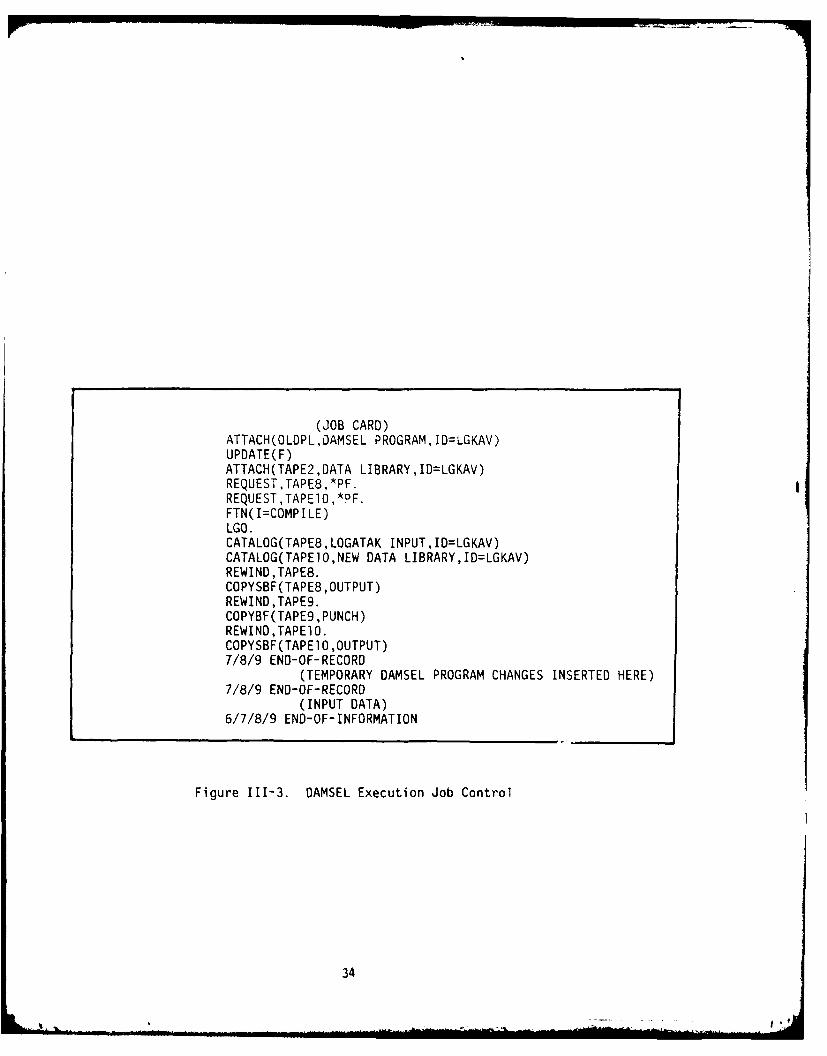
(JOB CARD)ATTACH(OLDPL,DAMSEL PROGRAM,ID=LGKAV)UPDATE(F)ATTACH(TAPE2,DATA LIBRARY,ID=LGKAV)REQUEST ,TAPE8, *PF.REQUEST,TAPE1O .*PF.FTN(I=COMPILE)LGO.CATALOG(TAPE8, LOGATAK INPUT, ID=LGKAV)CATALOG(TAPEJO,NEW DATA LIBRARY,ID=LGKAV)REWINDJAPE8.COPYSBF(TAPE8 ,OUTPUT)REWINDJAPE9.COPYBF(TAPE9 ,PUNCH)REWIND,TAPElO.COPYSBF(TAPE1O ,OUTPUT)7/8/9 END-OF-RECORD
(TEMPORARY DAMSEL PROGRAM CHANGES INSERTED HERE)7/8/9 END-OF-RECORD
(INPUT DATA)6/7/8/9 END-OF-INFORMATION
Figure 111-3. DAMSEL Execution Job Control
34
d Wahl
*1 -1
*1 -
*1 .-
m1 0cI
49
35

2.2.2 Data Selection
The first printed output, see Figure 111-5, wnen selecting iata
is a list of the input used for seiection identification. The Iumoers
identify the location and mode of the data to be selected. A minus sign
indicates that data selected in this sector shall be initially inactive.
The list of terminals selectea are orintea as shown in
Figure 111-6. The first terminal numDer is used ay LOGATAK and is unique
only for this selection of data. The second terminal number is from the
data base and uniquely represents the associated terminal.
Following the list of terminals is the list of associated links,
Figure 111-7. The two sets of terminal numbers define the end points of
the linKs and are consistent with the terminal numbers identified above.
Finally, as shown in Figure 111-8, is the summary of the data
selection operation of program GAMSEL.
2.3 Permanent File Output
2.3.1 Data Library Alterations
Whenever alterations are made to the data library the updated
library is output onto a permanent file. The library is maintained in an
ordered fashion which simplifies the alteration and selection processes.
Samples of the data library are shown in Figure 111-9.
2.3.2 Data Selection
Data which s selected for analysis is properly formatted for use
by LOGATAK stored on permanent file. This file is utilized to create an
UPDATE file of input data for LOGATAK. To this UPDATE file must be added
the other LOGATAK inputs described in Chapter IV, and the scenario depend-
ent data outlined in Chapter II. The scenario dependent data describes the
locations of the supply points and demand generators. These locations are
tied into the geographic network through additional links. Links are
defined for all positions of the scenario and are formatted as described in
Table IV-3. A sample of this file is shown in Figure III-10.
Some of the data selected is initially inactive (i.e., links have
negative capacity). A permanent file is created which contains all infor-
mation, except time of "turn on", necessary to activate these links in the
36

, o, r =,o
: 4* I a 41
-vo ,--*
, ar C J0.t• ,, l ..
~ 04 ~ -, t
*4 .4 4 4E4
a- g 4J
*' 4. 4 4
"..41
0 0 0

* I
I i 0.
oo 0- - -
0 * 0.* 0 0 0 0 0 0 0 0 0 0 0 0 0 m A A 0 00 0 1
I' I * * * N I4 4 4 ' 4 4 * 4' 4 * 4 4 * .4 4 ,. i- 4 4
! ! ! .
10 cc
a . oo o o 0,a a 0 0 0 o o 0 0 o 0, ° °0 -
10
" 0 0.
* 'i
A W' 0.
*0 a F. f0.34 Av A L f
i+ I)
a0 0 10a4m" - .0-. P. .
W4, ISX o
00
• /I** -, U II [ . /
- - - I - - - - -- - - -
38 I - -
* V I, ." "I-" ' . . . .. . " "* , - U Z .4 - C. .- . - . -. .. . .... .
*.... ............. .. .. . a' " -= .. .. u ... .. j ' +, - - a* a"++ + . . I1 - +
n. . .

II
a , -1 r I r 4 -
.9 IV 15154- p p ,
* 39

*
S
* 0 0 0 0 0* 0 0 0 0 0* 0 0 C 0 0* 3 PC~~ -* 14 4 414 4* I, ~ I~t o* 4 4
.4
COO 0* 0 0 0* 0 0 0 .0 0* ~ ., ~ Ut 0* 4 4 .4 4 4* ~ 0 i%~
* 4.4 .4 4 4 .
* >4
* 0 0 0 0 0* 0 0 0 0 0 2* 0 0 0 C 0 2* ~ 0 - 4 d* 4 4 4 14 .4* ~ 0 .~ - St* Pt 4 4 4 4* C* 0** C 0 0 C C* 0 0 0 0 0* 0 0 0 0 0* .4 Cr* 4 4 4 4 P' -* ~ 0 - t.4 4~ W
- 4 4 4 4 C.,,
x* 0 0 0 0 01 0 0 0 0 0- 0 0 0 0 0 La.iU Cf .L £ 4.
* 4 .4 4 4 S~ 0 - Cr 4P. .4 4 4 4
* C
S* 4-* C 0 0 0 3 .4* 0 0 0 0 0 0* 0 0 0 0 0* 4 54 U' - -* 4 4 4 4 4 -* 34 0 - Pt 4 0 -* - 4 4 4 4 -
** 0 0 0 0 0 4* 0 0 C C 0 'U* 0 0 0 0 0* C'~ 4 4 0 0* * 4 4 4 4 Li..* S C - P 4* P~ 4 4 4 4 t* 0
** 0 0 0 C C C (It* C C 0 0 0 2 C
* 0 0 0 C C C* ft. Cr Cr ~ ~ 4* 4 4 4 - - .4 -C* ~ 0 - Cr 4 W* t. 4 .8 .4 4 4 0* .4
S* 0 0 0 0 0 0 If It .* 0 0 0 C C C 4 £ ~* Ut C C 2 0 C C C 2* £ - A N P. - C C .4 Ut* j 4 .4 4 4 4. .4 - S -* - .7 0 - A 4 i S S -* J 4 4 4 4 4 2 C C C* .4 - .4 1* Ut - 4 -
* C C C* 0 0 0 0 0 0* 0 3 0 0 0 0S -t .4 - 4 7 t 0 0* St .4 .4 4 .4 4 P - -* W C - 44. 4. - PC .49
I * * * .4 4SSSSS
40

LINK QAYL 5 4;);) 3 0 1 SUP A An 1 ;1 115nn.J_ ;l AjLw_ r 4 ? A 5 n t i a;) % VV2 11 S
INK Q A I ( ;Uq In I ra;'r, jn p , q 7-'m
-- LINK PATI 1;41.75 in I r42N Am 1 112, Onn
LINK A I I C; a . r, 10 1 % 7 P I 10 1 51 a a n n 0LINK 4 A I L qu Ph 30 1 S '07 14M 1 f3 Q A 0 n n
L I NK 4 4 1 [ 147h in I S a ;17 ;n I Qku 17 4 k) nLINK _PA 45 aR 7 In I 542AAA2 704 nLINK RATI SUA73ni q-,2AInI !nA. ITr,(I.
-L I 14-C Q& I r,52 I 3n 1 9C-Pl 302 qn., 37cn.
LINK PATL v;P I In 1 5ft.7 13A 1 1 ;0 1 bc;nn .LINO OAI L sr.,743t) I Sr. in in 1 904, 75ne , S6.LINK 0 A I S;2A in I iq An In 1 ;41; .4 . A 6 0 .J-1 NK RAIL ;S ;?In I 4q;,- 17560,
LINK QATL so.?Alol ;0,71A At, I If% A A7nmfl. Sh.
__" !KqATL S7273ni 57poInj 7,0L I No( Q A T L 1;Q in An I 'APA In 1 1 4 A Imson. -3 h ,
LINK PAIL rQnAnl en,.iq An 1 1 Oh- 3sno. 44,LINK QATL 'IQ in In I OnAlAnI ?17, Anno. Sh.
_Jl l K 4 A Lt. So IQ An 1 '3414 A 34, 1 807, 4h5mo._ __lkLINK Q A I L #,n 1A in I hl in int ??os 't I n-imn. aA .
_LLkl RAIL --- h r I A AM t hi Ad Am I ISO, l2noo So. ____ -LINK 4ATL h I 3uxel 1 3;1 Sit It, I I A n (ILINK: QATL AlAIJAnt $%a ta In 1 2 Qpn-LINK RAIL hu ;a in I -it% XxIn I I A 7 f Vonn .Lj NK 46n _kt3j3LL___&?A;1 If) I_ __ ___1513 _1;) 'I An, 6_L 1 -4 K Q-A I L h73p3ml ft A 4,; 3 A 1 r, n n
_0 li ( F."r) - - -CHG TFQ-
TERM wy , A M F N I I F 7 n C 7 4AI4404 qnn. 40 UA at U?
-TERM 14-Y vA InV C7 (AX14,41f, r, n (I aq ag 4 1 417
?EQ- 4wy tvial .lvnRv CZ joluall C. M o 4Q UA at U7-imenv giicka a A;) -- -q -,t -? - - - --I 3n I 3non.
TERF4 PAIL mJx Arwf vil -AA,7? 30 1 Ison. 39 301 33 37FQANWqVSK 39 IP 33 37
TERM PATI f-FQNjoVTSKv 4q;Pr, 3n 39 34 31 17
TEQ" PAIL alla C7 491 P 304 7-,A . 39 %A 31 3f-TERM PAIL M&PTAN41fF i-AINF r? 401A305 1 r, ft A . 39 3A 31 37T E if" _w-v oL&NA r7 4 -112 a 0 f, 14; A n . 40 as% 41 ATT E 0 14 ;#A I L mQF7QIrE C? (491 A 30r, ?;PIK A 39 34 3? 37TERM RAII wQAIMIVtC.F Cl U91 330h 2;1;0 39 3A 32 17
TERM QATL w-11 YS ly r I uQI 13n? ?rln 39 3A 31 17TERM .4WY 'JAWF r7 AQINU07 14;nn. 49 OA at 47
TEP -Y LIIMVNF Awc 7NO TrF r 7 491 janq 1 Sno * 40 an "1 47
TER" mwy ,E Plm i( C 2 '491 la()Q I Sno . UQ 44 41 47
TERM ".Y 1 '),11 N1 A c 7 '101 1 a I m Irmn UQ UP a I U 7
TER" H*Y 4FSryrF C? U91 A a I I I f, A A UQ UA 41 47
TERM w-v wilyviv r? IQI141Z 11;mn, a9 UA at Ul
TER' WA I MOAf)FInvlr.$: r7 '441410% jr4nn, it) In 31 A?
--!E 0 11 R A T L jLF!t v -1 C Z -4414 SA 7 1 SAn 39 lot II SlT E 44-4 i-f-i m-,F4PTq r? UQjU3nA 7rA 39 Alk ITER" -OATt r7 4jQIU3AQ %?%o 39 xA 31 it?
TERM PAIL -,TLPVS,(l r? .4Q 1 4131 n 71;n, 3Q SA 31 17
YER, -VY tEsFhjrF C 4 Q A (A 1 47rER"rjHWv jq I U4jAq
W(TTVCA ,Y r? 4QIi_4nA - - ___ 44 UA at 47TfQM kwV -P 2W )VI 9' C 7 44 UA at 47
T Of i 4 ___rl 419 1 a I M 11;011.
IERv P4wy vEwFL Tj r? 101 4Q an al 47'?YN ,Lr' Yl T AV 1.1 C I M ' Il ; ;N!
TERM W.Av a 49 am a? -!JF-YFQ- -wy mILF VS-Cl r 7 491 1441 it le nn. PJQ IJA al .47
TEO W : -Al '174*5 CY a a l7jlTi -a- - ,i A .TER-4 -4-Y IL,,ifIrE ri 4011JUIr, r A A UQ an at U?ff 6 4 m t k F r'Am
f E Q4 -4 v 'Viv A 1., a r 7 a 0 1 U I q A 11 49 Uok al Q7
Figure ITT-9. Transportation Network Data Library
41

z '
1011 . . . . . . . . V
0i0.0.. ... . .... ...........
•~~ . . . ..1 .. o . .. ° . . .° . . L
0.00 0 0 0 0 0 0 3 0 0 0 0 0 0 0 0 0 00 1 S 0 0 0 0 0 '
00 0 0-0 4 0 0 -0 0 000-0 0 0-0 00 0 -00 -O - 0--3000-00---30---00--: --
.... ..4 .2 . •
00 .0 00 0 00 0 00 0 -o ~ 0 0 0 0 0 0 0 , 0 0 0
0 000. 0.00. 00000 00 0 00 0 0 0 0 0 0 0 0 0 O0 0 0 S0 0 0
000 0 00 0 000 0 00 00 00 ~ 00 00 00 0 O 00 S00 34 o00420

LOGATAK simulation. This permanent file can be converted to punched cards
(CHNET cards, see Fable IV-ll) and utilized as input to LOGATAK. Only the
"turn on" time needs to be added in card columns 11-20.
43

CHAPTER 1V
LOGATAK INPUTS
1. GENERAL DESCRIPTION
The user must describe the transportation network, the supoly
nodes, the classes of supply, and the deiay distributions usea in the
simulation. In addition, changes can tbe made to most of the parameters
during the course of a simulation run and attacks on the transportation
network can be made at any time. The input data for the LOGATAK model is
read by the modules DATAN, RONET, INITP, INPAR, and FILE at the beginning
of the model run. Data to change the transportation network (CHNET),
change distribution parameters (CHPAR), change supply parameters (CHPRM),
attack supply inventories (ATSUP), attack the network (ATACK), and jam
communications (CCCUB), are read in during the model run in the order and
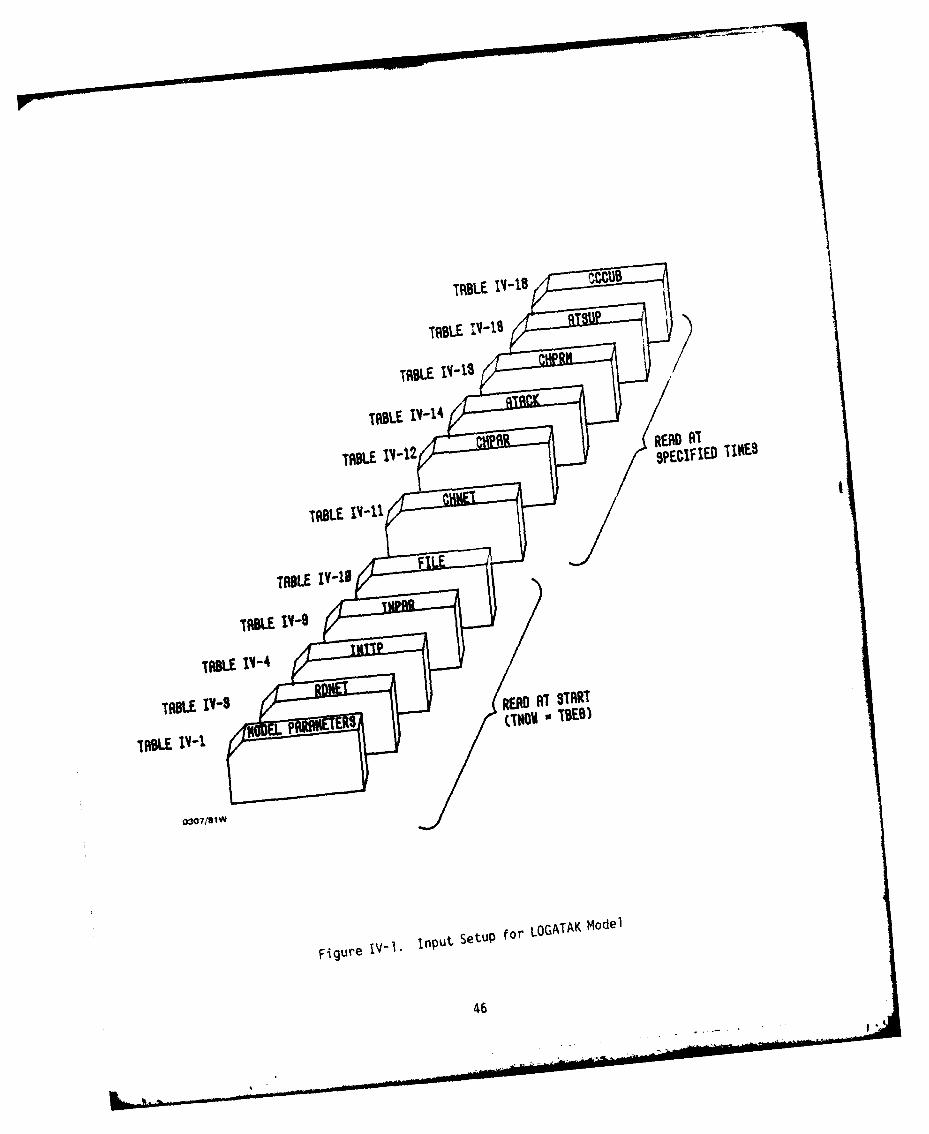
at times prespecified in the DATAN input. Figure IV-l shows a schematic of
the input stream for the LOGATAK model.
This chapter describes the input data and the data formats
required in each of the above specified areas. The deck to restart the
model from a previously saved position is also described.
2. MODEL PARAMETERS
The first cards in a model run specify general model parameters.
Table IV-l shows the format for the five card types that are read by the
module DATAN. They are self-explanatory with the possible exception of the
Exogenous Events Cards. These cards are the primary method of scheduling
events within the model. (Future events may also be scheduled during the
run in the CHNET and ATACK card decks.) The end of simulation event and
the warmup event are alternatives to the time specifications on the Control
Parameters Card. KTRACE is a trace of logical events in the model and
LTRACE is a detailed trace of the internal linkage between modules. Both
traces may be turned on or off at any time during the simulation. The save
45
REI D E.
ThB I ~~AB L IUV -140
I E B
0 3 0 7181W
Figure 1'i.nput Setup for LOGATAK Model

TABLE IV-l. MODEL PARAMETER CARD FORMATS
RUN TYPE CARD FORMAT
COLUMN FORMAT DESCRIPTION
!-I0 lOX ENTER LOGATAK11-20 FlO.O CENTRAL PROCESSOR TIME LIMIT MINUS
REPORT TIME21-30 F1O.O RESTART SWITCH
.LE. 0 - NORMAL START
.GT. 0 - RESTART
MODEL AND RUN IDENTIFIERS CARD FORMAT
COLUMN FORMAT DESCRIPTION
1-12 A12 ANALYST NAME13-16 14 PROJECT NUMBER17-18 12 MONTH19-20 12 DAY OF THE MONTH21-24 14 YEAR25-28 14 NUMBER OF CYCLES OF THE SIMULATION IN
THIS RUN29-40 A12 MODEL NAME41-58 Al8 RUN NAME59-80 22X BLANK
UNIT LABELS CARD FORMAT
COLUMN FORMAT DESCRIPTION
1-6 A6 UNIT OF TIME7-12 A6 UNIT OF WEIGHT13-18 A6 UNIT OF CUBE19-24 A6 UNIT OF DISTANCE25-80 56X BLANK
47

TABLE IV-i. MODEL PARAMETER CARD FORMATS (CONTINUED)
CONTROL PARAMETERS CARD FORMAT
COLUMN FORMAT DESCRIPTION
1-5 15 STOPPING RULE SWITCH (MSTOP) -
.EQ. 0 - STOP SIMULATION WHENEVENT ENDSM (EVENT CODE -l)IS ENCOUNTERED
.GT. 0 - STOP SIMULATION WHENSIMULATED TIME EXCEEDS ENDINGTIME TFIN
6-15 lOX BLANK16-20 15 VARIABLE NEP, ENTER 121-30 F1O.3 TBEG, INITIAL VALUE OF SIMULATED TIME31-40 FlO.3 TFIN, LARGEST VALUE OF SIMULATED TIME
TO BE REPRESENTED IF MSTOP .GT. 041-50 F1O.3 TWARM, SIMULATED TIME AT WHICH STA-
TISTICAL ARRAYS ARE TO BE CLEARED51-54 14 RANDOM NUMBER SEED55-80 25X BLANK
EXOGENOUS EVENTS CARD FORMAT*
COLUMN FORMAT DESCRIPTION
1-8 18 ENTER 1, THE NUMBER OF THE GASP TIME FILE9-17 F9.3 SIMULATION TIME AT WHICH EVENT SHOULD OCCUR18-20 3X BLANK21-23 13 EVENT CODE
-1 END OF SIMULATION EVENT-2 KTRACE-3 LTRACE-4 WARMUP EVENT-5 SAVE RUN EVENT-6 CORE REPORT-8 EXECUTE A ZINIT SUBNODE
-99 EXECUTE TARGAA24-26 3X BLANK27-35 F9.3 ATTRIBUTE 3 OF EVENT. ZINIT SUBNODE
NUMBER IF EVENT CODE IS -8. NUMBER OFBOMBS AVAILABLE IF EVENT CODE IS -99.
48

TABLE V-I. MODEL PARAMETER CARD FORMATS (CONTINUED)
COLUMN FORMAT DESCRIPTION36-44 F9.3 ATTRIBUTE 4 OF EVENT. SWTICH TO RESCHED-
ULE TARGAA IF EVENT CODE 1S -99. O-*lO,]-YES)
45-53 F9.3 ATTRIBUTE 5 OF EVENT. TIME DELAY FORTARGAA RESCHEDULING IF EVENT CODE IS -99.
54-62 F9.3 ATTRIBUTE 663-71 F9.3 ATTRIBUTE 7 (ATTRIBUTES 3-8 ARE GENERALLY
BLANK)72-80 F9.3 ATTRIBUTE 8
THE SUBDECK OF EXOGENOUS EVENTS CARDS MUST BE HEADED BY A CARD CONTAIN-ING -1 IN COLS 7-8 TO CAUSE INITIALIZATION OF ARRAY SETS AND IS ENDED WHENA CARD WITH 0 IN COL 8 IS ENCOUNTERED.
49
. . l
run event causes all model data values to be placea on tiLE3 for 'use ;n
restarting the model from that point in 3imulated time. The core report
request causes a short report on <ey array utilization in the model. Eacn
of the above events requires only the time of occurrence and the event coae
attributes to be specified on the cara.
The other two event codes reQuire additional attributes to be
soecified. The -3 event code causes the ZINIT subnode with the numoer in
attribute 3 to be executed. Table IV-2 lists the available options in
LOGATAK. The -99 event code causes the Target Allocation Algorithm
(TARGAA) to be executed. A list of preferred targets will be printed out
and the number of bombs specified in attribute 3 will be used to schedule
attacks. TARGAA can be rescheduled periodically by setting the values in
attributes 4 and 5.
3. TRANSPORTATION NETWORK
The links and terminals of a transportation network and all their
characteristics are defined in the RDNET input data deck at the beginning
of the model run. Table IV-3 shows the formats for the five types of RDNET
cards; FILE, LINK, TERM, MODE, and END. Figure IV-2 shows the input card
order for the RDNET deck. The FILE card is always read from FILES, the
card reader and all subsequent cards are read from the file specified on
the FILE card. This permits a voluminous RDNET deck to be placed on a
separate file. For most efficient core utilization, terminals should be
numbered consecutively, starting with 33. The first 30 terminals are
automatically assigned to the 5 sources of supply, the 5 intermediate
supply points, and the 20 demand generators in the model. Terminals 31 and
32 are assigned for use by TARGAA as artificial source and artificial sink
terminals.
TERM cards and LINK cards can be intermixed in the deck. The
read operation ceases when an END card is encountered. For initial execu-
tion of RDNET, the six MODE cards are read. For subsequent executions of
RDNET (TNOW.NE.TBEG), the MODE cards are not required. The links in a
50

TABLE iV-2. UINIT SUBNODES WHICH CAN BE SCHEDULED EXOGENOUSLY
SUBNODENUMBER PURPOSE
2 RDNET - ADDITIONS TO THE TRANSPORTATION NETWORK DURING
THE MODEL RUN
3 CHNET - CHANGE THE TRANSPORTATION NETWORK PARAMETERS
4 ATACK - ATTACKS ON THE TRANSPORTATION NETWORK
5 CHPRM - CHANGE THE SUPPLY PARAMETERS
6 CHPAR - CHANGE THE DELAY DISTRIBUTION PARAMETERS
(PARAMS)
8 INTERIM SUPPLY REPORT
9 INTERIM TRANSPORTATION REPORT
10 ATSUP - ATTACK SUPPLY
11 CCCUB - COUNTER - C3
12 SHPMT - EXOGENOUS SHIPMENTS
51
L h - -, -- -• .. .. . . .. .. ... . ..... -,

TABLE !V-3. RDNET DATA CARD FORMATS
SET OF DATA CARDS FOR DESCRIBING "INKS AND TERMINALS 'N A -RANSPORTATIONNETWORK FOR A MODEL RUN. CONTINUOUS READ UNTIL LAST CARD .ITH END CARDTYPE DESIGNATION. SUBSEQUENT CARDS READ FROM FILE SPECIFIED ON FIRST CARD.
FILE DEFINITION CARD - ALL SUBSEQUENT CARD 1MAGES ARE READ cROMHE FILE SPECIFIED
CCl -CC5 A5 CARD NAME - RDNETCC6 -CC1O AS CARD TYPE - FILECC11-CC20 110 FILE NUMBERCC21-CC8O 60X BLANK
LINK DEFINING CARD -
CC1 -CC5 A5 CARD NAME - RDNETCC6 -CCIO A5 CARD TYPE - LINK OR END, LEFT JUSTIFIEDCCII-CCIS 15 TERMINAL NUMBERCC16-CC2O 15 TERMINAL NUMBERCC21-CC30 FlO.3 LENGTH OF LINKCC31-CC4D F1O.3 CAPACITY OF LINK IN WEIGHT UNITS (NEGATIVE
SIGN INDICATES THAT THE LINK IS NOT CURRENTLYACTIVE)
CC41-CC45 F5.O VULNERABILITY FACTORCC46-CC50 F5.O TIME TO REBUILDCC51-CC55 F5.O RATE OF TRAVEL ON LINKCC56-CC60 15 MODE OF LINKCC61-CC7O lOX NOT USEDCC71-CC72 12 STATIX - AVG. TONS ON LINK (3)CC73-CC74 12 STATIX - TOTAL TONS OVER LINK (1)CC75-CC76 12 STATIX - AVG. CAPACITY OF LINK (3)CC77-CC80 4X NOT USED
TERMINAL DEFINING CARD -
CC1 -CC5 A5 CARD NAME - RDNETCC6 -CC1O A5 CARD TYPE - TERM, LEFT JUSTIFIEDCC11-CC15 15 TERMINAL NUMBERCC16-CC2O I5 MODE OF TERMINALCC21-CC30 FIO.3 NOT USED ON TERM CARDCC31-CC40 FO.3 CAPACITY OF TERMINAL (NEGATIVE SIGN INDICATES
THAT THE TERMINAL IS NOT CURRENTLY ACTIVE)CC41-CC45 F5.O VULNERABILITY FACTORCC46-CC50 F5.O TIME TO REBUILD
INDEX TO PROBABILITY DISTRIBUTIONS FOR DELAY -CC51-CC55 15 - SHIPMENT CONSOLIDATION (NEGATIVE
VALUE CAUSES CHANGE IN SHIPMENT SIZE)CC56-CC60 I5 - LOADING
52 I *

fABLE IV-3. RDNET DATA CARD FORMATS (CONTINUED)
CC61-CC65 [5 - TERMINAL THROUGHPUT (NEGATIVE VALUEFORCES ROUTE RECOMPUTATION)
CC66-CC70 T5 - UNLOADING3C71-CC72 12 STATIX - AVG. TONS IN THIS TERMINAL ,'3)CC73-CC74 12 STATIX - TOTAL TONS THROUGH TERMINAL (1)CZ75-CC76 2 STATIX - TOTAL TONS DELIVERED FROM TERM. (2)CC77-CC78 12 STATIX - AVG. CAPACITY OF THIS TERMINAL (3)CC79 Ii STATIX - AVG. NO. OF THIPMENTS-ARRIVAL 3 3)CC80 11 STATIX - AVG. NO. OF SHIPMENTS-DEPART. Q (3)
MODE DEFINITION CARD - USED ONLY FOR INITIAL RONET iN MODELCCI -CC5 A5 CARD NAME - RDNETCC6 -CC1O A5 CARD TYPE - MODECCll-CC15 15 MODE CODE - ONE CARD FOR EACH MODE TYPECC16-CC20 5X NOT USEDCC21-CC30 FIO.3 MAXIMUM NUMBER OF WEIGHT UNITS THAT CAN BE
CARRIED IN THIS MODE AT ONE TIMECC31-CC40 FIO.3 MAXIMUM NUMBER OF CUBE UNITS THAT CAN BE
CARRIED IN THIS MODE AT ONE TIMECC47-CC50 F10.3 STATIX - TOTAL UNITS OF WEIGHT TIMES UNITS
OF DISTANCE TRANSPURTED IN THIS MODE (1)CC51-CC80 30X NOT USED FOR MODES 2 - 6.
FOR MODE 1CC51-CC55 15 LOWEST PRIORITY SHIPMENT THAT CAN TRVL BY AIRCC56-CC60 15 UPPER LIMIT ON ARRIVAL QUEUE SIZECC61-CC65 15 UPPER LIMIT ON DEPARTURE QUEUE SIZECC66-CC70 15 STATIX - TOTAL SHIPMENTS SENT ALL MODES (1)CC71-CC75 15 STATIX - TOTAL SHIPMENTS LOST ALL MODES (1)CC76-CC80 15 STATIX - TOTAL SHIPMENTS DELIVERED ALL MODES (1)
53

INITIAL RONET
RONETFILESPECIFIES FILE THAT SUBSEQUENT_r CARDS WILL BE READ FROM
0307/81W
Figure IV-2. Input Setup for RDNET Module
54

transportation network are deTined by the terminals at each end. The moaei
orders and numbers the link for ease of access after reaaing all RDNETLINK
cards. RONET can be used later in a model run to read in aaditional termi-
nals and/or links. This causes a renumbering of the linKs and the model
prints a table showing the cross reference from the old to the new link
numbering.
The first 30 terminals must be linked into the network at the
desired terminals to specify the geographic location of the supply nodes.
A supply node terminal may be linked in at a number of different points in
the network to show different geographic locations over time. In this
case, all but one of the links should have a negative capacity, indicating
that they are inactive at the current time. They can subsequently be
"turned on" in turn with the CHNET capability.
4. SUPPLY PARAMETERS
The characteristics of supply classes and supply nodes are speci-
fied on INITP cards. These cards initialize permanent attribute data sets
in the model and are quite flexible in format and use. Some portion or all
of the supply nodes may be utilized in any given model run. One or more
classes of supply can be represented at each supply node by preparing one
or more INITP cards of the proper type. In general, there is no fixed
limit on the number of classes represented at any node in the model. The
supply characteristics of each node in the model are specified by a group
of INITP cards. The formats for the three INITP card types are shown in
Table IV-4. Card type INITPl is generally blank in CC7-CC8O, but it does
offer a method for specifying data for a number of supply classes or
resources by grouping them into a resource set. The resource set identifi-
cation number is then used in INITP2 cards which causes duplication of the
data sets for all resources in the set.
4.1 ***ALL Node Data
A supply item common (SICOM) data set must be specified for each
item or supply class which is represented in the model run. Each item must
55

TABLE IV-4. INITP DATA CARD FORMATS
PERMAT INPUT DATA.(
CARD TYPE I - RESOURCE SET DEFINITION CARD
COLUMN FORMAT DESCRIPTION
I - 6 A6 ENTER INITP17 - 14 8X IGNORED
15 - 20 16 RESOURCE SET IDENTIFICATION NUMBER21 - 26 6X IGNORED27 - 28 12 CARD SEQUENCE NUMBER (OPTIONAL)29 IX BLANK30 - 31 12 NUMBER OF RESOURCE NUMBERS IN THIS SET32 iX BLANK33 - 38 F6.0 FIRST RESOURCE NUMBER39 - 44 F6.0 SECOND RESOURCE NUMBER
75 - 80 F6.0 EIGHTH RESOURCE NUMBER
ADDITIONAL RESOURCE NUMBERS WILL BE READ FROM SUCCEEDING CARDS UNTIL ADIFFERENT RESOURCE SET NUMBER IS ENCOUNTERED IN CC 15 - 20. THE NUMBEROF RESOURCE NUMBERS IS LIMITED TO 2000 FOR ALL SETS.
56

TABLE TV-4. INITP DATA CARD FORMATS (CONTINUED)
THE SUBDECK OF ALL TYPE 1 CARDS IS FOLLOWED BY A SERIES OF SUBDECKS (,EACHCONTAINING ONE TYPE 2 CARD AND A NUMBER OF TYPE 3 CARDS), ONE FOR EACHNODE THAT REQUIRES PERMAT DATA AND ONE FOR DATA COMMON TO ALL NODES.
CARD TYPE 2 - NODE IDENTIFICATION CARD OR END CARD
COLUMN FORMAT DESCRIPTION
1 - 6 A6 ENTER INITP27 iX BLANK8 - 13 A6 NODE NAME OR ***ALL OR ***END
14 - 80 66X IGNORED
CARD TYPE 3 - ATTRIBUTE SET VALUES CARD
COLUMN FORMAT DESCRIPTION
1 - 6 A6 ENTER INITP37 Ix BLANK8 - 13 A6 RESOURCE FUNCTION
14 iX BLANK15 - 20 16 RESOURCE NUMBER OR RESOURCE SET NUMBER21 IX BLANK22 - 26 A5 FUNCTION TYPE (E.G., SNOD, UNOD, .)
27 - 28 12 CARD SEQUENCE NUMBER (OPTIONAL)29 IX BLANK30 - 31 12 NUMBER OF ATTRIBUTES IN SET (.LE. 20)32 iX BLANK33 - 38 F6.0 1ST, 9TH, AND 17TH ATTRIBUTE VALUES39 - 44 F6.0 2ND, 10TH, AND 18TH ATTRIBUTE VALUES
76 - 80 F6.0 8TH AND 16TH ATTRIBUTE VALUES
IF MORE THAN 8 ATTRIBUTE VALUES ARE NEEDED IN A SET THEY ARE LISTED ON ONEOR TWO SUCCEEDING CARDS WITH THE SAME FORMAT AS INDICATED. CC 8-31 MAY BELEFT BLANK ON THE 2ND AND 3RD CARDS.
57
I.

be given a uniaue identification numDer. Table IV-5 defines the attributes
for the SICOM resource function.
4.2 FSB Node Data
The FSB nodes are the top source of supply in the model. Incom-
ing demands are filled in one or more stages to simulate delays encoun-
tered. The FSB node can handle the same items or classes of suoply as the
lower supply echelons do or it can handle "wholesale" classes which are
groups of items. These classes are specified in attribute 5 of the SICOM
data set. Table IV-6 shows the attributes for the FILTM data set which
specify the delays to be imposed for each class and priority pair.
Table IV-6 also shows the attributes for the PRI (SNOD) data set which
specifies the priority groupings used for the priorities of incoming
demands.
4.3 ASB Node Data
The intermediate supply bases require three types of data sets:
supply parameters (SUPAR), supply item statistics (SUPIST), and demand
statistics (DSTAT). Table IV-7 defines the attributes for each of these
data sets. The key information specified for the ASB node is the initial
balance on hand or inventory level. The ASB node will handle all items or
classes of supply for which there are SUPAR data sets specified.
4.4 DSB Node Data
The DSB nodes are the lowest level supply bases. They generate
demands on the supply system and measure the response of the system to
those demands. The DB nodes require three types of data sets: node
parameters (NODE), supply item demand generation data at a user node
(SIUNOD), and aggregate demand generation data (SAUNOD). Table IV-8
defines the attributes necessary for each of the three data sets. The DSB
node will generate demands periodically for as many items or classes of
supply as there are SIUNOD data sets. The SAUNOD data set will collect
aggregate statistics for all the items at the node. A void SAUNOD card
should be included even if there is only one SIUNOD card since a model
report is triggered by its presence. The three DSB data set types should
be defined for each DSB node which will be active in the model run. The
58
I

TABLE IV-5. SICOM ATTRIBUTES
SICOM (ITEM) - COMMON SUPPLY ITEM DATA
- ONE SET FOR EACH SUPPLY ITEM OR CLASSIN THIS MODEL
- USE CARD TYPE INITP3
ATTRIBUTES
1 - WEIGHT OF THE ITEM/CLASS UNIT
2 - CUBE OF THE ITEM/CLASS UNIT
4 - ITEM TYPE CODE (1 - CONSUMABLE MATERIEL,2 - UNIT EQUIPMENT AND PERSONNEL)
5 - SOURCE OF SUPPLY ITEM IDENTIFICATION NUMBER(GENERALLY THE SAME AS SICOM ID NUMBER)
7 - ITEM SUPPLY PRIORITY
59
AL.
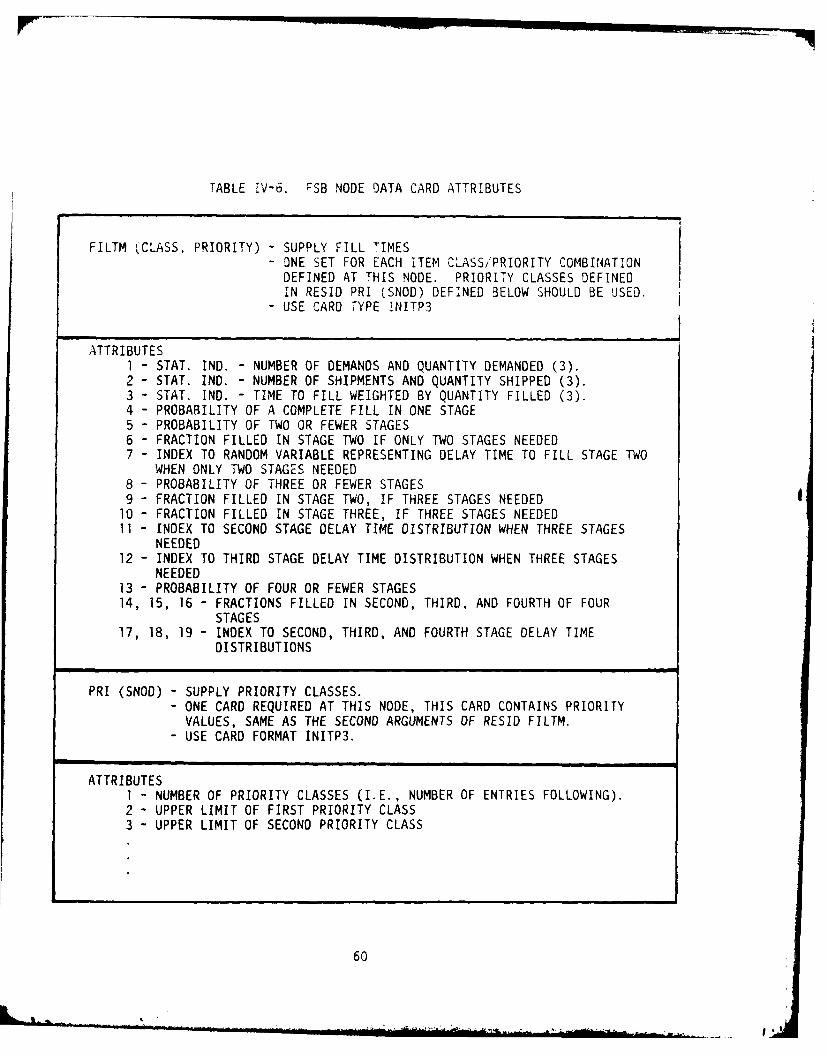
TABLE IV-6. FSB NODE DATA CARD ATTRIBUTES
FILTM (CLASS, PRIORITY) - SUPPLY FILL TIMES- ONE SET FOR EACH ITEM CLASS/PRIORITY COMBINATIONDEFINED AT THIS NODE. PRIORITY CLASSES DEFINEDIN RESID PRI (SNOD) DEFINED BELOW SHOULD BE USED.
- USE CARD TYPE iNITP3
ATTRIBUTESI - STAT. IND. - NUMBER OF DEMANDS AND QUANTITY DEMANDED (3).2 - STAT. IND. - NUMBER OF SHIPMENTS AND QUANTITY SHIPPED (3).3 - STAT. IND. - TIME TO FILL WEIGHTED BY QUANTITY FILLED (3).4 - PROBABILITY OF A COMPLETE FILL IN ONE STAGE5 - PROBABILITY OF TWO OR FEWER STAGES6 - FRACTION FILLED IN STAGE TWO IF ONLY TWO STAGES NEEDED7 - INDEX TO RANDOM VARIABLE REPRESENTING DELAY TIME TO FILL STAGE TWO
WHEN ONLY TWO STAGES NEEDED8 - PROBABILITY OF THREE OR FEWER STAGES9 - FRACTION FILLED IN STAGE TWO, IF THREE STAGES NEEDED
10 - FRACTION FILLED IN STAGE THREE, IF THREE STAGES NEEDED11 - INDEX TO SECOND STAGE DELAY TIME DISTRIBUTION WHEN THREE STAGES
NEEDED12 - INDEX TO THIRD STAGE DELAY TIME DISTRIBUTION WHEN THREE STAGES
NEEDED13 - PROBABILITY OF FOUR OR FEWER STAGES14, 15, 16 - FRACTIONS FILLED IN SECOND, THIRD, AND FOURTH OF FOUR
STAGES17, 18, 19 - INDEX TO SECOND, THIRD, AND FOURTH STAGE DELAY TIME
DISTRIBUTIONS
PRI (SNOD) - SUPPLY PRIORITY CLASSES.- ONE CARD REQUIRED AT THIS NODE, THIS CARD CONTAINS PRIORITY
VALUES, SAME AS THE SECOND ARGUMENTS OF RESID FILTM.- USE CARD FORMAT INITP3.
ATTRIBUTES1 - NUMBER OF PRIORITY CLASSES (I.E., NUMBER OF ENTRIES FOLLOWING).2 - UPPER LIMIT OF FIRST PRIORITY CLASS3 - UPPER LIMIT OF SECOND PRIORITY CLASS
60

TABLE IV-7. ASB NODE DATA CARD ATTRIBUTES
SUPAR (ITEM, SNOD) - SUPPLY ITEM PARAMETERS
- ONE CARD FOR EACH ITEM/CLASS STOCKED AT THIS IODE
- USE CARD TYPE TNITP3
ATTRIBUTES1 - SERVICEABLE BALANCE ON HAND
SUPIST (ITEM, SNOD) - SUPPLY ITEM STATISTICS
- ONE CARD FOR EACH ITEM/CLASS STOCKED AT THIS NODE
- USE CARD TYPE INITP3
ATTRIBUTES1 - STATISTICAL INDEX - SERVICEABLE BALANCE ON HAND (3)
DSTAT (ITEM, SNOD) - ITEM DEMAND STATISTICS
- ONE CARD FOR EACH ITEM/CLASS STOCKED AT THIS NODE
- USE CARD TYPE INITP3
ATTRIBUTESI - STATISTICAL INDEX - NUMBER OF DEMANDS RECEIVED AND
QUANTITY DEMANDED (3)
2 - STATISTICAL INDEX - NUMBER OF DEMANDS COMPLETELYFILLED WITHOUT DELAY AND QUANTITY FILLED (3)
3 - STATISTICAL INDEX - NUMBER OF DEMANDS PARTIALLYFILLED AND QUANTITY FILLED (3)
61

TABLE IV-8. )SB 4ODE DATA 2ARD ATTRIBUTES
NODE (NODTYP) - NODE PARAMETERS- ONE SET COR EACH NODE TYPE DEFINED AT THIS '40DE- USE CARD TYPE INITP3
ATTRIBUTES- DEMAND GENERATION INTERVAL 1N TIME UNITS
2 - NODE PRIORITY
SIUNOD (ITEM) - ITEM DEMAND GENERATION DATA- ONE SET NEEDED FOR EACH ITEM STOCKED AT THIS NODE
- USE CARD TYPE INITP3
ATTRIBUTESI - INDEX OF DISTRIBUTION OF NUMBER OF DEMANDS IN A DEMAND
GENERATION INTERVAL2 - INDEX OF DISTRIBUTION Of QUANTITY PER DEMAND6 - STAT. IND. - NUMBER AND QUANTITY OF SUPPLY REQUISITIONS
SUBMITTED7 - STAT. IND. - QUANTITY DUE IN FROM SUPPLY - A TMST STATISTIC8 - STAT. IND. - DURATION OF DUE INS FROM SUPPLY9 - STAT. IND. - NUMBER AND QUANTITY OF SUPPLY SHIPMENTS RECEIVED
SAUNOD - AGGREGATE DEMAND GENERATION DATA- ONE SET REQUIRED AT THIS NODE- USE CARD TYPE INITP3
ATTRIBUTES6 - STAT. IND. - NUMBER AND QUANTITY OF SUPPLY REQUISITIONS
SUBMITTED7 - STAT. IND. - QUANTITY DUE IN FROM SUPPLY - TMST - TYPE
STATISTIC8 - STAT. IND. - DURATION OF DUE INS FROM SUPPLY9 - STAT. IND. - NUMBER AND QUANTITY OF SUPPLY SHIPMENTS RECEIVED
62

demand frequency and quantity demanded are specifiea for the no,'- -)V indi-
rect reference to the distributions in the INPAR data deck. This ailows
many nodes to use the same distribution if desired.
4.5 INITP Data Deck
Figure IV-3 shows the input deck for the INITP moaule. Only
those supply nodes which are active in the modei require data cards in the
deck. The subdecks for the nodes and the data set caras within each suD-
deck may be placed in any order. Figure IV-3 shows one such ordering.
5. DELAY DISTRIBUTIONS
The LOGATAK Model has complete flexibility in specifying stochas-
tic delay distributions in the input data deck. These distributions are
read in by the INPAR module. The INPAR card formats are shown in
Table IV-9. Note that not only the parameters of the distribution but also
the type of distribution may be altered in the input data deck.
6. ACTIVATING DEMAND GENERATION
There are twenty supply demand generator nodes available in the
model. Whether and when they are activated is determined by the cards
input to the FILE module. There are twenty occurrences of the module FILE
in node ZINIT, indexed 1 through 20 to correspond to demand generator nodes
OSBOl through DSB20. The format of cards for the FILE module is given in
Table IV-lO. The minium deck requires 20 FILE cards with indices I to 20
in CC6-7 and a zero in CCIO. To activate a node, the corresponding FILE
card should be preceded by a FILE card with a I in CC1O and the time of
activation in CC1l-20. Demand generation will then continue periodically
at the interval specified in the INITP3 NODE card.
63
A.'

I+ITP "EN
II
IKI~P2 OSBI
INTP0SPR,
1710re
FiueI-. IptStpfrINITP Module
4 1*ITP2F31664
w "IM

TABLE !V-9. INPAR DATA CARD FORMATS
PROBABILITY DISTRIBUTION PARAMETERS
CARD TYPE I - NUMBER OF DISTRIBUTIONS - ONE CARD ONLY REQUIRED
COLUMN FORMAT DESCRIPTION
1 - 6 A6 ENTER INPARI7 IX BLANK8 - 12 15 NUMBER OF PROBABILITY DISTS. IN MODEL
13 - 80 68X BLANK
CARD TYPE 2 - DISTRIBUTION PARAMETER CARDS - ONE FOR EACH DIST.
COLUMN FORMAT DESCRIPTION
I - 6 A6 ENTER INPAR27 iX BLANK8 - 12 A5 DISTRIBUTION TYPE *
13 iX BLANK14 - 16 13 DISTRIBUTION INDEX NUMBER *17 iX BLANK18 - 25 F8.0 FIRST PARAMETER26 - 33 F8.0 SECOND PARAMETER34 - 41 F8.0 THIRD PARAMETER42 - 49 F8.0 FOURTH PARAMETER50 - 80 31X BLANK
* - SEE FOLLOWING TABLE FOR ALLOWABLE TYPES AND PARAMETER..
- THE NUMBER USED IN THE MODEL DESCRIPTION AND/OR INPUT.
65
• - _ • N

TABLE IV-9. INPAR DATA CARD FORMATS (CONTINUED)
RANDOM VARIABLE TYPES AND PARAMETERS
NAME OR FIRST SECOND THIRD FOURTHDISTRIBUTION INPUT PARAM. PARAM. PARAM. PARAM.
NORMAL NORML MEAN MINIMUM MAXIMUM STANDARDDEVIATION
LOGNORMAL LGNOR MEAN MINIMUM MAXIMUM STD. DEV.ERLANG ERLNG MEAN MINIMUM MAXIMUM ERLANG
PARAMETERPOISSON POSSN MEAN MINIMUM MAXIMUM BLANKGEOMETRIC GEOMT MEAN MINIMUM MAXIMUM BLANKCONSTANT CONST VALUE BLANK BLANK BLANKEMPIRICAL TABLE BLANK NUMBER OF BLANK TYPEDATA ** POINTS IN INDICATOR'
DISTRIBUTIONEND-OF-DECK **END
* - ENTER 0 IF THE DISTRIBUTION IS CONTINUOUS, ENTER 1 IF THE DISTRIBUTION
IS DISCRETE.** - WHEN AN EMPIRICAL DISTRIBUTION IS USED, THE DIST. PARAMETER CARD MUST
BE IMMEDIATELY FOLLOWED BY A SERIES OF TYPE 3 CARDS DEFINING THE POINTSIN THE DISTRIBUTION.
66

TABLE !V-9. INPAR DATA CARD FORMATS (CONTINUED)
CARD TYPE 3 -DISTRIBUTIONS DESCRIBED IN TABULAR FORM]
COLUMN FORMAT DESCRIPTION
I - 6 A6 ENTER INPAR37 -8 2X BLANK9 - 14 F6.0 MINIMUM VALUE OF DISTRIBUTION15 - 18 F4.4 PROB. THAT MINIMUM VALUE WILL OCCUR19 - 24 F6.0 SECOND POINT IN DISTRIBUTION25 - 28 F4.4 PROBABILITY THAT THE RANDOM VARIABLE
WILL NOT EXCEED SECOND VALUE (CUMULATIVFPROB.)
29 - 34 F6.0 THIRD POINT35 - 38 F4.4 CUMULATIVE PROBABILITY OF THIRD POINT39 - 44 F6.0 FOURTH POINT45 - 48 F4.4 CUMULATIVE PROBABILITY OF FOURTH POINT49 - 54 F6.055 - 58 F4.459 - 64 F6.065 - 68 F4.469 - 74 F6.0 SEVENTH POINT75 - 78 F4.4 CUMULATIVE PROBABILITY OF SEVENTH POINT79 - 80 2X BLANK
CONTINUATION CARD
1 - 6 A6 ENTER INPAR37 -8 2X BLANK9 - 14 F6.0 EIGHTH POINT
15 - 18 F4.4 CUMULATIVE PROBABILITY OF EIGHTH POINT
CONTINUED CODING DISTRIBUTION POINTS, SEVEN TO A CARD, USING AS MANY CARDSAS REQUIRED. THE FIRST POINT IN THE DISTRIBUTION WHICH HAS A CUM. PROB. OF1.0 IS CONSIDERED AS THE END OF TABLE.
67

TABLE IV-IO. FILE DATA CARD FORMATS
COLUMN FORMAT DESCRIPTION
- 4 A4 ENTER FILE5 A] CARD TYPE, I - FIRST CARD, 2 - SECOND
CARD6 - 7 12 INDEX OF REFERENCE TO FILE, I.E., VAL
OF ARGUMENT IFIL8 - 10 13 ENTER 1, THE FILE NUMBER FOR THE TIME
FILE11 - 20 FIO.O FIRST ATTRIBUTE-TIME OF OCCURRENCE IF
ARGUMENT OF RTURN IS 0, TIME TO WHICHINCREMENT OBTAINED BY RTURN IS TO BEADDED TO OBTAIN TIME OF OCCURRENCE IFARGUMENT OF RTURN IS POSITIVE.
21 - 30 F1O.O SECOND ATRIB OR NINTH ATRIB ON CARD 231 - 40 FIO.O THIRD ATRIB OR TENTH ATRIB ON CARD 241 - 50 FIO.O FOURTH ATRIB OR ELEVENTH ATRIB ON CARD 251 - 60 F1O.O FIFTH61 - 70 F1O.O SIXTH ATRIB71 - 80 F1O.O SEVENTH ATRIB
THE VERB FILE WILL CONTINUE TO READ EXOGENOUS EVENT CARDS UNTIL IT ENCOUNTERSA CARD WITH FILE 1 IN CC1-5 AND A 0 OR BLANK IN CC8-10. FILE 2 CARDS AREOPTIONAL. USE ONLY IF NEEDED TO SET NON-ZERO VALUES IN ATRIBS 8, 9, 10,AND 11.
68

CHANGING THE IETWORK
The transportation network characteristics may be changed exogen-
ously at any time during the simulation model run. Any previously defined
terminal or link may be activated, deactivated, or have its probability of
destruction, capacity, and time to rebuild changed. For links, the rate of
travel and length of the link may also be changed. The format of CHNET
cards is specified in Table IV-ll. A deck of CHNET cards will be read
whenever subnode number 3 of node ZINIT is executed by an exogenous event
card in the DATAN deck. The actual changes will occur at the time speci-
fied on the CHNET card for the particular terminal or link. Changes to
links and terminals may be intermixed in the CHNET data deck.
8. CHANGING DISTRIBUTIONS
The probability distributions which control the transportation
delays and the demand patterns from the users (e.g., quantity per demand,
number of demands) may be changed or be newly defined at any time during a
model run. Either the parameter values for the distribution, the type of
distribution or both may be changed with the CHPAR module. A deck of CHPAR
cards will be read whenever subnode 6 of node ZINIT is executed by an
exogenous event card in the DATAN deck. The actual parameter changes will
occur at the time the CHPAR cards are read in. The format of CHPAR cards
is shown in Table IV-12.
9. CHANGING SUPPLY PARAMETERS
Any value in a supply parameters permanent attribute set that was
read in on an INITP card can be changed during the model run utilizing the
CHPRM module. This change PERMAT module can also be used to add or delete
entire data sets for any of the nodes in the model. This feature can be
used, for example, to add a supply class to the inventory for one of the
supply bases. The data sets and their attributes are defined in Section D
69

TABLE TV-il. CHNET DATA CARD FORMATS
CARDS TO CHANGE TRANSPORTATION NETWORK CHARACTERISTICS -
CCI - CC5 A5 CARD NAME (CHNET)CC6 - CC7 12 PRIMARY CARD-ENTER 1CC8 - CC1O 3X BLANKCCI1 - CCO F1O.O TIME OF CHANGECC21 - CC25 15 TERMINAL NUMBER OR 0 IF LINK NO. IN CC26-30CC26 - CC3O 15 TERMINAL NUMBER OR LINK NUMBER FOR LINK
CHANGE OR 0 FOR TERMINAL CHANGECC31 - CC40 110 TYPE OF CHANGE REQUESTED -
-1 DEACTIVATE LINK/TERMINAL0 SET CHARACTERISTICS OF LINK/TERMINAL1 ACTIVATE LINK/TERMINAL2 REBUILD LINK/TERMINAL
CC41 - CC50 FlO.O NEW RATE OF TRAVEL ON LINKCC51 - CC6O FiO.O NEW CAPACITY OF LINK/TERMINALCC61 - CC70 F10.0 NEW PROBABILITY OF DESTRUCTIONCC71 - CC80 FlO. O NEW TIME TO REBUILD
IF LENGTH OF LINK IS TO BE CHANGED, INCLUDE A SECOND CARD -
CCl - CC5 A5 CARD NAME (CHNET)CC6 - CC7 12 CONTINUATION CARD-ENTER 2CC8 - CC1O 3X BLANKCC11 - CC2O F1O.O NEW LENGTH OF LINK
IF RATE, CAPACITY, PROB. DESTRUC., OR TIME TO REBUILD ARE NOT TO BE
CHANGED -- ENTER A VALUE OF -1.
END CARD
CCI - CC5 A5 CARD NAME (CHNET)CC6 - CC7 12 ENTER 0CC11 - CC80 73X BLANK
70
I.

TABIE IV-12. CHPAR DATA CARD FORMATS
COLUMN FORMAT DESCRIPTION
1 - 6 A6 ENTER CHPARI7 IX BLANK8 - 25 3A6 NAME OF CHANGE SET (E.G., TIME,
PURPOSE, . .)26 - 30 15 NON-FATAL SWITCH (0 - ERRORS ARE FATAL,
1- ERRORS ARE FLAGGED ONLY)31 - 80 50X BLANK
CARD TYPE 2 - DISTRIBUTION PARAMETER CARDS - ONE FOR EACH DIST. TO BECHANGED
COLUMN FORMAT DESCRIPTION
1 - 6 A6 ENTER CHPAR27 IX BLANK8 - 12 A5 DISTRIBUTION TYPE *
13 iX BLANK14 - 16 13 DISTRIBUTION INDEX NUMBER **17 iX BLANK18 - 25 F8.O FIRST PARAMETER26 - 33 F8.0 SECOND PARAMETER34 - 41 F8.O THIRD PARAMETER42 - 49 F8.0 FOURTH PARAMETER50 - 80 31X BLANK
- SEE FOLLOWING TABLE FOR ALLOWABLE TYPES AND PARAMETERS.**-THE NUMBER USED IN THE MODEL DESCRIPTION AND/OR INPUT.
71
• * TH NUBER SEDIN HE ODELDESRIPION ND/R IPUT

TABLE IV-12. CHPAR DATA CARD FORMATS (CONTINUED)
RANDOM VARIABLE TYPES AND PARAMETERS
NAME FOR FIRST SECOND THIRD FOURTHDISTRIBUTION INPUT PARAM. PARAM. PARAM. PARAM.
NORMAL NORML MEAN MINIMUM MAXIMUM STANDARDDEVIATION
LOGNORMAL LGNOR MEAN MINIMUM MAXIMUM STD. DEV.ERLANG ERLNG MEAN MINIMUM MAXIMUM ERLANG
PARAMETERPOISSON POSSN MEAN MINIMUM MAXIMUM BLANKGEOMETRIC GEOMT MEAN MINIMUM MAXIMUM BLANKCONSTANT CONST VALUE BLANK BLANK BLANKEMPIRICAL TABLE BLANK NUMBER OF BLANK TYPE
DATA ** POINTS IN INDICATOR*DISTRIBUTION
END-OF-DECK **END
* - ENTER 0 IF THE DISTRIBUTION IS CONTINUOUS, ENTER 1 IF THE DISTRIBUTION
IS DISCRETE.- WHEN AN EMPIRICAL DISTRIBUTION IS USED, THE DIST. PARAMETER CARD MUST
BE IMMEDIATELY FOLLOWED BY A SERIES OF TYPE 3 CARDS DEFINING THE POINTSIN THE DISTRIBUTION.
72

TABLE IV-12. CHPAR DATA CARD FORMATS (CONTINUED)
CARD TYPE 3 -DISTRIBUTIONS DESCRIBED IN TABULAR FORM
COLUMN FORMAT DESCRIPTION
1-6 A6 ENTER CHPAR37 -8 2X BLANK9 - 14 F6.0 MINIMUM VALUE OF DISTRIBUTION
15 - 18 F4.4 PROBABILITY THAT MINIMUM VALUE WILL OCCUR19 - 24 F6.0 SECOND POINT IN DISTRIBUTION25 - 28 F4.4 PROBABILITY THAT THE RANDOM VARIABLE
WILL NOT EXCEED SECOND VALUE (CUMULATIVEPROB.)
29 - 34 F6.0 THIRD POINT35 - 38 F4.4 CUMULATIVE PROBABILITY OF THIRD POINT39 -44 F6.0 FOURTH POINT45 - 48 F4.4 CUMULATIVE PROBABILITY OF FOURTH POINT49 - 54 F6.055 - 58 F4.459 - 64 F6.065 - 68 F4.469 - 74 F6.0 SEVENTH POINT75 - 78 F4.4 CUMULATIVE PROBABILITY OF SEVENTH POINT79 - 80 2X BLANK
CONTINUATION CARD
I - 6 A6 ENTER CHPAR37 -8 2X BLANK9 - 14 F6.0 EIGHTH POINT
15 - 18 F4.4 CUMULATIVE PROBABILITY OF EIGHTH POINT
CONTINUE CODING DISTRIBUTION POINTS, SEVEN TO A CARD, USING AS MANY CARDSAS REQUIRED. THE FIRST POINT IN THE DISTRIBUTION WHICH HAS A CUM. PROB.OF 1.0 IS CONSIDERED AS THE END OF TABLE.
73

of this cnapter. The format of CHPRM cards is shown in Table IV-i3. Eacn
CHPRM deck consists of a CHRPMl card that labels it, followed by a sequence
of CHPRM2 caras that specify the data set to be changed by node name and
data set name. If more than 4 elements of a data set are to be changed,
one or more continuation cards of type CHPRM3 must foilow a CHPRM2 :ara.
The last CHPRM2 card in the deck must have ***END in CC7-CC12. The type of
change to be performed is specified on each CHPRM2 cara with the following
codes:
CHGEL - change one element (add the given value to the existing value)
SETEL - set one element (see the value to the given value)
SETSET - set the values of a set of attributes
ADDSET - add the set of attributes to the model
RELSET - release a set of attributes from the model
MLTEL - multiply the value of one element by the given value.
A deck of CHPRM cards will be read whenever subnode 5 of node ZINIT is
executed by an exogenous event card in the DATAN deck. The actual changes
will occur at that time.
10. SCHEDULING NETWORK ATTACKS
Attacks on links and terminals in the transportation network may
be scheduled exogenously at any time. One card is used in the ATACK deck
for each sortie or attack on a single transportation element. The card
specifies the time of the attack and enables the user to change any of the
characteristics of the link or terminal prior to the attack. The model
then calculates the effect of the attack, reduces the capacity, and sched-
ules a rebuild event to restore the existing capacity. The format of ATACK
cards is specified in Table IV-14. A deck of ATACK cards will be read
whenever subnode number 4 of node ZINIT is executed by an exogenous event
card in the DATAN deck. Attacks to links and terminals may be intermixed
in the ATTACK deck. Links may be identified by their number or by their
two end terminals. The former should be used if there is more than one
link between the same two terminals to insure that the proper link is
attacked.
74 " 1J

TABLE IV-13. CHPRM DATA CARD FORMATS
DECK OF CHPRM TO CHANGE PERMAT DATASETS -
CHPRMI CARD -
CC 1-CC 6 A6 ENTER CHPRM1CC 7-CC12 A6 OPTIONAL NAME FOR THIS CHANGE SETCC13-CC14 12 NON-FATAL SWITCH (O-ERRORS ARE FATAL, I-INPUT
ERRORS ARE FLAGGED ONLY)
CHPRM2 CARD -
CC 1-CC 6 A6 ENTER CHPRM2CC 7-CC12 A6 TYPE OF CHANGE - CHGEL, SETEL, SETSET, ADDSET,
RELSET OR MLTEL. (***END FOR LAST CARD)CC13-CC17 A5 NAME OF NODE DATASET IS ASSOCIATED WITH OR
**ALLCC18-CC23 A6 PERMAT RESOURCE FUNCTION NAME (E.G., SUPAR,
SICOM)CC24-CC33 IlO RESOURCE IDENTIFIER (E.G., ITEM NUMBER)CC34-CC37 A4 FUNCTION TYPE (E.G., SNOD, SNOI, MNOD)CC38-CC40 13 ATTRIBUTE NUMBER OF NUMBER OF ATTRIBUTESCC41-CC5O F1O.O SINGLE VALUE TO BE USED OR FIRST ATTRIBUTE
(FOLLOWING ONLY USED FOR ADDSET AND SETSET)CC51-CC6O F1O.O SECOND ATTRIBUTECC61-CC70 F1O.O THIRD ATTRIBUTECC71-CC80 F1O.O FOURTH ATTRIBUTE
CHPRM3 CARD - ONLY USED FOR ADDSET OR SETSET WITH MORE THAN 4, 11, OR 18ATTRIBUTES.
CC 1-CC 6 A6 ENTER CHPRM3CC 7-CC1O 4X NOT USEDCC11-CC20 F1O.O FIFTH, TWELFTH, OR NINETEENTH ATTRIBUTECC21-CC3O F1O.O SIXTH, THIRTEENTH, OR TWENTIETH ATTRIBUTECC31-CC40 F1O.O SEVENTH OR FOURTEENTH ATTRIBUTECC41-CC50 F1O.O EIGHTH OR FIFTEENTH ATTRIBUTECC51-CC60 F1O.O NINTH OR SIXTEENTH ATTRIBUTECC61-CC70 F1O.O TENTH OR SEVENTEENTH ATTRIBUTECC71-CC80 FIO.O ELEVENTH OR EIGHTEENTH ATTRIBUTE
LAST CARD IN DECK IS A CHPRM2 CARD WITH ***END IN CC 7-CC12.FOR A VACUOUS DECK, THE ***END CARD MAY BE A CHPRMI CARD.
75
.-6,*

TABLE IV-14. ATACK DATA CARD FORMATS
CARDS TO ATTACK TRANSPORTATION NETWORK -
CCl - CC5 A5 CARD NAME (ATACK)CC6 - CC7 12 PRIMARY CARD - ENTER 1CC8 - CCIO 3X BLANKCC11 - CC20 FlO.O TIME OF ATTACKCC21 - CC25 15 TERMINAL NUMBER OR 0 iF LINK NO. IN CC26-30CC26 - CC30 15 TERMINAL NUMBER OR LINK NUMBER FOR LINK
CHANGE OR 0 FOR TERMINAL CHANGECC31 - CC40 I10 TYPE OF CHANGE REQUESTED - 3, ATTACKCC41 - CC50 F1O.O NEW RATE OF TRAVEL ON LINKCC51 - CC60 F1O.O NEW CAPACITY OF LINK/TERMINALCC61 - CC70 F1O.O NEW PROBABILITY OF DESTRUCTIONCC71 - CC80 FIO.O NEW TIME TO REBUILD
IF LENGTH OF LINK IS TO BE CHANGED, INCLUDE A SECOND CARD -
CC1 - CC5 A5 CARD NAME (ATACK)CC6 - CC7 12 CONTINUATION CARD - ENTER 2CC8 - CC1O 3X BLANKCC11 - CC20 F1O.O NEW LENGTH OF LINK
END CARD
CC1 - CC5 A5 CARD NAME (ATACK)CC6 - CC7 12 ENTER 0CC8 - CC8O 73X BLANK
IF RATE, CAPACITY, PROB. DESTRUC., OR TIME TO REBUILD ARE NOT TO BECHANGED -- ENTER A VALUE OF -1. THE OLD VALUE FOR PROBABILITY OFDESTRUCTION WILL BE USED FOR THIS ATTACK. OTHER NEW VALUES (RATE,CAPACITY, . .) WILL BE USED AS THE VALUE THAT THE LINK/TERM ISRESULT TO.
76
-. - . .I. i

11. SCHEDULING SUPPLY POINT ATTACKS
Attacks on intermediate stockage points may be scheduled exogen-
ously at any time. One card is used in an ATSUP deck for each attack on a
supply point. All classes of material or soecific classes may be destroyed
as specified on the ATSUP card. The card specifies the time of the attacK
and the probability of destruction. The model then calculates the effect
of the attack, reduces the balance on hand, and orders the materiel
destroyed to replenish the inventory levels. The format of ATSUP cards is
specified in Table IV-15. A deck of ATSUP cards will be read whenever
subnode number 10 of node ZINIT is executed by an exogenous event card in
the DATAN deck. Supply points are identified on the ATSUP cards by their
node number in the LOGATAK model description. These numbers are shown in
Table IV-15.
12. SCHEDULING COMMUJNICATIONS JAMMING
Jamming of information about the condition of the transportation
network may be scheduled exogenously at any time. One card is used in a
CCC(JB deck to initiate jamming of information for a link in the network.
Jamming may be scheduled by the model to stop after a given period of time
or it may be turned off exogenously by another CCCUB card. Information
about the link capacity and the traffic on the link is denies to the trans-
portation routing logic while the communications jammed. The format of
CCCUB cards is shown in Table IV-16. A deck of CCCUB cards will be read
whenever subnode number 12 of node ZINIT executed by an exogenous event
card in the DATAN deck. Links are identified by two end terminal numbers
or the l ink number on the CCCUB card.
13. RESTART INPUT DECK
The major input to a restart run is a Restart File containing the
status of the model saved at some point during an earlier run. The model
77
I.

TABLE IV-15. ATSUP DATA CARD FORMATS
CARDS TO ATTACK SUPPLY INVENTORIES -
CCI - CC5 A5 CARD NAME (ATSUP)CC6 - CC7 12 PRIMARY CARD - ENTER 1OC8 - oCiO 3X BLANKCCII - CC20 F1O.O TIME OF ATTACKCC21 - CC30 FIO.O NUMBER OF NODE ATTACKED*CC31 - CC40 F1O.O NUMBER OF PARAMETER SLOT OF ATSUP TO
SCHEDULE REPLENISHMENT**CC41 - CC50 FlO.O PROBABILITY OF DESTRUCTION-OR- NEGATIVECC51 - CC60 F1O.O SUPPLY ITEM/CLASS NUMBER-OR-ZERO FOR ALL
ITEMS/CLASSESCC61 - CC80 20X BLANK
END CARD
CCl - CC5 A5 CARD NAME (ATSUP)CC6 - CC7 12 END CARD - ENTER 0CC8 - CC80 73X BLANK
ASBOl - 6 ASBO1 - I
ASB02 - 7 ASB02 - 2ASB03 - 8 ASB03 - 3ASB04 - 9 ASB04 - 4ASB05 - 10 ASB05 - 5
78

TABLE IV-16. CCCUB OATA CARD FORMATS
CARDS TO JAM COMMUNICATIONS IFROM A LINK-
CCI - CC5 A5 CARD NAME (CCCUB)
CC6 - CC7 12 PRIMARY CARD - ENTERCC8 - CCIO 3X BLANK
CCI! - CC20 FIO.O TIME OF CHANGE IN COUNTER C-CUBE ACTIVITYCC21 - CC25 15 TERMINAL NUMBER OR 0 IF LINK INO. N CC26-30CC26 - CC30 15 TERMINAL NUMBER OR LINK NUMBER !F 0 IN
CC21-CC25CC31 - CC40 I0 KEY TO EVENT TYPE
(0 - BEGIN A JAM1 - END A JAM)
CC41 - CC50 FIO.O PROBABILITY OF A SUCCESSFUL JAM (.6=60)PERCENT CHANCE OF A JAM)
CC51 - CC60 FIO.O LENGTH OF JAM(.GE.O - TIME VALUE,.LT.O - NEGATIVE INDEXTO PARAM DISTRIBUTION)
CC61 - CC8O 20X BLANK
END CARD
CCI - CC5 A5 CARD NAME (CCCUB)CC6 - CC7 12 END CARD - ENTER 0CC8 - CC80 73X BLANK
79

can be restarted at that ooint in simuiation time and continued for 3n
arbitrary period of time. in ddition to the Restart File, the model
requires d minimum of four input cards. Additional cards to schedule
exogenous events after the restart time may be included optionally. The
user is remined that all events in the time file on the Restart File are
waiting to occur and should not be reentered in card form. Figure !V-4
shows the card deck setup "or a restart run. The format for the LOGATAK
card is shown in Table iV-17. The format for the Restart File Iaentifica-
tion card is shown in Table IV-18. The restart run can proceed only if the
identifiers on this card match those read from the header record of the
Restart File. For reference, when a Restart File is initially created, a
notice is written which includes the format and content of the restart file
identification card which will match the header record on the file. The
thm:d card contains the amount of additional time to be simulated and the
warmup interval. This card is described in Table IV-19. The fourth and
last card of the minimum restart data deck is a card with a zero in
column 8 representing the end of the exogenous events subdeck.
If exogenous events are to be read from cards by a restart run,
they are included between the third and fourth cards in the four-card deck
just outlined. Their format is that given in Table IV-l. Note that regard-
less of whether exogenous events are included, the initial card of this
subdeck a described in Table IV-l is not desirable in a restart run since
its purpose - to trigger initialization of the event filing array - is
antithetical to the purpose of a restart run, namely to start with the
files of the model at more realistic states than the empty one used when
starting from cards.
Figure IV-4 also shows optional subdecks of change cards which
may be read by the model in the order and at the times specified by exogen-
ous event cards or existing events in the time file. These decks have been
previously described in this chapter.
80

ITABLE IV-!7. LOGATAK CARD FORMAT FOR RESTART
FORTRAN
COLUMN FORMAT DESCRIPTION
1-10 lOX ENTER "LOGATAK" IN COLS 1-6
11-20 F1O.O CENTRAL PROCESSOR TIME LIMIT IN SECONDS -
CONTROL IS GIVEN TO THE END-OF-RUN REPORTING
AND EXIT SEQUENCE IF THE ELAPSED CENTRAL
PROCESSOR TIME SINCE THE RESTART RUN BEGAN
EXCEEDS THIS LIMIT
21-30 FlO.O RESTART SWITCH, SET TO 1.
81
- ~ 2~ -'

TABLE IV-18. RESTART FILE IDENTIFICATION CARD FORMAT
FORTRAN
COLUMN FORMAT DESCRIPTION
1-6 A6 "RESTART," CARD IDENTIFIER
7-8 2X IGNORED
9-20 2A6 MODEL NAME
21-22 2X IGNORED
23-40 3A6 RUN NAME
41-42 2X IGNORED
43-44 12 MONTH
45-46 12 DAY
47-50 14 YEAR
51 Ix IGNORED
52-61 F1O.3 SIMULATON TIME AT WHICH RESTART FILE WAS
WRITTEN
62 iX IGNORED
63-66 14 PROJECT NUMBER
67-68 2X IGNORED
69-80 2A6 ANALYST'S NAME
82

TABLE IV-19. RESTART CONTROL PARAMETERS CARD FORMAT (REGASP)
FORTRANCOLUMN FORMAT DESCRIPTION
1-6 A6 "REGASP," CARD IDENTIFIER
7-10 4X IGNORED
11-20 F1O.3 AMOUNT OF TIME TO BE SIMULATED
21-30 F1O.3 WARMUP INTERVAL AFTER WHICH STATISTICSARRAYS ARE CLEARED a/
31-40 F1O.3 RANDOM NUMBER SEED; IF ZERO, THAT SPECIFIEDIN THE SAVRUN FILE IS USED
41-80 40X IGNORED
a. IF THE WARMUP INTERVAL PLUS THE TNOW AT WHICH RESTART OCCURS IS LESSTHAN TBEG OF THE ORIGINAL RUN, I.E., IF (WARMUP INTERVAL) <- (TNOW ATRESTART), NO WARMUP EVENT OCCURS.
83~i

C PRI
ATRCKREAD ATSPECIFIED TIMES
RESTART FIRLE
5 R STR K 0 ..R A T R S A T T N
020T91
ESRT FI uE IV4 RetrDekCrStu
ICRTI84

14. CDC CONTROL CARDS
The source code for the LOGATAK model is maintained as a CDC
UPDATE file on tape. Changes are made to the code utilizing the UPDATE
capability and the model is loaded from a binary version of the code stored
on the same tape. To save reloading time for each nun, an absolute load is
stored on a disk file and is used for each model run. The control cards to
update the code, load the updated binary routines. and save an aosolute
load file are shown in Figure IV-5.
The control cards for a standard model run from a cold start are
shown in Figure IV-6. A Restart File is created if requested in the model
on file TAPE3, and this file can be catalogued to a permanent disc file at
the end of the run. The model input data can be read from cards or from an
UPDATE data file. Both options are shown in Figure IV-6.
The control cards for a restart model run are shown in
Figure IV-7. In this sequence, a restart file at 15 days was used to start
the run and a new restart file was created at 30 days. The CATALOG after
the exit card is insurance to save a restart file if the model abnormally
ends any time after the save run.
85
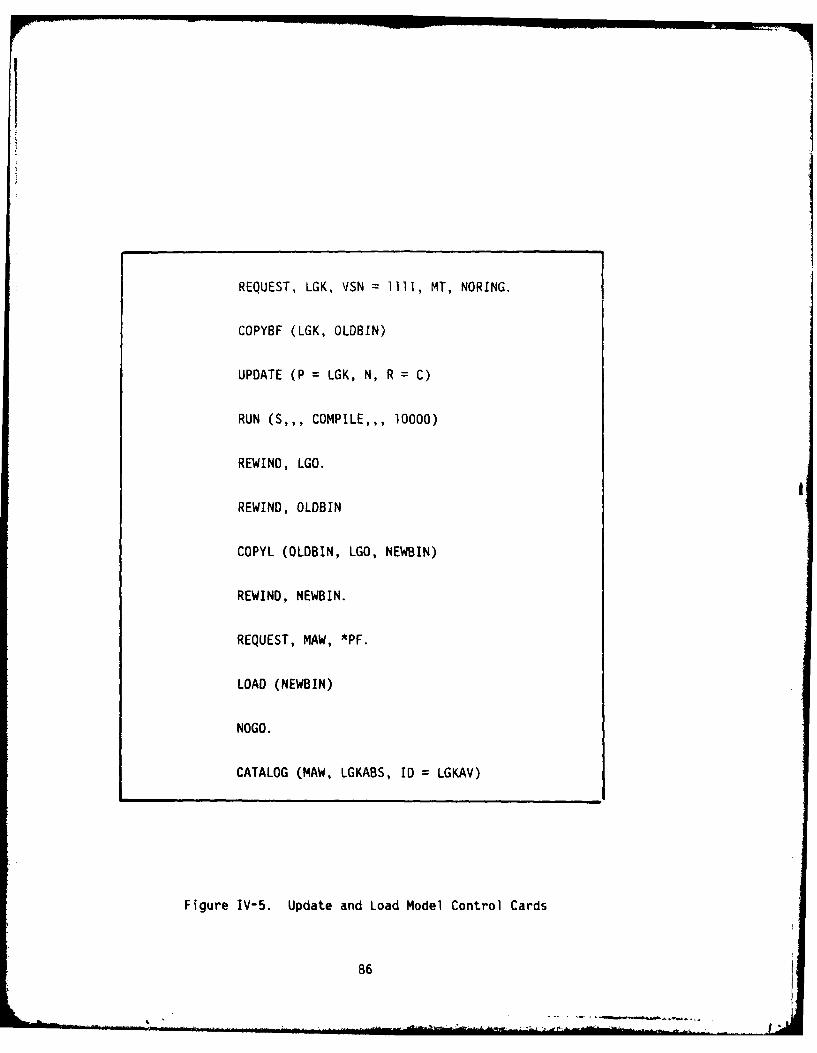
REQUEST, LGK, VSN =1111, MT, NORING.
COPYBF (LGK, OLOBIN)
UPDATE (P = LGK, N, R = C)
RUN (S .,. COMPILE,,,. 10000)
REWIND, LGO.
REWIND, OLOBIN
COPYL (OLDBIN, LGO, NEWBIN)
REWIND, NEWBIN.
REQUEST, MAW, *PF.
LOAD (NEWBIN)
NOGO.
CATALOG (MAW, LGKABS, ID0 LGKAV)
Figure IV-5. Update and Load Model Control Cards
86

INPUT DATA ON CARDS
ATTACH (MAW, LGKABS, ID = LGKAV)
REQUEST, TAPE3, *PF.
MAW, LC =100000.
CATALOG (TAPE3, RESTART15, ID =LGKAV)
EXIT.
CATALOG (TAPE3, RESTART1S, ID = LGKAV)
INPUT DATA ON UPDATE FILE
ATTACH (OLDPL, LGKDATA, ID =LGKAV)
UPDATE (P, C = TAPE5, D, F)
ATTACH (MAW, LGKABS, ID =LGKAV)
REQUEST, TAPE3, *PF.
MAW, LC = 100000, TAPE5.
CATALOG (TAPE3, RESTART15, ID = LGKAV)
Figure IV-6. Control Cards to Execute the Model and Save theRestart File
87

ATTACH (RESTRT, RESTART15, ID : LGKAV)
REQUEST, TAPE3, *PF.
COPYBF (RESTRT, TAPE3)
REWIND, TAPE3.
ATTACH (MAW, LGKABS, ID = LGKAV)
MAW, LC = 100000.
CATALOG (TAPE3, RESTART30, ID = LGKAV)
EXIT.
CATALOG (TAPE3, RESTART30, ID = LGKAV)
Figure IV-7. Control Cards to Restart the Model
88
CHAPTER V
LOGATAK REPORTS
1. GENERAL DESCRIPTION
The LOGATAK model produces a set of reports that covers the
supply and transportation activities in the model. A standard set of
reports is produced when a run is terminated normally. If a model run is
terminated abnormally, due to some input data erros, array overflows, or
central processor time limit for example, the standard set of reports is
also produced. However certain errors, such as illegal data in a card
field, are nonrecoverable and the output reports cannot be produced. In
addition to the reports at the end of a run, interim reports can be
requested at any time during the run by executing subnode 8 of node ZINIT
for supply reports and subnode 9 of node ZINIT for transportation reports.
These events are scheduled as type 8 exogenous events (see Chapter IV.2.).
In addition to the standard reports, the model produces a limited
report when a SAVRUN for restart file is requested, so that the user is
aware of the status saved on the restart file. This report is not product_
if a SAVRUN file is requested at the end of a run, that is if TNOW = TFIN,
since the standard report is available.
Optional output, in the form of an event by event trace, is
available throughout the model run for verification of the model activi-
ties. Each of the report types is described in a section in this chapter
with sample pages shown.
2. FILES STATUS
The first report produced designates the current status of dis-
tribution parameters and file contents. The files in the LOGATAK model are
those which store all events waiting to occur in chronological order,
89

arrival queues at terminals, departure queues at terminals ana a split
shipment working file. The time file is always number I and if shipments
need to be split into smaller shipments, the working file is number 2. rhe
remaining files are assigned as needed. The numerical assignment is given
in the transportation terminal characteristics report. These transporta-
tion queues can be scanned to verify what the average and maximum size is
and what shipments are currently in the queues. The attribute definitions
for the events in the queues and the time file are given in Tables V-1 and
V-2. A sample of the Random Variables Parameters report is shown in Fig-
ure V-1. The columns contain the values defined in Table IV-9. A sample
of the File Printout with 5 files defined is shown in Figure V-2.
3. REPORTS FOR SUPPLY NODES
Supply node reports are produced at the end of a model run and
whenever subnode 8 of node ZINIT is executed.
3.1 Demand Generation Nodes Report
The status of each demand generation node (DSBOl to DSB2O) that
is active in the model is printed out for each item or class of supply
ordered. Figure V-3 shows a sample page of this report. Statistics are
shown for orders generated and orders received. In this sample for DSB06,
supply class 10, ten orders have been generated for 1,130 metric tons. The
average order size was 113 tons with the smallest being 113 and the largest
113. The time weighted average quantity due in from supply was 31.17 tons
and the due in level was never greater than 226 tons. The average duration
of due ins or order and ship time was .423 days with the slowest shipment
requiring .872 days. To this point in simulated time, 9 shipments have
been received with a total of 1,017 tons. All of the shipments ranged were
113 tons each in size.
3.2 Intermediate Supply Nodes Report
The stock status and demand satisfaction are reported for each
intermediate supply node (ASBOI to ASB05) which is active. Figure V-4
shows a sample report for 2 ASB nodes. The serviceable balance on hand for
90
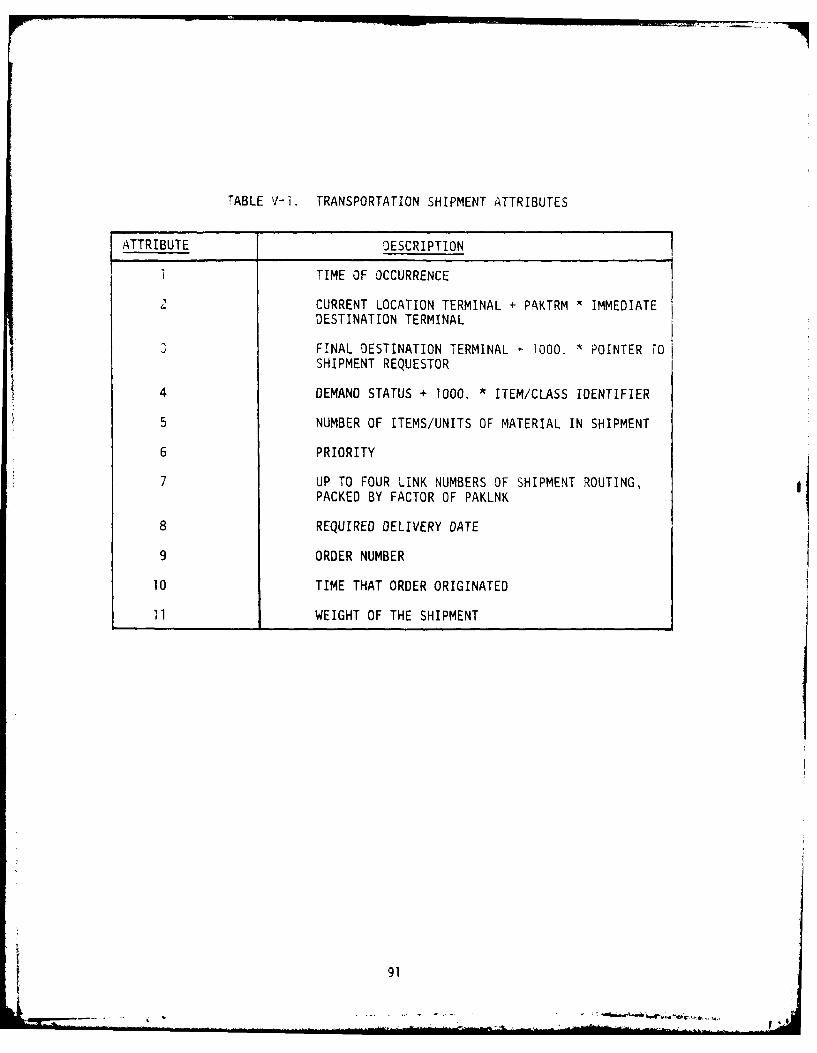
TABLE V-i. TRANSPORTATION SHIPMENT ATTRIBUTES
ATTRIBUTE DESCRIPTION
TIME OF OCCURRENCE
2 CURRENT LOCATION TERMINAL + PAKTRM * IMMEDIATEDESTINATION TERMINAL
FINAL DESTINATION TERMINAL + 1000. " POINTER TOSHIPMENT REQUESTOR
4 DEMAND STATUS + 1000. * ITEM/CLASS IDENTIFIER
5 NUMBER OF ITEMS/UNITS OF MATERIAL IN SHIPMENT
6 PRIORITY
7 UP TO FOUR LINK NUMBERS OF SHIPMENT ROUTING,PACKED BY FACTOR OF PAKLNK
8 REQUIRED DELIVERY DATE
9 ORDER NUMBER
10 TIME THAT ORDER ORIGINATED
11 WEIGHT OF THE SHIPMENT
91

TABLE V-2. CHNET, ATACK, REBUILD EVENT ATTRIBUTES
ATTRIBUTE DESCRIPTION
I TIME OF OCCURRENCE
2 LINK NUMBER IF LESS THAN 100000TERMINAL NUMBER IF FIRST 5 DIGITS ARE 0LINK DESIGNATION BY TERMINAL END POINTS
OTHERWISE (TERMINAL + 1OO00O TERMINAL)
3 TYPE OF ACTION-1 DEACTIVATE0 ACTIVATE+1 ACTIVATE2 REBUILD3 ATTACK
4 NEW RATE OF TRAVEL ON LINK
5 NEW CAPACITY OF LINK/TERMINAL
6 PROBABILITY OF DESTRUCTION
7 TIME TO REBUILD
8 NEW LENGTH OF LINK
92

I
C- 2' -
• .. ...
..
I.'T
-: - , -, .' _ . . ..C> s ,. .-.
- C wI C

AO-Al08 736 BOMSCORP MUCLEAN VA F/ I WA U ERS GU IDE FR LOGATAK. A SIMULATION MODEL TO ANALYZE LOOIS -Ftr ,APR 81 E .1 BITINAS, W F LYNCH DNAOOI-79-C-0OAR
UNCLASSIFIED BOM/W81-079-TR DNA-65OAH NL2ffffffffffff'i EEohEohhEEEEl

1.0112.02
1111.2 -2

I I
*1* . .. ,o . ..
' -
i Ci ' t. C t. !. a S I.~er c 1; 11 I~t I; 4*W4
i e c--
., ... .._ ..=
4 I. ..
C C\4
In I -
94
* 4
* ... 4

I z Z
I : :4J
I qf .
atL X0 I*
C.3
C. Z C_ 0 43 0C.
i4 z CD *g , * .. . a * z z1za
~~~~~~~6 C 1,, 0 ,,0
S 0
2 00
CI ft 4I I .41. t = ,I0
( a l l D o t n V ) a 4 C a
* K95

ICE .11w -~cI
40 --
j 'I
0~ L - C
Itaw IL 0.
* InVI )96
ASBOl, item !0, ranged from a low of 865 tons to a hign of 2.3123 tons. The
node received 10 demands for 2,430 tons and filled 10 of those demands for
2.430 tons. The percent of demands f il1led was 100%.
4. TRANSPORTATION SYSTEM REPORT
The transportation system report consists of five different sub-
reports. First the current status of the network is printed out with all
links specified by their end terminals and their characteristics. The
column labeled CAPACITY is the maximum number of metric tons that can be
placed on the link during any given interval of time equal to the travel
time across the link. The capacity per day of the link is also shown. A
sample page of this report is shown in Figure V-5. The next section of the
report prints the current characteristics of the terminals in the network
and any queue assignments that have been made. A sample page of this
report is shown in Figure V-6.The workloads measured at each terminal that was utilized in the
network are printed in the next section of the report, as shown in Fig-
ure V-7. The average capacity and average number of metric tons in the
terminal is shown. The total number of metric tons passing through the
terminal to this point is shown. Finally the average size of arrival and
departure queues, if any, are shown. The link workloads are presented in a
similar fashion as shown in Figure V-8. The flow pattern experienced in a
network can be readily visualized when the tonnage over each link is trans-
f erred to a map.
The final workloads report (Figure V-9) is presented by mode of
travel, reporting the metric ton kilometer utilization for each mode. The
most common definition of mode codes is as follows:
1 - Air
2 - Sea
3 - Rail
4 - Highway
5 - Inland Waterway
6 - Transshipment
97
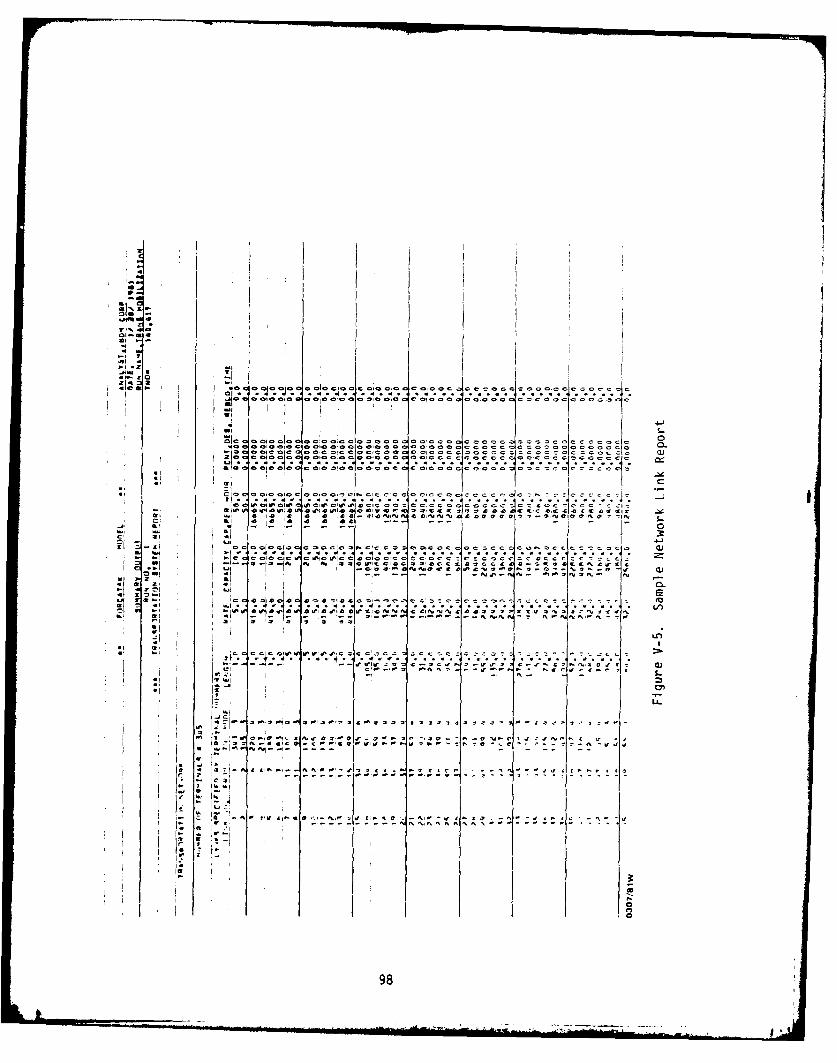
1-IT
9 T 0=
....c I
'1~~ ~~ ... ,0o< .> ... I.. . .o.< ... .... ...... c°o~~~~ a~ c gQ .€:0 .~ o
. . . .' a1 ... . . . Jcl af-, v ~ - 1
I i il 0 iCi l l Il l i, il I , o ~ ? i .
I., It ,Iti1 11
0 1t C0 0 0 , 0 0C1 . 04 C: 1 C Ct C 0 0
0, ' I =
c CCti
f - - .-- -
a 0 1
* i il ... . " ....'0 0-8
Oj S 2 SI 0.
Cl ,t I Ol ... V . ... . ... .. .................. 0
-,U *'i ,~ StSJC-, a %. CC N ' eSs ?SC .... S -t , r
SiSI -- ,a -
1 SI ,
098 C C ~ I :~ cz c -
04001 ~ 0 00~.2'

0'.
SI T
4-4-
ZP
0 IL C
I 4D
zw a
99 L4 g
*C0C.C, °... °JC.C .C........ .. C °-0 ... .. . .. . ........ ..S. . . ,C..C .. .. -
4 -o
* -
* C '0
00 0 , 0 0 0 04 c 0 C 0 0 ,C O 0 C . 0CC C '9 00 C .

It, I - 5
II M, = i01. 14=. *I .* , I
C~ CY NC C Y C 0 0
12I . 1 04 .
, .~C a,.
0 6ma d 0a C0 CY a! I
C.~or E ~-,-
C CC C ~CI C C C 0 011C, ;01.~
K Ic
zC CL CC z0 CICC 'C
4.K 4 Ix
*. a cc
100

aa
cI Zc
cI c cc-c
.41
c c1 c !=Zc4 Z ,
cC z CrL 7
100

LA
do- C
ImI
oDa 0
0' 0
CO K
102

5. PERMANENT ATTRIBUTES REPORT
At the end of the run, all supply parameters stored in the array
PERMAT are printed out for each supply node. These attributes were definea
in Tables IV-6, IV-7, and IV-S. A sample page for node OSBOI is shown in
Figure V-10. This node handles eight different supply classes. 2. 3, 4. 5.
6, 7, 10 and 11. For statistical indices that have Deen utilized, the
position in the statistics data storage arrays is packed in with the type
of statistic. For example, attribute 8 of SIUNOD for class 2 shows that
this is a COLCT type statistic (3) and the values are stored in location 22
of the COLCT arrays. If a location has not been assigned, i.e., there is a
single digit as input, then the statistic has not been activated yet.
6. SAVRUN FOR RESTART |
Whenever a SAVRUN is requested to create a file for later restart-
ing of the model, one or more pages is printed out. The first page
describes the identification card required to restart the model utilizing
this file. If the SAVRUN is not at the end of the model run, additional
reports similar to the final reports are produced to clearly define the
conditions in the model at that point. Only the last SAVRUN in a model is
available on the file since the previous SAVRUN is overwritten. Thus
earlier SAVRUNs are created only to recover from premature termination of
the model.
7. EVENT TRACE
To aid in debugging the model and checking the input data para-
meters and model logic, an event trace is provided in the model. This
trace is optional and may be turned on or off at any time during the model
run. This capability is controlled through exogenous events of type -2.
The trace provides an event by event history of all activity in the modelduri- the ti- the trace is activated. Each module that is used during
103
k . . . • - .. . -* l '! " " - -,m ' , "' I

SI0NI C CI 0 0' 0 0
CI 0 0 0 I c CI I
aI Cl I I Ci a. ec
CC
4 --
.I~If
IS0
C CI C C C C 104

the event is listed oy name to aid in following the logical path followed.
A sample page from a trace is shown in Figure V-11. This page snows three
complete events and a portion of two others. Each~ event starts with a set
of attributes removed from the time file. The attributes have been defined
in Tables V-1 and V-2. The sample shows a jparture event, an arrival
event, and a supply delivery.
105
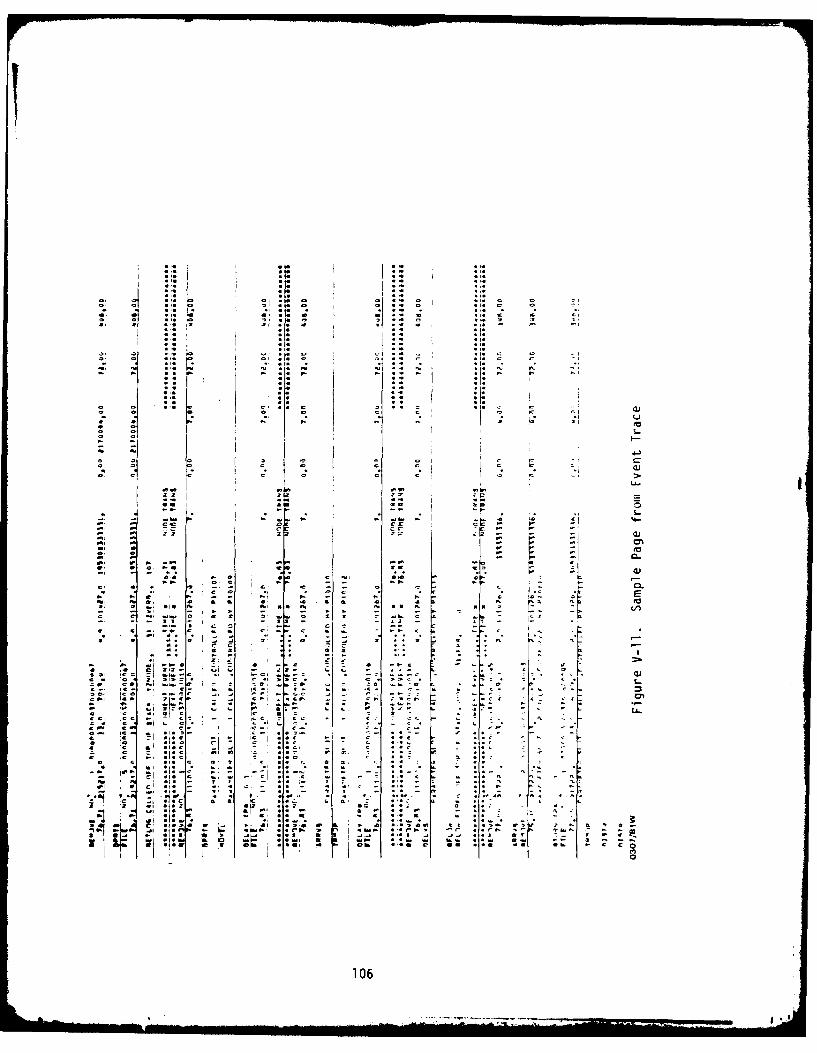
c c
~c.9 4. C .. Ia .1 ~ *LA-
z* I
0 106

CHAPTER VI
OPERATING STRATEGY
1. GENERAL
The preceding chapters have described various aspects of the
LOGATAK computer model, and have presented detailed instructions describing
how to operate the various component parts of the model. This chapter ties
together the detailed instructions of the previous chapters and presents a
number of observations on how the LOGATAK model can be operated to present
the most useful simulation of the desired problem. The suggestions pre-
sented in this chapter are generally grouped around building the scenario,
gathering the required data, running the model , and analyzing the model
resul ts.
If one paramount observation could be made concerning the appli-
cation of the LOGATAK model, it would be this: the number of simulation
features available in the model is so large and the ability of the data
base to accept information is so great, the model is capable of overwhelm-
ing any available computer capacity or program budget. Since it is not
technically nor financially feasible to model the whole world, the analyst
must necessarily exert censorship on the building of his model. The
scenario must be a test of the desired effects. The temptation is always
great to include every factor of the logistic system in detail, but this
temptation rapidly overwhelms the capability of the computer.
2. SCENARIO
In designing the scenario for a LOGATAK run, the analyst must
first determine which factors are significant in the problem he is study-
ing, and which factors are clearly second order variables which will have
little or no influence on the final answer. On the face of it, the preced-
ing statement tends to sound like a pre-judgement and pre-determination of
107

the final results if the model run, but such need not be the case. Some
careful consideration of the propiem before the model is ouilt will usua'.1y
indicate which effects can be safely suppressed. If the problem to be
considered involves a short, rapidly-moving war, factors usually associated
with long term attrition such as higner echelon maintenance activities,
spare part stocks, and the movement of logistic supplies far behind the
battlefront are usually of little significance to the outcome. On the
other hand, if the scenario involves a slow campaign of attrition, factors
involving battlefield mobility of fighting units are of little consequence.
Exceptions exist to every general statement, but the point to be emphasized
is that careful forethought will clarify the issues in a problem and safely
enable the suppression of some variables as second-order.
The scenario must be carefully constructed to be realistic and to
incorporate the desired type of battlefield and logistic operations. Each
national military establishment, eithor friendly or enemy, has individual
features of its operations in every activity, such as battlefield tactics,
doctrines of ammunition expenditure, doctrines concerning marching order,
and doctrines regulating the operation of its logistic system. These
factors should be investigated and incorporated into the scenario so that
the results will be representative of the operation of the force under
cons iderati on.
An important factor in the construction of a scenario is to
achieve a proper proportion between the total size of the operational
battle force and the capability of the existing physical features of the
logistic network, such as terminals and transportation links. The general
nature of an interdiction attack which is directed primarily against fixed
installations rather than vehicles, for example, is an initial wearing-down
of the "surplus capacity" of the logistic network, after which the support
to the battle forces begins to deteriorate. For any given part of the
world, it can readily be appreciated that the existing transportation
network is more than enough to support a very small battlefield force, but
insufficient to support an extremely large battlefield force, even without
108

interdictive attack. The absolute size of the battle force selected for
the scenario thus becomes an important factor in the apparent success of
any interdiction campaign, without consideration of the nature or severity
of the interdictive attacks. For this reason special care must be taken to
size the supported battle force realistically in terms of the military
campaign envisaged. If it is thoughtlessly chosen either excessively large
or small, the results of the simulation will be inadvertently biased.
The interdiction plan in the scenario should make best use of
weaknesses in the logistic support structure. Frequently a geographic
weakness can be found in the form of a "barrier line," either a physical
feature such as a river or mountain chain, or a weakness in the man-made
logistic network, or a combination of the two factors. If uncertainty
exists in a given scenario as to the best choice of logistic barrier,
different strategies of attack should be tried in separate computer runs to
observe the variation in results. Such preliminary trials can be very
useful in improving the effectiveness and realism of the interdiction
attacks chosen in the scenario.
3. INPUT DATA
A considerable opportunity exists in the preparation of the data
base to eliminate less important information by means of data aggregation.
In preparing the data base for a highway system, for example, there are
usually roads which are so small and poorly made that their freight capa-
city is insignificant compared to better roads in the same vicinity. These
secondary roads can be aggregated to form theoretical roads whose capacity
and rate of travel simulates the combination of more than one actual
secondary road. A suggested set of guidelines which were found useful in
LOGATAK runs are as follows:
(1) A data base element is subject to aggregation if it is not a
worthwhile target of interdictive attack.
(2) Only elements of like character should be aggregated, for example
a country road should not be aggregated with a freeway.
109

3) The iqgregated eiements should serve the same general purpose,that ;s, if they are roads they should run in roughly the samedirection and be reasonably close together.Data base aggregation enables the analyst to simulate the real
world to a level of quality adequate for the LOGATAK simulation while atthe same time eliminating a great deal of insignificant information beforeit ever gets into the computer. As will be seen later in Part 5 of this
cnapter, excessive aggregation of the data base which distorts the finalsimulation output can easily be reversed, but need be reversed only in theareas where greater detail is significant to the particular simulation.The flexibility in the data base provided by DAMSEL thus encourages theanalyst to aggregate apparently insignificant information, since thisaggregation is not permanent.
The kill probabilities associated with logistic strikes shouldobviously be as realistic as possible, since they greatly influence whether 'a particular interdiction attack has been successful. If a particular
model run uses stochastic kill probabilities, the analyst should take careto make a sufficient nubmer of model runs to evaluate scatter in the finalresults which stems from variation in the stochastic kill probabilities.No hard and fast rules can be made concerning the number of times a runmust be repeated to evaluate stochastic effects, but since kill probabili-ties are one of th~e few stochastic processes in LOGATAK, the analyst should
be alert for this type of problem.It is important to have accurate estimates of rebuild capability,
both the time it takes to rebuild a target, and the degree of restorationin capacity and rate of travel. Interdiction is essentially a race between
destruction and rebuild. It doesn't make for a balanced study to put agreat deal of effort into estimating probabilities of kill and extent ofdestruction, and then to input hasty rebuild estimates. The model willaccept rebuild estimates in a variety of ways. First, the DAMSEL data basehas the capability to store standard rebuild times and capacities for eachtarget which is likely to be attacked. Second, at the time any attack isinput to the LOGATAK model, the attack card may contain a modified value of
110

rebuild time and target capacity as rebuilt. Third, even if rebuilt tarqet
capacity is changed by the attack card. a subsequent "change net" card can
be input to the computer to restore the target capability to the original
values or any other values desired. Since there is no limit to the number
of change net cards which may be input, the analyst has great flexibility
in altering th capability of rebuilt targets as a function of time. This
model capability enables the analyst to tailor target rebuilding to match
time-varying estimates of rebuild capability.
4. RUNNING THE MODEL
The first point to be made concerning the building of a LOGATAK
simulation is that the analyst should not expect a perfect run the first
time through. Network problems are complex and there are many interactions
between the data base, input assumptions and attack strategies, which
sometimes do not mesh well together. As difficulties show up, the analyst
should expect to perform a certain amount of fine tuning to the model
inputs in order to improve realism in trouble areas.
The use of the save run (SAVRUN) feature in LOGATAK is especially
valuable in tuning up the model. The liberal use of the save run feature
produces several benefits to the analyst:
(1) Save run permits the analyst to feel his way through the simula-
tion run, looking at intermediate results at frequent intervals
to see if trouble is building up. It permits interaction between
the analyst and the run as the simulation proceeds and enables
the analyst to terminate a run which is not going well, thus
saving computing time.
(2) The save run feature permits the printing of ither a supply
report, a transportation report, or both, at any point in the
run, depending on what types of information the analyst desires.
(3) The save run feature provides comprehensive pictures of the
development of the scenario at frequent time intervals, rather
than relying on final results only. These intermediate pictures
not only aid the analyst in understanding his model, but are also
very worthwhile when report time comes.

A useful feature in the LOGATAK mode] during the early running
stage is the ability to put time limits on the runs. This feature supple-
ments the save run Feature to save wasted computer time on runs which have
gone bad for some reason.
A useful way to begin the validation of a simulation is to per-
form a baseline run, that is, a runthrough of the scenario with no inter-
diction attacks. The baseline run provides a perspective of how thelogistic system performs the task required by the scenario without inter-
ference. For example, because of unusual demands or a weak spot in thelogistic system, significant queues may form even without interdiction. A
very useful tool in the analysis of the baseline run is to prepare simple
flow charts showing the traffic through each link and terminal in the
logistic system at various points in time. These simple charts rapidly
disclose the existence of unusually heavy traffic or queues. The analyst
should be especially sensitive to these points of heavy traffic because
they may result either from some element of unrealism inadvertently placed
in the model (which should be corrected), or they may point up a deficiency
in the real logistic network which can be exploited by an interdictive
attack. A "by hand" analysis will determine whether these heavy traffic
locations are real choke points or whether they come from unrealism in the
input assumptions.
As indicated in Part 3, variations in stochastic kill probabili-
ties will sometimes influence the results obtained from model runs in
peculiar ways. The analyst should be on the look-out for unusual results
of this type which do not reflect long term realism.
5. ANALYZING THE MODEL RESULTS
In reviewing the results of the model runs, the analyst should
keep several factors in mind. In a model as complex as LOGATAK, many types
and variations in input data are required, and some types of input data are
better known than others. If uncertainty exists with respect to certain
classes of input data or attack strategies, separate runs of the model can
112
be made to cover the spectrum of input possibilities. Under the controlled
condi ti ons of the modelI, these sens iti v ity studi es wilIl gi ve the analIyst a
good feel for the quantitative effect of variation caused by input data
uncertainty. Depending on the degree of effect in the final results, the
analyst may or may not wish to expend additional effort improving the input
data. One especially important type of improvement in input data is thepotential de-aggregation of transportation network data. It will sometimes
be found that most of the network aggregation is appropriate and realistic,
but in certain localities, special cases cause an unusually heavy trafficload, and greater detail is desired to see what is happening. In such
areas the secondary roads can be de-aggregated, more detailed data can be
reentered through DAMSEL, and the degree of realism in the special locality
can be improved without the necessity to rework the entire transportation
network data base.
A variety of different attack strategies should be generally be
used to determine which strategies appear most cost/effective in creating
interdiction. LOGATAK is very helpful in developing superior interdiction
strageties, as the traffic flows generated by the model show clearly how
the logistic net responds to interdictive damage, and "avenues of escape"
can be successively closed off.
One of the important benefits of interdictive attack is the
reduction in the mobility of battle forces, as well as the more usual
reduction in level of supplies. Many battles are won or lost by the degree
of mobility in the battlefield military units, because a unit away from the
main action is often of no more value than a unit which has been destroyed.
In many scenarios, the movement of military units through the logistic
support area competes for the use of these facilities with the movement of
supplies, and unit moves must be accounted for in the model as they are
often the heaviest user of logistic network capability.
It has been previously mentioned that the model will, from time
to time, produce results of a very surprising nature to the analyst. The
analyst should be especially sensitive to these situations, because the
surprise is caused either by a serious inconsistency in the model which
113

produces destructive unrealism in the simulation, or by a truly novel
effect not present in the analyst's previous experience. These new effects
are among the most valuable results produced by the exercise of the LOGATAK
model, and they should be followed uD and studied carefully as potential
new improvements in interdiction.
114

CHAPTER VII
FORCE MOVEMENT OPTION
1. INTRODUCTION AND PURPOSE
The LOGATAK model has been developea for analyzing logistics networksbefore and after interdictive attack, as described in the previouschapters. Because forces moving to the front must compete with logisticaltraffic along the same transportation network, the LOGATA( model can beused to investigate mobilization and interdiction of reinforcements.
The Force Movement Option to LOGATAK provides the user with the abil-ity to move units according to their organizational order of march fromgarrison locations in rear areas, up to pre-commitment locations. Units
are provided with organic bridging and the ability to clear obstacles(landslides, mines) and perform these functions on an as need basis. To
accoummodate these requirements some additional input data is required.This takes the form of the division organization, the division movement,and organic bridging capability.
To improve the interdiction aspects of LOGATAK, the target set ideahas been developed. Targetable entities along the transportation networkare grouped into target sets. A number of attacks are performed against a
set at once. Sets could consist of rail bridges, marshalling yards, etc.Those elements of a set already destroyed (and not yet repaired) will notbe restruck during subsequent attacks. Targets can be in one or more sets
at the same time.
Additionally, the ability to attrit units and create obstacles hasalso been included. Off-road movement around obstacles, reconstitution and
wrecks have been included in the expanded attack module.Every attempt to minimize additional computer requirements has been
made. Much of the new data has been woven into the existing logisticsnetwork data to minimize restructuring of the model.
115

2. INPUT DATA FOR FORCE MOVEMENT
2.1 Unit Organizations
2.1.1 Supply Item Common Data
The smallest indivisible unit to be represented in the model is
considered to be a supply item. Identification numbers one through eight
are reserved for this purpose. The SICOM attributes have been expanded to
include attrition effects for up to six weapon types (Table VII-l). This
attrition is expressed as a percentage of a full strength unit destroyed
per weapon application.
2.1.2 Parent Unit Organization
These component units are organized into parent units through the
use of the ORGAN data card (Table VII-2). The order of march of the parent
unit is represented by the matrix of organization. The items in the first
set will move first, second set second, etc. Up to seven sets can be
represented.
2.2 Parent Unit Movement
To ease the burden of data preparation, an entire parent unit
consisting of as many as 504 items can be input for movement through
LOGATAK using only one data card (Table VII-3). This module will construct
shipments of each item, assign priorities, and begin movement through the
transportation network. The LOGATAK departure time may differ from the
actual departure time to include movement outside of the area of interest.
Movement priority is used by LOGATAK to resolve contention on
link usage. Lowest numbers move first. The user should use the case of
two units attempting to cross one bridge simultaneously to resolve movement
priority problems.
3. INTERDICTION
Expanded interdiction capabilities have been included in the force
movement option of LOGATAK. Mines, landslide areas and attrition of of
units on the move have been included, as well as targeteering, intel-
ligence, weaponeering, and limited strike assets.
116

TABLE VII-l. SICOM ATTRIBUTES FORCE MOVEMENT OPTION
SICOM (ITEM) - COMMON SUPPLY ITEM DATAONE SET FOR EACH UNIT TYPE (ITEM
IDENTIFICATION NUMBERS 1 THROUGH 8)- USE CARD TYPE INITP3
ATTRIBUTE DESCRIPTION
I WEIGHT OF UNIT
4 ITEM TYPE CODE (1)
5 SOURCE OF ITEM IDENTIFICATION
NUMBER (GENERALLY THE SAME AS
SICOM ID NUMBER)
8 STATISTICAL INDICATOR FOR OVERALL
WEAPON EFFECT (3)-9 INDEX TO ATTRITION DISTRIBUTION
FOR WEAPON TYPE 1
10 STATISTICAL INDICATOR FOR ATTACK
EFFECTIVENESS OF WEAPON TYPE 1 (3)
11 INDEX TO ATTRITION DISTRIBUTION
FOR WEAPON TYPE 2
12 STATISTICAL INDICATOR FOR WEAPON
TYPE 2 (3)
117

TABLE VII-2. PARENT UNIT ORGANIZATION DATA CARD FORMAT
COLUMN FORMAT DESCRIPTION
1-5 A5 CARD NAME (ORGAN)
6-7 12 SEQUENCE NUMBER (ENTER 1)
8-10 13 UNITED TYPE IDENTIFICATION
11-12 2X
13 Il NUMBER OF ITEM I UNITS
14 I" 2
15 11 " " 3 I
16 II " " 4 "
17 11 I f " 5 1"
18 I1 " of 6 "
19 1 11 " " 7 "
20 I1 8
21-22 2X
23-30 811 REPEAT CC13 - CC2O
31-80 5(811) REPEAT 21 - 30 AS REQUIRED
118

TABLE VII-3. PARENT UNIT DIVISION DATA CARD FORMAT
COLUMN FORMAT DESCRIPTION
1-5 A5 CARD NAME (DIVSN)
6-7 12 PRIMARY CARD (ENTER 1)
8-10 3X
11-20 F10.O TIME OF DEPARTURE IN LOGATAK
21-24 4X
25-27 13 ORIGIN TERMINAL
28-30 13 DESTINATION TERMINAL
31-40 FIO.O TYPE OF PARENT UNIT
41-50 F1O.O ACTUAL DEPARTURE TIME
51-60 110 UNIQUE DIVISION IDENTIFICATION
NUMBER
61-65 5X
66-68 13 PRIORITY
69-80 12X
119
I-

3. 1 Target Set Concept
Strikes are carried out against target sets. At present, oniy
links and terminals are included in a set. Links and terminals are grouped
by some analyst-defined rule, and strikes are carried out against thesesets. This helps the analyst by reducing his burden on input preparation.Table VII-4 describes the input for target sets.
3.2 Basic Repair Groups
Targets are repaired in two ways: automatically some time after
attack (simulating dedicated repair assets) and on demand (organic engineer
capability). Mines are cleared by any units encountering this type ofobstacle. Once struck, a target will be repaired in one of these two ways.
Some parameters of the repair must be addressed. Table VII-5 lists theinput format for the basic repair groups. A group could consist of pontoon
bridges, track laying, mine clearing, etc.3.3 Attack Execution
Because many more options for interdiction have been added toLOGATAK, a new attack module has been developed, with a wide .ariety ~
options (Table VII-6).
4. OTHER MODEL ADDITIONS
Additional exogenous events have been added to reflect the forcemovement option (Table VII-7). These include the additional i nput datarequirements described above, and additional reporting features.
4.1 Queue Report
A list of all queues currently (at the time of the report) inexistence are organized by terminal number, and the members of the queue.
4.2 Target Status Report
An abbreviated version of the transportation report, dealing only
with elements of the network that are included in target sets.4.3 Attack Effects Report
Upon attacking items in transit, LOGATAK keeps statistics on theeffect of each type weapon on the attrition of the item. This report gives
120
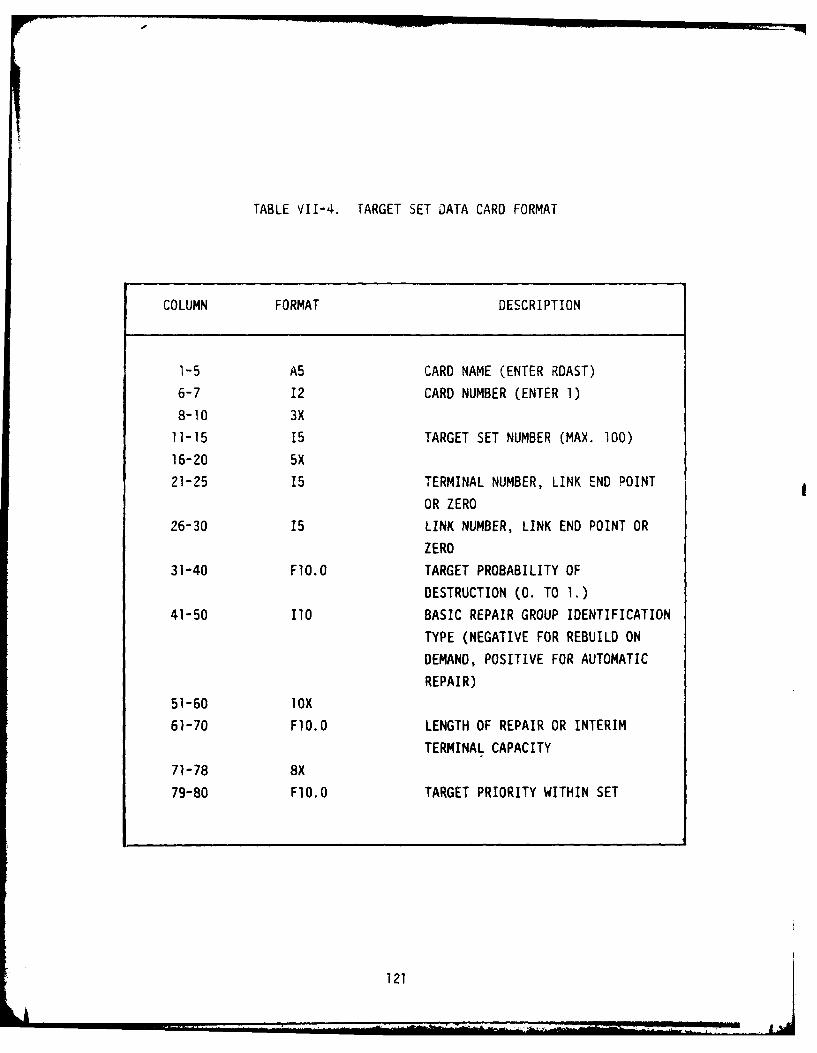
TABLE VII-4. TARGET SET OATA CARD FORMAT
COLUMN FORMAT DESCRIPTION
1-5 A5 CARD NAME (ENTER ROAST)
6-7 12 CARD NUMBER (ENTER 1)
8-10 3X
11-15 15 TARGET SET NUMBER (MAX. 100)
16-20 5X
21-25 15 TERMINAL NUMBER, LINK END POINT
OR ZERO
26-30 15 LINK NUMBER, LINK END POINT OR
ZERO
31-40 FIO.O TARGET PROBABILITY OF
DESTRUCTION (0. TO 1.)
41-50 110 BASIC REPAIR GROUP IDENTIFICATION
TYPE (NEGATIVE FOR REBUILD ON
DEMAND, POSITIVE FOR AUTOMATIC
REPAIR)
51-60 lOX
61-70 FlO.O LENGTH OF REPAIR OR INTERIM
TERMINAL CAPACITY
71-78 8X
79-80 FlO.O TARGET PRIORITY WITHIN SET
121
|L

TABLE VII-5. BASIC REPAIR GROUP DATA CARD FORMAT
COLUMN FORMAT DESCRIPTION
1-5 A5 CARD NAME (ENTER RDBRG)
6-7 12 CARD NAME (ENTER 1)
8-10 3X
11-15 15 GROUP TYPE NUMBER
16-20 15 MATERIAL AVAILABILITY DELAY
DISTRIBUTION INDEX
21-30 FlO.O RATE OF TRAVEL
31-40 F1O.O CAPACITY/DISTANCE
41-50 F1O.O CONSTRUCTION TIME
DISTANCE/TIME
51-60 F1O.O PROBABILITY OF DESTRUCTION
(0.0 TO 1.0)
61-80 20X
122

TABLE VII-6. ATTACK TARGET SET DATA CARD FORMAT
COLUMN FORMAT DESCRIPTION
1-5 A5 CARD NAME (ENTER ATSET)
6-7 12 CARD NUMBER (ENTER 1)
8-10 3X
11-20 FlO.O TIME OF ATTACK
21-30 F1O.O TARGET SET NUMBER
31-36 16 WEAPON TYPE NUMBER
37 II LINK PRIORITY(0 - AS IN TARGET SET
I - LINKS IN USE ONLY
2 - LINKS IN USE FIRST)
38 Il ATTRITABLE ITEM TYPES
(0 - ALL
1 - ITEMS 1 THROUGH 8
2 - ITEMS 9 AND ABOVE)
i 39-40 12 TYPE OF ATTACK
(0,1,3,4,7,8,10,11 - LINKS,0,5 - TERMINALS
2,6,7,8,12 - QUEUES
6,7 - UNITS MOVING
3,4,5 - MINES
10,11,12 - NUCLEAR)
41-46 16 MINIMUM ATTACKABLE QUEUE SIZE
47-50 F4.0 WEAPON EFFECTIVENESS (0. TO 1.)
51-55 15 MAXIMUM NUMBER OF WEAPONSPER TARGET
123

- -4
TABLE VII-6. ATTACK TARGET SET DATA CARD FORMAT (CONTINUED)
COLUMN FORMAT DESCRIPTION
56-60 15 TOTAL NUMBER OF WEAPONS FOR THIS
ATTACK
61-70 FlO.O PROBABILITY OF DESTRUCTION
MULTIPLIER (NUCLEAR STRIKE)
OR LENGTH OF MINE FIELD71-80 F1O.O TIME DELAY (NUCLEAR AND MINES)
124
.. . . .. ... . . .... - -. .. l l g l r l .. . .

TABLE VII-7. ADDITIONAL ZINIT SUBNODES WHICH CAN BE SCHEDULED EXOGENOUSLY
SUBNODE NUMBER PURPOSE1
14 INTERIM QUEUE SUMMARY REPORT
15 INTERIM TARGET SET STATUS REPORT
16 DIVSN-INPUT PARENT UNIT MOVEMENT
CARDS
17 ORGAN-INPUT FORCE ORGANIZATION
18 RDBRG-INPUT BASIC REPAIR GROUP DATA
RDAST-INPUT TARGET SETS
19 ATSET-ATTACK A TARGET SET
20 ATRPT-ATTACK EFFECTIVENESS REPORT
125
the breakdown of the effectiveness of eacn weapon on each item and an
aggregate for all weapons on each item.
5. OPERATING STRATEGY
The flexibility of the force movement Option allows a wide range of
scenarios to be generated quickly. Sensitivities to order of march, move-
ment priority, and weapons effects can be played with minimal manpower
expenditure.
Parent unit organization has some limitations. Only eight basic item
types are allowed. Some aggregation of support elements may be required to
accommodate this limit.
When the numbers of basic item types exceed nine in an organization,another movement set must be started. If more than seven movements sets
are required by a parent organization (a tank division at company level,for example). Additional parent unit organizations may be added. Care
must be taken to be sure that the parent unit movement is initiated by one
unit of each type.
The attack target set options provide additional variety in the analy-
sis than can be made. A well-structured, comprehensive plan of sensitivity
excursions will ease the analyst's burden of option selection.The supplemental reports used with the restart options allow war room
simulations using LOGATAK. The reports represent the current networkstatus (at the time of the report). Strikes against queues or links could
be allocated (after an appropriate delay) and the run could be restarted
with the new attacks included.
NOTE: The new LOGATAK data included in the force movement option iscontained in PDS (Permanent Data Sets) storage and not in PERMAT asdescribed in previous chapters. Care must be taken to include all P05service routines and verbs when assembling LOGATAK for the first time,i f the f orce movement opti on i s to be used.
126

DISTRIBUTION LIST
DEPARTMENT OF DEFENSE DEPARTMENT OF THE ARMY (Continued)
Armed Forces Staff College US Army Ballistic Rsch LabsATTN: Coordinator for Studies & Rsch Lib ATTN: DRDAR-TSB-SATTN: Ref & Tech Svcs Br
US Army Comb Arms Combat Dev ActyAssistant Secretary of Defense ATTN: ATZL-CAD-LNProgram Analysis & Eval2 cy ATTN: Regional Programs US Army Cmd & Gen Staff College
ATTN: ATSW-TA-DAssistant to the Secretary of DefenseAtomic Energy US Army Concepts Analysis Agcy
ATTN: Executive Asst ATTN: CSSA-ADL
Commander-in-Chief, Pacific Commander-in-ChiefATTN: J-3 U.S. Army Europe & Seventh ArmyATTN: J-22 ATTN: AEAGC-NC
Defense Intelligence Agcy US Army Forces CmdATTN: DB-4 ATTN: AF-OPTSATTN: DB-1
US Army Materiel Sys Analysis ActvyDefense Nuclear Agcy ATTN: DRXSY-DS
ATTN: NATA ATTN: DRXSY-SATTN: STNAATTN: NATD US Army Nuclear & Chemical AgcyATTN: NAFD ATTN: Lib
4 cy ATTN: TITL14 cy ATTN: TISI US Army TRADOC Sys Analysis Actvy
ATTN: ATAA-TAC
Defense Technical Info Ctr12 cy ATTN: DO US Army Training and Doctrine Cmd
ATTN: ATCD-CFDeputy Under Secretary of Defense (S&TNF) ATTN: ATCD-AO
ATTN: T. K. Jones ATTN: ATOO-NCOATTN: ATCD-N
Field CommandDefense Nuclear Agcy US Army War College2 cy ATTN: FCP ATTN: Lib
Joint Chiefs of Staff V CorpsATTN: SAGA Department of the Army
ATTN: G-3DirectorNET Assessment VII CorpsOffice of the Secretary of Defense Department of the Army
ATTN: F. Giessler ATTN: G-3
U.S. European Cmd DEPARTMENT OF THE AIR FORCEATTN: ECJ2-T -AAssistant
Chief of StaffDEPARTMENT OF THE ARMY Studies & Analyses
Department of the Air ForceDeputy Chief of Staff for Ops & Plans ATTN: AF/SAMIDepartment of the Army
ATTN: DAMO-NCN Deputy Chief of StaffOp Plans and Readiness
Eighth US Amy Department of the Air ForceATTN: CJ-JP-NS ATTN: AFXOXFM
Harry Diamond Labs Tactical Air CmdDepartment of the Army Department of the Air Force
ATTN: DELHD-I-TL ATTN: TAC/XPS
127

DEPARTMENT OF THE AIR FORCE (Continued) DEPARTMENT OF DEFENSE CONTRACTORS (Continued)
Commander-in-Chief Kaman Sciences Corp
US Air Forces in Europe ATTN: F. SheltonATTN: USAFE/INA
Kaman Tempo
DEPARTMENT OF DEFENSE CONTRACTORS ATTN: DASIAC
BDM Corp Pacific-Sierra Rsch CorpATTN: J. Braddock ATTN: H. Brode
4 cy ATTN: E. Bitinas4 cy ATTN: W. Lynch R & D Associates
ATTN: P. Haas66th MI Grp
ATTN: K. Moran Science Applications, IncATTN: J. Martin
General Research CorpATTN: Tactical Warfare Ops Science Applications, Inc
ATTN: W. LaysonIRT Corp
ATTN: J. Hengle Systems, Science & Software, IncATTN: W. Macklin ATTN: K. Pyatt
JAYCORATTN: R. Sullivan
128

DATE
ILMEI