unclassified env/jm/mono(2016)6 - oecd
TRANSCRIPT
Unclassified ENV/JM/MONO(2016)6 Organisation de Coopération et de Développement Économiques Organisation for Economic Co-operation and Development 04-Mar-2016
___________________________________________________________________________________________
_____________ English - Or. English ENVIRONMENT DIRECTORATE
JOINT MEETING OF THE CHEMICALS COMMITTEE AND
THE WORKING PARTY ON CHEMICALS, PESTICIDES AND BIOTECHNOLOGY
Guidance Document for Conducting Pesticide Terrestrial Field Dissipation Studies
Series on Testing & Assessment
No. 232
Series on Pesticides
No. 82
JT03391244
Complete document available on OLIS in its original format
This document and any map included herein are without prejudice to the status of or sovereignty over any territory, to the delimitation of
international frontiers and boundaries and to the name of any territory, city or area.
EN
V/JM
/MO
NO
(20
16
)6
Un
classified
En
glish
- Or. E
ng
lish
Cancels & replaces the same document of 12 February 2016

ENV/JM/MONO(2016)6
2
ENV/JM/MONO(2016)6
3
OECD Environment, Health and Safety Publications
Series on Testing and Assessment
No. 232
Series on Pesticides
No. 82
GUIDANCE DOCUMENT FOR CONDUCTING PESTICIDE TERRESTRIAL FIELD
DISSIPATION STUDIES
Environment Directorate
ORGANISATION FOR ECONOMIC CO-OPERATION AND DEVELOPMENT
Paris 2016
ENV/JM/MONO(2016)6
4
About the OECD
The Organisation for Economic Co-operation and Development (OECD) is an intergovernmental
organisation in which representatives of 34 industrialised countries in North and South America, Europe
and the Asia and Pacific region, as well as the European Commission, meet to co-ordinate and harmonise
policies, discuss issues of mutual concern, and work together to respond to international problems. Most of
the OECD’s work is carried out by more than 200 specialised committees and working groups composed
of member country delegates. Observers from several countries with special status at the OECD, and from
interested international organisations, attend many of the OECD’s workshops and other meetings.
Committees and working groups are served by the OECD Secretariat, located in Paris, France, which is
organised into directorates and divisions.
The Environment, Health and Safety Division publishes free-of-charge documents in eleven different
series: Testing and Assessment; Good Laboratory Practice and Compliance Monitoring; Pesticides;
Biocides; Risk Management; Harmonisation of Regulatory Oversight in Biotechnology; Safety of
Novel Foods and Feeds; Chemical Accidents; Pollutant Release and Transfer Registers; Emission
Scenario Documents; and Safety of Manufactured Nanomaterials. More information about the
Environment, Health and Safety Programme and EHS publications is available on the OECD’s World
Wide Web site (www.oecd.org/chemicalsafety/).
This publication was developed in the IOMC context. The contents do not necessarily reflect the
views or stated policies of individual IOMC Participating Organizations.
The Inter-Organisation Programme for the Sound Management of Chemicals (IOMC) was established in
1995 following recommendations made by the 1992 UN Conference on Environment and Development
to strengthen co-operation and increase international co-ordination in the field of chemical safety. The
Participating Organisations are FAO, ILO, UNDP, UNEP, UNIDO, UNITAR, WHO, World Bank and
OECD. The purpose of the IOMC is to promote co-ordination of the policies and activities pursued by
the Participating Organisations, jointly or separately, to achieve the sound management of chemicals in
relation to human health and the environment.
ENV/JM/MONO(2016)6
5
This publication is available electronically, at no charge.
For this and many other Environment,
Health and Safety publications, consult the OECD’s
World Wide Web site (www.oecd.org/ehs)
or contact:
OECD Environment Directorate,
Environment, Health and Safety Division
2, rue André-Pascal
75775 Paris cedex 16
France
Fax : (33-1) 44 30 61 80
E-mail : [email protected]
© OECD 2016
Applications for permission to reproduce or translate all or part of this material should
be made to: Head of Publications Service, [email protected], OECD, 2 rue André-
Pascal, 75775 Paris Cedex 16, France
ENV/JM/MONO(2016)6
6
FOREWORD
This Guidance Document for conducting pesticides terrestrial field dissipation (TFD) studies has
been developed by an ad hoc Expert Group of the OECD Working Group on Pesticides (WGP).
Developing guidance for conducting terrestrial field dissipation studies is part of a global project that
includes constructing an ecoregion crosswalk between North America and European ecoregions. The
ecoregion crosswalk objectives are to: (i) identify similar eco-regions between North America and Europe;
(ii) provide a GIS (geographic information systems)-based decision support to assist in the selection of
regions for TFD studies; and (iii) provide background information on pesticide use areas (crop-based),
soils and climate.
The outcome of the project is the present international guidance document for conducting pesticide
field dissipation studies and identifying similar ecoregions. A harmonised methodology, based on a
conceptual model and modular approach, is provided to conduct the study. This will allow for pesticide
field dissipation/ accumulation studies conducted at foreign sites to be evaluated and considered by other
countries and regulatory agencies.
In parallel to this guidance document, an ENASGIPS model – Europe-North America Soil
Geographic Information for Pesticide Studies – has been developed and is available publicly
(www.enasgips3.org). It is a GIS-based model for identifying similar ecoregions between Europe and
North America and a tool for field site selection based on concerns identified in the conceptual model.
After two rounds of comments in 2014-2015 among the WGP and the Working Group of National
Co-ordinators of the Test Guidelines Programme (WNT), the TFD Guidance Document was approved by
the WGP and WNT in October 2015, and declassified in February 2015.
This document is being published under the responsibility of the Joint Meeting of the Chemicals
Committee and the Working Party on Chemicals, Pesticides and Biotechnology.
ENV/JM/MONO(2016)6
7
TABLE OF CONTENTS
Foreword ……………………………………………………………………………………………………
4
List of Abbreviations ……………………………………………………………………………………
8
I. Introduction …………………………………………………………………………………....
9
I-A Conceptual model/molecular approach …….………………………………………………....
10
I-B Additional study modules ……………………………………………………………………..
13
II. Basic study …………………………………………………………………………………………..
15
II-A Information on the test substance ……………………………………………………………..
15
II-B Field plot system ……………………………………………………………………………...
17
II-C Site selection ………………………………………………………………………………….
18
II-D Field plot design ………………………………………………………………………………
19
II-E Procedure ……………………………………………………………………………………..
20
1. Site characterisation
2. Application of the test substance
3. Study duration
4. Management
5. Irrigation
6. Environmental conditions and monitoring
7. Soil sampling
8. Sampling of other media
9. Sampling strategies to increase sensitivity
II-F Data analysis, interpretation and reporting …………………………………………………...
32
1. Statistical analysis
2. Data interpretation and quantitative assessment
3. Mass accounting considerations
4. Reporting
III. DegT50 Module ……………………………………………………………………………………..
34
ENV/JM/MONO(2016)6
8
III-A Information on the test substance …………………………………………………………….
35
III-B Field plot systems …………………………………………………………………………….
36
III-C Site selection ………………………………………………………………………………….
36
III-D Field plot design ……………………………………………………………………………..
37
III-E Procedure …………………………………………………………………………………….
37
1. Site characterisation
2. Application of the test substance
3. Study duration
4. Management
5. Irrigation
6. Environmental conditions and monitoring
7. Soil sampling
8. Sampling strategies to increase sensitivity
III-F Handling and analysis of samples …………………………………………………………….
40
IV. Runoff module ………………………………………………………………………………………
41
IV-A Introduction …………………………………………………………………………………..
41
IV-B Field site selection and description …………………………………………………………..
41
1. Site: Location, climate, topography, soils, geology and history
2. Soil characteristics
IV-C Runoff plot design …………………………………………………………………………….
42
IV-D Pesticide application ………………………………………………………………………….
43
IV-E Collection of runoff samples (measurement of runoff) ……………………………………….
43
IV-F Equipment of runoff flow measurements …………………………………………………….
43
IV-G selection of automatic sampler ……………………………………………………………….
44
IV-H Metrological record …………………………………………………………………………..
44
IV-I Handling and analysis of samples ……………………………………………………………
44
IV-J Results ………………………………………………………………………………………..
45
V. Volatilization module ……………………………………………………………………………….
45
V-A Introduction …………………………………………..............................................................
45

ENV/JM/MONO(2016)6
9
V-B Criteria for volatility module selection ……………………………………………………….
46
1. Vapour pressure
2. Henry’s Law constant
3. Soil adsorption effects
V-C Study design and field site selection ………………………………………………………….
49
V-D Test substance …………………………………………………………………………………
49
V-E Air sampling …………………………………………………………………………………..
49
V-F Environmental conditions and meteorological record ………………………………………..
49
V-G Development of the field volatility protocol ………………………………………………….
50
V-H Reporting and evaluation data ………………………………………………………………..
50
V-I Utility of experimental results in assessment …………………………………………………
51
VI. Leaching to depth module ………………………………………………………………………….
51
VI-A Introduction ……………………………………………………………………………………
51
VI-B Study design …………………………………………………………………………………..
51
VI-C Utility of experimental results ………………………………………………………………..
52
VII. Plant uptake module ……………………………………………………………………………….
53
VII-A Introduction ……………………………………………………………………………….....
53
VII-B Study design ………………………………………………………………………………….
53
VII-C Pesticide application …………………………………………………………………………
54
VII-D Sampling ……………………………………………………………………………………..
54
VII-E Analysis ………………………………………………………………………………………
54
ENV/JM/MONO(2016)6
10
VIII Principle, applicability and use of the study results ……………………………………………..
55
VIII-A Principle of the terrestrial field dissipation study …………………………………………… 55
VIII-B Applicability of the terrestrial field dissipation study ……………………………………….
56
VIII-C Use of the terrestrial field dissipation study results ………………………………………….
57
1. Use in model evaluation
2. Use as input for environmental fate and transport models
3. Use in terrestrial exposure assessment
4. Use in refined risk assessments (RRAs)
References ……………………………………………………………………………………………….…
60
Appendices …………………………………………………………………………………………..…….
68
Appendix 1: suggested criteria for module selection …………………………………………………...….
68
Appendix 2: Definitions and units ……………………………………………………………………….…
72
Appendix 3: Data sheet to characterize test substance properties …………………………………………
74
Appendix 4: Analytical method reporting, QA/QC and validation ………………………………………..
75
Appendix 5: site characterization data sheet ………………………………………………………………
78
Appendix 6: Sample description of the soil profile (USDA) ………………………………………………
79
Appendix 7: Physicochemical properties of soil ……………………………………………………………
80
Appendix 8: Meteorological history data sheet …………………………………………………………….
81
Appendix 9: site use and management history for the previous three years ………………………………
82
Appendix 10: Runoff module ………………………………………………………………………………
83
Appendix 11: Example of data reporting tables …………………………………………………….…….
84
ENV/JM/MONO(2016)6
11
LIST OF ABBREVIATIONS
CV Coefficient of Variation
DQO Data Quality Objectives
DT50 Refer Appendix 2
EEC Estimated Exposure Concentration
EPA United States Environmental Protection Agency
EXAMS Exposure Analysis Modeling System
FAO Food and Agriculture Organization of the United Nations
GIS Geographical Information System
NAFTA North American Free Trade Agreement
NRCS Natural Resources Conservation Service, USDA
PMRA Pest Management Regulatory Agency
PRZM Pesticide Root Zone Model
RRA Refined Risk Assessment
t1/2 Refer Appendix 2
TDR Time Domain Reflectometry
TFD Terrestrial Field Dissipation
USDA United States Department of Agriculture
ENV/JM/MONO(2016)6
12
I. INTRODUCTION
1. This OECD guidance for conducting terrestrial field dissipation studies (TFD) was prepared
following the recommendations made by the OECD Workshop on the Development of Harmonized
International Guidance for Pesticide Terrestrial Field Dissipation Studies and Crosswalk of North
American and European Eco-regions, held in Ottawa, Canada, in March 2011. The workshop
report published in the series on Pesticides, No. 68 is available on the Internet
http://www.oecd.org/env/ehs/pesticides-biocides/seriesonpesticides.htm . The main purpose of this
workshop was to elicit OECD country experts’ input on issues related to harmonizing guidance for
pesticide terrestrial field dissipation (TFD) studies. By sharing their views and expertise, the
participants contributed to further progress towards harmonization among OECD countries in this
scientific and regulatory area.
2. This document provides guidance on how to conduct terrestrial field dissipation (TFD) studies to
demonstrate the transformation, transport and fate of pesticides under representative actual use
conditions when a pesticide product is used according to the label. These field studies can help to
substantiate the physicochemical, mobility and transformation data from laboratory studies, and
indeed, may be a standard regulatory requirement in some jurisdictions. Environmental fate studies
have shown that pesticide dissipation may proceed at different rates under actual field conditions
and may result in degradates forming at levels different from those observed in laboratory studies.
3. The objective of this guidance document is to ensure that TFD studies are conducted in a manner
that will provide risk assessors with more confidence in the data generated and with a better
understanding of the assumptions and limitations of the data and estimated dissipation half-lives of
the chemical. In addition, the TFD studies will provide the risk assessors with the end-points
needed to carry out exposure and risk assessments according to supra national and national
requirements in the EU countries. Properly designed field dissipation studies will also provide a
feedback mechanism for testing the hypothesis generated during the problem formulation phase of
the risk assessment. Often, the interpretation of the field results relative to the hypothesis of
expected behaviour requires an understanding of the specific site conditions under which the study
was conducted. Appendices 1-11 provide examples of the data elements deemed critical for
evaluating the hypothesis.
4. One method, which can be used to help in the design of a TFD study, is the 'conceptual model'
approach. In this approach, a conceptual model is developed and environmental concerns are
identified for an individual pesticide using assumptions derived from laboratory data in
combination with the formulation type and field conditions under which the study will be
conducted. In addition to the mandatory basic study, a TFD study includes only those fate
processes that are significant to the pesticide in question. The conceptual model is based on the
chemical’s physicochemical properties, laboratory environmental fate studies, formulation type
and intended use pattern. The conceptual model is therefore a prediction of the relative importance
of each of the transformation and transport processes that may be involved in the dissipation of a
pesticide under field conditions and represents the sum total of all potential dissipation processes.
As such, it can be used as a working hypothesis for which aspects of dissipation the TFD studies
should address. Although the responsibility for determining which processes are significant rests
with the study sponsor, the regulatory authorities in EU, NAFTA and OECD countries may be
consulted after the development of the pesticide-specific conceptual model if there is a question
about whether a particular dissipation process (i.e., represented by individual study modules)
ENV/JM/MONO(2016)6
13
should be included in the study protocol. Through the use of the conceptual model approach, study
sponsors should be able to provide data that are useful in the assessment and characterization of
exposure and risk, fully support claims of dissipation in the final analysis, and reduce the number
of rejected studies.
5. As the ecological risk assessment evolves, so does the need for more complete characterization of
the data supporting the risk assessment. Critical in this characterization is an understanding of the
assumptions and limitations inherent in the data. The TFD study is a keystone study that provides
the primary means for testing the hypothesis of pesticide behaviour under actual use conditions.
Although laboratory data is the foundation for the hypothesis and the basis for the conceptual
model approach, the TFD study can provide a mechanism for testing and refining the hypothesis
for the environmental fate and transport of a pesticide under actual use conditions.
I-A. Conceptual Model/Modular Approach
6. Well-designed Terrestrial Field Dissipation (TFD) studies answer the risk assessor’s basic
questions: Where did the pesticide go when applied in the field in accordance with label
directions? How does the pesticide behave under field conditions? Different regulatory regimes
have different end uses for the TFD; however, by using a conceptual model in the study design
phase, the study sponsor can address this question by determining the overall rate of dissipation. In
addition, the study sponsor can investigate, as appropriate, which routes of dissipation need to be
evaluated in order to adequately characterize the behaviour of a pesticide in the field under actual
use conditions. Where required by the appropriate regulatory regime, the study sponsor should
consider a study design suited to answer the following questions: Is the chemical persistent and is
there a potential for residue carry over? Does the chemical have potential for leaching and
groundwater contamination? Does the chemical have potential for volatilization and long range
transport? Does it form major transformation products or other transformation products of
toxicological significance? Does the chemical have potential for surface runoff to non-target areas?
In addition, the use pattern may need to be considered and steps taken to ensure that the overall
study design accounts for potential formulation effects. Different designs may be necessary to
investigate the effect of multiple formulation types, for example, granules and emulsifiable
concentrates. The relative requirements of different regulatory regimes for TFD studies may be
found by consulting their respective data requirements.
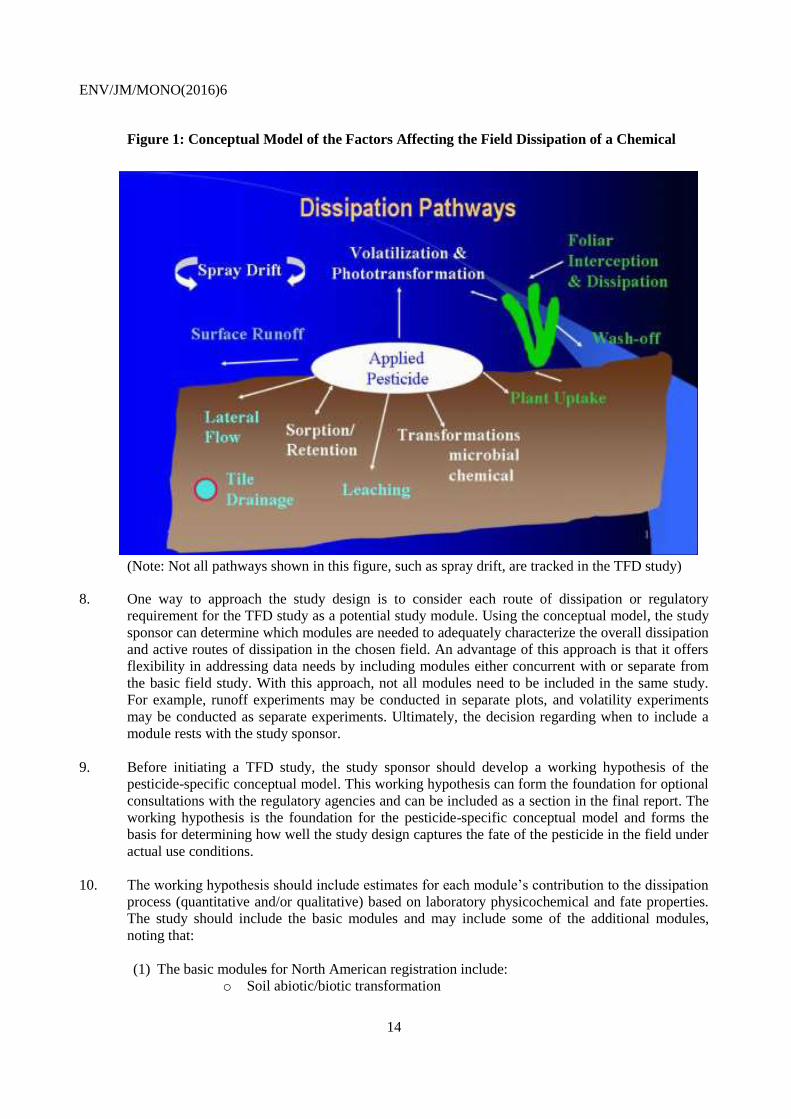
7. Before conducting a study, the study sponsor needs to carefully consider all potential processes
and routes of dissipation as well as determine which of these are critical to answering the risk
assessor’s basic question (Figure 1)
ENV/JM/MONO(2016)6
14
Figure 1: Conceptual Model of the Factors Affecting the Field Dissipation of a Chemical
(Note: Not all pathways shown in this figure, such as spray drift, are tracked in the TFD study)
8. One way to approach the study design is to consider each route of dissipation or regulatory
requirement for the TFD study as a potential study module. Using the conceptual model, the study
sponsor can determine which modules are needed to adequately characterize the overall dissipation
and active routes of dissipation in the chosen field. An advantage of this approach is that it offers
flexibility in addressing data needs by including modules either concurrent with or separate from
the basic field study. With this approach, not all modules need to be included in the same study.
For example, runoff experiments may be conducted in separate plots, and volatility experiments
may be conducted as separate experiments. Ultimately, the decision regarding when to include a
module rests with the study sponsor.
9. Before initiating a TFD study, the study sponsor should develop a working hypothesis of the
pesticide-specific conceptual model. This working hypothesis can form the foundation for optional
consultations with the regulatory agencies and can be included as a section in the final report. The
working hypothesis is the foundation for the pesticide-specific conceptual model and forms the
basis for determining how well the study design captures the fate of the pesticide in the field under
actual use conditions.
10. The working hypothesis should include estimates for each module’s contribution to the dissipation
process (quantitative and/or qualitative) based on laboratory physicochemical and fate properties.
The study should include the basic modules and may include some of the additional modules,
noting that:
(1) The basic modules for North American registration include:
o Soil abiotic/biotic transformation
Figure 1 Conceptual Model of the Factors Affecting the Field
Dissipation of a Chemical
Figure 1 Conceptual Model of the Factors Affecting the Field
Dissipation of a Chemical
ENV/JM/MONO(2016)6
15
o movement (leaching) down the soil column via soil concentration
measurement
(2) The additional modules are:
o Runoff
o Volatilization
o Leaching to depth
o Plant uptake
o Others
11. For the “basic Study” module (see section II), both North American and EU registration
requirements have been met. The Basic Study is likely to address EU requirements for a TFD
study in the circumstances that TFD studies have been triggered by the criteria in the EU
regulations. Under certain circumstances, additional modules may be required for North American
registration for certain pesticide products and their uses. For EU registration, an additional module
(the Deg T50 module) may also be conducted as a higher tier option even when TFD studies have
not been triggered as a regulatory requirement.
12. Mainly with respect to North American registration needs, the conceptual model described above
should take in consideration anticipated conditions at the individual TFD study sites. These
conditions include field soil properties compared to soils used in laboratory studies, weather data,
water balance, formulation type, mode of delivery, crop influence (if any), agronomic practices
and other factors. Additionally, laboratory estimated contribution to dissipation for each module
(both quantitative and/or qualitative) should be described for both the basic study modules and any
additional modules that are necessary based upon a review of laboratory data.
13. The study sponsor should consider the following when determining if an additional module, other
than the basic study modules, should be included or excluded:
(1) Only those routes of dissipation that are included in the field can be claimed to significantly
affect the fate of a pesticide and/or its degradates in the field. However laboratory studies may
be more reliable to quantify certain dissipation processes, such as plant uptake.
(2) Additional modules should not be excluded from the study when data indicate that associated
processes may contribute to significant pesticide dissipation or result in any pesticide
dissipation of toxicological concern. Refer to Section B, below, for a discussion of indicators
that are used to determine inclusion of additional modules).
(3) Ideally, when all modules are chosen, total dissipation attributed to excluded modules should
not exceed 20%.
(4) Because drift modules are not included in the study, best application management practices
should be used to minimize any loss due to spray drift.
14. Ultimately, it is the responsibility of the study sponsor to establish a hypothesis of the routes of
dissipation (i.e., the conceptual model) that will affect the outcome of the TFD study. The TFD
study should test the established hypothesis, and the final report should include the hypothesis and
the results analysed in order to confirm or modify the hypothesis.
ENV/JM/MONO(2016)6
16
I-B. Additional Study Modules
15. Laboratory studies on adsorption/desorption, column leaching, solubility and persistence can
predict the possibility of leaching beneath the root zone. The basic TFD study has traditionally
incorporated a leaching component and requires analyses of soil cores extending below the surface
(generally considered as 6 in. or 15 cm increments) to a given depth (Agriculture Canada, 1987;
Fletcher et al., 1989; Cheng, 1990). If neither the parent nor degradates of concern are detected in
all cores below a given depth, analysis of deeper cores is usually not necessary unless deep
leaching is expected to occur. A conservative tracer, such as bromide ion, must be applied to the
test plot to verify the depth of water leaching over the course of the study, when a leaching-to-
depth module is included.
16. The basic TFD study focuses on pesticide dissipation (degradation and transport) from the soil
surface layer in a bare ground study; it can be used to estimate field degradation only when other
major routes of dissipation (e.g., leaching, volatilization, runoff and plant uptake) are quantified
and shown to be negligible. In addition to the guidance described in this document, the regulatory
authorities may require other dissipation studies to answer specific risk assessment questions. In
deciding if an additional study module is necessary in a field study, the study sponsor should ask
the following questions:
(1) Is the DegT50 module required?
(2) What is the potential for dissipation of the parent compound and its major transformation
products by a given route other than leaching (e.g., volatilization, photolysis, runoff, plant
uptake, etc.)?
(3) Is the potential route of dissipation great enough to warrant measurement under field
conditions representative of actual use?
17. In summary, the process of selecting modules to include TFD studies depends on the pesticide-
specific conceptual model and the identified concerns, including data required for water modeling
as defined in the conceptual model. The study design should anticipate the needs of the risk
assessor who will rely on a clear explanation of the assumptions used in the development of the
study design. Although not required, the study sponsor may consult with the risk assessor and the
risk manager on the design of the pesticide-specific conceptual model early in the process. Early
consultation will give the study sponsor time to assess the needs of the risk assessor and avoid
unnecessary expenditure of time and resources. A well-developed pesticide specific conceptual
model should be prepared and used as the basis for such consultation.
18. As noted above, the TFD study is a keystone study in that it provides the primary means for testing
the hypothesis of environmental dissipation (transformation/degradation, transport) developed
during the problem formulation phase of a risk assessment. The current guidance has been
developed to provide the risk assessor with a better understanding of the assumptions and
limitations inherent in the data, an improved perspective on the estimate of error in the study
results and ultimately better confidence in the data generated. The guidance has been written to
provide maximum flexibility for the study design while increasing confidence in the data.
Therefore, the study designer should look to the overall hypothesis of pesticide fate based on a
combination of data, including laboratory studies and physicochemical properties as well as
climate, soil, agronomic and site characteristics. Once a hypothesis is developed, the study design
may include additional modules as needed. The modules may be run concurrently with the basic
field soil or may be plugged in using other data, as long as the data are scientifically valid and
ENV/JM/MONO(2016)6
17
appropriate. One of the most important points to remember when designing this study is that the
results of the study describe the pesticide’s major routes of dissipation in the environment.
19. In most cases, using the suggested criteria found in Appendix 1 or a lines-of-evidence approach
based on physicochemical properties and laboratory fate data is the best way to answer these
questions and to determine if an additional module(s) should be included in the TFD study. Using
this approach, the following modules should be considered in all phases of the study design:
20. DegT50 module: This module is optional. The objective for including this module is to facilitate a
higher tier option for generating a robust estimation of kinetic parameters that are used for
estimating the DegT50. In this case, the DegT50 is the half-life due to degradation within the bulk
soil matrix of the field.
21. First, the study sponsor should determine if inclusion of the DegT50 module is necessary. The
decision on whether or not to include this module could be based on the results of the first tier EU
groundwater modeling (FOCUS modeling) or proposed terrestrial risk assessment using laboratory
derived kinetic endpoints.
Second, the experimental design of module is left to the study sponsor; however, the following
should be considered:
1. Apply only a single application to bare ground.
2. Minimize possible surface losses such as photolysis and volatilization by incorporating or
watering in the pesticide by irrigation, or by covering the plot surface with a layer of
sand (photolysis only) soon after application.
3. Use relatively small plots compared to the size of the plots used in a typical DT50 module.
22. Runoff module: Runoff is possible for both weakly adsorbed, highly soluble chemicals and
strongly adsorbed, slightly soluble chemicals. The former may runoff in the dissolved phase, and
the latter may adsorb on the particulate phase. However, the potential for runoff often depends
more on the type of formulation, cover crop, mode of application (e.g., surface application versus
soil incorporation) and site factors (e.g., slope, type of soil, infiltration capacity and rainfall
intensity) than on the chemical properties of the active ingredient(s) and transformation product(s).
Depending on the conditions of the particular field dissipation study site, loss due to runoff may be
a significant or insignificant component of pesticide dissipation from the surface. A simple runoff
collector at the down slope edge of the field may be adequate to monitor for the amount of
pesticide loss due to runoff from an unanticipated event (i.e., storm).
23. Volatilization Module: refer to Section V, below.
24. Leaching to depth module: This module should be considered when a chemical is identified as
having a leaching potential in the conceptual model. It should also be considered when lower tier
simulation modelling indicates a leaching potential for the test substance or its transformation
products and when the results from deep leaching investigations might inform higher tier
approaches for groundwater exposure assessment. It might also be selected if preferential flow or
karst topography would be issues at an experimental location.
25. Plant Uptake module: For systemic pesticides and transformation products whose mode of action
involves uptake through plant tissues (roots, leaves, etc.), this pathway may be a significant route
of dissipation. (For example, plant uptake may be an important route of exposure for non-target
ENV/JM/MONO(2016)6
18
organisms, such as honeybees). The study sponsor can characterize this route by conducting a
cropped-plot study in the field or by greenhouse studies on the same crop.
II. BASIC STUDY
26. The design of a field study depends on the predicted behaviour, concerns and major routes of
dissipation identified in the conceptual model. A basic study in a bare soil plot should include
determination of the concentrations of parent compound and major (or toxicologically important)
transformation products over time and by soil depth in a representative use area using a typical
formulation product. Additional modules include volatilization, runoff, leaching to depth/
groundwater, plant uptake and a design for estimating kinetics of transformation within bulk soil
that aims to minimise dissipation processes, particularly those that occur at the soil surface
(DegT50/90).
II-A. Information on the Test Substance
27. The test substance should be applied in a suitable formulation; it may be possible to provide
justification that a test formulation rather than a final formulated product is acceptable if the tested
formulation would be unlikely to affect fate and behaviour of the substance under field conditions.
Substances that are intended to be marketed in formulations that influence their rate of release into
the environment should include testing with the end-use product(s). Such formulations cannot be
substituted by other formulations if the environmental effects are assumed to not occur.
(Appendix 2 contains a list of definitions and units discussed throughout this guidance document).
28. The TFD study should address the effect of pesticide formulation on dissipation where applicable.
Different formulations may influence the fate or transport properties of the pesticide. For example,
granular or microencapsulated formulations may release the active ingredient more slowly than
emulsifiable concentrate formulations. For this reason, separate studies may be needed on
representative formulations from the applicable formulation groups listed below if it is anticipated
that these may influence dissipation behaviour. Applicants are strongly encouraged to consult with
regulatory authorities with respect to which formulation types to test if it is anticipated that the
final end-use formulation(s) may influence dissipation. If the various commercial formulations of a
given pesticide are not expected to change the fate of the active ingredient, the applicant should
provide the necessary justification in support of this assumption within the body of the study
report. In general, it may be possible to compare a field study conducted using water soluble
liquids/water soluble powders/emulsifiable concentrates with water dispersible liquids/wettable
powders/water dispersible granules. However, separate field studies will be needed for
microencapsulated and granular formulations unless convincing evidence indicates that these
studies will not influence the dissipation behaviour. The recommended groupings of pesticide
formulations are as follows:
1) Water soluble liquids, water soluble powders and emulsifiable concentrates:
The release of an active ingredient into the environment is controlled by the formulation type and
the site-specific environmental conditions. Water soluble liquids and powders form true solutions
when mixed with water, and emulsifiable concentrates consist of oil soluble pesticides and
emulsifiers. These formulations are expected to have little effect on the transport of the pesticide in
soil (Flury, 1996).
ENV/JM/MONO(2016)6
19
2) Water dispersible liquids, wettable powders and water dispersible granules:
Water dispersible liquids, wettable powders, and dispersible granules consist of finely ground
solids of various dimensions. Various studies indicate that these formulations may affect the
transport of pesticides in soil (Ghodrati and Jury’ 1992; Hurto and Prinster, 1993 and Wauchope,
1987). For example, Ghodrati and Jury (1992) showed wettable powder formulations may be more
resistant to preferential flow than emulsifiable concentrates and technical grade material dissolved
in water.
3) Granules:
After precipitation or irrigation, granular formulations release the active ingredient gradually as a
function of diffusion or leaching (Furmidge, 1984). Therefore, this formulation may have a
significant effect on transport of the active ingredient if a rain event or irrigation occurs after
application.
Granular formulations are of particular concern with respect to runoff if the granules are applied
and not watered into the soil. To rely on rainfall to move the active ingredient into the soil always
carries the risk of off-site movement via runoff.
4) Microencapsulated pesticides:
Microencapsulated/controlled-release formulations can reduce the potential of leaching through the
soil (Flury, 1996), but may result in higher surface losses of a chemical when compared to other
formulations (Kenimer et al. 1997). Available literature studies on the effects of microencapsulated
and controlled-release formulations are inconsistent, and testing of this formulation type needs to
be evaluated on a case-by-case basis.
5) Volatile and semi-volatile chemicals:
Highly volatile and semi-volatile chemicals (i.e., fumigants) are different from many conventional
pesticides. Although fumigants can be applied as a solid, liquid, or liquified gas, soil fumigants
rapidly volatilize and become a gas. In gaseous form, the fumigant can disperse and result in
multiple dissipation pathways such as volatilization, runoff, and leaching from soil. Based on
formulation type and laboratory studies, the study sponsor should identify the active ingredient(s)
and the transformation products that must be tracked in the field. If the formulation product
contains more than one active ingredient, the properties and data from laboratory studies for all the
active ingredients must be provided.
6) Non-radiolabelled or radiolabelled substances can be used for the test although non-
radiolabelled substances are preferred. The application of radiolabelled substances to field
environments is subject to pertinent national and local regulations.
29. The following information on the test substance (and transformation products if available) should
be included in the study report:
Description of the formulation product and active ingredient(s)
Solubility in water (Cheng, 1990; Agriculture Canada, 1987; OECD, 1993; and US EPA,
1988)
Vapour pressure (Cheng, 1990; Agriculture Canada, 1987 OECD, 1993; and US EPA, 1988)
Henry’s law constant
ENV/JM/MONO(2016)6
20
n-octanol-water partition coefficient (Cheng, 1990; Agriculture Canada, 1987; OECD, 1993;
and US EPA, 1988)
Dissociation constant in water, reported as pKa or pKb (Cheng, 1990; OECD, 1993; and US
EPA, 1988)
Hydrolysis as a function of pH (Cheng, 1990; Agriculture Canada, 1987; OECD, 1993; US
EPA, 1982; and Creeger, 1985)
Photolysis on soil (Cheng, 1990; Agriculture Canada, 1987; US EPA, 1982; SETAC-Europe,
1995; and Whetzel and Creeger, 1985)
Soil aerobic biotransformation (Cheng, 1990; Agriculture Canada, 1987; US EPA, 1982;
SETAC-Europe, 1995; and Fletcher and Creeger, 1985)
Soil anaerobic biotransformation (Cheng, 1990; Agriculture Canada, 1987; US EPA, 1982;
and SETAC-Europe, 1995)
Adsorption/desorption coefficients (Cheng, 1990; Agriculture Canada, 1987; US EPA, 1982;
and SETAC-Europe, 1995).
30. These data are important in developing the conceptual model, identifying the potential routes of
dissipation (modules) to be studied and aiding in the experimental design with respect to the
sampling strategies, site locations, sample size and quantity, frequency of sampling, analytes to
include in the analytical method, etc. The data are also necessary to interpret the results of the
study. (Refer to Appendix 3 for a data sheet that can be used in providing this information).
31. An appropriate analytical method of known accuracy, precision and sensitivity for the
quantification of the active ingredient and major transformation products should also be included
in the study. In most cases, cold (i.e., non-radiolabelled) analytical methods that are sufficiently
sensitive to detect and monitor pesticide residues in the field are used. In order to be useful for
terrestrial exposure assessments, the limit of quantitation (LOQ) of the chosen procedure should be
less than 5% of initial concentration (molar mass) and should ideally be less than the important
endpoints for non-target organisms. The analytical methods are subject to independent laboratory
validation (Marlow et al., 1995; SANCO 3029/99 rev.4 of 11/07/00; OCSPP 850.6100), unless the
analytical method was developed as part of the TFD study and is only used in the context of the
TFD study. Appendix 4 contains a description of environmental chemistry information that is
needed for validating analytical methods used in conducting field dissipation studies.
II-B. Field Plot Systems
32. Plot size should be adequate to demonstrate the transformation, mobility and fate of the test
material in soil under field conditions representative of actual use. The decision concerning the
plot size in field studies should be based on factors such as application methods, crop and
management factors, site characteristics and anticipated total number of samples. For pesticides
typically applied to cropped or conservation tillage plots (e.g., with at least 30% crop residues on
the surface), bare ground pesticide-treated plots are necessary to help distinguish dissipation
pathways.
33. Large-scale studies (Birk and Roadhouse, 1964; Hunter and Stobbe, 1972; and Khan et al., 1976)
are conducted using normal agricultural practices (e.g., cultivation prior to planting, etc.) and
equipment. These studies may be used in combination with other field studies, such as crop residue
studies, provided the TFD studies are not disturbed. Small plots (Chapman and Harris, 1982;
Harris et al., 1971; Harvey, 1983; Hill, 1981; and Walker and Brown, 1985) are treated using
research-plot application techniques (e.g., hand-held or backpack sprayers) that, in some cases,
may reduce the variability seen in large-scale studies. These small-plot techniques can also limit
ENV/JM/MONO(2016)6
21
the ability to interpret results and obtain satisfactory pesticide dissipation curves. Large-scale and
small-plot studies have the following characteristics:
1. Large-scale studies: Large-scale studies typically cover a treated area of 8 cropped rows by
25 m, but may range up to an entire field of several hectares, depending on the design of
the experiment and the use for which the product is intended. Typical plot sizes range from
4 × 10 m to 10 × 40 m.
2. Small-plot studies: Small plots (e.g., up to 2 x 2-6 m or 4-12 m2 in area) are preferable when
pesticide dispersion is uneven and dissipation curves are difficult to generate or interpret.
34. It is important to select appropriate plot sizes depending on the chemical, number of core
samplings required and management practices.
II-C. Site Selection
35. Field study sites should be representative of the soil, climatic and management factors under which
the pesticide will be used. Selected sites should be typical of the proposed use areas or based on
concerns (worst case scenario) identified in the conceptual model. For example, if the pesticide
properties and laboratory studies indicate a potential for leaching and groundwater contamination,
the selected site should provide ideal conditions for leaching, e.g., coarse textured soil, high
rainfall, shallow groundwater table, low organic matter content, low adsorption (Kd and Koc), etc.
The following factors should be considered in selecting field study sites:
Number of uses/crops
Geographic extent and acreage of the crops/use patterns
Soil characteristics
Topography
Climate (including temperature, amount and distribution of precipitation, solar exposure and
intensity)
Use and management practices
Crop impacts on pesticide dissipation
Pesticide formulation
Timing, frequency and method of pesticide application
Label restrictions regarding usage, sites or conditions
36. If selected field sites are not representative of the major use patterns, or use areas of the pesticide
or not based on concerns, the applicability of the study results may be limited. Tools, such as
geographic information system (GIS)-based decision support models or other GIS-based
vulnerability assessment tools that account for the critical factors affecting pesticide dissipation,
can be used to determine the most appropriate field sites (Kroetsch et al., 1998; Gangaraju et al.,
2013; and Ruhman et al., 2013). It is strongly recommended to use ENAS_GIPS (Europe-North
America Soil Geographic Information for Pesticide Studies) in selecting sites for field dissipation
studies and in accepting studies conducted at foreign sites. The studies conducted at foreign sites
in similar ecoregions are considered by other countries. This model uses ecoregion concept and is
based on geospatial soil and agricultural crops databases, climatic information, and pesticide
properties, including laboratory fate data. This model also helps to identify sites based on concerns
(worst case scenarios) identified by the conceptual model and has the advantage that another field
study may not be required if there is a use expansion to new areas or new crops. Comparable field
ENV/JM/MONO(2016)6
22
study area selection is based on environmental conditions and the conceptual pesticide dissipation
model developed from laboratory fate studies.
37. The TFD study should include multiple field sites, generally four to six study sites. The actual
number of sites needed depends on factors such as the types of formulations, the geographical
extent of the use pattern, the number of uses and management practices as well as the range in soil
and climatic conditions within the geographic extent of the uses. If pesticide use is limited
geographically and/or to minor crops, a reduced number of field studies may be appropriate.
II-D. Field Plot Design
38. An assessment of the fate of the pesticide in the terrestrial environment should include all processes
that can affect the fate of the chemical, including transformation, leaching, volatilization, runoff,
and sorption to soil and plant uptake (Cheng, 1990). Terrestrial field studies should be designed,
conducted and evaluated to assess the most probable routes and rates of pesticide dissipation under
conditions representative of actual use. The physicochemical properties of the pesticide, laboratory
environmental fate data, and application techniques/use pattern and site characteristics should be
considered in designing the study.
39. The basic field study design evaluates field dissipation in soil at a bare ground site. If the pesticide-
specific conceptual model suggests that volatilization, leaching, runoff or plant uptake are
potentially important dissipation routes, then a modular approach is recommended whereby
dissipation pathways that can be studied concurrently at one site are included, while those
pathways that are incompatible are evaluated in separate studies.
40. The study design should encompass the range of practices and conditions that reflect the actual
usage of the test substance. For all field dissipation studies, non-cropped (bare ground) plots must
be included. If the sponsor considers that plant uptake of residues from the soil may be an
important dissipation pathway, then the trial should be conducted with a cropped soil in addition to
the non-cropped (bare ground) plots. Data generated from laboratory or greenhouse studies may
be used to supplement the field data. However, the use of laboratory or greenhouse data will
require an explanation of the conditions under which the data were collected and how any
differences between conditions in the laboratory/greenhouse, the field study results, and the
laboratory hypothesis may influence the evaluation of the field results. The studies should also
include an untreated control plot.
41. Because of field-scale variability, the experimental units in each TFD study should be replicated.
Replication serves the following functions (Steel and Torrie, 1980):
Provides an estimate of experimental error.
Improves precision by reducing standard deviation of a mean.
Increases the scope of inference of the experiment by selection and appropriate use of variable
experimental units.
Effects control of the error variance.
ENV/JM/MONO(2016)6
23
II-E. Procedure
1. Site Characterization
42. Assessing pesticide dissipation requires detailed description of the site characteristics as well as
characterization of representative soils at each test site. Ideally, the site selected for the TFD study
should be represented by a single soil type in order to reduce variability in the field. Site
characterization information is critical to assess in situ chemical and physical properties of the test
soil.
a. Site Description
43. The study site should be described according to geographic coordinates (e.g., latitude, longitude),
location on a map (e.g., topographic map, aerial photograph or soil survey map), landforms,
landscape position, land surface configuration (e.g., slope length and gradient, aspect and
direction, micro-relief, roughness, shape, elevation) and depth to groundwater. A suggested site
description sheet can be found in Appendix 5.
b. Soil Characterization
44. At each site, a representative soil pedon should be identified, and a minimum of one soil profile
should be described by soil horizons (preferably 1.5 m in depth) using standard soil morphological
properties (depth to and thickness of horizons or layers, Munsell color, texture, structure, macro
porosity, depth to a root restricting layer, etc.). Soil profiles will be described and classified at the
family or series level (taxonomic description and classes) according to an internationally
recognized system representative of the areas where the study is conducted. Taxonomic description
should be compatible with the databases in the ecoregion crosswalk project extension, including
those of the EU. The only three internationally recognized systems are the World Reference Base
(WRB) of the Food and Agriculture Organization of the United Nations (FAO), the Harmonized
World Soil Database and the US Soil Taxonomy of the United States Department of Agriculture
(USDA), Natural Resources Conservation Service (NRCS). In addition to the description of soil
morphology, information on the soil parent material, vegetation, erosion class, natural drainage
class, surface runoff, infiltration and saturated hydraulic conductivity should be reported. It is also
preferable to include the relevant soil moisture characteristics in SI units (kPa as well as bars). A
suggested soil profile description can be found in Appendix 6.
45. Soil samples from each horizon should be collected and characterized by determining the
physicochemical properties in the laboratory. The physical properties should include particle size
distribution (i.e., % sand, % silt and % clay, with size fractions specified), textural class (according
to ISO standard methods), undisturbed bulk density, and soil moisture characteristic curve (0-15
bar) to help determine the soil water balance throughout the study. The soil chemical properties
should include pH, percentage of organic carbon and cation exchange capacity. Internationally
recognized standardized methods (e.g., ISO, OECD, U.S. standard methods, etc.) should be used
and referenced for the determination of these properties. Depending on the chemical properties or
use site, additional analyses of the surface soil layer or epipedon and the subjacent horizon (layer)
may be helpful for determining sorption potential at the field site. Additional analyses include clay
mineralogy, specific surface area and anion exchange capacity, especially in soils dominated by
low activity clays or derived from volcanic materials. A suggested format for reporting the soil
properties is given in Appendix 7.
ENV/JM/MONO(2016)6
24
c. Environmental Conditions
46. Historical climatological data should be obtained to help evaluate site data with respect to long-
term regional variation, and the source and location of the historical data should be specified.
Historical climatic information should include monthly average rainfall, average monthly
minimum and maximum temperatures, and the dates and the number of days in the average annual
frost-free period. A suggested format for reporting the historical meteorological conditions is given
in Appendix 8.
d. Management History
47. Information on the use of the study site, for example, crops grown, pesticides and fertilizers used,
should be provided for the previous three years. The site selected should not have a history of the
use of the study pesticide or other pesticides of similar nature (chemical class, common non-
volatile transformation products, etc.) for at least three years prior to the study. This requirement is
necessary to reduce analytical interferences and potential microbial adaptations for the test.
Management factors, such as tillage and cultivation methods, irrigation practices, etc., should be
described in detail. A suggested format for reporting the land use and management history can be
found in Appendix 9.
2. Application of the Test Substance
48. In the TFD study, the pesticide product should be applied at the maximum proposed use rate
utilizing the same application method(s) as stated on the label. In limited instances (e.g., for ultra-
low application rates), it may be necessary to apply the pesticide at a rate greater than the
maximum proposed use rate due to analytical detection limits.
49. Recommended equipment for pesticide delivery in the TFD study should be of high precision,
suited for the particular pesticide formulation (some pesticides may need to be homogenized by a
continuous mixing device in the tank) and outfitted with a device to keep drift loss to a minimum.
50. The pesticide application, including timing and the number of applications, should be consistent
with labelling. However, to be appropriate for robust calculation of dissipation of active substance
(and where appropriate, metabolites), the maximum total annual or seasonal dose should be
applied in a single application. Where the maximum total annual or seasonal dose is to be applied,
care should be taken that the dose does not influence soil microbial functions. The pesticide
application should:
occur at the typical time(s) of the year and stage(s) in crop development when it is normally
used;
be performed according to label instructions for the specific formulation;
be incorporated if the pesticide is typically incorporated; and
be measured by spray cards or similar verification techniques and related to the target
application rate and measured concentration in the spray tank.
ENV/JM/MONO(2016)6
25
3. Study Duration
51. The duration of the TFD study, which has historically taken up to two years to complete, should be
sufficient to determine the DT90 of the parent compound as well as the pattern of formation and
decline of major transformation products in the soil. Whilst in an ideal situation the basic study
should be conducted until 90% dissipation has been achieved, there are potential circumstances in
which there may be limited practical advantage to continuation of the study where the aim of the
study is limited to estimation of the persistence of the applied substance and its
metabolites/breakdown products. Therefore it may be possible to provide a justification to
terminate the basic study before 90% dissipation of the applied substance has been reached,
provided that the reasoning is robust and supported by the collected data. However, it is extremely
important that the specific use of the TFD basic study within the regulatory framework where the
submission is being made and the reasons for early termination are considered extremely carefully.
In situations where 90% dissipation of the applied substance has not been reached, there is no
absolute maximum or minimum duration of the study, but the study must have experienced
multiple yearly cycles of weather conditions. Slow decline due solely to cold soil temperature or
low soil moisture must also be eliminated as reasons for any slowing of observed declines. Study
directors must consider the possibility for biphasic behaviour or plateauing of decline to manifest
itself after the early termination point as this could impact estimates of predicted soil
concentrations where such persistent substances are likely to be used either in successive years or
in rotational situations. A way of reliably estimating potential for accumulating concentrations that
includes slow phases where biphasic kinetics can occur is also important for informing appropriate
rotational crop metabolism and residues trials that support the consumer risk assessment and MRL
setting. In addition, where metabolites/degradation products have been identified in laboratory
studies which need to be investigated under field conditions, the potential for compromising the
elucidation of the behaviour of those metabolites/breakdown products must be taken into
consideration. This is not an exhaustive list and illustrates that the decision to terminate the study
before 90% dissipation is achieved is potentially complex.
52. In determining the decline of the major transformation products, the study duration should be
sufficient to determine the time required for major transformation products to dissipate to 10% of
their maximum detected values in the soil. A major transformation product is one accounting for
≥10% of the applied amount at any time during the laboratory studies, or one that has been
identified as being of potential toxicological or ecological concern. In the EU, though, this >10%
criteria is applied when: (a) transformation products are formed at > 5% of the applied at any time
during the laboratory incubations for more than two consecutive sampling times and (b) when, at
the termination of laboratory incubations, concentrations have reached 5% but are still increasing.
Therefore it is recommended that these additional EU criteria be applied for defining the
transformation products when the EU lab incubation DT criteria (Lab DT50/90 >60/200 days at
20°C and pF 2 soil moisture) for triggering field investigations are reached.
4. Management
53. The management (e.g., fertilization, seed bed preparation, weed control, sowing and tillage) of the
field dissipation study site should be carried out in accordance with good agronomic practices.
Tillage practices prior to application (conventional tillage, conservation tillage or no-till) should be
typical of those used for the particular crop and label recommendations, or after application where
they encourage shallow incorporation of the test substance. Deeper tillage operations that might be
associated with specific crops are not recommended if these were to occur after application of the
pesticide.
ENV/JM/MONO(2016)6
26
5. Irrigation
54. It is important that the study design include sufficient water to meet the crop need in quantity and
timing. Any irrigation applied should be based on normal agronomic practices for the region in
which the site is situated. If the use pattern includes irrigation to supplement the water
requirements of the plants, then the study should be conducted under irrigated conditions. In this
case, the study design should ensure appropriate timing and sufficient water to meet a minimum of
110% of the crop need. In the case of bare plots, the site should receive sufficient excess water at
the appropriate time to provide an additional minimum 10% of the target crop water demand so
that the amount of excess water applied to the bare plot is equivalent to the amount of excess water
that would have been applied if the crop had been present. Alternatively, if the use pattern does
not involve irrigation, then the field studies do not necessarily have to be conducted with
supplemental irrigation. However, it may be necessary to prepare the site for irrigation in case of
drier than normal conditions. For non-irrigated sites, the study design should ensure that a
minimum of 110% of normal monthly rainfall is delivered to the site.
6. Environmental Conditions and Monitoring
55. Measurement of meteorological variables is necessary to understand pesticide dissipation in the
field. Daily records of maximum, minimum and mean temperature (air and soil), total
precipitation, mean wind speed and potential evapotranspiration are recommended from five days
prior to the first application of the pesticide through to the conclusion of the study. Modelling
approaches for soil temperatures and moisture from air temperatures and precipitation may be
acceptable. When irrigation is used to supplement rainfall, timing and amounts of irrigation water
should also be reported.
56. The following environmental conditions should be recorded daily at the study site:
Precipitation and irrigation
Mean air temperature
Potential evapotranspiration or pan evaporation (can be determined from a nearby site, or
evapotranspiration may be calculated from other environmental data)
Hours of sunshine and intensity of solar radiation
Mean soil temperature
Soil moisture content
57. It is recommended to take soil moisture samples for measurements in 0 to 5 cm and 5 to 10 cm
depth for the purposes of generating a DegT50.
a. Soil Water Balance
58. Soil water content can affect the mode of degradation, degree of microbial activity, potential for
volatilization, plant growth and potential for movement (i.e., up or down in the soil profile). To
interpret routes and patterns of dissipation of the test substance, the soil water content needs to be
measured on a regular basis to adequately determine the flux of soil water. Continuous or daily
measurements are preferred, but at a minimum, readings should be collected at each sampling
time. Various methods of measuring soil water include tensiometers, time domain reflectometry
ENV/JM/MONO(2016)6
27
(TDR), neutron probes, gypsum blocks and direct measurement of the moisture content of the soil
samples (Klute, 1986).
b. Using Tracers to Track the Potential Depth of Leaching
59. A conservative tracer can be applied along with the test chemical to help determine the direction,
depth and rate of soil water movement through the vadose zone. Tracer selection should consider
the chemistry of the tracer, including potential sources of interference, background/baseline levels,
analytical detection limits and potential losses such as plant uptake. If a tracer is used, background
concentrations need to be analysed prior to the study.
c. Soil Temperature
60. The soil temperature can also affect the rate of degradation, degree of microbial activity, potential
for volatilization, plant growth, and potential for and direction of water movement (i.e., up or
down in the soil profile). Soil temperature should be measured at depths and at time intervals
relevant to the expected primary distribution of pesticide residues. Alternatively, modelling
approaches may be used to derive soil temperature profiles.
7. Soil Sampling
61. Soil samples for residue analysis should be representative of each replicate plot at each sampling
time. Replicate plots can be defined as repetitive, homogeneous sections of a field treated with the
test pesticide in a similar manner to allow comparison between treatments. Sampling procedures
can have a major effect on variability of pesticide concentrations in soil; accurate and consistent
sampling is vital for meaningful results. Variables such as plot size, soil variability, crop
management practices, pesticide application method and existing knowledge of the behaviour of
the pesticide in the environment should be considered in designing an appropriate soil-sampling
protocol.
a. Sampling Patterns
62. Soil core holes should be marked after sampling. Filling holes with soil from untreated areas of the
site or replacing the removed core with a blank coring tube to the same depth of sampling will
prevent the cross-contamination at greater depths and subsequent anomalous results. Cores should
be marked so that another sample will not be taken from the same/nearby sampled core.
63. A random or systematic soil sampling pattern (Roadhouse and Birk, 1961) may be followed,
depending on the type of pesticide application and other variables listed above. For example, the
soil may be sampled in-row only (e.g., seed furrow or band treatment) or by a random pattern that
covers the entire treatment area (i.e., broadcast application). Because it may be difficult to obtain
interpretable results using an in-row sampling pattern, extreme care should be taken in the
application and sampling procedures.
64. In order to avoid variability resulting from possible under-coverage, drift or edge effects, outside
rows of treated areas should be excluded from sampling.
65. In small plots, systematic sampling is preferred to ensure that all treated sectors of the plot are
represented and to make it easier to avoid sampling from a previous core hole or in zones where
spray patterns in successive passes of the application equipment may have overlapped or failed to
cover the surface adequately.
ENV/JM/MONO(2016)6
28
66. Larger diameter cores are expected to reduce variability in the field. Typically, a core of 2.5 cm to
5 cm (1 to 2 inches) in diameter has been used in TFD studies, but use of larger diameter cores
should be considered in the field design.
b. Depth of Soil Sampling
67. In order to fully demonstrate the fate and transport of the pesticide under study, soil should be
collected from a depth sufficient to encompass the vertical distribution of the pesticide and its
major transformation products at each sampling time. Data from laboratory studies
(physicochemical properties, mobility and transformation) can be used in conjunction with water
recharge estimates (e.g., average rainfall data and expected irrigation coupled with
evapotranspiration estimates) and soil permeability properties to establish appropriate core depths.
Soil sampling should typically proceed to at least a depth of one meter, particularly for pesticides
with laboratory fate characteristics that indicate leaching is an important route of dissipation.
68. The major transformation processes usually occur within the biologically active zone of the soil.
For sampling purposes, this zone can be defined as the maximum depth of tillage, rooting depth of
agronomic plants or the depth of an impermeable soil layer, whichever is deepest. If the laboratory
studies indicate a low potential of a pesticide to leach, the emphasis of soil sampling designs
should be placed on this zone of soil rather than sub-soils. The biologically active soil zone
concept will allow flexibility in experimental design because of different agronomic practices,
types of soil and site characteristics.
69. For most studies, soil cores should be collected to 1 m in depth and divided into six or more depth
increments for analysis (e.g., 15 cm, 15 cm, 15 cm, 15 cm, 20 cm and 20 cm). For low application
rate pesticides or where the results of the laboratory studies indicate very low mobility of the
parent chemical and its major transformation products in soil, core depths could be sectioned into
shorter increments to circumvent dilution of the chemical residues with excess soil. In all cases,
analysis of the sectioned cores should clearly define the extent of leaching of the parent chemical
and its major transformation products in the soil profile.
70. Soils should be sampled to a sufficient depth such that the lowest section of the sampled cores does
not contain detectable amounts of the active ingredient or major transformation products. In the
absence of rainfall or irrigation, the initial or zero time samples can be taken to at least one sample
increment below the depth of incorporation. For example, a pesticide incorporated to 3 inches
below the surface should be sampled from 0 to 6 inches (15 cm) and from 6 to 12 inches (15 to
30 cm), assuming a 6-inch (15 cm) interval.
c. Times of Soil Sampling
71. Soil sampling should be carried out prior to treatment, immediately after treatment (zero time) and
at increasing intervals (daily, weekly, monthly) between sampling times. If more than one
application is made, then soil sampling should be done just before and immediately after each
application and then at increasing intervals after the last application. Time intervals should be
based on the results of laboratory studies and other field studies, if available. Sampling frequency
should consider laboratory half-life estimates with increased frequency of sampling for shorter
half-life compounds. Other factors that may affect sampling frequency include compound mobility
and site-specific environmental conditions (e.g., rainfall and micro-climate). The frequency of
sampling should be concentrated after each application time to characterize the dissipation of the
test substance. However, the number and distribution of sample times should also be sufficient to
ENV/JM/MONO(2016)6
29
adequately characterize the formation and decline of the transformation products. The dissipation
of a product used in multiple applications over a season should be studied through a full cycle of
applications (Hill, 1981).
72. Residue data should be obtained until at least 90% of the pesticide and/or its major transformation
products have dissipated from the soil profile or the pattern of dissipation has been clearly
delineated (US EPA, 1975a and Smith, 1971). The study sponsor should determine the DT50 and
DT90 from the initial concentration because the dissipation rate constant often decreases with time
(i.e., the half-life is not constant as in first-order kinetics). If 90% dissipation is not reached by the
time of freezing temperature in the fall (autumn), the study should be continued in the following
year(s).
73. The plot should be sampled at the end of the growing season to determine residue carryover to the
next season; sampling in subsequent years may be necessary. Long-term studies may be
recommended if dissipation is slow to occur. This is particularly important for persistent, low
mobility pesticides or for those chemicals that show pesticidal activities at low concentrations.
74. Soil sampling of the control plot need only be conducted during the early stages of the study with a
sufficient number of samples to demonstrate absence of the pesticide prior to application and to
provide control soil for use in the analytical phase fortification and recovery experiments
d. Time Zero Sampling
75. The time zero concentration lays the foundation for all subsequent sampling and is used to build
confidence that the pesticide was applied uniformly and accurately. The following points should be
considered in developing a time zero sampling protocol for a single application on bare ground:
Availability of an appropriate analytical method with limits of quantitation low enough to
detect the parent and key degradates at relevant concentrations
Handling of all fortification samples in the same manner as soil samples
Testing of verification devices before use to provide confidence in compatibility with the test
substance
Verification of the actual rate applied
Calculation of an expected concentration in the field
Comparison of time zero concentrations with the expected concentration
76. For multiple applications, each application should be treated as time zero, and concentrations prior
to and immediately after application should be determined.
77. For cropped plots, the time zero sampling strategy should be modified to measure the portion of
pesticide reaching foliage as well as the portion reaching the ground surface.
78. The initial concentration in the soil immediately after treatment (“time zero”) is a crucial
benchmark value. Time zero sampling is recommended to verify residue concentrations reaching
the target and to confirm uniformity of its distribution. The pesticide residues in all subsequent soil
samples are evaluated in relation to this benchmark value. It cannot be emphasized enough how
critical accounting of a pesticide at time zero is are for the evaluation of the study results. Ideally, a
ENV/JM/MONO(2016)6
30
study should utilize techniques that maximize the delivery of the pesticide to the field at the target
rate and keep the differences between measured and target rates to a minimum.
79. Determination of time zero concentration involves soil sampling immediately after application.
Preferably, actual time zero sampling is conducted in duplicate, and the two sets of soil samples
are processed separately to provide two estimates of the mean time zero concentration. Time zero
sampling data should be used to confirm that the pesticide was applied uniformly to each plot.
Techniques used and any deficiencies associated with the delivery of the pesticide to the field
should be described and accounted for when analysing the study results.
80. Although not routinely required, there may be instances where a cropped plot should be sampled
concurrently with a bare soil plot. In this case, the following factors should be considered in the
sampling strategy of a well-designed protocol:
Time zero samples
Types of samples (i.e., soil versus plant) and sampling frequency
Sample locations (e.g., between rows, under rows)
Accounting for plant uptake versus foliar dissipation
Residues in roots
Chemical factors such as formulation and application method
Crop characteristics
e. Number and Pooling of Samples
81. The purpose of soil sampling in the TFD study is to measure the mean concentration of the
pesticide and its degradates or transformation products so that dissipation may be followed
quantitatively over time. In order to generate a reliable estimate of the mean concentration that
represents the entire treated plot, a sufficient number of core samples should be taken to achieve
acceptable variability in the concentration across the plot. The number of cores needed to estimate
the mean concentration (statistically, the sample size) will then depend on the desired precision
(i.e., standard deviation around the mean) and the variability of the pesticide concentration in the
field (the field or population variability).
82. The statistics of this estimation were developed several years ago (Gilbert, 1987) and have been
made into a calculator (DQO-PRO) by EPAs Superfund program to support the development of
Data Quality Objectives (DQOs). The DQO process is an experimental design exercise intended to
quantitatively define the sampling effort, given the data precision needed to support decision-
making.
83. In the case of the TFD study, the major DQO is measurement of the mean concentration at each
sampling time with a small enough error (standard deviation) that the means at different sampling
times over the course of the study can be used to calculate a statistically significant rate of
dissipation from the soil. Data presented by Jones et al. (2004) at the 227th American Chemical
Society National Meeting suggest that the standard deviation among 16 samples individually
analysed from a variety of TFD studies is about 110%. (This analysis provides an estimate of field
or population variability). Further analysis by industry (Van Wessenbeck, 2004) suggests that the
variability in calculated half-lives is less than the variability of the mean concentrations from
which they are calculated (assuming constant variability of the soil means over the course of the
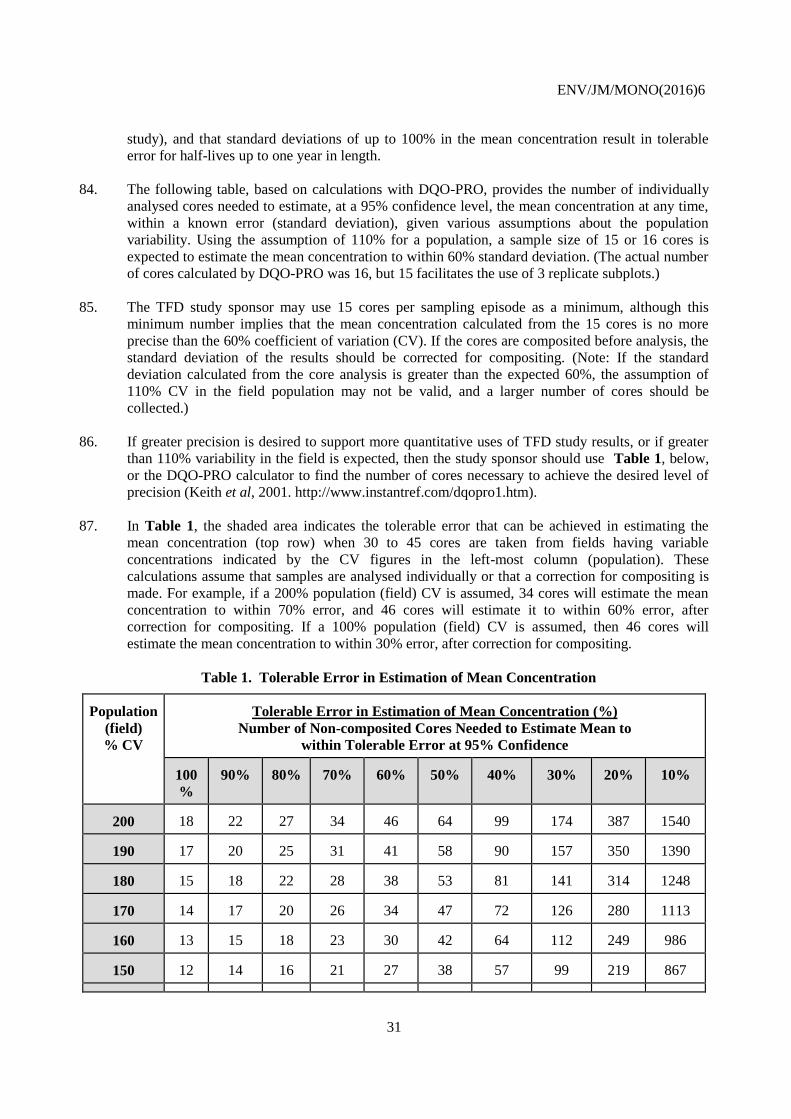
ENV/JM/MONO(2016)6
31
study), and that standard deviations of up to 100% in the mean concentration result in tolerable
error for half-lives up to one year in length.
84. The following table, based on calculations with DQO-PRO, provides the number of individually
analysed cores needed to estimate, at a 95% confidence level, the mean concentration at any time,
within a known error (standard deviation), given various assumptions about the population
variability. Using the assumption of 110% for a population, a sample size of 15 or 16 cores is
expected to estimate the mean concentration to within 60% standard deviation. (The actual number
of cores calculated by DQO-PRO was 16, but 15 facilitates the use of 3 replicate subplots.)
85. The TFD study sponsor may use 15 cores per sampling episode as a minimum, although this
minimum number implies that the mean concentration calculated from the 15 cores is no more
precise than the 60% coefficient of variation (CV). If the cores are composited before analysis, the
standard deviation of the results should be corrected for compositing. (Note: If the standard
deviation calculated from the core analysis is greater than the expected 60%, the assumption of
110% CV in the field population may not be valid, and a larger number of cores should be
collected.)
86. If greater precision is desired to support more quantitative uses of TFD study results, or if greater
than 110% variability in the field is expected, then the study sponsor should use Table 1, below,
or the DQO-PRO calculator to find the number of cores necessary to achieve the desired level of
precision (Keith et al, 2001. http://www.instantref.com/dqopro1.htm).
87. In Table 1, the shaded area indicates the tolerable error that can be achieved in estimating the
mean concentration (top row) when 30 to 45 cores are taken from fields having variable
concentrations indicated by the CV figures in the left-most column (population). These
calculations assume that samples are analysed individually or that a correction for compositing is
made. For example, if a 200% population (field) CV is assumed, 34 cores will estimate the mean
concentration to within 70% error, and 46 cores will estimate it to within 60% error, after
correction for compositing. If a 100% population (field) CV is assumed, then 46 cores will
estimate the mean concentration to within 30% error, after correction for compositing.
Table 1. Tolerable Error in Estimation of Mean Concentration
Population
(field)
% CV
Tolerable Error in Estimation of Mean Concentration (%)
Number of Non-composited Cores Needed to Estimate Mean to
within Tolerable Error at 95% Confidence 100
%
90%
80%
70%
60%
50%
40%
30%
20%
10%
200
18
22
27
34
46
64
99
174
387
1540
190
17
20
25
31
41
58
90
157
350
1390
180
15
18
22
28
38
53
81
141
314
1248
170
14
17
20
26
34
47
72
126
280
1113
160
13
15
18
23
30
42
64
112
249
986
150
12
14
16
21
27
38
57
99
219
867
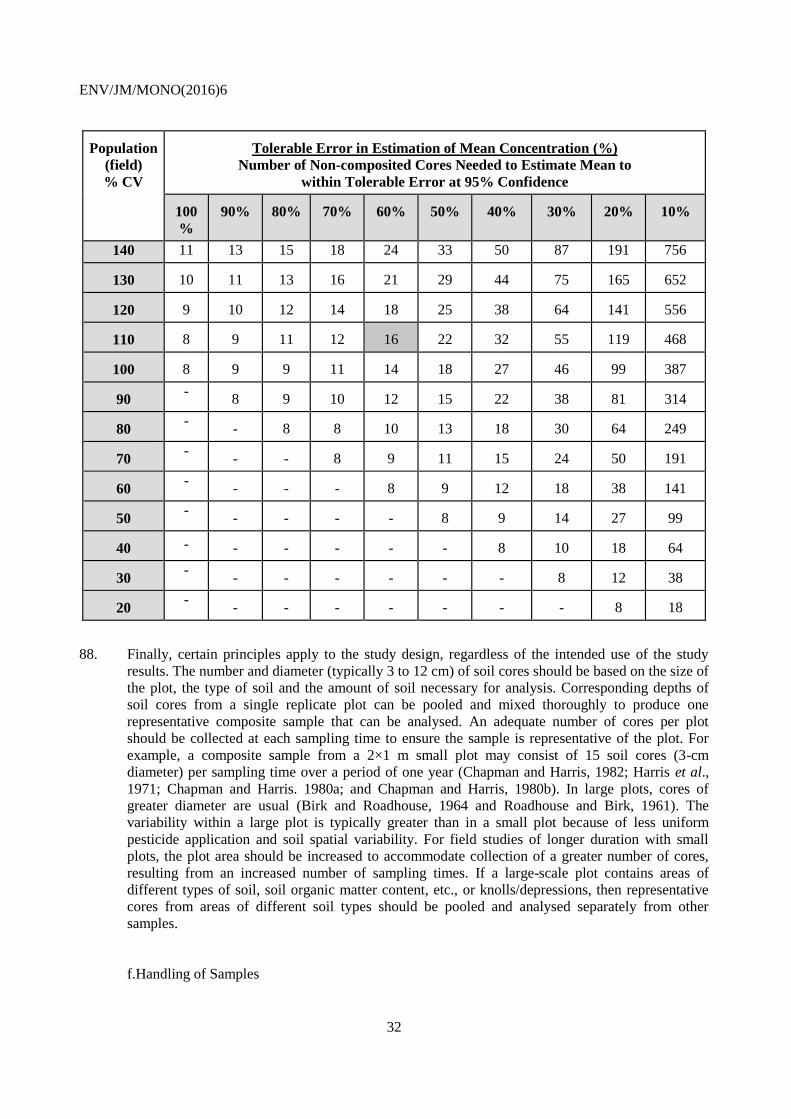
ENV/JM/MONO(2016)6
32
Population
(field)
% CV
Tolerable Error in Estimation of Mean Concentration (%)
Number of Non-composited Cores Needed to Estimate Mean to
within Tolerable Error at 95% Confidence 100
%
90%
80%
70%
60%
50%
40%
30%
20%
10%
140 11 13 15 18 24 33 50 87 191 756
130
10
11
13
16
21
29
44
75
165
652
120
9
10
12
14
18
25
38
64
141
556
110
8
9
11
12
16
22
32
55
119
468
100
8
9
9
11
14
18
27
46
99
387
90 -
8
9
10
12
15
22
38
81
314
80
-
-
8
8
10
13
18
30
64
249
70 -
-
-
8
9
11
15
24
50
191
60
-
-
-
-
8
9
12
18
38
141
50 -
-
-
-
-
8
9
14
27
99
40 -
-
-
-
-
-
8
10
18
64
30
-
-
-
-
-
-
-
8
12
38
20 -
-
-
-
-
-
-
-
8
18
88. Finally, certain principles apply to the study design, regardless of the intended use of the study
results. The number and diameter (typically 3 to 12 cm) of soil cores should be based on the size of
the plot, the type of soil and the amount of soil necessary for analysis. Corresponding depths of
soil cores from a single replicate plot can be pooled and mixed thoroughly to produce one
representative composite sample that can be analysed. An adequate number of cores per plot
should be collected at each sampling time to ensure the sample is representative of the plot. For
example, a composite sample from a 2×1 m small plot may consist of 15 soil cores (3-cm
diameter) per sampling time over a period of one year (Chapman and Harris, 1982; Harris et al.,
1971; Chapman and Harris. 1980a; and Chapman and Harris, 1980b). In large plots, cores of
greater diameter are usual (Birk and Roadhouse, 1964 and Roadhouse and Birk, 1961). The
variability within a large plot is typically greater than in a small plot because of less uniform
pesticide application and soil spatial variability. For field studies of longer duration with small
plots, the plot area should be increased to accommodate collection of a greater number of cores,
resulting from an increased number of sampling times. If a large-scale plot contains areas of
different types of soil, soil organic matter content, etc., or knolls/depressions, then representative
cores from areas of different soil types should be pooled and analysed separately from other
samples.
f. Handling of Samples
ENV/JM/MONO(2016)6
33
89. Soil samples should be handled in the following manner.
Soil samples should be deep frozen as soon as possible (at least within 24 h) if they cannot be
extracted immediately.
Air-drying of soil samples before extraction is not recommended because of possible loss of
chemical residues from the samples via volatilization.
90. Sample transport, processing and storage procedures should be demonstrated to have no significant
effect on the residues present in the analytical sample. This can be achieved by storage stability
data and by comparison to field spiked samples transported/processed/stored similar to the core
samples. Where there is evidence that comminution (cutting and homogenisation) at ambient
temperature has a significant influence on the degradation of certain pesticide residues, it is
recommended that samples be homogenised at low temperature (e.g., frozen and/or in the presence
of "dry ice").
8. Sampling of Other Media
91. Measuring pesticide residues in soil over time provides direct information on a limited number of
dissipation routes, e.g., transformation, sorption and leaching. Other dissipation routes that often
play major roles in the environmental fate of a compound include accumulation and metabolism in
plants; volatilization from soil, water and/or plant surfaces; soil binding; runoff; and spray drift. To
meet the objectives of the TFD study and to determine where the pesticide goes in the
environment, the study sponsor may need to design the sampling scheme to account for routes of
dissipation that cannot be accounted for through soil core sampling alone.
a. Sampling Plants and Foliage
92. Refer to plant uptake module for details (Section VII).
b. Air Sampling
93. Refer to volatilization module for details (Section V).
c. Sampling for Pesticide Residues in Runoff
94. Refer to runoff module for more details (Section IV).
9. Sampling Strategies to Increase Sensitivity
95. Strategies that could be used to increase the detection sensitivity of pesticides in TFD study
samples include the following:
Decreasing the thickness of sample soil depth (thinner increments)
Increasing the area of soil or foliage samples
Increasing the volume of runoff water or air samples
Increasing the application rates, if appropriate
Increasing the number of replications, if appropriate
ENV/JM/MONO(2016)6
34
Refining/improving analytical methods for parent and major transformation products
Improving recovery efficiencies
II-F. Data Analysis, Interpretation and Reporting
1. Statistical Analysis
96. Data gathered from the study should be analysed by statistical methods that describe the
pesticide’s rate of dissipation. Methods should be specified and consistent with the study design;
goodness of fit of the data to the statistical analysis should be provided. Analysis should emphasize
the dissipation of the pesticide from the upper soil layer to which the pesticide is applied, as well
as comparisons of within-site and among-site variability.
2. Data Interpretation and Quantitative Assessment
97. An evaluation of the data collected in the field dissipation study and interpretation of the results
should include the following considerations:
Half-life and times for 50% and 90% dissipation of the parent chemical (DT50 and DT90
respectively) under field conditions, determined from the residue data;
Dissipation parameters of the major transformation products (e.g., quantities and rates of
formation and decline, including kinetic formation fraction from a precursor, DT50 and DT90);
vertical movement of detectable residues of the parent compound and the major transformation
products under field conditions;
A comparison of the dissipation and mobility parameters from the field studies with
corresponding results from laboratory studies and predictions based on the pesticide
physical/chemical properties (e.g., solubility in water, vapour pressure, Henry’s law constant,
dissociation constant and n-octanol-water partition coefficient);
If relevant, plant uptake of pesticide residues in the field compared with that under laboratory
or greenhouse conditions, within the context of the experimental parameters at the field site,
e.g., application, climatic (precipitation and temperature), edaphic (soil properties and moisture
conditions) and cropping parameters; and
Identification and discussion of discrepancies between the results of field studies and
predictions based on conceptual model.
3. Mass Accounting Considerations
98. The residue data for the parent chemical, each of the major transformation products and the total
major chemical residues should be expressed in terms of equivalent amounts of parent chemical on
a dry-weight basis, and then as percentages of the 0-day concentration. These percentages can then
be summed for the sampled environmental compartments (e.g., soil depths, air, water, and plants)
and plotted versus time to estimate an overall mass accounting. If the overall mass accounting is
unexpectedly low, major route(s) of dissipation are possibly not adequately addressed in the field
study design. In that case mass balance laboratory studies with radiolabelled compounds can be
used to infer the magnitude of these pathways.
ENV/JM/MONO(2016)6
35
4. Reporting
99. The study report should be clear and succinct with definitive conclusions regarding the
environmental fate and transport of the pesticide after field application. Soil samples results should
always be reported on a dry-weight basis along with percent moisture. The study conclusion
should be discussed both in terms of the data developed in the field study and in terms of the
expected route(s) of dissipation suggested by the laboratory studies. Discussion of how the study
compares with other field studies of this active ingredient should be included. The report should
clearly identify those aspects of the study having a direct bearing on the author’s conclusions and
the validity of the study results.
100. In addition to a full description of the analytical methods used, the following data should be
reported:
Information on the test substance and relevant transformation products:
Formulation of the test substance
Limits of analytical detection/quantification
Physicochemical and environmental fate properties
Specific activity and labelling positions (if appropriate)
Information on the field study site:
Location
Climatic conditions and history
Soil taxonomic classification and properties with depth
Hydrologic setting
Size and configuration of the treatment and control plots
Crop, management and pesticide-use history
Depth to the water table
Application of the test substance:
Time(s) of application
Rate(s) of application
Method of application
Confirmation of application rate
Field condition at the time of application
Meteorological conditions at the time of application
Tracer(s) used, if any:
Type of tracer(s)
Rate and method of application
Maintenance activities:
Type of vegetation
Agricultural practices (date of seeding, time of harvest, yields, etc.)
Weed control
Conditions during test:
Daily air temperature (minimum, maximum)
Daily precipitation and irrigation (reporting of single rainfall events), intensity and
duration
Irrigation technique
Weekly and monthly sums of precipitation and irrigation
ENV/JM/MONO(2016)6
36
Weekly mean soil temperature
Soil water content
Daily evapotranspiration or pan evaporation
Movement of tracers (if used)
Residues in soil (as mg/kg dry weight and % of applied amount) at each sample interval:
Concentration of test substance in each soil depth
Concentration of transformation products in each soil depth
Concentration of extractable radioactivity in each soil depth, if applicable
Concentration of non-extractable radioactivity in each soil depth, if applicable
Total amounts of test substance, transformation products, other unidentified
extractable residues and non-extractable radioactivity, if appropriate
Residues on and in plants (in mg/kg fresh weight and % of applied amount) at each sample
interval, if appropriate. In addition, plant residues should be reported based on how much of
the pesticide was removed from a unit area of the field in order to be useful in mass
accounting.
Residues detected via other avenues of dissipation (e.g., volatility, runoff, leaching), if
appropriate
Mass accounting (recovered percentage of applied test substance) at each sample interval
Appropriate statistical analyses of the collected data
Protocol deviations and amendments
101. Data should be presented in both tabular and graphical forms.
III DEGT50 MODULE
102. This guidance for DegT50 is specifically provided to meet field data requirements for European
regulatory agencies.
103. The objective of the DegT50 module is to provide guidance for field studies which estimate the
degradation half-life (DegT50) in top soil at 20oC and at a moisture content corresponding to field
capacity, following inverse modelling procedures (time step normalization) proposed by EFSA
(2014). These DegT50 values are used in combination with DegT50 values from laboratory aerobic
soil incubation studies to assess the geomean DegT50 in top soil at 20oC and at a moisture content
corresponding to field capacity for the area of use of the substance. This geomean is used as an
input parameter in simulation models that estimate environmental exposure to pesticides (leaching
to groundwater, exposure of aquatic and soil organisms) within the EU. Environmental exposure
assessments are usually based on the median DegT50 in the area where the substance is used, and
the geomean is considered the best estimator of the median (EFSA, 2012).
104. In the context of the DegT50 module, FOCUS (2006) treats soil bound residues as degradation
products with regards to the definition of degradation. Definitions of bound residues, in this
context, are also defined in FOCUS (2006).
105. For exposure assessments, it is essential that the DegT50 reflects the degradation rate within the soil
matrix (DegT50matrix) and excludes other loss processes such as photodegradation or volatilization.
This result can be achieved either by designing the experiment in such a way that the measured
decline reflects almost exclusively the degradation in the soil matrix (e.g., by incorporating the
ENV/JM/MONO(2016)6
37
dose immediately after application) or by spraying the substance onto the soil surface combined
with an analysis of the data that ensures that loss processes other than degradation do not influence
the DegT50 value. (See EFSA, 2014 for details of this analysis).
106. The inverse modelling procedure for estimating a DegT50 is commonly based on the decline of the
total mass per surface area that is present in the soil profile. The purpose of the DegT50 module is
to provide guidance for assessing this decline.
107. The following text in this module indicates where a difference in approach is needed to that
outlined in the basic study method description (i.e., Section II). Note that the section
letter/numbering used below is the same as that of the basic study method. Unless indicated to the
contrary below, guidance contained in the basic study method description (i.e., Section II and its
appendices) is considered appropriate. Thus, when a different recommendation is given in this
module, it should be adhered to as it replaces the guidance set out in the basic study method.
III-A Information on the Test Substance
108. The test substance can be the active substance to be marketed or a transformation product of the
test substance for which a field DegT50matrix value is desired.
109. Usually, if transformation products are used as a test substance, they will have reached levels that
trigger assessment in appropriate laboratory (lab) soil aerobic, anaerobic or photolysis
experiments. These levels and where applicable lab DegT50 triggers for field studies can be found
in the relevant regulatory requirements of official regulatory authorities, or in the case of European
Union countries, the legal data requirements of the European Union Regulation (EC) No
1107/2009. If reliable transformation DegT50 matrix values can be derived from experiments where
precursors in a transformation pathway have been dosed, then the applicants have discretion over
whether they will carry out field experiments and which transformation products they will analyse,
where a transformation product is applied as the test substance.
110. The test substance should be prepared/formulated so that it can be evenly applied to a test plot, and
variation in the mass of test substance applied per unit area should be minimized. Preparation as a
formulation may not be necessary when the test substance is soluble in or miscible with the
diluents being employed in the experiment. The formulation does not need to be a typical end use
product. End use products that have been used to treat seeds or are ready to use granules should be
avoided, as the use of these will increase variation in the mass of test substance applied per unit
area at the spatial scale of soil core sampling.
111. Note in the European context, the only time a DegT50 study with an end use product would be
essential (according to legal product data requirements of Regulation (EC) No 1107/2009) is when
the test substance is the commercialized formulated active substance and the commercialized
formulation technology affects the rate of release of the active substance from the formulation. In
other words, this study is essential when the study sponsor cannot justifiably extrapolate the
DegT50 value estimated for the test substance and the kinetic formation fractions involving any
transformation product from investigations carried out with any other preparation or formulation of
the active substance.
ENV/JM/MONO(2016)6
38
III-B Field Plot System
112. Test plots should never be cropped at the time of application as this will increase variation in the
mass of test substance applied per unit area at the spatial scale of soil core sampling. When plant
uptake cannot be excluded as a significant route of dissipation for any of the compounds of
interest, the experimental design has to maintain bare plots throughout the experiment, Where
robust data are available in the dossier to confirm that crop uptake is not a significant route of
dissipation from soil for any of the compounds of interest (e.g., evidence from OECD Test
Guideline 502 studies on metabolism in rotational crops), both plots, maintained bare and plots
where grass will germinate, can be prepared, resulting in parallel experiments for both plot types at
each study site. When this option is followed, grassed plots can be seeded after the test substance
has been mechanically incorporated. (Refer to Section III-E-2). Alternatively grassed plots can be
pre-seeded so that the grass crop will emerge after application when test substance incorporation is
to be achieved via irrigation (Refer to Section III-E-2). When results from parallel maintained
bare and grass-emerged plots are available, soil root zone models should be parameterised for the
conditions of the experimental sites1 to provide an interpretation of any difference in DT50 values
between bare and grassed plots2. DegT50 matrix should only be derived from the grass emerged plots
when the results of a soil root zone modelling exercise have confirmed that plant uptake has not
contributed significantly to lower substance mass in the root zone and was not a reason for shorter
DT50 values estimated from grass-emerged plots.
III-C Site Selection
113. As the purpose of these experiments is to obtain a median DegT50 matrix for the population of
agricultural/horticultural fields in the area of use of the substance, sites can be randomly selected
from this population. Note it is considered indefensible to mix DegT50 populations derived from
experiments carried out on temperate mineral soils with those carried out on tropical soils. A check
should be made that the soil pH, organic matter and clay contents are within the range of values to
be expected for top soils in the area of use of the substance. Use of sites with a soil mineral content
derived from volcanic activity where there has been limited pedology is considered inappropriate
for extrapolating to regions where there has not been recent volcanic activity. In this case, the
chemical and physical properties of these soils differ substantially from those of other mineral
soils. For other aspects of site selection the basic study method description (i.e., Section II) can be
considered. Note that study sponsors should avoid estimating DegT50 matrix values in sites where soil
characteristics indicate possible significant movement of substances of interest out of the
microbially active topsoil layers. For example, sites where soils have coarse textures combined
with low organic carbon, such as the ‘Borstel’ soils typically used in European lysimeter
experiments should be avoided as far as possible.
1 When using the soil root zone models recommended by the European guidance of FOCUS, in the first
instance, the transpiration stream concentration factor(s) (TSCF) needed for each compound can be
calculated from measured log Pow values, in line with the FOCUS recommendations and EFSA (2013) or
from appropriate TSCF measurement in grass.
2 This interpretation is to inform what contribution plant uptake may have made to any difference in DT values
compared to the contribution the presence of plant roots may have to enhancing microbial degradation.
ENV/JM/MONO(2016)6
39
III-D Field Plot Design
114. When designing an experiment to estimate DegT50 matrix in topsoil, all processes that can affect the
fate of the chemical, except the formation of transformation products or extracted residues,
(e.g., leaching, volatilization, soil surface photolysis, runoff and plant uptake) should be minimized
as far as possible. Therefore, test plots should be level without any slope. (Refer to Section III-E-2
for more information on the approaches to minimize surface processes impacting the DegT50 matrix
estimates).
115. The basic DegT50 matrix field study design, which evaluates field degradation in topsoil in bare
ground plots or which may additionally include plots where grass emerges after application (refer
to Section III-B, above), should exclude the influence of surface processes as far as is practical.
116. The study design should encompass the range of environmental conditions that reflect the actual
usage of the test substance, although surface processes should be excluded, even if these might
occur as a result of the actual usage. The studies should also include an untreated control plot. The
purpose of the control plot is to ensure that the pesticide is not present prior to application and to
provide a sufficient quantity of soil for carrying out the necessary analytical method fortification
and recovery experiments that must be carried out throughout the experiment. The plot
preparation/cultivation depth and mixing of samples from the control plot should mirror that of the
treated plots to minimize different matrix effects in recovery experiments. Measures to prevent
contamination of the control plot from treated plots, in particular through spray drift at the time of
application, should be made.
117. Because of field-scale variability, the experimental units in each study should be replicated. The
considerations of the basic study method description (i.e., Section II) regarding replication in
Section II-D, field plot design, are considered appropriate. At least three subplots should be used
as the basis for the replicated sampling strategy.
III-E Procedure
1. Site Characterization
118. Consideration of the basic study method description (i.e., Section II) is appropriate. Note that the
use of the word dissipation in Section II does not apply in Section III, where the focus is
degradation/transformation. See Appendix 2 for a definition of the term dissipation.
2. Application of the Test Substance
119. The test substance should be applied to the surface of test plots as evenly as possible and
formulated as necessary, as already discussed in Section III-A, above. For active substances, at
least the maximum proposed/intended annual total dose use rate, as stated on the label, should be
used. When necessary, the active substance should be applied at a rate greater than the maximum
proposed use rate to ensure that analytical quantification/detection limits for the compounds of
interest enable determination of ≤10% / ≤5% of the initial measured soil residues for the active
substance. Where the test substance is a transformation product, the application rate should cover
at least the maximum formation level expected, considering the results of the relevant laboratory
experiments. As for the active substance, when necessary an application rate greater than this value
should be used when it is necessary to ensure that analytical quantification/detection limits for the
compounds of interest enable ≤ 10% / ≤ 5% of initial measured soil residues to be determined
respectively.
ENV/JM/MONO(2016)6
40
120. Recommended equipment for pesticide delivery to experimental plots should be of high precision,
suited for the particular pesticide formulation and fitted with a device to keep drift loss to a
minimum. Some pesticides may need to be homogenized by a continuous mixing device in the
tank.
121. Only a single application should be made to each test plot. The applied mass per surface area
should be measured in parallel in two ways. The first is based on measurements of (i) the speed of
the spray boom or other application method, (ii) the flow rate of the liquid from the nozzles or
other flow rate and (iii) the concentration of the pesticide in the diluent. The second is based on
measurements of deposition of pesticide on the soil surface (e.g., spray cards). The results of these
two estimates of the applied mass per surface area should be compared with the mass per surface
area recovered from the soil sampled at the day of application.
122. Following application of the substance, one of the following procedures should be employed to
minimize the impact of surface processes (e.g., photolysis, volatilization) on the DegT50 matrix value
that can be estimated for each test plot:
Incorporation of the substance in the soil immediately after spraying to the soil surface; mixing
should be over a target depth of 7 cm. A plot power harrow can be used for this type of application
for most soil textures. Following harrowing, the plots should be rolled.
Injection of the substance within the top layer (0-30 cm) of the soil, followed by mixing through
the soil over a minimum target depth of 7 cm. Again, a plot power harrow can be used to achieve
this result. Following harrowing, the plots should be rolled.
Irrigation immediately after application of the substance to the soil surface; the irrigation
volume should be sufficient for the substance to reach an average penetration depth of 10 mm (to
be calculated with models such as PELMO and PEARL).
Even application of a layer of commercial fine sand to the soil surface, achieving a depth of at
least 3 mm. Note that this approach should not be used if any of the substances of interest has a
vapour pressure > 110-4
Pa3. unless other experimental evidence is available, indicating that
volatilization losses from soil are not a route of dissipation. Observations should be made and
recorded to confirm that the sand layer remained in place until at least 10 mm of rainfall/irrigation
has occurred.
124. In all cases, the first soil sampling should take place after the incorporation, irrigation or covering
has taken place.
3. Study Duration
125. It is expected that the study will be continued until the concentration of test substance has reached
≤ 10% of initial measured test substance in the target top 10 cm soil layer or the transformation
products of interest formed from the test substance have peaked and subsequently declined such
that they no longer account for more than 10 % of the molar mass of the initial mass of the test
substance. Movement out of the top 10 cm soil layer does not invalidate the study for the purpose
3 The function of such a vapour pressure limit for this study design, is to exclude that the process of
volatilization is a significant factor in the DT value that can be estimated, particularly in relation to earlier
sampling times
ENV/JM/MONO(2016)6
41
of calculating DegT50 matrix and DegT90 matrix values. However if measurement of residues of interest
in the top 10 cm indicates that the decline is plateauing when > 10% remains, the study can be
terminated, provided the study has included a winter and spring period This study duration ensures
that an observed plateau is not based on colder winter temperatures.
4. Management
126. Consideration of the basic study method description (i.e., Section II) is appropriate, except: (a)
tillage operations before application should ensure that soil mixing is as even as possible over the
top 15 cm of soil, (b) an even fine seed bed type tilth is achieved over the top 7 cm of soil and (c)
that any cultivation incorporating the substance results in even incorporation over at least the top
7 cm soil layer.
5. Irrigation
127. Treated plots that are maintained bare may not require irrigation except in the following situations:
Irrigation is used to move the test substance into the soil immediately after application. (Refer
to Section III-E-2for further details).
Some soil textures (e.g. high clay content) may benefit from irrigation during prolonged dry
periods to facilitate the sampling of intact soil cores.
Study durations can also be prolonged if there are extended dry periods reducing microbial
activity, in which case irrigation can be used as a tool to optimize (shorten) study durations.
Irrigation for these purposes is appropriate. The irrigation amounts applied should aim to keep soil
moisture contents in the top 30 cm below field capacity, thus substances of interest remain within
the microbially active topsoil. When plots have grass cover, irrigation to sustain the grass is
appropriate. Again the irrigation amounts applied should aim to keep soil moisture contents in the
top 30 cm below field capacity.
6. Environmental Conditions and Monitoring
128. Consideration of the basic study method description (i.e., Section II) is appropriate. Use of tracers
to track the potential depth of leaching, however, is not pertinent as the study design should
minimize the potential for substances to leach from the upper soil layers. In this case, the best
practice is to measure the daily average soil temperatures at a depth of 10 cm.
7. Soil Sampling
129. Consideration of the basic study method description (i.e. Section II) is appropriate, soil sampling
should usually proceed to a depth of 1 metre, except at sites where the soil is so shallow that this is
not physically possible. For samples taken immediately after application, a depth of 30 cm can be
accepted, except when injection to this depth or deeper was used as the method of application.
Depth segments should continue to be analysed until the depth is reached, where a segment no
longer contains the compounds of interest at levels above the limit of detection for the analytical
method. The time intervals chosen for sampling should be based on the results of laboratory
studies and other field studies, if available. Sampling frequency should take into account lab
DegT50 estimates with increased frequency of sampling for compounds with lower DegT50 values.
The number and distribution of sampling times should also be sufficient to adequately characterise
the formation and decline of the transformation products of interest. A minimum of eight time
intervals should be sampled. Significantly more sampling times than this may be required when a
ENV/JM/MONO(2016)6
42
number of transformation products are of interest and kinetic fitting of both formation and decline
of these needs to be determined.
130. It is recommended dividing the experimental plots into at least three subplots and to randomly take
at least 10 samples from each subplot. The diameter of the sampling core should be at least 5 cm in
the top 30 cm. It is important that the basic study method description (i.e., Section II-E-7-F) on
the handling of samples is followed. All samples from one subplot and the same depth segment
may be mixed before analysis.
131. It is unacceptable to mix all samples from the plot for each depth segment into one sample because
it is essential that the DegT50matrix time-step normalization procedure include information on the
uncertainty of the measured residue at each sampling time. This information will allow the study
sponsor to allocate a lower weight to measured time points with a large uncertainty in the inverse
modelling procedure than measured time points with a small uncertainty (e.g., often the scatter
immediately after application is larger than at later sampling times).
132. The total mass of moist soil from each mixed sample should be recorded because it is the intention
to assess the mass per surface area present in each depth segment (soil layer). If this mass of moist
soil is not measured and recorded, the mass per surface area can be calculated only after the bulk
density of the soil has been estimated. This estimation may be inaccurate. This inaccuracy can be
avoided simply by measuring and recording the total mass of moist soil of each mixed sample. For
each mixed sample, the mass of substance per sampled surface area should be calculated from the
content of substance in the soil, the total mass of soil in the sample and the sampled surface area.
Results from all depth segments containing detectable residues for the compound(s) of interest
should be used when estimating DegT50 matrix values. Therefore, a final manipulation of the results
must be completed. The masses per surface area of the different depth segments from the same
subplot should be summed to give the total mass per surface area for each subplot. These total
masses per surface area form the basic data for the further DegT50 matrix estimation.
8. Sampling Strategies of Other Media to Increase Sensitivity
133. Consideration of the basic study method description (i.e., Section II) is appropriate, although plant
material sampling, air sampling and sampling of runoff are not relevant for DegT50 matrix
experiments.
III-F. Handling and Analysis of Samples
134. It is appropriate that the basic study method description (i.e., Section II-E-7-F and Appendix 4) is
considered although the following additional recommendations should be followed:
135. Because the efficiency of the sample extraction procedure influences the DegT50 matrix that is
calculated from the experiment (more efficient extraction procedures, will usually result in longer
DegT50matrix being estimated), adequate and consistent extraction procedures should be followed
for all samples taken at a trial site. It is desirable that the same extraction procedure(s) be used in
all field and laboratory DegT50 experiments in a dossier. While this situation may not be usual,
particularly for substances for which regulatory data bases have been developed over many years,
it is preferable that extraction procedure(s) used in new field DegT50 experiments be similar to
those that have been used in the laboratory soil incubations and already available soil field
experiments.
ENV/JM/MONO(2016)6
43
IV. RUNOFF MODULE
IV-A. Introduction
136. Runoff studies may be conducted on a single field, a watershed, or a river basin. The experimental
layout proposed here is for the small-scale field level as a component of terrestrial field dissipation
study or a stand-alone runoff field study. The objective is to measure runoff losses at the edge of
agricultural fields. Runoff is often an important route of dissipation of pesticide residues under
field conditions, and in some landscapes, it is the major process by which pesticides are transported
from the land into water bodies. The information presented in this guidance is designed to provide the
user with a framework for developing and designing components of a pesticide runoff study.
137. Evaluation of pesticide risk to the environment by agricultural runoff requires an understanding of
pesticide properties and agronomic practices, soil properties and field scale hydrologic processes.
Pesticide loss in runoff is the sum of the loss in the dissolved phase (in water) and in the adsorbed
phase (on suspended soil or sediment particles).
138. Factors that are important in describing the processes of runoff and sediment transport are climate,
topography, soil properties, and management practices. The chief climatic factor is the intensity of
rainfall. Intensities must be great enough to exceed soil infiltration rates or to cause surface saturation by
rapidly rising water tables to produce runoff. Once runoff occurs, topographic features, such as long,
steep slopes, will tend to produce higher runoff velocities, increasing the capability of flow to detach and
transport pesticides sorbed to soil particles/sediment.
IV-B. Field Site Selection and Description
139. Site selection is a critical component of a runoff study, as it defines the climatic regime and
soil/field/cropping characteristics. These factors affect virtually all aspects of pesticide transport.
1. Site: Location, Climate, Topography, Soils, Geology and History
140. The site selected should be representative of the area where a pesticide is going to be used. Factors
to be considered include:
Climate: rainfall duration and intensity, and evapotranspiration
Topography: slope length and steepness
Type of soil: erodibility, infiltration characteristics and organic matter
Management practices: tillage, crop rotation, cover crop use, and irrigation
141. Climatically total rainfall, duration and intensity affect total runoff and peak runoff rates, both of
which affect sediment transport. Crop evapotranspiration as well as use of supplemental irrigation affects the
antecedent soil water condition prior to runoff events. Two topographical factors, slope length and
steepness, will affect runoff velocities and, hence, the capability of flow to detach and transport
sediment. The type of soil is also a primary factor. Erodibility determines the sediment yield per unit
shear stress on the soil; the organic matter content affects erodibility and the degree of pesticide
adsorption and desorption. Infiltration characteristics affect the timing and quantity of runoff
water.
ENV/JM/MONO(2016)6
44
2. Soil Characteristics
142. The characterization of soil properties is an essential part of a field runoff study because these
properties affect sampling design and runoff and erosion losses. It is preferred that soil core samples be
taken from the field site for analysis and characterization. In addition to soil characteristics as described
elsewhere in this document (e.g., Section II-E), additional soil properties that affect runoff, such
as infiltration rate, permeability and erodibility, etc, should be provided.
143. Specific soil characterization data that are essential include soil taxonomy, hydrologic soil group, soil
texture, organic carbon content, bulk density, soil water content, soil pH, the soil water characteristic curve,
and saturated hydraulic conductivity. These data are needed to a depth of 30 cm.
144. For information on soil groups based on infiltration rates, refer to USDA (1973).
145. Infiltration capacity of the soil should be given major consideration, as it will strongly impact the quantity
of runoff produced from the area. The moisture content of field soils has a direct influence on the
dissolved-phase concentrations of a pesticide and also has a substantial impact on the attenuation and
transport processes. Soil moisture measurements are needed as a function of time and depth. Some runoff
models require the soil moisture release characteristic curve (metric potential versus water content).
These data range from saturated hydraulic conductivity (0 bar) to field capacity (-0.33 bar; EU -0.1 bar)
and permanent wilting point (15 bar).
IV-C. Runoff Plot Design
146. Delineation of runoff test area: The runoff test area should be defined and hydrologically isolated
from neighbouring fields or the TFD study area by creating an earthen dike or other physical
barrier around the test area. A collection ditch should be created along the lower field edge
immediately inside the earthen dike. With this drainage system, runoff water will be free to drain
off the field and then along the collection ditch to the sampling area. Ditches may not be needed if
berms are constructed and fields have uniform grade.
147. First, in the process of selecting a suitable site to study runoff of pesticides, one must conduct site
visits and determine whether runoff does occur. Secondly, it must be determined that the field has a
drainage pattern that converges to a central draw or drainage channel and that outside boundaries are well
established. To ensure that runoff water from other areas does not enter the site, a soil berm
(embankment) or dike can be established on the outside boundary of the field. In predominantly level
geographic areas where well defined drainage channels are not apparent, it may be necessary to construct
a system of barriers to direct runoff to a central collection point. Depending on the specific field situation,
these might be metal or concrete barriers or simple soil terraces. Pesticide application can be made
either before or preferably after constructing the dike.
IV-D. Pesticide Application
148. Refer to Section II-A and II-E-2.
149. Following pesticide application, soil samples must be collected and analysed to determine the 0-
day residue concentration. Subsequent runoff losses are estimated as a percentage of this initial
amount. Soil samples should also be analysed at the end of the runoff events/study period. Also,
soil samples are collected by either grid or random sampling. (For details of soil sampling, refer to
Section II-E-7).
ENV/JM/MONO(2016)6
45
IV-E. Collection of Runoff Samples (Measurement of Runoff)
150. Surface runoff occurs when the rainfall intensity and duration exceeds the infiltration rate. The amount of
runoff produced, however, is a function of site size, antecedent soil moisture content, soil permeability,
vegetation, evaporation rate, slope and surface roughness (Wauchope et al., 1977 and 1985). The
pesticide concentration in runoff is affected by these properties, as well as the pesticide properties that include
water solubility, degradation rate in soil, sorption to soil and sediment, and method of application (plant
foliage, soil surface or soil incorporated) and formulation (Wauchope et al., 1977 and 1985). The flow
from a field site is intermittent and can vary from low to high with varying time intervals (few minutes to
several hours), depending on the rainfall intensity and duration, and site characteristics.
151. The design of the sampling network must specify the measurement of certain variables or
parameters at defined points in space and time. The frequency of sampling will depend on the
dynamics of the process being sampled. The length of the sampling period will, in general, depend
upon the persistence of the chemical, although some time series measurements may be required year
round if a multiple year study is being conducted.
152. Composite runoff samples are collected for each event after application until the analytes of
interest decrease in concentration below the level of detection. Depending on the site and its
topography, small plots can be instrumented to allow automated collection of runoff water from
the entire field by installing collection devices at the down-slope edge. Larger plots require
installation of collection devices at several predetermined locations.
IV-F. Equipment for Runoff Flow Measurements
153. Once the sampling network has been designed procedures for taking samples should be specified. These
procedures will require the availability of certain equipment to collect, store, and transport
samples.
154. Devices for monitoring flow commonly consist of various types of flumes and weirs. For field-
scale runoff studies involving intermittent storms, H-type measuring flumes (H and HL type) are
appropriate. Weirs, on the other hand, are inappropriate for monitoring intermittent flows (i.e., ponding
conditions are created, as well as sediment deposition). H-type flumes have the capability of measuring a
wide range of flow rates with a high degree of accuracy. They are more accurate at lower flows, as
compared to other types (i.e., Parshall). An H-flume is commonly used as the primary device for
measuring open channel flow, and is engineered in such a way that flow can be related to the
measured depth of water passing through the flume by a defined, non-linear equation.
155. To monitor the rate of flow and runoff volume, a continuous water stage record for depth of flow
(stage or head) with time during the event is required. This record can be obtained by using
pressure transducers in conjunction with a stilling well attached to the flume and electronic data
loggers. Multiple units can be installed to ensure that stage height data are not lost due to recorder
failure. The stage record from the water level recorders (derived from breakpoint values or at even
time intervals) are converted into rates of flow, i.e., discharge in cm3 (or ft
3)/sec, by using the rating
table for the flume type being used.
IV-G. Selection of Automatic Sampler
156. The field under study must be instrumented to allow automated collection of runoff water samples.
ENV/JM/MONO(2016)6
46
157. To determine the amount of pesticide residue transported in runoff, samples must be taken in
proportion to flow volume or elapsed time during the event (flow weighted composites). Pesticide
concentration measurements and stage height measurements must be "paired" in time sequence to
allow calculation of pesticide runoff quantities due to the dynamic nature of the runoff hydrograph.
The sampler must be set to ensure an adequate number of samples are collected at low flows (small
runoff events) and a practical number of samples are obtained during high flow storm events. Dynamic
sampling techniques are particularly important because of the non-linear relationship between flow rate and
sediment/pesticide transport.
158. Although several different runoff samplers are available for field runoff studies, automatic
samplers (e.g., ISCO) are widely used. These samplers are flexible in that sample times can be pre-set
for timed sampling during the event or proportional to flow by using an attached flow meter. The number of
samples collected should be sufficient to represent the runoff event. The limitation on the number of
samples is determined by the volume of sample required for analysis; sample volumes of 1000 mL or
greater are often used. To obtain samples of such volumes with an automatic sampler that has lower
capacities requires programming the sampler to allow a sample to be collected in several bottles. Glass
containers (10 L) are recommended to collect one flow-weighted composite sample per event.
IV-H. Metrological Record
159. Monitoring weather or meteorological parameters at the field site is an essential data requirement
because these parameters influence runoff volume and pesticide concentrations. Data may be
required hourly, daily, monthly, etc., for the various meteorological parameters. The
required data include precipitation (rain and snow), pan evaporation, solar radiation, air
temperature, relative humidity and wind. A record of irrigation use is also essential.
IV-I. Handling and Analyses of Samples
160. It is important that runoff samples are removed from the field soon after runoff events so that
sampling equipment is ready for new events. Samples also should be analyzed for pesticide
residues as soon as possible to minimize errors due to potential degradation losses. Runoff samples
can be transported to the laboratory in ice coolers and stored as frozen samples in a refrigerator at
4°C until processed. If both chemical (pesticide residue) and physical (particle size distribution)
analyses are desired, runoff samples should be subdivided. Separate pesticide analysis should be
performed in the sediment and water phases and sediment weights should be determined. The
relative effort exerted in analyzing either the sediment or solution phases should reflect the main
transport mode of the pesticide.
IV-J. Results
161. Pesticide residue concentrations in sediment and water should be determined separately. Sediment
should also be analysed for particle size distribution, organic carbon, and CEC. Information on
particle size distribution in runoff is important because fine particles (silt, clay) normally have
enriched pesticide contents. This enrichment effect results from the increased surface areas, cation
exchange capacities, and organic carbon contents of the fine fractions. Organic carbon content of
runoff sediments is important because of the influence it has in determining overall pesticide
sorption (Karickhoff, 1983). CEC influences sediment sorption capacity particularly for ionizable
compounds.
162. For details of data analysis, including statistical analysis, interpretation and reporting, refer to
Section II-F.
ENV/JM/MONO(2016)6
47
163. The results expected from this runoff specific module study are as follows:
- Initial 0-day residue concentration in soils after pesticide application
- Amount of rainfall received at each event and in total
- Quantity of runoff that occurred after each rainfall event
- Time series residue concentration in runoff water
- Total quantity of runoff that occurred during study period
- Total quantity of pesticide residues lost due to runoff water
164. Residues transported in runoff water should include parent, major transformation products, and
residues adsorbed to sediments that are extractable. Residues analysed and quantified in the study
report should be based on those identified under laboratory studies.
165. Appendix 10 contains suggested tables for data required for this runoff module.
V. VOLATILIZATION MODULE
V-A. Introduction
166. Post application volatilization of applied pesticides from soil and plant surfaces is an important
route of dissipation for selected pesticides. Volatilization processes not only may result in reduced
efficacy in controlling pests, but also have the potential to adversely impact terrestrial and aquatic
natural systems far from the intended target (Peck and Hornbuckle, 2005). Many air monitoring
studies available in the scientific literature corroborate field volatilization of conventional
pesticides from application sites (Glotfelty et al., 1990; Majewski and Capel, 1995; LeNoir et al.,
1999; Majewski and Baston, 2002; Zamora et al., 2003; and USEPA, 2008a). Pesticide
volatilization from application sites involves the interaction of a number of complex variables.
Physical and chemical properties, such as vapor pressure and solubility of active ingredients (AIs)
and the environmental and meteorological conditions, as well as nature of the soil or the crop, are
key parameters influencing volatilization, along with management practices. In addition, solvents,
and other additives used in formulations and in tank mixtures, may also influence the volatility of
pesticide from application sites. Since volatilization can be an important route of field dissipation
for some pesticides, it needs to be considered under regulatory frameworks to address risk from
volatile and semi-volatile chemicals. In such cases, a field volatilization module can be prescribed
as an additional module of field dissipation study and should only be considered for the
compounds shown to have inherent physicochemical characteristics for volatilization and/or
detected as trapped volatile organics in standard laboratory studies as well as detected in the
atmospheric samples.
V-B. Criteria for Volatility Module Selection
167. Important physicochemical properties of chemical compounds that influence volatilization are
vapor pressure and solubility in water. The partitioning of a chemical between air and water is
described by the Henry’s Law Constant, which can be used to determine the potential for
volatilization of applied chemicals from water. Adsorption to soil is also an important process that
reduces volatilization and needs to be considered during the selection of a volatility module for the
field dissipation study. When needed, volatilization from soil and water may be specifically
ENV/JM/MONO(2016)6
48
studied under laboratory conditions to gain additional knowledge. Quantification of trapped
volatile organics in standard laboratory studies of biotransformation/metabolism in soil and aquatic
systems also addresses volatilization of the parent compounds and their transformation products.
168. Other factors that may be considered include method of application (e.g., foliar versus soil surface
versus soil incorporated, injected and watered-in), temperature, soil moisture content, soil organic
carbon content, soil texture, soil porosity, residue persistence and leaching. However, a weight-of-
evidence approach based on the physical and chemical properties of the test substance and
laboratory studies is the best way to prescribe the inclusion of a volatility module as a part of the
field dissipation study. The following criteria have been used in initiating a field volatility module
as part of the field dissipation study described in the guideline for terrestrial field dissipation study
(US EPA, 2008b).
1. Vapor Pressure
169. The measured vapor pressure of a chemical compound is a guide to its volatility and to the
probability of its movement into the atmosphere. Woodrow et al., (1997) and Smit et al., (1997
and 1998) have demonstrated that the vapor pressure of an active ingredient could be a reliable
predictor of volatilization from soil and plant surfaces. The rate of volatilization from plants seems
to be higher than that from soil, but limited data are available (Bedos et al., 2002). A volatility
classification based solely on vapor pressure is best suited to dry, non-adsorbing surfaces. In
general, pesticides with vapor pressures ≤ 1 × 10⁻⁶
mm Hg (1.33 × 10⁻⁴
Pa = 1.33 × 10⁻¹
mPa) are
considered relatively non-volatile under field conditions, whereas pesticides with vapor pressures ≥
3.9 × 10⁻⁵
mm Hg (5.20 × 10⁻³
Pa = 5.2 mPa) are considered to be of intermediate to high volatility
under field conditions (Kennedy and Talbert, 1977; and Guth et al., 2004) suggested that pesticide
volatilization is not expected from compounds with a vapor pressure less than 10-4
Pa for crops and
10-3
Pa for soil. Thus, a vapor pressure of ≥ 3.9 × 10⁻⁵
mm Hg or 5.2 mPa at 25°C raises concern
regarding potential volatilization and vapor drift of the active ingredient, and a field volatility
study may be warranted as an additional module for the terrestrial field dissipation study.
2. Henry’s Law Constant
170. Henry’s Law Constant (HLC) addresses the partitioning of a compound between water and air, a
process that can increase or decrease the overall volatilization of the compound from a water or
moist surface. The OCSPP 835.6100 Guideline (USEPA, 2008b) has a volatility classification to
characterize potential volatilization from water and moist surfaces using the unitless water/air
distribution ratio (Cwater/Cair) or air-water distribution coefficient (KAW, dimensionless HLC) as
shown in Table 1. Either of these coefficients can be used as a criterion to consider a field
volatility module for the terrestrial field dissipation study. The unitless water/air distribution ratio
can be estimated when a measured value is not available, using Equation 1 or the reciprocal of
KAW.
Cwater / Cair = (S x T x R x 760) / (P x GMW x 106) Equation 1
Where:
Cwater is the concentration of the compound in water in µg/mL,
Cair is the concentration of the compound in air in µg/mL,
S is the solubility of the compound in water in µg/mL,
T is absolute temperature in K [K = °C + 273.15],
R is the ideal gas constant of 82.08 mL-atm/K-mole,
760 is a conversion factor to convert mmHg or torr to atm [760 mmHg = 1 atm],
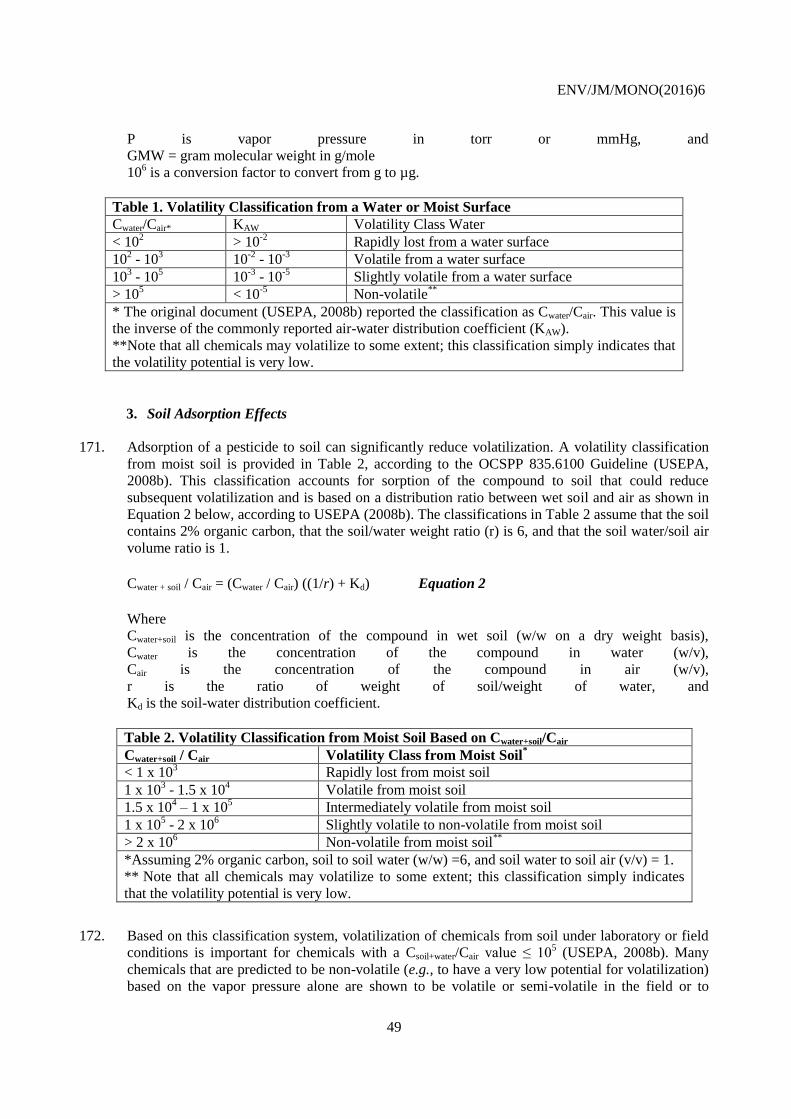
ENV/JM/MONO(2016)6
49
P is vapor pressure in torr or mmHg, and
GMW = gram molecular weight in g/mole
106 is a conversion factor to convert from g to µg.
Table 1. Volatility Classification from a Water or Moist Surface
Cwater/Cair* KAW Volatility Class Water
< 102 > 10
-2 Rapidly lost from a water surface
102 - 10
3 10
-2 - 10
-3 Volatile from a water surface
103 - 10
5 10
-3 - 10
-5 Slightly volatile from a water surface
> 105 < 10
-5 Non-volatile
**
* The original document (USEPA, 2008b) reported the classification as Cwater/Cair. This value is
the inverse of the commonly reported air-water distribution coefficient (KAW).
**Note that all chemicals may volatilize to some extent; this classification simply indicates that
the volatility potential is very low.
3. Soil Adsorption Effects
171. Adsorption of a pesticide to soil can significantly reduce volatilization. A volatility classification
from moist soil is provided in Table 2, according to the OCSPP 835.6100 Guideline (USEPA,
2008b). This classification accounts for sorption of the compound to soil that could reduce
subsequent volatilization and is based on a distribution ratio between wet soil and air as shown in
Equation 2 below, according to USEPA (2008b). The classifications in Table 2 assume that the soil
contains 2% organic carbon, that the soil/water weight ratio (r) is 6, and that the soil water/soil air
volume ratio is 1.
Cwater + soil / Cair = (Cwater / Cair) ((1/r) + Kd) Equation 2
Where
Cwater+soil is the concentration of the compound in wet soil (w/w on a dry weight basis),
Cwater is the concentration of the compound in water (w/v),
Cair is the concentration of the compound in air (w/v),
r is the ratio of weight of soil/weight of water, and
Kd is the soil-water distribution coefficient.
Table 2. Volatility Classification from Moist Soil Based on Cwater+soil/Cair
Cwater+soil / Cair Volatility Class from Moist Soil*
< 1 x 10³ Rapidly lost from moist soil
1 x 10³ - 1.5 x 10
4 Volatile from moist soil
1.5 x 10⁴ – 1 x 10
5 Intermediately volatile from moist soil
1 x 10⁵ - 2 x 10
6 Slightly volatile to non-volatile from moist soil
> 2 x 10⁶ Non-volatile from moist soil
**
*Assuming 2% organic carbon, soil to soil water (w/w) =6, and soil water to soil air (v/v) = 1.
** Note that all chemicals may volatilize to some extent; this classification simply indicates
that the volatility potential is very low.
172. Based on this classification system, volatilization of chemicals from soil under laboratory or field
conditions is important for chemicals with a Csoil+water/Cair value ≤ 105 (USEPA, 2008b). Many
chemicals that are predicted to be non-volatile (e.g., to have a very low potential for volatilization)
based on the vapor pressure alone are shown to be volatile or semi-volatile in the field or to
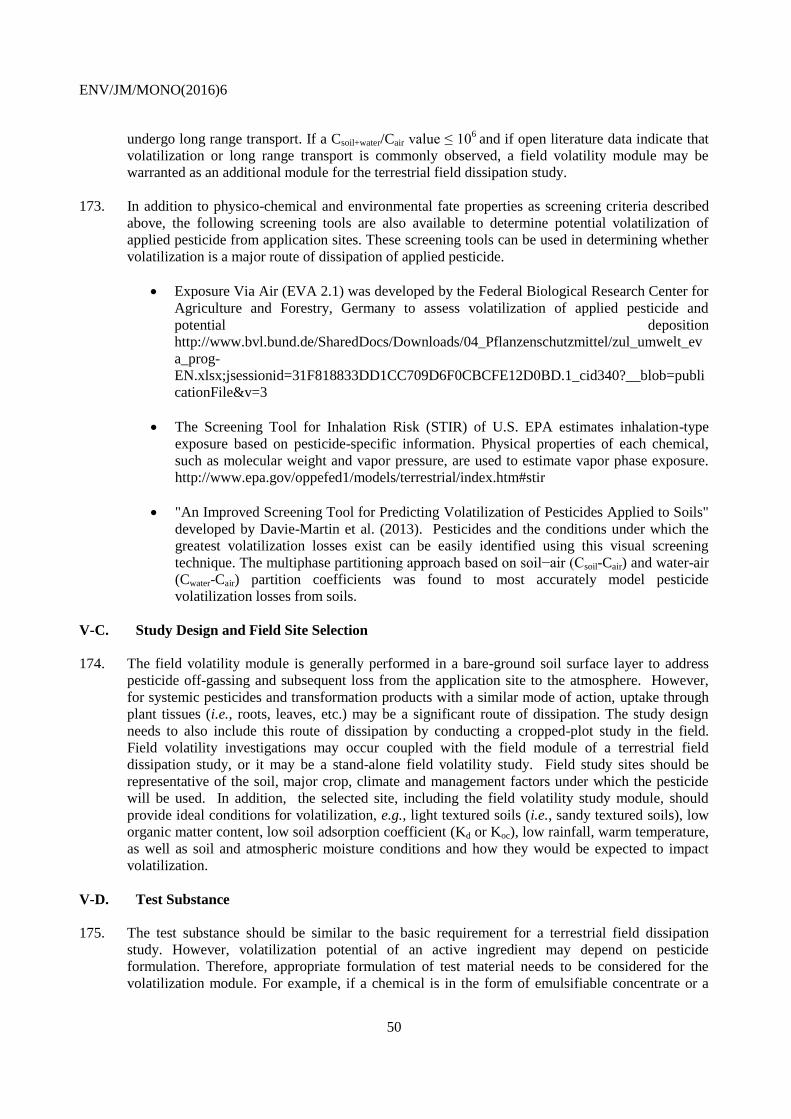
ENV/JM/MONO(2016)6
50
undergo long range transport. If a Csoil+water/Cair value ≤ 106
and if open literature data indicate that
volatilization or long range transport is commonly observed, a field volatility module may be
warranted as an additional module for the terrestrial field dissipation study.
173. In addition to physico-chemical and environmental fate properties as screening criteria described
above, the following screening tools are also available to determine potential volatilization of
applied pesticide from application sites. These screening tools can be used in determining whether
volatilization is a major route of dissipation of applied pesticide.
Exposure Via Air (EVA 2.1) was developed by the Federal Biological Research Center for
Agriculture and Forestry, Germany to assess volatilization of applied pesticide and
potential deposition
http://www.bvl.bund.de/SharedDocs/Downloads/04_Pflanzenschutzmittel/zul_umwelt_ev
a_prog-
EN.xlsx;jsessionid=31F818833DD1CC709D6F0CBCFE12D0BD.1_cid340?__blob=publi
cationFile&v=3
The Screening Tool for Inhalation Risk (STIR) of U.S. EPA estimates inhalation-type
exposure based on pesticide-specific information. Physical properties of each chemical,
such as molecular weight and vapor pressure, are used to estimate vapor phase exposure.
http://www.epa.gov/oppefed1/models/terrestrial/index.htm#stir
"An Improved Screening Tool for Predicting Volatilization of Pesticides Applied to Soils"
developed by Davie-Martin et al. (2013). Pesticides and the conditions under which the
greatest volatilization losses exist can be easily identified using this visual screening
technique. The multiphase partitioning approach based on soil−air (Csoil-Cair) and water-air
(Cwater-Cair) partition coefficients was found to most accurately model pesticide
volatilization losses from soils.
V-C. Study Design and Field Site Selection
174. The field volatility module is generally performed in a bare-ground soil surface layer to address
pesticide off-gassing and subsequent loss from the application site to the atmosphere. However,
for systemic pesticides and transformation products with a similar mode of action, uptake through
plant tissues (i.e., roots, leaves, etc.) may be a significant route of dissipation. The study design
needs to also include this route of dissipation by conducting a cropped-plot study in the field.
Field volatility investigations may occur coupled with the field module of a terrestrial field
dissipation study, or it may be a stand-alone field volatility study. Field study sites should be
representative of the soil, major crop, climate and management factors under which the pesticide
will be used. In addition, the selected site, including the field volatility study module, should
provide ideal conditions for volatilization, e.g., light textured soils (i.e., sandy textured soils), low
organic matter content, low soil adsorption coefficient (Kd or Koc), low rainfall, warm temperature,
as well as soil and atmospheric moisture conditions and how they would be expected to impact
volatilization.
V-D. Test Substance
175. The test substance should be similar to the basic requirement for a terrestrial field dissipation
study. However, volatilization potential of an active ingredient may depend on pesticide
formulation. Therefore, appropriate formulation of test material needs to be considered for the
volatilization module. For example, if a chemical is in the form of emulsifiable concentrate or a
ENV/JM/MONO(2016)6
51
granule, the emulsifiable concentrate formulation would be the appropriate formulation for field
volatility module.
V-E. Air Sampling
176. For a volatility module, robust air monitoring of applied pesticide and its degradates, if volatile, is
critical to quantify emissions as flux, or the mass of pesticide emitted per unit time through a
specific surface area (i.e., typically presented in units of mass/area-time). Flux represents how
quickly a mass of pesticide moves or volatilizes into the surrounding atmosphere. Sampling
intervals of at least hour increments for the day of application should be followed by 12 – 24-hour
increments in subsequent sampling periods following application. Sampling should be continued
until all air monitors indicate that air concentrations have clearly approached the level of detection.
V-F. Environmental Conditions and Meteorological Record
177. Volatilization of an applied chemical is a function of partitioning of the chemical from solid and
liquid to gaseous phases in the environment as well as meteorological conditions such as air
temperature, relative humidity, wind velocity and direction, net radiation (or solar radiation and
cloud cover), and barometric pressure. These meteorological parameters need to be monitored
throughout the entire volatility module. In general, a one-minute sampling interval is adequate for
meteorological variables for a field volatility study.
V-G. Development of the Field Volatility Protocol
178. A well designed field volatility study protocol needs to be developed to address field volatilization
from the application sites. This protocol is critical in designing a field volatility study and should
be available for review by the pesticide regulatory authorities before conducting the field volatility
study. Several peer reviewed articles that provide the procedure for performing effective field
volatility studies are cited below. Cliath et al. (1980) and Soderquist et al. (1975) described well
executed field studies of volatilization with simultaneous study of other modes of dissipation of
test substances. Methods for the trapping, extraction, cleanup and quantitation of pesticides are
described in Lewis (1976) and Harper et al. (1976). Harper et al. (1976) also provided an example
of using ethylene glycol vapor traps and non-specific GLC quantitation used in field volatility
studies. Parmele et al. (1972) used hexylene glycol vapor traps and sampling periods adjusted to
compensate for the decrease in pesticide vapor concentration during the study. Majewski (1999)
and Parmele et al. (1972) provided pesticide vapor flux calculations from soil in relation to
micrometeorological measurements. OCSPP835-8100 guideline (USEPA, 2007) also provides
useful information for conducting field volatility study.
ENV/JM/MONO(2016)6
52
V-H. Reporting and Evaluation of Data
179. Calculation and tabular, graphic information: The principal mathematical equations in
generating and analyzing data, as well as representative calculations using equations should be
captured in the study protocol. The formation and decline of parent compounds should be
expressed as amounts, concentrations, and corresponding percentages. Rate constants, when
appropriate, should be reported in conjunction with rate data. Tabular formatted raw data (e.g.,
detections of trapped vapors in air cartridges, sampling flow rates, and sampling durations),
meteorological data, as well as plots showing the temporal trend in volatilization flux should be
submitted by the registrant. Examples of critical data summary tables related to field volatility
studies are presented in Appendix 11.
180. Empirical Flux Determination Method Description and Applicability: Descriptions of the
empirical approaches used in determining the volatilization flux rates, as well as their
appropriateness to the study design, are essential. The most commonly used methods to estimate
volatilization flux are the indirect method (Johnson et al., 1999), aerodynamic method (Majewski
et al., 1990) and Integrated Horizontal Flux Method (Majewski et al., 1990). Majewski (1999) also
provided a wide variety of micrometeorological measurement methods and the
advantage/disadvantages of these methods to estimate the post-application volatilization of
pesticides from treated fields. He also emphasized that the accuracy of these volatilization flux
determinations will only be resolved by conducting careful mass balance experiments. The flux
profile is essential for each sampling period to determine the concentrations of the chemical in the
atmosphere after application. An example of the reporting table for volatilization flux rate is
provided in Appendix 11.
V-I. Utility of Experimental Results in Assessment
181. As with all field studies, the results will be directly relevant to the climatic and agronomic (crop,
timing, application rate, etc.) conditions as well as spatial scale pertinent to the studies conducted.
However, a modelling exercise using the results of estimated flux rate from these experiments can
be extrapolated on spatial and temporal scales, often using air dispersion models to evaluate
potential exposure in the atmosphere beyond the experimental sites.
VI. Leaching to Depth Module
VI-A. Introduction
182. In field dissipation studies, the detection and consideration of residues present in soil samples in
the soil profile, below the cultivation depth and or root zone, is one way of determining that
leaching is a contributor to dissipation from the topsoil layers. It is also an indicator that leaching
to groundwater may be a concern. However, non-detection of residues in soil samples in a field
dissipation study, from below the depth where cultivation would mix topsoil, is not satisfactory
evidence to conclude that undesirable levels of contamination of groundwater resources will not
occur. In this case, the limits of analytical detection and quantification that can be achieved
routinely in bulk soil samples are usually much higher than is possible in samples of soil water or
groundwater. This situation is particularly true in relation to the legal parametric concentration
limits that have to be considered in the regulatory framework of the EU and other regulatory
frameworks where risk characterization following exposure to contaminated groundwater
resources may need to be considered. Consequently, modelling approaches to characterize solute
concentrations in soil water moving vertically below the root zone, which have the potential to
ENV/JM/MONO(2016)6
53
recharge groundwater resources, have been developed. To supplement these modelling approaches,
applicants may choose or regulators may request that field investigations measure substance
concentrations in soil water samples taken from the unsaturated zone and/or in shallow
groundwater samples. Such field investigations have been termed ‘field leaching studies’ (EU
regulatory framework terminology) and ‘prospective groundwater monitoring studies’ (North American
regulatory framework terminology).
VI-B. Study Design
183. The experimental layout that may be followed for such field investigations is either at the small-
scale field level as a component of a terrestrial field dissipation study or it may be a stand-alone
field leaching study. The objective is to characterize recharge concentrations that may leach below
the root zone and or the measurement of groundwater concentrations in shallow, vulnerable
aquifers that result from the known applications made at an experimental site. Water is drawn out of
the soil profile and or taken directly from ground water at different depths (for which a range of techniques
are available) and analysed for the presence of the compounds of interest. For a detailed framework and
detailed guidance in designing such experiments, including recommended sampling techniques,
practitioners should consult US EPA Guidance for Prospective Ground-water Monitoring Studies (US EPA,
2008c). Some further considerations of methodological issues regarding soil water sampling approaches are
also contained in Carter and Fogg (1995); Weihermüller et al. (2005 and 2006); and Ferrari et al. (2007)
(‘suction cup samplers’) and in Byre et al. (1999); Kosugi and Katsuyama (2004) and Mertens et al. (2005)
(‘equilibrium tension plate lysimeters'). Such further considerations of methodological issues regarding
sampling from the saturated zone (shallow groundwater) can also be found in Ferrari et al. (2007).
184. Several factors influence the magnitude and duration of potential contamination of groundwater such as
pesticide properties (water solubility, sorption, persistence and volatility), soil and site conditions (soil
chemical, physical and hydrological properties, topography, depth of water table, groundwater hydrology
and climatic conditions) and agronomic practices. Although most of this information is available in the basic
TFD study report, additional information such as depth to/ movement within the saturated zone/groundwater
table over the duration of the study and hydraulic conductivity of the unsaturated and saturated zones are
required. These and other ancillary data are required to enable the results to be interpreted. Sites selected for
the study should be highly vulnerable for leaching, and as an example might have coarse textured soils, high
rainfall, low evapotranspiration potential (at least in some seasons), a shallow groundwater table, etc. For
full details, consult US EPA Guidance for Prospective Ground-water Monitoring Studies (US EPA, 2008c).
A well planned study should track the movement of the active substance and transformation product
residues in soil core samples, soil water and/or the saturated zone. If piezometers or sampling wells are
installed into the saturated zone, results should enable a time-series of concentrations in the saturated
zone/groundwater to be produced for each sampling location installation.
185. It is also important to note that US EPA (2008c) states that ‘All pesticides and major pesticide
degradates in the study and the conservative tracer compound to be used on the site are considered
compounds of interest. A major degradate is one accounting for >10% of the applied at any time
during the laboratory studies, or one that has been identified as of potential toxicological,
environmental or ecological concern. While these criteria are also applied in the EU, there are
additional EU criteria that require assessment of groundwater transformation products formed at >
5% of the applied at any time during the laboratory studies for more than 2 consecutive sampling
times or when, at the termination of laboratory incubations, concentrations have reached 5% but
are still increasing (Commission regulation (EU) No 283/2013, European Commission, 2013).
Therefore, it is recommended that these additional EU criteria be applied when defining the major
degradates that are investigated in these studies if they will be used to support an authorisation in
the EU.
ENV/JM/MONO(2016)6
54
186. For studies not located in the U.S. that will not be submitted to U.S. competent authorities, (where
US EPA (2008c) states that ‘reports must be submitted to EPA’ or ‘Design Reports must be submitted to
and approved by EPA’ etc., applicants should consult the competent authorities in the territory where the
regulatory submission will be made to determine how these aspects will be managed.
VI-C. Utility of Experimental Results
187. As with all field studies, the results need to be interpreted with care as they are only directly
applicable to the climatic, pedological, agronomic (crop, timing, application rate etc.) conditions
and spatial/temporal scales pertinent to the studies conducted. However, it may be that the studies
cover what might occur in less vulnerable situations than those investigated. As a result, a
modelling exercise on the results of these experiments may be necessary to give useful information
on the meaning of the results in the context of potential groundwater exposure. This information is
important because the duration and spatial scale of any experiment will rarely match the important
temporal and spatial scale parameters that will drive actual groundwater concentrations, even in
small unconfined vulnerable shallow aquifers.
VII. Plant Uptake Module
VII-A. Introduction
188. Cropped plot field studies may be needed when plants are an important factor in controlling field
dissipation of a pesticide and plant uptake is an important route of dissipation. For systemic
pesticides whose mode of action involves uptake through plant tissues (leaves and roots), this
pathway may be a significant route of dissipation.
189. Plants influence the soil water balance and thereby affect leaching (EFSA, 2013), especially by
macro pore-flow along the root channels and cracks. The presence of a well-developed crop
canopy can be expected to greatly affect the pattern of water infiltration into the soil, especially
row crops (Leistra and Boesten, 2010). Plants also influence the surface roughness and runoff.
190. In the modelling scenarios (PRZM, PRZM GW, PEARL, MACRO and PELMO), which are used
for approval of pesticides and calculation of exposure of pesticides in surface and ground water,
several parameters connected to plant uptake are needed. These models need input on foliar
deposition, interception, volatilization rate, passive plant uptake via roots, foliar wash-off and
dissipation rates.
191. Pesticide plant uptake is indirectly influenced by factors controlling the deposition of the pesticides
on the plant such as spraying equipment, pesticide formulation and crop type. The pesticide residue
in the crop is a multi-compartment system and is a function of deposition, volatilization,
interception, translocations and degradation of the pesticides in the plant, deposition on soil from
spraying, and wash off from plants after spraying and uptake by the roots.
192. The most reliable measure for interception is obtained if both deposition on the crop and on the soil
underneath the crop are measured (van Beinum and Beulke, 2010). This method has also been
accepted by FOCUS (Linders et al., 2000). Some of the systemic substances and pesticides with
low sorption to soil will be available for plant uptake. Plants grown on soils containing bound
residues may also have the ability to take up portions of these residues (Gevao et al., 2000).
ENV/JM/MONO(2016)6
55
193. The plant uptake via roots may be taken into account as this also can be important for the leaching
assessment (EFSA, 2013). In this respect, it is important that assumptions used in the leaching
assessment related to plant uptake via roots are robustly quantified. In the case of studies where
the substance of interest is applied to the foliage, it could be difficult to distinguish the residue
taken up via the soil from that taken up by the foliage. Therefore, any field study results that are
used to provide evidence of plant uptake from the soil, particularly where application is made post-
emergence of the crop, could be supported by laboratory or green house studies. At the time of
writing, this is an area of development in the EU regulatory system, and applicants and regulators
are encouraged to consult the latest guidance on the selection of the parameter (the transpiration
stream concentration factor (TSCF) or the plant uptake factor (PUF) for regulatory exposure
modeling. (See documents hosted on the FOCUS website:
http://focus.jrc.ec.europa.eu/gw/index_with_doc.html).
VII-B. Study Design
194. Generally to study plant uptake, the cropped plot should be included as an additional plot in the
basic field trial with non-cropped (bare ground) plot (Corbin et al., 2006). The cropped study is run
in parallel to the bare study plot. The study should also include an untreated control plot. The study
design should reflect normal conditions and practice and actual use of the test substance.
195. Cropped plots should be considered in the design of field studies when one or more of the
following criteria have been met:
Systemic pesticides, which are designed to move into and through the plant, are used. This
type of pesticide is expected to become incorporated into the plant either through active or
passive uptake.
Foliar-applied pesticides applied at half to full canopy of the plant are expected to be
predominantly deposited on leaf surfaces. Under these conditions, foliar dissipation is
expected to be the dominant process in the field, although wash-off can lead to increased
loadings to soil.
Pesticides are applied to pasture, foliage crop, grass and turf and expected to strongly
influence dissipation pathways of pesticides.
High foliar wash-off fractions are evident or uptake of parent compounds (30-day emergency
crop rotation interval) from rotational crop studies indicate plant processes may control
pesticide dissipation. These studies should be conducted on the same crops as the TFD study
crop(s).
VII-C. Pesticide Application
196. The pesticide should be applied to the crop corresponding to normal use of the substance as
specified on the label. To provide a complete picture of the dissipation and plant uptake,
information on the application method, type of spray equipment, pesticide formulation,
meteorological conditions, stage of growth of the crops, and the crop type should be provided. At
the time of spray application, an estimation of ground cover of the crop should be made to estimate
the relationship between amounts of pesticide deposited on the soil.
ENV/JM/MONO(2016)6
56
VII-D. Sampling
197. Soil samples should be collected together with plant material to follow the deposition to soil just
after application and wash off after rain events. If repeated applications are made, samples should
be taken just before and after spraying. The sampling scheme should be designed to track the
decline in pesticide residues from foliage with time, and foliage sampling should include a time
zero residue level. Pesticide residues may also degrade abiotically (hydrolysis and/or photolysis),
translocate into plant foliage, and volatilize from foliage more readily than from soil. If any of
these processes from foliage are a likely route of dissipation, the study design should ensure that
appropriate measurements are made. Samples need to be collected more frequently at the
beginning of the study in order to adequately characterize foliar dissipation.
198. It may be appropriate to use existing laboratory and/or greenhouse plant studies as a substitute for
a full scale field sampling of plant material. However, when relying on laboratory/greenhouse data
to support a route of dissipation in the field study, the registrant needs to characterize any
differences between the conditions under which the laboratory/greenhouse studies were conducted
relative to the field dissipation study. These laboratory/greenhouse studies should be conducted
using similar conditions as those present in the field study, e.g., plants, application, treatment, etc.,
if possible. The registrants should consider collecting a set of benchmark samples from the field
study to determine how much of the pesticide was removed by the crop and for comparison with
the laboratory/greenhouse studies.
VII-E. Analysis
199. Analyses of the data collected from the two-cropped and non-cropped plots should be similar
except that plants should be sampled and analyzed for pesticide residues in the cropped plots. The
separate collection, compositing and analyses of soil samples collected within and between the
rows of the row crop(s) may also be necessary. Whole plant residues should be designed to capture
either dissipation or accumulation in the plant. It is recommended that foliar wash-off half-lives, if
available, and potential plant accumulation rates be considered for designing sampling frequency.
Crop residues should be expressed as concentrations on both a dry weight and wet weight basis.
Additionally, crop yields, expressed as the total crop mass (g)/unit area (m2), should be determined
at each sampling time. Recording crop growth stage and area coverage are important in the overall
interpretation of the results
.
200. Portions of pesticide residues in plants can be extractable residues, extractable conjugates bound to
natural components of the plant or un-extractable or bound residues incorporated into the plant
constituents (Kahn, 1982). Quantification of pesticide residues in the plant tissues will be defined
by the nature of extractant and sampling preparation (Alexander, 1994).
201. Data generated from laboratory or greenhouse studies may be used to supplement or used instead
of field data. However, the use of laboratory or greenhouse data will require an explanation of the
conditions under which the data were collected and how any differences between conditions in the
laboratory/greenhouse and the field study results and laboratory hypothesis may influence the
evaluation of the field results.
ENV/JM/MONO(2016)6
57
VIII. PRINCIPLE, APPLICABILITY AND USE OF THE STUDY RESULTS
VIII-A. Principle of the Terrestrial Field Dissipation Study
202. With regard to the regulatory jurisdiction in which registration is sought, it may be necessary for
each TFD study to be designed in the context of a suite of TFD studies that identify the route(s)
and rate(s) of dissipation of the active ingredient and major degradates/transformation products
when a typical formulation/end-use product is applied under field conditions representative of the
significant area(s) where pesticides are used. The studies should quantify the pathways of
transformation and transport as well as the distribution of the parent compound and its major
transformation products in each environmental compartment. In short, the studies should address
the dissipation and fate of the active ingredient and major transformation products in the
environment. However, the applicant is advised to refer to the specific data requirements for TFD
studies of the regulatory jurisdiction in which registration is sought, and if necessary, to discuss
with the competent regulatory authority.
203. It may not be feasible or desirable to study each of the routes of dissipation, as identified by the
pesticide-specific conceptual model at one field site. For example, testing conditions for the
evaluation of pesticide runoff would not be appropriate for an assessment of leaching. In this case,
a modular approach is recommended in which concurrent dissipation pathways are studied at one
site, while non-concurrent pathways are evaluated in separate studies. The suite of field dissipation
studies may, depending on the requirements of the regulatory jurisdiction, be conducted in an
iterative fashion until the results:
provide an integrated qualitative and quantitative environmental fate assessment that
characterizes the relative importance of each route of dissipation for the parent compound and
major transformation products (greater than 10% of applied) and/or toxicologically significant
amounts of parent and transformation products. The study design should acknowledge that the
relative importance of each route may be different depending on use pattern, formulation type
and soil/climatic conditions;
determine whether potential routes of dissipation identified in the laboratory are consistent
with field results;
characterize the dissipation rates of the parent compound and transformation products as well
as decline of the major and/or toxicologically significant transformation products under field
conditions;
characterize the rates and relative importance of the different transport processes, including
leaching, runoff and volatilization;
establish the distribution of the parent compound and the major transformation products in the
soil profile and determine the potential for leaching and ground water contamination;
provide data on leaching if it is identified as a concern; include deep soil and groundwater
sampling to determine groundwater contamination potential;
characterize the persistence of the parent compound and major transformation products in soil,
including retention and residue carryover in the soil to the following crop season;
characterize foliar dissipation, if the compound is applied to plants, only when data collected
meets certain conditions; and
characterize the effect(s) of different typical pesticide formulation categories, where
applicable.
ENV/JM/MONO(2016)6
58
VIII-B. Applicability of the Terrestrial Field Dissipation Study
204. TFD data are generally required by regulatory agencies to support the registration of an end-use
product intended for outdoor uses and to support each application to register a technical grade
active ingredient and manufacturing-use product used to make such an end-use product (US Code
of Federal Regulations, Part 158 Title 40, Protection of the Environment in the USA; Pest Control
Products Regulation, Section 9 in Canada). In EU Regulation (EU) 283/2013 setting data
requirements for active substances, the regulation requires TFD studies to derive degradation and
dissipation values when the active substance and/or metabolites/transformation products meet
certain persistence criteria. Dissipation and/or degradation values derived from TFD studies may
subsequently be used in estimation of predicted environmental concentrations (PEC) in soil,
groundwater, surface water and sediment.
VIII-C. Use of the Terrestrial Field Dissipation Study Results
205. The results of the TFD study are used to validate and/or refine the established hypothesis that the
pesticide dissipates in accordance with the pesticide-specific conceptual model. Differences
between field study findings and the established pesticide-specific conceptual model may suggest
the need for revision of the pesticide-specific conceptual model and possibly the need for
additional laboratory and/or field studies.
206. While this section provides examples of where the TFD study results may be used quantitatively,
the value of this study in qualitative assessments should not be overlooked. A critical component
of all risk assessments is the characterization of risk, in which the assumptions, limitations and
uncertainties inherent in the risk assessment are captured and the potential effect of these factors
on overall risk are explained. The TFD study results have been and will continue to be a critical
element of the risk characterization component of the risk assessment; it is the only avenue by
which the laboratory-based hypothesis and water model predictions of field behaviour can be
tested.
207. Results of field dissipation studies can be used to estimate the field persistence of parent
compound, formation and decline of transformation products, residue carryover, and leaching
potential under representative actual use conditions. When other modules are included in the study,
results of these tests may provide important information on major dissipation routes such as
transformation, transport, volatilization, plant uptake and runoff. Although not specifically relevant
to this technical guidance document, a brief discussion of how the TFD study results can be used
in risk assessments deserves consideration. In addition to its value in characterizing the dissipation
of a pesticide in an actual field environment, field dissipation study results can be used to evaluate
the algorithms and input data for environmental fate models, and the results can be used to develop
more refined ecological risk assessments. The following sections discuss some of the potential
uses and limitations of using TFD results quantitatively.
ENV/JM/MONO(2016)6
59
1. Use in Model Evaluation
208. The results of TFD studies can be compared with pesticide estimations generated by Pesticide
Root Zone Models (e.g., PEARL, PELMO, PRZM, PRZM-GW and MACRO) to evaluate how
well the models perform. Although the current field study does not always track specific routes of
dissipation and identify reasons for discrepancies, field dissipation studies can be designed to test
hypotheses regarding routes of dissipation predicted by environmental fate models. Not only can
modelling efforts be used to focus and interpret the results of field dissipation studies, but the study
results can also be used to evaluate the model.
2. Use as Input for Environmental Fate and Transport Models
209. Environmental fate and transport models used in regulatory assessments typically require the use
of bulk soil degradation rates rather than dissipation rates observed in TFD studies. Use of such
dissipation rates in these models is incorrect when reported dissipation half-lives include the
combined routes of dissipation (degradation/ transformation and transport) from the surface. A
rapid field dissipation rate may be due to degradation, movement out of the surface soil, or both.
Thus, the reviewer would expect a persistent, highly mobile chemical to have a short half-life (t1/2)
in the surface (provided rainfall or irrigation occurs) because it would move out of the surface.
Therefore, it is important to distinguish bulk soil degradation from other dissipation processes
which could have influenced observed disappearance in the TFD study.
210. Current models use inputs that represent the individual routes of dissipation (degradation half-life
values, rate constants, sorption/partitioning coefficients, water solubility, vapour
pressure/volatility) to simulate overall dissipation. Thus, use of a dissipation half-life in such a
model would effectively treat movement out of the surface (and potentially into the compartment
of interest, i.e., surface water or groundwater) as if it were degradation. For some specific
assessments in certain regulatory jurisdictions, it may be possible to replace the route-specific
model inputs with a combined dissipation rate determined in a field study under the following
conditions:
The sole focus of the modelling effort is to simulate runoff into a water body and, thus,
requires only an estimate of the amount of chemical that is available at the surface and subject
to runoff over time.
The weight of laboratory and field evidence indicates that dissipation in the field can be
confidently attributed solely to degradation/transformation (i.e., negligible loss by the other
dissipation routes, such as leaching, runoff, volatilization and plant uptake).
211. It should be noted that EU countries routinely use degradation half-life values (DegT50 module)
from the TFD studies for fate and transport modelling of parent and metabolites. The requirement
for TFD studies to derive DegT50 values are requested through the EU regulation (EU) 284/2013
for setting the data requirements for plant protection products in accordance with regulation (EC)
1107/2009. This OECD document contains guidance for the conduct of a TFD study module to
specifically derive the DegT50 parameter for active substances and metabolites. Use of such
parameters in other regulatory jurisdictions would have to be discussed with the appropriate
regulatory authority.
ENV/JM/MONO(2016)6
60
3. Use in Terrestrial Exposure Assessment
212. Although terrestrial field study results can be used to determine the potential for pesticide residues
to remain in the soil from year to year, most of these studies do not provide adequate information
on plant residue concentrations or residue concentrations in other food sources, such as seeds or
insects, in a manner that can be used in refined terrestrial exposure assessments. However, when
data are collected from foliage/food sources, they can provide estimates of residue concentrations
over time under actual use conditions in refined risk assessments. In these cases, study results have
been used in North America to calculate estimated exposure concentrations (EECs) in soil for
buffer zone determinations in terrestrial habitats. Finally, results from TFD studies can be used to
evaluate the potential for carry-over of residues (both parent and degradates) from one crop season
to the following. This is particularly important for persistent pesticides used in colder climates
where the potential for persistence is greatest. Evidence from TFD studies will have implications
for long-term exposure to non-target organisms and may trigger additional studies (e.g., long term
soil accumulation).
213. In EU countries, the dissipation half-life values (DT50, basic study) are currently used as triggers
for accumulation assessment and to calculate carry-over/accumulation in soil (PECsoil) where
maximum level of metabolites are used. The degradation half-life values (DegT50 module), on the
other hand, are used quantitatively as input parameters in simulation models for environmental
exposure assessment (leaching to ground water, exposure to aquatic and soil organisms) within the
EU.
4. Use in Refined Risk Assessments (RRAs)
214. Refined risk assessments produce a range or distribution of values instead of one fixed value
produced in a deterministic approach. Current research is focused on refining risk assessment
through the implementation of spatially and temporally distributed models and or advanced
probabilistic models that look at multiple pathways for exposure and allow for sensitivity analysis
to determine the significance of exposures to overall risk. Well-designed TFD studies can provide
results that are useful for interpreting and providing feedback on model assumptions and results,
and may even be considered as possible inputs for Monte Carlo analysis.
ENV/JM/MONO(2016)6
61
REFERENCES
ACS. 2004. American Chemical Society, Agrochemical Division Symposium: Pesticide Risk Assessment:
From a Conceptual to a Quantitative Exposure Model. Al Barefoot, and Don Wauchope, Co-chairs.
Anaheim, CA, 2004. Abstracts published in ACS National Meeting Technical Program.
Agriculture Canada. 1987. Environment Canada, and Department of Fisheries and Oceans. Environmental
Chemistry and Fate Guidelines for Registration of Pesticides in Canada. Trade Memorandum T-1-255.
Ottawa, Canada.
Agronomy Abstract. 1995. American Society of Agronomy, Division of Environmental Quality (A5),
Symposium Integrating Environmental Fate and Transport Data from Laboratory to Field Studies. A.G.
Hornsby, Division Chair; J.K. Wolf, and J.A. Hetrick, Symposium Chairs. St. Louis, MO, 1995.
Alexander, M., 1994. Biodegradation and Bioremediation. Academic Press, San Diego, CA
Bedos, C., Cellier, P., Raoul Calvet, R., Enrique, B. A., Benoît Gabrielle, B. 2002. Mass transfer of
pesticides into the atmosphere by volatilization from soils and plants: overview. Agronomie 22: 21–33.
Birk, L.A., and F.E.B. Roadhouse. 1964. Penetration and persistence in soil of the herbicide atrazine. Can.
J. Plant Sci. 44: 21-27.
Brye, K.R., Norman, J.M., Bundy, L.G., Gower, S.T. 1999. An equilibrium tension lysimeter for measuring
drainage through soil. Soil Science Society of America Journal 63:536-543.
Canada. Pest Control Products Regulations. Section 9.
Carter, A. D. and Fogg, P. 1995. A critical evaluation of field monitoring techniques used to describe the
leaching and run-off behaviour of pesticides. in "Pesticide movement to Water", BCPC Monograph No 62.
Eds. Walker, A., Allen, A., Bailey, S., Blair, A., Brown, C., Gunther, P., Leake, C., and Nicholls, P. BCPC,
Farnham, Surrey.
Chapman, R.A., and C.R. Harris. 1980a. Insecticidal activity and persistence of terbufos, terbufos
sulfoxide, and terbufos sulfone in soil. J. Econ. Entomol. 73(4): 536–543.
Chapman, R.A., and C.R. Harris. 1980b. Persistence of chlorpyrifos in a mineral and an organic soil. J.
Environ. Sci. Health B15 (l): 39-46.
Chapman, R.A., and C.R. Harris. 1982. Persistence of isofenphos and isazophos in a mineral and an
organic soil. J. Environ. Sci. Health. B17: 335-361.
Cheng, H.H. 1990. Pesticides in the Soil Environment: Processes, Impacts, and Modeling. Soil Sci. Soc.
Amer. Book Series #2, Madison, WI.
Cliath, M.M., W.F. Spencer, W.J. Farmer, T.D. Shoup, and R. Grover. 1980. Volatilization of S-ethyl N, N-
dipropylthiocarbamate from water and wet soil during and after flood irrigation of an alfalfa field. J.Agr.
Food Chem. 28:610-613
ENV/JM/MONO(2016)6
62
Corbin, M, Eckel, W., Ruhman, M., Spatz, D., Thurman, N., Gangaraju, R., Kuchnicki, T. Mathew, R. &
Nicholson, I. 2006.NAFTA Guidance Document for Conducting Terrestrial Field Dissipation Studies.
http://www.epa.gov/oppefed1/ecorisk_ders/terrestrial_field_dissipation.htm
Creeger, S.M. 1985. Standard Evaluation Procedure: Hydrolysis Studies. EPA-540/9-85-013. EPA Office
of Pesticide Programs, Washington, DC.
Davie-Martin,C.L. K.J. Hageman,and Y. Chin. 2013. An Improved Screening Tool for Predicting
Volatilization of Pesticides Applied to Soils. Environ. Sci. and Tech. 47:868-876.
Dunne, T. 1978. Field Studies of Hillslope Flow Processes. In: Hillslope Hydrology, M.J. Kirkby (Ed.).
Wiley Interscience, NY. pp. 227-293.
EFSA, 2012. Scientific Opinion on the science behind the guidance for scenario selection and scenario
parameterisation for predicting environmental concentrations in soil. EFSA Journal 2012; 10(2):2562. [77
pp.] doi:10.2903/j.efsa.2012.2562
http://www.efsa.europa.eu/en/efsajournal/doc/2562.pdf
EFSA. 2013. EFSA Panel on Plant Protection Products and their Residues (PPR). Scientific Opinion on the
report of the FOCUS groundwater working group (FOCUS, 2009): Assessment of higher tiers. EFSA
Journal 2013; 11(6):3291, 25pp.
EFSA. 2014. EFSA Guidance Document for evaluating laboratory and field dissipation studies to obtain
DegT50 values of active substances of plant protection products and transformation products of these
active substances in soil. EFSA Journal 2014;12(5): 3662,[39 pp.] doi:10.2903/j.efsa.2014.3662
http://www.efsa.europa.eu/en/efsajournal/doc/3662.pdf
European Commission. 2013. COMMISSION REGULATION (EU) No 283/2013 of 1 March 2013
implementing Regulation (EC) No 1107/2009 of the European Parliament and of the Council as regards
the data requirements for active substances.
http://eur-lex.europa.eu/LexUriServ/LexUriServ.do?uri=OJ:L:2013:093:0001:0084:EN:PDF
Fantke, P., Wieland, P., Wannaz, C., Friedrich, R., Jolliet, O., 2013. Dynamics of pesticide plant uptake
into plants. Environmental Modelling & Software 40 (2013) 316-324
Ferrari F., Fait G., Balderacchi M., Ferrari T., Capri E., Trevisan M. 2007. Field leaching study for maize
herbicides and their metabolites. In Environmental fate and ecological effects of pesticide (Del Re A.A.M.,
Capri E., Fragoulis G. & Trevisan M. eds.), ISBN 978-88-7830-473-4, La Goliardica Pavese, Peschiera
Borromeo (MI), Italy, pp. 754-762.
Fletcher, C.L., and S.M. Creeger. 1985. Standard Evaluation Procedure: Aerobic Soil Metabolism Studies.
EPA-540/9-85-015. EPA Office of Pesticide Programs, Washington, DC.
Fletcher, C., S. Hong, C. Eiden, and M. Barrett. 1989. Standard Evaluation Procedure: Terrestrial Field
Dissipation Studies. EPA-540/09-90-073. EPA, Office of Pesticide Programs, Washington, DC.
Flury, M. 1996. Experimental evidence of transport of pesticides through field soils - a review. J. Environ.
Qual. 25: 25-45.
FOCUS, 2006. Guidance Document on Estimating Persistence and Degradation Kinetics from
Environmental Fate Studies on Pesticides in EU Registration. Report of the FOCUS Work Group on
ENV/JM/MONO(2016)6
63
Degradation Kinetics, EC Document Reference Sanco/10058/2005 version 2.0, 434 pp.
http://focus.jrc.ec.europa.eu/dk/
Furmidge, C. 1984. Formulation and application factors involved in the performance of soil applied
pesticides. In: R. Hance (ed.). Soils and crop protection chemicals. Monogr. 27. British Crop Protection
Council, Croydon, UK. p. 49-64.
Gangaraju, R., M. Mitchell, M. Shamim, I. Nicholson, L. Montanarella and M. Egsmose, 2013. OECD
guidance for acceptance of foreign pesticide field dissipation studies and eco-region concept. Proceedings
(AGRO003) Terrestrial Field Dissipation Studies in Global Agrochemical Registration Programs, 246th
ACS National Meeting, Indianapolis, IN, 2013; Document ID: 10412.
Gevao, B., Semple, K.T., Jones, K.C., 2000. Bound residues in soils: a review. Environmental Pollution
108 (2000) 3-14
Ghodrati, M., and W.A. Jury. 1992. A field study of the effects of soil structure and irrigation method on
preferential flow of pesticides in unsaturated soil. J. Contam. Hydro. 11:101-125.
Gilbert, R.O. 1987. Statistical Methods for Environmental Protection Monitoring. Van Nostrand Reinhold,
pp. 30-34.
Glotfelty, D.E., Majewski, M.S. and Seiber, J.N. 1990. Distribution of several organophosphorus
insecticides and their oxygen analogues in a foggy atmosphere. Environmental Science and Technology,
24:353-357.
Guth, J.A. F.J. Reischmann, R. Allen, D. Arnold, J. Hassink, C.R. Leake, M.W. Skidmore, and G.L.
Reeves. 2004. Volatilization of crop protection chemicals from crops and soil surfaces under controlled
conditions-prediction of volatile losses from physico-chemical properties. Chemosphere 57: 871-887
Harper, L.A., A.W. White, Jr., R.R. Bruce, A.W. Thomas, and R.A. Leonard. 1976. Soil and microclimate
effects on trifluralin volatilization. J. Environ. Qual. 5:236-242.
Harris, C.R., H.J. Svec, and W.W. Sans. 1971. Toxicological studies on cutworms. VII. Microplot field
experiments on the effectiveness of four experimental insecticides applied as rye cover crop and soil
treatments for control of the dark-sided cutworm. J. Econ. Entomol. 64: 493--496.
Harvey, J., Jr. 1983. A simple method of evaluating soil breakdown of 14
C-pesticides under field conditions.
Residue Rev. 85: 149-158.
Hill, B.D. 1981. Persistence and distribution of fenvalerate residues in soil under field and laboratory
conditions. J. Agric. Food Chem. 29: 107-110.
Hunter, J.H., and E.H. Stobbe. 1972. Movement and persistence of picloram in soil. Weed Sci. 20: 486-
489.
Hurto, K., and M. Prinster. 1993. Dissipation of turf grass foliar dislodgeable residues of chlorpyrifos,
DCPA, diazinon, isofenphos, and pendimethalin. In: K. Racke and A. Leslie (eds.). Pesticides in urban
environments: fate and significance. American Chemical Society, Washington, DC. pp. 86-99.
ENV/JM/MONO(2016)6
64
Johnson, B., Barry, T., and Wofford P. 1999. Workbook for Gaussian Modeling: Analysis of Air
Concentrations Measurements. State of California Environmental Protection Agency, Department of
Pesticide Regulation. Sacramento, CA.
Jones, R.L., et.al. 2004. Suitability of field data for determining degradation rates in environmental risk
assessments. Presented at the 227th American Chemical Society National Meeting, Anaheim, CA, March
2004.
Karickhoff, 1983. As cited in Smith, C.N., D.S. Brown, J.D. Dean, R.S. Parrish, R.F. Carsel, and A.S.
Donigian, Jr., 1985. U.S.EPA Field Agricultural Runoff Monitoring (FARM) Manual. EPA/600/3-
85/043; p 101
Keith, L.H, G.L. Patton, and P.G. Edwards. 2001. Radian International LLC, Austin TX. DQO-PRO 2.0:
Calculator for estimating numbers of environmental samples and associated QC samples. Public domain
software available at American Chemical Society Division of Environmental Chemistry website:
www.envirofacs.org/dqopro.htm
Kennedy, J.M., and R.E. Talbert. 1977. Comparative persistence of dinitroaniline type herbicides on the
soil surface. Weed Sci. 25(5): 373–381.
Kenimer, A., J. Mitchell, A. Felsot, and M. Hirschi. 1997. Pesticide formulation and application technique
effects on surface pesticide losses. Trans. of ASAE. 40(6):1617-1622.
Khan, S.U., H.A. Hamilton, and J.E Hogue. 1976. Fonofos residues in an organic soil and vegetable crops
following treatment of the soil with the insecticide. Pestic. Sci. 7: 553-558.
Khan, S.U., 1982. Bound pesticide residues in soil and plants. Residue Reviews 84, 1±25.
Klute, A. 1986. Methods of Soil Analysis - Part 1: Second Edition, Physical and Mineralogical Methods,
American Society of Agronomy, Madison, WI, ASA Monograph No. 9.
Kosugi, K. and Katsuyama, M. 2004. Controlled-suction period lysimeter for measuring vertical water flux
and convective chemical fluxes. Soil Science Society of America Journal
68:371-382.
Kroetsch, D., R. Gangaraju, W. Effland, I. Nicholson, N. Thurman, and D. Pagurek. 1998. A spatial
decision support system for the selection of target areas for pesticide field dissipation studies. Paper
presented at First International Conference on Geospatial Information in Agriculture and Forestry, 1-
3 June 1998, Lake Buena Vista, FL.
Leistra, M. and Boesten, J.J.T.I. 2010. Measurement and computation of movement of bromide ions and
carbofuran in ridged humic-sandy soil. Archives of Environmental Contamination and Toxicology 59 (1),
39-48.
LeNoir, J.S., McConnell, L.L.,Fellers, G.M., Cahill, T.M., and Seiber, J.N. 1999. Summer Time Transport
of Current-use pesticides from California’s Central Valley to the Sierra Nevada Mountain Range, USA.
Environmental Toxicology & Chemistry 18:2715-2722.
Lewis, R.G., 1976. Sampling and Analysis of Airborne Pesticides, pp. 51-94 in Air Pollution from
Pesticides and Agricultural Processes. R.E. Lee (ed.). CFC Press, Inc., Cleveland, Ohio.
ENV/JM/MONO(2016)6
65
Linders, J., Mensink, H., Stephenson, G., Wauchope, D., and Racke, K. 2000. Foliar interception and
retention values after pesticide application. A proposal for standardized values for environmental risk
assessment. Pure Appl. Chem., Vol. 72, No 11, pp. 2199-2218.
Majewski, M.S. and Capel, P.D. 1995. Pesticides in the atmosphere: distribution, trends, and governing
factors. Ann Arbor Press, Inc. Chelsea, MI.
Majewski, M.S. 1999. Mircometeorologic methods for measuring the post-application volatilization of
pesticides. Water, Air, and Soil Pollution 115: 83-113.
Majewski, M.S., Glotfelty, D.E., Kyaw Tha Paw, U., Seiber, J.N. 1990. A field comparison of several
methods for measuring pesticide evaporation rates from soil. Environmental Science and Technology,
24:1490-1497.
Majewski, M.S. and Baston, D.S. 2002. Atmospheric transport of pesticides in the Sacramento,
California, metropolitan area, 1996-1997. United States Geological Survey. Water Resources
Investigations Report 02-4100.
Marlow, D.A., D.D. McDaniel, A.E. Dupuy, Jr., and E.M. Leovey. 1995. Data Reporting Guideline for
Environmental Chemistry Methods. Subdivisions N, E, and K. EPA Office of Pesticide Programs,
Washington, DC.
Mastradone, P.J., J. Breithaupt, P.J. Hannan, J.A. Hetrick, A.W. Jones, R.D. Jones, R.J. Mahler, S. Syslo,
and J.K. Wolf. 1995. Critical assessment of terrestrial field dissipation guidelines. In M.L. Leng, E.M.K.
Leovey and P.J. Zubkoff (eds.). Agrochemical Environmental Fate Studies: State of the Art. Lewis
Publishers, Boca Raton, FL. p. 93-98.
Mertens, J., Barkle, G.F., Stenger R. 2005. Numerical analysis to investigate the effects of the design and
installation of equilibrium tension plate lysimeters on leachate volume. Vadose Zone Journal 4:488-499.
OECD Guidelines for the Testing of Chemicals. OECD, Paris.
http://www.oecd.org/env/ehs/testing/oecdguidelinesforthetestingofchemicals.htm
Page, A.L. 1982. Methods of Soil Analysis - Part 2: Chemical and Microbiological Properties, American
Society of Agronomy, Madison, WI, ASA Monograph No. 9.
Parmele, L.H., E.R. Lemon, and A.W. Taylor. 1972. Micrometeorological measurement of pesticide vapor
flux from bare soil and corn under field conditions. Water, Air, and Soil Pollut. 1:433-451.
Peck, A.M and K.C. Hornbuckle. 2005. Gas-Phase Concentrations of Current-Use Pesticides in Iowa.
Environmental Science and Technology, 39:2952-2959.
Roadhouse, F.E.B. and L.A. Birk. 1961. Penetration and persistence in soil of the herbicide
2-chloro-4,6-bis(ethylamino)-s-triazine (simazine). Can. J. Plant Sci. 41: 252-260. Chapman, R.A., and
C.R. Harris. 1980a. Insecticidal activity and persistence of terbufos, terbufos sulfoxide, and terbufos
sulfone in soil. J. Econ. Entomol. 73(4): 536-543.
Ruhman. M., R. Gangaraju, and M. Shamim. 2013. Use of the Europe-North American Soil Geographic
Information for Pesticide Studies Tool (ENASGIPS version 2.0 Tool). Proceedings (AGRO003) Terrestrial
Field Dissipation Studies in Global Agrochemical Registration Programs, 246th ACS National Meeting,
Indianapolis, IN, 2013; Document ID: 14162.
ENV/JM/MONO(2016)6
66
SETAC-Europe. 1995. Procedures for Assessing the Environmental Fate and Ecotoxicity of Pesticides.
Society of Environmental Toxicology and Chemistry.
Smit, A.A.M.F.R., Van den Berg, F. and Leistra, M. 1997. Estimation method for the volatilisation of
pesticides from fallow soils. Environmental Planning Bureau series 2, DLO Winand Staring Centre,
Wageningen, The Netherlands.
Smit, A.A.M.F.R., Leistra, M., Van den Berg, F. 1998. Estimation method for the volatilization of
pesticides from plants. Environmental Planning Bureau series 4, DLO Winand Staring Centre,
Wageningen, The Netherlands.
Smith, A.E. 1971. Disappearance of triallate from field soils. Weed Sci. 19(5): 536-537.
Taylor, A.W., and W.F. Spencer. 1990. Volatilization and Vapor Transport Processes. In H.H. Cheng (ed.).
Pesticides in the Soil Environment: Processes, Impacts, and Modeling. Soil Sci. Soc. Amer. Book Series
#2, Madison, WI. pp. 213-270.
Soderquist, C.J., D.G. Crosby, K.W. Moilanen, J.W. Seoner, and J.W. Woodrow. 1975. Occurrence of
trifluralin-and its photo-products in air. J. Agr. Food Chem. 23:304-309.
Steel, R.G.D., and J.H. Torrie. 1980. Principles and Procedures of Statistics: A Biometrical Approach.
McGraw-Hill Book Company, New York, NY.
USDA. 1973. U.S. Department of Agriculture. In Smith, C.N., D.S. Brown, J.D. Dean, R.S. Parrish, R.F.
Carsel, and A.S. Donigian, Jr., 1985. U.S.EPA Field Agricultural Runoff Monitoring (FARM) Manual.
EPA/600/3-85/043; p 61.
USDA, 1979. Field Manual for Research in Agricultural Hydrology. U.S. Department of Agriculture.
Coordinators D.L. Brakensiek, H.B. Osborn, and W.J. Rawls. U.S. Department of Agriculture, Washington, DC.
Agriculture Handbook No. 224. p 547.
US EPA. 1975a. United States Environmental Protection Agency. Field dissipation studies. Guidelines for
registering pesticides in the United States. 40 FR (123): 26894-26896.
US EPA. 1975b. United States Environmental Protection Agency. Volatilization studies. Guidelines for
registering pesticides in the United States. 40 FR (123): 26889–26891.
US EPA. 1982. United States Environmental Protection Agency. Pesticide Assessment Guidelines.
Subdivision N, Chemistry: Environmental Fate. EPA-540/9-82-021. EPA, Office of Pesticide Programs,
Washington, DC.
US EPA. 1988. United States Environmental Protection Agency. Pesticide Assessment Guidelines.
Subdivision D: Product Chemistry. EPA-540/09-82-018. EPA, Office of Pesticide Programs, Washington,
DC.
USEPA. 2007. OPPTS 835.6100: Terrestrial Field Dissipation. EPA 712-C-08-024. October 2008. Office
of Prevention, Pesticides, and Toxic Substances. United States Environmental Protection Agency.
http://www.regulations.gov/#!documentDetail;D=EPA-HQ-OPP-2007-0639-0001 (Accessed March 5,
2013).
ENV/JM/MONO(2016)6
67
US EPA. 2008a. U.S. Environmental Protection Agency. The Fate, Transport, and Environmental Effects
of Airborne Contaminants in Western National Parks. U.S. Environmental Protection Agency.
Washington, DC. EPA/600-R07/138.
USEPA. 2008b. OPPTS 835.6100: Terrestrial Field Dissipation. EPA 712-C-08-020. October 2008.
Office of Prevention, Pesticides, and Toxic Substances. United States Environmental Protection Agency.
http://www.regulations.gov/#!documentDetail;D=EPA-HQ-OPPT-2009-0152-0040 (Accessed March 5,
2013).
USEPA. 2008c. OPPTS 835.7100 Guidance for prospective groundwater monitoring studies. Office of the
Prevention, Pesticides and Toxic Substance (7101) US. Environmental Protection Agency. EPA 712-B-10-
001, August 25, 2008.
http://www.regulations.gov/#!documentDetail;D=EPA-HQ-OPPT-2009-0152-0044
Van Beinum, W. and Beulke, S. 2010. Collection and evaluation of relevant information on crop
interception for the revision of the Guidance Document on Persistence in Soil. Scientific/Technical report
submitted to EFSA by The Food and Environment Research Agency, FERA, York UK.
Van Wessenbeck, I. 2004. Comparison of lab and field DT50 PDFs and PRZM-3 soil and water
concentration predictions. Presented at the 227th American Chemical Society National Meeting, Anaheim,
CA, March 2004.
Walker, A. and P.A. Brown. 1985. The relative persistence in soil of five acetanilide herbicides. Bull.
Environ. Contam. Toxicol. 34: 143-149.
Wauchope, R.D. and D.G. DeCoursey. 1985. Measuring and Predicting Losses of Herbicides in Runoff
Water from Agricultural Areas. In: Research Methods in Weed Science. Third Edition. N.D. Camper (Ed.).
Southern Weed Science Society, (as cited in USEPA FARM, EPA/600/3-85/043))
Wauchope, R.D., K.E. Savage, and D.G. DeCoursey. 1977. Measurement of Herbicides in Runoff from
Agricultural Areas. In: Research Methods in Weed Science. Second Edition. B. Truelove (Ed.). Southern
Weed Science Society, Auburn, AL. pp 49-58.
Wauchope, R. 1987. Tilted-bed simulation of erosion and chemical runoff from agricultural fields: II.
Effects of formulation on atrazine runoff. J. Environ. Qual. 16(3):212-216.
Weihermüller, L., R. Kasteel, J. Vanderborght, T. Pütz, and H. Vereecken. 2005. Soil water extraction with
a suction cup: Results of numerical simulations. Vadose Zone Journal.
4:899-907.
Weihermüller, L., R. Kasteel, and H. Vereecken. 2006. Soil heterogeneity effects on solute breakthrough
sampled with suction cups: numerical simulations. Vadose Zone Journal.
5:886-893.
Whetzel, N.K. and S.M. Creeger. 1985. Standard Evaluation Procedure: Soil Photolysis Studies. EPA-
540/9-85-016. EPA Office of Pesticide Programs, Washington, DC.
Woodrow, J.E., Seiber, J.N. and Baker, L.W. 1997. Correlation techniques for estimating pesticide
volatilization flux and downwind concentration. Environ. Sci. Technol., 31, 523-529.

ENV/JM/MONO(2016)6
68
Zamora, C., Kratzer, C.R., Majewski, M.S. and Knifong, D.L. 2003. Diazinon and chloropyrifos loads
precipitation and urban and agricultural storm runoff during January and February 2001 in the San
Joaquin River Basin, California. United States Geological Survey. Water Resources Investigations Report
03-4091.
ENV/JM/MONO(2016)6
69
APPENDICES
APPENDIX 1: SUGGESTED CRITERIA FOR MODULE SELECTION
Field Study Indicators
In deciding what modules to incorporate into a field study, the study sponsor should ask the following
questions:
1. What is the potential for dissipation of the parent compound and major transformation by a given
route (e.g., volatilization, leaching, runoff, etc.)?
2. Is the potential great enough to warrant measurement under field conditions representative of
actual use?
In many cases, several criteria or a weight-of-evidence approach based on physicochemical properties
of the test substance and laboratory fate and transport studies is the best way to answer these questions. No
single laboratory study by itself can absolutely predict transformation, transport or dissipation in the field.
Laboratory data can, however, provide quantitative or semi-quantitative indices of the inherent persistence
and mobility under field conditions.
Volatilization Potential
Refer to the volatilization module (Section V).
Leaching Potential
The movement of a chemical through soil is dependent on several factors, including rainfall and
irrigation and the properties of the chemical and the soil. In general, leaching is faster and more extensive
in coarse-textured soils and soils that have low organic matter and clay content. An assessment of leaching
potential at sites in specific use areas should also consider the likelihood of potential preferential flow
through relatively large soil voids, e.g., cracks, root channels and Karst topography.
A mobility classification based on soil column leaching was developed by Guth4 and Hörmann
(1987)5. Monuron has been proposed as the reference compound.
5
Guth, J.A., and W. D. Hörmann. 1987. Problematik und Relevanz von Pflanzenschutzmittel-Spuren in
Grund (Trink-) Wasser. Schr.-Reihe Verein WaBoLu, 68: 91–106.
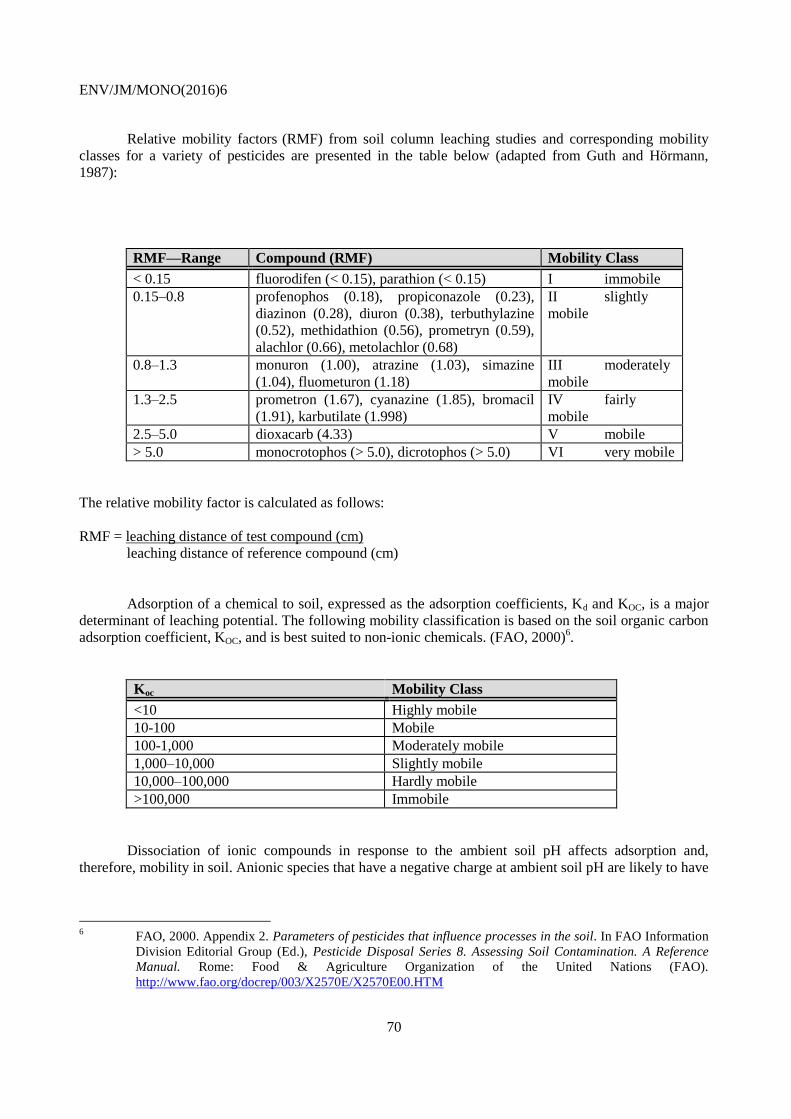
ENV/JM/MONO(2016)6
70
Relative mobility factors (RMF) from soil column leaching studies and corresponding mobility
classes for a variety of pesticides are presented in the table below (adapted from Guth and Hörmann,
1987):
RMF—Range Compound (RMF) Mobility Class
< 0.15 fluorodifen (< 0.15), parathion (< 0.15) I immobile
0.15–0.8 profenophos (0.18), propiconazole (0.23),
diazinon (0.28), diuron (0.38), terbuthylazine
(0.52), methidathion (0.56), prometryn (0.59),
alachlor (0.66), metolachlor (0.68)
II slightly
mobile
0.8–1.3 monuron (1.00), atrazine (1.03), simazine
(1.04), fluometuron (1.18)
III moderately
mobile
1.3–2.5 prometron (1.67), cyanazine (1.85), bromacil
(1.91), karbutilate (1.998)
IV fairly
mobile
2.5–5.0 dioxacarb (4.33) V mobile
> 5.0 monocrotophos (> 5.0), dicrotophos (> 5.0) VI very mobile
The relative mobility factor is calculated as follows:
RMF = leaching distance of test compound (cm)
leaching distance of reference compound (cm)
Adsorption of a chemical to soil, expressed as the adsorption coefficients, Kd and KOC, is a major
determinant of leaching potential. The following mobility classification is based on the soil organic carbon
adsorption coefficient, KOC, and is best suited to non-ionic chemicals. (FAO, 2000)6.
Koc Mobility Class
<10 Highly mobile
10-100 Mobile
100-1,000 Moderately mobile
1,000–10,000 Slightly mobile
10,000–100,000 Hardly mobile
>100,000 Immobile
Dissociation of ionic compounds in response to the ambient soil pH affects adsorption and,
therefore, mobility in soil. Anionic species that have a negative charge at ambient soil pH are likely to have
6
FAO, 2000. Appendix 2. Parameters of pesticides that influence processes in the soil. In FAO Information
Division Editorial Group (Ed.), Pesticide Disposal Series 8. Assessing Soil Contamination. A Reference
Manual. Rome: Food & Agriculture Organization of the United Nations (FAO).
http://www.fao.org/docrep/003/X2570E/X2570E00.HTM
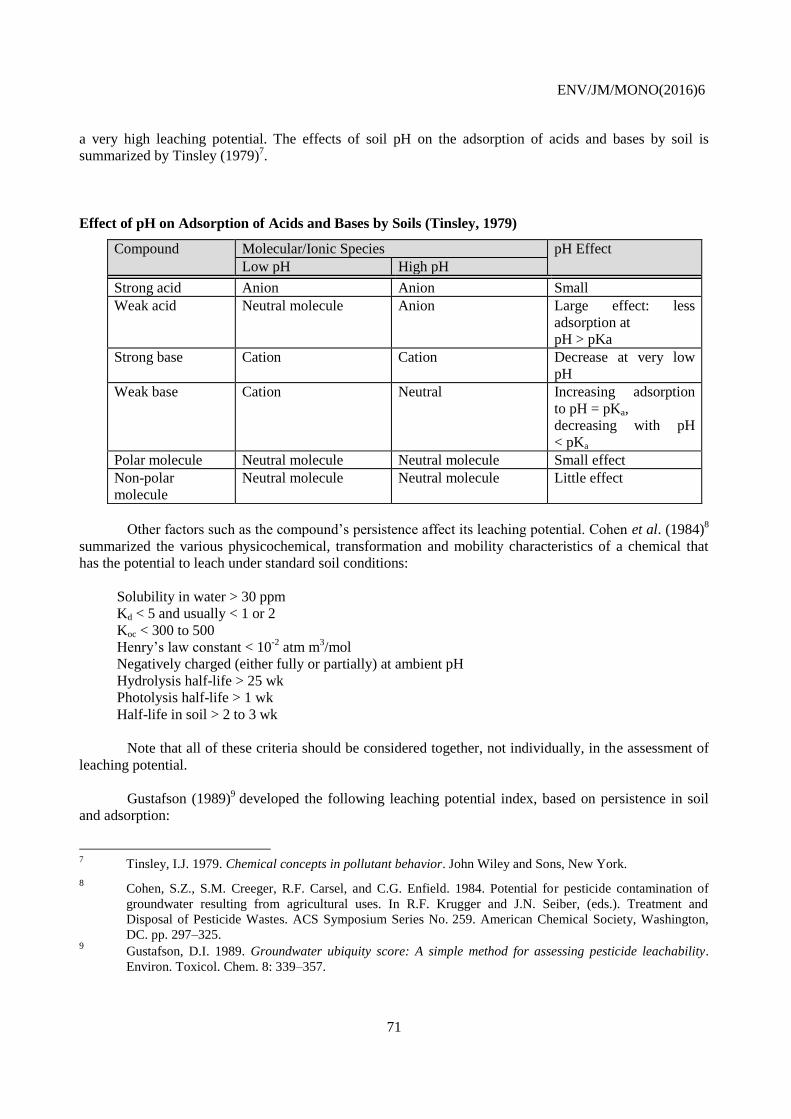
ENV/JM/MONO(2016)6
71
a very high leaching potential. The effects of soil pH on the adsorption of acids and bases by soil is
summarized by Tinsley (1979)7.
Effect of pH on Adsorption of Acids and Bases by Soils (Tinsley, 1979)
Compound Molecular/Ionic Species pH Effect
Low pH High pH
Strong acid Anion Anion Small
Weak acid Neutral molecule Anion Large effect: less
adsorption at
pH > pKa
Strong base Cation Cation Decrease at very low
pH
Weak base Cation Neutral Increasing adsorption
to pH = pKa,
decreasing with pH
< pKa
Polar molecule Neutral molecule Neutral molecule Small effect
Non-polar
molecule
Neutral molecule Neutral molecule Little effect
Other factors such as the compound’s persistence affect its leaching potential. Cohen et al. (1984)8
summarized the various physicochemical, transformation and mobility characteristics of a chemical that
has the potential to leach under standard soil conditions:
Solubility in water > 30 ppm
Kd < 5 and usually < 1 or 2
Koc < 300 to 500
Henry’s law constant < 10-2
atm m3/mol
Negatively charged (either fully or partially) at ambient pH
Hydrolysis half-life > 25 wk
Photolysis half-life > 1 wk
Half-life in soil > 2 to 3 wk
Note that all of these criteria should be considered together, not individually, in the assessment of
leaching potential.
Gustafson (1989)9
developed the following leaching potential index, based on persistence in soil
and adsorption:
7 Tinsley, I.J. 1979. Chemical concepts in pollutant behavior. John Wiley and Sons, New York.
8 Cohen, S.Z., S.M. Creeger, R.F. Carsel, and C.G. Enfield. 1984. Potential for pesticide contamination of
groundwater resulting from agricultural uses. In R.F. Krugger and J.N. Seiber, (eds.). Treatment and
Disposal of Pesticide Wastes. ACS Symposium Series No. 259. American Chemical Society, Washington,
DC. pp. 297–325. 9 Gustafson, D.I. 1989. Groundwater ubiquity score: A simple method for assessing pesticide leachability.
Environ. Toxicol. Chem. 8: 339–357.
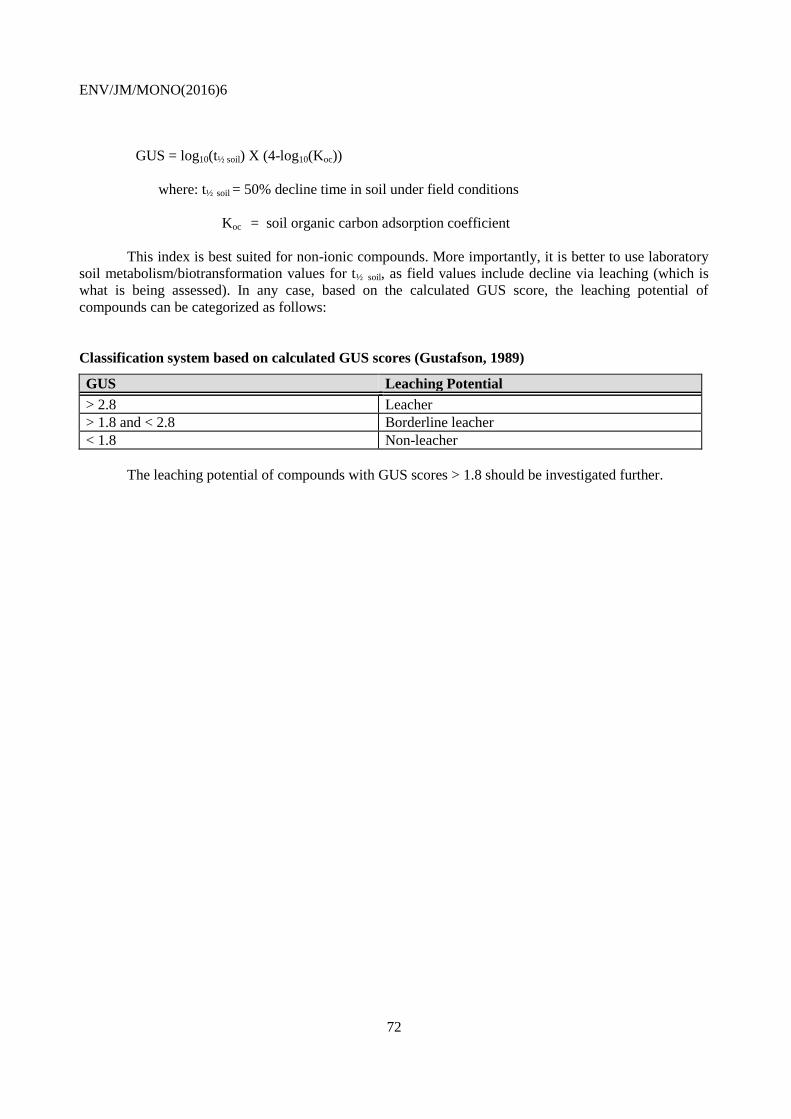
ENV/JM/MONO(2016)6
72
GUS = log10(t½ soil) X (4-log10(Koc))
where: t½ soil = 50% decline time in soil under field conditions
Koc = soil organic carbon adsorption coefficient
This index is best suited for non-ionic compounds. More importantly, it is better to use laboratory
soil metabolism/biotransformation values for t½ soil, as field values include decline via leaching (which is
what is being assessed). In any case, based on the calculated GUS score, the leaching potential of
compounds can be categorized as follows:
Classification system based on calculated GUS scores (Gustafson, 1989)
GUS Leaching Potential
> 2.8 Leacher
> 1.8 and < 2.8 Borderline leacher
< 1.8 Non-leacher
The leaching potential of compounds with GUS scores > 1.8 should be investigated further.
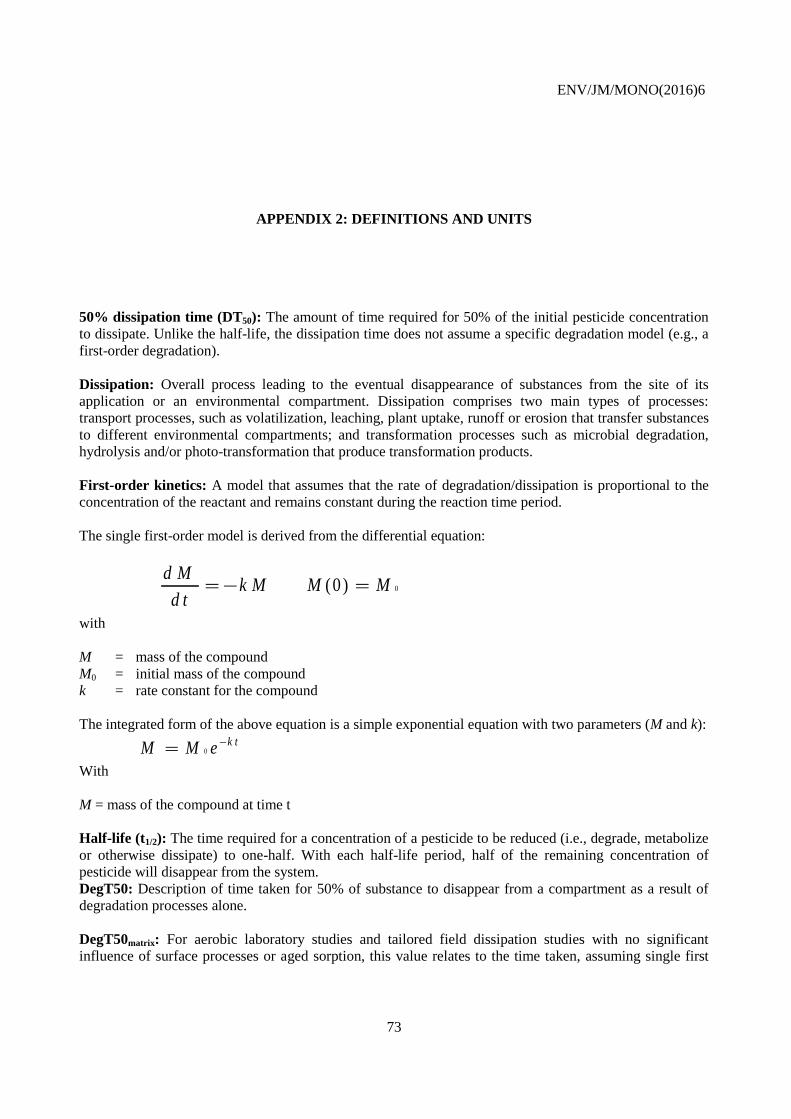
ENV/JM/MONO(2016)6
73
APPENDIX 2: DEFINITIONS AND UNITS
50% dissipation time (DT50): The amount of time required for 50% of the initial pesticide concentration
to dissipate. Unlike the half-life, the dissipation time does not assume a specific degradation model (e.g., a
first-order degradation).
Dissipation: Overall process leading to the eventual disappearance of substances from the site of its
application or an environmental compartment. Dissipation comprises two main types of processes:
transport processes, such as volatilization, leaching, plant uptake, runoff or erosion that transfer substances
to different environmental compartments; and transformation processes such as microbial degradation,
hydrolysis and/or photo-transformation that produce transformation products.
First-order kinetics: A model that assumes that the rate of degradation/dissipation is proportional to the
concentration of the reactant and remains constant during the reaction time period.
The single first-order model is derived from the differential equation:
d M
d tk M M M ( )0 0
with
M = mass of the compound
M0 = initial mass of the compound
k = rate constant for the compound
The integrated form of the above equation is a simple exponential equation with two parameters (M and k):
M M e k t
0
With
M = mass of the compound at time t
Half-life (t1/2): The time required for a concentration of a pesticide to be reduced (i.e., degrade, metabolize
or otherwise dissipate) to one-half. With each half-life period, half of the remaining concentration of
pesticide will disappear from the system.
DegT50: Description of time taken for 50% of substance to disappear from a compartment as a result of
degradation processes alone.
DegT50matrix: For aerobic laboratory studies and tailored field dissipation studies with no significant
influence of surface processes or aged sorption, this value relates to the time taken, assuming single first
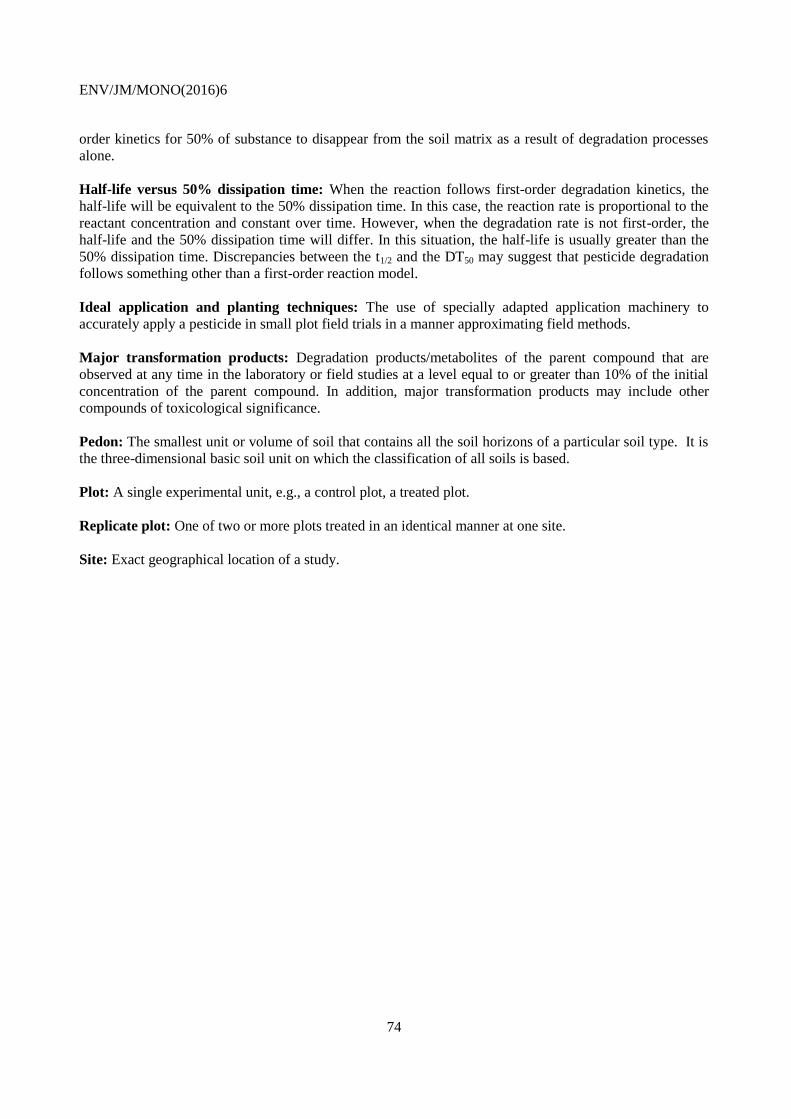
ENV/JM/MONO(2016)6
74
order kinetics for 50% of substance to disappear from the soil matrix as a result of degradation processes
alone.
Half-life versus 50% dissipation time: When the reaction follows first-order degradation kinetics, the
half-life will be equivalent to the 50% dissipation time. In this case, the reaction rate is proportional to the
reactant concentration and constant over time. However, when the degradation rate is not first-order, the
half-life and the 50% dissipation time will differ. In this situation, the half-life is usually greater than the
50% dissipation time. Discrepancies between the t1/2 and the DT50 may suggest that pesticide degradation
follows something other than a first-order reaction model.
Ideal application and planting techniques: The use of specially adapted application machinery to
accurately apply a pesticide in small plot field trials in a manner approximating field methods.
Major transformation products: Degradation products/metabolites of the parent compound that are
observed at any time in the laboratory or field studies at a level equal to or greater than 10% of the initial
concentration of the parent compound. In addition, major transformation products may include other
compounds of toxicological significance.
Pedon: The smallest unit or volume of soil that contains all the soil horizons of a particular soil type. It is
the three-dimensional basic soil unit on which the classification of all soils is based.
Plot: A single experimental unit, e.g., a control plot, a treated plot.
Replicate plot: One of two or more plots treated in an identical manner at one site.
Site: Exact geographical location of a study.
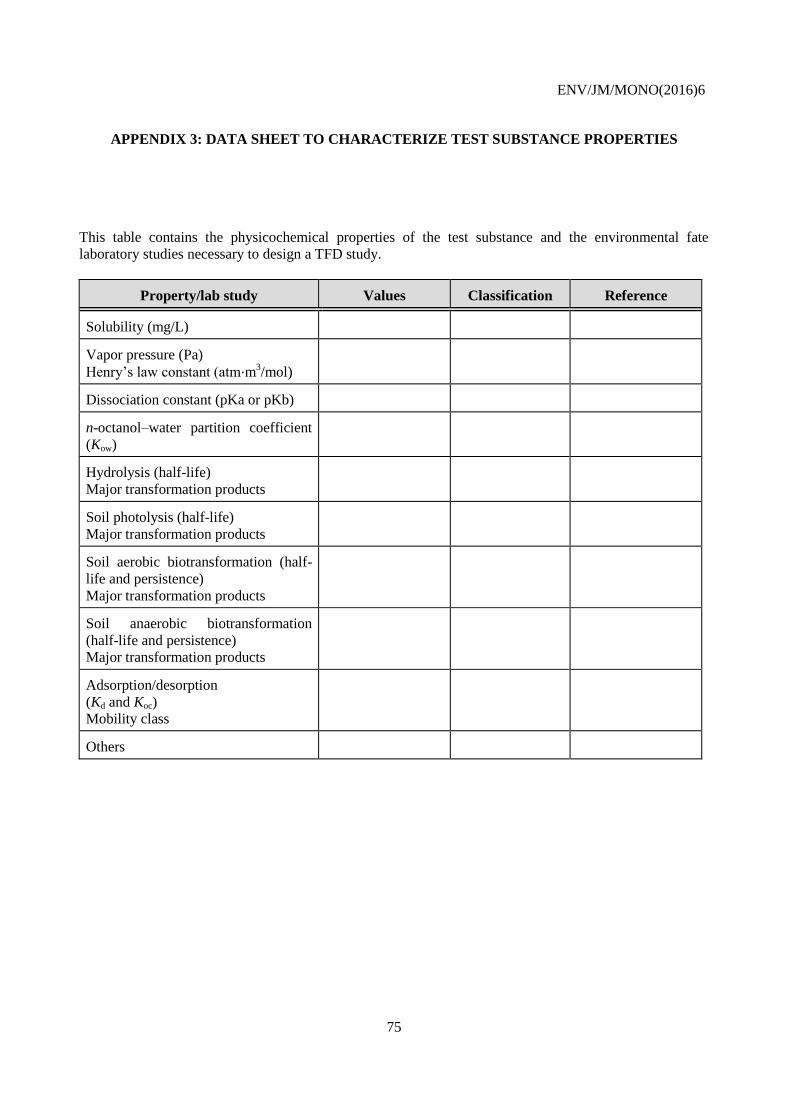
ENV/JM/MONO(2016)6
75
APPENDIX 3: DATA SHEET TO CHARACTERIZE TEST SUBSTANCE PROPERTIES
This table contains the physicochemical properties of the test substance and the environmental fate
laboratory studies necessary to design a TFD study.
Property/lab study Values Classification Reference
Solubility (mg/L)
Vapor pressure (Pa)
Henry’s law constant (atm⋅m3/mol)
Dissociation constant (pKa or pKb)
n-octanol–water partition coefficient
(Kow)
Hydrolysis (half-life)
Major transformation products
Soil photolysis (half-life)
Major transformation products
Soil aerobic biotransformation (half-
life and persistence)
Major transformation products
Soil anaerobic biotransformation
(half-life and persistence)
Major transformation products
Adsorption/desorption
(Kd and Koc)
Mobility class
Others
ENV/JM/MONO(2016)6
76
APPENDIX 4: ANALYTICAL METHOD REPORTING, QA/QC AND VALIDATION
Environmental chemistry information that is needed for the independent validation of analytical methods
used in conducting field dissipation studies is listed below.
Documentation. A full description of the analytical methods used in all steps of the analytical protocol
should be submitted, including the following information:
Name and signature, title, organization, address and telephone number of the person(s) responsible for the
planning and supervision/monitoring and laboratory procedures/analyses
Analytical method(s) title/designation/date
Source of analytical method(s) [e.g., Pesticide Analytical Manual (PAM), Vol. II, scientific literature,
company reports]
Principles of the analytical procedure (description)
Copy of the analytical method(s) detailing the following procedures:
a) extraction
b) clean-up
c) derivatization
d) determination and calculation of the magnitude of the residue
Reagents or procedural steps requiring special precautions to avoid safety or health hazards
Identification of the chemical species determined
Modifications, if any, to the analytical method(s)
Extraction efficiency
Instrumentation (e.g., GC)
a) make/model
b) type/specificity of detectors
c) column(s) packing materials and size
d) gas carrier and flow rates
e) temperatures
f) limits of detection and sensitivity
g) calibration procedures
Interferences, if any
Confirmatory techniques
a) other column packings
b) detectors
c) mass spectrometry
d) nuclear magnetic resonance

ENV/JM/MONO(2016)6
77
Date(s) of sampling, extraction and residue analyses
Sample identification (coding and labelling information)
Residue results (examples of raw data, laboratory worksheets, stepwise calculation of residue levels,
dilution factors, peak heights/areas, method correction factors applied [e.g., storage stability and method
validation recovery values], standard curve(s) used, ppm of total residues and of individual components if
they are of special concern, range of residue values, representative chromatograms, spectra of control and
treated samples)
Statistical treatments of raw data
Other additional information that the study sponsor/researcher considers appropriate and relevant to
provide a complete as well as thorough description of residue analytical methodology and the means of
calculating the residue results
Quality Assurance/Quality Control. A complete description of the measures taken to ensure the integrity
of the analytical results should include information on the following:
Logbooks and/or record keeping procedures, representative instrument printouts, such as
chromatograms, spectral analyses, etc.
Sample coding
Use of replicate samples and control blanks
Use of written and validated analytical methodology for residue analyses involved in all test and
analytical procedures, including modifications made
Skills of laboratory personnel
Laboratory facilities
Use of high quality glassware, solvents and test compounds to ensure minimal contamination
Calibration and maintenance of instruments
Good laboratory practices in handling the test substance(s)
Quality assurance project plan
Internal and external auditing schedule established by the study director using an independent quality
assurance unit
Independent Laboratory Method Validation. A full description of the method validation procedures
performed by an independent laboratory should be submitted and include the following information:
Recovery level(s) of the test compounds from the soil (substrate) at various fortification level(s)
using the residue analytical methodology
A validated method sensitivity level
Results of the study and statistical test applied, including a stepwise presentation of the procedure
for calculating percent recovery from the raw data
All the data/information necessary to independently verify the results
Summary of the results
Discussion and conclusions of the results
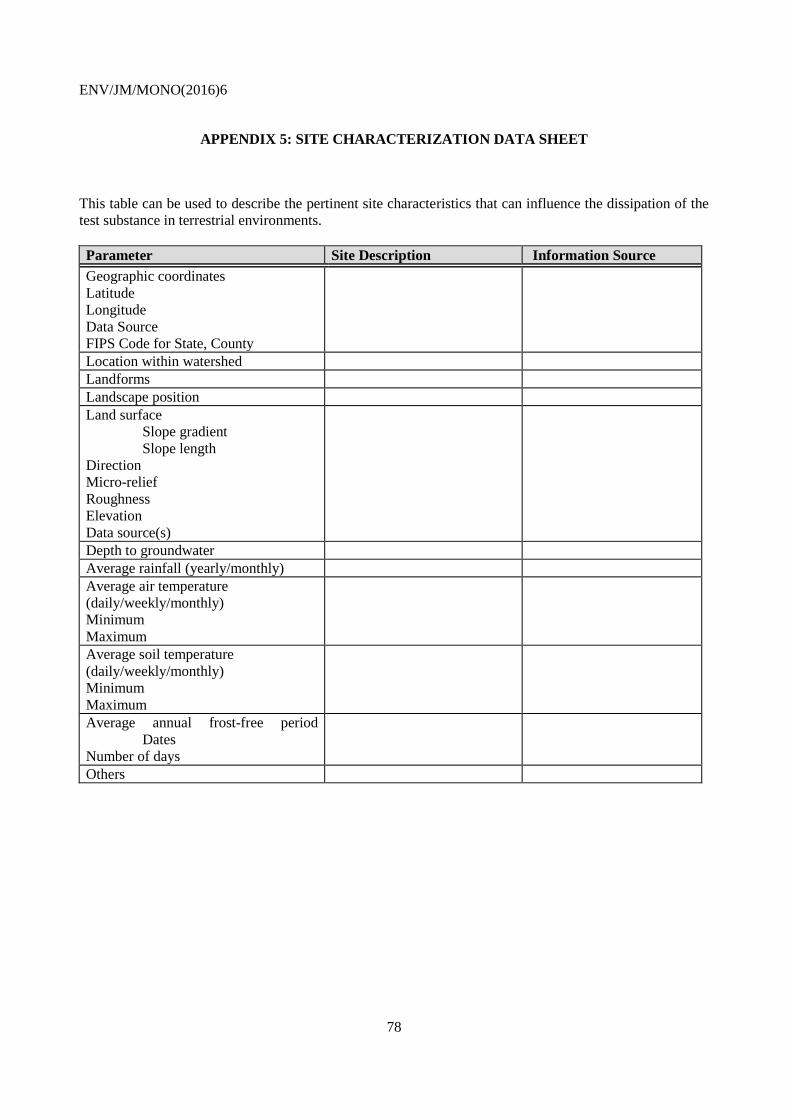
ENV/JM/MONO(2016)6
78
APPENDIX 5: SITE CHARACTERIZATION DATA SHEET
This table can be used to describe the pertinent site characteristics that can influence the dissipation of the
test substance in terrestrial environments.
Parameter Site Description Information Source
Geographic coordinates
Latitude
Longitude
Data Source
FIPS Code for State, County
Location within watershed
Landforms
Landscape position
Land surface
Slope gradient
Slope length
Direction
Micro-relief
Roughness
Elevation
Data source(s)
Depth to groundwater
Average rainfall (yearly/monthly)
Average air temperature
(daily/weekly/monthly)
Minimum
Maximum
Average soil temperature
(daily/weekly/monthly)
Minimum
Maximum
Average annual frost-free period
Dates
Number of days
Others
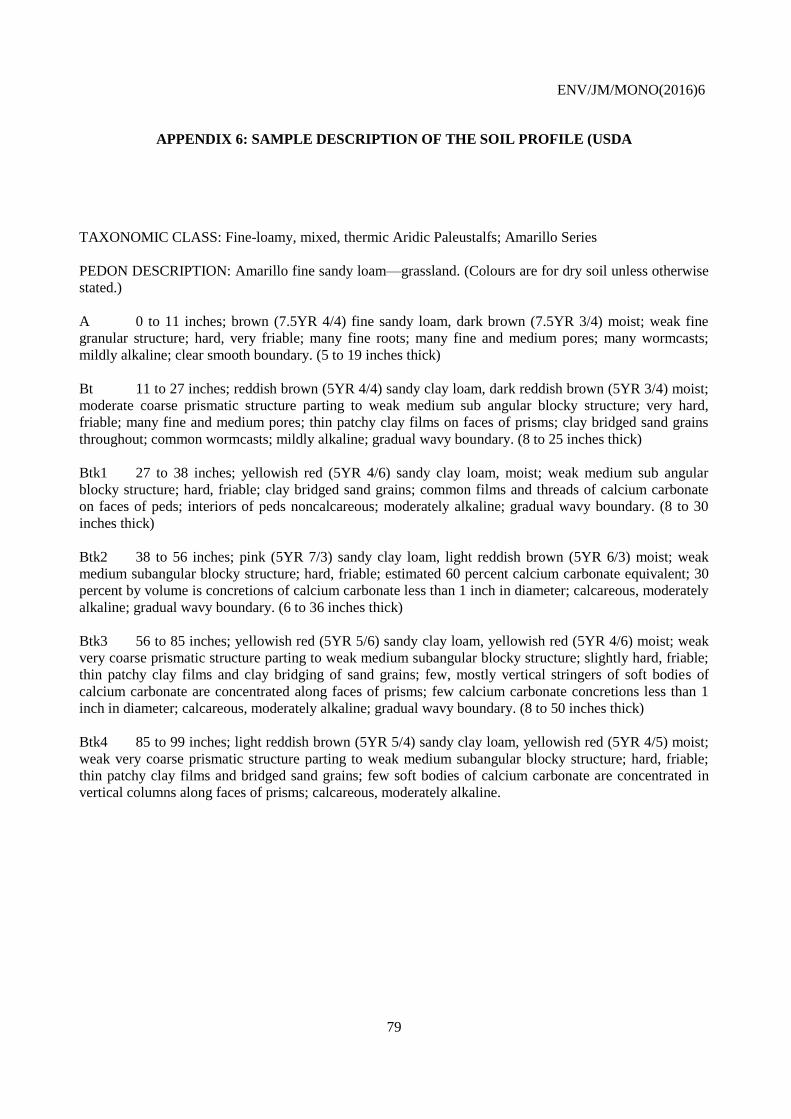
ENV/JM/MONO(2016)6
79
APPENDIX 6: SAMPLE DESCRIPTION OF THE SOIL PROFILE (USDA
TAXONOMIC CLASS: Fine-loamy, mixed, thermic Aridic Paleustalfs; Amarillo Series
PEDON DESCRIPTION: Amarillo fine sandy loam—grassland. (Colours are for dry soil unless otherwise
stated.)
A 0 to 11 inches; brown (7.5YR 4/4) fine sandy loam, dark brown (7.5YR 3/4) moist; weak fine
granular structure; hard, very friable; many fine roots; many fine and medium pores; many wormcasts;
mildly alkaline; clear smooth boundary. (5 to 19 inches thick)
Bt 11 to 27 inches; reddish brown (5YR 4/4) sandy clay loam, dark reddish brown (5YR 3/4) moist;
moderate coarse prismatic structure parting to weak medium sub angular blocky structure; very hard,
friable; many fine and medium pores; thin patchy clay films on faces of prisms; clay bridged sand grains
throughout; common wormcasts; mildly alkaline; gradual wavy boundary. (8 to 25 inches thick)
Btk1 27 to 38 inches; yellowish red (5YR 4/6) sandy clay loam, moist; weak medium sub angular
blocky structure; hard, friable; clay bridged sand grains; common films and threads of calcium carbonate
on faces of peds; interiors of peds noncalcareous; moderately alkaline; gradual wavy boundary. (8 to 30
inches thick)
Btk2 38 to 56 inches; pink (5YR 7/3) sandy clay loam, light reddish brown (5YR 6/3) moist; weak
medium subangular blocky structure; hard, friable; estimated 60 percent calcium carbonate equivalent; 30
percent by volume is concretions of calcium carbonate less than 1 inch in diameter; calcareous, moderately
alkaline; gradual wavy boundary. (6 to 36 inches thick)
Btk3 56 to 85 inches; yellowish red (5YR 5/6) sandy clay loam, yellowish red (5YR 4/6) moist; weak
very coarse prismatic structure parting to weak medium subangular blocky structure; slightly hard, friable;
thin patchy clay films and clay bridging of sand grains; few, mostly vertical stringers of soft bodies of
calcium carbonate are concentrated along faces of prisms; few calcium carbonate concretions less than 1
inch in diameter; calcareous, moderately alkaline; gradual wavy boundary. (8 to 50 inches thick)
Btk4 85 to 99 inches; light reddish brown (5YR 5/4) sandy clay loam, yellowish red (5YR 4/5) moist;
weak very coarse prismatic structure parting to weak medium subangular blocky structure; hard, friable;
thin patchy clay films and bridged sand grains; few soft bodies of calcium carbonate are concentrated in
vertical columns along faces of prisms; calcareous, moderately alkaline.
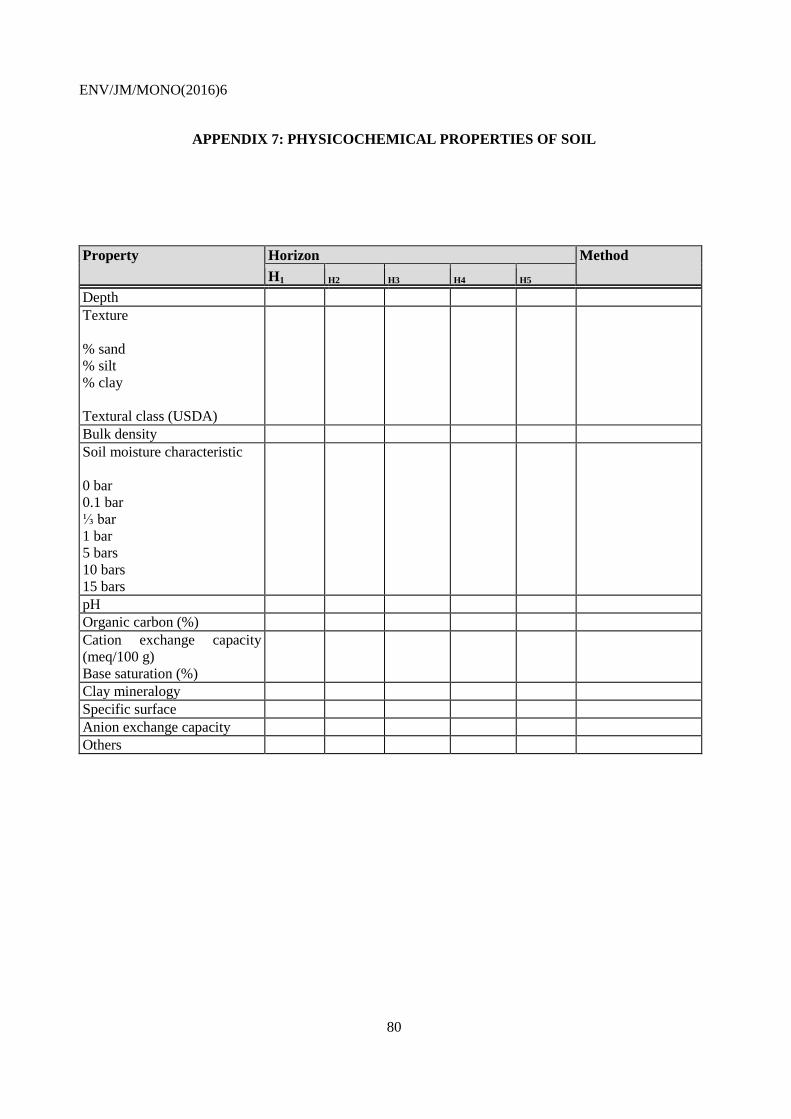
ENV/JM/MONO(2016)6
80
APPENDIX 7: PHYSICOCHEMICAL PROPERTIES OF SOIL
Property Horizon Method
H1 H2 H3 H4 H5
Depth
Texture
% sand
% silt
% clay
Textural class (USDA)
Bulk density
Soil moisture characteristic
0 bar
0.1 bar
⅓ bar
1 bar
5 bars
10 bars
15 bars
pH
Organic carbon (%)
Cation exchange capacity
(meq/100 g)
Base saturation (%)
Clay mineralogy
Specific surface
Anion exchange capacity
Others

ENV/JM/MONO(2016)6
81
APPENDIX 8: METEOROLOGICAL HISTORY DATA SHEET
This table can be used to describe the pertinent meteorological factors that can influence the dissipation of
the test substance in terrestrial environments.
Parameter Site Description Information Source
Average monthly rainfall
January
February
March
April
May
June
July
August
September
October
November
December
Average minimum/maximum air
temperature
January
February
March
April
May
June
July
August
September
October
November
December
Average annual frost-free period
Dates
Number of days
Others

ENV/JM/MONO(2016)6
82
APPENDIX 9: SITE USE AND MANAGEMENT HISTORY FOR THE PREVIOUS THREE
YEARS
Use Previous Year Previous 2nd Year Previous 3rd Year
Crops grown
Pesticide and fertilizer use
Cultivation methods
Tillage
Irrigation practices
Others
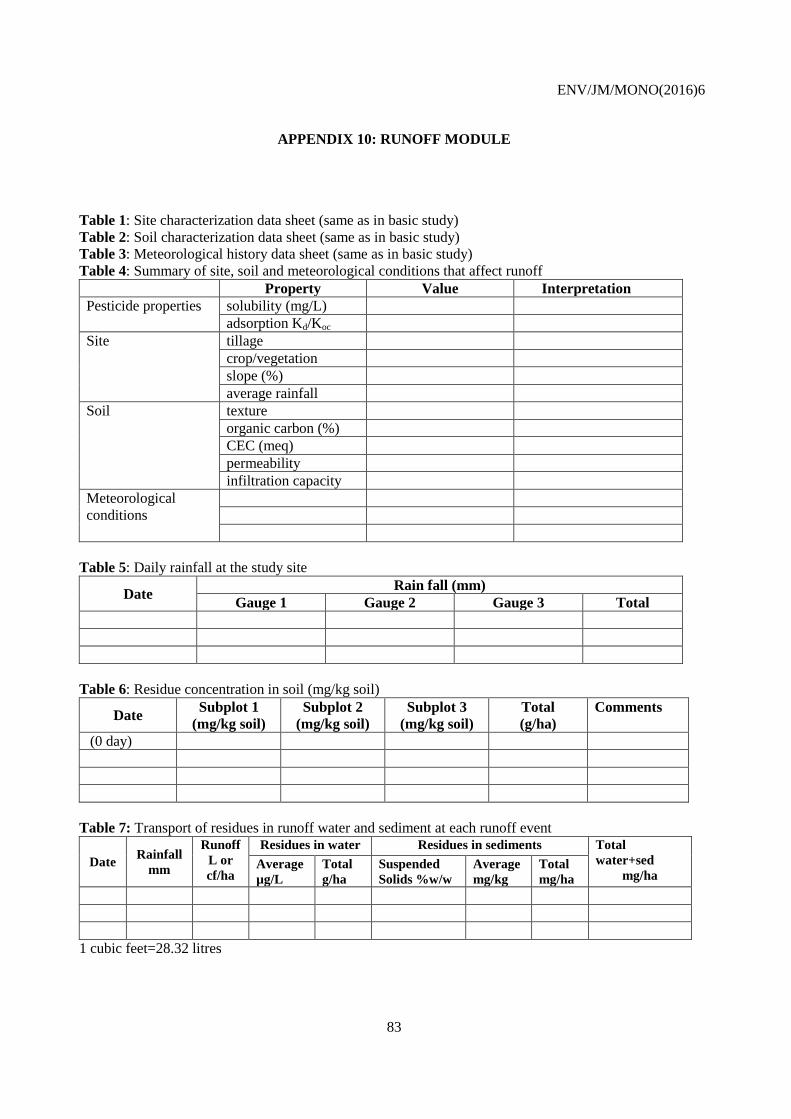
ENV/JM/MONO(2016)6
83
APPENDIX 10: RUNOFF MODULE
Table 1: Site characterization data sheet (same as in basic study)
Table 2: Soil characterization data sheet (same as in basic study)
Table 3: Meteorological history data sheet (same as in basic study)
Table 4: Summary of site, soil and meteorological conditions that affect runoff
Property Value Interpretation
Pesticide properties solubility (mg/L)
adsorption Kd/Koc
Site tillage
crop/vegetation
slope (%)
average rainfall
Soil texture
organic carbon (%)
CEC (meq)
permeability
infiltration capacity
Meteorological
conditions
Table 5: Daily rainfall at the study site
Date Rain fall (mm)
Gauge 1 Gauge 2 Gauge 3 Total
Table 6: Residue concentration in soil (mg/kg soil)
Date Subplot 1
(mg/kg soil)
Subplot 2
(mg/kg soil)
Subplot 3
(mg/kg soil)
Total
(g/ha)
Comments
(0 day)
Table 7: Transport of residues in runoff water and sediment at each runoff event
Date Rainfall
mm
Runoff
L or
cf/ha
Residues in water Residues in sediments Total
water+sed
mg/ha Average
µg/L
Total
g/ha
Suspended
Solids %w/w
Average
mg/kg
Total
mg/ha
1 cubic feet=28.32 litres
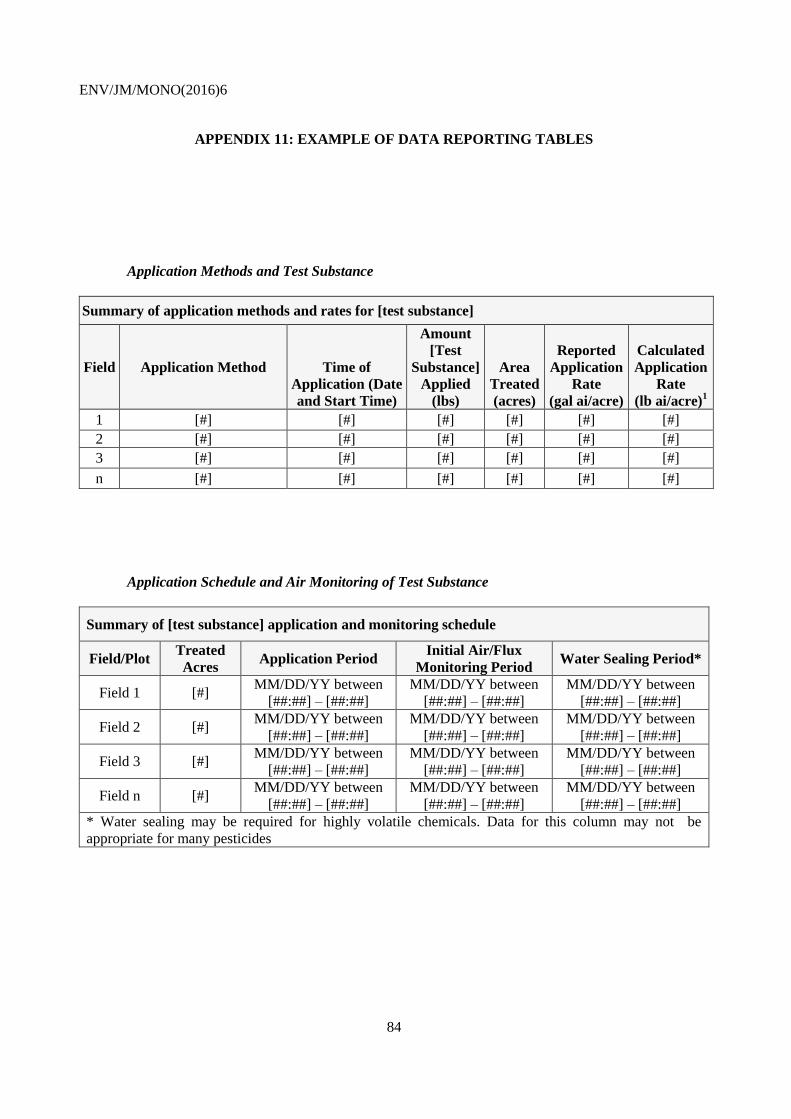
ENV/JM/MONO(2016)6
84
APPENDIX 11: EXAMPLE OF DATA REPORTING TABLES
Application Methods and Test Substance
Summary of application methods and rates for [test substance]
Field Application Method
Time of
Application (Date
and Start Time)
Amount
[Test
Substance]
Applied
(lbs)
Area
Treated
(acres)
Reported
Application
Rate
(gal ai/acre)
Calculated
Application
Rate
(lb ai/acre)1
1 [#] [#] [#] [#] [#] [#]
2 [#] [#] [#] [#] [#] [#]
3 [#] [#] [#] [#] [#] [#]
n [#] [#] [#] [#] [#] [#]
Application Schedule and Air Monitoring of Test Substance
Summary of [test substance] application and monitoring schedule
Field/Plot Treated
Acres Application Period
Initial Air/Flux
Monitoring Period Water Sealing Period*
Field 1 [#] MM/DD/YY between
[##:##] – [##:##]
MM/DD/YY between
[##:##] – [##:##]
MM/DD/YY between
[##:##] – [##:##]
Field 2 [#] MM/DD/YY between
[##:##] – [##:##]
MM/DD/YY between
[##:##] – [##:##]
MM/DD/YY between
[##:##] – [##:##]
Field 3 [#] MM/DD/YY between
[##:##] – [##:##]
MM/DD/YY between
[##:##] – [##:##]
MM/DD/YY between
[##:##] – [##:##]
Field n [#] MM/DD/YY between
[##:##] – [##:##]
MM/DD/YY between
[##:##] – [##:##]
MM/DD/YY between
[##:##] – [##:##]
* Water sealing may be required for highly volatile chemicals. Data for this column may not be
appropriate for many pesticides
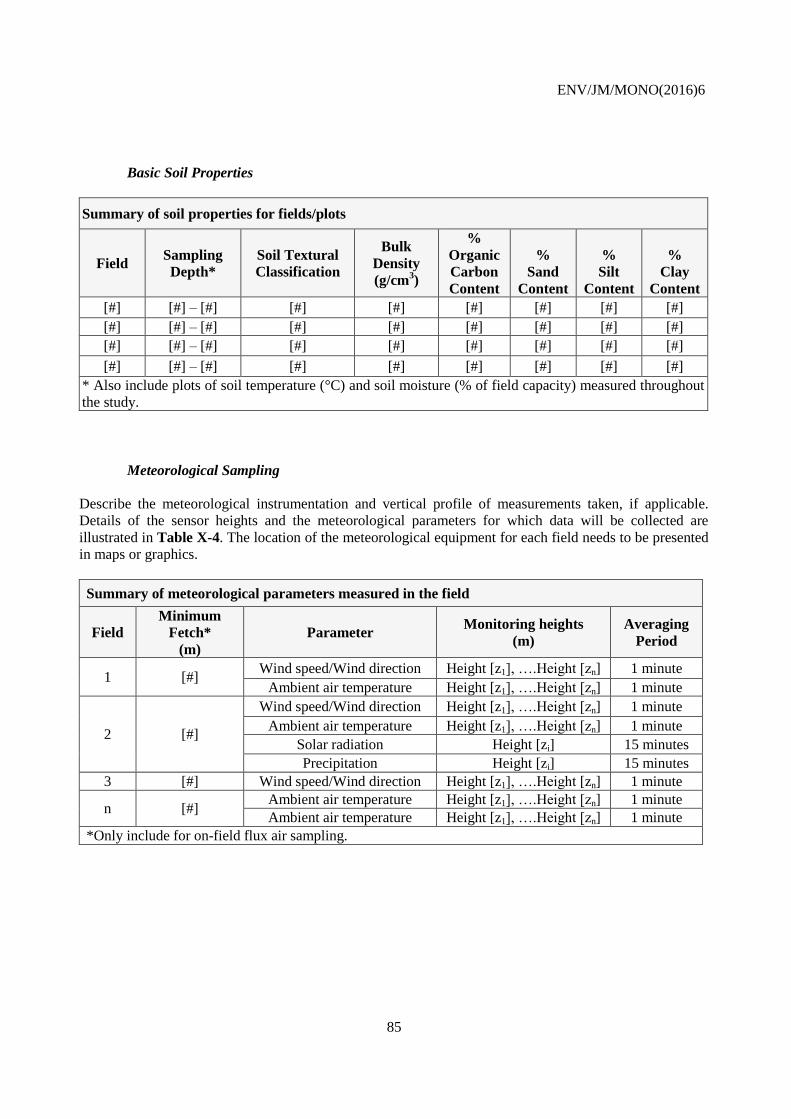
ENV/JM/MONO(2016)6
85
Basic Soil Properties
Summary of soil properties for fields/plots
Field Sampling
Depth*
Soil Textural
Classification
Bulk
Density
(g/cm3)
%
Organic
Carbon
Content
%
Sand
Content
%
Silt
Content
%
Clay
Content
[#] [#] – [#] [#] [#] [#] [#] [#] [#]
[#] [#] – [#] [#] [#] [#] [#] [#] [#]
[#] [#] – [#] [#] [#] [#] [#] [#] [#]
[#] [#] – [#] [#] [#] [#] [#] [#] [#]
* Also include plots of soil temperature (°C) and soil moisture (% of field capacity) measured throughout
the study.
Meteorological Sampling
Describe the meteorological instrumentation and vertical profile of measurements taken, if applicable.
Details of the sensor heights and the meteorological parameters for which data will be collected are
illustrated in Table X-4. The location of the meteorological equipment for each field needs to be presented
in maps or graphics.
Summary of meteorological parameters measured in the field
Field
Minimum
Fetch*
(m)
Parameter Monitoring heights
(m)
Averaging
Period
1 [#] Wind speed/Wind direction Height [z1], ….Height [zn] 1 minute
Ambient air temperature Height [z1], ….Height [zn] 1 minute
2 [#]
Wind speed/Wind direction Height [z1], ….Height [zn] 1 minute
Ambient air temperature Height [z1], ….Height [zn] 1 minute
Solar radiation Height [zi] 15 minutes
Precipitation Height [zi] 15 minutes
3 [#] Wind speed/Wind direction Height [z1], ….Height [zn] 1 minute
n [#] Ambient air temperature Height [z1], ….Height [zn] 1 minute
Ambient air temperature Height [z1], ….Height [zn] 1 minute
*Only include for on-field flux air sampling.
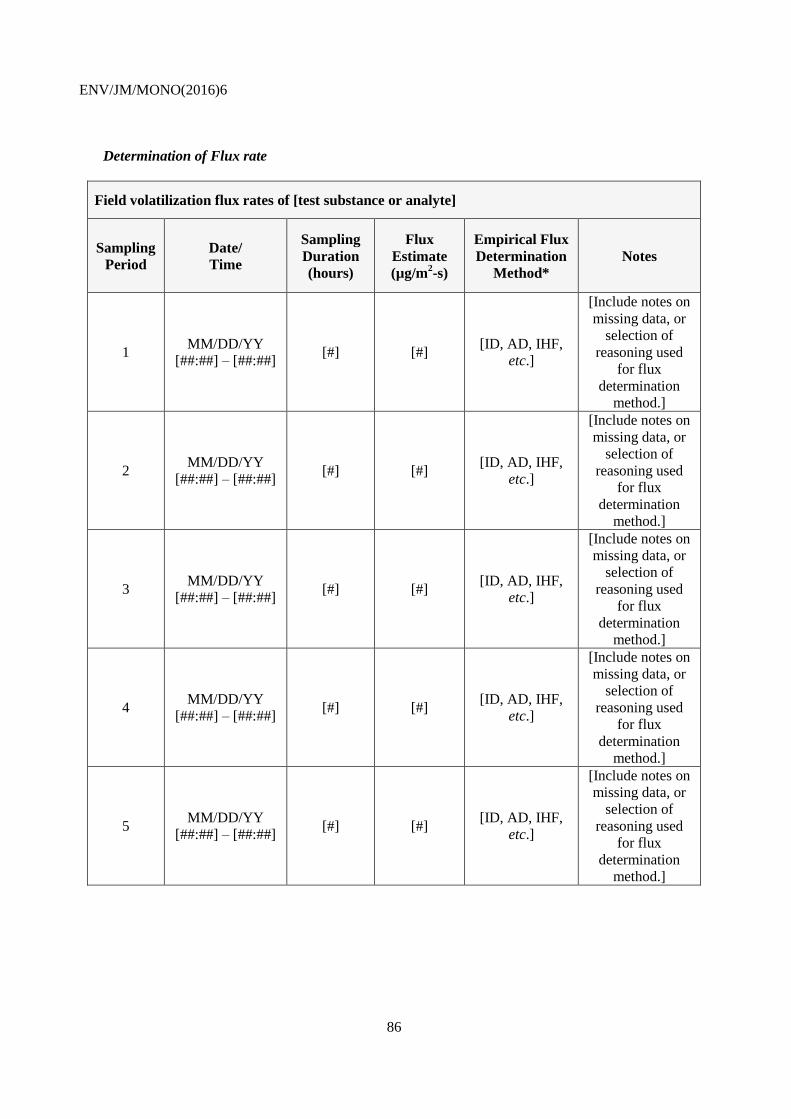
ENV/JM/MONO(2016)6
86
Determination of Flux rate
Field volatilization flux rates of [test substance or analyte]
Sampling
Period
Date/
Time
Sampling
Duration
(hours)
Flux
Estimate
(µg/m2-s)
Empirical Flux
Determination
Method*
Notes
1 MM/DD/YY
[##:##] – [##:##] [#] [#]
[ID, AD, IHF,
etc.]
[Include notes on
missing data, or
selection of
reasoning used
for flux
determination
method.]
2 MM/DD/YY
[##:##] – [##:##] [#] [#]
[ID, AD, IHF,
etc.]
[Include notes on
missing data, or
selection of
reasoning used
for flux
determination
method.]
3 MM/DD/YY
[##:##] – [##:##] [#] [#]
[ID, AD, IHF,
etc.]
[Include notes on
missing data, or
selection of
reasoning used
for flux
determination
method.]
4 MM/DD/YY
[##:##] – [##:##] [#] [#]
[ID, AD, IHF,
etc.]
[Include notes on
missing data, or
selection of
reasoning used
for flux
determination
method.]
5 MM/DD/YY
[##:##] – [##:##] [#] [#]
[ID, AD, IHF,
etc.]
[Include notes on
missing data, or
selection of
reasoning used
for flux
determination
method.]
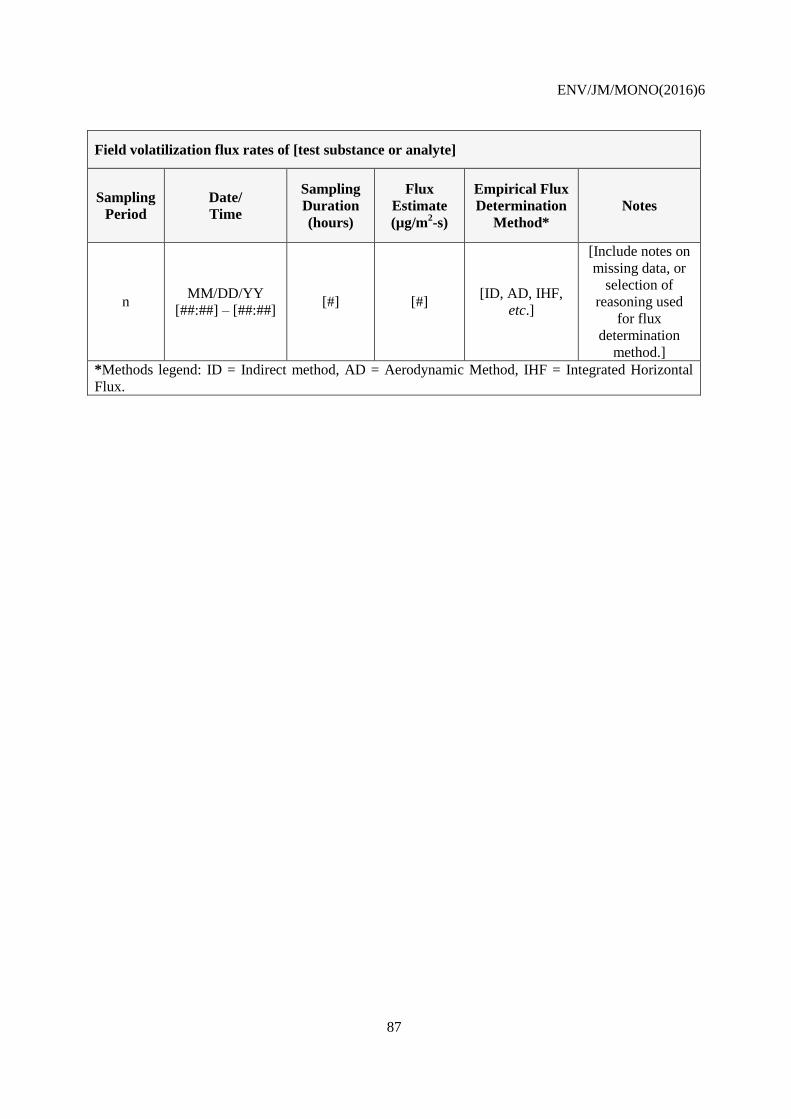
ENV/JM/MONO(2016)6
87
Field volatilization flux rates of [test substance or analyte]
Sampling
Period
Date/
Time
Sampling
Duration
(hours)
Flux
Estimate
(µg/m2-s)
Empirical Flux
Determination
Method*
Notes
n MM/DD/YY
[##:##] – [##:##] [#] [#]
[ID, AD, IHF,
etc.]
[Include notes on
missing data, or
selection of
reasoning used
for flux
determination
method.]
*Methods legend: ID = Indirect method, AD = Aerodynamic Method, IHF = Integrated Horizontal
Flux.