uncertainty quantification and dimension prediction in forging and cooling processes belur k....
TRANSCRIPT
Uncertainty Quantification and Dimension Prediction in
Forging and Cooling Processes
Belur K. Badrinarayan
Adviser: Dr. Ramana V. Grandhi

What are we trying to accomplish?
A
B
C
D
E
Image Processing
Computer simulations
(Database generation)
Comparator/Estimator (TIG)
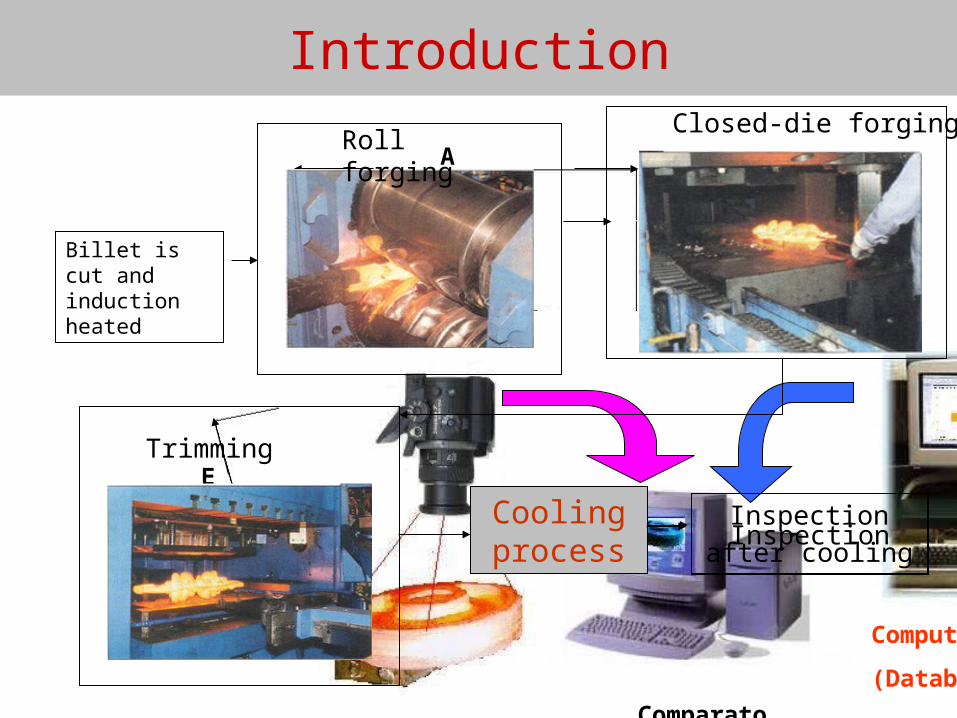
Closed-die forging Roll forging
Introduction
Billet is cut and induction heated
Trimming
Cooling process
Inspection after
cooling Inspection
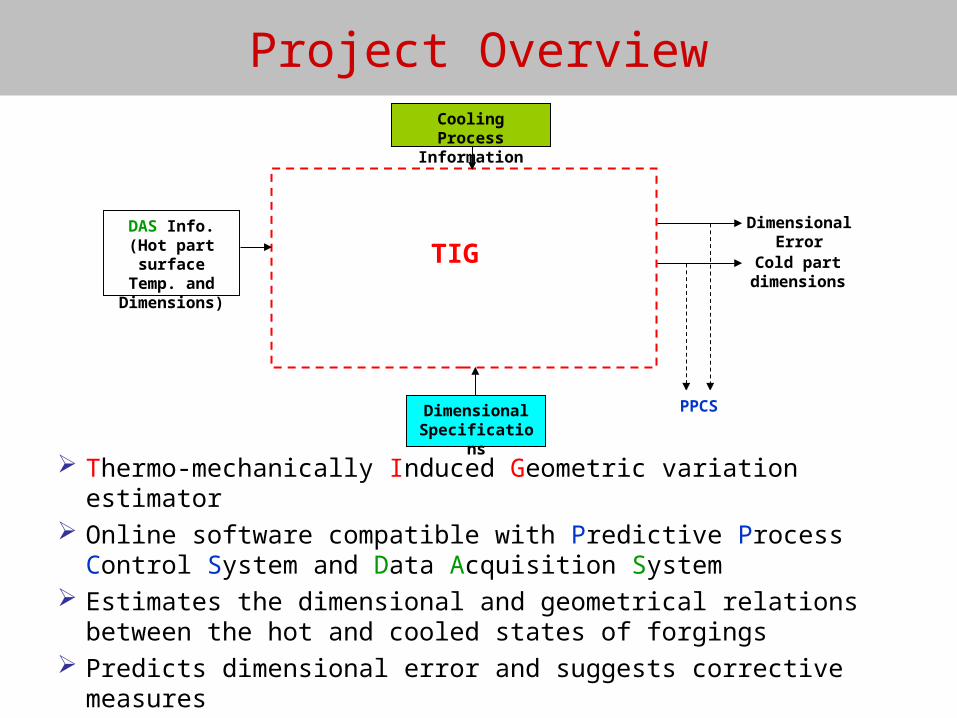
Project Overview
Thermo-mechanically Induced Geometric variation estimator Online software compatible with Predictive Process Control
System and Data Acquisition System Estimates the dimensional and geometrical relations between the
hot and cooled states of forgings Predicts dimensional error and suggests corrective measures
Cold part dimensions
DAS Info. (Hot part surface Temp. and
Dimensions)
TIG
Dimensional Specifications
Dimensional Error
PPCS
Cooling Process Information
Determine factors affecting final part dimensions
Quantify uncertainties in forging/cooling process
Predict hot part dimensions after forging
Incorporate into TIG
Reduce part rejection and production costs
Research Objectives
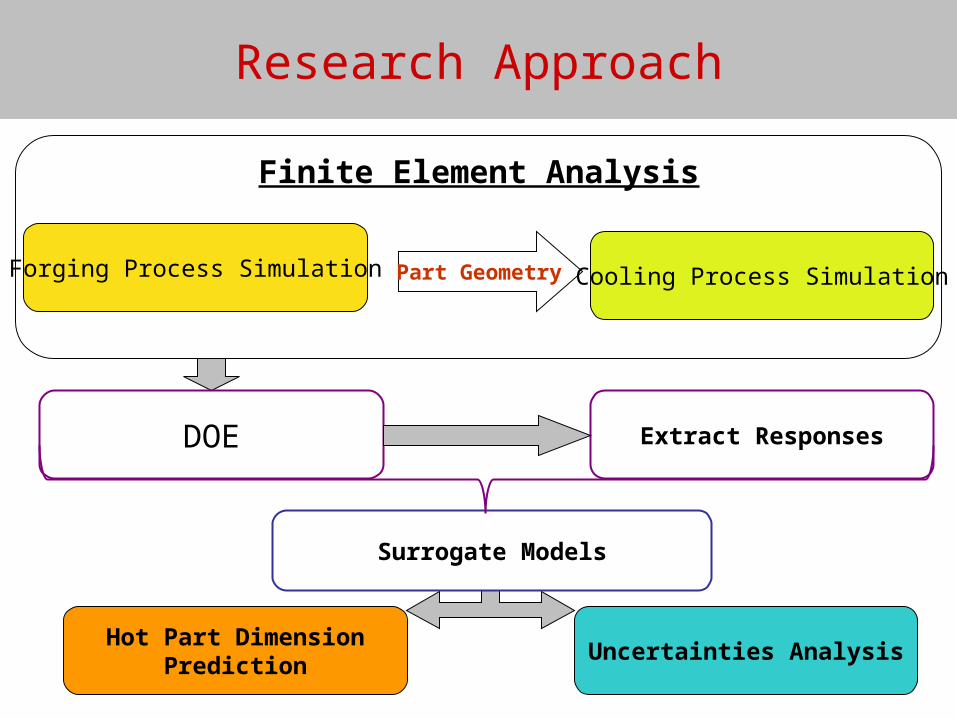
Finite Element Analysis
Part Geometry Cooling Process SimulationForging Process Simulation
Surrogate Models
Uncertainties Analysis
DOE Extract Responses
Hot Part Dimension Prediction
Research Approach
Research Approach
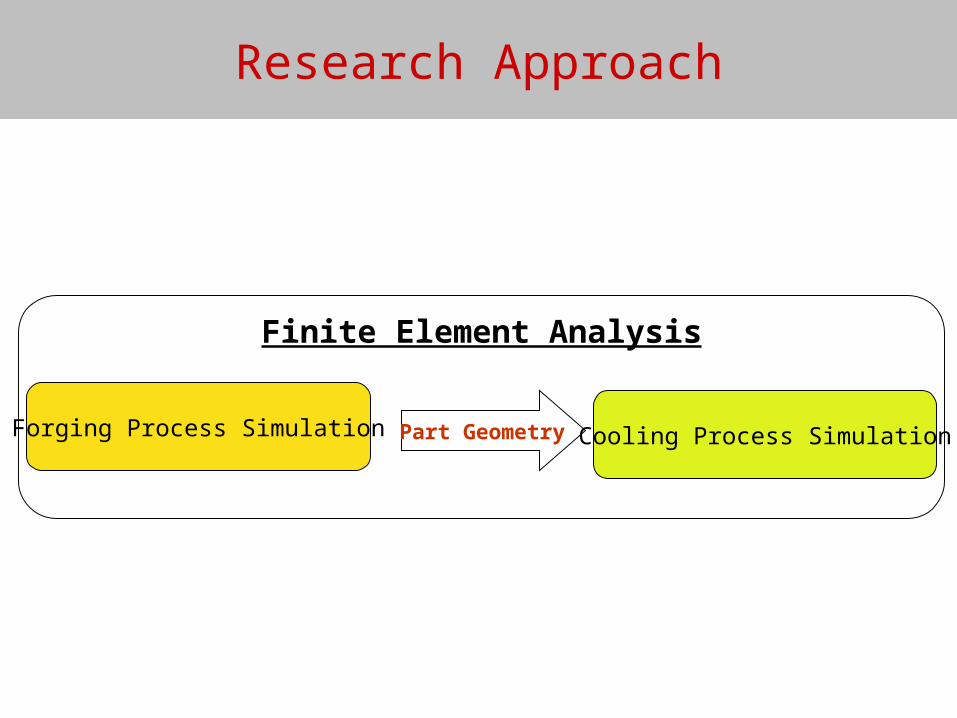
Finite Element Analysis
Part Geometry Cooling Process SimulationForging Process Simulation
Finite Element Analysis
Part Geometry Cooling Process SimulationForging Process Simulation
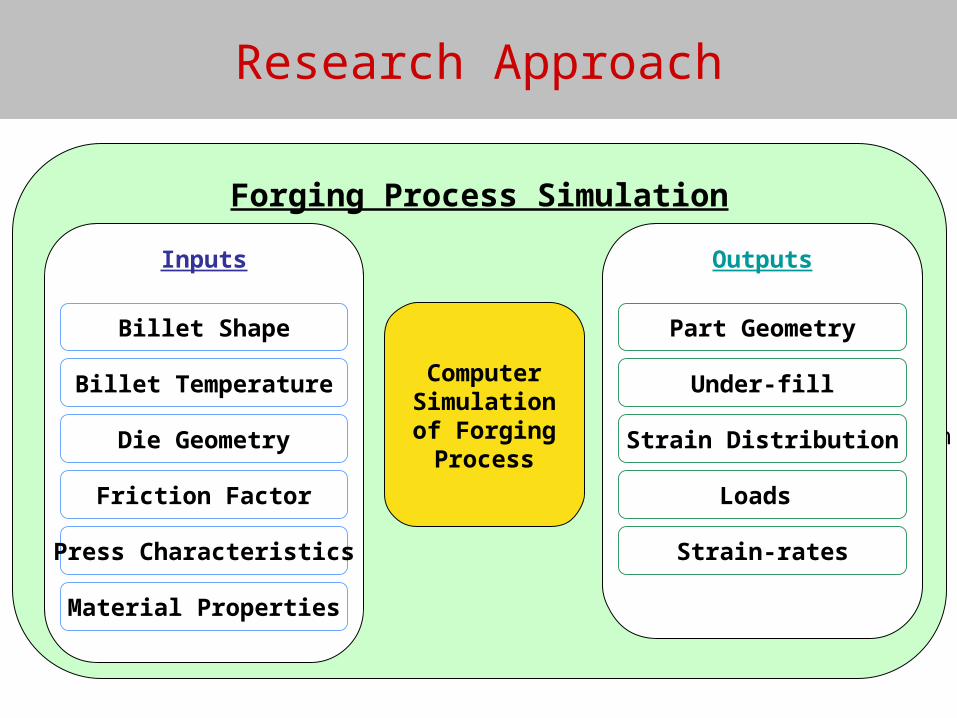
Forging Process Simulation
Inputs
Billet Temperature
Die Geometry
Friction Factor
Press Characteristics
Billet Shape
Computer Simulation of
Forging Process
Outputs
Under-fill
Strain Distribution
Loads
Strain-rates
Part Geometry
Material Properties
Research Approach

Cooling Process Simulation
Inputs
Heat Transfer Coefficient
Kinetic Models
Environment Temperature
Material Properties
Part Geometry
Computer Simulation of
Cooling Process
Outputs
Nodal Coordinates
Stress Distribution
Hardness Distribution
Volume Fraction of Phases
Part Geometry
Research Approach
Sensitivity Analysis
Finite Element Analysis
Part Geometry Cooling Process SimulationForging Process Simulation
DEFORM HT ABAQUS/DANTE
Finite Element Package
Easy to model NO Phase
Transformation and Material property data
Easy to model Contains Phase
Transformation and Material property data

Uncertainties Analysis
Hot Part Dimension Prediction
Finite Element Analysis
Part Geometry Cooling Process SimulationForging Process Simulation
Surrogate Models
DOE Extract Responses
Research Approach
Research Approach
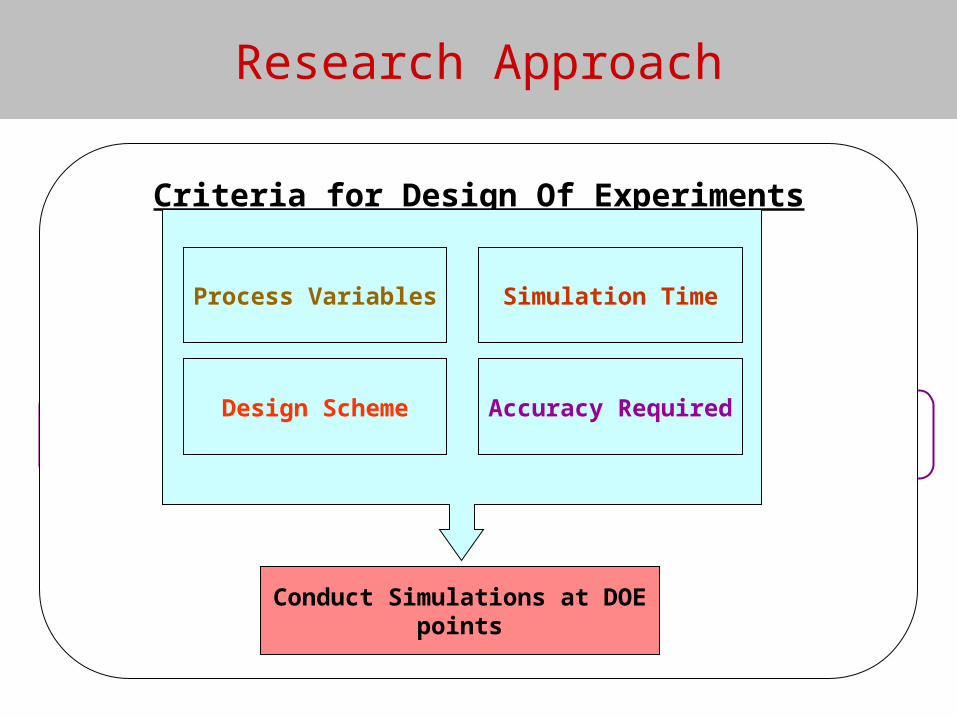
DOE Extract Responses
Criteria for Design Of Experiments
Process Variables Simulation Time
Accuracy Required
Conduct Simulations at DOE points
Design Scheme

Uncertainties Analysis
Hot Part Dimension Prediction
Finite Element Analysis
Part Geometry Cooling Process SimulationForging Process Simulation
Surrogate Models
DOE Extract Responses
Research Approach
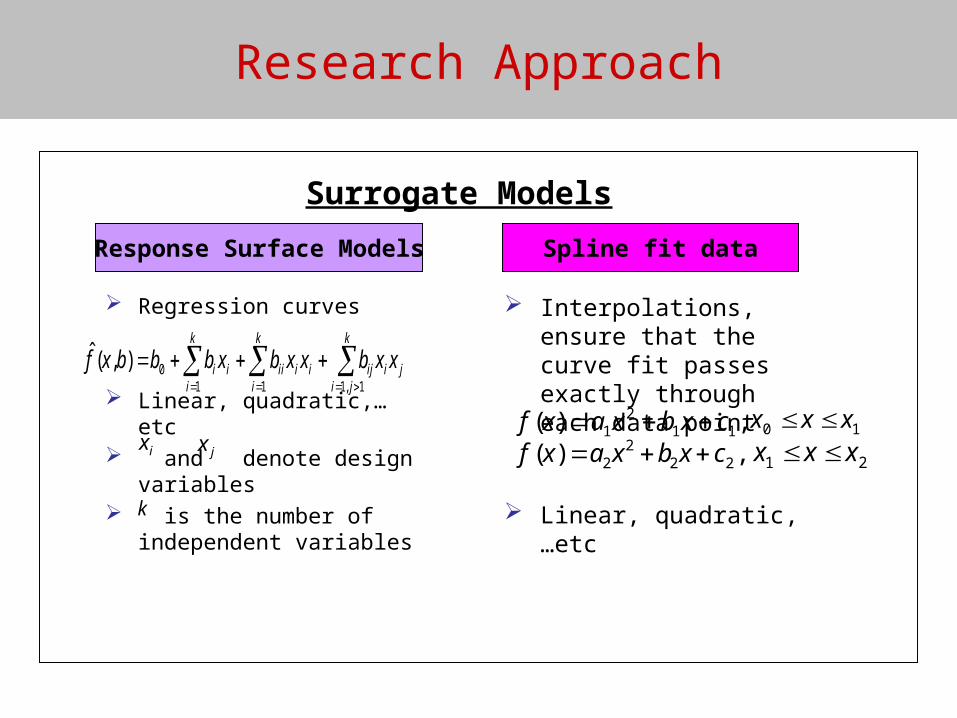
Surrogate ModelsSurrogate models
(Response Surface Models/ Spline fit)
Response Surface Models Spline fit data
Regression curves
Linear, quadratic,…etc and denote design
variables is the number of
independent variables
j
k
jiiiji
k
iiii
k
iii xxbxxbxbbbxf
1,111
0),(ˆ
jxix
k
Surrogate Models
Interpolations, ensure that the curve fit passes exactly through each data point
Linear, quadratic,…etc
,)( 112
1 cxbxaxf 10 xxx ,)( 22
22 cxbxaxf 21 xxx
Research Approach

Uncertainties Analysis
Hot Part Dimension Prediction
Finite Element Analysis
Part Geometry Cooling Process SimulationForging Process Simulation
Surrogate Models
DOE Extract Responses
Research Approach
Research Approach
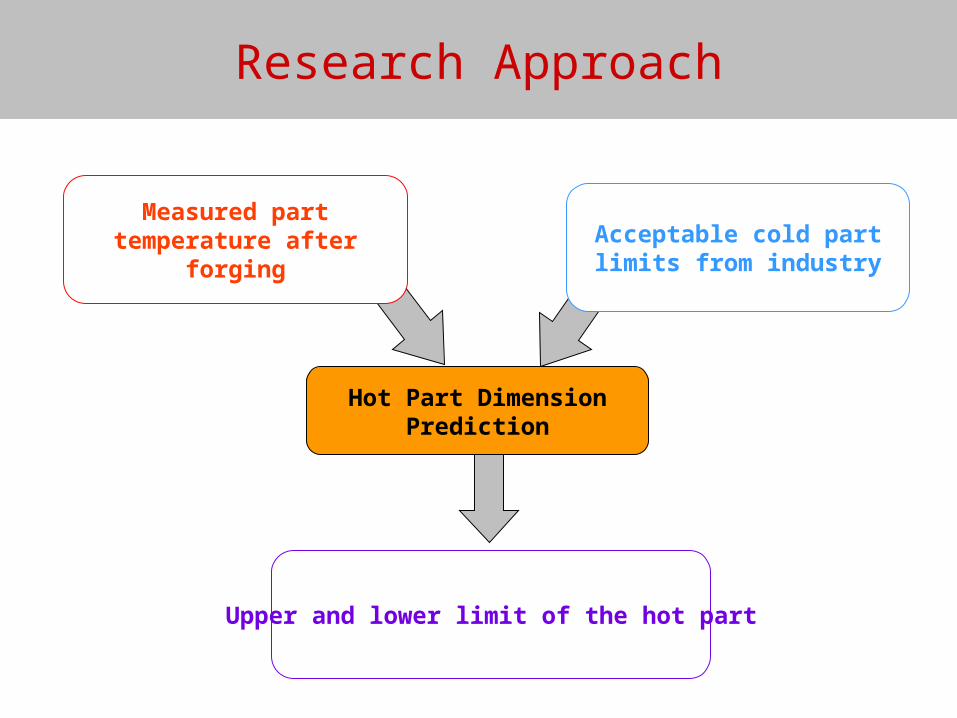
Upper and lower limit of the hot part
Acceptable cold part limits from industry
Measured part temperature after forging
Hot Part Dimension Prediction

Finite Element Analysis
Part Geometry Cooling Process SimulationForging Process Simulation
Uncertainties Analysis
DOE Extract Responses
Research Approach
Surrogate Models
Hot Part Dimension Prediction
Research Approach
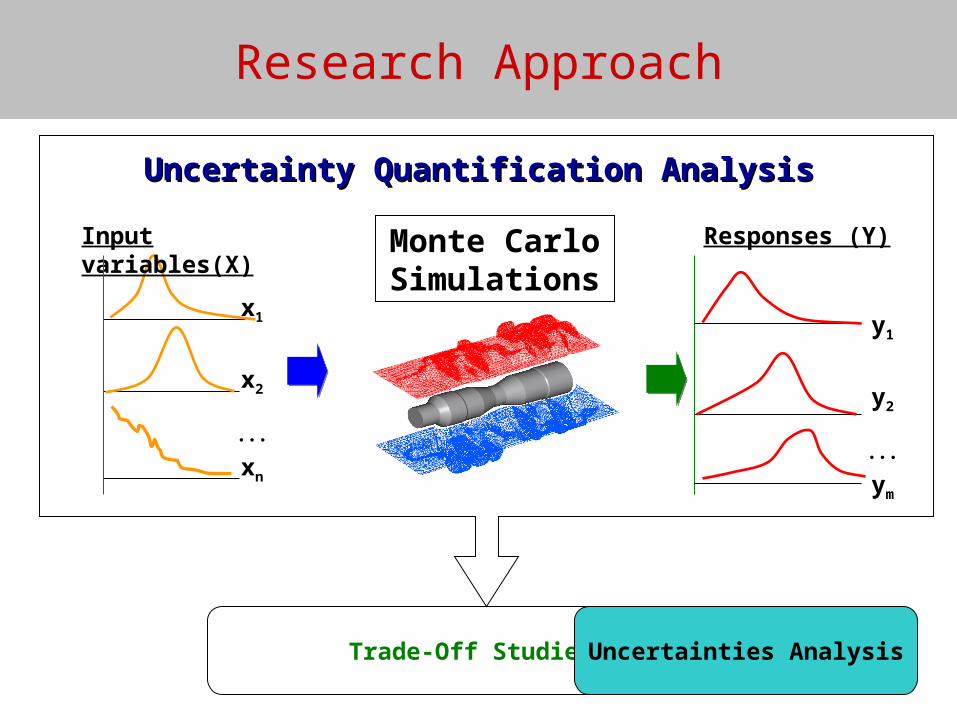
Monte Carlo Simulations
Input variables(X)
x1
x2
xn
Responses (Y)
y1
y2
ym
Uncertainty Quantification AnalysisUncertainty Quantification Analysis
Trade-Off Studies Uncertainties Analysis
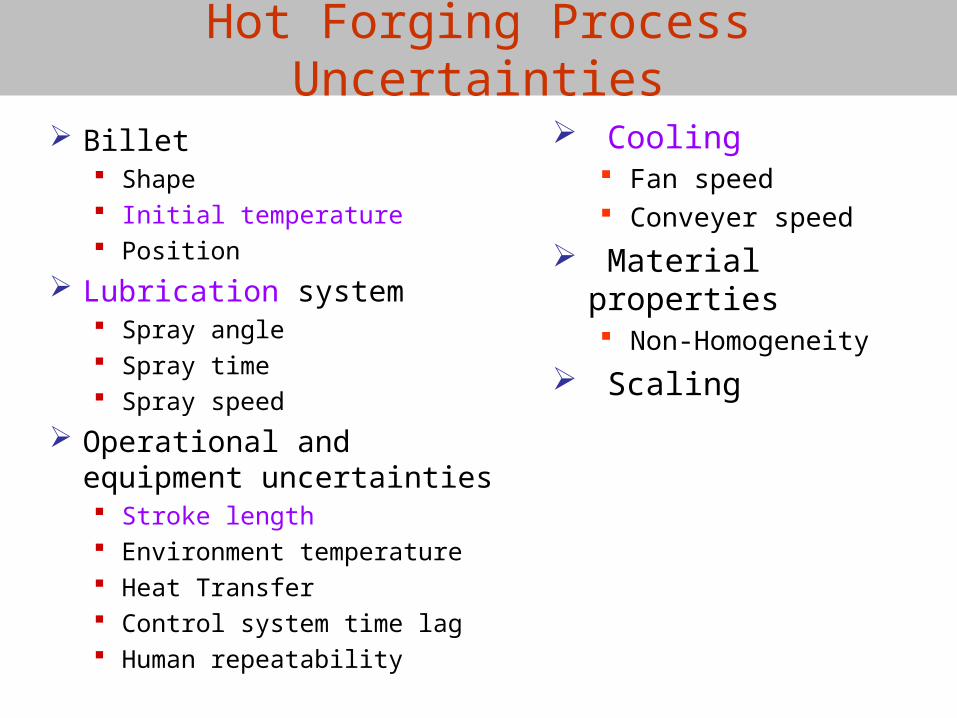
Billet Shape Initial temperature Position
Lubrication system Spray angle Spray time Spray speed
Operational and equipment uncertainties Stroke length Environment temperature Heat Transfer Control system time lag Human repeatability
Cooling Fan speed Conveyer speed
Material properties Non-Homogeneity
Scaling
Hot Forging Process Uncertainties

Stroke
Case Study-I
Metal wheel
Conduct forging and cooling simulations
Check effective stresses
Extract forging load after forging
Determine part dimensions after cooling
Conduct trade-off studies
Finite element model
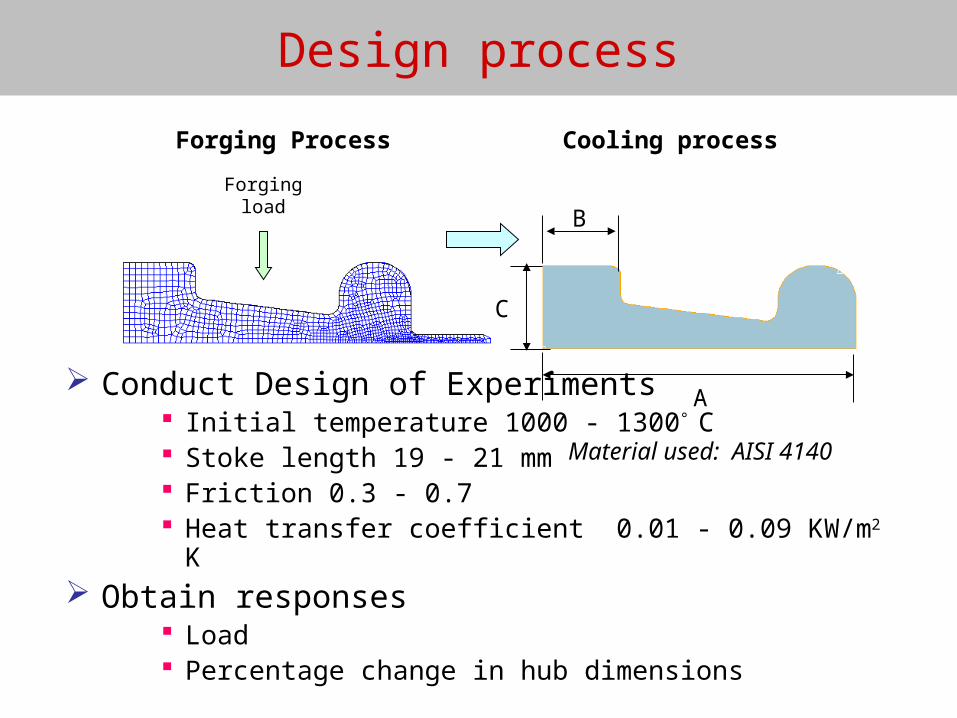
Forging Process Cooling process
Forging load
Conduct Design of Experiments Initial temperature 1000 - 1300° C Stoke length 19 - 21 mm Friction 0.3 - 0.7 Heat transfer coefficient 0.01 - 0.09 KW/m2 K
Obtain responses Load Percentage change in hub dimensions
A
B
C
Material used: AISI 4140
Design process

0.4
0.45
0.5
0.55
0.6
0.65
0.7
0.75
0.8
0 0.02 0.04 0.06 0.08 0.1
Outer Diameter
Hub Diameter
Hub Thickness
Percentage Change in Dimensions
Heat Transfer Coefficient (kW/m2 K)
Dimensional Variation With Cooling Rate
Percentage change
in dimensions Initial dimension – Final Dimension
Initial dimension 100*
Outer Diameter
Hub Diameter
Hub Thickness
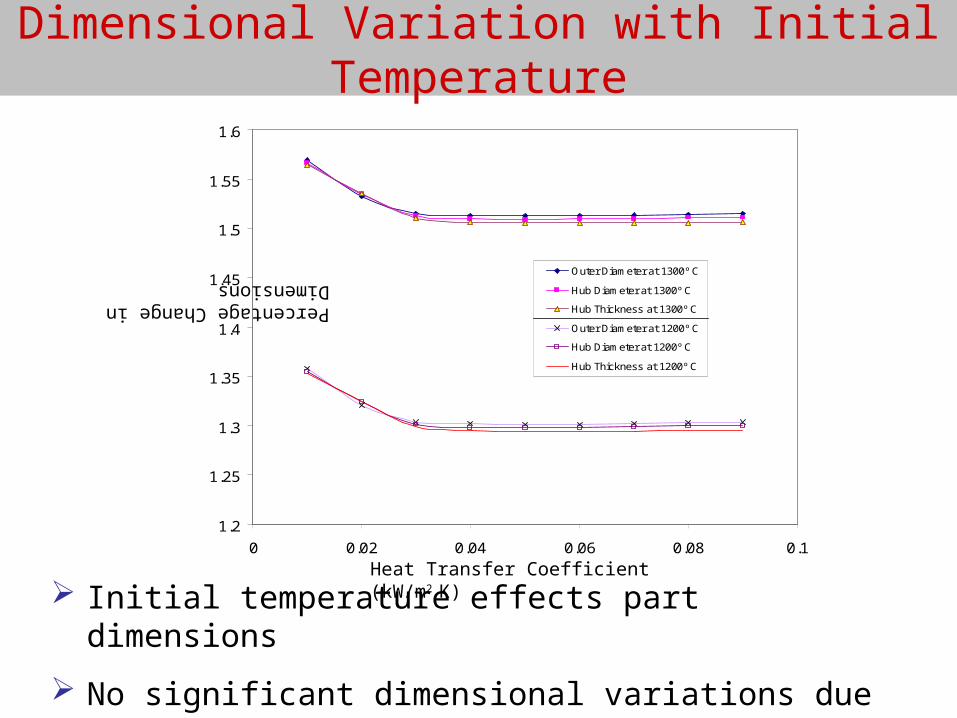
Dimensional Variation with Initial Temperature
1.2
1.25
1.3
1.35
1.4
1.45
1.5
1.55
1.6
0 0.02 0.04 0.06 0.08 0.1
Outer Diameter at 1300º C
Hub Diameter at 1300º C
Hub Thickness at 1300º C
Outer Diameter at 1200º C
Hub Diameter at 1200º C
Hub Thickness at 1200º C
Percentage Change in Dimensions
Heat Transfer Coefficient (kW/m2 K)
Initial temperature effects part dimensions
No significant dimensional variations due to change in cooling rate
-6
-4
-2
0
2
4
6
8
0 0.5 1 1.5 2 2.5 3
Outer diameter
Hub diameter
Hub thickness
Outer diameter
Hub diameter
Hub thickness
Outer diameter
Hub diameter
Hub thickness
+1mm
-1mm
no change
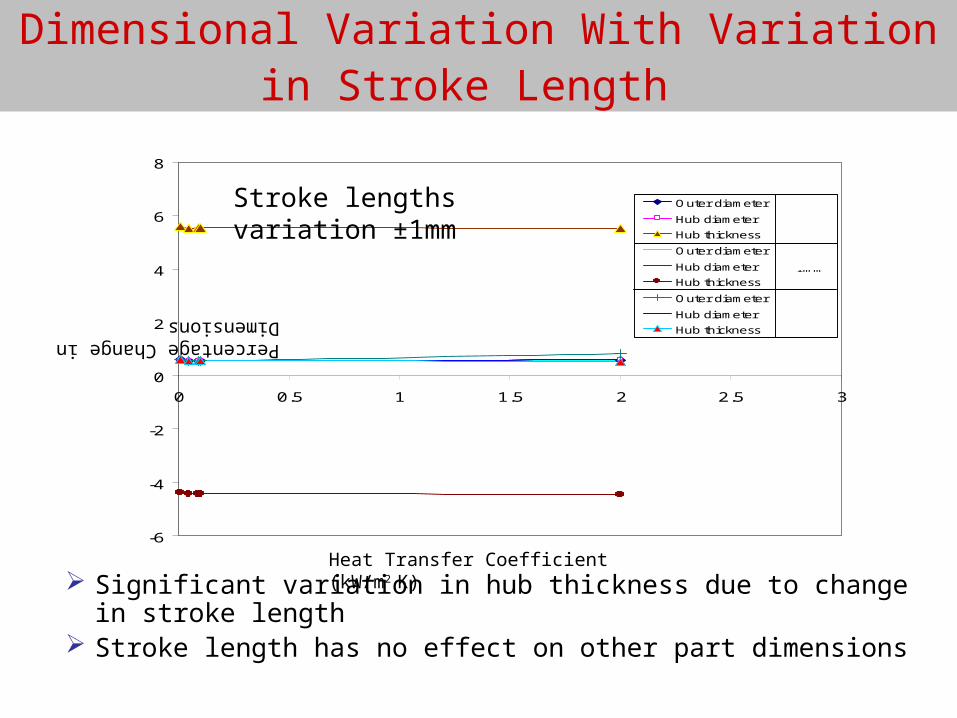
Dimensional Variation With Variation in Stroke Length
Stroke lengths variation ±1mm
Percentage Change in Dimensions
Heat Transfer Coefficient (kW/m2 K)
Significant variation in hub thickness due to change in stroke length
Stroke length has no effect on other part dimensions
-6
-4
-2
0
2
4
6
8
0 0.02 0.04 0.06 0.08 0.1
Hub thickness at 1300º C
Hub thickness at 1200º C
Hub thickness at 1300º C
Hub thickness at 1200º C
Hub thickness at 1300º C
Hub thickness at 1200º C
+1 mm
-1 mm
no change
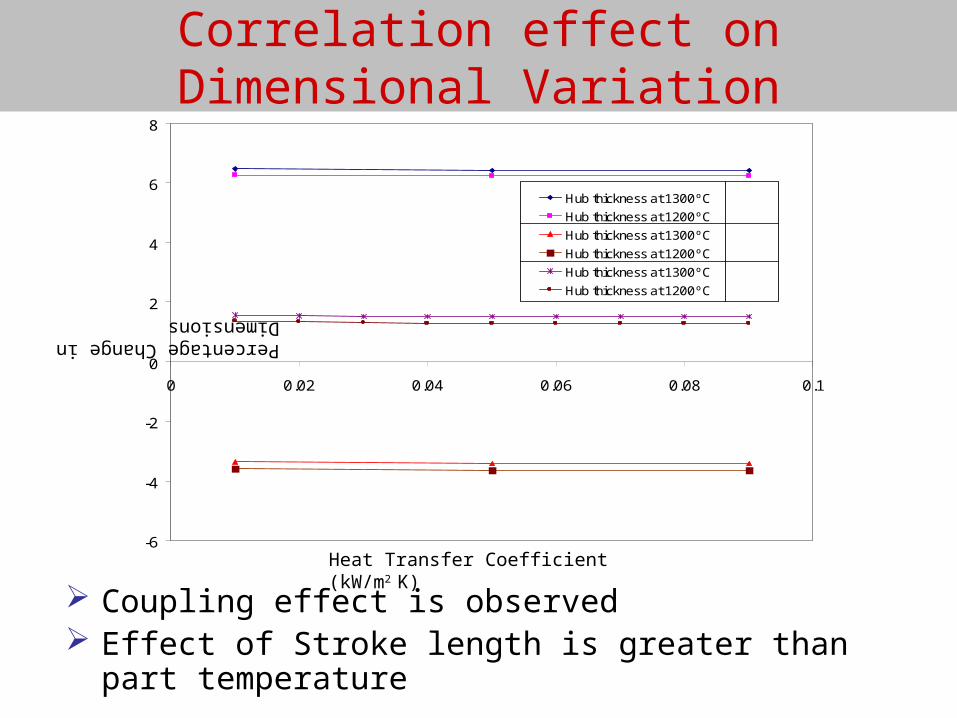
Correlation effect on Dimensional Variation
Percentage Change in Dimensions
Heat Transfer Coefficient (kW/m2 K)
Coupling effect is observed Effect of Stroke length is greater than part temperature
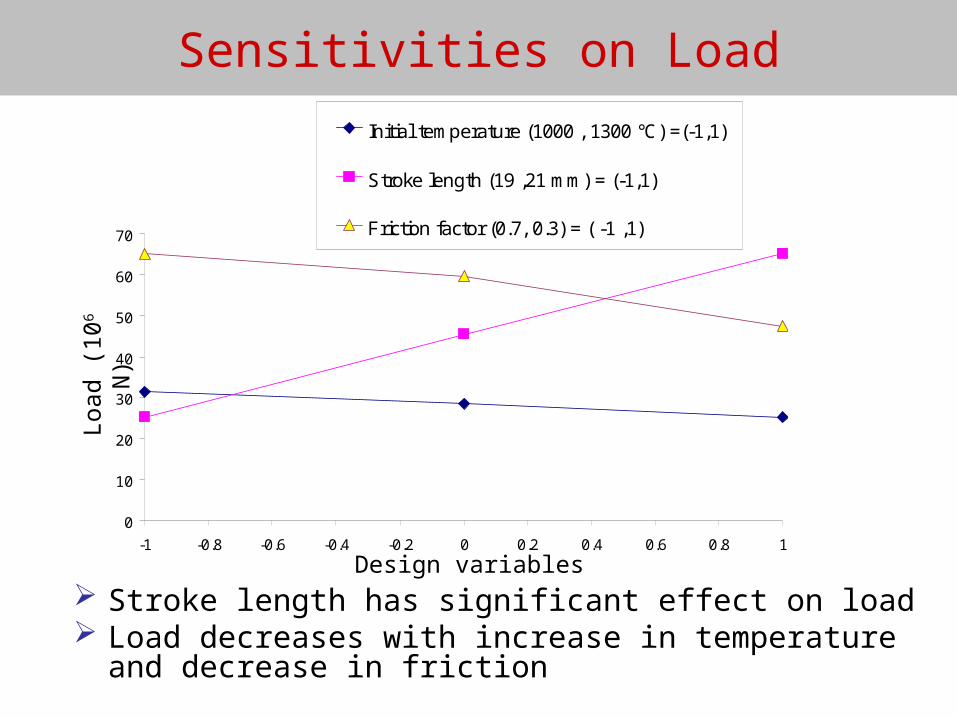
Stroke length has significant effect on load Load decreases with increase in temperature and decrease in
friction
0
10
20
30
40
50
60
70
-1 -0.8 -0.6 -0.4 -0.2 0 0.2 0.4 0.6 0.8 1
Initial temperature (1000 , 1300 °C) =(-1,1)
Stroke length (19 ,21 mm) = (-1,1)
Friction factor (0.7, 0.3) = ( -1 ,1)
Loa
d (1
06 N)
Design variables
Sensitivities on Load
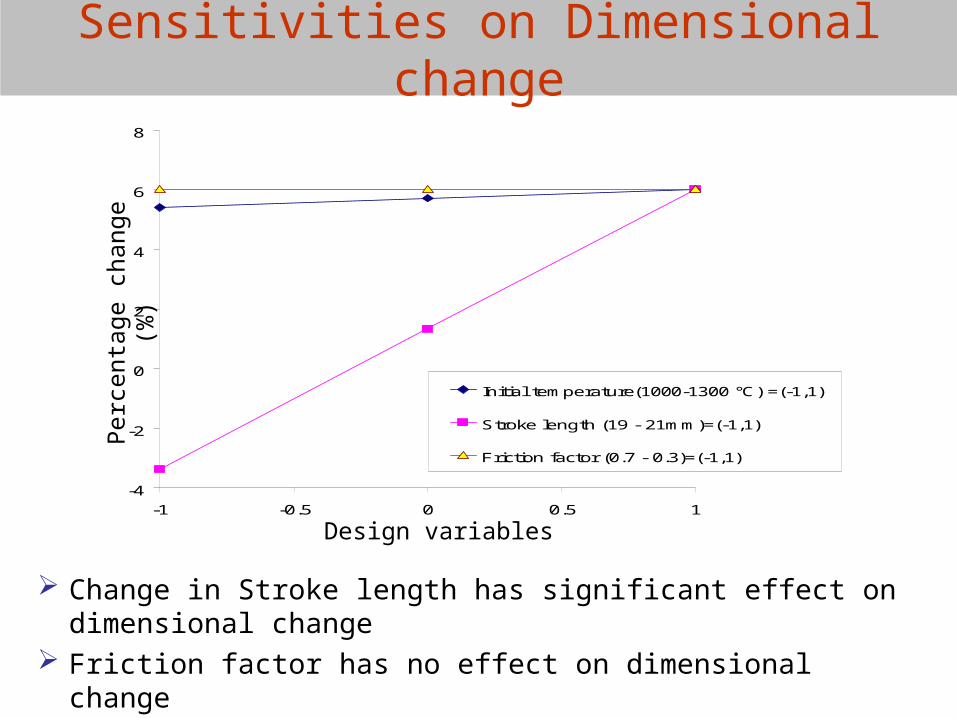
Sensitivities on Dimensional change
Change in Stroke length has significant effect on dimensional change
Friction factor has no effect on dimensional change
-4
-2
0
2
4
6
8
-1 -0.5 0 0.5 1
Initial temperature(1000-1300 °C) =(-1,1)
Stroke length (19 - 21mm)=(-1,1)
Friction factor (0.7 - 0.3)=(-1,1)
Perc
enta
ge c
hang
e (%
)
Design variables
Uncertainty Quantification
Generate Response Surface model
Conduct Monte Carlo simulations
Input variables have normal distribution
Plot Probability Density Function (PDF)
Undersize parts are rejected
Oversize parts are machined
0
0.01
0.02
0.03
0.04
0.05
0.06
0.07
-3.3
9
-3.2
1
-3.0
2
-2.8
3
-2.6
5
-2.4
6
-2.2
8
-2.0
9
-1.9
0
-1.7
2
-1.5
3
-1.3
4
-1.1
6
-0.9
7
-0.7
9
-0.6
0
-0.4
1
-0.2
3
Mor
e
oversized parts
0
0.01
0.02
0.03
0.04
0.05
0.06
-1.7
9
-1.6
0
-1.4
0
-1.2
1
-1.0
1
-0.8
2
-0.6
2
-0.4
3
-0.2
3
-0.0
4
0.16
0.35
0.55
0.74
0.94
1.13
1.33
1.52
Mor
e
undersized parts
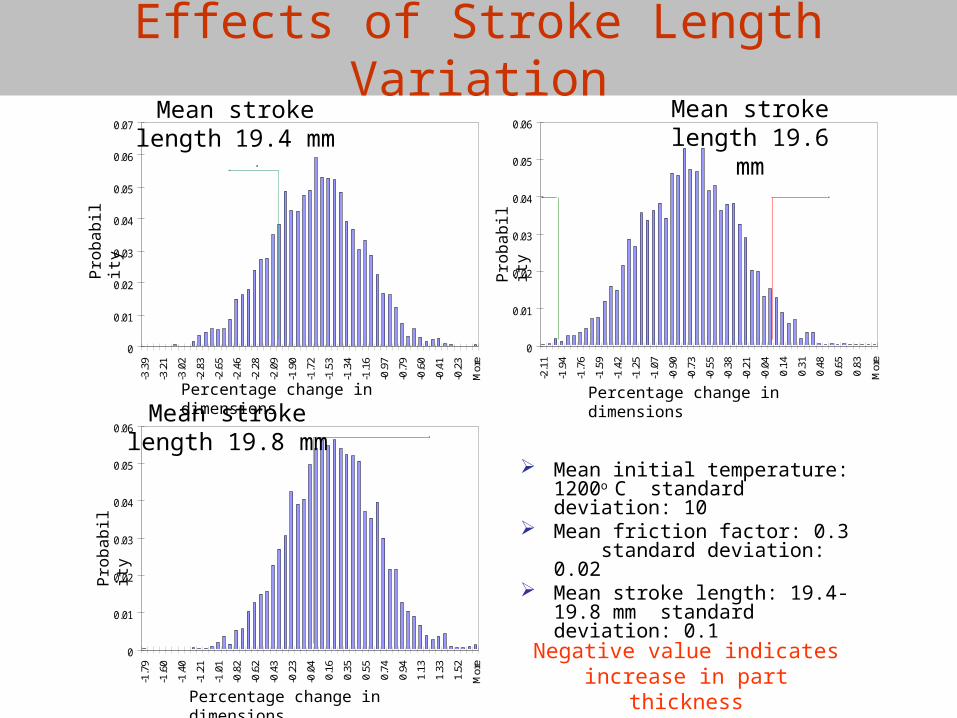
Effects of Stroke Length Variation
Mean initial temperature: 1200o C standard deviation: 10
Mean friction factor: 0.3 standard deviation: 0.02
Mean stroke length: 19.4-19.8 mm standard deviation: 0.1
0
0.01
0.02
0.03
0.04
0.05
0.06
-2.1
1
-1.9
4
-1.7
6
-1.5
9
-1.4
2
-1.2
5
-1.0
7
-0.9
0
-0.7
3
-0.5
5
-0.3
8
-0.2
1
-0.0
4
0.14
0.31
0.48
0.65
0.83
Mor
e
undersized partsoversized parts
Mean stroke length 19.4 mm
Mean stroke length 19.6 mm
Mean stroke length 19.8 mm
Negative value indicates increase in part thickness
Pro
ba
bili
ty
Percentage change in dimensions
Pro
ba
bili
ty
Percentage change in dimensions
Pro
ba
bili
ty
Percentage change in dimensions
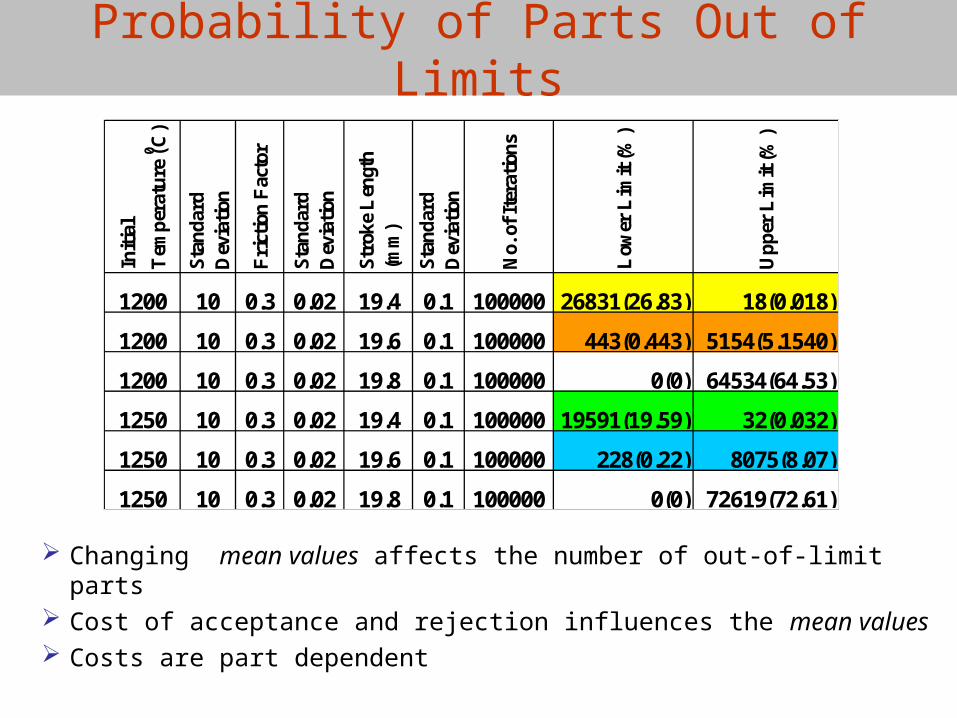
Probability of Parts Out of Limits
Changing mean values affects the number of out-of-limit parts Cost of acceptance and rejection influences the mean values Costs are part dependent
Init
ial
Tem
per
atu
re (0 C
)
Sta
nd
ard
D
evia
tion
Fri
ctio
n F
acto
r
Sta
nd
ard
D
evia
tion
Str
oke
Len
gth
(m
m)
Sta
nd
ard
D
evia
tion
No.
of
Iter
atio
ns
Low
er L
imit
(%
)
Up
per
Lim
it (
%)
1200 10 0.3 0.02 19.4 0.1 100000 26831(26.83) 18(0.018)
1200 10 0.3 0.02 19.6 0.1 100000 443(0.443) 5154(5.1540)
1200 10 0.3 0.02 19.8 0.1 100000 0(0) 64534(64.53)
1250 10 0.3 0.02 19.4 0.1 100000 19591(19.59) 32(0.032)
1250 10 0.3 0.02 19.6 0.1 100000 228(0.22) 8075(8.07)
1250 10 0.3 0.02 19.8 0.1 100000 0(0) 72619(72.61)
Case II
Model Metaldyne hub front axle (part no. 4638)
Conduct sensitivity of cold part dimensions in the cooling process
Initial temperature
Dimensional variation during forging
Develop a mathematical model representing the cooling process
Determine acceptable hot part dimensions before cooling for TIG
Aids in better quality control
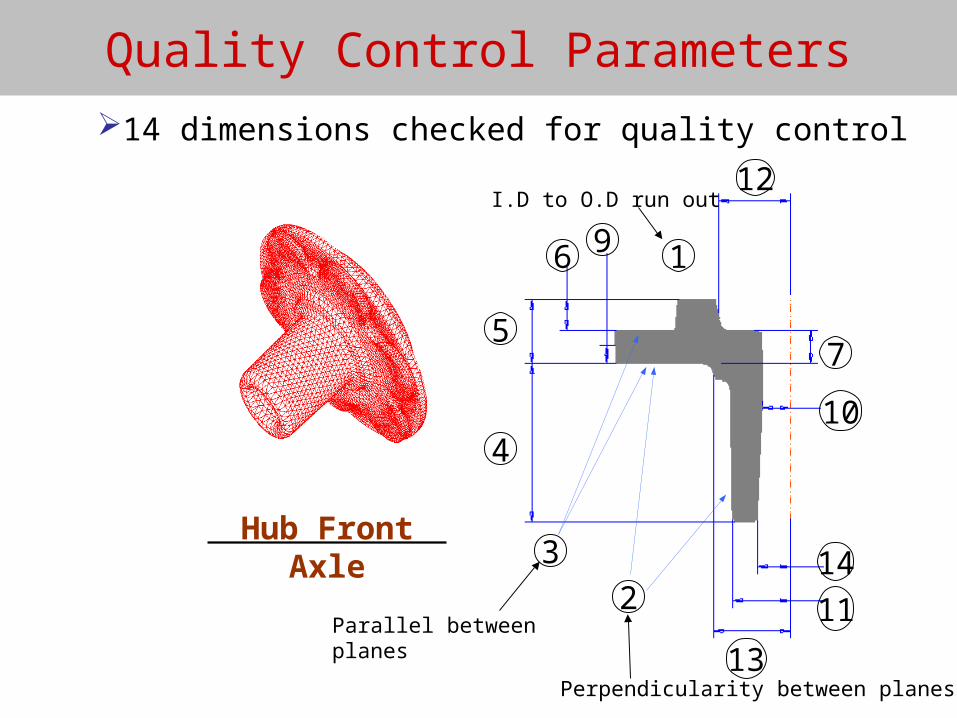
Quality Control Parameters
Hub Front Axle
Parallel between planes
1
I.D to O.D run out
Perpendicularity between planes
4
5
6
7
10
11
12
13
14
9
2
3
14 dimensions checked for quality control
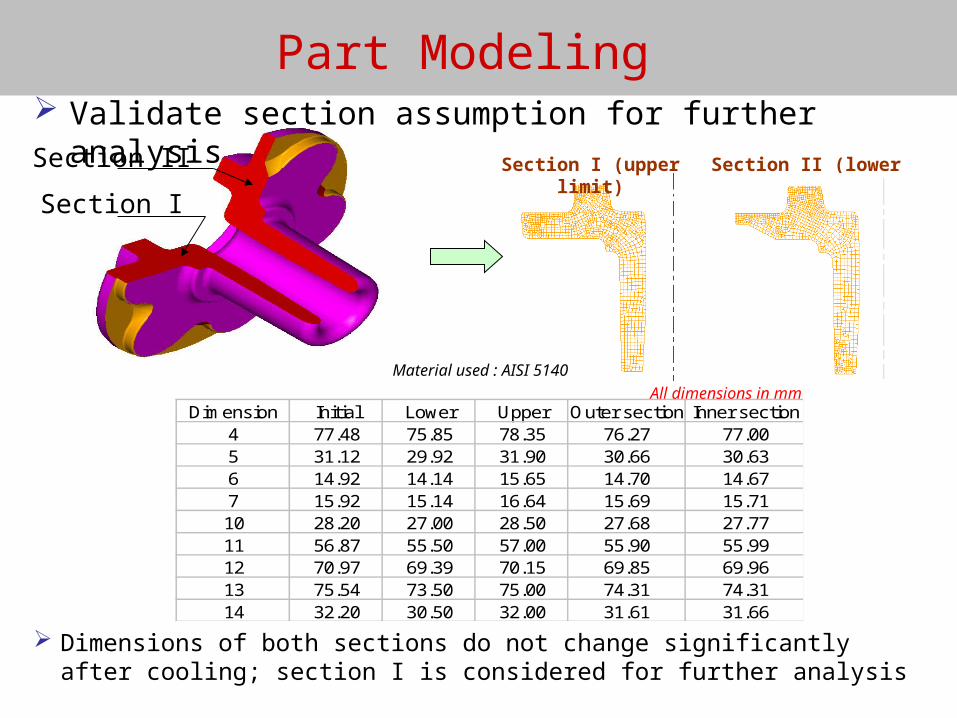
Part Modeling
Section I (upper limit) Section II (lower limit)
Dimension Initial Lower Upper Outer section Inner section4 77.48 75.85 78.35 76.27 77.005 31.12 29.92 31.90 30.66 30.636 14.92 14.14 15.65 14.70 14.677 15.92 15.14 16.64 15.69 15.7110 28.20 27.00 28.50 27.68 27.7711 56.87 55.50 57.00 55.90 55.9912 70.97 69.39 70.15 69.85 69.9613 75.54 73.50 75.00 74.31 74.3114 32.20 30.50 32.00 31.61 31.66
Section II
Section I
Dimensions of both sections do not change significantly after cooling; section I is considered for further analysis
All dimensions in mm
Material used : AISI 5140
Validate section assumption for further analysis
Location - 2
Location -3
Location - 1
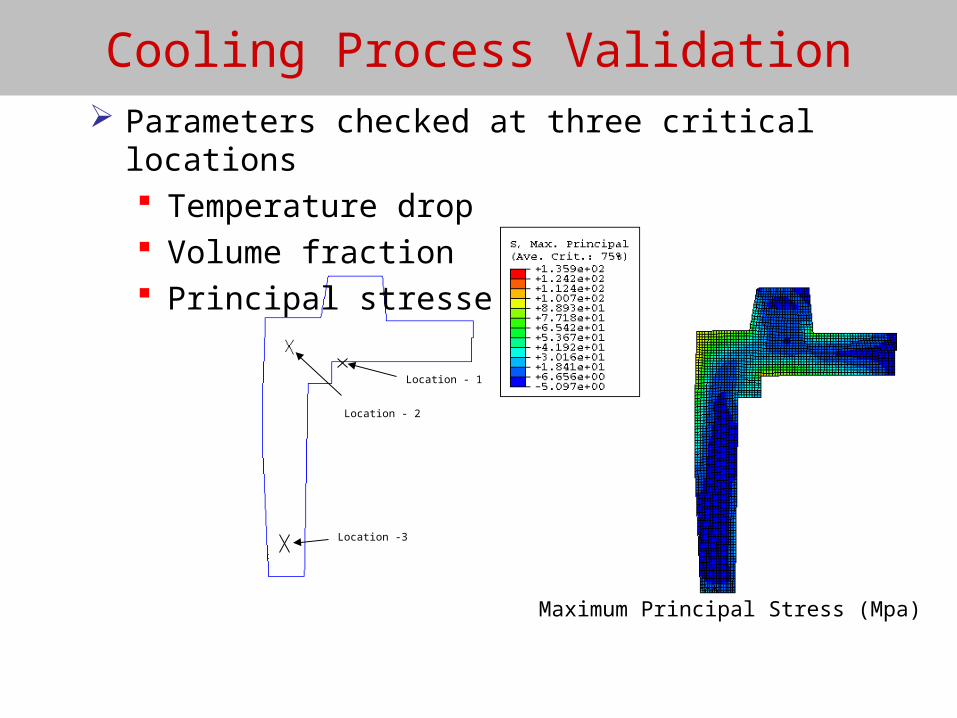
Parameters checked at three critical locations Temperature drop Volume fraction Principal stresses
Cooling Process Validation
Maximum Principal Stress (Mpa)
Point 1
0
0.2
0.4
0.6
0.8
1
1.2
0 200 400 600 800 1000 1200 1400
AC-AustiniteAC-Ferrite & PearliteAC-BainiteAC-Quenched MartensiteAC-Pearlite
Vol
ume
Fra
ctio
n
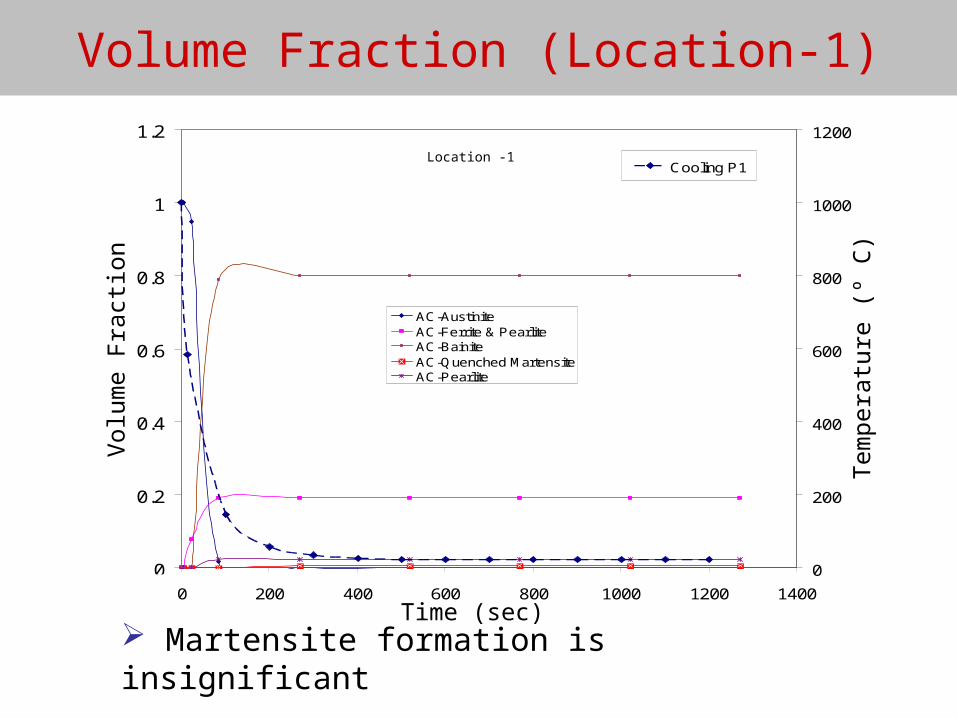
Volume Fraction (Location-1)
Location -1
Martensite formation is insignificant
0
200
400
600
800
1000
1200
0 200 400 600 800 1000 1200 1400
Cooling P1
Time (sec)
Tem
pera
ture
(º
C)
0
0.2
0.4
0.6
0.8
1
1.2
0 200 400 600 800 1000 1200 1400
AC-Austinite
AC-Ferrite & Pearlite
AC-Bainite
AC-Quenched Martensite
AC-Pearlite
Vol
ume
Fra
ctio
n
0
200
400
600
800
1000
1200
0 200 400 600 800 1000 1200 1400 1600 1800
Cooling P2
Time (sec)
Tem
pera
ture
(°
C)
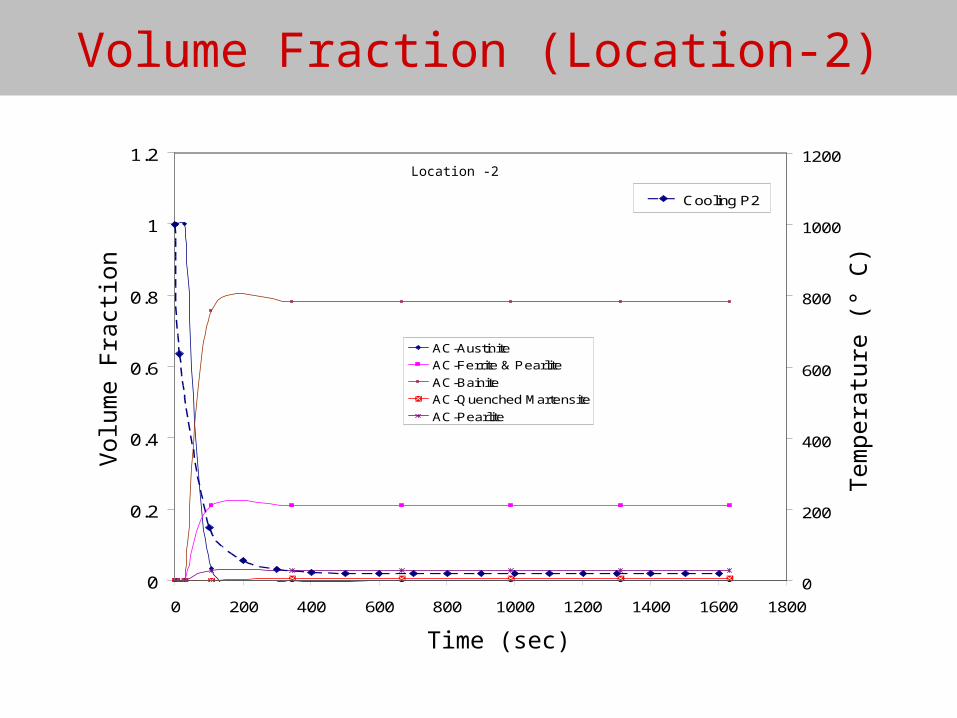
Volume Fraction (Location-2)
Location -2
Point 3
0
0.2
0.4
0.6
0.8
1
1.2
0 200 400 600 800 1000 1200 1400
AC-Austinite
AC-Ferrite & Pearlite
AC-BainiteAC-Quenched Martensite
AC-Pearlite
Vol
ume
Fra
ctio
n
0
200
400
600
800
1000
1200
0 200 400 600 800 1000 1200 1400
Cooling P3
Time (sec)
Tem
pera
ture
(°
C)
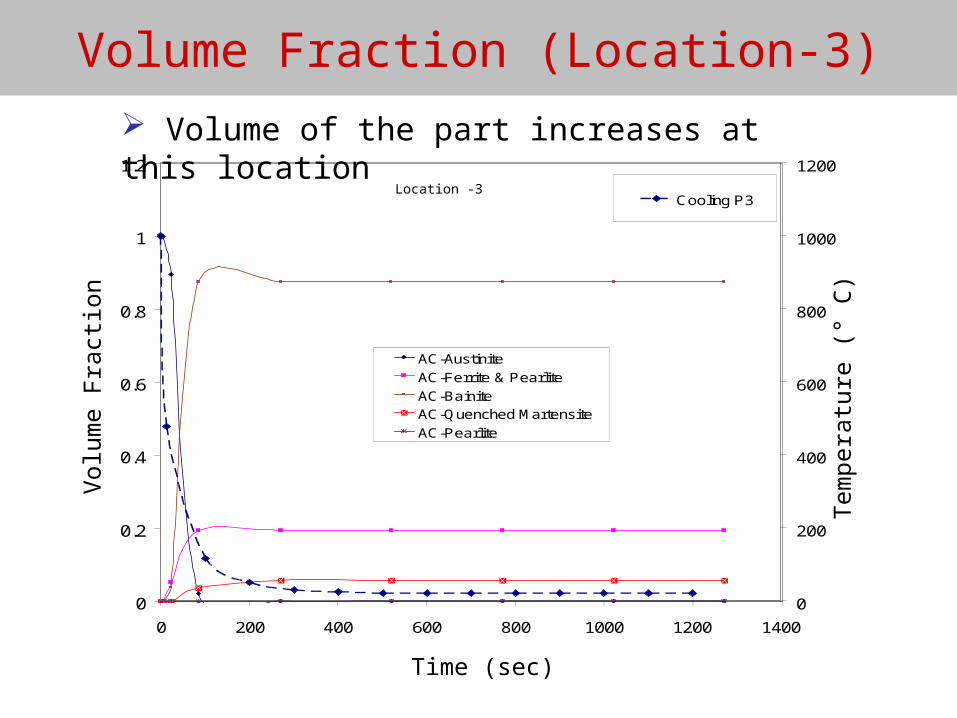
Volume Fraction (Location-3)
Location -3
Volume of the part increases at this location
-40
-20
0
20
40
60
80
100
120
140
0 200 400 600 800 1000 1200 1400
AC-1000-P1
AC-1000-P2
AC-1000-P3
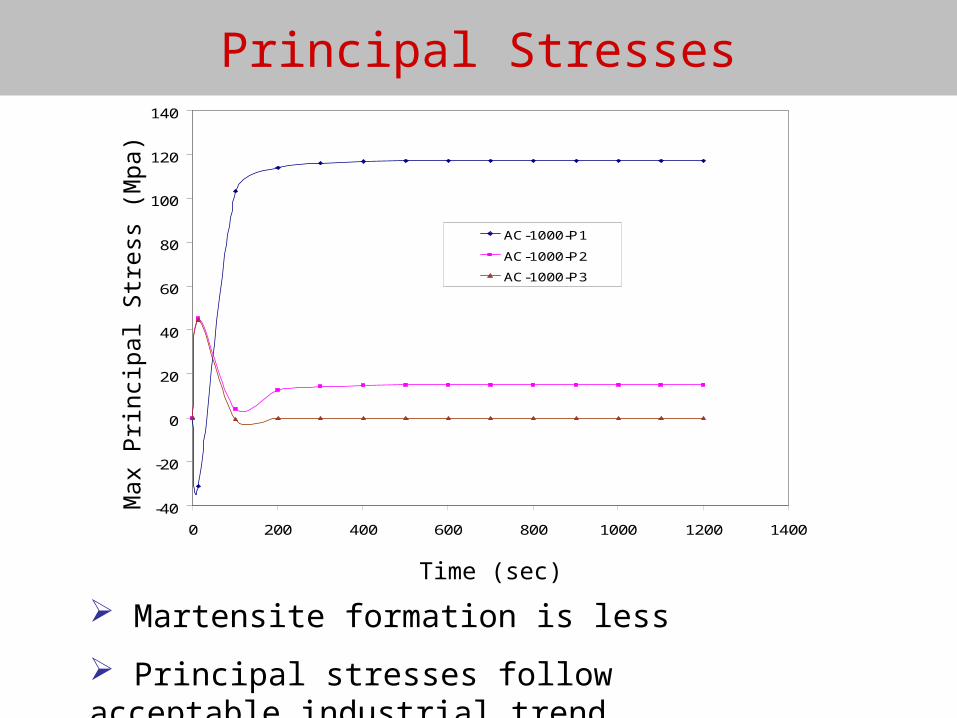
Principal Stresses
Time (sec)
Max
Prin
cipa
l Str
ess
(Mpa
)
Martensite formation is less
Principal stresses follow acceptable industrial trend
Development of Dimension Estimator
Conduct Design Of Experiments
Compute percentage change in final cold part dimensions as
responses
Determine correlation effect of process variables to obtain
number of parameters for the surrogate model
Spline fit DOE data to obtain surrogate model
Surrogate model predicts acceptable hot part dimensional limits
Validate predicted dimensions
D10 Plotted Dimension0
0.2
0.4
0.6
0.8
1
1.2
1.4
1.6
1.8
2
1 3 5 7 9 11 13
1200º C 1000º C 800º C
Design Of Experiments
Per
cen
tag
e C
han
ge in
Dim
ensi
ons
(D10
)
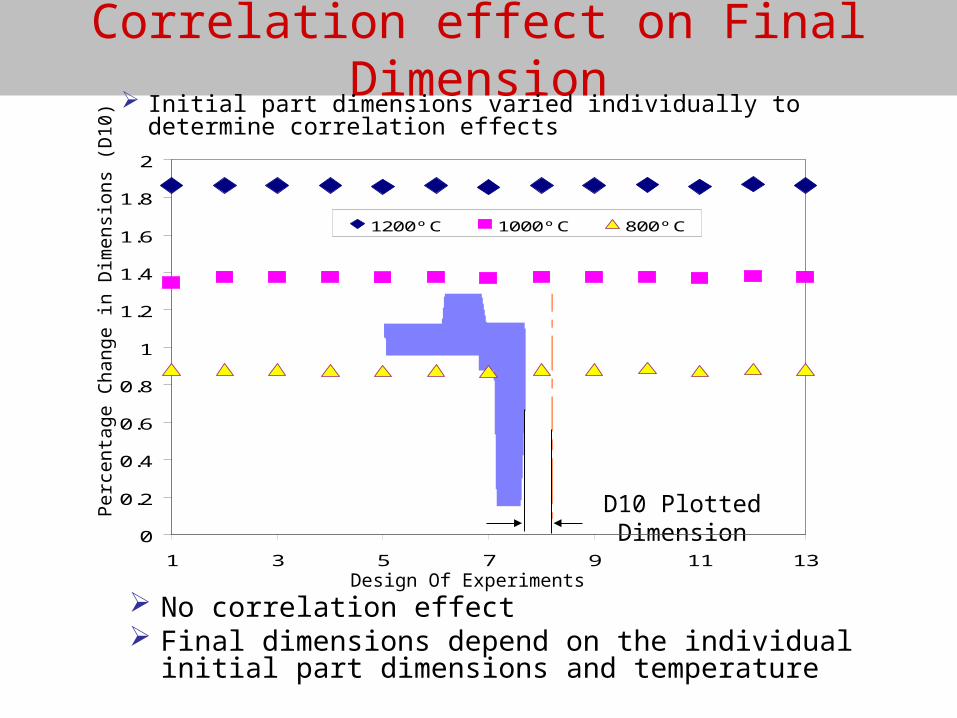
Correlation effect on Final Dimension
No correlation effect Final dimensions depend on the individual initial part
dimensions and temperature
Initial part dimensions varied individually to determine correlation effects
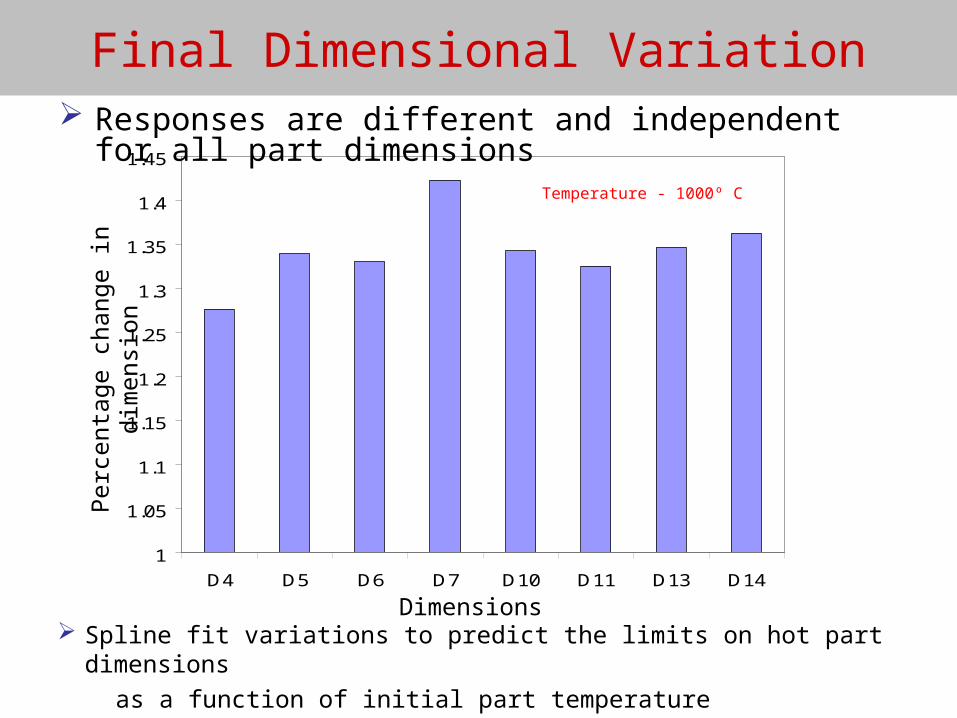
Final Dimensional Variation
Spline fit variations to predict the limits on hot part dimensions
as a function of initial part temperature
1
1.05
1.1
1.15
1.2
1.25
1.3
1.35
1.4
1.45
D4 D5 D6 D7 D10 D11 D13 D14
Dimensions
Per
cent
age
chan
ge in
dim
ensi
on
Temperature - 1000º C
Responses are different and independent for all part dimensions
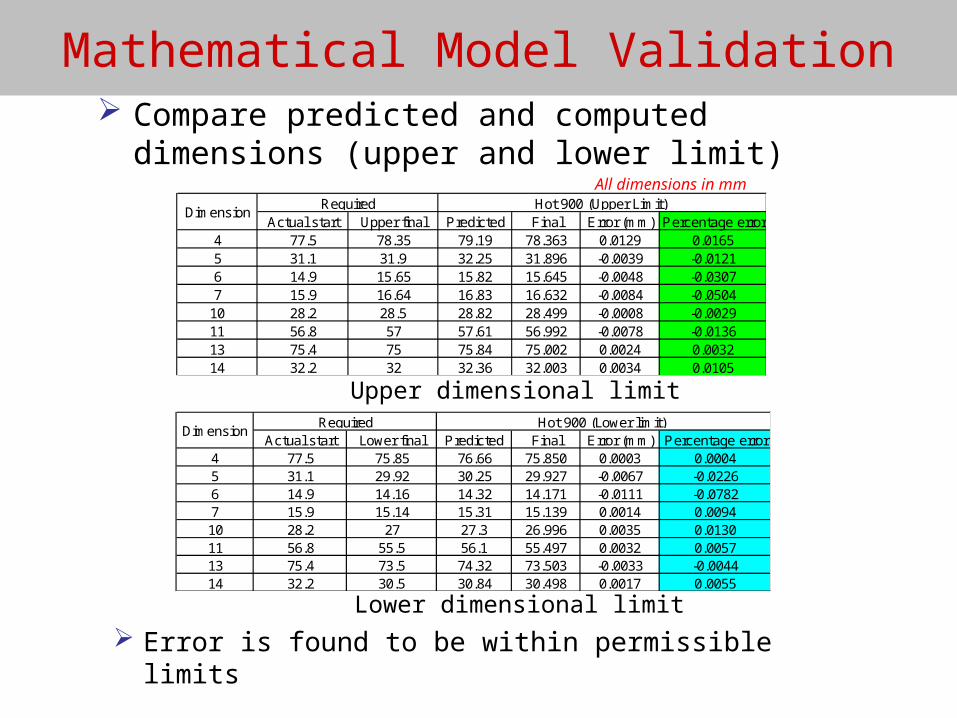
Mathematical Model Validation Compare predicted and computed dimensions (upper
and lower limit)
Actual start Upper final Predicted Final Error (mm) Percentage error4 77.5 78.35 79.19 78.363 0.0129 0.01655 31.1 31.9 32.25 31.896 -0.0039 -0.01216 14.9 15.65 15.82 15.645 -0.0048 -0.03077 15.9 16.64 16.83 16.632 -0.0084 -0.0504
10 28.2 28.5 28.82 28.499 -0.0008 -0.002911 56.8 57 57.61 56.992 -0.0078 -0.013613 75.4 75 75.84 75.002 0.0024 0.003214 32.2 32 32.36 32.003 0.0034 0.0105
RequiredDimension
Hot 900 (Upper Limit)
Actual start Lower final Predicted Final Error (mm) Percentage error4 77.5 75.85 76.66 75.850 0.0003 0.00045 31.1 29.92 30.25 29.927 -0.0067 -0.02266 14.9 14.16 14.32 14.171 -0.0111 -0.07827 15.9 15.14 15.31 15.139 0.0014 0.009410 28.2 27 27.3 26.996 0.0035 0.013011 56.8 55.5 56.1 55.497 0.0032 0.005713 75.4 73.5 74.32 73.503 -0.0033 -0.004414 32.2 30.5 30.84 30.498 0.0017 0.0055
Hot 900 (Lower limit) RequiredDimension
All dimensions in mm
Upper dimensional limit
Lower dimensional limit
Error is found to be within permissible limits
Summary
Quantified forging/cooling process uncertainties
Investigated trade-off studies to improve process design
Developed surrogate model to predict hot part dimensional
limit for various input temperature
Incorporated hot part dimension predictor into TIG
Reduced part rejection rate during forging

Any questions ???

Thank you
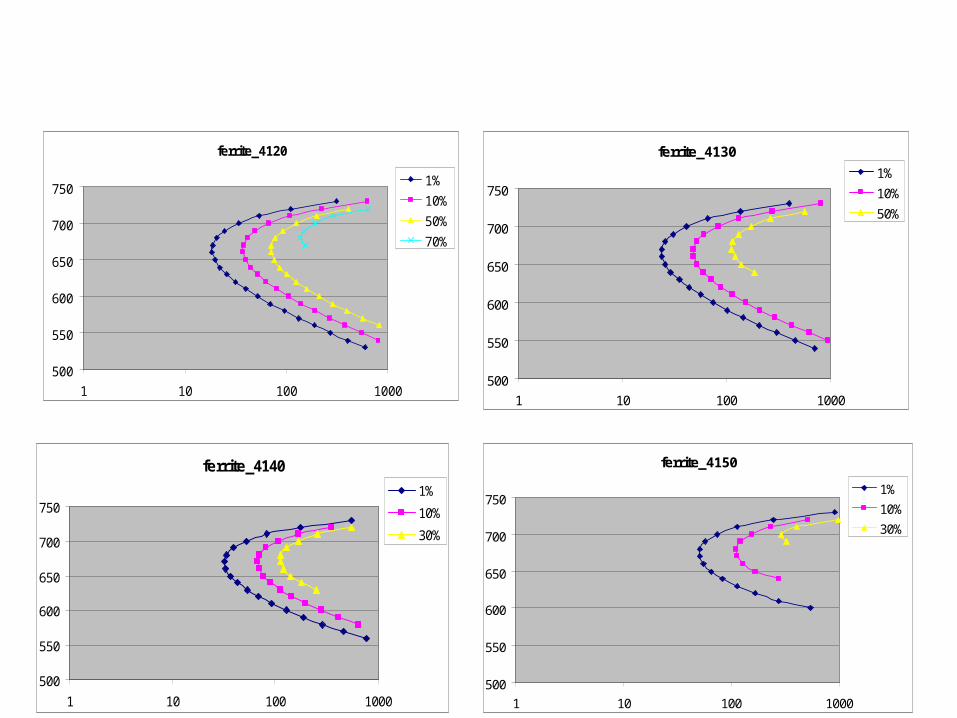
ferrite_4120
500
550
600
650
700
750
1 10 100 1000
1%
10%
50%
70%
ferrite_4140
500
550
600
650
700
750
1 10 100 1000
1%
10%
30%
ferrite_4150
500
550
600
650
700
750
1 10 100 1000
1%
10%
30%
ferrite_4130
500
550
600
650
700
750
1 10 100 1000
1%
10%
50%
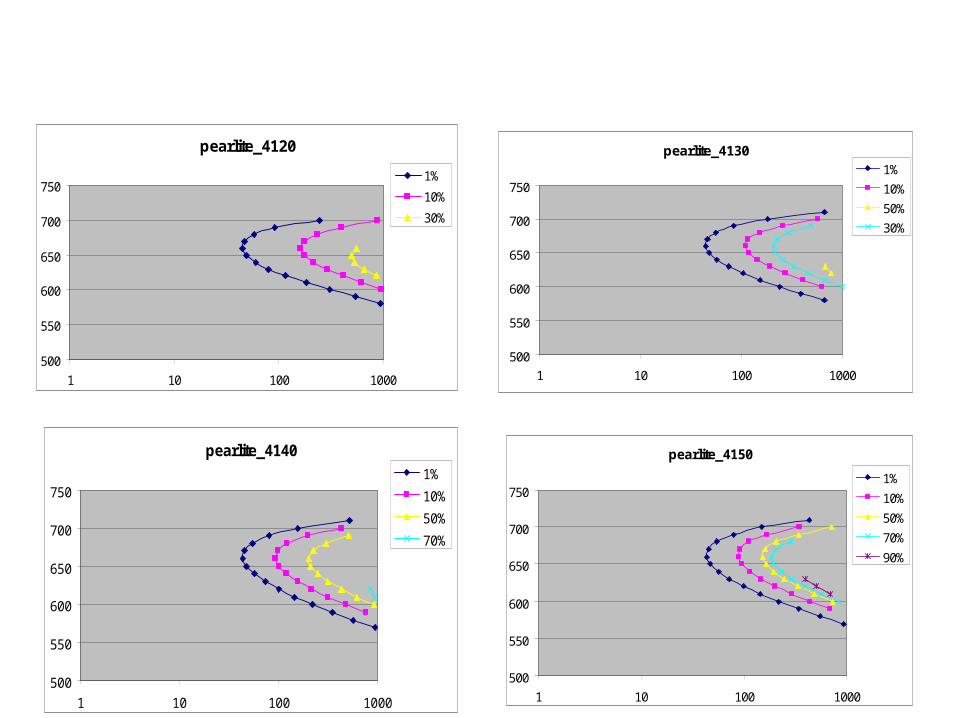
pearlite_4120
500
550
600
650
700
750
1 10 100 1000
1%
10%
30%
pearlite_4140
500
550
600
650
700
750
1 10 100 1000
1%
10%
50%
70%
pearlite_4150
500
550
600
650
700
750
1 10 100 1000
1%
10%
50%
70%
90%
pearlite_4130
500
550
600
650
700
750
1 10 100 1000
1%
10%
50%
30%
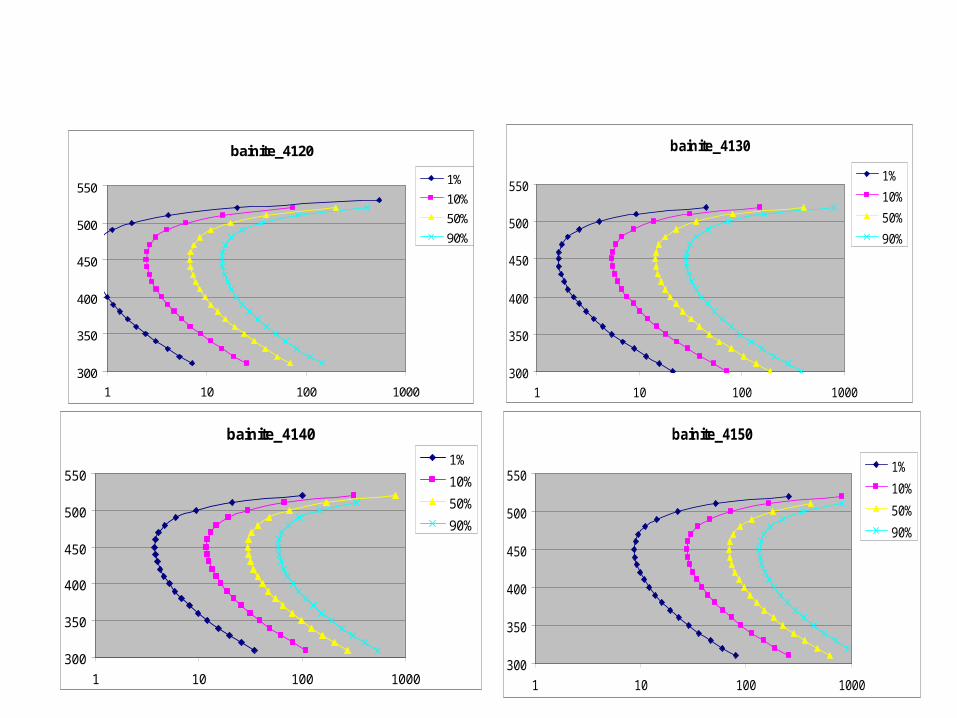
bainite_4140
300
350
400
450
500
550
1 10 100 1000
1%
10%
50%
90%
bainite_4150
300
350
400
450
500
550
1 10 100 1000
1%
10%
50%
90%
bainite_4130
300
350
400
450
500
550
1 10 100 1000
1%
10%
50%
90%
bainite_4120
300
350
400
450
500
550
1 10 100 1000
1%
10%
50%
90%
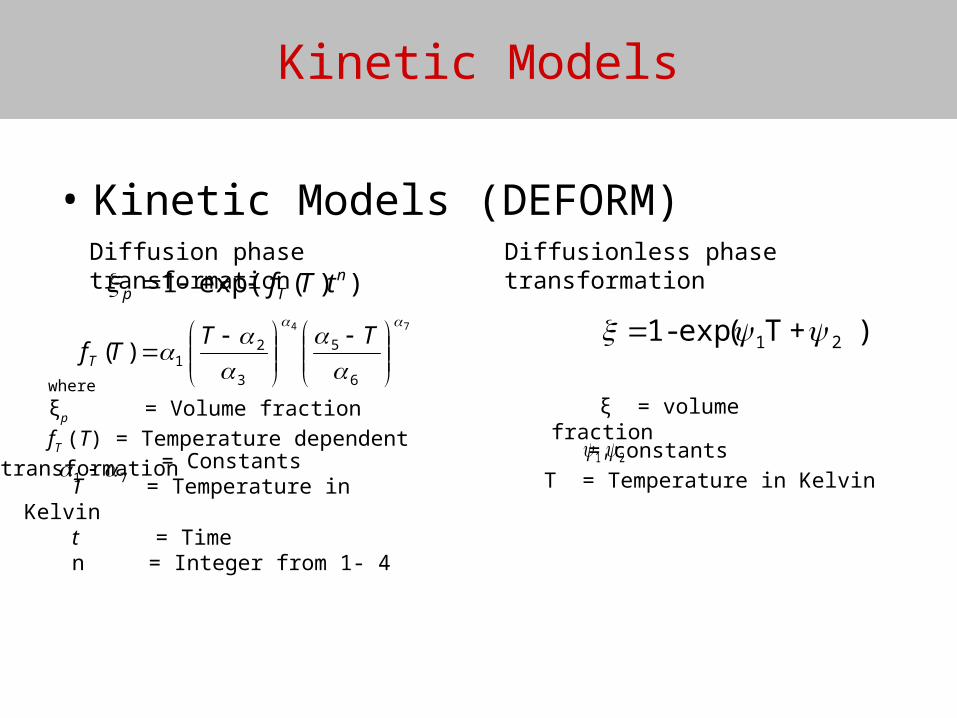
Kinetic Models
• Kinetic Models (DEFORM)
) + T( exp -1 21
where
ξp = Volume fraction
fT (T) = Temperature dependent
transformation
))(exp(1 nTp tTf
= ConstantsT = Temperature in
Kelvint = Time n = Integer from 1- 4
7 1
74
6
5
3
2 1)(
TTTfT
ξ = volume fraction
, 21 = constants
T = Temperature in Kelvin
Diffusion phase transformation Diffusionless phase transformation
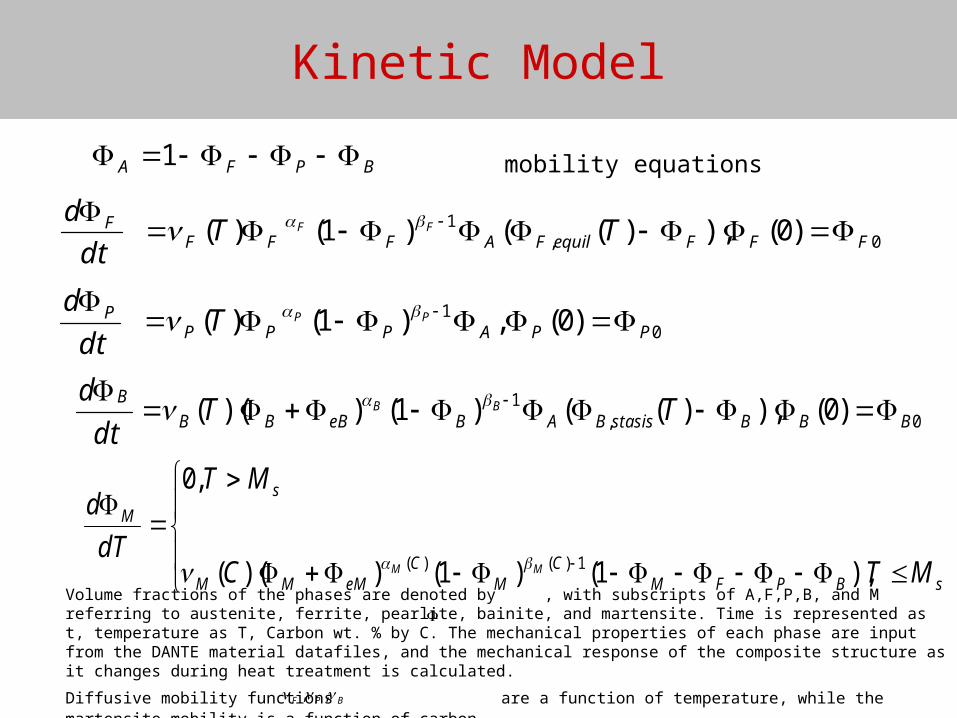
Kinetic Model
BPFA 1
0,1 )0(),)(()1()( FFFequilFAFFF
F TTdt
dFF
01 )0(,)1()( PPAPPP
P PPTdt
d
0,1 )0(),)(()1())(( BBBstasisBABeBBB
BTT
dt
dBB
sBPFM
CM
CeMMM
s
M
MTC
MT
dT
d
MM ),1()1())((
,0
1)()( Volume fractions of the phases are denoted by , with subscripts of A,F,P,B, and M referring to austenite, ferrite, pearlite, bainite, and martensite. Time is represented as t, temperature as T, Carbon wt. % by C. The mechanical properties of each phase are input from the DANTE material datafiles, and the mechanical response of the composite structure as it changes during heat treatment is calculated.
Diffusive mobility functions are a function of temperature, while the martensite mobility is a function of carbon.
BPF ,,
mobility equations
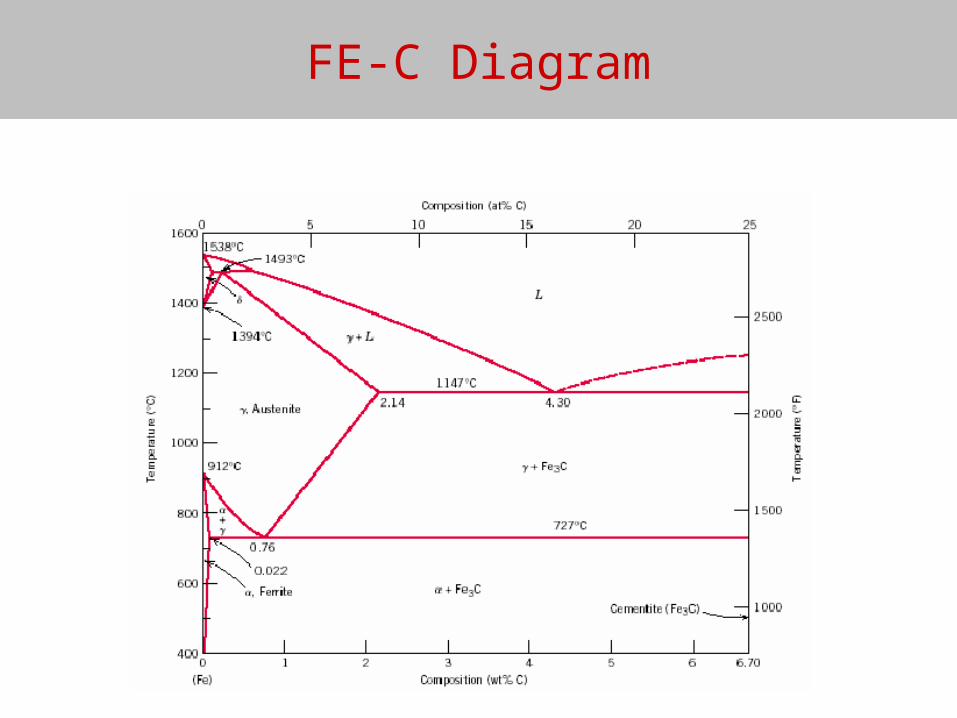
FE-C Diagram

Temperature distribution Effective stress
Heat transfer coefficient 0.05 KW/m2 K
Point locations
Output Parameters
0
100
200
300
400
500
600
700
800
900
0 500 1000 1500 2000
Point 1
Point 2
Point 3
Point 4
Time (sec)
Temperature ( o C)
0
50
100
150
200
250
0 500 1000 1500 2000 2500
Point 1Point 2
Point 3Point 4
Time (sec)
Effective Stress ( MPa )
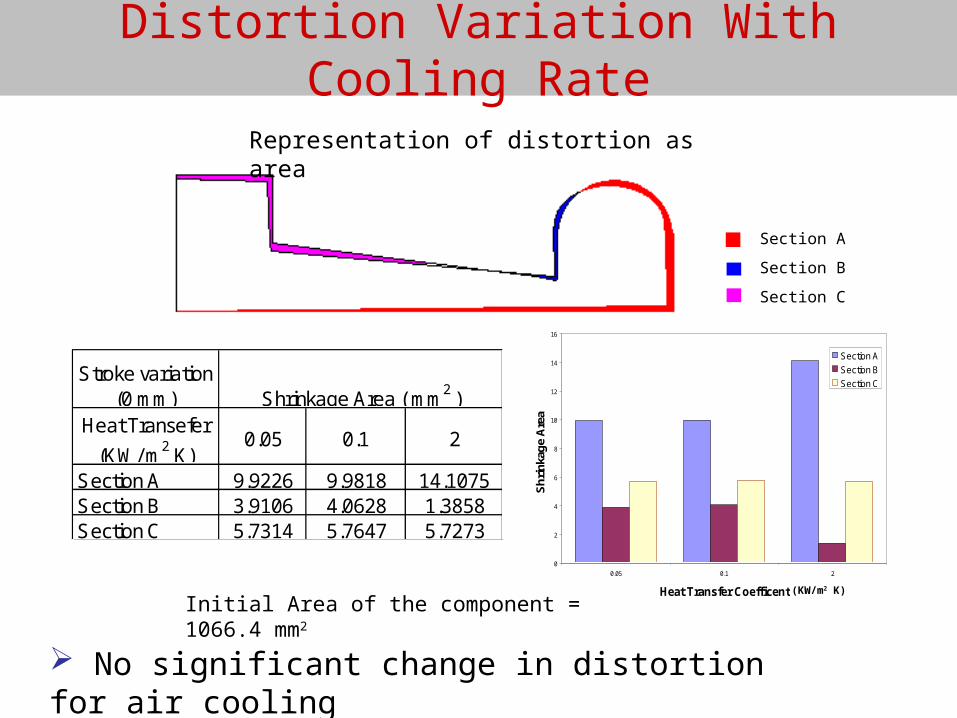
Section A
Section B
Section C
Initial Area of the component = 1066.4 mm2
Stroke variation (0 mm)
Heat Transefer
(KW/ m2 K)0.05 0.1 2
Section A 9.9226 9.9818 14.1075Section B 3.9106 4.0628 1.3858Section C 5.7314 5.7647 5.7273
Shrinkage Area ( mm2 )
0
2
4
6
8
10
12
14
16
0.05 0.1 2
Heat Transfer Coefficent
Sh
rin
kag
e A
rea
Section A
Section B
Section C
(KW/m2 K)
Distortion Variation With Cooling Rate
Representation of distortion as area
No significant change in distortion for air cooling
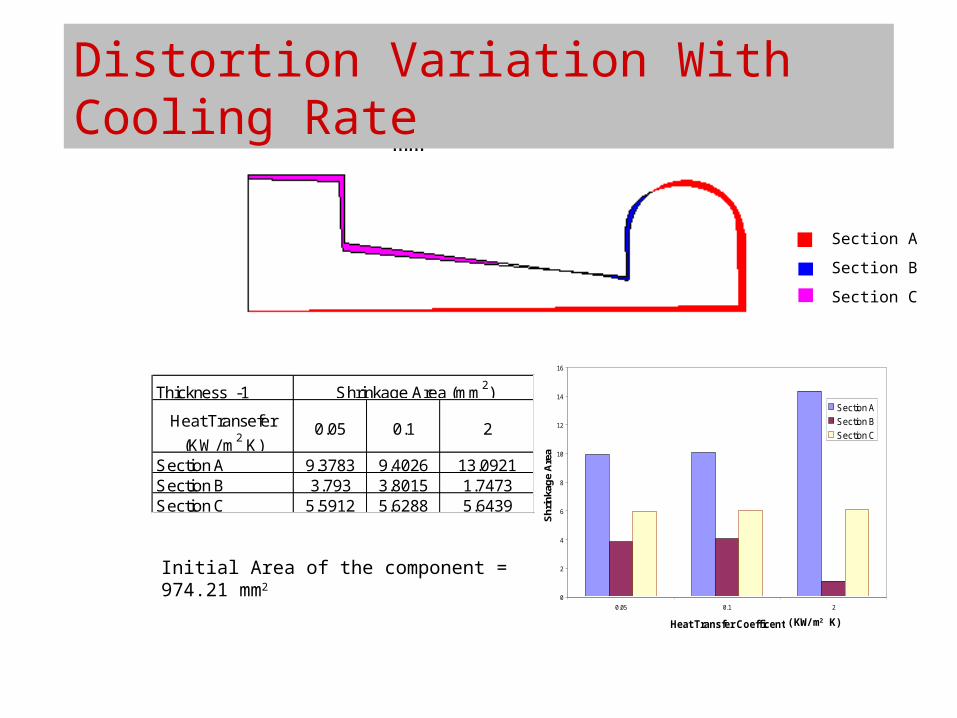
Section A
Section B
Section C
Thickness -1
Heat Transefer
(KW/ m2 K)0.05 0.1 2
Section A 9.3783 9.4026 13.0921Section B 3.793 3.8015 1.7473Section C 5.5912 5.6288 5.6439
Shrinkage Area (mm2)
0
2
4
6
8
10
12
14
16
0.05 0.1 2
Heat Transfer Coefficent
Sh
rin
kag
e A
rea
Section A
Section B
Section C
Initial Area of the component = 974.21 mm2
At stroke Length +1 mm
(KW/m2 K)
Distortion Variation With Cooling Rate
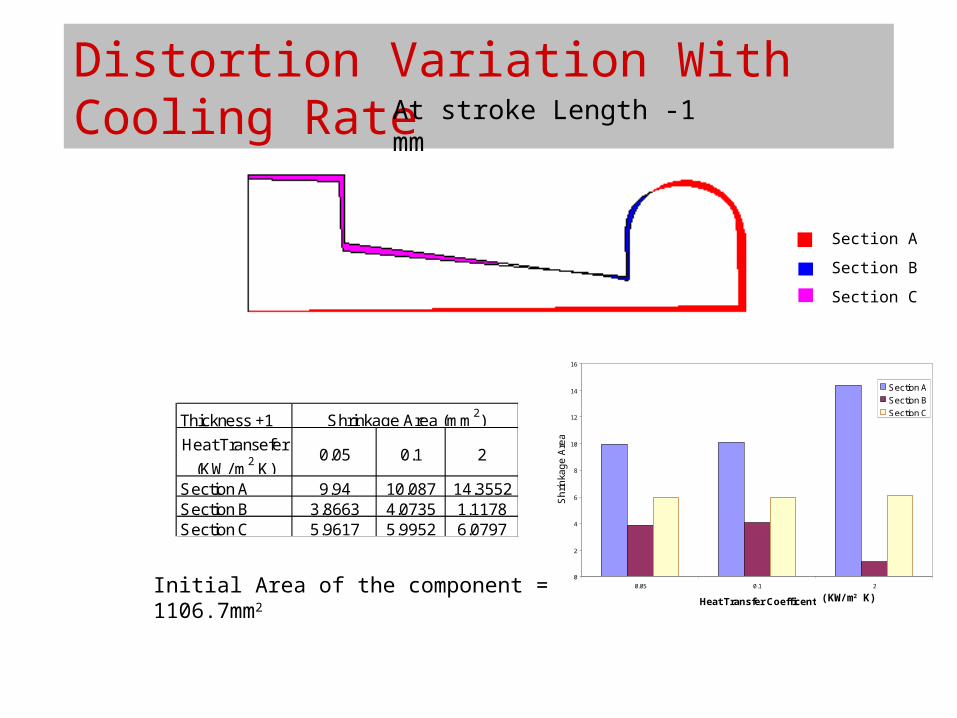
Section A
Section B
Section C
Initial Area of the component = 1106.7mm2
Thickness +1
Heat Transefer
(KW/ m2 K)0.05 0.1 2
Section A 9.94 10.087 14.3552Section B 3.8663 4.0735 1.1178Section C 5.9617 5.9952 6.0797
Shrinkage Area (mm2)
0
2
4
6
8
10
12
14
16
0.05 0.1 2
Heat Transfer Coefficent
Sh
rin
kag
e A
rea
Section A
Section B
Section C
Distortion Variation With Cooling RateAt stroke Length -1 mm
(KW/m2 K)
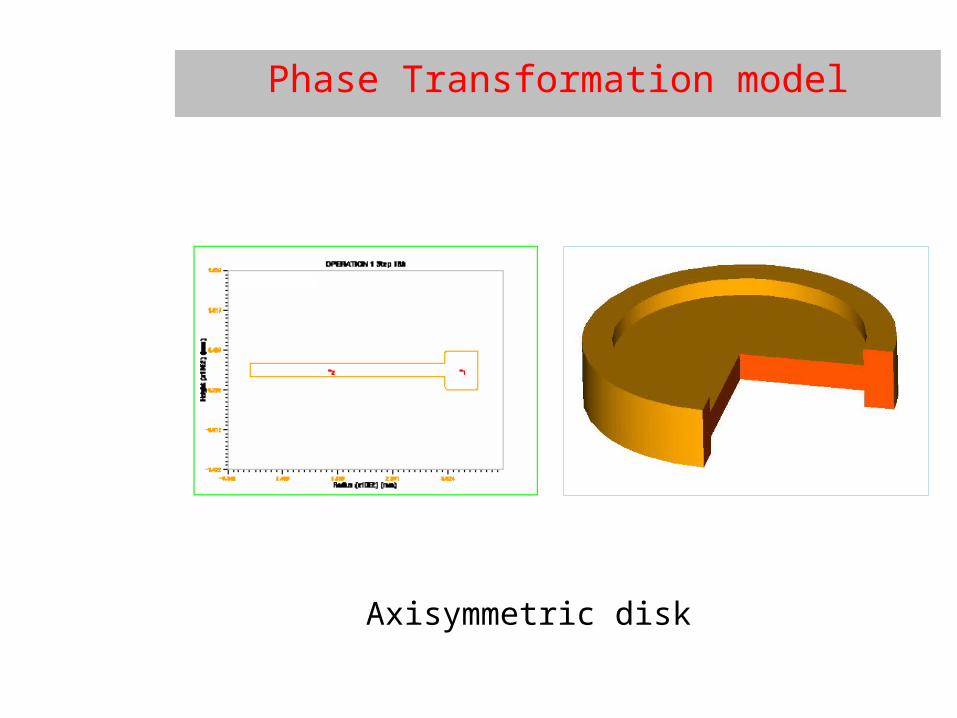
Phase Transformation model
Axisymmetric disk
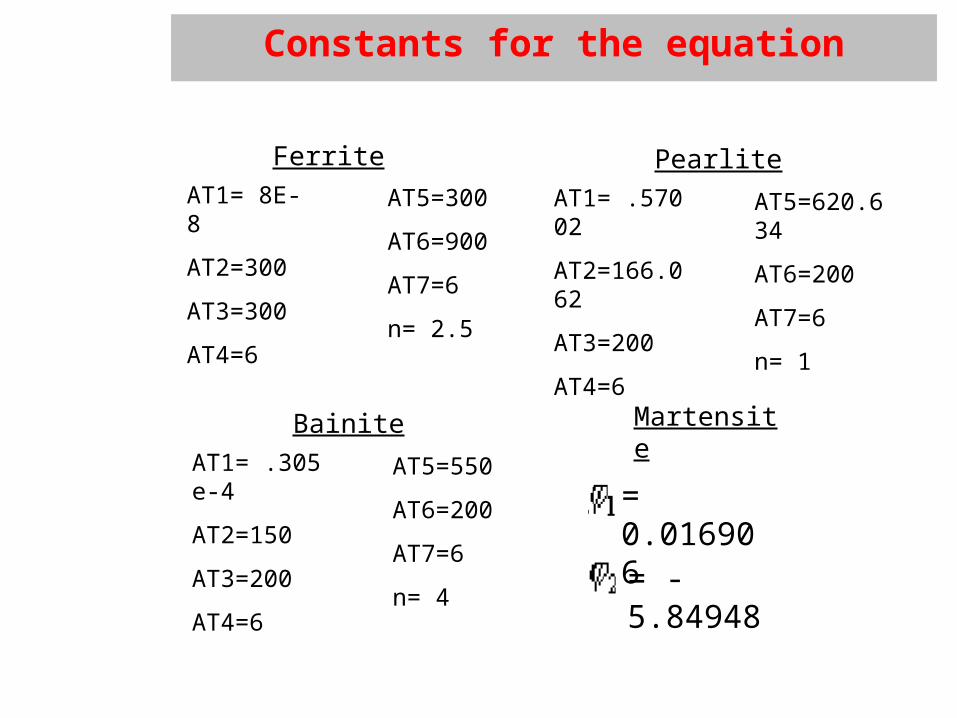
AT1= .57002
AT2=166.062
AT3=200
AT4=6
AT5=620.634
AT6=200
AT7=6
n= 1
AT1= 8E-8
AT2=300
AT3=300
AT4=6
AT5=300
AT6=900
AT7=6
n= 2.5
Ferrite Pearlite
Martensite
= 0.016906
= - 5.84948
Constants for the equation
AT1= .305e-4
AT2=150
AT3=200
AT4=6
AT5=550
AT6=200
AT7=6
n= 4
Bainite
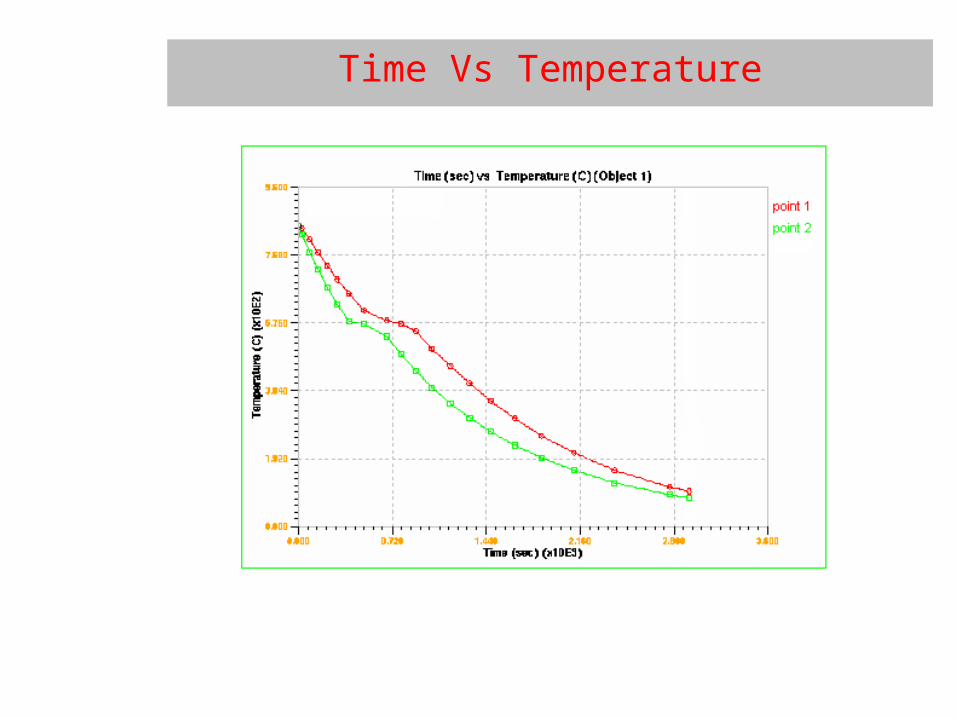
Time Vs Temperature
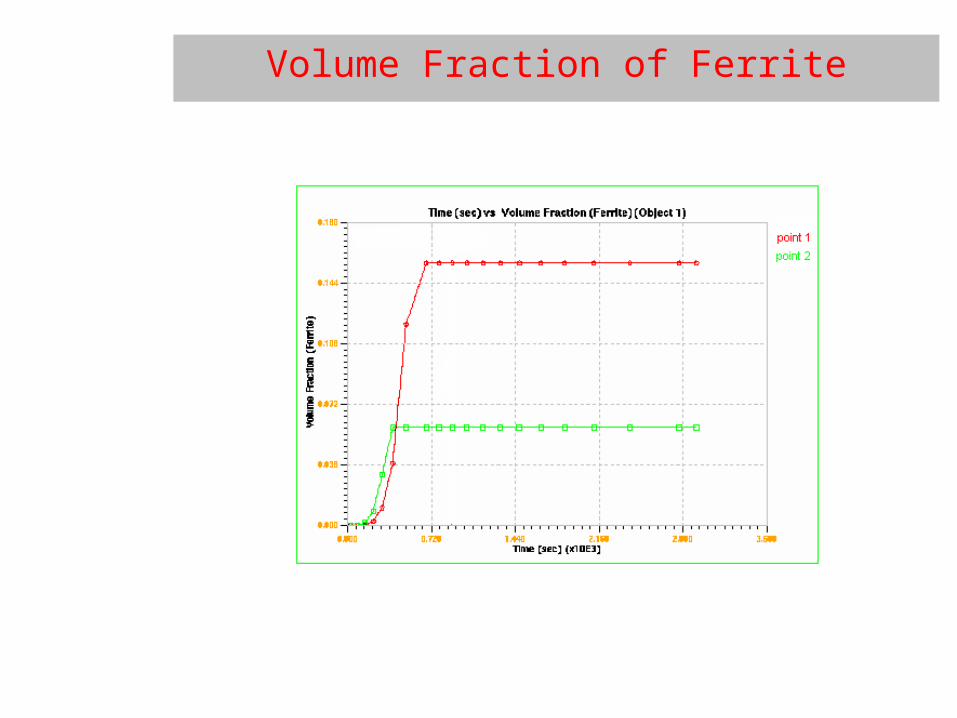
Volume Fraction of Ferrite
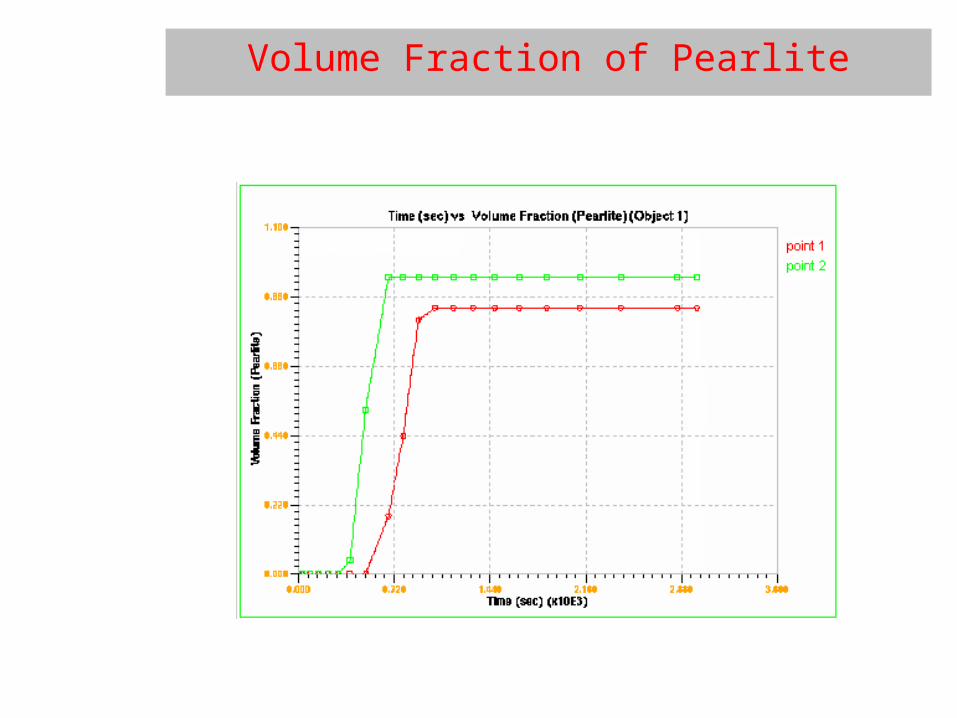
Volume Fraction of Pearlite
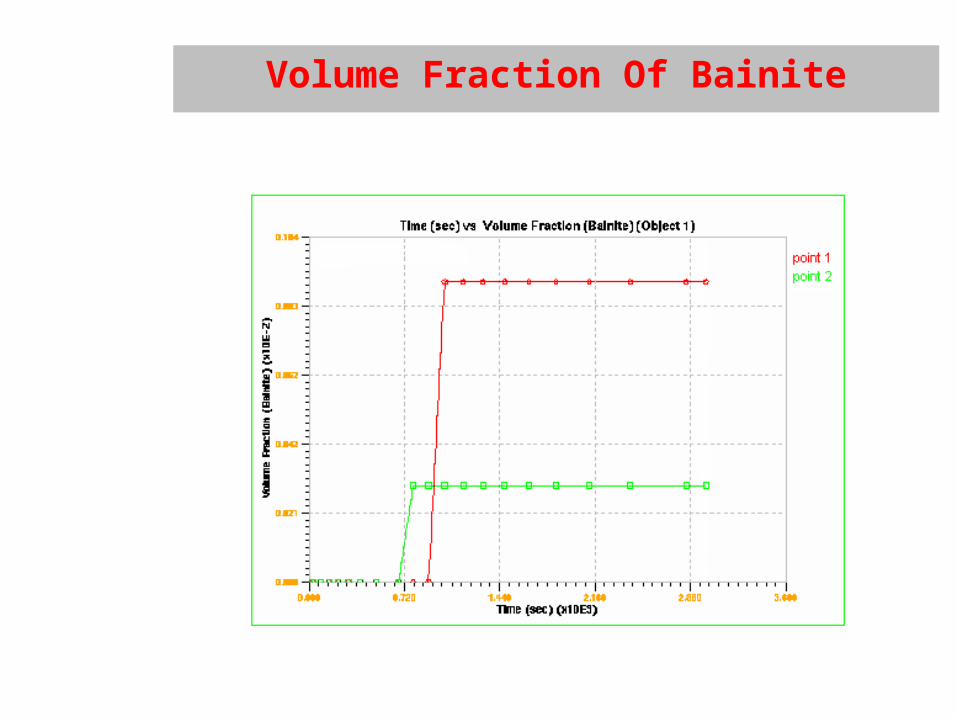
Volume Fraction Of Bainite
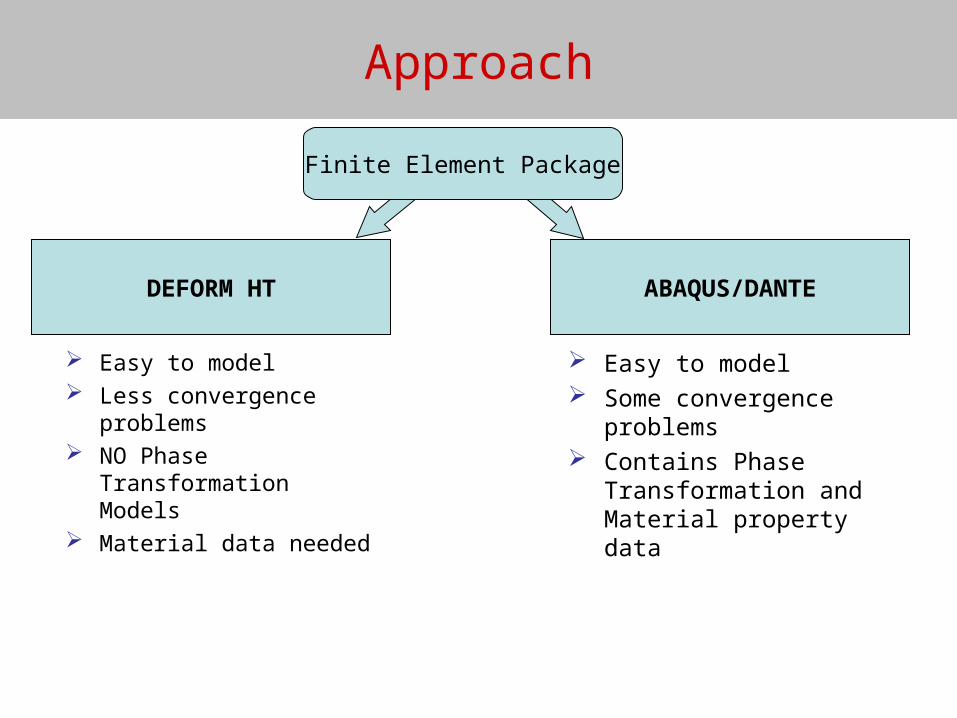
Approach
DEFORM HT ABAQUS/DANTE
Finite Element Package
Easy to model Less convergence
problems NO Phase
Transformation Models Material data needed
Easy to model Some convergence
problems Contains Phase
Transformation and Material property data
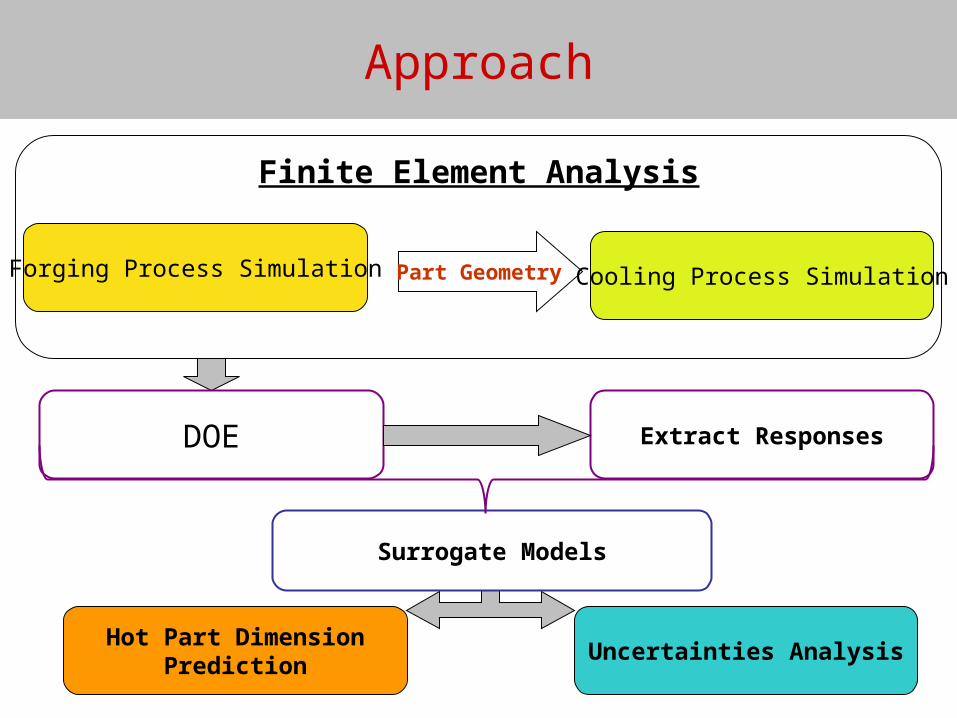
Finite Element Analysis
Part Geometry Cooling Process SimulationForging Process Simulation
Surrogate Models
Uncertainties Analysis
DOE Extract Responses
Hot Part Dimension Prediction
Approach
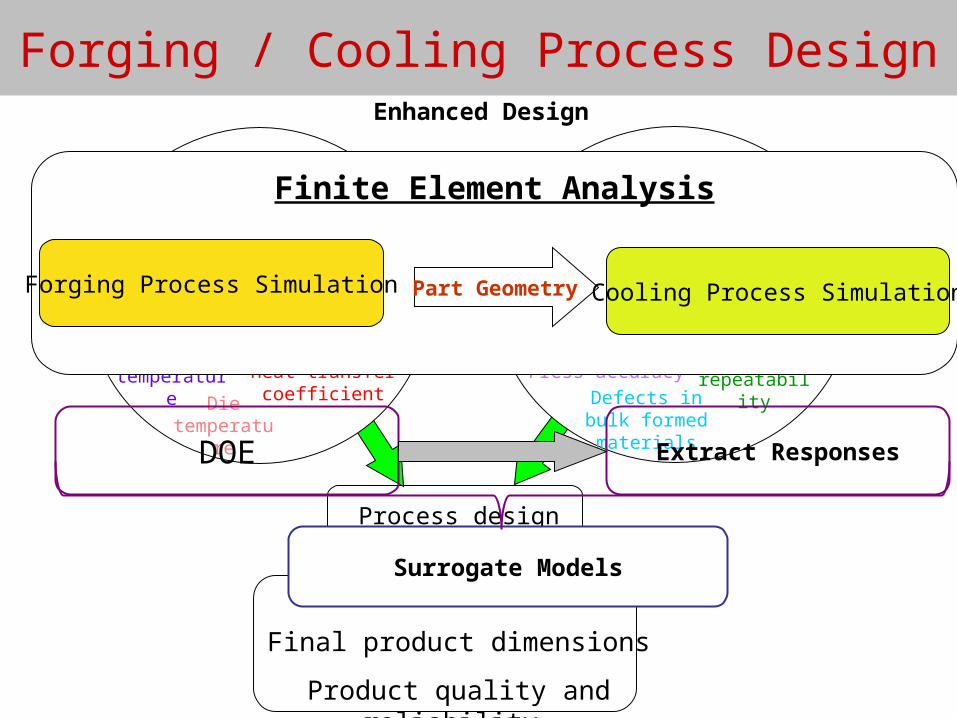
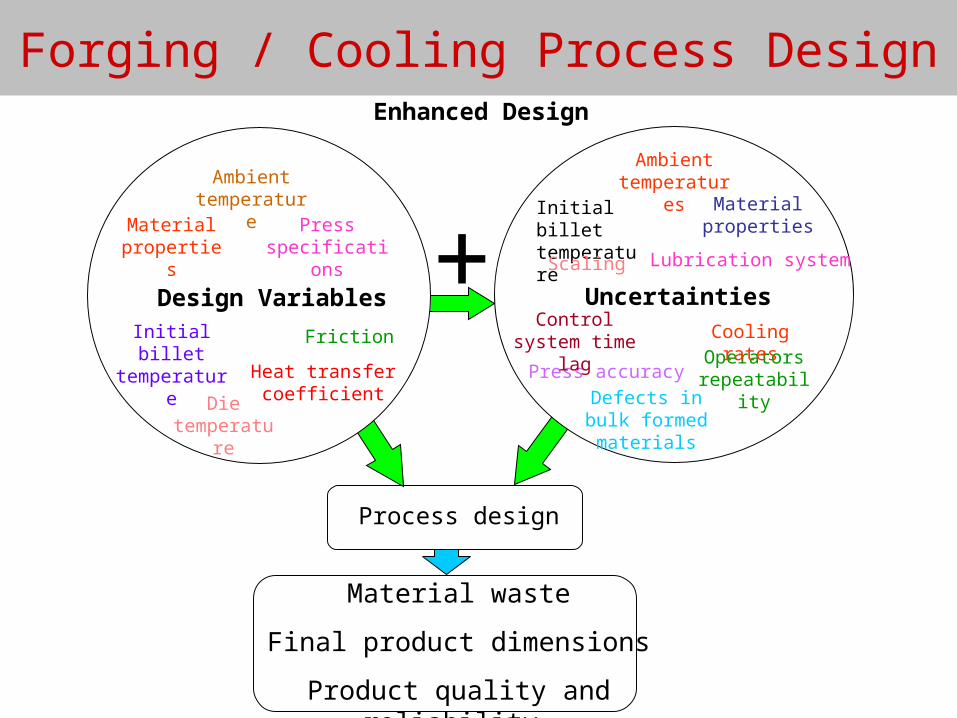
Enhanced Design
Uncertainties
Initial billet temperature
Ambient temperatures
Material properties
Scaling
Press accuracyOperators
repeatability
Control system time lag
Defects in bulk formed materials
+ Lubrication system
Cooling rates
Forging / Cooling Process Design
Material waste
Final product dimensions
Product quality and reliability
Process design
Design Variables
Material properties
Press specifications
Initial billet temperature
Friction
Die temperature
Ambient temperature
Heat transfer coefficient
Finite Element Analysis
Part Geometry Cooling Process SimulationForging Process Simulation
Surrogate Models
DOE Extract Responses
Enhanced Design
Uncertainties
Initial billet temperature
Ambient temperatures
Material properties
Scaling
Press accuracyOperators
repeatability
Control system time lag
Defects in bulk formed materials
+ Lubrication system
Cooling rates
Forging / Cooling Process Design
Material waste
Final product dimensions
Product quality and reliability
Process design
Design Variables
Material properties
Press specifications
Initial billet temperature
Friction
Die temperature
Ambient temperature
Heat transfer coefficient
Identify critical process parameters
Computationally evaluate variations in the parameters
Develop surrogate models for forging and cooling processes
Conduct Monte Carlo simulations
Predict the probability of part failure
Determine effect on production cost
Generate acceptable hot part dimensions before cooling
Approach