uncertainty in estimating land use and management impacts on soil organic carbon storage for us...
TRANSCRIPT

Uncertainty in estimating land use and managementimpacts on soil organic carbon storage for US agriculturallands between 1982 and 1997
S T E PH EN M . OG L E *, F . J AY B R E I D T w , MAR L EN D . E V E * and K E I TH PAU S T I AN * z*National Resource Ecology Laboratory, Colorado State University, Fort Collins, CO 80523, USA, wDepartment of Statistics,
Colorado State University, Fort Collins, CO 80523, USA, zDepartment of Soil and Crop Science, Colorado State University, Fort
Collins, CO 80523, USA
Abstract
Uncertainty was quantified for an inventory estimating change in soil organic carbon
(SOC) storage resulting from modifications in land use and management across US
agricultural lands between 1982 and 1997. This inventory was conducted using a
modified version of a carbon (C) accounting method developed by the Intergovern-
mental Panel on Climate Change (IPCC). Probability density functions (PDFs) were
derived for each input to the IPCC model, including reference SOC stocks, land use/
management activity data, and management factors. Change in C storage was estimated
using a Monte-Carlo approach with 50 000 iterations, by randomly selecting values from
the PDFs after accounting for dependencies in the model inputs. Over the inventory
period, mineral soils had a net gain of 10.8TgCyr� 1, with a 95% confidence interval
ranging from 6.5 to 15.3 TgCyr� 1. Most of this gain was due to setting-aside lands in the
Conservation Reserve Program. In contrast, managed organic soils lost 9.4 TgCyr� 1,
with a 95% confidence interval ranging from 6.4 to 13.3 TgCyr� 1. Combining these gains
and losses in SOC, US agricultural soils accrued 1.3TgCyr� 1 due to land use and
management change, with a 95% confidence interval ranging from a loss of 4.4TgCyr� 1
to a gain of 6.9 TgCyr� 1. Most of the uncertainty was attributed to management factors
for tillage, land use change between cultivated and uncultivated conditions, and C loss
rates from managed organic soils. Based on the uncertainty, we are not able to conclude
with 95% confidence that change in US agricultural land use and management between
1982 and 1997 created a net C sink for atmospheric CO2.
Keywords: agroecosystems, carbon sequestration, greenhouse gas mitigation, IPCC, land use change,
uncertainty analysis
Received 8 November 2002; revised version received 2 June 2003 and accepted 3 June 2003
Introduction
One of the most dramatic changes in the global system
resulting from human activity is the rising concentra-
tion of greenhouse gases in the atmosphere (Vitousek
et al., 1997). Consequently, nations have been negotiat-
ing policies over the last decade, to mitigate greenhouse
gas emissions and one of the proposals would allow
countries to use carbon (C) sinks as a way to offset
emissions, based on the Kyoto Protocol (Article 3.3 and
3.4; UNFCCC, 1997). A potential C sink for CO2
emissions is the terrestrial pool of soil organic carbon
(SOC) (Houghton et al., 1983; Schimel, 1995). While SOC
pools are affected by a wide variety of environmental
variables operating across a range of temporal and
spatial scales, human management has been shown to
have an important influence, particularly in highly
managed systems such as agricultural fields (Paustian
et al., 1997a). Moreover, atmospheric CO2 can be
sequestered in agricultural soils with the implementa-
tion of conservation management practices (Kern &
Johnson, 1993; Paustian et al., 1997a, b, 2000; Lal et al.,
1998; Post & Kwon, 2000; Batjes, 2001; Follett, 2001;
Kucharik et al., 2001). Bruce et al. (1999) describe several
practices that promote C sequestration, including aCorrespondence: Stephen M. Ogle, fax 1 970-491-1965,
e-mail: [email protected]
Global Change Biology (2003) 9, 1521–1542, doi: 10.1046/j.1529-8817.2003.00683.x
r 2003 Blackwell Publishing Ltd 1521

reduction in tillage disturbance, intensification of
cropping rotations, improvements in crop yields, and
replacement of annual crops with perennial vegetation.
In general, these practices increase SOC storage by
enhancing C inputs to the soil through improved
productivity and residue management. However some
practices decrease C outputs resulting from decom-
position, such as reducing tillage disturbance, which
enhances soil aggregation and provides limited ‘pro-
tection’ to organic matter from microbial decomposi-
tion (Jastrow, 1996; Six et al., 1998, 2000). In addition,
several national assessments have demonstrated the
potential for C sequestration in agricultural soils
based on the adoption of conservation practices
(Smith et al., 2000a, b; Kucharik et al., 2001; Sperow
et al., 2003).
While the potential exists for agricultural soils to be a
C sink, inventories are needed to estimate the amount
of C sequestration for qualification as a mitigation
practice under international agreements (Subak, 2000;
Houghton, 2001). The Intergovernmental Panel on
Climate Change (IPCC) has developed such a model
for quantifying changes in SOC storage based on land
use and management practices. This method has been
applied to US agroecosystems (Eve et al., 2001a, b, 2002),
but previous inventories did not include rigorous
measures of uncertainty. In fact, the standard IPCC
method does not supply the information needed to
assess uncertainty. Consequently, our objective was to
estimate the change in SOC storage for US agricultural
lands between 1982 and 1997, along with the uncertainty
in those estimates, using the IPCC method. This time
frame was selected to determine baseline trends in net C
fluxes between agricultural soils and the atmosphere
that have resulted from land use and management
change in the recent past. The baseline conditions can be
used to quantify the effectiveness of future management
activity in mitigating greenhouse gas emissions.
Ecological models always have uncertainty in struc-
ture and formulation, and quantifying this uncertainty
provides a measure of the model’s ability to estimate
changes in a system, as well as information about
which inputs lead to the greatest uncertainty (Smith &
Heath, 2001). Without this assessment, it is problematic
for policymakers and resource managers to use model
results for developing government policies and man-
agement programs.
Methods
IPCC method
The IPCC method accounts for a change in SOC stocks
from a reference condition resulting from modifications
in agricultural land use and management (IPCC, 1997).
It is a relatively simple C accounting approach that any
nation, even those with limited technology and
resources, can use to account for net changes in SOC
storage as part of their greenhouse gas reporting. This
method has been used to report a change in SOC
storage due to agricultural land use and management
as part of the US greenhouse gas inventory, which is
compiled under agreements set forth by the UN
Framework Convention on Climate Change (EPA,
2003).
The method estimates changes in the SOC stocks for
the top 30 cm of a mineral soil profile (i.e., excluding
Histosols) over the first 20 years following a shift in
management. Presumably, agricultural management
has its greatest influence over this time frame and
portion of the profile (IPCC, 1997), although this may
limit its usefulness if there are pervasive impacts at
longer time intervals or deeper depths. For organic soils
(i.e., Histosols), the method estimates an annual loss
rate until the organic horizon has disappeared. Organic
soils are typically drained when converted to agricul-
tural land uses, leading to relatively high rates of
oxidation of the well-developed organic horizon (Ar-
mentano & Menges, 1986). Consequently, the method
only considers C losses from these soils. Also, in its
current form, the method does not account for gains
that may occur following wetland restoration.
Overall, the IPCC approach only deals with direct
anthropogenic effects on SOC storage that are verifiable
from land use and management activity records, and
hence its application is a partial accounting approach
(Watson et al., 2000; Houghton, 2003). Additional
changes in SOC storage resulting from other driving
variables (e.g., natural disturbance or climate) are not
considered in this method because their impact on
storage is unlikely to be given credit for mitigation
purposes. In addition, while full C accounting is
desirable, costs and resource availability limit the
current use and practicality of such approaches
(Houghton, 2001). For this analysis, we have focused
on land use change between cultivated croplands and
uncultivated cover types, such as grasslands and
forests, as well as management effects resulting from
changing tillage practices, cropping rotations, and
draining organic soils for agricultural production.
SOC inventory calculations are carried out for
aggregated soil types within climate regions. The
aggregated types include ‘high-activity’ mineral soils
(Vertisols, Mollisols, high base status Alfisols), ‘low-
activity’ mineral soils (Ultisols, Oxisols, acidic Alfisols),
sandy soils (o8% clay and 470% sand), volcanic soils
(Andisols), spodisols (Spodisols), wetland soils (Aquic
suborder), and organic soils (Histosols). Climate
1522 S . M . OG L E et al.
r 2003 Blackwell Publishing Ltd, Global Change Biology, 9, 1521–1542

divisions occurring in the US include wet and dry
zones for subtropical, warm, and cool temperate
regions (Eve et al., 2001a).
For mineral soil types, annual changes in SOC stocks
(TgCyr� 1) are estimated using the equation
dC ¼
PH
h¼1
ðSOCtðhÞ � SOCt�20ðhÞÞ
1�106�20; ð1Þ
where H represents the number of climate regions by
soil types by land use/management systems, SOCt(h)
(MgC) is the amount of SOC in system h at the
beginning of the inventory, and SOCt-20 (h) (MgC) is the
amount at the end of the inventory period. We divided
by 1�106 to convert units from Mg to TgC, and then
divided by 20 to obtain an annual rate of change, as
recommended in IPCC guidelines (IPCC, 1997). SOC (h)
(MgC) is estimated using the equation
SOC ðhÞ ¼ RC � TF � IF � LUC � LA; ð2Þ
where RC is the reference SOC stock (MgCha� 1), TF is
the tillage factor (deals with tillage intensity such as no-
till vs. conventional tillage practices; dimensionless), IF
is the input factor (deals with cropping intensity and
the productivity of various cropping rotations; dimen-
sionless), LUC is the land use change factor (deals with
conversions between cultivated and non-cultivated
conditions; dimensionless), and LA is the land area
(ha).
Eqn (2) is a modified version of the original IPCC
formulation (IPCC, 1997). In the original method, the
reference SOC stock (RC) is based on values from
relatively undisturbed, native ecosystems. We modi-
fied this approach to use conventionally managed
cropland as the reference for estimating SOC stocks,
instead of native conditions, because US pedon
databases provide information that is readily linked to
agricultural management, and SOC stock measure-
ments are more common for soils under cultivated
than native conditions in major agricultural regions of
the US.
C emissions from managed organic soils are com-
puted using the following equation:
CL ¼LR � LA1�106
; ð3Þ
where CL is C loss (TgC), LR is an annual loss rate
factor (MgCha� 1 yr� 1), LA is the land area (ha), and
the quantity is divided by 1�106 to convert from Mg to
TgC.
We estimated annual SOC stock changes in mineral
soils and C losses from managed organic soils between
1982 and 1997, assuming a linear change in C storage.
In other analyses (EPA, 2003), we have estimated stock
changes for 1982 to 1992 and 1992 to 1997. Including the
1992 activity data had little effect on the final values,
however, and so for brevity, we present the simpler
results in this paper. All analyses were conducted using
the Splus 2000 Professional software package, release 3
(Insightful Corporation, Seattle, WA, USA).
Uncertainty analysis: Monte Carlo simulations
Uncertainties in model estimates are a consequence of
imprecision in initial (or reference) values, parameters,
inputs, model formulation, and validation data (Kros
et al., 1993; Klepper, 1997). We considered the first three
types of uncertainty in this analysis. Uncertainty in
model formulation may be explored in the future by
comparisons with other models that have different
constructs and assumptions. In addition, validation
data along with their corresponding uncertainties may
be incorporated into future analyses as they become
available frommonitoring of land use and management
impacts on SOC storage.
As depicted in Fig. 1, we estimated uncertainty using
a Monte Carlo approach by generating multiple outputs
from the model based upon a random selection of input
values from probability density functions (PDFs) (e.g.,
Kros et al. 1993; IPCC 2000; Smith and Heath 2001).
PDFs represent the distributions of uncertain input
values to the IPCC equations, including areas in various
land use/management practices, reference SOC stocks,
and factors representing the management impacts on
SOC storage. We simulated 50 000 runs of the IPCC
model for each climate region by soil type combination,
and then summed outputs for each run to produce an
empirical distribution of 50 000 C change estimates at
the national level. From these 50 000 estimates, we
(Lit. reviewof field trials)
IPCC Factors
Framework for Uncertainty Analysis
National Estimates(95% C.I.)
Land Use /Management History
Reference Carbon Stocks(NSSC Database)
(NRI and CTIC)
IPCCEquation
(50,000 reps.)MonteCarlo
Simulation
Fig. 1 Framework for IPCC uncertainty analysis with the
sources of uncertainty in italics.
UNC E RTA IN T Y ANALY S I S F O R AGR I CU LTURAL SOC S TORAGE 1523
r 2003 Blackwell Publishing Ltd, Global Change Biology, 9, 1521–1542

obtained the 2.5 and 97.5 percentiles as a description of
uncertainty (i.e., 95% confidence interval). Values at
these percentiles would change if the entire simulation
experiment were repeated. However, to assess the
precision of using 50 000 replicates, we estimated the
standard errors of the percentiles and constructed 95%
confidence intervals. The range of the confidence
intervals for both percentiles was 0.03. This was
adequate for our application because we were only
reporting one significant digit beyond the decimal; that
is, the Monte-Carlo percentile estimates are unlikely to
change in the reported digits for other simulations with
50 000 runs.
In general, uncertainties about model inputs are not
statistically independent, and a simulation study needs
to deal with dependencies to generate meaningful
results. We considered several key dependencies. First,
we accounted for dependence in land use activity data.
For example, if an estimated land use is too high in one
inventory year, it will also tend to be too high in the
next year because the same survey locations are visited
each survey year in the US to determine land use
patterns (USDA-NRCS, 2000). Likewise, in a given
inventory year, if one estimated land use is too high,
then other estimated land uses must be too low
(otherwise the land use estimates would not add up
to the total land area). These dependencies in un-
certainty are reflected in the simulation by incorporat-
ing the proper variance–covariance matrix of the
estimates for the simulated land uses across time.
Second, we accounted for the dependent uncertainties
in management factors that were estimated in a single
statistical model using a common set of studies, such as
factors for reduced and no-till management (i.e.,
dependence exists because some studies had no-till
and reduced till treatments that were compared with a
single conventional till treatment). Land use change
and cropping input factors were also derived from a
single data set. Third, we accounted for dependence in
the assignment of factor values and land use areas to
climate regions by soil types in the simulation (i.e., id-
entical factor values were assigned to each climate by
soil region and therefore they were completely depen-
dent). Uncertainties for tillage, land use and input fac-
tors were dependent across all climates by soil types
because we used a single PDF to quantify the effect of
these management practices for the entire country.
Similarly, we did not differentiate separate C loss rates
for the dry and wet areas of a climate region (e.g., cool
temperate dry and wet), and therefore there were
dependencies in those rates. In contrast, uncertainties in
land use activity were considered to be independent
across climate by soil types because estimates were based
on separate data sets that were collected in each region.
PDFs
Reference SOC stocks for mineral soils
PDFs were derived for the reference SOC stocks using
pedon data from the National Soil Survey Character-
ization Database (USDA-NRCS, 1997). We selected
pedons representing cultivated agricultural conditions
based on the presence of an Ap horizon at the surface
with no overlying O horizon. In addition, we only
included pedons with measurements to a 30 cm depth
for %OC, textural composition, and gravel content data,
as well as having location information and a taxonomic
description. A total of 2601 pedons met these criteria.
Bulk density values (o2mm fraction) were only
measured for about 1200 of those pedons; the remain-
ing bulk densities were computed based on neural
network calculations described in Lacelle et al. (2001).
We estimated SOC stocks (RC) in Mgha� 1 for each
pedon, using the following equation:
RC ¼ð%OC=100Þ � depth �Db
� ½ð100�%gravelÞ=100� � 10 000;ð4Þ
where %OC is the organic carbon content, depth
is the increment width (m), Db is bulk density for the
o2mm fraction (Mgm� 3), %gravel is the proportion of
gravel in the top 30 cm of the profile, and 10 000 is a
factor for converting m2 to ha. PDFs were normal
densities based on the means and variances of the
pedon data, with truncation to avoid unrealistic values.
The lower limit for truncation was 0MgCha� 1, and
the upper limit for truncation was 450MgCha� 1
(only histosols are likely to accumulate C above this
value).
Pedon locations were clumped in various parts of the
country. Clumping often reduces the statistical inde-
pendence of individual measurements, and can lead to
lower variance estimates than would be justified by the
data. To check for this pattern, data were tested for
spatial autocorrelation in each climate region by soil
type using Moran’s I test. Traditionally, spatial depen-
dence has been ignored in statistical modeling, except
for cases in which investigators have specified spatial
models using geostatistical techniques. Because of the
sparse density of pedon data, however, we could not
specify spatial models to compensate for autocorrela-
tion effects. As an alternative, we inflated variances by
10% for all climates by soil types with significant
P-values from the Moran’s I test. There is no standard
for inflation in such cases, but in further simulations not
reported here, we found that even with a higher
inflation at 50%, the contribution of the reference C
stocks to overall IPCC model uncertainty changed by
less than 1%.
1524 S . M . OG L E et al.
r 2003 Blackwell Publishing Ltd, Global Change Biology, 9, 1521–1542

Tillage, input, and land use change factors
To estimate management factors for input, tillage, and
land use change, we conducted a literature search using
the Agricola bibliographic database and the ISI Web of
Science citations database. We selected studies pub-
lished in journal articles and book chapters based on
several criteria. First, we only included studies from the
US and neighboring areas in Canada (with similar soils
and climate as northern portions of the US), assuming
that they would best represent management impacts for
this inventory. Second, we selected studies that either
provided SOC stocks in the paper, or the %C and bulk
density measurements so that we could calculate the
stocks. Requiring bulk density measurements allowed
us to reduce uncertainty in the factors by not having to
approximate values using pedo-transfer functions.
Third, studies had to report the depth of measurement
and time frame over which the management change
had occurred because these variables were used to
estimate factors representative of impacts for the top
30 cm of the soil profile over the first 20 years since a
management change, using a regression analysis.
Input factors quantified the effect of variation in
cropping intensity and crop type on SOC storage, and
were grouped into three general categories. The vast
majority of rotations were part of the medium input
category, which included continuous row crops and
small grains. Rotations with bare summer-fallow were
placed in the low-input category, along with crops
producing low amounts of residue, such as vegetables
and cotton. The high-input category was reserved for
cropping systems that included a year of hay, legumes,
or pasture in rotation, and fields with winter cover
crops or irrigation.
Tillage impacts were based on three general types
that represent a gradient in tillage disturbance, ranging
from the most intensive practices referred to as
conventional tillage (e.g., moldboard plowing), to
moderately intensive practices referred to as reduced
tillage (e.g., ridge tillage, mulch tillage, or chisel
plowing), and the least intensive referred to as no-till.
Land use change factors quantified the effect of
conversions between cultivated and uncultivated con-
ditions. Uncultivated lands included continuous pas-
ture and hayland (i.e., not in rotation with annual
crops), rangeland, and managed forest. In addition, we
estimated a separate land use change factor for areas
that had been set aside from agricultural production in
the Conservation Reserve Program (CRP).
PDFs were derived by fitting the published data in
linear mixed-effect models. The response variable was a
ratio of the SOC stock for the management change
divided by the SOC stock for the reference condition.
This metric is referred to as a response ratio, and is
equivalent to the factor values defined in the IPCC
method (IPCC, 1997). In some cases, ratios were
transformed using a natural log:
ln ðratioÞ ¼ ln ðSOCchangeÞ � ln ðSOC referenceÞ ð5Þ
if the residual analysis demonstrated a violation of
model assumptions. Fixed effects were included for
time and depth, while random effects were assumed for
time series data and multiple depth increments from a
single study, accounting for correlations among those
measurements.
While some studies only considered the effect of
management across a single depth increment, most
included more than one increment in the evaluation,
such as 0–5, 5–10, and 10–20 cm. For studies with single
and multiple depth increments, regressors were formed
from the upper and lower values of each increment by
modeling the instantaneous SOC stock ratio as a
quadratic function of depth, and then integrating and
averaging the quadratic function over the increment.
That is, the average SOC stock ratio for a single
increment was the integral of the quadratic function
from the upper depth to the lower depth, divided by
the thickness of the increment. Integration of the
quadratic function resulted in two regression variables
for each depth increment:
x1¼ ðL2 �U2Þ=ð2 ðL�UÞÞ; ð6Þ
x2¼ ðL3 �U3Þ=ð3 ðL�UÞÞ; ð7Þ
where L represents the lower depth of the increment
(cm) and U represents the upper depth (cm). By using
this approach, no information was lost from the studies
through an aggregation of individual samples or
through interpolation to a standard set of depth
increments.
A quadratic function was chosen to represent the
declining difference in SOC storage between manage-
ment treatments at deeper depths in the profile (i.e., the
effects of agricultural management are typically great-
est at the surface and then diminish with depth). The
rate of decline depended on the strength and nature of
the management impact. In some cases, such as in the
comparison of no-till and conventional till practices, the
difference in SOC storage changes sign across depth,
with more SOC in the no-till treatment near the surface
of the soil at 0–5 cm, but more SOC in the conventional
till treatment near the bottom of the plow layer, which
typically reaches a depth of 20–25 cm. This is due to less
mixing of the soil with no-till management, leading to
greater stratification of C near the soil surface (Anger
et al., 1997). The fit of a quadratic function is well suited
to capture this trend.
PDFs for the management factors were normal
densities with the mean equal to the prediction for
UNC E RTA IN T Y ANALY S I S F O R AGR I CU LTURAL SOC S TORAGE 1525
r 2003 Blackwell Publishing Ltd, Global Change Biology, 9, 1521–1542

the integrated effect of management in the top 30 cm of
the soil profile over the first 20 years after implementa-
tion. The standard deviation for the PDF was calculated
based on the prediction error variance for that estimate.
We did not synthesize the literature to determine
management factors for pasture and hay land improve-
ments (e.g., irrigation and seeding legumes), contin-
uous perennial/horticultural cropping, and rice
production, because fewer than five US studies were
found meeting our selection criteria for these practices.
Because of relatively high C inputs to the soil for these
practices, the IPCC method assumes that they increase
SOC storage above levels found in typical uncultivated
systems, and a default value of 1.1 is provided in the
IPCC documentation for estimating their impact (IPCC,
1997). A PDF was constructed for the default estimate
with a nominal level of uncertainty based on a 750%
normal distribution around the value (i.e., standard
deviation5 value/4). To calculate SOC storage under
these management systems, we multiplied the land use
change factor (LUC) from Eqn (2), which was estimated
from our literature synthesis, by the additional value of
1.1 from the IPCC documentation.
C loss rates from managed organic soils
PDFs for C loss rates were derived from published
studies in the US and neighboring areas in Canada,
assuming that they would best represent losses for this
inventory. Most studies are based on measures of
subsidence, and while subsidence is related to oxida-
tion of the organic matter, it is not a direct measurement
of C loss. Consequently, we used adjustment factors to
account for the amount of total subsidence that was due
to oxidation, assuming a nominal 750% normal
distribution around those adjustments. The C loss rates
(LR) (MgCha-1 yr� 1) were computed using the follow-
ing equation:
LR ¼ ST � Sox � ð%OC=100Þ �Db � 10000; ð8Þ
where ST is the total subsidence (myr� 1) (rate of land
subsidence following drainage of a wetland for
agricultural production), Sox is the adjustment factor
for the proportion of subsidence attributed to decom-
position of organic matter (percentage), %OC is the
organic C content, Db is the bulk density of the soil
(Mgm� 3), and 10 000 is a factor for converting m2 to ha.
C loss rates falling below 0MgCha� 1 were reassigned
to 0 because we only estimated C losses from managed
organic soils in accordance with the IPCC method (i.e.,
negative loss rates would imply a gain in C using
Eqn (3)).
Loss rates were also needed for soils that have been
drained, but managed as pastures or forests (IPCC
1997). We were unable to find enough articles to model
this effect based on studies conducted in the US.
Therefore, we used the default assumption from the
IPCC method that C losses from organic soils in
managed forest or pastures are about 25% of those
from the annually cropped, organic soils. We assumed a
nominal 750% normal distribution around the 25%
conversion value in order to construct a PDF.
Land use activity data: National Resources Inventory
The majority of the land use and management activity
data were obtained from the National Resources
Inventory (NRI), which has a record of land use history
since 1982 for the conterminous US and Hawaii (Nusser
& Goebel, 1997; USDA-NRCS, 2000). The land base for
the agricultural SOC inventory included all areas from
the NRI that were designated as an agricultural land
use in 1992 or 1997, including high-input cropping
systems, low-input cropping systems, medium-input
cropping system, continuous perennial/horticultural
crops, rice, pasture lands, improved pasture lands
(based on seeding legumes or irrigation as captured
in the NRI), rangelands, and set-aside lands registered
in the CRP (Table 1). Several non-agricultural land uses
were also included in the analysis because they were
transferred from or into agricultural production during
the inventory period. The non-agricultural land uses
included forests, open water, urban, federal land, and
other miscellaneous non-cropland (e.g., barren areas,
feedlots, marshland, and gravel pits).
We computed change in SOC storage for the entire
agricultural land base, with the exception of those areas
that were shifting between agricultural land uses and
urban, open water, or miscellaneous non-cropland. In
previous inventories, it was assumed that these land
uses were similar to native conditions in terms of SOC
storage (Eve et al., 2002). However, the fate of SOC
during conversions to non-agricultural uses is largely
unknown, and so in the current inventory, we adopted
a more conservative approach in dealing with these
land use conversions and assumed no change in SOC
storage.
The NRI uses a stratified, two-stage probability
sampling design (Nusser et al., 1998), in which first-
stage sampling units are land areas (typically quarter-
sections), second-stage sampling units are points within
those land areas, and all units are stratified geographi-
cally to ensure good spatial dispersion. During the time
period of interest for the present study, the sampling
points were inventoried every 5 years. The standard
theory of probability surveys (Cochran, 1977) shows
that uncertainties in the estimates for land areas are
approximately normally distributed, with variances
and covariances computed via standard formulae.
Therefore, we constructed multivariate normal PDFs
1526 S . M . OG L E et al.
r 2003 Blackwell Publishing Ltd, Global Change Biology, 9, 1521–1542

for land use to have a mean vector equal to the vector of
total areas for the land use categories in different
years of the inventory, and to have a covariance matrix
equal to the sampling covariances that were compu-
ted from the NRI data. This construction ensures
that dependencies are properly reflected in the simula-
tion, including dependent uncertainties in land use
estimates between the first and last year of the
inventory (due to the panel structure of the NRI), and
dependent uncertainties in land use estimates for a
given inventory year (due to constraints on the total
land area).
Tillage practice activity data: Conservation Technology
Information Center
We used an annual survey conducted by the Conserva-
tion Technology Information Center to estimate the
amount of agricultural land managed with conven-
tional, reduced, and no-tillage (CTIC, 1998). PDFs were
derived for the CTIC data as bivariate normal on a log-
ratio scale, to reflect negative dependence among tillage
classes (e.g., if the percentage of conventional tillage in
a county is high, then the percentage of no-till is
necessarily low) and to ensure that simulated tillage
percentages were non-negative and summed to 100%.
Table 1 Land use/management categories derived from the National Resources Inventory and the corresponding land use/
management systems recognized in the Intergovernmental Panel on Climate Change (IPCC) method (1997)
IPCC categories
Land use/management categories Mineral soils Histosols
Agricultural (cropland and grazing land)
Irrigated crops High-input cropping Cultivated crops
Continuous row crops Medium-input cropping Cultivated crops
Continuous small grains Medium-input cropping Cultivated crops
Continuous row crops and small grains Medium-input cropping Cultivated crops
Row crops in rotation with hay and/or pasture High-input cropping Cultivated crops
Small grains in rotation with hay and/or pasture High-input cropping Cultivated crops
Row crops and small grains in rotation with hay and/or pasture High-input cropping Cultivated crops
Vegetable crops Low-input cropping Cultivated crops
Low residue annual crops (e.g., tobacco or cotton) Low-input cropping Cultivated crops
Small grains with fallow Low-input cropping Cultivated crops
Row crops and small grains with fallow Low-input cropping Cultivated crops
Miscellaneous crop rotations Medium-input cropping Cultivated crops
Continuous rice Rice* No loss
Rice in rotation with other crops Rice* No loss
Continuous perennial or horticultural crops Perennial/horticultural cropping* Pasture/forest
Continuous hay Uncultivated land (general) Pasture/forest
Continuous hay with legumes or irrigation Improved pasture/hayland* Pasture/forest
CRP Set-aside No loss
Rangeland Uncultivated land (general) No loss
Continuous pasture Uncultivated land (general) Pasture/forest
Continuous pasture with legumes or irrigation Improved pasture/hayland* Pasture/forest
Aquaculturew Not estimated Not estimated
Non-agriculturalzForest Uncultivated land (general) Pasture/forest
Federal Uncultivated land (general) No loss
Waterw Not estimated Not estimated
Urban Landw Not estimated Not estimated
Miscellaneousw§ Not estimated Not estimated
*Improved pastures and haylands are treated separately because they have relatively higher amounts of soil organic carbon (SOC)
storage than is typically found for uncultivated lands in a similar climate and soil type.
wAssumed no change in carbon stocks when converting to or from these land uses because of a lack of information about the effect
of current practices on SOC storage.
zSome non-agricultural lands are included in the inventory because those areas were converted to or from an agricultural use in
1992 or 1997.
§Includes a variety of land uses from beaches and marshes to mining and gravel pits.
UNC E RTA IN T Y ANALY S I S F O R AGR I CU LTURAL SOC S TORAGE 1527
r 2003 Blackwell Publishing Ltd, Global Change Biology, 9, 1521–1542
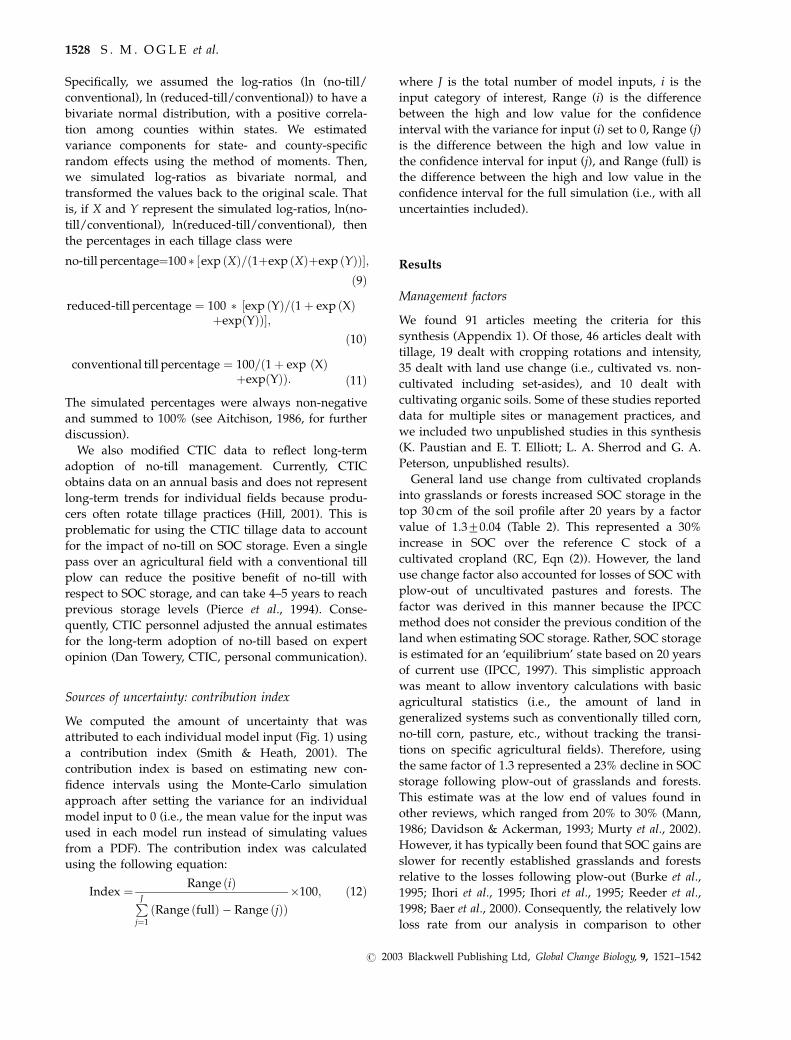
Specifically, we assumed the log-ratios (ln (no-till/
conventional), ln (reduced-till/conventional)) to have a
bivariate normal distribution, with a positive correla-
tion among counties within states. We estimated
variance components for state- and county-specific
random effects using the method of moments. Then,
we simulated log-ratios as bivariate normal, and
transformed the values back to the original scale. That
is, if X and Y represent the simulated log-ratios, ln(no-
till/conventional), ln(reduced-till/conventional), then
the percentages in each tillage class were
no-till percentage¼100 � ½exp ðXÞ=ð1þexp ðXÞþexp ðYÞÞ�;ð9Þ
reduced-till percentage ¼ 100 � ½exp ðYÞ=ð1þ exp ðXÞþexpðYÞÞ�;
ð10Þ
conventional till percentage ¼ 100=ð1þ exp ðXÞþexpðYÞÞ: ð11Þ
The simulated percentages were always non-negative
and summed to 100% (see Aitchison, 1986, for further
discussion).
We also modified CTIC data to reflect long-term
adoption of no-till management. Currently, CTIC
obtains data on an annual basis and does not represent
long-term trends for individual fields because produ-
cers often rotate tillage practices (Hill, 2001). This is
problematic for using the CTIC tillage data to account
for the impact of no-till on SOC storage. Even a single
pass over an agricultural field with a conventional till
plow can reduce the positive benefit of no-till with
respect to SOC storage, and can take 4–5 years to reach
previous storage levels (Pierce et al., 1994). Conse-
quently, CTIC personnel adjusted the annual estimates
for the long-term adoption of no-till based on expert
opinion (Dan Towery, CTIC, personal communication).
Sources of uncertainty: contribution index
We computed the amount of uncertainty that was
attributed to each individual model input (Fig. 1) using
a contribution index (Smith & Heath, 2001). The
contribution index is based on estimating new con-
fidence intervals using the Monte-Carlo simulation
approach after setting the variance for an individual
model input to 0 (i.e., the mean value for the input was
used in each model run instead of simulating values
from a PDF). The contribution index was calculated
using the following equation:
Index ¼ Range ðiÞPJ
j¼1
ðRange ðfullÞ � Range ðjÞÞ�100; ð12Þ
where J is the total number of model inputs, i is the
input category of interest, Range (i) is the difference
between the high and low value for the confidence
interval with the variance for input (i) set to 0, Range (j)
is the difference between the high and low value in
the confidence interval for input (j), and Range (full) is
the difference between the high and low value in the
confidence interval for the full simulation (i.e., with all
uncertainties included).
Results
Management factors
We found 91 articles meeting the criteria for this
synthesis (Appendix 1). Of those, 46 articles dealt with
tillage, 19 dealt with cropping rotations and intensity,
35 dealt with land use change (i.e., cultivated vs. non-
cultivated including set-asides), and 10 dealt with
cultivating organic soils. Some of these studies reported
data for multiple sites or management practices, and
we included two unpublished studies in this synthesis
(K. Paustian and E. T. Elliott; L. A. Sherrod and G. A.
Peterson, unpublished results).
General land use change from cultivated croplands
into grasslands or forests increased SOC storage in the
top 30 cm of the soil profile after 20 years by a factor
value of 1.370.04 (Table 2). This represented a 30%
increase in SOC over the reference C stock of a
cultivated cropland (RC, Eqn (2)). However, the land
use change factor also accounted for losses of SOC with
plow-out of uncultivated pastures and forests. The
factor was derived in this manner because the IPCC
method does not consider the previous condition of the
land when estimating SOC storage. Rather, SOC storage
is estimated for an ‘equilibrium’ state based on 20 years
of current use (IPCC, 1997). This simplistic approach
was meant to allow inventory calculations with basic
agricultural statistics (i.e., the amount of land in
generalized systems such as conventionally tilled corn,
no-till corn, pasture, etc., without tracking the transi-
tions on specific agricultural fields). Therefore, using
the same factor of 1.3 represented a 23% decline in SOC
storage following plow-out of grasslands and forests.
This estimate was at the low end of values found in
other reviews, which ranged from 20% to 30% (Mann,
1986; Davidson & Ackerman, 1993; Murty et al., 2002).
However, it has typically been found that SOC gains are
slower for recently established grasslands and forests
relative to the losses following plow-out (Burke et al.,
1995; Ihori et al., 1995; Ihori et al., 1995; Reeder et al.,
1998; Baer et al., 2000). Consequently, the relatively low
loss rate from our analysis in comparison to other
1528 S . M . OG L E et al.
r 2003 Blackwell Publishing Ltd, Global Change Biology, 9, 1521–1542

reviews was plausible since the factor represented both
types of conversions.
In addition to general land use change, the IPCC
method utilizes a separate factor for land that is set
aside from agricultural production, which has occurred
in the US through enrollment in the CRP. SOC storage
increased on set-aside lands by a factor of 1.270.03
over that found in reference croplands, which repre-
sented a 20% increase in the top 30 cm of the soil after
20 years (Table 2). As expected, the set-aside factor was
smaller than the general land use change factor because
recovery of SOC in land taken out of production is
slower than losses following plow-out, and as pre-
viously noted, the general land use change factor
represented both cases.
Land management also impacted SOC storage, but
varied depending on the practice. Changing from
conventional to no-till management increased storage
by a factor of 1.1370.03 in the top 30 cm after 20 years
(Table 2). In contrast, changing from conventional to
reduced till management had a minimal impact on
storage, estimated at a factor value of 1.0270.03. This
represented only a 2% change in storage for the top
30 cm after 20 years, and the uncertainty ranged below
a factor value of 1, suggesting that reduced tillage did
not always increase the amount of SOC storage relative
to conventionally tilled cropland. As for cropping
practices, changing from medium-input rotations to
high-input rotations increased SOC storage by a factor
of 1.0770.02 in the top 30 cm after 20 years (Table 2).
Changing from medium input to low-input rotations
decreased SOC storage by a factor of 0.9470.01, or 94%
of the amount of C found under the reference condition.
Lastly, C loss rates for cultivated cropland on organic
soils varied by climate, with the highest rates estimated
for the sub-tropical and warm temperate regions at
1473.3MgCha-1 yr� 1 and 1472.5MgCha� 1 yr� 1, re-
spectively, followed by the cool temperate region at
1172.5MgCha� 1 yr� 1 (Table 2).
Reference C stocks
Reference C stocks were computed for each climate
region by soil type, and the highest stocks were
estimated for volcanic soils, followed by spodisols
and wetland soils (Table 3). Not surprisingly, the sandy
soils had the lowest C stocks for most climate regions,
while the high- and low-activity mineral soils had
intermediate values. Across climates, moister regions
tended to have higher C stocks than dry regions, and
cool temperate regions tended to have higher stocks
than warm temperate or sub-tropical regions.
Land use and management trends (1982–1997)
Cultivated cropland declined in the US between 1982
and 1997, including losses in medium-, high-, and low-
input rotations, as well as the amount of area in rice
production (Table 4). Most of this land was set aside in
the CRP, but some cropland was lost to urban
expansion, development of new water bodies (e.g.,
lakes), or converted to miscellaneous non-cropland,
such as feedlots and mining operations. The amount of
land under other agricultural land uses remained
relatively stable, including those designated as range-
land, pasture, and perennial/horticultural cropland.
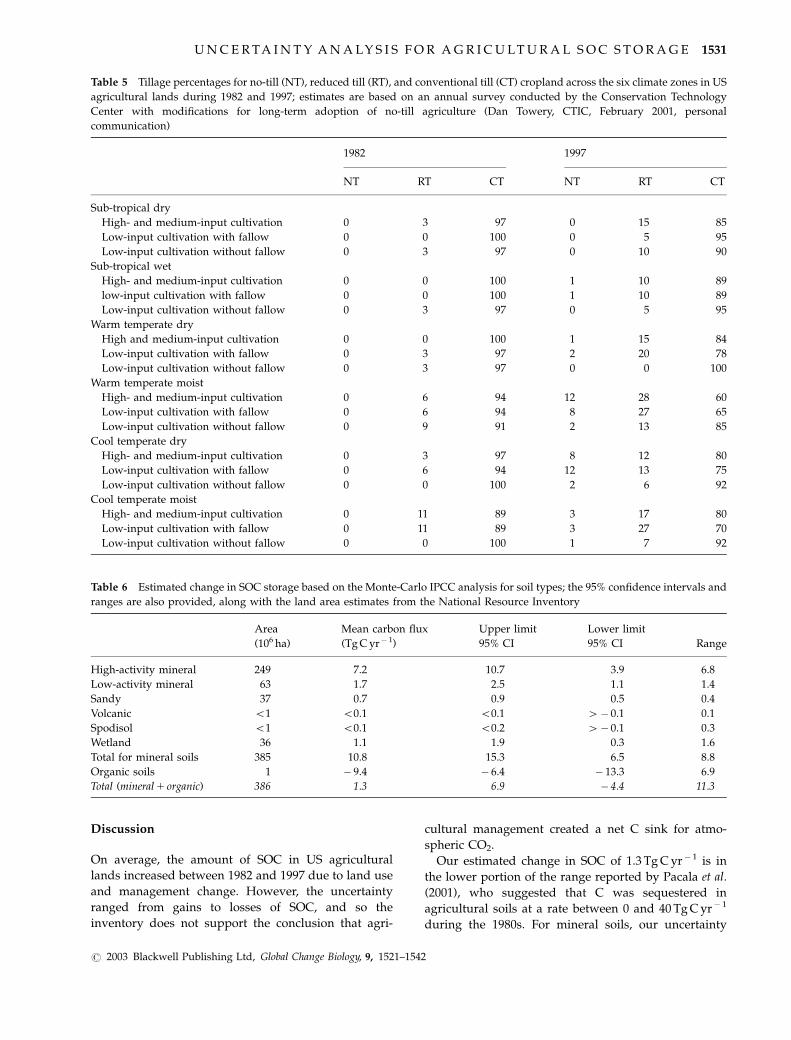
Conventional tillage was the most common practice
used across US agricultural lands between 1982 and
1997 (Table 5). Reduced tillage was the second most
common practice, ranging from 0% to around 30%
usage, depending on the region of interest and crop
type. No-till was the least common, with virtually 0%
usage in 1982, while climbing to about 12% usage for a
few crop types in select regions by 1997.
Table 2 US factor estimates (7SE) for management impacts
on soil organic carbon (SOC) storage in mineral soils, which
were derived from a synthesis of studies evaluating the effect
of changing management from a conventionally tilled agri-
cultural field with medium-input cropping; the factors
represent the change in SOC storage for the top 30 cm of the
soil profile after 20 years following the management change;
in addition, annual carbon loss rates (7SE) are provided for
the impact of draining organic soils for crop production
Management practices US factors
Land use
Cultivated 1
Uncultivated (general)*w 1.370.04
Set-asides (Conservation Reserve Program)w 1.270.03
Tillage
Conventional till 1
Reduced till 1.0270.03
No-till 1.1370.03
Cropping rotations and intensities
High 1.0770.02
Medium 1
Low 0.9470.01
Carbon loss rate for organic soils (MgCha� 1 yr� 1)
Cool temperate 1172.5
Warm temperate 1472.5
Sub-tropical 1473.3
*The uncultivated factor represents the difference in carbon
storage between the reference condition and the uncultivated
condition, and includes studies tracking changes following
‘plow-out’ as well as after converting land back into
uncultivated uses (i.e., pastures and forest).wRatios are back-transformed values as estimated from a
model fit with ln-transformed data (Eqn (5)).
UNC E RTA IN T Y ANALY S I S F O R AGR I CU LTURAL SOC S TORAGE 1529
r 2003 Blackwell Publishing Ltd, Global Change Biology, 9, 1521–1542
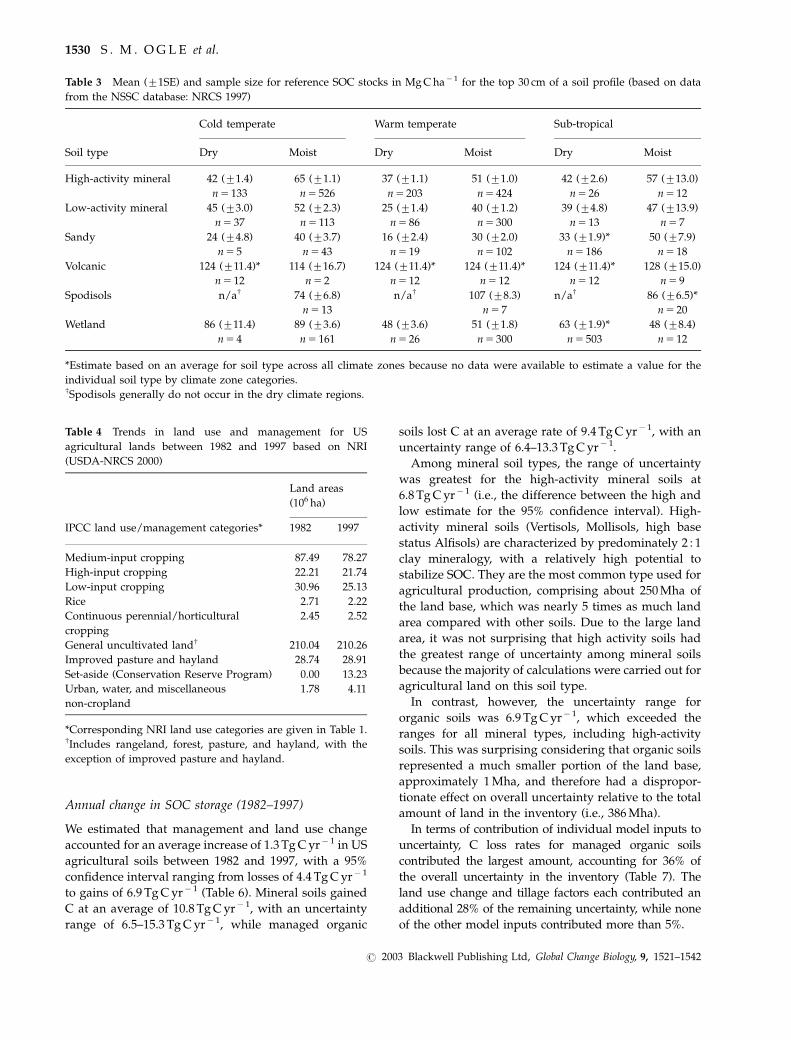
Annual change in SOC storage (1982–1997)
We estimated that management and land use change
accounted for an average increase of 1.3 TgCyr� 1 in US
agricultural soils between 1982 and 1997, with a 95%
confidence interval ranging from losses of 4.4 TgCyr� 1
to gains of 6.9 TgCyr� 1 (Table 6). Mineral soils gained
C at an average of 10.8 TgCyr� 1, with an uncertainty
range of 6.5–15.3 TgCyr� 1, while managed organic
soils lost C at an average rate of 9.4 TgCyr� 1, with an
uncertainty range of 6.4–13.3 TgCyr� 1.
Among mineral soil types, the range of uncertainty
was greatest for the high-activity mineral soils at
6.8 TgCyr� 1 (i.e., the difference between the high and
low estimate for the 95% confidence interval). High-
activity mineral soils (Vertisols, Mollisols, high base
status Alfisols) are characterized by predominately 2 : 1
clay mineralogy, with a relatively high potential to
stabilize SOC. They are the most common type used for
agricultural production, comprising about 250Mha of
the land base, which was nearly 5 times as much land
area compared with other soils. Due to the large land
area, it was not surprising that high activity soils had
the greatest range of uncertainty among mineral soils
because the majority of calculations were carried out for
agricultural land on this soil type.
In contrast, however, the uncertainty range for
organic soils was 6.9 TgCyr� 1, which exceeded the
ranges for all mineral types, including high-activity
soils. This was surprising considering that organic soils
represented a much smaller portion of the land base,
approximately 1Mha, and therefore had a dispropor-
tionate effect on overall uncertainty relative to the total
amount of land in the inventory (i.e., 386Mha).
In terms of contribution of individual model inputs to
uncertainty, C loss rates for managed organic soils
contributed the largest amount, accounting for 36% of
the overall uncertainty in the inventory (Table 7). The
land use change and tillage factors each contributed an
additional 28% of the remaining uncertainty, while none
of the other model inputs contributed more than 5%.
Table 3 Mean (71SE) and sample size for reference SOC stocks in MgCha� 1 for the top 30 cm of a soil profile (based on data
from the NSSC database: NRCS 1997)
Cold temperate Warm temperate Sub-tropical
Soil type Dry Moist Dry Moist Dry Moist
High-activity mineral 42 (71.4) 65 (71.1) 37 (71.1) 51 (71.0) 42 (72.6) 57 (713.0)
n5 133 n5 526 n5 203 n5 424 n5 26 n5 12
Low-activity mineral 45 (73.0) 52 (72.3) 25 (71.4) 40 (71.2) 39 (74.8) 47 (713.9)
n5 37 n5 113 n5 86 n5 300 n5 13 n5 7
Sandy 24 (74.8) 40 (73.7) 16 (72.4) 30 (72.0) 33 (71.9)* 50 (77.9)
n5 5 n5 43 n5 19 n5 102 n5 186 n5 18
Volcanic 124 (711.4)* 114 (716.7) 124 (711.4)* 124 (711.4)* 124 (711.4)* 128 (715.0)
n5 12 n5 2 n5 12 n5 12 n5 12 n5 9
Spodisols n/aw 74 (76.8) n/aw 107 (78.3) n/aw 86 (76.5)*
n5 13 n5 7 n5 20
Wetland 86 (711.4) 89 (73.6) 48 (73.6) 51 (71.8) 63 (71.9)* 48 (78.4)
n5 4 n5 161 n5 26 n5 300 n5 503 n5 12
*Estimate based on an average for soil type across all climate zones because no data were available to estimate a value for the
individual soil type by climate zone categories.wSpodisols generally do not occur in the dry climate regions.
Table 4 Trends in land use and management for US
agricultural lands between 1982 and 1997 based on NRI
(USDA-NRCS 2000)
Land areas
(106 ha)
IPCC land use/management categories* 1982 1997
Medium-input cropping 87.49 78.27
High-input cropping 22.21 21.74
Low-input cropping 30.96 25.13
Rice 2.71 2.22
Continuous perennial/horticultural
cropping
2.45 2.52
General uncultivated landw 210.04 210.26
Improved pasture and hayland 28.74 28.91
Set-aside (Conservation Reserve Program) 0.00 13.23
Urban, water, and miscellaneous
non-cropland
1.78 4.11
*Corresponding NRI land use categories are given in Table 1.wIncludes rangeland, forest, pasture, and hayland, with the
exception of improved pasture and hayland.
1530 S . M . OG L E et al.
r 2003 Blackwell Publishing Ltd, Global Change Biology, 9, 1521–1542
Discussion
On average, the amount of SOC in US agricultural
lands increased between 1982 and 1997 due to land use
and management change. However, the uncertainty
ranged from gains to losses of SOC, and so the
inventory does not support the conclusion that agri-
cultural management created a net C sink for atmo-
spheric CO2.
Our estimated change in SOC of 1.3 TgCyr� 1 is in
the lower portion of the range reported by Pacala et al.
(2001), who suggested that C was sequestered in
agricultural soils at a rate between 0 and 40TgCyr� 1
during the 1980s. For mineral soils, our uncertainty
Table 5 Tillage percentages for no-till (NT), reduced till (RT), and conventional till (CT) cropland across the six climate zones in US
agricultural lands during 1982 and 1997; estimates are based on an annual survey conducted by the Conservation Technology
Center with modifications for long-term adoption of no-till agriculture (Dan Towery, CTIC, February 2001, personal
communication)
1982 1997
NT RT CT NT RT CT
Sub-tropical dry
High- and medium-input cultivation 0 3 97 0 15 85
Low-input cultivation with fallow 0 0 100 0 5 95
Low-input cultivation without fallow 0 3 97 0 10 90
Sub-tropical wet
High- and medium-input cultivation 0 0 100 1 10 89
low-input cultivation with fallow 0 0 100 1 10 89
Low-input cultivation without fallow 0 3 97 0 5 95
Warm temperate dry
High and medium-input cultivation 0 0 100 1 15 84
Low-input cultivation with fallow 0 3 97 2 20 78
Low-input cultivation without fallow 0 3 97 0 0 100
Warm temperate moist
High- and medium-input cultivation 0 6 94 12 28 60
Low-input cultivation with fallow 0 6 94 8 27 65
Low-input cultivation without fallow 0 9 91 2 13 85
Cool temperate dry
High- and medium-input cultivation 0 3 97 8 12 80
Low-input cultivation with fallow 0 6 94 12 13 75
Low-input cultivation without fallow 0 0 100 2 6 92
Cool temperate moist
High- and medium-input cultivation 0 11 89 3 17 80
Low-input cultivation with fallow 0 11 89 3 27 70
Low-input cultivation without fallow 0 0 100 1 7 92
Table 6 Estimated change in SOC storage based on the Monte-Carlo IPCC analysis for soil types; the 95% confidence intervals and
ranges are also provided, along with the land area estimates from the National Resource Inventory
Area Mean carbon flux Upper limit Lower limit
(106 ha) (TgCyr� 1) 95% CI 95% CI Range
High-activity mineral 249 7.2 10.7 3.9 6.8
Low-activity mineral 63 1.7 2.5 1.1 1.4
Sandy 37 0.7 0.9 0.5 0.4
Volcanic o1 o0.1 o0.1 4� 0.1 0.1
Spodisol o1 o0.1 o0.2 4� 0.1 0.3
Wetland 36 1.1 1.9 0.3 1.6
Total for mineral soils 385 10.8 15.3 6.5 8.8
Organic soils 1 � 9.4 � 6.4 � 13.3 6.9
Total (mineral1 organic) 386 1.3 6.9 � 4.4 11.3
UNCERTA IN T Y ANALY S I S F O R AGR I CU LTURAL SOC S TORAGE 1531
r 2003 Blackwell Publishing Ltd, Global Change Biology, 9, 1521–1542

range of 6.5–15.3 TgCyr� 1 is more conservative than
Pacala et al. (2001), and this is likely because we did not
account for gradual or incremental changes in manage-
ment, particularly variation in fertilizer application
rates and crop varieties. The IPCC method is a simple
approach based on a categorical system that recognizes
major shifts in land use and management practices
(e.g., fertilized vs. non-fertilized), assessing the impact
during the first 20 years for purposes of crediting
emission offsets, but does not capture additional
changes in SOC resulting from variation in a practice
(e.g., changing fertilizer application rates). Producers
have used fertilizers and improved crop varieties since
the 1950s and 1960s in the US, and most croplands were
managed with these higher-input practices before the
inventory period from 1982 to 1997. For example,
90–100% of corn fields (or rotations with corn) have been
fertilized since the mid-1960s (USDA-ERS, 1994), but the
average rate of N fertilization has increased steadily
during the past few decades into the early 1990s
(USDA-ERS, 1994). While no specific estimate is
available with respect to the change in SOC storage
due to gradually increasing application rates, fertiliza-
tion has been shown to enhance storage by an average
of 7% in long-term experiments, ranging from 7 to 120
years (Paustian et al., 1997a), and it has been estimated
that this practice could sequester an additional
11.8 TgCyr� 1 in US agricultural soils in the future
(Lal et al., 1998). Similarly, organic fertilizers (i.e.,
manures and sewage sludge) have been used to
improve soil fertility, and this practice increased SOC
storage by an additional 4–6 TgCyr� 1 during the 1990s
(EPA, 2003). As with mineral fertilizers, though, much
of the C sequestration presumably occurred on lands
that have been managed with organic fertilizers for
decades, and these gradual increases are not captured
by the IPCC method. In contrast to fertilizer usage, the
types of cultivars planted in US croplands have not
been reported, but it is likely that producers have
consistently used the most productive varieties avail-
able for several decades, thus increasing SOC storage
due to incremental changes in this management
practice.
In addition, Pacala et al. (2001) did not account for
impacts of agricultural management on organic soils,
which have been shown to generate large fluxes of CO2
to the atmosphere (Armentano & Menges, 1986). We
found that the estimated loss of 9.4 TgCyr� 1 from
organic soils counteracted much of the gain in SOC
storage for mineral soils, even though managed organic
soils comprised less than 1% of all US agricultural land.
This large flux of CO2 to the atmosphere is unlikely to
change in the near future unless there is more effort to
conserve the organic horizon, such as by maintaining
water table depths near the rooting zone of crops
(Jongedyk et al., 1950; Shih et al., 1998) or by restoring
agricultural fields into wetlands.
C sequestration in mineral soils was mainly attrib-
uted to setting aside land through the CRP (Eve et al.,
2002). Of approximately 16 million hectares that under-
went land use change, the dominant trend was setting
aside about 13 million hectares from production. This
conversion was estimated to increase SOC storage by
an average of 20% over 20 years. In contrast, conserva-
tion tillage had little effect on SOC storage due to the
low rate of continuous no-till agriculture in the US
(Hill, 2001), even though this practice was estimated to
increase C storage by 13% over 20 years.
The majority of uncertainty using the IPCC method
resulted from estimating C loss rates for managed
organic soils, changes in SOC storage with shifts in land
use, particularly setting aside land in CRP, and the
effect of implementing conservation tillage. Bernoux
et al. (2001) also identified the management factors,
particularly land use change, as a key source of
uncertainty when using the IPCC method to estimate
stock changes in Brazil. The PDFs for land use change
and tillage management factors were estimated from
Table 7 Contribution index (Eqn (12)) for model inputs to overall uncertainty in the inventory results
Upper limit
95% CI
Lower limit
95% CI Range
Difference from
full simulation
Contribution
index (%)
Full simulation 6.9 � 4.4 11.3
Land use (NRI data) 6.8 � 4.2 11 0.3 4.6
Tillage practices (CTIC data) 6.8 � 4.3 11.1 0.2 3.1
Reference carbon stocks 6.9 � 4.4 11.3 o0.01 o1.0
Input factor 6.9 � 4.4 11.3 o0.01 o1.0
Tillage factor 5.9 � 3.6 9.5 1.8 27.7
Land use change factor 5.9 � 3.6 9.5 1.8 27.7
Improved pasture 6.8 � 4.4 11.2 0.1 1.5
Carbon loss rate (organic soils) 6.0 � 3.0 9 2.3 35.4
1532 S . M . OG L E et al.
r 2003 Blackwell Publishing Ltd, Global Change Biology, 9, 1521–1542

published studies (Appendix 1). Of course, studies
were not conducted for all or even most of the
combined management systems by climate region and
soil type across the US. The data were scaled to
represent impacts throughout the country in a manner
consistent with the original IPCC method. Reducing
uncertainty will rely upon future studies that improve
the scaling process and possibly revised scaling
procedures that diverge from the original method. In
addition, uncertainty in C loss rates from managed
organic soils may be reduced by directly measuring
CO2 emissions. Currently, loss rates are based on
subsidence data, which reflect not only losses from
decomposition of organic matter but also other impacts
following drainage, such as shrinkage of the drying
organic mat (Weir, 1950). Consequently, we had to
estimate the proportion of total subsidence that is
attributable to oxidation of the organic matter, introdu-
cing greater uncertainty than would presumably occur
with direct CO2 flux estimates.
Although current uncertainties lead us to conclude
that US agricultural soils were not a net C sink for
atmospheric CO2 between 1982 and 1997, these soils
have the potential to sequester considerable amounts of
C in the future beyond the baseline estimates from this
analysis (Lal et al., 1998; Bruce et al., 1999; Sperow et al.,
2003). This could be done through widespread adop-
tion of conservation management, particularly by
increasing the usage of no-till, eliminating fallow in
rotations, increasing the usage of winter cover crops,
and setting aside more of the highly erodible cropland
from cultivation than has currently occurred through
the CRP (Sperow et al., 2003). Using the IPCC method,
Sperow et al. (2003) estimated a potential C sequestra-
tion rate of 83.1 TgCyr� 1 on mineral soils through
widespread adoption of these conservation practices.
This estimate was consistent with other analyses for the
US, Canada, and Europe (Lal et al., 1998; Bruce et al.,
1999; Smith et al., 2000a, b), which have suggested that
the potential for C sequestration greatly exceeds current
rates. Interestingly, C sequestration at a rate of
83.1 TgCyr� 1 would exceed the CO2 emission reduc-
tions from the agricultural sector that would be
required under the Kyoto Protocol (Sperow et al.,
2003). Overall, though, the agricultural sector would
likely remain a net emitter of greenhouse gases even
with higher rates of C sequestration based on a full
accounting of all emissions and sinks involved in farm
operations, particularly CO2 losses from fossil fuel
usage (e.g., Schlesinger, 2000; West & Marland, 2002),
N2O losses from soil management, and CH4 losses from
livestock operations (EPA, 2003).
The current approach to estimate the change in SOC
storage due to land use and management provides
assurance about the magnitude of C sequestration in
agricultural soils, while maintaining the simplicity of
the IPCC method so that it can be applied with a
minimal amount of technology and resources. Of
course, mitigation of greenhouse gases in agricultural
systems will also depend on the net emissions of other
gases, particularly nitrous oxide and methane. Conse-
quently, future advancements should account for these
fluxes and associated uncertainties to address fully the
effectiveness of changing agricultural management for
purposes of mitigating greenhouse gas emissions (e.g.,
Robertson et al., 2000; Smith et al., 2001).
Acknowledgements
We appreciate the comments and recommendations on an earlierdraft of this work by scientists who attended a USDA NationalSoil Carbon Inventory Workshop in June 2002 that was hostedby Ron Follett and John Kimble. We are grateful for theassistance provided by Amy Swan, Kristen Howerton, MarkSperow, Mark Easter, Rich Conant, John Brenner, Johan Six,Kendrick Killian, Steve Williams, Dan Towery, MohammedKalkhan, Sharon Waltman, and Thomas Reinsch. This researchwas supported by the Environmental Protection Agency(Agreement No. 2W-2964-NAEX), USDA Agricultural ResearchService (Agreement No. 58-5402-6-109), and USDA/CSREES(Agreement No. 2001-38700-11092) through funding for theConsortium for Agricultural Soils Mitigation of GreenhouseGases (CASMGS).
References
Albert AR, Zeasman OR (1953) Farming muck and peat in
Wisconsin. Circular 456, University of Wisconsin Extension
Service, Madison, WI.
Aitchison J (1986) The Statistical Analysis of Compositional Data.
Chapman & Hall, London.
Angers DA, Bolinder MA, Carter MR et al. (1997) Impact of
tillage practices on organic carbon and nitrogen storage in
cool, humid soils of eastern Canada. Soil and Tillage Research,
41, 191–201.
Angers DA, Pesant A, Vigneux J (1992) Early cropping-induced
changes in soil aggregation, organic matter, and microbial
biomass. Soil Science Society of America Journal, 56, 115–119.
Angers DA, Voroney RP, Cote D (1995) Dynamics of soil organic
matter and corn residues affected by tillage practices. Soil
Science Society of America Journal, 59, 1311–1315.
Armentano TV (1979) The role of organic soils in the world
carbon cycle – problem analysis and research needs. Report to
the US Department of Energy, Number DOE/ET/10040-2,
Institute of Ecology, Indianapolis, IN.
Armentano TV, Menges ES (1986) Patterns of change in the
carbon balance of organic soil wetlands of the temperate zone.
Journal of Ecology, 74, 755–774.
Baer SG, Rice CW, Blair JM (2000) Assessment of soil quality in
fields with short and long term enrollment in the CRP. Journal
of Soil and Water Conservation, 55, 142–146.
UNC E RTA IN T Y ANALY S I S F O R AGR I CU LTURAL SOC S TORAGE 1533
r 2003 Blackwell Publishing Ltd, Global Change Biology, 9, 1521–1542

Batjes NH (2001) Options for increasing carbon sequestration in
West African soils: an exploratory study with special focus on
Senegal. Land Degradation and Development, 12, 131–142.
Bauer A, Black AL (1981) Soil carbon, nitrogen, and bulk density
comparisons, in two cropland tillage systems after 25 years
and in virgin grassland. Soil Science Society of America Journal,
45, 1166–1170.
Beare MH, Hendrix PF, Coleman DC (1994) Water-stable
aggregates and organic matter fractions in conventional- and
no-tillage soils. Soil Science Society of America Journal, 58, 777–
786.
Bernoux M, Carvalho MDCS, Volkoff B et al. (2001) CO2
emissions from mineral soils following land-cover change in
Brazil. Global Change Biology, 7, 779–787.
Black AL, Tanaka DL (1997) A conservation tillage-cropping
systems study in the northern Great Plains of the United
States. In: Soil organic Matter in Temperate Agroecosystems: Long-
term Experiments in North America (eds Paul EA, Elliot ET,
Paustian K, Cole CV), pp. 335–342. CRC Press, Boca Raton, FL.
Bordovsky DG, Choudhary M, Gerard CJ (1999) Effect of tillage,
cropping, and residue management on soil properties in the
Texas rolling plains. Soil Science, 164, 331–340.
Bowman RA, Anderson RL (2002) Conservation Reserve
Program: effects on soil organic carbon and preservation
when converting back to cropland in northeastern Colorado.
Journal of Soil and Water Conservation, 57, 121–126.
Bremer E, Janzen HH, Johnston AM (1994) Sensitivity of total,
light fraction and mineralizable organic matter to manage-
ment practices in a Lethbridge soil. Soil Science Society of
America Journal, 74, 131–138.
Bruce JP, Frome M, Haites E et al. (1999) Carbon sequestration in
soils. Journal of Soil and Water Conservation, 54, 382–389.
Burke IC, Elliott ET, Cole CV (1995) Influence of macroclimate,
landscape position, and management on soil organic matter in
agroecosystems. Ecological Applications, 5, 124–131.
Buyanovsky GA, Kucera CL, Wagner GH (1987) Comparative
analyses of carbon dynamics in native and cultivated
ecosystems. Ecology, 68, 2023–2031.
Buyanovsky GA, Wagner GH (1998) Carbon cycling in culti-
vated land and its global significance. Global Change Biology, 4,
131–141.
Campbell CA, Biederbeck VO, McConkey BG et al. (1999) Soil
quality-effect of tillage and fallow frequency. Soil organic
matter quality as influenced by tillage and fallow frequency in
a silt loam in southwestern Saskatchewan. Soil Biology and
Biochemistry, 31, 1–7.
Campbell CA, Bowren KE, Schnitzer M et al. (1991) Effect of crop
rotations and fertilization on soil organic matter and some
biochemical properties of a thick black Chernozem. Canadian
Journal of Soil Science, 71, 377–387.
Cambardella CA, Elliott ET (1994) Carbon and nitrogen
dynamics of soil organic matter fractions from cultivated
grassland soils. Soil Science Society of America Journal, 58, 123–
130.
Campbell CA, Lafond GP, Moulin AP, et al. (1997) Crop
production and soil organic matter in long-term crop rotations
in the sub-humid northern Great Plains of Canada. In: Soil
Organic Matter in Temperate Agroecosystems: Long-term Experi-
ments in North America (eds Paul EA, Elliot ET, Paustian K,
Cole CV), pp. 297–315. CRC Press, Boca Raton, FL.
Campbell CA, McConkey BG, Zentner RP et al. (1996) Long-term
effects of tillage and crop rotations on soil organic C and total
N in a clay soil in southwestern Saskatchewan. Canadian
Journal of Soil Science, 76, 395–401.
Campbell CA, Zentner RP (1997) Crop production and soil
organic matter in long-term crop rotations in the semi-arid
northern Great Plains of Canada. In: Soil Organic Matter in
Temperate Agroecosystems: Long-term Experiments in North
America (eds Paul EA, Elliot ET, Paustian K, Cole CV), pp.
317–334. CRC Press, Boca Raton, FL.
Campbell CA, Zentner RP, Selles F et al. (2000) Quantifying
short-term effects of crop rotations on soil organic carbon in
southwestern Saskatchewan. Canadian Journal of Soil Science,
80, 193–202.
Carter MR (1991) Evaluation of shallow tillage for spring cereals
on a fine sandy loam-2-Soil physical, chemical and biological
properties. Soil and Tillage Research, 21, 37–52.
Carter MR, Johnston HW, Kimpinski J (1988) Direct drilling and
soil loosening for spring cereals on a fine sandy loam in
Atlantic Canada. Soil and Tillage Research, 12, 365–384.
Carter MR, Sanderson JB, Ivany JA et al. (2002) Influence of
rotation and tillage on forage maize productivity, weed
species, and soil quality of a fine sandy loam in the cool-
humid climate of Atlantic Canada. Soil and Tillage Research, 67,
85–98.
Clapp CE, Allmaras RR, Layese MF et al. (2000) Soil organic
carbon and 13C abundance as related to tillage, crop residue,
and nitrogen fertilization under continuous corn management
in Minnesota. Soil and Tillage Research, 55, 127–142.
Cochran WG (1977) Sampling Techniques 3rd edn. Wiley,
New York.
Collins HP, Blevins RL, Bundy LG et al. (1999) Soil carbon
dynamics in corn-based agroecosystems: results from carbon-
13 natural abundance. Soil Science Society of America Journal, 63,
584–591.
Coote DR, Ramsey JF (1983) Quantification of the effects of over
35 years of intensive cultivation on four soils. Canadian Journal
of Soil Science, 63, 1–14.
CTIC (1998) 1998 Crop Residue Management Executive Summary.
Conservation Technology Information Center, West Lafay-
ette, IN.
Davidson EA, Ackerman IL (1993) Changes in soil carbon
inventories following cultivation of previously untilled soils.
Biogeochemistry, 20, 161–193.
Davis JR, Engberg CA (1955) A preliminary report of investiga-
tions of subsidence of organic soils in Michigan. Michigan
State Agricultural Experimental Station, East Lansing, MI.
Dick WA, Durkalski JT (1997) No-tillage production agriculture
and carbon sequestration in a typic fragiudalf soil of north-
eastern Ohio. In: Advances in Soil Science: Management of Carbon
Sequestration in Soil (eds Lal R, Kimble JM, Follett RF, Stewart
BA), pp. 59–71. CRC Press, Boca Raton, FL.
Dick WA, Edwards WM, McCoy EL (1997) Continuous applica-
tion of no-tillage to Ohio soils: changes in crop yields and
organic matter-related soil properties. In: Soil Organic Matter in
Temperate Agroecosystems: Long-term Experiments in North
1534 S . M . OG L E et al.
r 2003 Blackwell Publishing Ltd, Global Change Biology, 9, 1521–1542

America (eds Paul EA, Elliot ET, Paustian K, Cole CV), pp. 171–
182. CRC Press, Boca Raton, FL.
Doran JW, Elliott ET, Paustian K (1998) Soil microbial activity,
nitrogen cycling, and long-term changes in organic carbon
pools as related to fallow tillage management. Soil and Tillage
Research, 49, 3–18.
Duiker SW, Lal R (1999) Crop residue and tillage effects on
carbon sequestration in a Luvisol in central Ohio. Soil and
Tillage Research, 52, 73–81.
Edwards JH, Woods CW, Thurlow DL et al. (1992) Tillage and
crop rotation effects on fertility status of a Hapludult soil. Soil
Science Society of America Journal, 56, 1577–1582.
Eghball B, Mielke LN, McCallister DL et al. (1994) Distribution of
organic carbon and inorganic nitrogen in a soil under various
tillage and crop sequences. Journal of Soil and Water Conserva-
tion, 49, 201–205.
EPA. 2003 Inventory of U.S. greenhouse gas emissions and sinks:
1990–2001 US Environmental Protection Agency, Washington,
DC, http://www.epa.gov/globalwarming/publications/
emissions.
Eve MD, Paustian K, Follett R, et al. (2001a) A national inventory
of changes in soil carbon from Natural Resources Inventory
data. In: Assessment Methods for Soil Carbon (eds Lal R, Kimble
JM, Follett RF, Stewart BA), pp. 593–610. Lewis Publishers,
Boca Raton, FL.
Eve MD, Paustian K, Follett R, et al. (2001b) An inventory of
carbon emissions and sequestration in US cropland soils. In:
Soil Carbon Sequestration and the Greenhouse Effect (ed. Lal R),
pp. 51–65. SSSA Special Publication 57 Madison, WI.
Eve MD, Sperow M, Paustian K et al. (2002) National-scale
estimation of changes in soil carbon stocks on agricultural
lands. Environmental Pollution, 116, 431–438.
Follett RF (2001) Soil management concepts and carbon
sequestration in cropland soils. Soil and Tillage Research, 61,
77–92.
Follett RF, Paul EA, Leavitt SW et al. (1997) Carbon isotope ratios
of Great Plains soils and in wheat–fallow systems. Soil Science
Society of America Journal, 61, 1068–1077.
Follett RF, Peterson GA (1988) Surface soil nutrient distribution
as affected by wheat–fallow tillage systems. Soil Science Society
of America Journal, 52, 141–147.
Follett RF, Pruessner EG, Samson-Liebig SE, et al (2001) Carbon
sequestration under conservation reserve program in the
historic grassland soils of the United States of America. In: Soil
Management of Enhancing Carbon Sequestration (eds Lal R,
McSweeney K), pp. 27–40. SSSA Special Publication No. 57
Madison, WI.
Franzluebbers AJ, Arshad MA (1996) Water stable aggregation
and organic matter in four soils under conventional and zero
tillage. Canadian Journal of Soil Science, 76, 387–393.
Franzluebbers AJ, Hons FM, Zuberer DA (1995) Soil organic
carbon, microbial biomass, and mineralizable carbon and
nitrogen in sorghum. Soil Science Society of America Journal, 59,
460–466.
Franzluebbers AJ, Langdale GW, Schomberg HH (1999) Soil
carbon, nitrogen, and aggregation in response to type and
frequency of tillage. Soil Science Society of America Journal, 63,
349–355.
Frye WW, Blevins RL (1997) Soil organic matter under long-term
no-tillage and conventional tillage corn production in Ken-
tucky. In: Soil Organic Matter in Temperate Agroecosystems: Long-
term Experiments in North America (eds Paul EA, Elliot ET,
Paustian K, Cole CV), pp. 227–234. CRC Press, Boca Raton, FL.
Gebhart DL, Johnson HB, Mayeux HS et al. (1994) The CRP
increases soil organic carbon. Journal of Soil and Water
Conservation, 49, 488–492.
Gregorich EG, Ellert BH, Drury CF et al. (1996) Fertilization
effects on soil organic matter turnover and corn residue C
storage. Soil Science Society of America Journal, 60, 472–476.
Halvorson AD, Vigil MF, Peterson GA, et al. (1997) Long-term
tillage and crop residue management study at Akron,
Colorado. In: Soil Organic Matter in Temperate Agroeco-
systems: Long-term Experiments in North America (eds Paul
EA, Elliot ET, Paustian K, Cole CV), pp. 361–370. CRC Press,
Boca Raton, FL.
Halvorson AD, Wienhold BJ, Black AL (2002) Tillage, nitrogen,
and cropping system effects on soil carbon sequestration. Soil
Science Society of America Journal, 66, 906–912.
Hansmeyer TL, Linden DR, Allan DL, et al. (1997) Determining
carbon dynamics under no-till, ridge-till, chisel, and mold-
board tillage systems within a corn and soybean cropping
sequence. In: Advances in Soil Science: Management of Carbon
Sequestration in Soil (eds. Lal R, Kimble JM, Follett RF, Stewart
BA), pp. 93–97. CRC Press, Boca Raton, FL.
Hao X, Chang C, Lindwall CW (2001) Tillage and crop sequence
effects on organic carbon and total nitrogen content in an
irrigated Alberta soil. Soil and Tillage Research, 62, 167–169.
Harden JW, Sharpe JM, Parton WJ et al. (1999) Dynamic
replacement and loss of soil carbon on eroding cropland.
Global Biogeochemical Cycles, 13, 885–901.
Harris CI, Erickson HT, Ellis NK et al. (1962) Water-level control
in organic soil, as related to subsidence rate, crop yield, and
response to nitrogen. Soil Science, 94, 158–161.
Havlin JL, Kissel DE (1997) Management effects on soil organic
carbon and nitrogen in the east-central Great Plains of Kansas.
In: Soil Organic Matter in Temperate Agroecosystems: Long-term
Experiments in North America (eds Paul EA, Elliot ET, Paustian
K, Cole CV), pp. 381–386. CRC Press, Boca Raton, FL.
Hendrix PF (1997) Long-term patterns of plant production and
soil carbon dynamics in a Georgia piedmont agroecosystem.
In: Soil Organic Matter in Temperate Agroecosystems: Long-term
Experiments in North America (eds Paul EA, Elliot ET, Paustian
K, Cole CV), pp. 235–245. CRC Press, Boca Raton, FL.
Hill PR (2001) Use of continuous no-till and rotational tillage
systems in the central and northern corn belt. Journal of Soil
and Water Conservation, 56, 286–290.
Houghton RA, Hobbie JE, Melillo JM et al. (1983) Changes in the
carbon content of terrestrial biota and soils between 1860 and
1980: a net release of CO2 to the atmosphere. Ecological
Monographs, 53, 235–262.
Houghton RA (2001) Counting terrestrial sources and sinks of
carbon. Climatic Change, 48, 525–534.
Houghton RA (2003) Why are estimates of the terrestrial carbon
balance so different? Global Change Biology, 9, 500–509.
Ihori T, Burke IC, Lauenroth WK et al. (1995) Effects of
cultivation and abandonment on soil organic matter in
UNC E RTA IN T Y ANALY S I S F O R AGR I CU LTURAL SOC S TORAGE 1535
r 2003 Blackwell Publishing Ltd, Global Change Biology, 9, 1521–1542
northeastern Colorado. Soil Science Society of America Journal,
59, 1112–1119.
IPCC (1997) Revised 1996 IPCC Guidelines for National Green-
house Gas Inventories: Reference Manual (Vol. 3). eds
Houghton JT, Meira LG, Filho LG, Lim B, Treanton K, Mamaty
I, Bonduki Y, Griggs DJ, Callender BA), Intergovernmental
Panel on Climate Change. Hadley Centre, Bracknell, UK.
IPCC (2000) Good practice guidance and uncertainty manage-
ment in national greenhouse gas inventories. Intergovern-
mental Panel on Climate Change, http://www.ipcc-nggip.
iges.or.jp/public/gp/gpgaum.html
Irwin RW (1977) Subsidence of cultivated organic soil in Ontario.
Journal of the Irrigation and Drainage Division, 103, 197–205.
Janzen HH (1987) Soil organic matter characteristics after long-
term cropping to various spring wheat rotations. Canadian
Journal of Soil Science, 67, 845–856.
Jastrow JD, Boutton TW, Miller RM (1996) Carbon dynamics of
aggregate-associated organic matter estimated by carbon-13
natural abundance. Soil Science Society of America Journal, 60,
801–807.
Jongedyk HA, Hickok RB, Mayer ID, et al. (1950) Subsidence of
muck soils in Northern Indiana. Special Circulation 366.
Purdue University Agricultural Experiment Station, IN.
Karlen DL, Kumar A, Kanwar RS et al. (1998) Tillage system
effects on 15-year carbon-based and simulated N budgets in a
tile-drained Iowa field. Soil and Tillage Research, 48, 155–165.
Karlen DL, Rosek MJ, Gardner JC et al. (1999) Conservation
Reserve Program effects on soil quality indicators. Journal of
Soil and Water Conservation, 54, 439–444.
Karlen DL, Wollenhaupt NC, Erbach DC et al. (1994) Long-term
tillage effects on soil quality. Soil and Tillage Research, 32, 313–327.
Kern JS, Johnson MG (1993) Conservation tillage impacts on
national soil and atmospheric carbon levels. Soil Science Society
of America Journal, 57, 200–210.
Klepper O (1997) Multivariate aspects of model uncertainty
analysis: tools for sensitivity analysis and calibration. Ecolo-
gical Modelling, 101, 1–13.
Kros J, De Vries W, Janssen PHM et al. (1993) The uncertainty in
forecasting trends of forest soil acidification. Water, Air, and
Soil Pollution, 66, 29–58.
Kucharik CJ, Brye KR, Norman JM et al. (2001) Measurements
and modeling of carbon and nitrogen cycling in agroecosys-
tems of southern Wisconsin: potential for SOC sequestration
during the next 50 years. Ecosystems, 4, 237–258.
Lacelle B, Waltman S, Bliss N, et al (2001) Methods used to create
the North American soil organic carbon digital database. In:
Assessment Methods for Soil Carbon (eds Lal R, Kimble JM,
Follett RF, Stewart BA), pp. 485–494. Lewis Publishers, Boca
Raton, FL.
Lal R, Kimble JM, Follett RF, et al. (1998) The Potential of U.S.
Cropland to Sequester Carbon and Mitigate the Greenhouse Effect.
Sleeping Bear Press, Chelsea MI.
Lal R, Mahboubi AA, Fausey NR (1994) Long-term tillage and
rotation effects on properties of a central Ohio soil. Soil Science
Society of America Journal, 58, 517–522.
Lamb JA, Peterson GA, Fenster CR (1985) Wheat fallow tillage
systems’ effect on a newly cultivated grassland soils’ nitrogen
budget. Soil Science Society of America Journal, 49, 352–356.
Larney FJ, Bremer E, Janzen HH et al. (1997) Changes in total,
mineralizable and light fraction soil organic matter with
cropping and tillage intensities in semiarid southern Alberta,
Canada. Soil and Tillage Research, 42, 229–240.
Mann LK (1986) Changes in soil carbon storage after cultivation.
Soil Science, 142, 279–288.
McCarty GW, Lyssenko NN, Starr JL (1998) Short-term changes
in soil carbon and nitrogen pools during tillage management
transition. Soil Science Society of America Journal, 62, 1564–1571.
Mielke LN, Doran JW, Richards KA (1986) Physical environment
near the surface of plowed and no-tilled soils. Soil and Tillage
Research, 7, 355–366.
Murty D, Kirschbaum MUF, McMurtrie RE et al. (2002) Does
conversion of forest to agricultural land change soil carbon
and nitrogen? a review of the literature. Global Change Biology,
8, 105–123.
Nusser SM, Breidt FJ, Fuller WA (1998) Design and estimation
for investigating the dynamics of natural resources. Ecological
Applications, 8, 234–245.
Nusser SM, Goebel JJ (1997) The national resources inventory: a
long term monitoring programme. Environmental and Ecologi-
cal Statistics, 4, 181–204.
Nyborg M, Solberg ED, Malhi SS, et al. (1995) Fertilizer N, crop
residue, and tillage alter soil C and N content in a decade. In:
Advances in Soil Science: Soil Management and the Greenhouse
Effect (eds Lal R, Kimble J, Levine E, Stewart BA), pp. 93–99.
CRC Press, Boca Raton, FL.
Pacala SW, Hurtt GC, Baker D et al. (2001) Consistent land- and
atmosphere-based U.S. carbon sink estimates. Science, 292,
2316–2320.
Parent LE, Millette JA, Mehuys GR (1982) Subsidence and erosion
of a histosol. Soil Science Society of America Journal, 46, 404–408.
Paustian K, Andren O, Janzen HH et al. (1997a) Agricultural soils
as a sink to mitigate CO2 emissions. Soil Use and Management,
13, 230–244.
Paustian K, Collins HP, Paul EA (1997b) Management controls
on soil carbon. In: Soil Organic Matter in Temperate Agroecosys-
tems: Long-term Experiments in North America (eds Paul EA,
Elliot ET, Paustian K, Cole CV), pp. 15–49. CRC Press, Boca
Raton, FL.
Paustian K, Six J, Elliott ET et al. (2000) Management options for
reducing CO2 emissions from agricultural soils. Biogeochem-
istry, 48, 147–163.
Pierce FJ, Fortin M-C, Staton MJ (1994) Periodic plowing effects
on soil properties in a no-till farming system. Soil Science
Society of America Journal, 58, 1782–1787.
Post WM, Kwon KC (2000) Soil carbon sequestration and land-
use change: processes and potential. Global Change Biology, 6,
317–327.
Potter KN, Jones OR, Torbert HA et al. (1997) Crop rotation and
tillage effects on organic carbon sequestration in the semiarid
southern Great Plains. Soil Science, 162, 140–147.
Potter KN, Torbert HA, Johnson HB et al. (1999) Carbon storage
after long-term grass establishment on degraded soils. Soil
Science, 164, 718–725.
Rasmussen PE, Albrecht SL (1997) Crop management effects on
organic carbon in semi-arid Pacific northwest soils. In:
Advances in Soil Science: Management of Carbon Sequestration in
1536 S . M . OG L E et al.
r 2003 Blackwell Publishing Ltd, Global Change Biology, 9, 1521–1542

Soil (eds Lal R, Kimble JM, Follett RF, Stewart BA), pp. 209–
219. CRC Press, Boca Raton, FL.
Reeder JD, Schuman GE, Bowman RA (1998) Soil C and N
changes on conservation reserve program lands in the central
Great Plains. Soil and Tillage Research, 47, 339–349.
Rhoton FE, Bruce RR, Buehring NW et al. (1993) Chemical and
physical characteristics of four soil types under conventional
and no-tillage systems. Soil and Tillage Research, 28, 51–61.
Richardson CJ (1981) Pocosins: ecosystem processes and the
influence of man on system response. In: Pocosins wetlands: an
integrated analysis of coastal plain freshwater bog in North
Carolina (ed. Richardson CJ), pp. 135–151. Hutchinson Ross
Publishing Co., Stroudsberg, PA, USA.
Robertson GP, Paul EA, Harwood RR (2000) Greenhouse gases in
intensive agriculture: contributions of individual gases to the
radiative forcing of the atmosphere. Science, 289, 1922–1925.
Robles MD, Burke IC (1998) Soil organic matter recovery on
conservation reserve program fields in southeastern Wyom-
ing. Soil Science Society of America Journal, 62, 725–730.
Rojstaczer S, Deverel SJ (1993) Time dependence in atmospheric
carbon inputs from drainage of organic soils. Geophysical
Research Letters, 20, 1383–1386.
Sainju UM, Singh BP, Whitehead WF (2002) Long-term effects of
tillage, cover crops, and nitrogen fertilization on organic
carbon and nitrogen concentrations in sandy loam soils in
Georgia, USA. Soil and Tillage Research, 63, 167–179.
Salinas-Garcia JR, Hons FM, Matocha JE (1997) Long-term effects
of tillage and fertilization on soil organic matter dynamics. Soil
Science Society of America Journal, 61, 152–159.
Schimel DS (1995) Terrestrial ecosystems and the carbon cycle.
Global Change Biology, 1, 77–91.
Schlesinger WH (2000) Carbon sequestration in soils: some
cautions amidst optimism. Agriculture, Ecosystems and Envir-
onment, 82, 121–127.
Shih SF, Glaz B, Barnes RE Jr (1998) Subsidence of organic soils
in the everglades agricultural area during the past 19 years.
Soil and Crop Science Society of Florida Proclamation, 57, 20–29.
Six J, Elliott ET, Paustian K et al. (1998) Aggregation and soil
organic matter accumulation in cultivated and native grass-
land soils. Soil Science Society of America Journal, 62, 1367–1377.
Six J, Paustian K, Elliott ET et al. (2000) Soil structure and organic
matter: I. Distribution of aggregate-size classes and aggregate-
associated carbon. Soil Science Society of America Journal, 64, 681–689.
Slobodian N, Van Rees K, Pennock D (2002) Cultivation-induced
effects on belowground biomass and organic carbon. Soil
Science Society of America Journal, 66, 924–930.
Smith WN, Desjardins RL, Pattey E (2000a) The net flux of
carbon from agricultural soils in Canada 1970–2010. Global
Change Biology, 6, 557–568.
Smith P, Goulding KW, Smith KA et al. (2001) Enhancing the
carbon sink in European agricultural soils: including trace gas
fluxes in estimates of carbon mitigation potential. Nutrient
Cycling in Agroecosystems, 60, 237–252.
Smith JE, Heath LS (2001) Identifying influences on model
uncertainty: an application using a forest carbon budget
model. Environmental Management, 27, 253–267.
Smith P, Powlson DS, Smith JU et al. (2000b) Meeting Europe’s
climate change commitments quantitative estimates of the
potential for carbon mitigation in agriculture. Global Change
Biology, 6, 525–539.
Sperow M, Eve MD, Paustian K (2003) Potential soil C seque-
stration on US-agricultural soils. Climatic Change, 57, 319–339.
Subak S (2000) Agricultural soil carbon accumulation in North
America: considerations for climate policy. Global Environ-
mental Change, 10, 185–195.
Tiessen H, Stewart JWB, Bettany JR (1982) Cultivation effects on
the amounts and concentrations of carbon, nitrogen, and
phosphorus in grassland soils. Agronomy Journal, 74, 831–835.
Turner RE, Neill C (1984) Revisiting impounded wetlands after
70 years. In: Proceedings of the Water Quality and Wetland
Management Conference, pp. 309–321.
UNFCCC (1997) Kyoto protocol to the United Nations Frame-
work Convention on Climate Change. Document found at
http://unfccc.int/resource/docs/convkp/kpeng.html.
Unger PW (2001) Total carbon, aggregation, bulk density, and
penetration resistance of cropland and nearby grassland soils.
In: Soil Carbon Sequestration and the Greenhouse Effect (ed. Lal R),
pp. 77–92. SSSA Special Publication No. 57, Madison, WI.
USDA-ERS (1994) Fertilizer use and practice statistics (86012).
Data product Economic Research Service, United States
Department of Agricultural, Document found at http://
www.ers.usda.gov/data/sdp/.
USDA-NRCS (1997) National Soil Survey Laboratory Characteriza-
tion Data Digital Data. USDA-NRCS, Lincoln, NE.
USDA-NRCS (2000) Summary Report 1997 National Resources
Inventory (revised December 2000). Iowa State University
Statistical Laboratory, Ames, IA.
Vitousek PM, Mooney HA, Lubchenco J et al. (1997) Human
domination of earth’s ecosystems. Science, 277, 494–499.
Voroney RP, Van Veen JA, Paul EA (1981) Organic C dynamics in
grassland soils. 2. Model validation and simulation of the
long-term effects of cultivation and rainfall erosion. Canadian
Journal of Soil Science, 61, 211–224.
Wander MM, Bidart MG, Aref S (1998) Tillage impacts on
depth distribution of total and particulate organic matter in
three Illinois soils. Soil Science Society of America Journal, 62,
1704–1711.
Wanniarachchi SD, Voroney RP, Vyn TJ et al. (1999) Tillage effects
on the dynamics of total and corn-residue-derived soil organic
matter in two southern Ontario soils. Canadian Journal of Soil
Science, 79, 473–480.
Watson RT, Noble IR, Bolin B, et al. (2000) Land Use, Land-Use
Change, and Forestry.Intergovernmental Panel on Climate
Change, Cambridge University Press, Cambridge.
Weir WW (1950) Subsidence of peat lands of the Sacramento-San
Joaquin Delta, California. Hilgardia, 20, 37–56.
West TO, Marland G (2002) A synthesis of carbon sequestration,
carbon emissions, and net carbon flux in agriculture: compar-
ing tillage practices in the United States. Agriculture, Ecosys-
tems and Environment, 91, 217–232.
Woods LE (1989) Active organic matter distribution in the
surface 15 cm of undisturbed and cultivated soil. Biology and
Fertility of Soils, 8, 271–278.
Yang X-M, Wander MM (1999) Tillage effects on soil organic
carbon distribution and storage in a silt loam soil in Illinois.
Soil and Tillage Research, 52, 1–9.
UNC E RTA IN T Y ANALY S I S F O R AGR I CU LTURAL SOC S TORAGE 1537
r 2003 Blackwell Publishing Ltd, Global Change Biology, 9, 1521–1542

Yang XM, Kay BD (2001) Impacts of tillage practices on total,
loose- and occluded-particulate, and humified organic carbon
fractions in soils within a field in southern Ontario. Canadian
Journal of Soil Science, 81, 149–156.
Zhang H, Thompson ML, Sandor JA (1988) Compositional
differences in organic matter among cultivated and unculti-
vated Argiudolls and Hapludalfs derived from loess. Soil
Science Society of America Journal, 52, 216–222.
1538 S . M . OG L E et al.
r 2003 Blackwell Publishing Ltd, Global Change Biology, 9, 1521–1542

Appendix
1.Publish
edstudiesusedin
theanalysisto
estim
ate
theim
pact
ofagricu
lturalmanagementonSOC
storage
Study
Location
Tim
espan
(years)
Depth
(cm)
Tillage*
Inpu
twLanduse
change
(cultivation)z
Organic
soil
Albert&
Zeasm
an(1953)
Wisconsin
35Gen
eral
�
Angerset
al.(1992)
Len
noxville,Queb
ec3
24Gen
eral
Angerset
al.(1995)
StLam
bert,Queb
ec11
24RT
Angerset
al.(1997)
Charlottetown,P.E.I.
860
RT
Delhi,Ontario
460
NT
Harrington,P.E.I.
860
NT
Harrow,Ontario
1160
NT
LaPocatiere,
Queb
ec6
60NT
Norm
andin,Queb
ec3,
460
RT,NT
Ottaw
a,Ontario
560
NT
Arm
entano(1979)
New
York
60Set-aside
�Baeret
al.(2000)
Gag
ean
dSaline
Counties,NE
1010
Bau
er&
Black
(1981)
GrantCounty,ND
2545.7
RT
Beare
etal.(1994)
Athen
s,GA
1315
NT
Black
andTan
aka(1997)
MortonCounty,ND
691.2
RT,NT
LBordovskyet
al.(1999)
Munday,TX
3,8
10RT
HBowman
&Anderson(2002)
Northeastern
Colorado
415
NT,RT
Gen
eral
Bremer
etal.(1994)
Lethbridge,
Alberta
7,41
30L
Set-aside
Burkeet
al.(1995)
WeldCounty,CO
5310
Gen
eral
Buyan
ovksy
etal.(1987)
Columbia,MO
9650
Gen
eral
Buyan
ovsky&
Wag
ner
(1998)
Columbia,MO
2520
HGen
eral
Cam
bardella
&Elliott(1994)
Sidney,NE
2020
Cam
pbell&
Zen
tner
(1997)
SwiftCurren
t,Saskatch
ewan
10,15,18,24
15L
Cam
pbellet
al.(1991)
Melfort,Saskatch
ewan
3115
H,L
Cam
pbellet
al.(1996)
StewartValley,
Saskatch
ewan
3,7,
1115
NT
L
Cam
pbellet
al.(1997)
IndianHead,
Saskatch
ewan
3015
L
Cam
pbellet
al.(1999)
SwiftCurren
t,Saskatch
ewan
5,9,
13,18
15NT
L
Cam
pbellet
al.(2000)
SwiftCurren
t,Saskatch
ewan
1030
H,L
Carter(1991)
Charlottetown,P.E.I.
320
RT,NT
Carteret
al.(1988)
Charlottetown,P.E.I.
320
NT
Carteret
al.(2002)
Charlottetown,P.E.I.
516
NT
Clappet
al.(2000)
Rosemount,MN
1330
RT,NT
Gen
eral
Collinset
al.(1999)
Lexington,KY
2250
Gen
eral
Coote
&Ram
sey(1983)
Ottaw
a,Ontario
3530
Dav
is&
Engberg(1955)
Michigan
5�
Dick&
Durkalski(1997)
Wooster,OH
3130
NT
HDicket
al.(1997)
Wooster,OH
945
RT,NT
HGen
eral
Doranet
al.(1998)
Sidney,NE
1130
11,22
30,20
NT,RT
(Continued)
U N C E RTA IN T Y ANALY S I S F O R AGR I CU LTURAL SOC S TORAGE 1539
r 2003 Blackwell Publishing Ltd, Global Change Biology, 9, 1521–1542

Appendix
1.(C
ont.)
Study
Location
Tim
espan
(years)
Depth
(cm)
Tillage*
Inpu
twLanduse
change
(cultivation)z
Organic
soil
Duiker
&Lal
(1999)
Columbus,
OH
710
RT,NT
Edwardset
al.(1992)
Crossville,AL
1120
NT
Eghballet
al.(1994)
Lincoln,NE
1130
RT,NT
Gen
eral
Follett&
Peterson(1988)
Sidney,NE
16,17
20RT,NT
Gen
eral
Follettet
al.(1997)
Akron,CO
8460
Gen
eral
Sydney,NE
2330
Set-aside
Follettet
al.(2001)
Akron,CO
630
Set-aside
Boley,
OK
1030
Set-aside
Bush
land,TX
830
Set-aside
Columbia,MO
730
Set-aside
Dalhart,TX
830
Set-aside
Dorothy,
MN
730
Set-aside
Glencoe,
MN
930
Set-aside
Indianola,IA
830
Set-aside
Lincoln,NE
630
Set-aside
Man
dan
,ND
1030
Set-aside
Med
ina,
MN
1030
Set-aside
Roseau
,MN
730
Set-aside
Sidney,MT
530
Set-aside
Vinson,OK
1030
Franzlueb
berset
al.(1995)
William
sonCounty,TX
1020
NT
Franzlueb
bers&
Arshad
(1996)
Alberta
4,6
20NT
British
Columbia
7,16
20NT
Franzlueb
berset
al.(1999)
Watkinsville,GA
415
NT
Gen
eral
Frye&
Blevins(1997)
Lexington,KY
5,19
30Set-aside
Geb
hartet
al.(1994)
Atw
ood,KS
5300
Set-aside
Big
Springs,
TX
5300
Set-aside
Colby,
KS
5300
Set-aside
Sem
inole,TX
5300
Set-aside
Valen
tine,
NE
5300
Gen
eral
Gregorich
etal.(1996)
Woodslee,Ontario
3240
Halvorsonet
al.(1997)
Akron,CO
1520
NT
Halvorsonet
al.(2002)
Man
dan
,ND
1230.4
NT
LHan
smey
eret
al.(1997)
Rosemount,MN
47.5
RT,NT
Hao
etal.(2001)
Lethbridge,
Ontario
430
RT
Gen
eral
Harden
etal.(1999)
Tatean
dPan
ola
Coun-
ties,MS
127
40
Harriset
al.(1962)
Indiana
�Hav
lin&
Kissel(1997)
Man
hattan,KS
1115
NT
Hen
drix(1997)
Athen
s,GA
4,5,
6,7,
21NT
8,10,12
Gen
eral
Ihori
etal.(1995)
WeldCounty,CO
5030
Irwin
(1977)
Ontario
35�
Janzen(1987)
Lethbridge,
Alberta
3330
LKarlenet
al.(1994)
Lan
caster,W
I12
5RT,NT
Karlenet
al.(1998)
Nashua,
IA15
20RT,NT
Set-aside
1540 S . M . OG L E et al.
r 2003 Blackwell Publishing Ltd, Global Change Biology, 9, 1521–1542

Karlenet
al.(1999)
Butler
Co.,IA
67.5
Set-aside
Hen
ryCo.,IA
27.5
Set-aside
Minnesota
67.5
Set-aside
NorthDak
ota
57.5
Set-aside
Washington
57.5
Lal
etal.(1994)
Wooster,OH
2915
RT,NT
Gen
eral
Lam
bet
al.(1985)
Sidney,NE
1830
Larney
etal.(1997)
Lethbridge,
Alberta
7,8,
1515
RT,NT
LMcC
arty
etal.(1998)
Maryland
320
NT
Mielkeet
al.(1986)
Elw
ood,IL
630
NT
Lincoln,NE
630
NT
Sidney,NE
1230
NT
Waseca,
MN
6,11
30NT
Nyborg
etal.(1995)
Breton,Alberta
1115
NT
Ellerslie,Alberta
1115
NT
Paren
tet
al.(1982)
Queb
ec38
�Pau
stian&
Elliott,unpublish
edresu
lts
Bush
land,TX
12100
LGen
eral
Griffin,GA
1810
0NT
Hickory
Corners,
MI
53100
NT
Gen
eral
HorseshoeBen
d,GA
1425
Gen
eral
Hoytville,OH
29100
NT
IndianHead,
Saskatch
ewan
35100
L
Kutztown,PA
11100
HLethbridge,
Alberta
41100
LGen
eral
Man
hattan,KS
92,17
90RT,NT
Melfort,Saskatch
ewan
3550
LGen
eral
Sidney,NE
22100
South
Charleston,OH
30100
RT,NT
Sterling,CO
7100
NT
Gen
eral
Stratton,CO
7100
Gen
eral
SwiftCurren
t,Saskatch
ewan
2625
Walsh
,CO
7100
NT
LGen
eral
WestLafey
ette,IN
12100
RT,NT
Gen
eral
Wooster,OH
3075
RT,NT
Potter
etal.(1997)
Bush
land,TX
10100
LSet-aside
Potter
etal.(1999)
Burleson,TX
26120
Set-aside
Riesel,TX
60120
Set-aside
Tem
ple,TX
6120
Gen
eral
Rasmussen
&Albrech
t(1997)
Pen
dleton,OR
59,28,40
20RT
LSet-aside
Reeder
etal.(1998)
Arvad
a,W
Y4,
6325
Set-aside
Keeline,
WY
4,33
28Rhotonet
al.(199
3)Auburn,AL
515
NT
Jackson,TN
915
NT
Verona,
MS
515
NT
Watkinsville,GA
1515
NT
Study
Location
Tim
espan
(years)
Depth
(cm)
Tillage*
Inpu
twLanduse
change
(cultivation)z
Organic
soil
(Continued)
U N C E RTA IN T Y ANALY S I S F O R AGR I CU LTURAL SOC S TORAGE 1541
r 2003 Blackwell Publishing Ltd, Global Change Biology, 9, 1521–1542

Richardson(1981)
NorthCarolina
50Set-aside
�Robles&
Burke(1998)
Chugwater,W
Y6
5Rojstaczer
&Dev
erel
(1993)
California
70�
Sainju
etal.(2002)
Fort
Valley,
GA
1,2,
3,4,
520
NT
Salinas-G
arciaet
al.(1997)
CorpusChristi,TX
1620
RT,NT
Set-aside
Sherrod&
Peterson,
unpublish
edresu
lts
Sterling,CO
1220
LSet-aside
Stratton,CO
1220
LSet-aside
Walsh
,CO
1220
LShih
etal.(1998)
Florida
54–60
Gen
eral
�Six
etal.(1998)
Sidney,NE
2520
Gen
eral
Six
etal.(2000)
Lexington,KY
2520
NT
Hickory
Corners,
MI
920
NT
Wooster,OH
3320
NT
Gen
eral
Slobodianet
al.(2002)
StDen
is,Saskatch
ewan
49120
Gen
eral
Tiessen
etal.(1982)
Blaine
Lak
e,Saskatch
-ew
an4,
60,90
30Gen
eral
Bradwell,
Saskatch
e-wan
6530
Gen
eral
Sutherland,Saskatch
e-wan
7031
Turner
&Neill(1984)
Louisiana
10Set-aside,
Gen
eral
�Unger
(2001)
Oldham
County,TX
10,78
30Set-aside,
Gen
eral
Swisher
County,TX
10,48
30Set-aside,
Gen
eral
Hutchinson
County,
TX
10,40
30Set-aside,
Gen
eral
Moore
County,TX
10,40
30Set-aside,
Gen
eral
Arm
strongCounty,TX
10,50
30Set-aside,
Gen
eral
BriscoeCounty,TX
10,43
30Set-aside,
Gen
eral
Dallam
County,TX
10,40
30Set-aside,
Gen
eral
CarsonCounty,TX
10,40
30Set-aside,
Gen
eral
Potter
County,TX
10,78
30Gen
eral
Voroney
etal.(1981)
IndianHead,Saskatch
-ew
an70
50
Wan
der
etal.(1998)
DeK
alb,IL
1030
NT
Monmouth,IL
1030
NT
Perry,IL
1030
NT
Wan
niarach
chiet
al.(1999)
Delhi,Ontario
6,14
50NT,RT
Gen
eral
Woods(1989)
WeldCounty,CO
415
Yan
g&
Wan
der
(1999)
Urban
a,IL
1190
RT,NT
Yan
g&
Kay
(2001)
SouthernOntario
1960
NT
Gen
eral
Zhan
get
al.(1988)
Hardin
County,IA
120
20Gen
eral
* RTindicates
reducedtillag
eim
pacts,an
dNTindicates
no-tillim
pacts.
w Hindicates
high-inputrotationsan
dLindicates
low-inputrotations.
z Set-asideindicates
thestudydealtwithim
pacts
forlandremoved
from
agricu
lturalproduction(i.e.,ConservationReserveProgram)an
dGen
eral
deals
withnon-specificland
use
chan
ges
betweencu
ltivated
anduncu
ltivated
conditions.
Appendix
1.(C
ont.)
Study
Location
Tim
espan
(years)
Depth
(cm)
Tillage*
Inpu
twLanduse
change
(cultivation)z
Organic
soil
1542 S . M . OG L E et al.
r 2003 Blackwell Publishing Ltd, Global Change Biology, 9, 1521–1542