uncertainty and bias - course websites · uncertainty and bias ... how to report your measurement...
TRANSCRIPT

Uncertainty and Bias UIUC, 403 Advanced Physics Laboratory
I can live with doubt and uncertainty and not knowing. I think it is much more interesting to live not knowing than to have answers that might be wrong. - Richard Feynman
Liang Yang*
If your experiment needs statistics, you ought to have done a better experiment. – Lord Ernest Rutherford
* Talk based on lectures by Matthias Perdekamp and David Herzog 1
There are three kinds of lies: lies, damned lies and statistics. – Benjamin Disraeli

How to report your measurement results?
• Always include uncertainty estimates in your results.
• Have the correct number of significant digits.
Examples: Origin fit result, V = 0.122349 m/s, σs = 0.01298 m/s You should report V = 0.122 ± 0.013 m/s
2
Measurement result, T = 3.745 x 10⁻³ s, σT = 0.0798 ms You should report T = (3.75 ± 0.08)x10-3 s
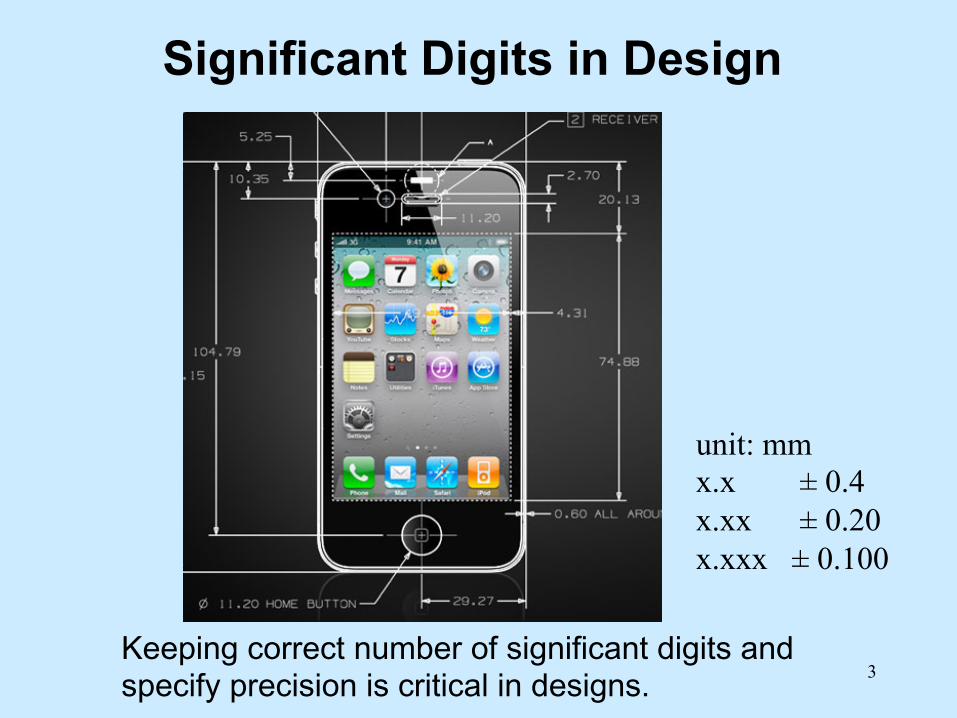
3 Keeping correct number of significant digits and specify precision is critical in designs.
unit: mm x.x ± 0.4 x.xx ± 0.20 x.xxx ± 0.100
Significant Digits in Design

Uncertainty Propagation
4
Example formula from Wikipedia
In most cases for this class, variables are uncorrelated, therefore the correlation term can be safely ignored. Before using the formula, you should check if your assumption about variable correlation is warranted.

Systematic vs. Statistical Uncertainties
5
• Systematic uncertainty – Uncertainties associated with imperfect knowledge of
measurement apparatus, other physical quantities needed for the measurement, or the physical model used to interpret the data.
– Generally correlated between measurements. Cannot be reduced by multiple measurements.
– Better calibration, or measurement of other variable can reduce the uncertainty.
• Statistical Uncertainty – Uncertainties due to stochastic fluctuations – Generally there is no correlation between successive
measurements. – Multiple measurements can be used to reduce to estimate the
uncertainty.

Gaussian Distribution
6
Most statistic uncertainties have the characteristic that, as the sample size becomes large, the shape of the histogram tends to that of the normal distribution.
One can fit the data to a Gaussian, or calculate the mean and variance.
The assumption is not always true!
What if an experiment doesn't give the result you expected? What if it gives a result that you just know is wrong in some way? Don't you keep trying until you get the "right" result?
Note: relevant here in our modern physics lab course where the “right”
result was, in general, published a long time ago
Bias, Data Selection?
7
How common is data “rejection”? Answer: Common • Realities of complex experiments
– Stuff goes wrong – Equipment malfunctions – People make mistakes
• Burden on the physicist – Record everything
• Responsibility of physicist – Develop a “result-unbiased” algorithm for data
rejection • Make decisions before you look at the results • Keep answer in a “blind” or unbiased space • You can rarely use the result to determine inclusion
8

Rejection of Data from J. Taylor, Ch. 6 of An Introduction to Error Analysis
Consider 6 measurements of a pendulum period : 3.8, 3.5, 3.9, 3.9, 3.4, 1.8
Should the last measurement be rejected?Yes: If some aspect of the experiment was changed ... new “slow”
stopwatch, etc.No: Never! You must always keep all data !! (diehards; beware)Maybe? The usual case. You don’t know why, but something may have
made this measurement “bad.” How do you set you set up ajudgement that is unbiased?
First, compute some simple statistics:Mean of measurements:
83.x =
Standard deviation: ( ) 801 2 .xxN ix =∑ −=σ
Is the 1.8 measurement anomalous? It differs by 2σ (1.6) from the mean.
3.4
0.73
≈ 2.2 σ
judge in an unbiased manner ?
An elementary test to indicate if you might have a problem with your data
10

Rejection of Data from J. Taylor, Ch. 6 of An Introduction to Error Analysis
Consider 6 measurements of a pendulum period : 3.8, 3.5, 3.9, 3.9, 3.4, 1.8
Should the last measurement be rejected?Yes: If some aspect of the experiment was changed ... new “slow”
stopwatch, etc.No: Never! You must always keep all data !! (diehards; beware)Maybe? The usual case. You don’t know why, but something may have
made this measurement “bad.” How do you set you set up ajudgement that is unbiased?
First, compute some simple statistics:Mean of measurements:
83.x =
Standard deviation: ( ) 801 2 .xxN ix =∑ −=σ
Is the 1.8 measurement anomalous? It differs by 2σ (1.6) from the mean.
0.73
≈ 2.2 σ
judge in an unbiased manner ?
An elementary test to indicate if you might have a problem with your data statistics: x = 3.4

Chauvenet’s Criterion
The probability that 1 or more measurements are outside 2 sigma for 6 measurements is 1-0.956=0.27
The probability (assuming a Gaussian distribution) is 0.05 for this to be an acceptable measurement. What’s wrong with that? We would even expect that 1 out of 20 measurements would fall outside of the 2 σ bound.
But, we only made 6 measurements. So, we expect that only 1/(20/6) = 0.3 measurements should fall outside the 2s bound.
Now, it is a bit of personal taste. Is this unreasonable?
Chauvenet’s criterion is the following: If the suspect measurement has a lower probability than 1/2, you should reject it. Our measurement has 0.27 so it goes.
New results: Mean = 3.7 Standard deviation = 0.2 ! much smaller !
10

Our case study: A very simple first step
Data set (picked off the graph by hand)11.5, 5.5, 4.0, 8.0, 7.6, 1.5, 10.2, 0.5 (note, at same beam intensity!)
Mean: = 6.1Standard deviation = 4.0
List of “deviations” in sigma: 1.35, -0.15, -0.53, 0.48, 0.38, -1.15, 1.03, -1.40(these are the “bad” guys)
Data Points prob in 1 prob in 8 (8,11.5) 0.09 0.53 (44,1.5) 0.07 0.44 (65.0.5) 0.15 0.72

Let’s look at our data
What are the uncertainties ? Can we attach the power fluc- tuations to particular data points? Why should we trust the theory prediciton? It could be simply wrong …
12
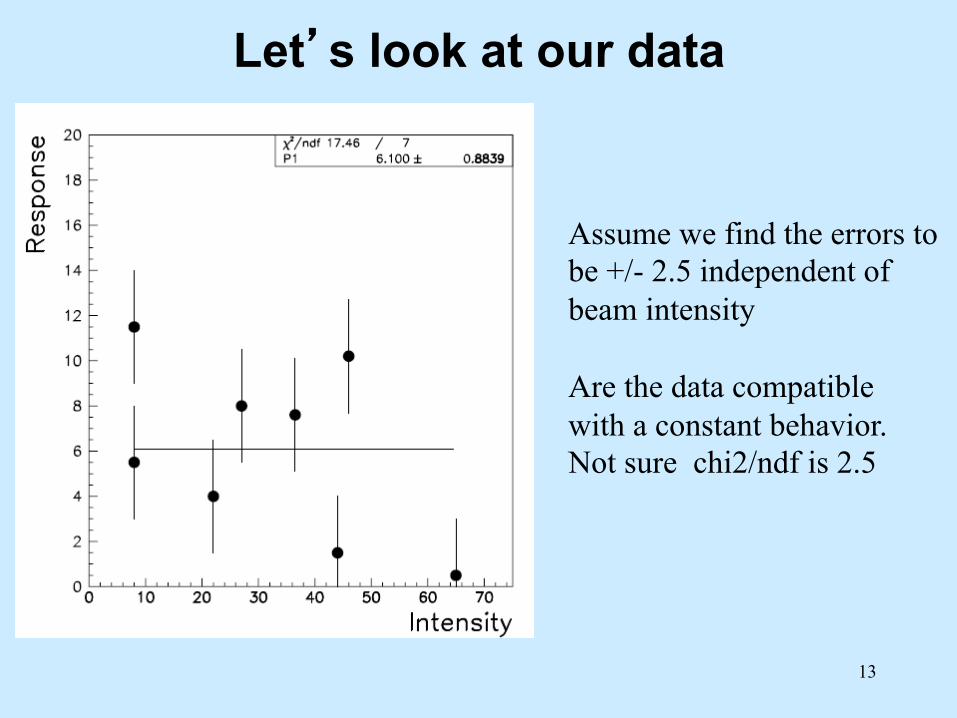
Let’s look at our data
Assume we find the errors to be +/- 2.5 independent of beam intensity Are the data compatible with a constant behavior. Not sure chi2/ndf is 2.5
13

Let’s look at our data
Assume we find the errors to be +/- 2.5 independent of beam intensity Are the data compatible with a polynomial . Not sure chi2/ndf is 2.4 In absence of slow control data for beam and experi- mental apparatus data cannot be rejected !
14

Repeat: Is all data good data? NO!
• Write down everything – in the logbook; take your time; use sentences; record numbers
(values); – glitch in the power? note the time – temperature “cold” or “hot”? comment about it – somebody “reset” the system? note it please and when
• Record (electronically if possible) everything reasonable – as parallel information to the main data set – temperatures; voltages; generally called “slow controls”
• You WILL (almost certainly) have to go back and hunt for this documentation when something possibly anomalous arises … and it will
15

Some additional points • Data rejection does exist and is necessary.
– If you can document a problem, then it is easy to discard – There still may be some data you would like to throw out.
• this is tricky and takes some carefully prepared, bias-free statistical tests to justify
• Theory curves can be misleading* and should generally (always?) be avoided when dealing with issues of data rejection
• You must also think in reverse. How self-consistent is your data set? – There are then many sophisticated tests of the data set itself – You will be expected to demonstrate this in many cases
16

Summary (for your report) • Always include uncertain estimates for all your
measurements if applicable. (use correct number of significant digits)
• Compare your results with published values if applicable: is your measurements agree with the published values within uncertainty? If not, is your estimate of systematic or statistical uncertainty correct? Is there other factors that can influence your result that you forgot to consider?
• If you need to reject certain sets or points of data, you should describe the reason that data should not be included. The reason should be based on changes in environment, setup, etc, and not solely result driven.
17