unburned carbon in flyash measurement - scf ingenieria · unburned carbon in flyash measurement....
TRANSCRIPT

Stefan Kranz
Page: 1
we focus on your process
Unburned Carbon
In Flyash
Measurement

Stefan Kranz
Page: 2
we focus on your process
Steam generator
BurnersS
econdary
air Air preheater
FD Fans
Combustion Air
Electrostatic
precipitator
Fly ash Silo
Fly ash
Flue gas
Coal bunker
Coal
mill
Pulverized
fuel
Prim
ary
air
MECONTROL
Coal
MECONTROL
Air
MECONTROL
UBC
System Application for Boiler Optimization

Stefan Kranz
Page: 3
we focus on your process
Efficiency
Optimization of coal flow distribution, excess air and unburned carbon,
-------Reduction of flue gas losses and ignition losses-------
O2 Distribution
Equalization of the both O2 levels at the flue gas duct
Unburned Carbon (UBC) Reduction
Increase combustion efficiency, maximize fly ash quality
NOx
Reduction of NOx emission / ammonia use in DeNOx system (SCR)
CO
Prevention of boiler wall corrosion/slagging
Targets in Boiler Optimization

Stefan Kranz
Page: 4
we focus on your process
Unburnt carbon in fly ash
Main indicator for combustion quality
Determination of further fly ash usage

Stefan Kranz
Page: 5
we focus on your process
Fly ash can cost or bring benefits

Stefan Kranz
Page: 6
we focus on your process
Internal Quality Assessment
Europe: According to EN-450 (DIN 18 990)
- Internal QA and coordination with customer
Quality has to be traceable at any stage of the fly ash
production. Sampling > 2 /day
Clearance of ``ready to ship`` ash according to DIN EN 450
3 Qualities
Category A < 5%
Category B > 2 % and < 7 %
Category C > 4% and < 9%
Sampling locations to be coordinated with the external auditor
(LOI, Particle Size, CaO)

Stefan Kranz
Page: 7
we focus on your process
Internal Quality Assessment
North America: ASTM C 618
- Internal QA and coordination with customer
Quality has to be traceable at any stage of the fly ash
production. Sampling > 2 /day
Clearance of ``ready to ship`` ash according to DIN EN 450
Qualities
Category C < 6%
Sampling locations to be coordinated with the external auditor
(LOI, Particle Size, CaO)
Stefan Kranz
Page: 8
we focus on your process
Analytik und Betriebsüberwachung ANA
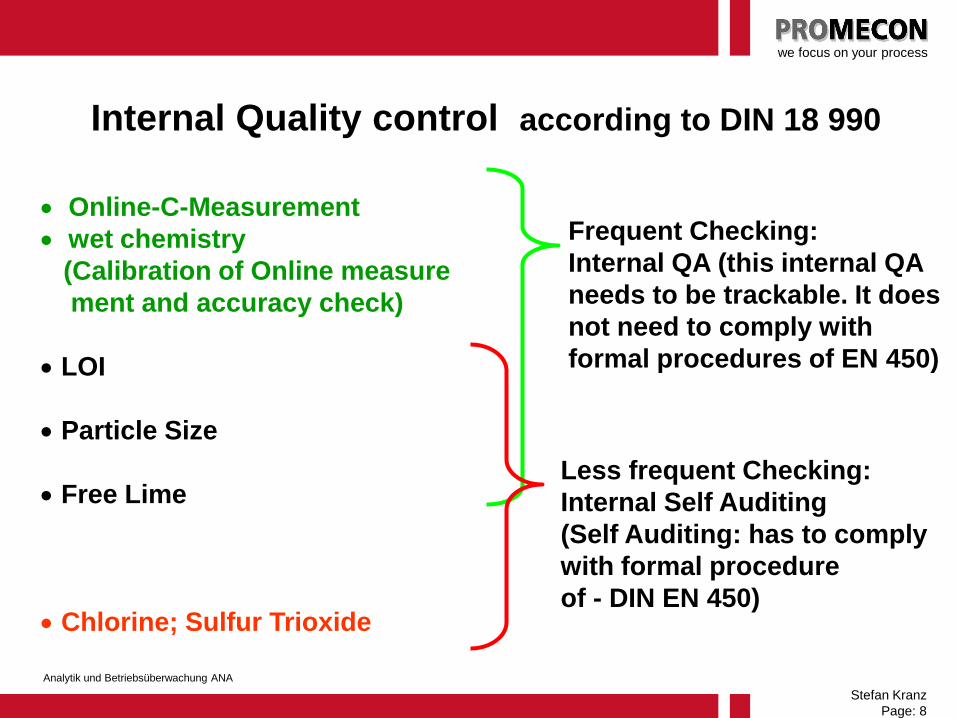
Internal Quality control according to DIN 18 990
Online-C-Measurement
wet chemistry
(Calibration of Online measure
ment and accuracy check)
LOI
Particle Size
Free Lime
Chlorine; Sulfur Trioxide
Less frequent Checking:
Internal Self Auditing
(Self Auditing: has to comply
with formal procedure
of - DIN EN 450)
Frequent Checking:
Internal QA (this internal QA
needs to be trackable. It does
not need to comply with
formal procedures of EN 450)
Stefan Kranz
Page: 9
we focus on your process
Analytik und Betriebsüberwachung ANA
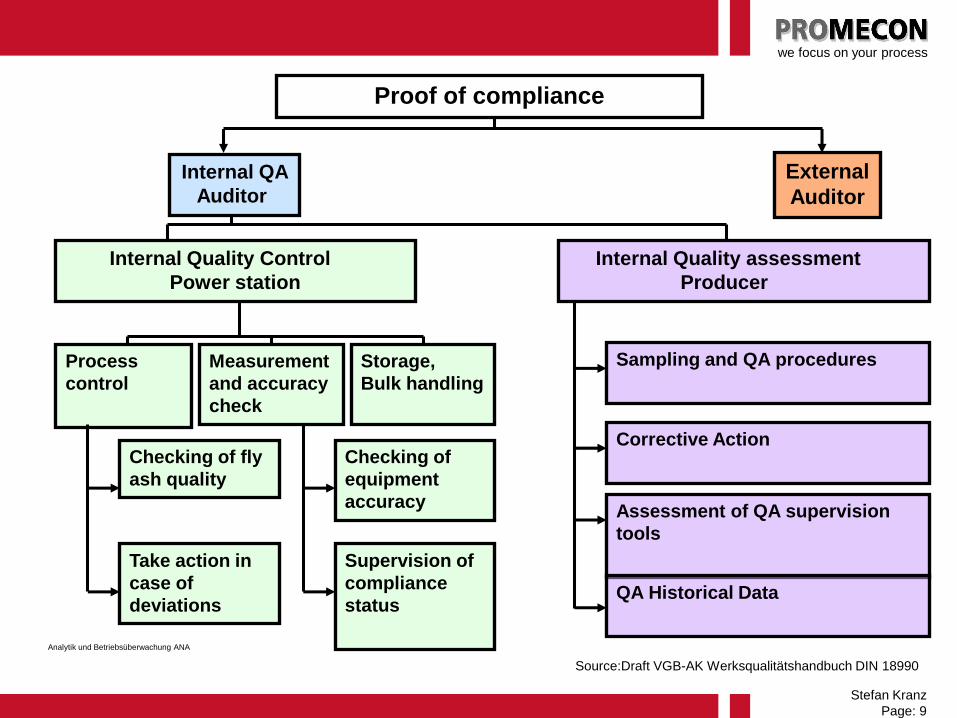
Proof of compliance
Source:Draft VGB-AK Werksqualitätshandbuch DIN 18990
Internal QA
Auditor
External
Auditor
Internal Quality Control
Power station
Sampling and QA procedures
Corrective Action
Assessment of QA supervision
tools
QA Historical Data
Internal Quality assessment
Producer
Process
control
Measurement
and accuracy
check
Storage,
Bulk handling
Checking of fly
ash quality
Take action in
case of
deviations
Checking of
equipment
accuracy
Supervision of
compliance
status

Stefan Kranz
Page: 10
we focus on your process
Analytik und Betriebsüberwachung ANA
Unburned Carbon / LOI
Internal QA of Fly Ash
0
1
2
3
4
5
6
0 1 2 3 4 5 6 7
LOI [wt-%]
UBC (TOC)
[wt%]

Stefan Kranz
Page: 11
we focus on your process
Classification of Loss On Ignition measurement
LaboratorySamplers/ Instrumentation

Stefan Kranz
Page: 12
we focus on your process
Classification of Loss On Ignition measurement
In-situ = no samplingSampling required

Stefan Kranz
Page: 13
we focus on your process
Correlation between UBC, flue gas and excess air as a
function of the losses
UBC
exhaust gas
Losses
Flue gas
UBC
Optimum
Optimization Principle

Stefan Kranz
Page: 14
we focus on your process
UBC Service
Focus/
ConditionsFlue gas losses
Optimization
Test
High Excess Air and
Low UBC
Reduction of the excess air (OFA or burner
air, SA)Base line testing
and optimization
Low Excess Air and
High UBC
Operating feedback on effectiveness of air
registersBase line testing
and optimization
High Excess Air and
High UBC
feedback on effectiveness of mills and
classifier settings and PA velocitiesBase line testing
and optimization
Optimization Optimization using DCS & OptimizersAdvice on control
scheme
modification
MECONTROL Boiler Optimization

Stefan Kranz
Page: 15
we focus on your process
How to measure?

Stefan Kranz
Page: 16
we focus on your process
Methods to estimate unburnt carbon in fly ash
Loss on ignition (LOI)
Laboratory Simple to conduct at laboratory without special analyzers. (Only furnace and scale required)
Most common laboratory analysis method for UBC estimation in power plants
Readings differ approximately 0,3 % to 1% wt UBC due to other reactands
Process Complicated to apply for online measurement (Sample extraction, piping, clogging problems)
Other reductants than carbon e.g. sulphur influence result

Stefan Kranz
Page: 17
we focus on your process
Methods to estimate unburnt carbon in fly ash
TOC Laboratory:
Sample is evacuated and then incinerated with pure oxygen
CO2 concentration is measured by NDIR gas analyzer
very accurate (typically better than 0,1% wt UBC)
Expensive laboratory analyzer
Process:
Complicated to apply for online measurement (Sample
extraction, piping, clogging problems)
Maintenance & Cost intense
Limited reliability
Consumables, disposals

Stefan Kranz
Page: 18
we focus on your process
Methods to estimate unburnt carbon in fly ash
Infra Red reflectance
Process: Sample is taken from process and exposed to infra red light
The reflectance is a measure for the unburnt carbon content
Complicated to apply for online measurement (Sample extraction, piping, clogging problems)
Dirt sensitive
Strong influence by particle size, raw coal type and other elements contained in the coal (Fe etc)

Stefan Kranz
Page: 19
we focus on your process
Principle: Light Reflection
Typical size: 100µm
Reflection only in surface zone
Ash color (Fe2O3) has influence
Smaller carbon particles overrepresented!
Change in particle size spectrum between carbon and ash brings change in light reflection
free space surface zone
light quantum
Dark zone – no measurement

Stefan Kranz
Page: 20
we focus on your process
Analytik und Betriebsüberwachung ANA
0
0 200 400 600 800 1000
[%]
UB
C C
on
ten
t
[µm] Particle Size
Typical Correlation of UBC and Particle Size
The UBC particles are larger than the average of the ash particles

Stefan Kranz
Page: 21
we focus on your process
same ash, same UBC content, different particle size
grinding ash especially makes carbon particles smaller
so the black particles get a larger surface
so the ash turns darker, even with the same UBC content

Stefan Kranz
Page: 22
we focus on your process
Extractive Microwave System

Stefan Kranz
Page: 23
we focus on your process
Microwave resonance/ Microwave absorption
Laboratory Microwave resonant frequency/ Microwave absorption depending on unburnt carbons
Process (extractive methods) Complicated to apply for online measurement (Sample extraction, piping, clogging problems)
Undefined bulk density
Maintenance & Cost intense
Extractive Microwave System
Stefan Kranz
Page: 24
we focus on your process
In-Situ Microwave Resonance
solution

Stefan Kranz
Page: 25
we focus on your process
Methods to estimate unburnt carbon in fly ash
In-Situ Microwave Resonance
Internationally patented In situ measurement
Fast accurate and reliable
Virtually no maintenance required
Fully self contained unit

Stefan Kranz
Page: 26
we focus on your process
Measurement Principle
Dielectric constant of fly ash is a function of
the carbon content. Measuring the shift of
frequency in a resonator (f) the carbon
content can be calculated.
UBC = A + B f
A and B are the
calibration coefficients

Stefan Kranz
Page: 27
we focus on your process
Principle: Microwave ResonanceFrequency fo,wavelength 1
Frequency fo,wavelength 2
no light quantums but
classical microwaves
penetration through all
material and inside the
particles
no impact of ash colour
no impact of particle size
low UBC
high UBC

Stefan Kranz
Page: 28
we focus on your process
Oscillating circuit
Cεfres
1
HF-
Emission
C
HF-
Reception
Ash with carbon
ε >1
Ash with carbon
ε >1
Relation:
Resonance frequency depends on
capacity C and dielectricity ε
Air: ε = 1,
Ash with no carbon: e.g. ε = 2,25
Measurement Principle

Stefan Kranz
Page: 29
we focus on your process
Measurement
Chamber
Auger
Sampling Tube
Sample will be compressed by a defined force in measurement
chamber
Large sample volume (500 ml)
Simple mechanical design
International patents
Sensor Arrangement

Stefan Kranz
Page: 30
we focus on your process
Main Panel
Touch Panel controled
Protection up to IP66
Can handle up to 4 independent
UBC sensors
4-20mA I/Os to DCS
Profibus/Modbus/Ethernet capability
Remote maintenance access

Stefan Kranz
Page: 31
we focus on your process
Measurement
Cabinet
Up to 8 SensorsPROMECON
Local control box Sensor(s)
System - Design

Stefan Kranz
Page: 32
we focus on your process
Local control box
1: Power indicator
2: Error indicator
3: Release signal indicator
4: Filling indicator and button
5: Emptying indicator and button
6: Sampling indicator and button
7: Automatic/manual mode switch
8: Automatic mode indicator
9: Main switch
Power Error Release
Filling Emptying Sample
Auto / Hand
Main switch
Automatic

Stefan Kranz
Page: 33
we focus on your process
In field applications

Stefan Kranz
Page: 34
we focus on your process
Design UBC Sensor Type 300
Ash Auger
Sensor Flange Mounting
Measurement Chamber

Stefan Kranz
Page: 35
we focus on your process
SCADA Screen for sampling location

Stefan Kranz
Page: 36
we focus on your process
System Data Flow: Single Cabinet

Stefan Kranz
Page: 37
we focus on your process
Multiple Cabinets

Stefan Kranz
Page: 38
we focus on your process
A B
90% separation
90% separation
90% separation
90% separation 90% of the total fly ash
9,0%
0,9%
0,09%
Measurement Cabinet
4 Sensors
Sensor
Control Box
Sensor
Control Box
Sensor
Control Box
Sensor
Control Box
Sensor 1
Sensor 2
Sensor 3
Sensor 4
Digital Input Signals
Release signals per channel
(if necessary)
Promecon
AshFLO Sensors
4-20 mA Signals
(UBC)
0600 1200 1800
2400
3
4
5
6
UBC [%]
Microw. Generator
Microwave Receiver
PLC Unit
Power Supply
Signal Converter
Control Room
Touch Screen
Operator Interface
Fault Messages
Maximum Distance: 190m
Recommended measurement locations

Stefan Kranz
Page: 39
we focus on your process
Measurement Location
Electric
precipitator
Fly ash
Flue gas
90% 9% 0.9%
MECONTROL UBC
Air Preheater
Spot sampling
100%
Weak Correlation to Silos
Strong Correlation to Silos
Silos
Flue gas
sampler
Not representative Representative

Stefan Kranz
Page: 40
we focus on your process
sampler
Flue Gas Duct
Nozzle
High CO/UBC rope
Sampling
location
Ash and gas not homogenizedAsh discharged in
dense quantities
Cross sectional coverage:
0.000005%
Cross sectional coverage: 2-8%
Fly ash concentration: 5g/m3
Fly ash concentration:
200,000 g/m3
Sampling of the Ash Flow
Ash Hopper

Stefan Kranz
Page: 41
we focus on your process
Fly Ash Collection Rate
ESP Hopper
1g/minute 100 g/minute
An adequate response time in the flue
gas duct is only achievable by a very
small sample size
Sampling can achieve both:
Large, representative
sample size
fast response measurement
ash travel time from burner
to DUCT sampler: 3 secs
ash collection time: 5
minutes
ash travel time from burner to
PROMECON sampler: 15 secs
ash collection time: 5 minutes (hopper cycle)
Sampling synchronous to cycle
Measurement Response Time
Flue Gas Duct

Stefan Kranz
Page: 42
we focus on your process
Sample Size
5 g out of flue gas duct 500 g out of precipitator

Stefan Kranz
Page: 43
we focus on your process
Extractive MeasurementIn-Situ Measurement
160oC
Flue gas
duct
Measurement Panel
Ambient Temperature
cyclone
separation
classification?
Transport
through
heated
pipes
MW measure-
ment of Air/
Ash mixture
Static weighing of 5g sample
60oC
Sampling and measurement
in the hopper:
no Extraction,
no cyclone separation
no static weighing
no heating elements
ESP
Hopper

Stefan Kranz
Page: 44
we focus on your process
All-in-one sensor
non extractive sampling!
no pneumatic transport
1 moving part
simple/robust design
no weighing
Mechanical sampling system
Mechanical: Less moving parts are better

Stefan Kranz
Page: 45
we focus on your process
Unequal particle size distribution
Bigger particles drop faster than small particles
Unqual particle size distribution in horizontal conveyor
pipes
Unequal UBC content depending on particle size
Inaccurate measurement since sample is not
representative

Stefan Kranz
Page: 46
we focus on your process
Measurement Location
Electric
precipitator
Fly ash
Flue gas
90% 9% 0.9%
MECONTROL UBC
Air Preheater
100%
Silos
Not representativeRepresentative
Sampling from
conveyor pipe

Stefan Kranz
Page: 47
we focus on your process
Conclusion measurement location
No particle size classification/ fractionating
Representative averaged sample
Short response time

Stefan Kranz
Page: 48
we focus on your process
Basic
Accuracy comparison with
Laboratory TOC Analyzer

Stefan Kranz
Page: 49
we focus on your process
0
1
2
3
4
5
6
7
8
9
10
0 2 4 6 8 10
Block1 Sensor1
Block1 Sensor2
Block2 Sensor1
Block2 Sensor2
-0,60%
+0,60%
Unit 1 Sensor 1
Unit 1 Sensor 2
Unit 2 Sensor 1
Unit 2 Sensor 2
Typical Measurement Data
UBC (lab)
UBC
Promecon

Stefan Kranz
Page: 50
we focus on your process

Stefan Kranz
Page: 51
we focus on your process
Measurement Data of
0
100
200
300
400
500
600
700
800
03.07.2001
06:00
08.07.2001
06:00
13.07.2001
06:00
18.07.2001
06:00
23.07.2001
06:00
28.07.2001
06:00
02.08.2001
06:00
07.08.2001
06:00
12.08.2001
06:00
Kanal 0 Labor 0
0
100
200
300
400
500
600
700
800
900
03.07.2001 06:00 03.07.2001 12:00 03.07.2001 18:00 04.07.2001 00:00 04.07.2001 06:00 04.07.2001 12:00
Kanal 2 Labor 2

Stefan Kranz
Page: 52
we focus on your process
Wedel
0
100
200
300
400
500
600
700
800
900
1000
18.07.2001
00:00
20.07.2001
00:00
22.07.2001
00:00
24.07.2001
00:00
26.07.2001
00:00
28.07.2001
00:00
Re
st-
C [
0,0
1%
]
0
100
200
300
400
500
600
700
800
900
1000
Kanal 2
Kanal 3
Temperatur Kanal 2
Temperatur Kanal 3
Measurement Data of

Stefan Kranz
Page: 53
we focus on your process
Trial Run at "Reuter West" Plant, dated 2001-11-12
-170
-165
-160
-155
-150
-145
-140
-135
-130
-125
06:00 07:00 08:00 09:00 10:00 11:00 12:00 13:00 14:00 15:00 16:00 17:00 18:00
Time
Se
co
nd
ary
Air
x 1
00
0 (
inve
rte
d)
[m³/
h]
ST
P
1
2
3
4
5
6
7
8
9
10
UB
C [
%]
Secondary Air (MECONTROL Air)
UBC ETG 17 (MECONTROL UBC)
UBC ETG 18 (MECONTROL UBC)
Remark: Listed values of secondary air
amount are only for one burner plane.
1 % O2
Boiler/Mill Optimization w/ UBC Monitoring

Stefan Kranz
Page: 54
we focus on your process
Optimization Results
Trial run at "Reuter West” power plant, dated 2001-11-12
2
4
6
8
10
12
14
16
18
UB
C [
%]
07:00 7:30 8:00 8:30 9:00 9:30 10:00 10:30 11:00 11:30 12:00 12:30 13:00 13:30 14:00 14:30 15:00 15:30 16:00 16:30 17:00
Time
0
0,5
1
1.5
2
2.5
3
3.5
4
4.5
O2
[%]
UBC Fly ash (MECONTROL UBC)
UBC Fly ash (Lab analysis)
O2 Boiler / DeNOx outlet
Excess Air Reduction

Stefan Kranz
Page: 55
we focus on your process
Excess Air Reduction Jan. 22, 2002
2
2,5
3
3,5
4
4,5
5
10:00 11:12 12:24 13:36 14:48 16:00 17:12
240
245
250
255
260
265
270
275
280
seco
nd
ary
air
[kg
/s]
O2 Boiler out SA total
SA2 TA SA1+CA
CA
SA1
SA2
TA
TA
6 Burners x 4 levels
O 2
[Vo
l.-%
]
Power Station Farge, Power Utility E-on

Stefan Kranz
Page: 56
we focus on your process
2
2,5
3
3,5
4
4,5
5
10:00 11:12 12:24 13:36 14:48 16:00 17:12
O 2
[Vo
l.-%
]
500
520
540
560
580
600
620
NO
x [
mg
/m³]
O2 boiler out NOx before SCR
SA2 TA SA1+CA
Power Station Farge, Power Utility E-on

Stefan Kranz
Page: 57
we focus on your process
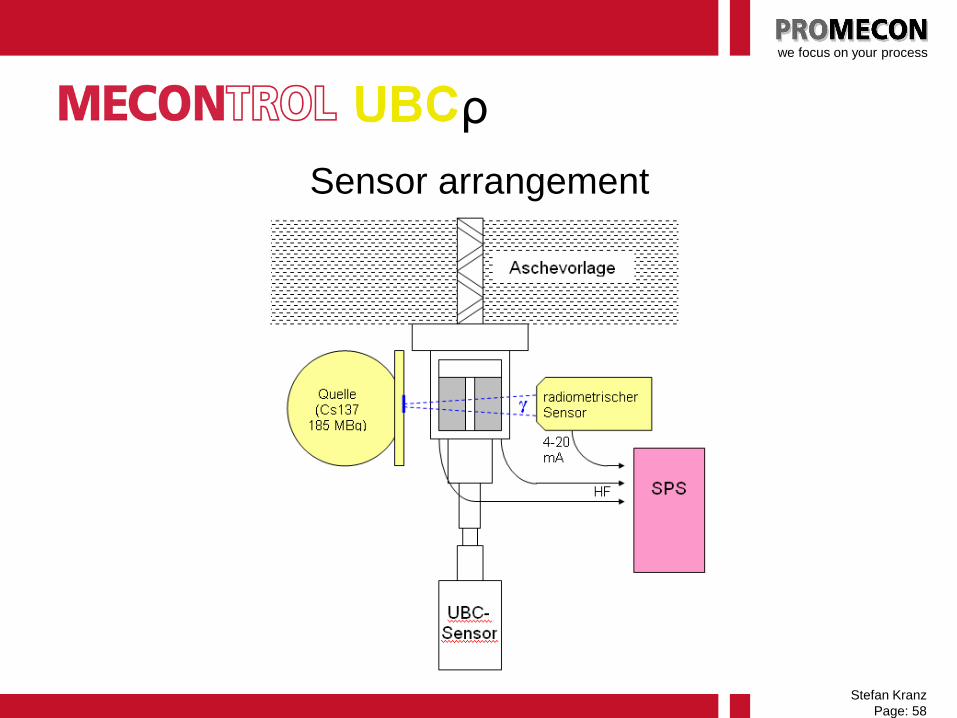
ρ
Integrated density correction by nucleonic source
Enhanced online accuracy
Independent of ash quality variation
Easy upgrade of existing systems
Stefan Kranz
Page: 58
we focus on your process
ρ
Sensor arrangement
Stefan Kranz
Page: 59
we focus on your process
ρ
Don‘t fear about radioactivity:
Very small source 185 MBq
Savely sealed, Stainless steel shell, lead & steel
protector
Typically used in Power stations for
Density measurement of lime milk (FGD)
Level switch for coal bunker exit
Belt scale measurements for feeder
Nucleonic Source

Stefan Kranz
Page: 60
we focus on your process
Typical accuracy
Laboratory - UBC correlation (density corrected)
0
1
2
3
4
5
6
7
8
9
10
11
12
0 1 2 3 4 5 6 7 8 9 10 11 12
TOC
UB
C Ash Samples
Regression
Sample
No.
TOC
Lab
UBC
reading Accuracy
1 10,49 10,52 -0,03
2 1,65 1,89 -0,24
3 1,80 1,53 0,27
4 1,96 1,90 0,05
5 1,35 1,53 -0,18
6 4,44 4,31 0,13
Accuracy process versus laboratory < 0,2% wt
ρ

Stefan Kranz
Page: 61
we focus on your process
Real world examples
without ρ correction
σ = 1,10%
No. Labor UBC Accuracy
1 10,49 7,12 3,37
2 1,65 2,36 -0,71
3 1,80 2,53 -0,73
4 1,96 2,69 -0,73
5 1,35 0,91 0,43
6 4,44 4,37 0,07
7 4,97 4,13 0,84
8 5,00 4,16 0,84
9 5,04 4,12 0,92
10 4,28 4,15 0,13
11 4,36 4,17 0,19
12 3,16 2,36 0,80
13 3,00 2,10 0,90
14 3,05 2,27 0,78
15 2,85 2,31 0,54
16 3,40 4,53 -1,13
17 3,30 4,50 -1,20
18 2,70 3,10 -0,40
Laboratory - UBC correlation
Without density correction
0
1
2
3
4
5
6
7
8
9
10
11
12
0 1 2 3 4 5 6 7 8 9 10 11 12
Laboratory
UB
C
Regression
Shikoku
ResearchYonghung 1
Yonghung 2
Yonghung 3
Scholven C

Stefan Kranz
Page: 62
we focus on your process
ρ
Accuracy process versus laboratory ~ 0,2%
No. Lab UBC Accuracy
1 10,49 10,48 0,01
2 1,65 1,88 -0,23
3 1,80 1,53 0,27
4 1,96 1,90 0,06
5 1,35 1,52 -0,18
6 4,44 4,29 0,14
7 4,97 4,91 0,06
8 5,00 5,07 -0,07
9 5,04 5,10 -0,06
10 4,28 4,17 0,11
11 4,36 4,22 0,14
12 3,16 2,90 0,26
13 3,00 2,82 0,18
14 3,05 2,97 0,08
15 2,85 2,79 0,06
16 3,40 3,81 -0,41
17 3,30 3,47 -0,17
18 2,70 2,96 -0,26
σ = 0,19%
Laboratory - UBC correlation
Density corrected
0
1
2
3
4
5
6
7
8
9
10
11
12
0 1 2 3 4 5 6 7 8 9 10 11 12
Laboratory
UB
C
Regression
Shikoku
ResearchYonghung 1
Yonghung 2
Yonghung 3
Scholven C
Real world examples
with ρ correction

Stefan Kranz
Page: 63
we focus on your process
Accuracy
Laboratory
0,1%
Gain of the effective accuracy
2 samples/ day
Accuracy
MECONTROL UBC
0,6%
50 samples/ day
(situation Altbach)
n
σσ
SystemMeanValueExpected
%07,02
%1,0MeanValueExpectedσ %08,0
50
%6,0MeanValueExpectedσ
Gain of effective accuracy due
to frequent measurements

Stefan Kranz
Page: 64
we focus on your process
Comparison Laboratory vs. Online
Altbach HKW2
0
1
2
3
4
5
8.10 9.10
UB
C (
%)
UBC
Channel 1
Lab

Stefan Kranz
Page: 65
we focus on your process
On-line in situ measurement of UBC
Fully self contained unit, no extractive sampling,
simple mechanical design
High accuracy and absolute measurement of UBC
Virtually no maintenance, low LTCO
Independent of ash density
Large international installed basis > 200 Sensors at >
100 boilers
Enhanced accuracy version 0,2% online vs. lab
Easy upgrade of existing installations
Conclusions
ρ

Stefan Kranz
Page: 66
we focus on your process
Accurate measurement of the key combustion
parameter
Optimization of mill &boiler performance
Improvement of NOx, CO, O2 and UBC
High cost savings by reduction of primary losses
Cost efficient fly ash disposal
Recommendations by Babcock Borsig Power
(BBP) and current utility users
Benefits to the Power Plant

Stefan Kranz
Page: 67
we focus on your process
PROMECON is the world leader with MECONTROL UBC
installations in more than 90 Power Plants worldwide.
At several international utilities PROMECON has achieved
improvements of several $100,000 US per year by its systems.
Recent investigation at reference Power Stations
Optimization of the boiler efficiency: 0.4 – 1.0 %
Reduction of the unburned carbon: 10 - 30 %
Reduction of CO: 50 - 80 %
Saving coal consumption: $300,000 /y
PROMECON estimates $150,000 – $500,000 US with NOx optimization and
boiler wear reduction.
Benefits with PROMECON systems

Stefan Kranz
Page: 68
we focus on your process
Thank you very much!

Stefan Kranz
Page: 69
we focus on your process